introduction - carleton universitytjs/spice.pdf · -the title must be the first line in the netlist...
TRANSCRIPT

INTRODUCTION
Unix
Spice
Excel

INTRODUCTION TO UNIX

Unix is an Operating System like Windows and Mac OSX, and similar to Linux, Sun
Solaris and DOS

Unix is an Operating system like Windows and Mac OSX, and similar to Linux and
Sun Solaris, DOS

DIRECTORY STRUCTURE• Command lines are typed in the ‘Terminal’ or ‘Console’:• The backslash (/) is the root: /home/bdej/Projects/…• This is similar to Windows Explorer where you have folders within folders (Ex. C:\Documents\Music\Artists\…)•Linux uses ‘/‘ Windows uses ‘\’
http://www.ee.surrey.ac.uk/Teaching/Unix/unixintro.html

$ pwd
PRINT WORKING DIRECTORY

LIST FILES/DIRECTORIES$ ls

LIST FILES/DIRECTORIES$ ls -altrLists all files in detail (even those that are normally hidden)

CHANGE DIRECTORY$ cd MyFolder

CHANGE DIRECTORY$ cd ~Go to home directory: /home/userName

CHANGE DIRECTORY$ cd ..Goes back one directory (ie. parent directory)

MAKE A DIRECTORY$ mkdir MyFolder
$ ls

WILDCARD ‘*”

MORE…• Copy: $ cp t.doc /home/bdej/MyFolder_3/t.doc• Remove: rm , rmdir• Move: mv (also used to rename files)• OpenOffice: $ office• Acrobat Reader: $ acroread• Emacs [simple text editor]: $ emacs
•Tabs finish typing for you !

SHORTCUTS• Control C cancels the current process• Tab fills in the rest of a filename if it exists in the current directory• goes to previously typed command lines• more filename shows the text of the file in the console• & allows your command to be executed in the background (ie. the next console command line can be typed without interrupting its progress)ex. $ Office &

SPICE

SPICE is a program which can be used to simulate analog electronic circuits

Analog filter circuits have a parameter called a ‘Transfer Function’ which maps input to output
with relation to frequency
v_in v_outcircuit

Analog filter circuits have a parameter called a ‘Transfer Function’ which maps input to output
with relation to frequency

Analog filter circuits have a parameter called a ‘Transfer Function’ which maps input to output
with relation to frequency

Analog filter circuits have a parameter called a ‘Transfer Function’ which maps input to output
with relation to frequency

Analog filter circuits have a parameter called a ‘Transfer Function’ which maps input to output
with relation to frequency

Analog filter circuits have a parameter called a ‘Transfer Function’ which maps input to output
with relation to frequency

Analog filter circuits have a parameter called a ‘Transfer Function’ which maps input to output
with relation to frequency
music

A netlist is a text version of the circuit which describes the components and values for the
computer to interpret and solve

A netlist is a text version of the circuit which describes the components and values for the
computer to interpret and solve

A netlist is a text version of the circuit which describes the components and values for the
computer to interpret and solve

A netlist is a text version of the circuit which describes the components and values for the
computer to interpret and solve

A netlist is a text version of the circuit which describes the components and values for the
computer to interpret and solve

A netlist is a text version of the circuit which describes the components and values for the
computer to interpret and solve

A netlist is a text version of the circuit which describes the components and values for the
computer to interpret and solve
* Basic DC circuitV1 1 0 20R1 3 1 4kR2 3 2 10kV2 2 0 -10R3 3 0 8k.OP.END

A netlist is a text version of the circuit which describes the components and values for the
computer to interpret and solve
* Series_RLC CircuitV1 1 0 SIN(0 5 1k) AC 1R1 2 1 50L1 2 3 100mHC1 3 0 1uF.AC DEC 100 1 10k.END

HSpice is a software program that simulates electronic circuits and outputs the circuits’ basic characteristics such as:
–Voltage–Current–Resistance
at any location in the circuit
HSpice is a version used in Unix
PSpice is a version used in Windows
WHAT IS HSPICE?

• Create an HSpice input file that describes the circuit
• Run HSpice
• Inspect the output
WORKFLOW

R_R1 1 0 100
C_C1 1 2 0.01592u
V_V1 2 0 dc 0.0 ac 1.0 sin(0.0 1.0 1.0 0 0)
nodevalue
- A netlist describes the circuit to the program
- Node 0 is always GROUND
name
THE NETLIST

-The title must be the first line in the netlist (in order to recognize the options command)- R1 = 100Ω (Ohms)- C1 = 0.01592uF (micro Farads) with initial condition of 0- V1 = sine wave with 1Hz frequency, 0 to 1V magnitude- Print ac voltage at node 1- Want 100 frequency points from 0.001 to 1e+06
Title “my filter circuit”.options ingold=2R_R1 1 0 100C_C1 1 2 0.01592u IC=0V_V1 2 0 dc 0.0 ac 1.0 sin(0.0 1.0 1.0 0 0).print ac V(1).ac LIN 100 0.001 1e+06.op.END
THE INPUT FILE

Use a text editor to create the above file:
$emacs &
Save as myFilter.sp
SAVE INPUT FILE

$hspice myFilter.netlist >myFilter.lis &
This line tells HSpice to simulate your input file and output the results in “myFilter.lis”
View the output file with Star Office:
$office &
RUN HSPICE

Microsoft Excel (Windows) is an important tool in undergrad (and I don’t know how to graph properly using a Star Office spreadsheet).
Copy/paste the relevant data into Excel, then choose:
Data Text to Columns… Delimited Space
Can also open the document in excel, and you will be asked for the delimiter automatically
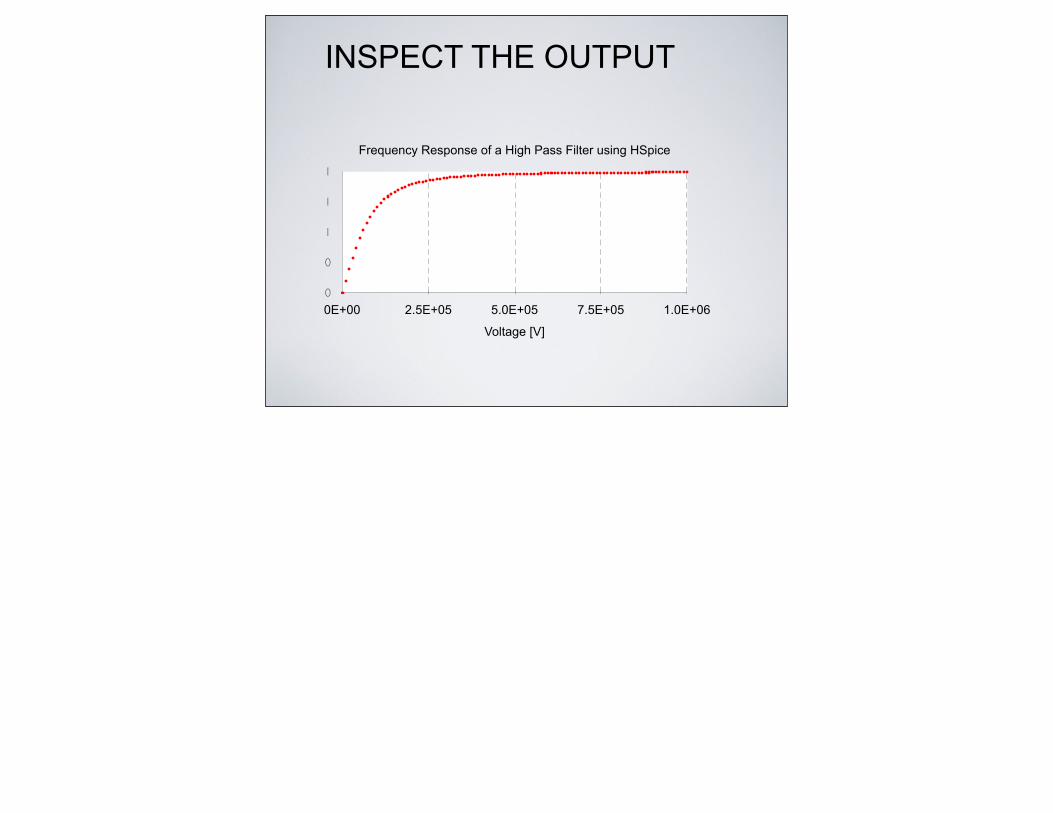
Produce a neat-looking graph.
INSPECT THE OUTPUT
0
0
1
1
1
0E+00 2.5E+05 5.0E+05 7.5E+05 1.0E+06
Frequency Response of a High Pass Filter using HSpice
Voltage [V]
INSPECT THE OUTPUT

• 3-terminals: Collector, Base, and Emitter
• Common Emitter Amplifier
• input = base with respect to the emitter
• output = collector with respect to the emitter
• Most commonly used configuration for transistor-based amplifiers as it produces the highest voltage, current, and power gain.
Input Voltage
Output Voltage
BIPOLAR JUNCTION

BJT

0
1.3
2.5
3.8
5.0
0E+00 1E-08 2E-08 3E-08 4E-08
Voltage at Collector and Base of a BJT using HSpice
Volta
ge [V
]
Time [s]
BaseCollector
OUTPUT FROM HSPICE

TIPS IN EXCEL

• In the menu, choose Format Cells
Time [s] Vout [V]0.E+00 0.0001.E-10 -0.0082.E-10 -0.0073.E-10 0.0344.E-10 0.1405.E-10 0.3226.E-10 0.5887.E-10 0.9348.E-10 1.3559.E-10 1.8391.E-09 2.373
Scientific Notation: 0 decimals
Number: 3 decimals
FORMAT CELLS

Excel can split text from one column into multiple columns using the command “Text to Columns”

• $ is used with cell coordinates, signifies leaving that coordinate constant
• Example: rearrange v=d/t to give d=v*t
The code
$

• Other: transpose, add…
• Example: Make a row of data negative
• Copy cell with -1 value, highlight cells that you want to become negative of the current values, Edit Paste Special Multiply
Positive“not yet
Negative” 0.400 0.400 -1-0.008 -0.008 -0.007 -0.007
Positive Negative0.400 -0.400-0.008 0.008-0.007 0.007
PASTE SPECIAL
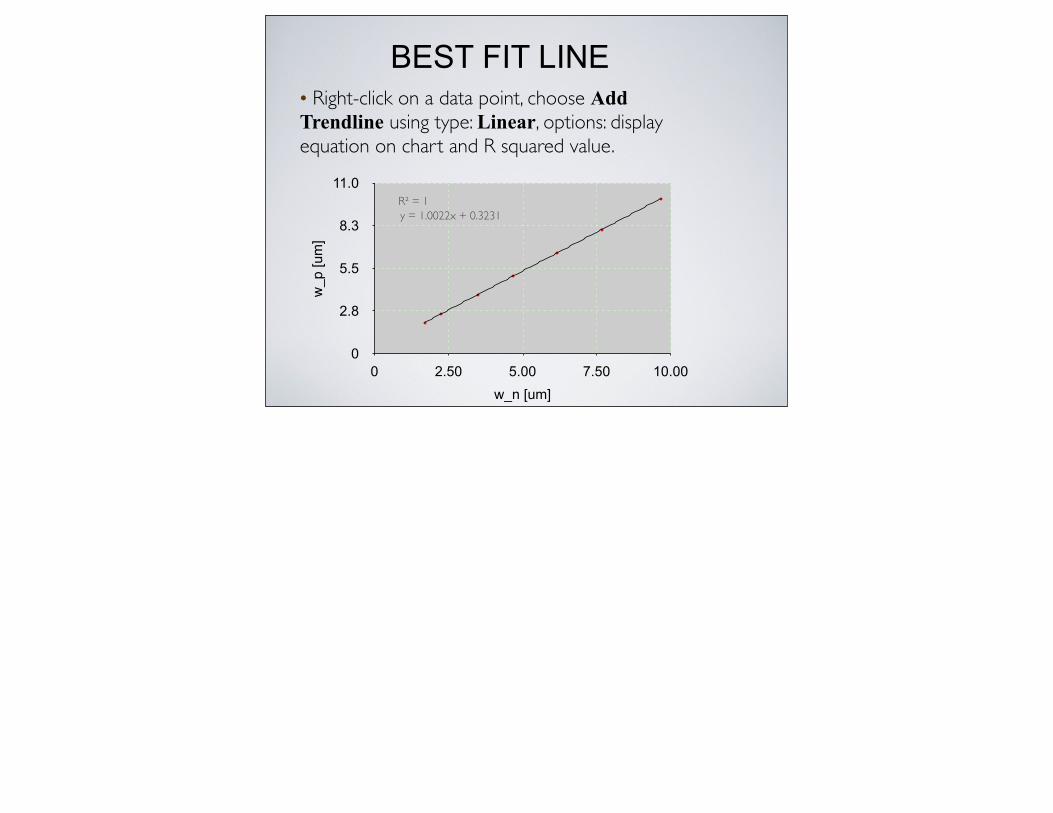
• Right-click on a data point, choose Add Trendline using type: Linear, options: display equation on chart and R squared value.
0
2.8
5.5
8.3
11.0
0 2.50 5.00 7.50 10.00
y = 1.0022x + 0.3231R² = 1
w_p
[um
]
w_n [um]
BEST FIT LINE

• must have the Analysis Toolpak (go to Tools Add-ins, and install).
• tools - data analysis - regression - x and y ranges - click residuals
SUMMARY OUTPUT
Regression StatisticsRegression Statistics
Multiple R 0.999997109R Square 0.999994218
Adjusted R Square 0.999991328Standard Error 1182.326494
Observations 4
End
STATISTICS

NOW TO APPLY YOUR KNOWLEDGE!