interstage flow interactions and l. porreca1 loss...
TRANSCRIPT

S
I
uosttpnuci
hdGwarcadclula
sza
tsc2
J
Downloa
L. Porreca1
e-mail: [email protected]
A. I. Kalfas
R. S. Abhari
Turbomachinery Laboratory,wiss Federal Institute of Technology ETH Zürich,
Zurich 8005, Switzerland
Y. I. Yun
S. J. Song
School of Mechanical and AerospaceEngineering,
Seoul National University,Republic of Korea
Interstage Flow Interactions andLoss Generation in a Two-StageShrouded Axial TurbineThe aerodynamics and kinematics of flow structures, including the loss generationmechanisms, in the interstage region of a two-stage partially shrouded axial turbine areexamined. The nonaxisymmetric partial shroud introduces highly three-dimensional un-steady interactions, the details of which must be understood in order to optimize thedesign of the blade/shroud. Detailed measurements of the steady and unsteady pressureand velocity fields are obtained using a two-sensor fast response aerodynamic probe andstereoscopic particle image velocimetry. These intrusive and nonintrusive measurementtechniques yield a unique data set that describes the details of the flow in the interstageregion. The measurements show that a highly three-dimensional interaction occurs be-tween the passage vortex and a vortex caused by the recessed shroud platform design.Flow coming from the blade passage suddenly expands and migrates radially upward inthe cavity region, causing a localized relative total pressure drop. Interactions of vortexand wake structures with the second stator row are analyzed by means of the combinationof the measured relative total pressure and nondeterministic pressure unsteadiness. Theanalysis of the data gives insight on unsteady loss mechanisms. This study providesimproved flow understanding and suggests that the design of the blade/shroud and secondstator leading edge may be further improved to reduce unsteady loss contribution.�DOI: 10.1115/1.2948961�
ntroductionThe flow within a multistage axial turbomachine is inherently
nsteady and turbulent due to the interaction of wakes and sec-ndary flow structures, shed by upstream blades, with the down-tream blades. Furthermore, the incoming wakes are chopped byhe rotor blades, and then diffuse and deform as they pass throughhe nonuniform pressure field in the rotor passage. These unsteadyhenomena affect the performance of the airfoils and generateoise and structural vibration. An improved understanding of thensteady flow physics is still a critical issue in rotating turboma-hinery design and is thus a key requirement in achieving furthermprovements in performance.
Previous experimental studies that examined flow interactionsave used miniaturized fast response aerodynamic probe �FRAP�evices �Schlienger et al. �1�, Miller et al. �2�, Pfau et al. �3�,aetani et al. �4�� to measure unsteady pressures and derive asell other flow field parameters. Recently, optical techniques such
s particle image velocimetry �PIV� have also been applied tootating machinery. However this measurement technique is still ahallenge in such an environment because of the difficult opticalccess and the need to use a uniquely defined calibration proce-ure to take into account the image distortion due to the cylindri-al shape of the window. Moreover, since PIV measures the ve-ocity field of tracers that are added to the flow, achieving aniform seeding with an optimum concentration is crucial. Inarge scale rotating turbomachinery research facilities, these issuesre very critical.
For these reasons, there are not many publications regarding theuccessful application of PIV to turbomachinery. Wernet �5�, Bal-ani et al. �6�, Sanders et al. �7�, Uzol et al. �8�, Ibaraki et al. �9�,nd Estevadeordal et al. �10� studied the 2D steady and transient
1Present address: MAN Turbo AG Schweiz, Zurich, Switzerland.Contributed by the International Gas Turbine Institute of ASME for publication in
he JOURNAL OF TURBOMACHINERY. Manuscript received August 8, 2006; final manu-cript received September 27, 2007; published online September 25, 2008. Reviewonducted by Matthew Montgomery. Paper presented at the ASME Turbo Expo
006: Land, Sea and Air �GT2006�, Barcelona, Spain, May 8–11, 2006.ournal of Turbomachinery Copyright © 20
ded 16 Feb 2011 to 147.46.117.245. Redistribution subject to ASM
flow fields in axial and centrifugal compressors. Liu et al. �11� andGöttlich et al. �12� made stereoscopic PIV measurements focusingon the wake-wake interaction at midspan in an axial transonicturbine and in the tip region of an axial compressor, respectively.
In the present work, extensive measurements using FRAP andstereoscopic PIV are made in a two-stage shrouded axial turbine.The investigation is focused on the flows within the interstageregion. Partial shrouds are currently in use in some stationaryindustrial applications �Dorris et al. �13�, Tomita �14�, and Nirma-lan and Bailey �15��, and they are receiving more attention due tothe aerodynamic advantage of shrouded configuration as well asreducing thermal load and mechanical stress on the blade root�Harvey and Ramsden �16�; Willer et al. �17��. However, the op-timal compromise between mechanical issues and aerodynamicperformances is still an open issue due to the resulting highlythree-dimensional unsteady flow field, difficulty in achieving anoptimal cooling and severe heat load on the shroud sealing fins.The coupling between flow kinematics and loss generation istherefore investigated in order to gain a better understanding ofthe flow physics and to suggest ways to improve aerodynamicdesign of the blade/shroud components.
Experimental method
Research Facility. The experimental investigation has beenperformed in the research turbine “Lisa” at the TurbomachineryLaboratory of the ETH Zurich. The facility can accommodate amaximum of two stages of an axial turbine. The air loop is qua-siclosed type �open to the atmospheric conditions� and thus in-cludes a radial compressor, a two-stage water to air heat ex-changer, and a calibrated Venturi nozzle for accurate mass flowmeasurements. A dc generator absorbs the turbine power and con-trols the rotational speed of the turbine shaft. The first and secondrotors are mechanically decoupled by use of a twin spool shaftdesign. A pair of independent torque meters allow the torque ofeach rotors to be separately measured. To achieve the same rota-
tional speeds, the shafts are coupled again before the DC genera-JANUARY 2009, Vol. 131 / 011002-109 by ASME
E license or copyright; see http://www.asme.org/terms/Terms_Use.cfm

t
ewhiottrotptbr
Ts
ROMBAMRR
0
Downloa
or. More details can be found in Porreca et al. �18�.The turbine’s design allows quick and precise assembly and
asy access to the measurement planes. The facility is equippedith a four-axis numerically controlled positioning system withigh precision ��0.05 mm in the radial direction and �0.002 degn the yaw and circumferential angles�. The turbine is normallyperated at constant pressure difference across the stages. Theurbine entry temperature is controlled to an accuracy of 0.3% andhe shaft speed is kept constant by the dc generator within theange of �0.02% ��0.5 rpm�. The main operational parametersf the facility are listed in Table 1. The test case under investiga-ion is representative of a partially shrouded axial turbine forower generation applications and is sketched in Fig. 1. The par-ial shroud has two vertical fins and a shroud platform with cut-acks at the leading and trailing edges. The tip clearance in both
Fig. 1 Schematic of the rotor partial shroud geometry
able 1 Main parameters of Lisa two-stage axial turbine re-earch facility
otor speed �rpm� 2625verall pressure ratio 1.38ass flow �kg/s� 10.65lade count �stator/rotor� 42 /42spect ratio 1.8ach number �stator/rotor� 0.35 /0.1eynolds number �rotor� based on Cax 2�105
hub /Rtip 0.77
otors is 1% of the blade span.
11002-2 / Vol. 131, JANUARY 2009
ded 16 Feb 2011 to 147.46.117.245. Redistribution subject to ASM
Measurement Techniques
Stereoscopic PIV. The two-stage axial research turbine rig Lisahas been equipped with a 3D-PIV optical measurement system.The stereoscopic PIV method is used to compensate for perspec-tive errors �Prasad �19�� as well as to observe the highly three-dimensional flows. Two optical windows made of acrylic polym-ethyl methacrylate �PMMA� are installed in the test turbine, asshown in Fig. 2. The window surfaces have been carefully pol-ished to achieve good transparency. The first window is locatedbetween the first rotor and the second stator, and the second win-dow is downstream of the second rotor. The windows are designedto reproduce the exact shape of the double curvature contour inthe casing of the inner wall. The flow was seeded with fine oildioctylsebacat C26H50O4 �DEHS� particles generated by a Laskinnozzle �Kähler et al. �20��. To obtain a uniform concentration aninjection device was designed to seed the entire air mass flow. Theinjection location was selected at the outlet of the radial compres-sor and upstream the heat exchanger to guarantee a sufficient mix-ing between the flow and the seeding particles. Deposits of seed-ing material on the casing windows were not significant during theoperation of the turbine. The nominal particle diameter wasaround 1 �m, which is considered adequate �according to Mellin�21�� for a frequency response up to 10 kHz.
The digital images are recorded with 1280�1024 pixels 12 bitcharge coupled device �CCD� cameras �PCO SensiCam SVGA�.The pixel size and pitch are 6.7�6.7 �m2 and 9 �m, respec-tively. The cameras are set, taking into account the Scheimpflugcondition �Zang and Prasad �22��. Nikon AF Micro Nikkor lenseswith a focal length of 60 mm are used for camera optics. Adouble-cavity �Nd:YAG� laser �Solo120PIV, New Wave Research�is used as a light source. The laser generates a maximum energyof 120 mJ/pulse of 532 nm wavelength green visible light. Thepulse width is 10 ns, and the repetition rate is 15 Hz. The bursts oflaser light are synchronized with cameras via a Dantec FlowMapsystem hub. The laser beam is delivered to a laser endoscope�Intelligent Laser Applications �ILA�� through an articulated mir-ror arm. The laser endoscope both generates the laser sheetthrough a cylindrical lens and bends the laser sheet by 90 degthrough a prism in its tip. The outer diameter of the laser endo-scope is 8 mm, and the divergence angle of the laser sheet isapproximately 16 deg. The cameras and laser endoscope aremounted on a motor-controlled one-axis linear stage so that cam-
Fig. 2 Optical windows and probe holes in the test turbine
eras and the light sheet can be moved together in the radial direc-
Transactions of the ASME
E license or copyright; see http://www.asme.org/terms/Terms_Use.cfm
t
ltifT5ppood
ctftdm
mafiitdpoa
J
Downloa
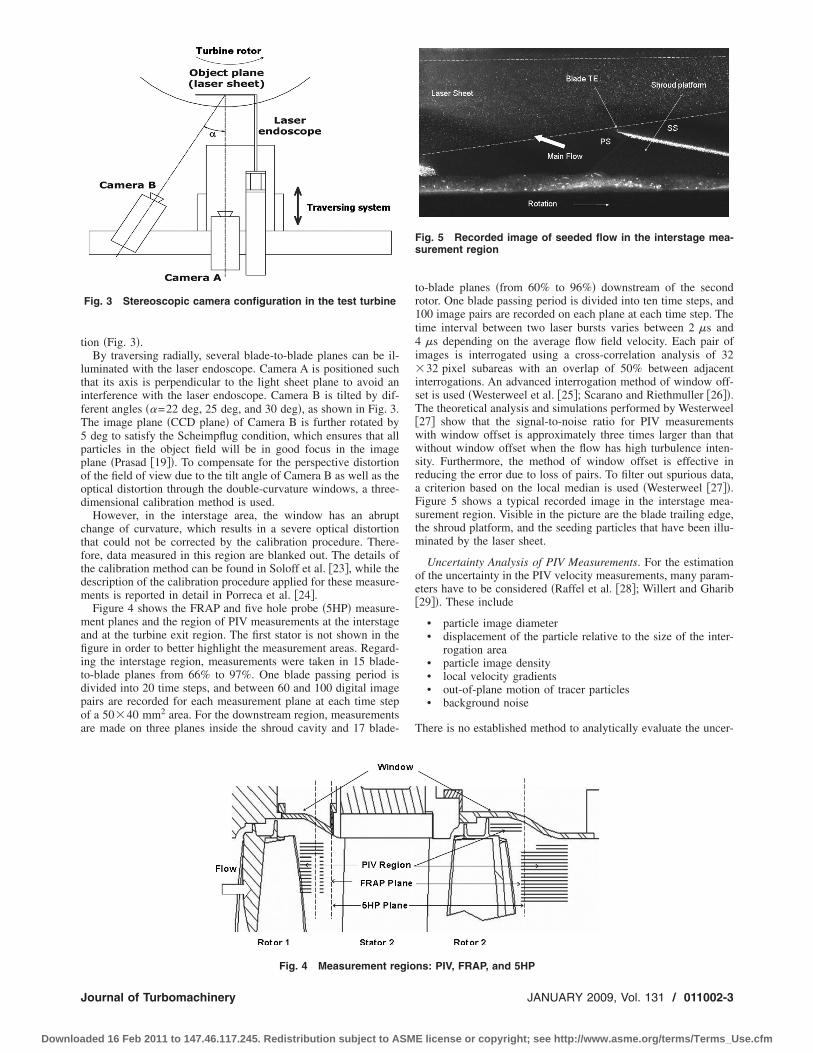
ion �Fig. 3�.By traversing radially, several blade-to-blade planes can be il-
uminated with the laser endoscope. Camera A is positioned suchhat its axis is perpendicular to the light sheet plane to avoid annterference with the laser endoscope. Camera B is tilted by dif-erent angles ��=22 deg, 25 deg, and 30 deg�, as shown in Fig. 3.he image plane �CCD plane� of Camera B is further rotated bydeg to satisfy the Scheimpflug condition, which ensures that all
articles in the object field will be in good focus in the imagelane �Prasad �19��. To compensate for the perspective distortionf the field of view due to the tilt angle of Camera B as well as theptical distortion through the double-curvature windows, a three-imensional calibration method is used.
However, in the interstage area, the window has an abrupthange of curvature, which results in a severe optical distortionhat could not be corrected by the calibration procedure. There-ore, data measured in this region are blanked out. The details ofhe calibration method can be found in Soloff et al. �23�, while theescription of the calibration procedure applied for these measure-ents is reported in detail in Porreca et al. �24�.Figure 4 shows the FRAP and five hole probe �5HP� measure-ent planes and the region of PIV measurements at the interstage
nd at the turbine exit region. The first stator is not shown in thegure in order to better highlight the measurement areas. Regard-
ng the interstage region, measurements were taken in 15 blade-o-blade planes from 66% to 97%. One blade passing period isivided into 20 time steps, and between 60 and 100 digital imageairs are recorded for each measurement plane at each time stepf a 50�40 mm2 area. For the downstream region, measurementsre made on three planes inside the shroud cavity and 17 blade-
Fig. 3 Stereoscopic camera configuration in the test turbine
Fig. 4 Measurement regio
ournal of Turbomachinery
ded 16 Feb 2011 to 147.46.117.245. Redistribution subject to ASM
to-blade planes �from 60% to 96%� downstream of the secondrotor. One blade passing period is divided into ten time steps, and100 image pairs are recorded on each plane at each time step. Thetime interval between two laser bursts varies between 2 �s and4 �s depending on the average flow field velocity. Each pair ofimages is interrogated using a cross-correlation analysis of 32�32 pixel subareas with an overlap of 50% between adjacentinterrogations. An advanced interrogation method of window off-set is used �Westerweel et al. �25�; Scarano and Riethmuller �26��.The theoretical analysis and simulations performed by Westerweel�27� show that the signal-to-noise ratio for PIV measurementswith window offset is approximately three times larger than thatwithout window offset when the flow has high turbulence inten-sity. Furthermore, the method of window offset is effective inreducing the error due to loss of pairs. To filter out spurious data,a criterion based on the local median is used �Westerweel �27��.Figure 5 shows a typical recorded image in the interstage mea-surement region. Visible in the picture are the blade trailing edge,the shroud platform, and the seeding particles that have been illu-minated by the laser sheet.
Uncertainty Analysis of PIV Measurements. For the estimationof the uncertainty in the PIV velocity measurements, many param-eters have to be considered �Raffel et al. �28�; Willert and Gharib�29��. These include
• particle image diameter• displacement of the particle relative to the size of the inter-
rogation area• particle image density• local velocity gradients• out-of-plane motion of tracer particles• background noise
There is no established method to analytically evaluate the uncer-
Fig. 5 Recorded image of seeded flow in the interstage mea-surement region
ns: PIV, FRAP, and 5HP
JANUARY 2009, Vol. 131 / 011002-3
E license or copyright; see http://www.asme.org/terms/Terms_Use.cfm

ttbt�ttfinsTpTbcmmfif
cMgt�
Trtfodt�Bpmsc�vd
0
Downloa
ainty in PIV measurements due to the above factors. Therefore,he assessment of PIV accuracy may be done for each PIV systemy using one of the following three methods. The first method iso make PIV measurements in a flow field with an exact solutione.g., Poiseuille flow or three-dimensional rotating disk flow� andhen evaluate uncertainty for the flow field. However, it is difficulto guarantee that the uncertainty determined in a canonical floweld can be applied to other more general flow fields. Also, it isot always possible to introduce such canonical flows with exactolutions in a specific environment such as the current test rig.he second method is to conduct a Monte Carlo simulation ofarticle displacements �Keane and Adrian �30�; Raffel et al. �28��.his approach allows the uncertainty of PIV measurements in aroad range of flow fields to be assessed. Third, PIV results can beompared against data obtained with hot wire or pneumatic probeethods or from direct numerical simulation �Scarano and Rieth-uller �26��. However, a rigorous evaluation of uncertainty is dif-cult with this method since the measurement techniques are dif-erent and the direct numerical simulation itself has uncertainties.
In the current investigation, a Monte Carlo simulation has beenonducted to evaluate measurement errors of PIV. To carry out aonte Carlo simulation, tracer particle images must be artificially
enerated. The light intensity scattered from individual tracer par-icles is assumed to have a Gaussian profile in both the in-planex ,y� and out-of-plane �z� directions,
I�x,y,z� = I0 exp�− �x − x0�2 − �y − y0�2
�1/8�d2 �exp�−z0
2
�1/8��z02�
�1�
he location of each tracer particle �x0, y0, z0� is set by using aandom number generator. Then, the light intensity scattered fromhe particle at each location in an interrogation area can be definedrom Eq. �1�. Four parameters—particle image diameter, numberf particles, maximum light intensity I0, and actualisplacement—must be given a priori. The diameter of tracer par-icles is set such that the particle fills a 2�2 pixels pixel or 3
3 pixels pixel region. The number of particles used here is 50.oth of these parameters were determined via a trial-and-errorrocess so that the artificially generated images look similar to theeasured images. Based on these artificial images, the first and
econd image frames with a time interval between 2 �s and 4 �san be generated. The actual displacements of the particle�x ,�y ,�z� are taken from a representative averaged velocityalue measured with PIV at each point of interest. Based on these
Table 2 Uncertainty analysis o
SpanTangeveloc
Intersta96% Actual values 30
Mean 28.3Standard deviation �m/s� 0.9Bias error �m/s� 1.7
66% Actual values 30Mean 28.3Standard deviation �m/s� 2.2Bias error �m/s� 1.6
Turbine85% Actual values 10
Mean 13.0Standard deviation �m/s� 1.9Bias error �m/s� 3.0
isplacements, the image pairs of tracer particles in the object
11002-4 / Vol. 131, JANUARY 2009
ded 16 Feb 2011 to 147.46.117.245. Redistribution subject to ASM
plane can be generated.The images are not generated for the entire field of view �for
the current investigation, 50�40 mm2� but at three points �asshown in Table 2�. A point in the field of view corresponds to a32�32 pixel interrogation area in the image plane. However, theimages are generated in a 96�96 pixel pixel region to properlyaccount for the particles that enter and exit the 32�32 pixel in-terrogation area that is located at the center of the 96�96 pixelpixel region. With stereoscopic PIV, the displacement values seenby the two cameras are different, particularly when there are out-of-plane displacement components. Also, perspective and opticaldistortions of the images occur when the particle images are pro-jected onto the image planes. The calibration procedure is used toestimate both the image distortion and the displacements seen inboth cameras’ image planes. The interrogation area is also subjectto background noise due to reflection on solid surfaces and thelight that is scattered from tracer particles located outside the lightsheet. Therefore, the background noise has a static intensity level�from the reflection� as well as a randomly moving pattern �fromthe scattering of particles outside the light sheet�. To obtain aspatially random intensity pattern, a random number generator hasbeen used. Then, the background noise is superimposed on theparticle images. Because there is a randomly moving pattern inthe background, the noise patterns for the first and the secondframes are separately generated. Three hundred particle imagepairs for each point are generated to carry out statistical evalua-tions. The stereoscopic PIV error is then evaluated by comparingthe imposed displacements to the displacements calculated fromthe artificially generated images. The measurement error consistsof two parts, bias error and root-mean-square (rms) error �Raffelet al. �28��,
�PIV = �bias + �rms
The bias error is defined as the difference between the actualvelocity value and the averaged value measured with PIV. Thisbias error originates from loss of pairs and velocity gradients inthe interrogation areas.
rms error is the standard deviation of the values measured withPIV and can be regarded as measurement uncertainty of PIV.Table 2 shows the results of the uncertainty analysis expressed interms of the bias and rms errors at the interstage and turbineregions. The bias error at the interstage region for the axial andtangential velocities �in-plane components with respect to the la-ser light sheet� is always in the range of �2 m /s. Standard devia-
ereoscopic PIV measurements
Velocity �m/s�
l Axialvelocity
Radialvelocity
Yawangle
region−5 10 80.54
−3.91 8.31 82.160.71 2.47 1.30 deg
−1.09 1.7 −1.63 deg65 10 24.7
62.99 16.59 24.222.69 5.97 1.92 deg2.01 −6.59 0.55 deg
t region30 5 18.43
31.10 1.08 22.833.48 0.59 3.31 deg1.10 −3.92 4.40 deg
f st
ntiaity
ge
12
258
exi
999
tion is in the lower range of 4–7% and higher close to the tip
Transactions of the ASME
E license or copyright; see http://www.asme.org/terms/Terms_Use.cfm

wer
mmtaocftm
paFstuaqmw
Lrvpwwms�cteptt
u�tsbo
peamai
F
tdR
J
Downloa
here the absolute velocity magnitude is smaller. In the turbinexit region, the magnitudes of the bias errors are similar, but thems errors are larger.
The bias error of the radial velocity �out-of-plane component� isore than 10% in all the planes; therefore, the radial velocityeasurements ought to be assessed only qualitatively. Another
rend is that the errors of the in-plane components �tangential andxial velocities� are similar for all three locations while the errorf the out-of-plane component increases as the measurement lo-ation is farther from the optical window. Measurement planesarther from the window suffer from more severe optical distor-ion. Thus, the error of the out-of-plane component appears to be
ore susceptible to optical distortion.
FRAP and 5HP. Flow parameters, including total and staticressures, flow angles, velocity components, and Mach numbers,re measured at frequencies of up to 40 kHz using a two-sensorRAP. This probe is a modified version of the conventional singleensor probe; a second sensor that is sensitive to pitch angle varia-ions of the flow is incorporated. This two-sensor FRAP has beensed in previous investigations �Porreca et al. �31��. The FRAPlso provides unsteady temperature measurements at a low fre-uency of up to 10 Hz. The absolute uncertainties in the measure-ents are listed in Table 3. Temperature measurements obtainedith FRAP have an absolute uncertainty of the order of �0.3 K.The FRAP probe has been developed in the Turbomachinery
aboratory at ETH Zurich in the last 20 years of research. Timeesolved measurements have been compared with laser Dopplerelocimetry measurements taken at the exit of a centrifugal com-ressor facility �32�. The agreement of the time mean velocitiesas found in the range of 0–4% while the time resolved velocitiesere within 2–5%. Furthermore, acomparison with nonintrusiveeasurements is presented in this paper. An additional compari-
on between FRAP and pneumatic probe can be found in Refs.33,18�. In the latter publication, the FRAP and 5HP data areompared at the exit of the first rotor and second stator of an axialurbine with exactly the same blade profile geometry of the onemployed in the current work. The comparison shows that theneumatic averaged data lay always in the minima and maxima ofhe FRAP measurement and therefore confirms the accuracy ofhis measurement technique.
The measurement grid comprises 1502 points that are distrib-ted uniformly in the circumferential direction at every 3.5% pitch32 points in a pitch range of 1.1� and 47 points clustered towardhe end walls in the radial direction. Data from the sensors areampled at 200 kHz, which corresponds to 109 samples for eachlade passing period. Phase-locked averaging of the data is donever 80 rotor revolutions.
Steady state measurements are performed using miniaturizedneumatic 5HPs with a 0.9 diameter cobra head shape �Treibert al. �34��. The probe is calibrated for ranges of �14 deg in yawnd �30 deg in pitch angle. The uncertainty of pneumatic probeeasurements is reported in Table 3 for angles of �10 deg in yaw
nd �10 deg in pitch. For higher pitch angles, higher uncertaintys detected.
RAP–3D PIV Comparison and AnalysisFigure 6 shows a comparison between the velocity measured by
he 3D PIV �Fig. 6�a�� and the FRAP �Fig. 6�b�� data. The FRAPata are presented over the same region as the PIV measurements.
Table 3 Uncertainty in me
Probe type � �deg� � �deg�
5HP 0.3 0.32S-FRAP 0.3 0.3
egions of the PIV measurements that have insufficient laser il-
ournal of Turbomachinery
ded 16 Feb 2011 to 147.46.117.245. Redistribution subject to ASM
lumination are blanked out at the left and right borders. Both datasets are presented with the same scale and levels. The highertangential velocity region in the middle of the pictures shows thepresence of the tip passage vortex that is located between 0.8 and0.9 of the span height. The comparison shows good agreementbetween the two measurement techniques. In the PIV plot, thecore with a high tangential velocity is slightly larger compared tothe FRAP measurements. However at the location of the vortexcore the differences in absolute magnitudes of velocity are com-parable and are within the range of �1.5 m /s, which is compa-rable to the uncertainty of the PIV measurements as discussed inthe previous section.
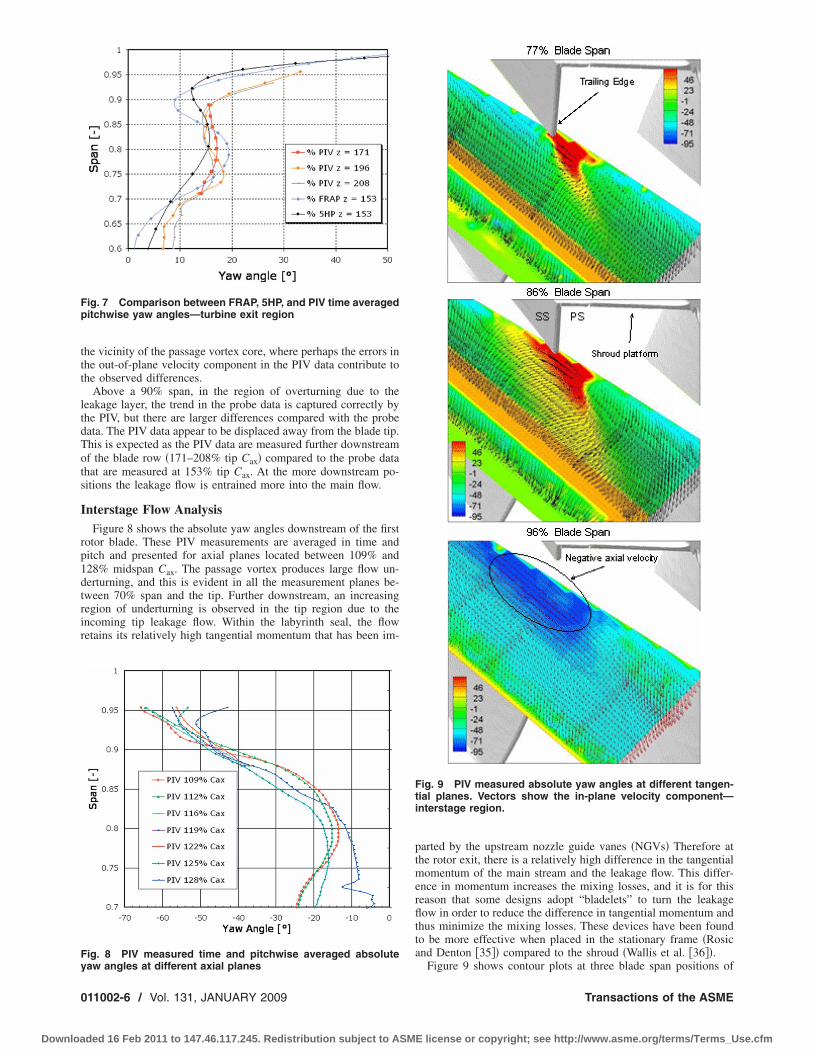
Figure 7 shows the pitchwise yaw angle distribution at differentaxial planes downstream of the second rotor blade. The time av-eraged FRAP and PIV data are presented together with 5HP mea-surements. The FRAP and 5HP measurements are made in theplane located at 153% of tip Cax. At this plane, there are blankedout regions in the PIV data, and thus three other planes located at171%, 196% and 208% tip Cax are presented for the PIV data.
A good agreement between the probe and the optical measure-ment techniques is again observed. An underturning/overturningbehavior is observed from a 0.7 span up to the blade tip where theblade profile is designed to align the flow with the underturnedleakage flow in order to minimize mixing losses. The yaw angleprofiles measured with the probes �FRAP and 5HP� are in goodagreement up to a 0.75 span. Discrepancies are observed from the0.75 span up to the blade tip since the passage vortex in the regiongenerates a high level of unsteadiness, which results in the timeaveraged signal of the fast response probe being different from thepneumatically averaged signal of the 5HP.
Overall the time averaged PIV data are in good agreement withthe probe data. Differences are of the order of �2.5 deg in theregion from 0.6 up to 0.9 blade span. The largest differences are in
rements of 5HP and FRAP
Pt �Pa� P �Pa� Ma
60 130 0.4%100 150 0.5%
Fig. 6 Measured absolute tangential velocity at one rotor
asu
blade position: „a… PIV and „b… FRAP—turbine exit region
JANUARY 2009, Vol. 131 / 011002-5
E license or copyright; see http://www.asme.org/terms/Terms_Use.cfm
ttt
ltdTots
I
rp1dtrir
Fp
Fy
0
Downloa
he vicinity of the passage vortex core, where perhaps the errors inhe out-of-plane velocity component in the PIV data contribute tohe observed differences.
Above a 90% span, in the region of overturning due to theeakage layer, the trend in the probe data is captured correctly byhe PIV, but there are larger differences compared with the probeata. The PIV data appear to be displaced away from the blade tip.his is expected as the PIV data are measured further downstreamf the blade row �171–208% tip Cax� compared to the probe datahat are measured at 153% tip Cax. At the more downstream po-itions the leakage flow is entrained more into the main flow.
nterstage Flow AnalysisFigure 8 shows the absolute yaw angles downstream of the first
otor blade. These PIV measurements are averaged in time anditch and presented for axial planes located between 109% and28% midspan Cax. The passage vortex produces large flow un-erturning, and this is evident in all the measurement planes be-ween 70% span and the tip. Further downstream, an increasingegion of underturning is observed in the tip region due to thencoming tip leakage flow. Within the labyrinth seal, the flowetains its relatively high tangential momentum that has been im-
ig. 7 Comparison between FRAP, 5HP, and PIV time averageditchwise yaw angles—turbine exit region
ig. 8 PIV measured time and pitchwise averaged absolute
aw angles at different axial planes11002-6 / Vol. 131, JANUARY 2009
ded 16 Feb 2011 to 147.46.117.245. Redistribution subject to ASM
parted by the upstream nozzle guide vanes �NGVs� Therefore atthe rotor exit, there is a relatively high difference in the tangentialmomentum of the main stream and the leakage flow. This differ-ence in momentum increases the mixing losses, and it is for thisreason that some designs adopt “bladelets” to turn the leakageflow in order to reduce the difference in tangential momentum andthus minimize the mixing losses. These devices have been foundto be more effective when placed in the stationary frame �Rosicand Denton �35�� compared to the shroud �Wallis et al. �36��.
Fig. 9 PIV measured absolute yaw angles at different tangen-tial planes. Vectors show the in-plane velocity component—interstage region.
Figure 9 shows contour plots at three blade span positions of
Transactions of the ASME
E license or copyright; see http://www.asme.org/terms/Terms_Use.cfm

taortmoattaprt
wflsflwarssoubeige
yiTprobvt
cv
ttoolwtta
is�tislctF
ppi
J
Downloa
he PIV measured yaw angle. Superimposed on the contour plotsre vectors of the in-plane velocities. The contours in the middlef the measurement plane are blanked out, as shown in the orangeegion with zero length vectors; these PIV data are unusable dueo the optical distortion through the window. All the measure-
ents are derived from phase-locked data, which are averagedver 100 samples. At the 77% blade span plane, the measured yawngle shows two distinct regions: the main “undisturbed” flow inhe middle of the passage and the wake region that is close to therailing edge. In the wake region the flow is underturned with yawngles as large as 80 deg; the deficit in the axial velocity and theresence of the passage vortex cause this underturning. The wakeegion is highly confined, compared to the main flow, and thushere are large circumferential gradients in the yaw angle.
At the 86% and 96% blade span positions, the influence of theake is reduced. At the 86% position, the region of underturnedow is significantly reduced compared to that at the 77% bladepan position. At the 96% blade position, no region of underturnedow is observed. Rather the passage vortex results in a regionith both strong overturning of the flow and measured negative
xial velocities. The resultant yaw angles exceed 90 deg in thisegion. The negative velocities arise due to the rapid flow expan-ion as the shroud platform uncovers the blade passage. The pas-age vortex grows downstream of the blade throat and expandsver the shroud platform. This growth and expansion results in anpward radial motion that is relatively weak in the middle of thelade passage and stronger downstream of the blade’s trailingdge. A similar radial motion is observed in the leakage cavity thats downstream of the second rotor with a similar partial shroudeometry; these measurements in the cavity are detailed in Yunt al. �37�.
Figure 10 shows contour plots of the PIV measured absoluteaw angles at two axial planes, 109% and 114% midspan Cax. Then-plane velocity vectors are superimposed on the contour plots.he vertical dashed line shows the trailing edge of the rotor bladerojected onto these downstream planes. The rotor motion is fromight to left. In order to highlight the wake and secondary flow,nly half of the blade pitch region is shown. The yaw angle variesetween −80 deg and +40 deg due to the presence of the passageortex. In the region between the 80% span and the blade tip,hese variations result in large gradients of the yaw angle.
These gradients are larger closer to the blade �109% mid Caxompared to 114% mid Cax� since the mixing weakens the passageortex as it evolves downstream.
The in-plane velocity vectors show the presence of a vortex athe trailing edge of the rotor blade. Its vorticity is of opposite signo that of the passage vortex. This flow phenomenon is sometimesbserved in turbomachinery blade flows and has been previouslybserved in a study of low aspect ratio, high turning NGVs �Pul-an et al. �38��. The rotation of this observed vortex is consistentith the shedding of streamwise vorticity from the pressure side
o suction side at the blade’s trailing edge. The partial covering ofhe shroud platform decreases the blade loading on the blade tipnd thus enhances the shed vorticity.
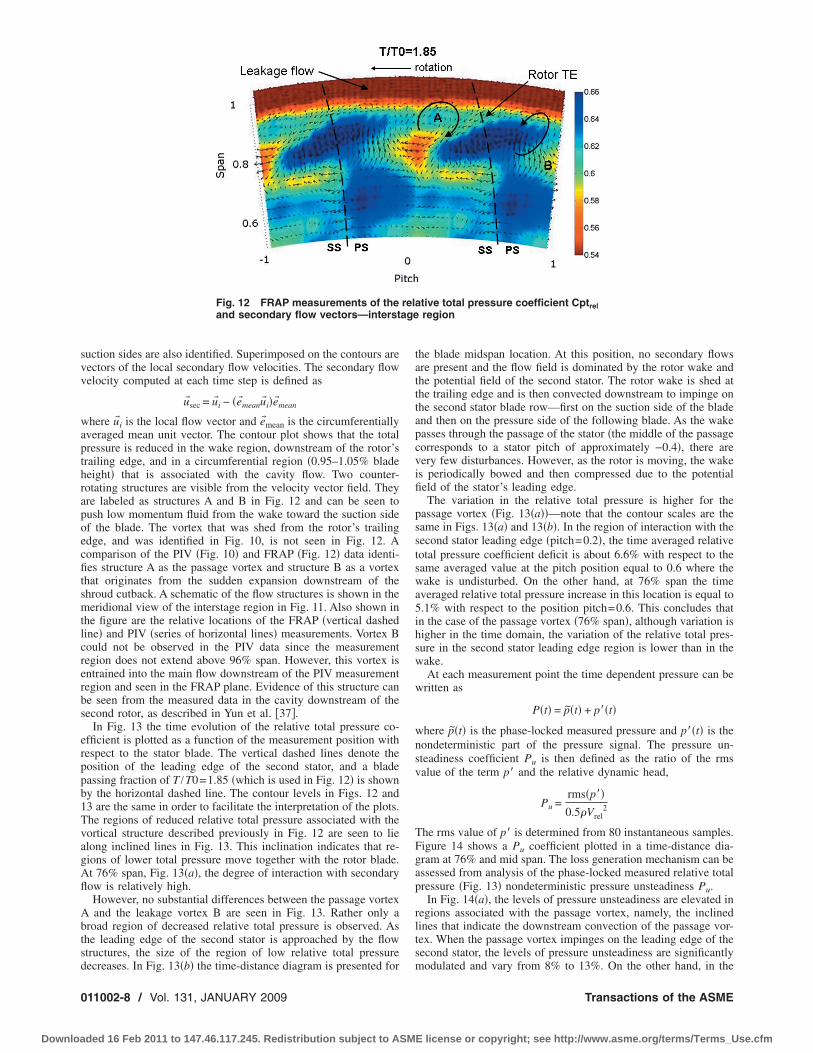
A combined effect of the passage vortex and the TE shed vortexs to displace the underturned low momentum flow toward theuction side. A comparison of the yaw angles in the upstream109% mid Cax� and downstream �114% mid Cax� planes showshat the gradients in the yaw angle are substantially reduced. Thiss a result of the merging of the two vortices. The merging andubsequent dissipation of the vortical structures result in mixingosses that may be quantified in terms of the relative total pressureoefficient. This is accomplished from the FRAP measurements inhe axial plane located downstream at 152% mid Cax, as shown inig. 11.Figure 12 shows a contour plot of the measured relative total
ressure coefficient. The data are phase locked at a rotor bladeosition of T /T0=1.85. The projected locations of the rotors’ trail-
ng edge are shown by the dashed lines, and the pressure andournal of Turbomachinery
ded 16 Feb 2011 to 147.46.117.245. Redistribution subject to ASM
Fig. 10 PIV measured absolute yaw angles at different axis-perpendicular planes. Vectors show the in-plane velocitycomponent—interstage region
Fig. 11 Schematic of flow structures and measurements in the
interstage regionJANUARY 2009, Vol. 131 / 011002-7
E license or copyright; see http://www.asme.org/terms/Terms_Use.cfm
svv
wapthrapoecfitsmtlcrerbs
erppb1TvagAfl
Abtsd
0
Downloa
uction sides are also identified. Superimposed on the contours areectors of the local secondary flow velocities. The secondary flowelocity computed at each time step is defined as
u�sec = u� i − �e�meanu� i�e�mean
here u� i is the local flow vector and e�mean is the circumferentiallyveraged mean unit vector. The contour plot shows that the totalressure is reduced in the wake region, downstream of the rotor’srailing edge, and in a circumferential region �0.95–1.05% bladeeight� that is associated with the cavity flow. Two counter-otating structures are visible from the velocity vector field. Theyre labeled as structures A and B in Fig. 12 and can be seen toush low momentum fluid from the wake toward the suction sidef the blade. The vortex that was shed from the rotor’s trailingdge, and was identified in Fig. 10, is not seen in Fig. 12. Aomparison of the PIV �Fig. 10� and FRAP �Fig. 12� data identi-es structure A as the passage vortex and structure B as a vortex
hat originates from the sudden expansion downstream of thehroud cutback. A schematic of the flow structures is shown in theeridional view of the interstage region in Fig. 11. Also shown in
he figure are the relative locations of the FRAP �vertical dashedine� and PIV �series of horizontal lines� measurements. Vortex Bould not be observed in the PIV data since the measurementegion does not extend above 96% span. However, this vortex isntrained into the main flow downstream of the PIV measurementegion and seen in the FRAP plane. Evidence of this structure cane seen from the measured data in the cavity downstream of theecond rotor, as described in Yun et al. �37�.
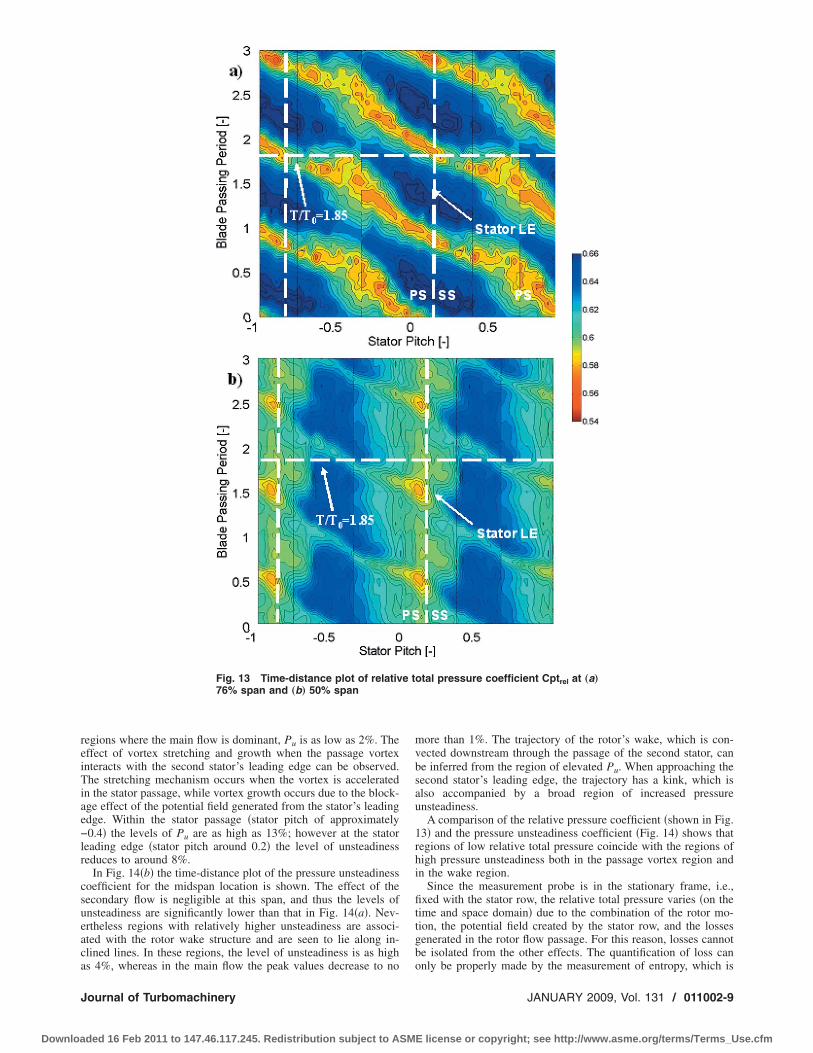
In Fig. 13 the time evolution of the relative total pressure co-fficient is plotted as a function of the measurement position withespect to the stator blade. The vertical dashed lines denote theosition of the leading edge of the second stator, and a bladeassing fraction of T /T0=1.85 �which is used in Fig. 12� is showny the horizontal dashed line. The contour levels in Figs. 12 and3 are the same in order to facilitate the interpretation of the plots.he regions of reduced relative total pressure associated with theortical structure described previously in Fig. 12 are seen to lielong inclined lines in Fig. 13. This inclination indicates that re-ions of lower total pressure move together with the rotor blade.t 76% span, Fig. 13�a�, the degree of interaction with secondaryow is relatively high.However, no substantial differences between the passage vortexand the leakage vortex B are seen in Fig. 13. Rather only a
road region of decreased relative total pressure is observed. Ashe leading edge of the second stator is approached by the flowtructures, the size of the region of low relative total pressure
Fig. 12 FRAP measurements of theand secondary flow vectors—interst
ecreases. In Fig. 13�b� the time-distance diagram is presented for
11002-8 / Vol. 131, JANUARY 2009
ded 16 Feb 2011 to 147.46.117.245. Redistribution subject to ASM
the blade midspan location. At this position, no secondary flowsare present and the flow field is dominated by the rotor wake andthe potential field of the second stator. The rotor wake is shed atthe trailing edge and is then convected downstream to impinge onthe second stator blade row—first on the suction side of the bladeand then on the pressure side of the following blade. As the wakepasses through the passage of the stator �the middle of the passagecorresponds to a stator pitch of approximately −0.4�, there arevery few disturbances. However, as the rotor is moving, the wakeis periodically bowed and then compressed due to the potentialfield of the stator’s leading edge.
The variation in the relative total pressure is higher for thepassage vortex �Fig. 13�a��—note that the contour scales are thesame in Figs. 13�a� and 13�b�. In the region of interaction with thesecond stator leading edge �pitch=0.2�, the time averaged relativetotal pressure coefficient deficit is about 6.6% with respect to thesame averaged value at the pitch position equal to 0.6 where thewake is undisturbed. On the other hand, at 76% span the timeaveraged relative total pressure increase in this location is equal to5.1% with respect to the position pitch=0.6. This concludes thatin the case of the passage vortex �76% span�, although variation ishigher in the time domain, the variation of the relative total pres-sure in the second stator leading edge region is lower than in thewake.
At each measurement point the time dependent pressure can bewritten as
P�t� = p̃�t� + p��t�
where p̃�t� is the phase-locked measured pressure and p��t� is thenondeterministic part of the pressure signal. The pressure un-steadiness coefficient Pu is then defined as the ratio of the rmsvalue of the term p� and the relative dynamic head,
Pu =rms�p��0.5Vrel
2
The rms value of p� is determined from 80 instantaneous samples.Figure 14 shows a Pu coefficient plotted in a time-distance dia-gram at 76% and mid span. The loss generation mechanism can beassessed from analysis of the phase-locked measured relative totalpressure �Fig. 13� nondeterministic pressure unsteadiness Pu.
In Fig. 14�a�, the levels of pressure unsteadiness are elevated inregions associated with the passage vortex, namely, the inclinedlines that indicate the downstream convection of the passage vor-tex. When the passage vortex impinges on the leading edge of thesecond stator, the levels of pressure unsteadiness are significantly
ative total pressure coefficient Cptrelregion
relage
modulated and vary from 8% to 13%. On the other hand, in the
Transactions of the ASME
E license or copyright; see http://www.asme.org/terms/Terms_Use.cfm
reiTiae−lr
csueaca
J
Downloa
egions where the main flow is dominant, Pu is as low as 2%. Theffect of vortex stretching and growth when the passage vortexnteracts with the second stator’s leading edge can be observed.he stretching mechanism occurs when the vortex is accelerated
n the stator passage, while vortex growth occurs due to the block-ge effect of the potential field generated from the stator’s leadingdge. Within the stator passage �stator pitch of approximately0.4� the levels of Pu are as high as 13%; however at the stator
eading edge �stator pitch around 0.2� the level of unsteadinesseduces to around 8%.
In Fig. 14�b� the time-distance plot of the pressure unsteadinessoefficient for the midspan location is shown. The effect of theecondary flow is negligible at this span, and thus the levels ofnsteadiness are significantly lower than that in Fig. 14�a�. Nev-rtheless regions with relatively higher unsteadiness are associ-ted with the rotor wake structure and are seen to lie along in-lined lines. In these regions, the level of unsteadiness is as high
Fig. 13 Time-distance plot of relativ76% span and „b… 50% span
s 4%, whereas in the main flow the peak values decrease to no
ournal of Turbomachinery
ded 16 Feb 2011 to 147.46.117.245. Redistribution subject to ASM
more than 1%. The trajectory of the rotor’s wake, which is con-vected downstream through the passage of the second stator, canbe inferred from the region of elevated Pu. When approaching thesecond stator’s leading edge, the trajectory has a kink, which isalso accompanied by a broad region of increased pressureunsteadiness.
A comparison of the relative pressure coefficient �shown in Fig.13� and the pressure unsteadiness coefficient �Fig. 14� shows thatregions of low relative total pressure coincide with the regions ofhigh pressure unsteadiness both in the passage vortex region andin the wake region.
Since the measurement probe is in the stationary frame, i.e.,fixed with the stator row, the relative total pressure varies �on thetime and space domain� due to the combination of the rotor mo-tion, the potential field created by the stator row, and the lossesgenerated in the rotor flow passage. For this reason, losses cannotbe isolated from the other effects. The quantification of loss can
otal pressure coefficient Cptrel at „a…
e tonly be properly made by the measurement of entropy, which is
JANUARY 2009, Vol. 131 / 011002-9
E license or copyright; see http://www.asme.org/terms/Terms_Use.cfm

rpted
saop
ttndpdcasavitii1
Fc
0
Downloa
etrieved by the combination of instantaneous temperature andressure. Although the FRAP can measure both quantities simul-aneously, the frequency response of the temperature signal is sev-ral orders of magnitude lower than the pressure signal; thus theseata cannot be used for unsteady entropy measurements.
The set of measured data presented in this work clearly show atrong correlation between region of low relative total pressurend high nondeterministic pressure unsteadiness. The combinationf these two quantities can be considered as an indication of lossroduction, and thus unsteady loss mechanisms can be assessed.
Kelvin’s theorem indicates that the circulation around a streamube is constant. Thus in an incompressible flow, such as that inhe present work, an increase in the vortex diameter is accompa-ied by a decrease in the kinetic energy. This induces a lowerissipation and thus lower rate of mixing and loss generation. Thishenomenon occurs periodically when the vortex diameter growsue to the blockage effect of the second stator leading edge and islearly observed from the measurement of relative total pressuret 76% span �Fig. 13�a�� together with the increased level of un-teadiness in Fig. 14�a�. A similar approach can be used in thenalysis of the wake mechanism. If the wake is considered as aortical structure with two counter-rotating vortex sheets, accord-ng to Kelvin’s theorem, the velocity difference is increased whenhe wake is compressed. This compression therefore results in anncreased velocity gradient inside the wake, which in turn resultsn an increase in the mixing losses. This process is shown in Fig.
ig. 14 Time-distance plot of pressure unsteadiness coeffi-ient Pu „%… at „a… 76% span and „b… 50% span
3�b� around a pitch of 0.2 where a broad area of increased rela-
11002-10 / Vol. 131, JANUARY 2009
ded 16 Feb 2011 to 147.46.117.245. Redistribution subject to ASM
tive total pressure drop, as well as an increased level of pressureunsteadiness �Fig. 14�b��, is measured. Thus there is a clear linkbetween the loss production mechanism and the kinking of wake’sstructure as the wake is turned and successively compressedaround the stator leading edge.
It is also noteworthy to point out the concentrated region ofhigh unsteadiness in the middle of the rotor blade passage—this islabeled as C in Fig. 14�b�. Its periodic appearance suggests that itis associated with the chopped wake shed from the first NGV. Thischopped wake is convected downstream through the rotor bladepassage. Further analysis is required to confirm the source of thisconcentrated region since the equal number of blade counts doesnot make it possible to clearly separate the effect of flow struc-tures generated in the NGV or in the rotor.
The measurements of the relative total pressure and pressureunsteadiness coefficients that were presented above show that theunsteady loss generation mechanisms at the midspan are differentfrom those in the secondary flow region. In the region of second-ary flow, the mechanisms are driven by the stretching and growthof passage vortex, and from the measured data, this mechanism ismore pronounced at 76% span compared to the midspan region.Thus, modifications to the characteristics of the secondary flowdeserve more attention in the aerodynamic design. For example, arotor/stator design that increases the mixing in the tip region andthus reduces the diffusion of the unsteady vortex should improvethe aerodynamic performance. This can be accomplished by in-cluding forward sweep in the blade stacking on the second stator’stip as a means to increase the axial distance between the rotor andstator.
The degree of mixing of the flow in the interstage region can bestudied by observing the variation of the measured yaw angle atone fixed rotor blade position at different axial location in thevolume shown in Fig. 11. The yaw angle variation, derived fromthe PIV measurements, as a function of the blade pitch is shown inFig. 15 for five axial positions �from 110% Cax to 117% Cax�. Atall positions the data are measured at 80% blade span. Also shownin the figure is the yaw angle derived from the more downstreamlocated FRAP. It can be seen that the largest changes in the yawangle occur at the most upstream position �110% Cax�. The peakvalue occurs at a pitch of approximately −0.1, and significantunderturning occurs in the pitch range of −0.15 to 0.1. At the moredownstream positions, the peak value decreases and occurs at amore negative pitch as the passage vortex convects downstream.However, the region of the main flow �seen in the pitch ranges of−0.75 to −0.4 and 0.2–0.65� remains almost unchanged. The lo-cation of the peak value in the yaw angle that is observed in the
Fig. 15 Circumferential evolution of yaw angle at differentaxial locations „110%–152% Cax… at 80% span—one rotor bladeposition
FRAP measurements is expected due to its more downstream lo-
Transactions of the ASME
E license or copyright; see http://www.asme.org/terms/Terms_Use.cfm

cpo
C
micflfipa
ibuaeectpp
nptsf
sti
A
rAetIfa
N
G
J
Downloa
ation. It is also noted that at this more downstream position theitch range of underturning is broader due to the increased mixingf the vortex into the main flow.
onclusionA unique set of steady and unsteady data has been acquired byeans of different measurement techniques �3D-PIV and FRAP�
n a partially shrouded multistage axial turbine. Owing to theombination of flow velocimetry and pressure measurements, theow kinematics and loss generation mechanism have been veri-ed. Stereoscopic PIV has been compared with FRAP unsteadyressure measurements and 5HP at the exit of the turbine section,nd they show a good agreement.
The interaction of vortex structures has been studied in thenterstage tip region. The passage vortex grows downstream of thelade throat and then passes over the shroud platform due to thencovering of the blade throat. Together with the passage vortex,vortex is formed due to a sudden flow expansion at the trailing
dge of the shroud. The interaction of the two vortex structuresntrains low momentum fluid from the wake and thus generates aore of local pressure losses that are measured downstreamhroughout the interstage region. The analysis of time-distancelots shows that this interaction is triggered by the blade passingeriod.
Unsteady loss generation has been discussed from the combi-ation of measured relative total pressure and the nondeterministicressure unsteadiness in the interstage region. Flow structure in-eraction, with the second stator’s leading edge such as vortextretching and wake bending mechanisms have been observed andound to be a primary source of unsteady losses.
This work presents a unique combination of velocity and pres-ure data and detailed flow analysis, which enables the possibilityo enhance flow modeling used in the design process and providesmproved understanding of loss generation mechanisms.
cknowledgmentThe support of the Alstom-ETH research and development fo-
um “Center of Energy Conversion” and the financial support oflstom Power are acknowledged. The authors gratefully acknowl-
dge Alstom Power Switzerland and Rolls Royce Deutschland forheir kind permission to publish the results presented in this paper.n particular, thanks are due to Michael Loetzerich and Erik Jankeor their support and suggestions during the course of this researchctivity.
omenclatureCax rotor blade axial chordCpt total pressure coefficient
�P0meas− PSexit� / �P0inlet− PSexit�d diameter of the seeding particle in Eq. �1�I scattered light intensity
I0 maximum light intensity in Eq. �1�Ma Mach number
NGV nozzle guide vaneP static pressure
PS blade pressure sideSS blade suction side
u ,v ,w axial, tangential, radial flow velocitiesT /T0 blade passing period fraction
TE trailing edgex0, y0, z0 location of tracer particles in Eq. �1�
z turbine axial coordinate
reek� angle between cameras A and B
�z0 laser beam thickness� measurement error
� pitch angleournal of Turbomachinery
ded 16 Feb 2011 to 147.46.117.245. Redistribution subject to ASM
� yaw angle density
Subscripts0 stagnation quantity
rel relative quantitysec secondary flow vector
mean mean unit vector
References�1� Schlienger, J., Kalfas, A. I., and Abhari, R. S., 2005, “Vortex-Wake-Blade
Interaction in a Shrouded Axial Turbine,” ASME J. Turbomach., 127, pp.633–707.
�2� Miller, R. J., Moss, R. W., Ainsworth, R. W., and Horwood, C. K., 2003,“Time-Resolved Vane-Rotor Interaction in a High-Pressure Turbine Stage,”ASME J. Turbomach., 125, pp. 1–13.
�3� Pfau, A., Schlienger, J., Rusch, D., Kalfas, A. I., and Abhari, R. S., 2005,“Unsteady Flow Interaction Within the Inlet Cavity of a Turbine Rotor TipLabyrinth Seal,” ASME J. Turbomach., 127, pp. 679–688.
�4� Gaetani, P., Persico, G., Dossena, V., and Osnaghi, C., 2006, “Investigation ofthe Flow-Field on a HP Turbine Stage for Two Stator-Rotor Axial Gaps. PartII: Unsteady Flow Field,” ASME Paper No. IGTI GT2006-90556.
�5� Wernet, M. P., 2000, “Application of DPIV to Study Both Steady State andTransient Turbomachinery Flows,” Opt. Laser Technol., 32, pp. 497–525.
�6� Balzani, N., Scarano, F., Riethmuller, M. L., and Breugelmans, F. A. E., 2000,“Experimental Investigation of the Blade-to-Blade in a Compressor Rotor byDigital Particle Image Velocimetry,” ASME J. Turbomach., 122, pp. 743–750.
�7� Sanders, A. J., Papalia, J., and Fleeter, S., 2002, “Multi-Blade Row Interac-tions in a Transonic Axial Compressor: Part I—Stator Particle Image Veloci-metry �PIV� Investigation,” ASME J. Turbomach., 124, pp. 10–18.
�8� Uzol, O., Chow, Y. C., Katz, J., and Meneveau, C., 2002, “Experimental In-vestigation of Unsteady Flow Field Within a Two-Stage Axial TurbomachineUsing Particle Image Velocimetry,” ASME J. Turbomach., 124, pp. 542–552.
�9� Ibaraki, S., Matsuo, T., and Yokoyama, T., 2006, “Investigation of UnsteadyFlow Field in Vaned Diffuser of a Centrifugal Compressor,” ASME Paper No.GT2006-90268.
�10� Estevadeordal, J., Gogineni, S., Goss, L., Copenhaver, W., and Gorrell, S.,2002, “Study of Wake-Blade Interactions in a Transonic Compressor UsingFlow Visualization and DPIV,” ASME J. Fluids Eng., 124, pp. 166–175.
�11� Liu, B., Wang, H., Liu, H., Yu, H., Jiang, H., and Chen, M., 2004, “Experi-mental Investigation of Unsteady Field in the Tip Region of an Axial Com-pressor Rotor Passage at Near Stall Condition with Stereoscopic Particle Im-age Velocimetry,” ASME J. Turbomach., 126, pp. 360–370.
�12� Göttlich, E., Woisetschläger, J., Pieringer, P., Hampel, B., and Heitmeir, F.,2005, “Investigation of Vortex Shedding and Wake-Wake Interaction in a Tran-sonic Turbine Stage using Laser-Doppler-Velocimetry and Particle Image Ve-locimetry,” ASME Paper No. GT2005-68579.
�13� Dorris, A. R., North, W. E., and Malandra, A. J., 1996, “Gas Turbine BladeHaving a Cooled Shroud,” U.S. Patent No. 5,482,435.
�14� Tomita, Y., 1998, “Gas Turbine Rotor,” U.S. Patent No. 5785496.�15� Nirmalan, N. V., and Bailey, J. C., 2005, “Experimental Investigation of Aero-
dynamic Losses of Different Shapes of a Shrouded Blade Tip Section,” ASMEPaper No. IGTI GT2005-68903.
�16� Harvey, N. W., and Ramsden, K., 2001, “A Computational Study of a NovelTurbine Rotor Partial Shroud,” ASME J. Turbomach., 123, pp. 534–543.
�17� Willer, L., Harvey, N. W., Haselbach, F., and Newman, D. A., 2006, “AnInvestigation Into Novel Turbine Rotor Winglet—Part II: Numerical Resultsand Experimental Results,” ASME Paper No. IGTI GT2006-90459.
�18� Porreca, L., Behr, T., Schlienger, J., Kalfas, A. I., Abhari, R. S., Ehrhard, J.,and Janke, E., 2005, “Fluid Dynamics and Performance of Partially and FullyShrouded Axial Turbines,” ASME J. Turbomach., 127, pp. 668–678.
�19� Prasad, A. K., 2000, “Stereoscopic Particle Image Velocimetry,” Exp. Fluids,29, pp. 103–116.
�20� Kähler, C. J., Sammler, B., and Kompenhans, J., 2002, “Generation and Con-trol of Tracer Particles for Optical Flow Investigations in Air,” Exp. Fluids,33, pp. 736–742.
�21� Mellin, A., 1997, “Tracer Particles and Seeding for Particle Image Velocim-etry,” Meas. Sci. Technol., 8, pp. 1496–1416.
�22� Zang, W. J., and Prasad, A. K., 1997, “Performance Evaluation of a Sche-impflug Stereocamera for Particle Image Velocimetry,” Appl. Opt., 36, pp.8738–8744.
�23� Soloff, S. M., Adrian, R. J., and Liu, Z-.C., 1997, “Distortion Compensationfor Generalized Stereoscopic Particle Image Velocimetry,” Meas. Sci. Tech-nol., 8, pp. 1441–1454.
�24� Porreca, L., Kalfas, A. I., Abhari, R. S., Yun, Y. I., and Song, S. J., 2006,“Stereoscopic PIV Measurements in A two-Stage Axial Turbine,” The 18thSymposium on Measurement Techniques in Transonic and Supersonic Flow inCascades and Turbomachinery, Thessaloniki, Greece, September.
�25� Westerweel, J., Dabiri, D., and Gharib, M., 1997, “The Effect of a DiscreteWindow Offset on the Accuracy of Cross-Correlation Analysis of Digital PIVRecordings,” Exp. Fluids, 23, pp. 20–28.
�26� Scarano, F., and Riethmuller, M. L., 1999, “Iterative Multigrid Approach inPIV Image Processing With Discrete Window Offset,” Exp. Fluids, 26, pp.
513–523.JANUARY 2009, Vol. 131 / 011002-11
E license or copyright; see http://www.asme.org/terms/Terms_Use.cfm

0
Downloa
�27� Westerweel, J., 1994, “Efficient Detection of Spurious Vectors in Particle Im-age Velocimetry,” Exp. Fluids, 16, pp. 237–247.
�28� Raffel, M., Willert, C., and Kompenhans, J., 1998, Particle Image Velocimetry:A Practical Guide, Springer, Berlin.
�29� Willert, C. E., and Gharib, M., 1991, “Digital Particle Image Velocimetry,”Exp. Fluids, 10, pp. 181–193.
�30� Keane, R. D., and Adrian, R. J., 1992, “Theory of Cross Correlation Analysisof PIV Images,” Appl. Sci. Res., 49, pp. 191–215.
�31� Porreca, L., Hollenstein, M., Kalfas, A. I., and Abhari, R. S., 2007, “Turbu-lence Measurements and Analysis in a Multistage Axial Turbine,” J. Propul.Power, 23�1�, pp. 227–234.
�32� Gizzi, W. P., Roudener, C., Stahlecker, D., Köppel, P., and Gyarmathy, G.,1999, “Time-Resolved Measurements With Fast-Response Probes and DopplerVelocimetry at the Impeller Exit of a Centrifugal Compressor: A Comparisonof Two Measurement Techniques,” Proc. Inst. Mech. Eng., Part A, 213, pp.291–318.
�33� Kupferschmied, P., Köppel, P., Gizzi, W., Roudener, C., and Gyarmathy, G.,
1999, “Time-Resolved Measurements in Fast-Response Aerodynamic Probes11002-12 / Vol. 131, JANUARY 2009
ded 16 Feb 2011 to 147.46.117.245. Redistribution subject to ASM
in Turbomachines,” Meas. Sci. Technol., 11, pp. 1036–1054.�34� Treiber, M., Kupferschmied, P., and Gyarmathy, G., 1998, “Analysis of the
Error Propagation Arising From the Measurements With a Miniature Pneu-matic 5-Hole Probe,” XIVth Symposium on Measuring Techniques for Tran-sonic and Supersonic Flows in Cascade and Turbomachines.
�35� Rosic, B., and Denton, J., 2006, “The Control of Shroud Leakage Loss byReducing Circumferential Mixing,” ASME Paper No. GT2006-90949.
�36� Wallis, A. M., Denton, J. D., and Demargne, A. A. J., 2001, “The Control ofShrouded Leakage Flows to Reduce Aerodynamic Losses in a Low AspectRatio, Shrouded Axial Flow Turbine,” ASME J. Turbomach., 123, pp. 334–341.
�37� Yun, Y. I., Porreca, L., Kalfas, A. I., Song, S. J., and Abhari, R. S., 2006,“Investigation of 3D Unsteady Flows in a Two Stages Shrouded Axial TurbineUsing Stereoscopic PIV and FRAP—Part II: Kinematics of Shroud CavityFlow,” ASME Paper No. GT2006-91020.
�38� Pullan, G., Denton, J., and Dunkley, M., 2003, “An Experimental and Com-putational Study of a Streamwise Shed Vortex in a Turbine Stage,” ASME J.
Turbomach., 125, pp. 291–297.Transactions of the ASME
E license or copyright; see http://www.asme.org/terms/Terms_Use.cfm