interpretation: how to use psychometrics. a different format previous talks were generally about one...
TRANSCRIPT

Interpretation: How to Use Psychometrics

A Different Format
• Previous talks were generally about one topic• Today’s presentation: Where does this stuff come
up at MP, outside of the psychos? • A little bit of info on several different things

The goals
• Understand various psychometric analyses as they arise in day-to-day work
• See which stats are used in different applications
• Answer questions

Topics Covered
• Things you’d find in a key verification file– Classical stats (p-values, point-biserials)
• Things you’d find at a form pulling– IRT stats (TCC’s, TIF’s)
• Things you’d find in a technical manual– All sorts of info
• A question you’d hear at a standard setting– IRT

1. Key Verification Files
• Purpose: To check the correctness of answer keys (MC items)
• A list of items whose stats are unusual or merit further investigation
• Items identified based on their p-values and/or point-biserials

• P-value: The proportion of students answering an item correctly– “How easy is the item?”
• Point-biserial: The correlation between item score and total score– “If you do well on the item, do you tend to do
well on the test?”

When might we be alarmed?
• Not many kids are picking the right answer– The p-value is low (less than .25)
• Low-performing kids are doing better on the item than high-performing kids– The point-biserial is low (less than .15)
and/or• If an incorrect answer choice has strange
stats

Distractor Stats
• Distractor p-value: The proportion of students picking the distractor (say, choice C when the correct answer is B)– “How popular is choice C?”
– Flag item if distractor p-value is higher than .3
• Distractor point-biserial: The correlation between picking the distractor and total test score– “If you picked C, how well did you tend to do on the test?”
– Flag item if distractor PBS is positive

An Operational Example
• A recent item had the following stats:– Key = D– P-value = 0.10– Point-biserial = -0.02– P-value for “C” = 0.60– Point-biserial for “C” = 0.20
• So the key was wrong? Nope

How Can That Happen?
• An example: What is the definition of the word travesty?
A: MockeryB: InjusticeC: BellybuttonD: Some even stupider answer than “bellybutton”
• Actual definition: “Any grotesque or debased likeness or imitation”
• The correct answer is “A”, but “travesty of justice” threw off the high-performing students

To sum up…
• Psychometrics can help us identify items whose keys need to be checked
• Stats used:– P-values
– Point-biserials
– Distractor p-values and point-biserials
• P-values & point-biserials should be relatively high, distractor values should be relatively low
• The key usually turns out to be right, but that’s OK

2. Form Pulling
• Context: We are choosing items for next year’s exam
• Clients like to look at psychometric info when picking items (e.g., MCAS)
• We know the stats ahead of time because items were field-tested
• Relevant stats: Test Characteristic Curves (TCC’s), raw score cut points, Test Information Functions (TIF’s)

• This stuff relates to Item Response Theory (IRT)• TCC is a plot that tells you the expected raw score
for each value of ability (denoted theta)• As ability increases, expected raw score increases

Example of a TCC: 5 Items
0
1
2
3
4
5
-3 -2 -1 0 1 2 3
q
Exp
ecte
d R
aw S
core

Raw Score Cut Points
• Suppose test has 4 performance levels: Below Basic, Basic, Proficient, Advanced
• How many points do you need in order to reach the Basic level? Proficient? Advanced?
• Example: Test goes from 0 to 72. Need 35 to reach Basic; 51 to reach Proficient; 63 to reach Advanced
• Standard Setting often tells us theta cut points; clients want to know raw score cuts

Using the TCC to find a cut point
• Suppose theta cut is 0.4
• Find expected raw score at 0.4 using the TCC. It is 3.3
• Cut is placed between 3 and 4
0
1
2
3
4
5
-3 -2 -1 0 1 2 3
q
Exp
ecte
d R
aw S
core

Test Information Functions
• TIF’s tell us the test precision at each level of ability
• The higher the curve, the more precision
• Easy items give us precision for low values of theta. Similarly:– Hard items give precision at high values– Medium items give precision at medium values

Example of a TIF
0
0.05
0.1
0.15
0.2
0.25
0.3
-4 -3 -2 -1 2E-15 1 2 3 4
q
Info
rma
tio
n

Why does the client care?
• It is often desired that next year’s forms are similar to this year’s forms
• Make sure tests are correct difficulty (TCC, RS cut points) & precision (TIF)
• Match TCC’s, cut points, TIF’s of the two years

Why should the forms be similar?
• Theoretically, we should be able to account for differences through equating (Liz)
• However, want the student experience to be similar from year to year
• Don’t want to give easy test to Class of ’07, hard test to Class of ’08
• Don’t want to make this year’s test less precise than last year’s

Example: 2007 MCAS, Grade 10 Math
• Proposed 2007 TCC was lower than last year’s• Solution: Replace some hard items with easy items
0
10
20
30
40
50
60
70
-4 -3 -2 -1 0 1 2 3 4
2005/2006 TCC Proposed TCC

Example, Continued
• Proposed 2007 TIF had less info at low abilities, more info at high abilities
• Solution: – Replace some hard items with easy items– Use hard items with lower PBS, easy items with higher PBS
0
5
10
15
20
25
30
35
40
45
-4 -3 -2 -1 0 1 2 3 4
2005/2006 TIF Proposed TIF

Example, Continued
• Proposed 2007 raw score cuts lower than 2006 raw score cuts
• Solution: Replace some hard items with easy items
RAW SCORE CUTS
OLD PROPOSED
20 15
33 28
45 41

Guide to making changes
Some rules-of-thumb for different problems:
TCC TIF Cuts
Too low Add easier items Add high PBS Add easier items
Too high Add harder items Add low PBS Add harder items

To sum up…
• Item Response Theory is useful in form pulling• TCC’s, raw score cuts, TIF’s are often examined
– Proposed values should be similar to current year’s
– Tests shouldn’t be too easy or hard
– Tests should be informative but not too informative
• It’s helpful to know how we can change these things based on item stats

3. Technical Manuals
• Things in Technical Manuals vary from program to program
• Often see some of the following:– P-values and point-biserials (thanks Louis!)– Test reliabilities (thanks Louis!)– TCC’s and TIF’s (thanks Mike!)– DIF (thanks Won!)– Standard Setting (thanks Liz and Abdullah!)– Equating (thanks in advance Liz!)– Inter-rater reliability (thanks for nothing!)– Decision consistency and accuracy (ditto)

Technical Manuals: P-Values & Point-Biserials
• You’ll often see a table like this:
Grade Subject Stat ALL MC OR
3 MAT Diff 0.67 ( 0.15) 0.7 ( 0.13) 0.61 ( 0.16)
3 MAT Disc 0.44 ( 0.08) 0.43 ( 0.07) 0.47 ( 0.1)
3 MAT N 142 89 53
3 REA Diff 0.67 ( 0.15) 0.71 ( 0.13) 0.52 ( 0.11)
3 REA Disc 0.48 ( 0.1) 0.45 ( 0.09) 0.6 ( 0.05)
3 REA N 85 70 15

Technical Manuals: Reliabilities (and other stats)
• Louis said: Reliability is the correlation between scores on parallel forms. Higher reliability Greater consistency
• You’ll often see a table like this:
Grade Subject N Points Min Max Mean S.D. Rel. (α)
3 MAT 32219 65 0 65 40.341 13.693 0.934
3 REA 32087 52 0 52 31.446 10.869 0.895
4 MAT 32673 65 0 65 39.628 13.043 0.925
4 REA 32527 52 0 52 33.452 9.112 0.891
5 MAT 33532 66 0 66 31.546 13.68 0.917
5 REA 33402 52 0 52 29.153 8.64 0.876
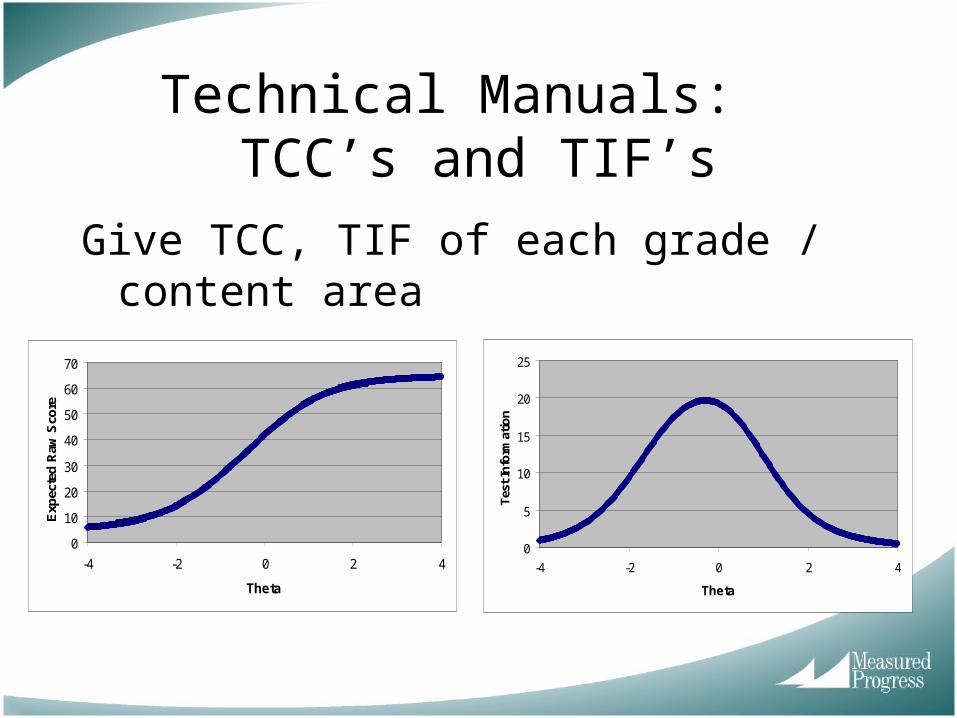
Technical Manuals: TCC’s and TIF’s
Give TCC, TIF of each grade / content area
0
5
10
15
20
25
-4 -2 0 2 4
Theta
Tes
t In
form
atio
n
0
10
20
30
40
50
60
70
-4 -2 0 2 4
Theta
Exp
ecte
d R
aw S
core

Technical Manuals: DIF
• Won said: An item has DIF if the probability of getting the item right is dependent on group membership (e.g., gender, ethnic group)
• Measured Progress uses a method called the Standardized P-Difference
• Comparing groups– Male-Female– White-Black– White-Hispanic
• Minimum 200 examinees in each group
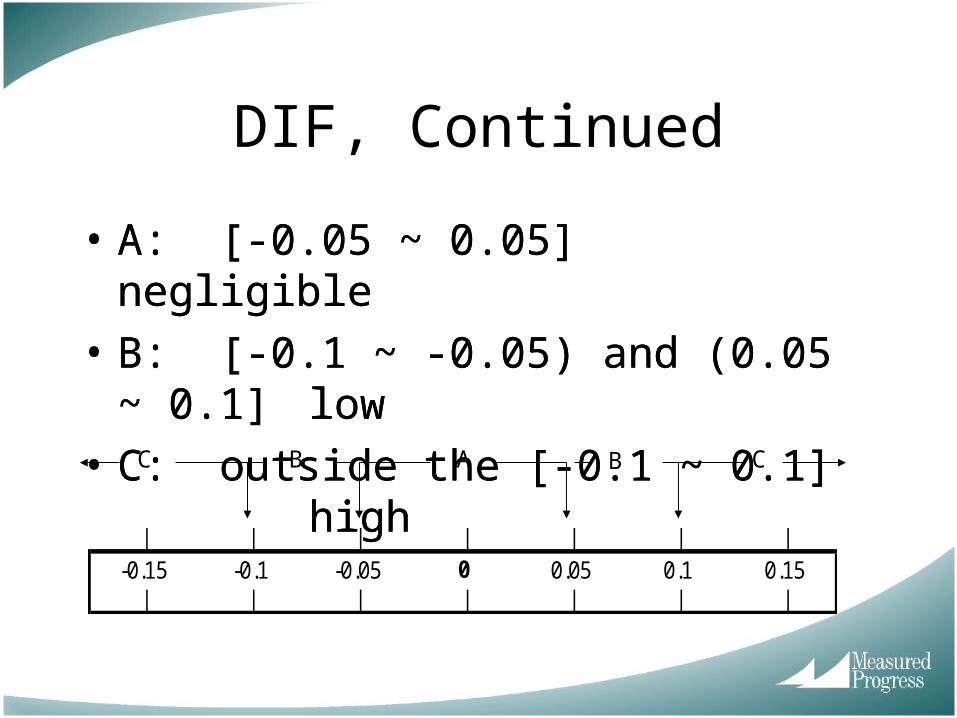
DIF, Continued
• A: [-0.05 ~ 0.05] negligible
• B: [-0.1 ~ -0.05) and (0.05 ~ 0.1] low
• C: outside the [-0.1 ~ 0.1] high
| | | | | | |-0.15 -0.1 -0.05 0 0.05 0.1 0.15
| | | | | | |
C C
• A: [-0.05 ~ 0.05] negligible
• B: [-0.1 ~ -0.05) and (0.05 ~ 0.1] low
• C: outside the [-0.1 ~ 0.1] high
AB B

DIF, Continued
• You may see a table like this:
Grade Subject Form Position Item Number
Type M/F Stat
M/F Cat
03 mat 00 01 201401 MC -0.02 A03 mat 00 02 201417 MC -0 A03 mat 00 03 226696 MC 0.03 A03 mat 00 04 201459 MC 0.01 A03 mat 00 08 201408 MC 0.01 A03 mat 00 09 201286 MC -0.06 B03 mat 00 10 201604 MC -0.05 A

Technical Manuals: Standard Setting & Equating
• Liz and Abdullah discussed Standard Setting• In technical manuals, you’ll often see:
– Report / summary of standard setting process• Info about panelists (how many, who they are)
• What method was used (e.g., bookmark / Body of Work)
• Cut points
• Info about panelist evaluations
• Equating: Come next week and find out!

Inter-rater reliability
• When constructed-response items are rated by multiple scorers, how well do raters agree?
• The more agreement, the better
• Exact agreement: What % of the time do they give the same score?
• Adjacent agreement: What % of the time are they off by 1?
Reading Open Response
Agreement Exact Adjacent > 1
Percentage 69.3 27.4 3.3

Decision Accuracy and Consistency: Introduction
• For most programs, four achievement levels, e.g., Below Basic, Basic, Proficient, Advanced
• Decision accuracy: degree to which observed categorizations match true categorizations
• Decision consistency: degree to which observed categorizations match those of a parallel form

Intuitive examples of accuracy
• TRUE LEVEL: Proficient• OBSERVED LEVEL: Proficient • DIAGNOSIS: ACCURATE (GOOD)
• TRUE LEVEL: Proficient• OBSERVED LEVEL: Below Basic • DIAGNOSIS: INACCURATE (BAD). False negative
• TRUE LEVEL: Basic • OBSERVED LEVEL: Advanced• DIAGNOSIS: INACCURATE (BAD). False positive

Intuitive examples of consistency
• OBSERVED LEVEL, Form 1: Basic• OBSERVED LEVEL, Form 2: Basic • DIAGNOSIS: CONSISTENT (GOOD)
• OBSERVED LEVEL, Form 1: Basic• OBSERVED LEVEL, Form 2: Advanced• DIAGNOSIS: INCONSISTENT (BAD)

Decision Accuracy and Consistency: Introduction
• Livingston and Lewis (1995) proposed method of estimating decision accuracy/consistency
• For most programs, many stats are computed. We will give an example of each
• The stats are all based on joint distributions • A joint distribution gives the proportion of times
that 2 things both happen.– What proportion of students are truly Basic and are
observed as Below Basic?

Joint Distribution: True/Observed Achievement Levels
Overall accuracy: 0.7484
Observed Status
BB B P A Total
BB 0.0706 0.0176 0.0007 0.0000 0.0889
B 0.0320 0.1058 0.0436 0.0000 0.1814
P 0.0014 0.0532 0.4726 0.0734 0.6007
A 0.0000 0.0000 0.0296 0.0993 0.1290
Total 0.1041 0.1766 0.5466 0.1728 1.0000
Tru
e S
tatu
s
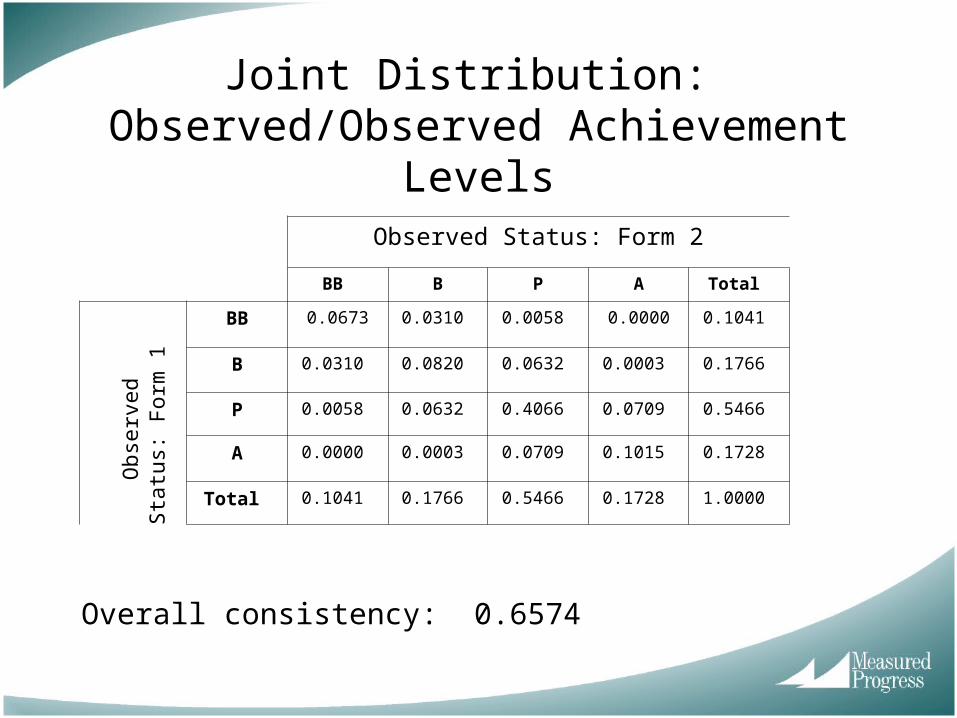
Joint Distribution: Observed/Observed Achievement Levels
Overall consistency: 0.6574
Observed Status: Form 2
BB B P A Total
BB 0.0673 0.0310 0.0058 0.0000 0.1041
B 0.0310 0.0820 0.0632 0.0003 0.1766
P 0.0058 0.0632 0.4066 0.0709 0.5466
A 0.0000 0.0003 0.0709 0.1015 0.1728
Total 0.1041 0.1766 0.5466 0.1728 1.0000 Obs
erve
d S
tatu
s:
For
m 1

Indices Conditional upon Level
• Proportion of students correctly classified, given true level
• Proportion of students consistently classified by parallel form, given observed level
Accuracy Consistency
BB 0.7945 0.6466
B 0.5831 0.4645
P 0.7868 0.7439
A 0.7702 0.5876

Indices at Cut Points
• Accuracy & consistency at specified cut point
• Accuracy: What is the chance that a student is classified on the “correct side” of a cut point?
• Consistency: What is the chance that a student is classified on the same side of a cut point twice?
Accuracy False Positive False Negative Consistency
BB:B 0.9483 0.0183 0.0334 0.9264
B:P 0.9011 0.0443 0.0546 0.8612
P:A 0.8969 0.0734 0.0296 0.8575

To sum up…
• Lots of stuff in technical manuals• Both classical test theory material (p-values,
point-biserials, reliabilities) & IRT material (TCC’s, TIF’s, equating) are important to understand
• Hopefully, these seminars have helped familiarize you with their contents

4. Standard Setting
• Comes up all the time outside Psychoville• Should be a perfect topic for this talk, but…• Liz and Abdullah already did a wonderful job

4. Standard Setting
• Standard Setting is the process of recommending cut scores between achievement levels– Advance (A)– Proficient (P)– Below Proficient (BP)– Failing (F)
• Focus on one FAQ in bookmark:– How do we determine the arrangement of items in the
ordered item booklets?
Cut point 3Cut point 2
Cut point 1

Brief Review of Bookmark
• Each panelist makes use of the ordered item booklet
• Items in the OIB are presented from easiest to hardest. One page per MC item
• Panelists’ job is to place bookmark in OIB for each cut
• For a given cut, where do panelists place a bookmark? – Where they think borderline students would no longer have a 2/3
chance (or better) of a correct answer
• Abdullah said: cut points are derived from bookmark placements


A Very Frequently-Asked Question
• First, a FMC: “You messed up the order of the items!”
• Then, the FAQ: “Well, how did you determine the order?”
• Important: Order is based on actual student performance
• We use the concept of IRT

Two MC items: Which is easier?
0
0.2
0.4
0.6
0.8
1
-3 -2 -1 0 1 2 3
Ability
Pro
b o
f C
orr
ect Easier item
Harder item

Depending on IRT Model this issue can become quite complex
0
0.2
0.4
0.6
0.8
1
-3 -2 -1 0 1 2 3
Ability
Pro
b o
f C
orr
ect

An Intuitive Explanation
• An easy item: An item that even low-ability students get right a high proportion of the time
• That is, students with small theta values tend to get it right• Which item has the smallest theta value corresponding to a
high probability of a correct answer?• How high a probability? Use 2/3 for consistency
• IN SUM: “Easiest” item is the one with the smallest theta corresponding to p = 2/3 – “Hardest” has largest theta corresponding to p = 2/3
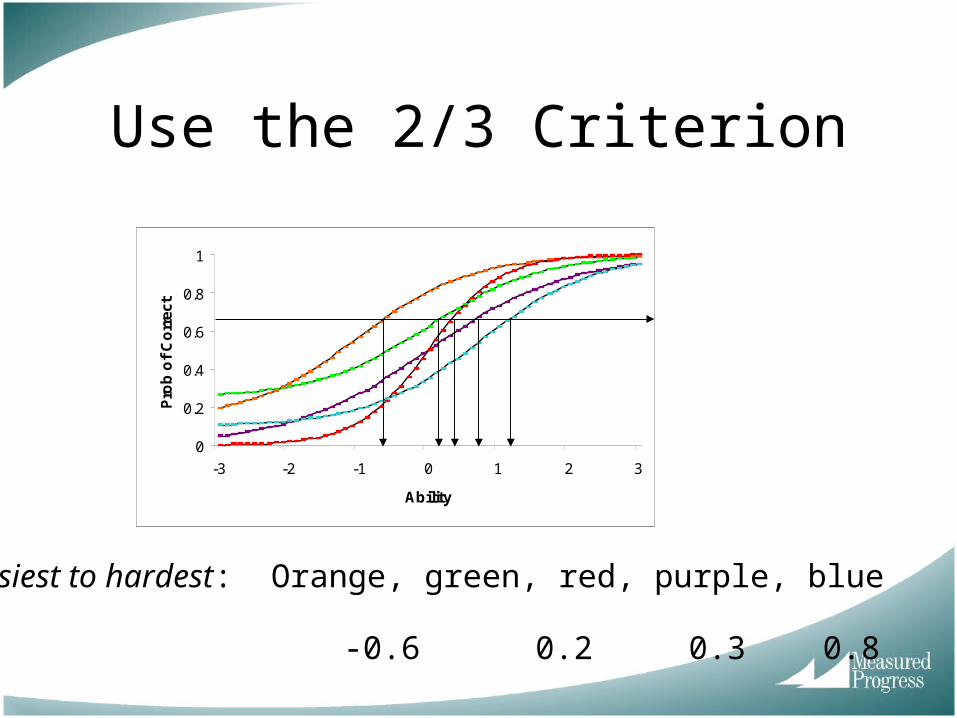
Use the 2/3 Criterion
0
0.2
0.4
0.6
0.8
1
-3 -2 -1 0 1 2 3
Ability
Pro
b o
f C
orr
ect
• Easiest to hardest: Orange, green, red, purple, blue
• Thetas: -0.6 0.2 0.3 0.8 1.2

How about polytomous items?
• A polytomous item is one that has more than 2 possible scores– MC items are dichotmous (0/1), not polytomous
– Example of polytomous: OR item scored 0,1,2,3,4
• Such an OR item is in the OIB four times, once for each score point 1,2,3,4
• Where do you put this item’s 4 pages in the OIB?

Incorporating polytomous items
• Just as with dichotmous items, we use IRT
• What theta do you need to have a 2/3 chance of getting a 1 or better? 2 or better? 3 or better? 4?
• The theta must increase as the score increases
• Suppose the results are: -0.4, 0.4, 0.6, 1.8
• Easiest to hardest: Orange, green, red, purple, blue
• Thetas: -0.6 0.2 0.3 0.8 1.2
1 2 3 4