interoception in insula subregions as a possible state ... · depressed individuals using the beck...
TRANSCRIPT
Christine Wiebking | Moritz de Greck | Niall W. Duncan | Claus Tempelmann | Malek Bajbouj | Georg Northoff
Interoception in insula subregions as a possible state marker for depression
An exploratory fMRI study investigating healthy, depressed and remitted participants
First published:Frontiers in behavioral neuroscience 9 (2015) 2DOI http://dx.doi.org/10.3389/fnbeh.2015.00082
Postprint published at the Institutional Repository of the Potsdam University:In: Postprints der Universität PotsdamHumanwissenschaftliche Reihe ; 271http://nbn-resolving.de/urn:nbn:de:kobv:517-opus4-75161
U n i v e r s i t ä t P o t s d a m
Postprints der Universität PotsdamHumanwissenschaftliche Reihe ; 271

ORIGINAL RESEARCHpublished: 10 April 2015
doi: 10.3389/fnbeh.2015.00082
Frontiers in Behavioral Neuroscience | www.frontiersin.org 1 April 2015 | Volume 9 | Article 82
Edited by:
Viridiana Mazzola,
University of Geneva, Switzerland
Reviewed by:
Heinz Boeker,
University Hospital of Psychiatry
Zurich, Switzerland
Kerang Zhang,
First Hospital of Shanxi Medical
University, China
*Correspondence:
Christine Wiebking,
Cluster of Excellence in Cognitive
Sciences, Department of Sociology of
Physical Activity and Health, University
of Potsdam, Am Neuen Palais 10,
14469 Potsdam, Germany
Received: 21 November 2014
Accepted: 17 March 2015
Published: 10 April 2015
Citation:
Wiebking C, de Greck M, Duncan NW,
Tempelmann C, Bajbouj M and
Northoff G (2015) Interoception in
insula subregions as a possible state
marker for depression—an exploratory
fMRI study investigating healthy,
depressed and remitted participants.
Front. Behav. Neurosci. 9:82.
doi: 10.3389/fnbeh.2015.00082
Interoception in insula subregions asa possible state marker fordepression—an exploratory fMRIstudy investigating healthy,depressed and remitted participantsChristine Wiebking 1, 2*, Moritz de Greck 3, Niall W. Duncan 2, 4, 5, 6, Claus Tempelmann 7,
Malek Bajbouj 8, 9 and Georg Northoff 2, 4, 5, 6, 10
1Cluster of Excellence in Cognitive Sciences, Department of Sociology of Physical Activity and Health, University of Potsdam,
Potsdam, Germany, 2Mind, Brain Imaging and Neuroethics, Institute of Mental Health Research, University of Ottawa,
Ottawa, ON, Canada, 3Department of Psychosomatic Medicine and Psychotherapy, University Medicine Mainz, Mainz,
Germany, 4Centre for Cognition and Brain Disorders, Hangzhou Normal University, Hangzhou, China, 5Graduate Institute of
Humanities in Medicine, Taipei Medical University, Taipei, Taiwan, 6 Brain and Consciousness Research Center, Taipei Medical
University-Shuang Ho Hospital, New Taipei City, Taiwan, 7Department of Neurology, Otto-von-Guericke University
Magdeburg, Magdeburg, Germany, 8Cluster of Excellence “Languages of Emotion” and Dahlem Institute for Neuroimaging of
Emotion, Freie Universität Berlin, Berlin, Germany, 9Department of Psychiatry, Charité-Universitätsmedizin, Campus Benjamin
Franklin, Berlin, Germany, 10Department of Psychology, National Chengchi University, Taipei, Taiwan
Background: Interoceptive awareness (iA), the awareness of stimuli originating inside
the body, plays an important role in human emotions and psychopathology. The insula is
particularly involved in neural processes underlying iA. However, iA-related neural activity
in the insula during the acute state of major depressive disorder (MDD) and in remission
from depression has not been explored.
Methods: A well-established fMRI paradigm for studying (iA; heartbeat counting) and
exteroceptive awareness (eA; tone counting) was used. Study participants formed three
independent groups: patients suffering from MDD, patients in remission from MDD or
healthy controls. Task-induced neural activity in three functional subdivisions of the insula
was compared between these groups.
Results: Depressed participants showed neural hypo-responses during iA in anterior
insula regions, as compared to both healthy and remitted participants. The right dorsal
anterior insula showed the strongest response to iA across all participant groups. In
depressed participants there was no differentiation between different stimuli types in this
region (i.e., between iA, eA and noTask). Healthy and remitted participants in contrast
showed clear activity differences.
Conclusions: This is the first study comparing iA and eA-related activity in the insula in
depressed participants to that in healthy and remitted individuals. The preliminary results
suggest that these groups differ in there being hypo-responses across insula regions in
the depressed participants, whilst non-psychiatric participants and patients in remission
fromMDD show the same neural activity during iA in insula subregions implying a possible
state marker for MDD. The lack of activity differences between different stimulus types
Wiebking et al. Interoception as state marker for depression
in the depressed group may account for their symptoms of altered external and internal
focus.
Keywords: major depressive disorder, interoceptive awareness, insula, remission, neuroimaging, fMRI,
hopelessness, interoception
Introduction
The insula has been described as a brain region serving as aninterface between external stimuli and stimuli originating insidethe body (Craig, 2002, 2009, 2011; Farb et al., 2013; Simmonset al., 2013). Under one model, a gradual integration of intero-/exteroceptive stimuli occurs along a pathway running from theposterior to the anterior parts of the insula (Craig, 2009). Such amodel posits that the insula as a whole is formed from separatebut highly interconnected modules. This is in line with the majorcytoarchitectonic structure of the insula (Mesulam and Mufson,1985; Morel et al., 2013). It is also supported by recent imagingstudies that have used task-based functional imaging (Deen et al.,2011; Chang et al., 2013), resting-state functional connectivity(Sridharan et al., 2008; Touroutoglou et al., 2012) and diffusiontractography structural connectivity (Cerliani et al., 2012; Clout-man et al., 2012) to parcellate the insula into a threefold regionalorganization (Deen et al., 2011; Chang et al., 2013). It remains tobe shown, however, whether these subregions show differentialneural responses to interoceptive awareness (iA).
In line with former research and prominent theories of emo-tional processing, the insula has been suggested to play a key rolein the connection between iA and affective experience (Damasio,1999; Craig, 2002; Bechara and Naqvi, 2004; Critchley et al., 2004;Wiens, 2005; Lamm and Singer, 2010; Paulus and Stein, 2010).Using functional magnetic resonance imaging (fMRI), this link-age was recently directly demonstrated in healthy participants,where neural activity during an iA task and emotional process-ing was found to overlap within the insula (Zaki et al., 2012).Such a connection between iA-related activity in the insula andemotional processing is suggestive of the insula being involvedin mood disorders such as major depressive disorder (MDD).This disorder is characterized by extreme negative affect, somaticsymptoms, altered body awareness (Henningsen et al., 2003;Nyboe Jacobsen et al., 2006) and feelings of hopelessness (Bjäre-hed et al., 2010). The assumption that both somatic signals andinteroception are altered in depression is further supported bya recent literature review on “Interoceptive Dysfunction: towardan Integrated Framework for Understanding Somatic and Affec-tive Disturbance in Depression,” suggesting that depressed symp-toms may arise from a disturbed integration of intero-/extero-ceptive stimuli (Harshaw, 2015). Though the insula mirrors abrain region constantly found in neuroimaging findings regardsdepression (Fitzgerald et al., 2008), few studies have applied aniA-related task in depressed populations yet. For example, Avery
Abbreviations: BHS, Beck Hopelessness Scale; BOLD, blood oxygen level depen-dent; D, depressed participants; (L/R)-dAI, left/right dorsal anterior insula; eA,exteroceptive awareness; fMRI, functional magnetic resonance imaging; H, healthyparticipants ; iA, interoceptive awareness; MANOVA, multivariate analysis of vari-ance; MDD, major depressive disorder; (L/R)-PI, posterior insula; R, remittedparticipants; ROI, region of interest; (L/R)-vAI, ventral anterior insula.
reported reduced neural activity during iA in MDD, whilst thisreduced activity was inversely associated with severity of depres-sion and somatic symptoms (Avery et al., 2014). Similarly, ownstudies showed altered body perception and aberrant insula activ-ity in MDD (Wiebking et al., 2010) with negative associationsbetween iA and hopelessness in the insula in non-psychiatric par-ticipants (Wiebking et al., 2014b), which are all factors typicallyaffected in depression (Bjärehed et al., 2010; Paulus and Stein,2010). As well as such links between insula activity, behavioraland subjective aspects of depression, changes in insula structure(Sprengelmeyer et al., 2011), metabolism (Brooks et al., 2009) andregional homogeneity (Yao et al., 2009; Liu et al., 2010; Guo et al.,2011), as compared to healthy participants, have all been reportedin depression (see Sliz and Hayley, 2012 for a review).
Taking these findings together, it can be hypothesized that theinsula plays a crucial role in integrating emotional and intero-ceptive stimuli and that these processes are disrupted in mentaldisorders (Paulus and Stein, 2010). Studies targeting the insuladuring iA in depressed individuals are rare (Wiebking et al.,2010; Avery et al., 2014) and support the hypothesis of aber-rant neural activity during interoceptive processing in the insula.However, studies exploring whether any iA-related changes inMDD return to activity levels seen in healthy groups when inremission from depression remain to be investigated. As such, inthe present study we aimed to compare neural responses duringiA in functional subregions of the insula between independentgroups of healthy, depressed and remitted individuals. Giventhat feelings of hopelessness are a major symptom of MDD, wesought to investigate the relationship between insula activity andhopelessness.
To these ends, a well-established intero-/exteroceptive aware-ness task was used in fMRI (Critchley et al., 2004; Pollatos et al.,2007; Wiebking et al., 2014a,b). The insula was divided into threesubregions, as defined previously through functional connectiv-ity pattern clustering (Deen et al., 2011; also used by Uddin et al.,2013). Exteroceptive awareness (eA; tone counting) and undi-rected awareness (noTask) were used as control conditions foractivity comparisons and for correlations with subjective hope-lessness scores. It was hypothesized that participants after remis-sion from depression and non-psychiatric controls show compa-rable BOLD responses during iA in the insula, whilst depressedparticipants would show decreased BOLD responses with areduced differentiation between the different task conditions (iA,eA, noTask).
Methods
Participants and PsychometricsUsing fMRI, three independent study groups were investigated:a group of 30 non-psychiatric healthy controls, 12 participants
Frontiers in Behavioral Neuroscience | www.frontiersin.org 2 April 2015 | Volume 9 | Article 82
Wiebking et al. Interoception as state marker for depression
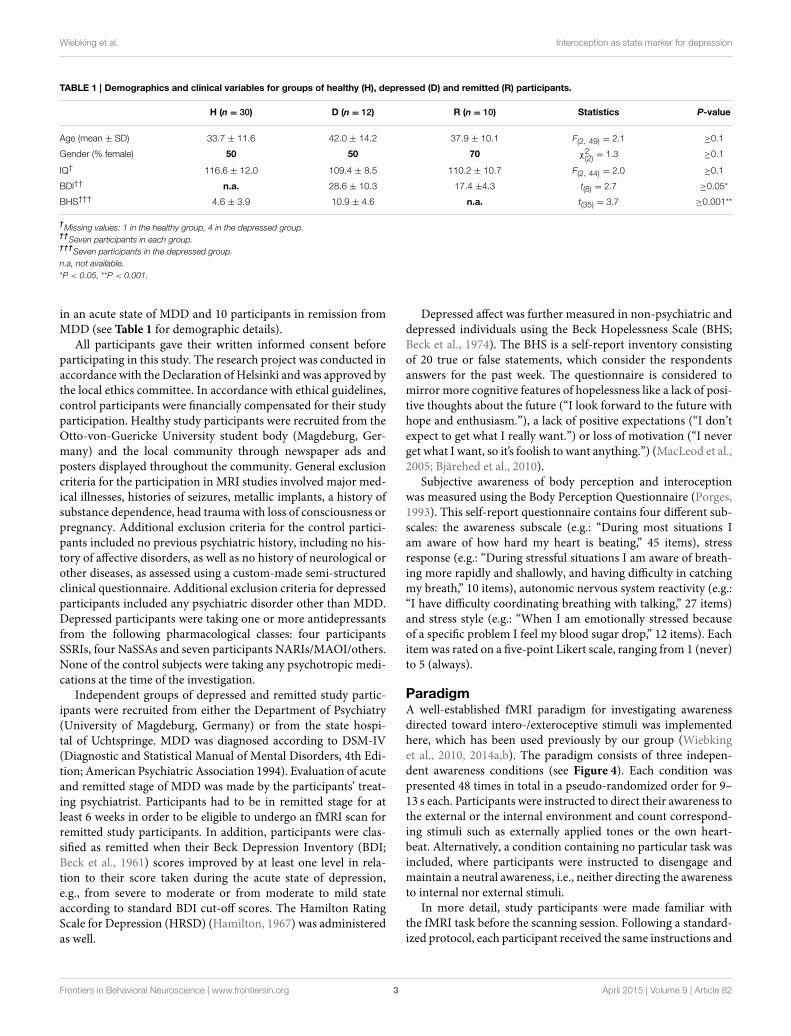
TABLE 1 | Demographics and clinical variables for groups of healthy (H), depressed (D) and remitted (R) participants.
H (n = 30) D (n = 12) R (n = 10) Statistics P-value
Age (mean ± SD) 33.7 ± 11.6 42.0 ± 14.2 37.9 ± 10.1 F(2, 49) = 2.1 ≥0.1
Gender (% female) 50 50 70 χ2(2)
= 1.3 ≥0.1
IQ† 116.6 ± 12.0 109.4 ± 8.5 110.2 ± 10.7 F(2, 44) = 2.0 ≥0.1
BDl†† n.a. 28.6 ± 10.3 17.4 ±4.3 t(8) = 2.7 ≥0.05*
BHS††† 4.6 ± 3.9 10.9 ± 4.6 n.a. t(35) = 3.7 ≥0.001**
†Missing values: 1 in the healthy group, 4 in the depressed group.
††Seven participants in each group.
†††Seven participants in the depressed group.
n.a, not available.
*P < 0.05, **P < 0.001.
in an acute state of MDD and 10 participants in remission fromMDD (see Table 1 for demographic details).
All participants gave their written informed consent beforeparticipating in this study. The research project was conducted inaccordance with the Declaration of Helsinki and was approved bythe local ethics committee. In accordance with ethical guidelines,control participants were financially compensated for their studyparticipation. Healthy study participants were recruited from theOtto-von-Guericke University student body (Magdeburg, Ger-many) and the local community through newspaper ads andposters displayed throughout the community. General exclusioncriteria for the participation in MRI studies involved major med-ical illnesses, histories of seizures, metallic implants, a history ofsubstance dependence, head trauma with loss of consciousness orpregnancy. Additional exclusion criteria for the control partici-pants included no previous psychiatric history, including no his-tory of affective disorders, as well as no history of neurological orother diseases, as assessed using a custom-made semi-structuredclinical questionnaire. Additional exclusion criteria for depressedparticipants included any psychiatric disorder other than MDD.Depressed participants were taking one or more antidepressantsfrom the following pharmacological classes: four participantsSSRIs, four NaSSAs and seven participants NARIs/MAOI/others.None of the control subjects were taking any psychotropic medi-cations at the time of the investigation.
Independent groups of depressed and remitted study partic-ipants were recruited from either the Department of Psychiatry(University of Magdeburg, Germany) or from the state hospi-tal of Uchtspringe. MDD was diagnosed according to DSM-IV(Diagnostic and Statistical Manual of Mental Disorders, 4th Edi-tion; American Psychiatric Association 1994). Evaluation of acuteand remitted stage of MDD was made by the participants’ treat-ing psychiatrist. Participants had to be in remitted stage for atleast 6 weeks in order to be eligible to undergo an fMRI scan forremitted study participants. In addition, participants were clas-sified as remitted when their Beck Depression Inventory (BDI;Beck et al., 1961) scores improved by at least one level in rela-tion to their score taken during the acute state of depression,e.g., from severe to moderate or from moderate to mild stateaccording to standard BDI cut-off scores. The Hamilton RatingScale for Depression (HRSD) (Hamilton, 1967) was administeredas well.
Depressed affect was further measured in non-psychiatric anddepressed individuals using the Beck Hopelessness Scale (BHS;Beck et al., 1974). The BHS is a self-report inventory consistingof 20 true or false statements, which consider the respondentsanswers for the past week. The questionnaire is considered tomirror more cognitive features of hopelessness like a lack of posi-tive thoughts about the future (“I look forward to the future withhope and enthusiasm.”), a lack of positive expectations (“I don’texpect to get what I really want.”) or loss of motivation (“I neverget what I want, so it’s foolish to want anything.”) (MacLeod et al.,2005; Bjärehed et al., 2010).
Subjective awareness of body perception and interoceptionwas measured using the Body Perception Questionnaire (Porges,1993). This self-report questionnaire contains four different sub-scales: the awareness subscale (e.g.: “During most situations Iam aware of how hard my heart is beating,” 45 items), stressresponse (e.g.: “During stressful situations I am aware of breath-ing more rapidly and shallowly, and having difficulty in catchingmy breath,” 10 items), autonomic nervous system reactivity (e.g.:“I have difficulty coordinating breathing with talking,” 27 items)and stress style (e.g.: “When I am emotionally stressed becauseof a specific problem I feel my blood sugar drop,” 12 items). Eachitemwas rated on a five-point Likert scale, ranging from 1 (never)to 5 (always).
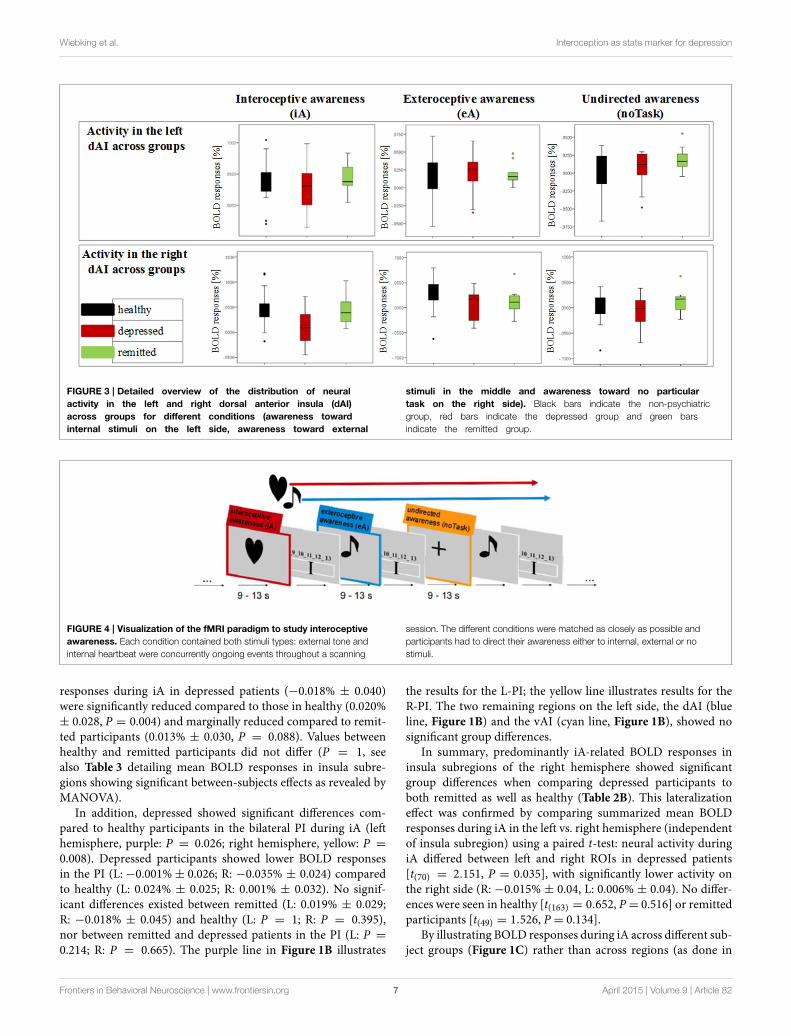
ParadigmA well-established fMRI paradigm for investigating awarenessdirected toward intero-/exteroceptive stimuli was implementedhere, which has been used previously by our group (Wiebkinget al., 2010, 2014a,b). The paradigm consists of three indepen-dent awareness conditions (see Figure 4). Each condition waspresented 48 times in total in a pseudo-randomized order for 9–13 s each. Participants were instructed to direct their awareness tothe external or the internal environment and count correspond-ing stimuli such as externally applied tones or the own heart-beat. Alternatively, a condition containing no particular task wasincluded, where participants were instructed to disengage andmaintain a neutral awareness, i.e., neither directing the awarenessto internal nor external stimuli.
In more detail, study participants were made familiar withthe fMRI task before the scanning session. Following a standard-ized protocol, each participant received the same instructions and
Frontiers in Behavioral Neuroscience | www.frontiersin.org 3 April 2015 | Volume 9 | Article 82
Wiebking et al. Interoception as state marker for depression
all had the possibility to practice the paradigm on a computeroutside the MRI room. For practice and scanning sessions thesoftware Presentation (Neurobehavioral Systems) was used. ThefMRI paradigm utilized dark simple visual stimuli of similar sizeplaced on a light gray background to indicate one of the threecondition types. In the scanner, visual stimuli were projected viaan LCD projector onto a screen visible through amirrormountedon the headcoil. During iA conditions, participants were askedto silently count their own heartbeat as long as the task-typeindicator–a dark colored heart on a light background–was vis-ible on the screen (jittered between 9 and 13 s). Participantswere instructed to focus their awareness on their heartbeat with-out changing the physical settings (like shifting their position)or any physiological measures (like breathing), which was con-trolled on-line via the breathing belt of the Siemens PhysiologicalMonitoring Unit (PMU).
During eA, participants were asked to focus on externallyapplied tones. As long as the task-type indicator–a dark col-ored musical note on a light background–was visible (jitteredbetween 9 and 13 s) on the screen, study participants countedthe number of externally applied tones. Afterwards, the numberof counted heartbeats or tones was indicated on a rating scale(4 s). The indicator on the scale was moved by the subject tothe labeled position representing the number of beats that theycounted. Left and right button presses were used to move theindicator to the left and right side on the scale. This feedbackcomponent allowed the monitoring of the subject’s attendance tothe task.
Auditory stimuli were presented via the scanner loudspeaker.Tones were presented throughout the scanning sessions at anindividually adapted volume to match the difficulty of bothcounting tasks. Thus, study participants had to focus either oninternal or external stimuli or to no particular task (see below).In addition, the presentation frequency of the tones was adaptedto correspond to each participant’s heart-rate. The heart-ratewas recorded using the Siemens Physiological Monitoring Unit(PMU) as described previously (Wiebking et al., 2014b). In orderto control for habituation effects, the individual onset time ofeach tone was jittered by 200ms. Conditions with no particulartask (Shulman et al., 2009) were indicated by a dark cross on lightbackground (9 - 13 s). Participants were instructed to disengage,reduce any cognitive work during these periods and maintainan undirected awareness, i.e., focusing neither on internal norexternal stimuli. The total experiment consisted of 4 sessions of9.6min (1160 volumes in total).
fMRI Data Acquisition and AnalysisMagnetic resonance imaging was performed on a 3-Tesla MRIsystem (Siemens Trio, Erlangen, Germany) with a body transmitand eight channel receive head-coil. Functional T2∗-weightedecho planar images with BOLD contrast were acquired parallelto the AC-PC plane in an odd-even interleaved order. 32 slicesper volume were obtained with the following settings: matrix64× 64; 32 slices per volume; FoV: 224× 224mm2; spatial reso-lution: 3.5× 3.5× 4mm3; TE = 30ms; TR = 2000ms; FA= 80◦.T1-weighted anatomical images were also acquired (MPRAGE;1× 1× 2mm3; TE = 5ms; TR = 1650ms; FA= 7◦).
The fMRI images were pre-processed using SPM8 running onMATLAB 7.11 (The Mathworks Inc., Natick, MA, USA). Func-tional images were slice time corrected with reference to thefirst acquired slice, corrected for motion artifacts by realignmentto the mean functional image, and spatially normalized to theICBM152 standard space (Ashburner and Friston, 1999). Imageswere resampled to 2mm3, smoothed with an isotropic 6mmfull-width half-maximum Gaussian kernel and high pass filtered(threshold 128 s).
Since structured noise still remains in the fMRI data aftertraditional steps of pre-processing, an independent componentanalysis (ICA) was applied to remove noise and improve the sen-sitivity and specificity of the results (Beckmann and Smith, 2004).Non-brain voxels were removed using the BET tool in FSL priorto running the ICA (Smith, 2002). Noise and signals of interestwere distinguished visually according to a previously describedprocedure (Wiebking et al., 2014a,b). Participant-level statisticalanalyses were carried out in SPM8 according to a standard gen-eral linear model approach (Friston et al., 1995). All conditions(iA, eA, noTask) were included in the model as separate events,including their feedback phases. The six rigid-body movementparameters calculated per participant during motion correctionwere included in the model as nuisance variables. Group com-parisons were calculated using the FEAT tool in FSL (Smith et al.,2004; Woolrich et al., 2009). In order to control for possiblegray or white matter differences as a between-group confound-ing factor, the individual T1-weighted anatomical images weresegmented into gray matter (GM), white matter (WM) and cere-brospinal fluid maps using FAST (Zhang et al., 2001). The result-ing partial volume estimates were used to quantify the proportionof GM and WM in each of the regions of interest (left and rightinsula regions). Individual volume estimates for both GM andWM were then included in the group comparisons as nuisancevariables. Group comparisons were masked with the combinedregions of interest. An FWE corrected cluster significance level ofP = 0.05 was used with a Z threshold of 3.1 (Worsley, 2001).
Definition of Insula Regions and StatisticalAnalysisRegions of interest (ROIs) were provided as template images byBenDeen and colleagues (Deen et al., 2011). They identified threebilateral subregions of the insula based on clustering of functionalconnectivity patterns: the left (L) and right (R) dorsal anterior tomiddle insula (dAI), ventral anterior insula (vAI) and the poste-rior insula (PI) (Figure 1A). This set of insula subdivisions wasrecently used to further investigate their roles relative to otherregions of interest in the brain (Uddin et al., 2013).
The MarsBaR (MARSeille Boîte À Région d’Intérêt, http://marsbar.sourceforge.net) toolbox was used to extract task-induced BOLD responses from the voxels within these ROIs. Thecalculated percent signal change represents an individual valuefor each participant and each condition within each ROI. Meanpercent signal changes (i.e., BOLD responses [%]), which are typ-ically less than 0.1 percent (see MarsBaR documentation), wereentered into SPSS 17.0 (SPSS inc., Chicago, IL). Extreme values,which were farther than three interquartile ranges away fromthe first or third quartile, were defined as outliers and excluded
Frontiers in Behavioral Neuroscience | www.frontiersin.org 4 April 2015 | Volume 9 | Article 82
Wiebking et al. Interoception as state marker for depression
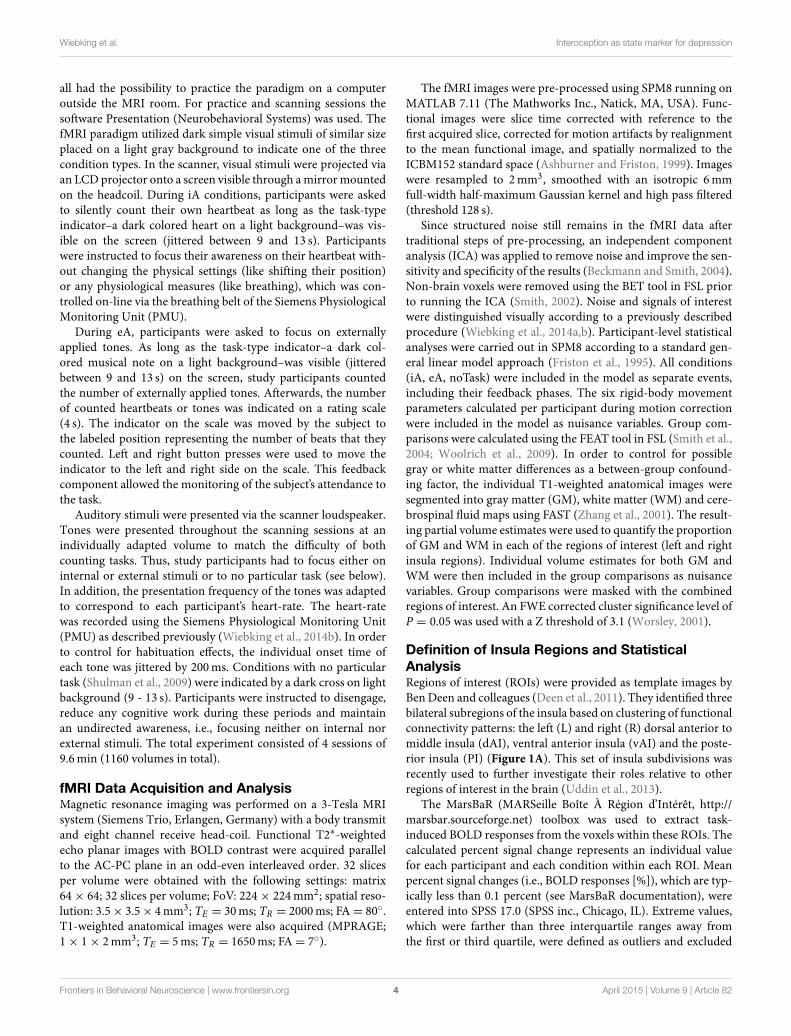
FIGURE 1 | Neural activity during interoceptive awareness (iA) in the
left (L) and right (R) dorsal anterior insula (dAI), ventral anterior insula
(vAI) and the posterior insula (PI) in groups of healthy (H), depressed
(D) and remitted (R) participants. (A) Illustration of regions of interest in
the left and right insula (L-dAI: blue, L-vAI: cyan, L-PI: purple, R-dAI: orange,
R-vAI: red, R-PI: yellow) (provided by Deen et al., 2011). (B) Mean iA-related
BOLD responses in insula subregions. Data points within columns represent
healthy (H), depressed (D) and remitted (R) groups. In the left hemisphere, the
PI (purple, square symbols) shows significant differences between healthy
and depressed participants. In the right hemisphere, the depressed group
differs compared to the healthy group in all regions, whereas differences to
the remitted group occur in the dAI (orange, triangular symbols) and vAI (red,
diamond symbols). Healthy and remitted groups show no differences.
[***P < 0.005, **P < 0.01, *P < 0.05, (*) P < 0.1, post-hoc Bonferroni] (C)
Results shown in (B) are re-represented here across groups (healthy: black
line, depressed: red line, remitted: green line). Columns represent insula
subregions. Healthy and remitted participants show identical neural
activation during iA, whilst depressed patients show the lowest activity in
each region. Bilateral regions of the dAI show the highest degree of iA-related
activity in each study group. In the right hemisphere, this activity linearly
decreases with the PI showing the lowest degree of neural activity. (D)
Voxel-wise results within the bilateral insula comparing the different groups
during iA performance (P = 0.05 FWE-corrected, Z threshold = 3.1, gray and
white matter volumes included as confound). Healthy (left image) and
remitted (middle image) participants show increased iA-related BOLD
responses compared to depressed participants. Healthy and remitted
groups show less extensive differences (right image), with increased BOLD
responses in the inferior insula in healthy individuals.
from analysis, which affected single conditions for three healthyparticipants. To calculate the time course of BOLD responses,MarsBaR’s finite impulse response models were used to estimatethe response at each time bin. Briefly, the determined valueswere used to investigate group differences by calculating a mul-tivariate analysis of variance (MANOVA) (Figure 1), to compareBOLD responses of different task conditions (Figure 2), to inves-tigate the distribution of neural activity within subject groups(Figure 3), to calculate time courses of mean BOLD responsesacross scanning sessions (Figure 5), to perform correlations withsubjective hopelessness scores (Figure 6) and to illustrate thetime course of BOLD responses (Supplementary Figure 1).
In more detail, to test neural response differences betweenthe independent study groups, a MANOVA was performed. Thethree participant groups (n = 30 healthy participants, n = 12depressed patients, n = 10 participants after remission fromMDD) were defined as the between-subjects factor and BOLDresponses for each condition (iA, eA, noTask) in each of the sixROIs (dAI, vAI and PI in the left and right hemisphere) wereentered as dependent within-subjects variables. Listwise exclu-sion of three outlier values (see above) led to n = 27 healthyparticipants when calculating the MANOVA. Bonferroni correc-tion was used for post-hoc testing in order to reduce type I errors(Figure 1 and Table 2). In order to investigate lateralization
Frontiers in Behavioral Neuroscience | www.frontiersin.org 5 April 2015 | Volume 9 | Article 82

Wiebking et al. Interoception as state marker for depression
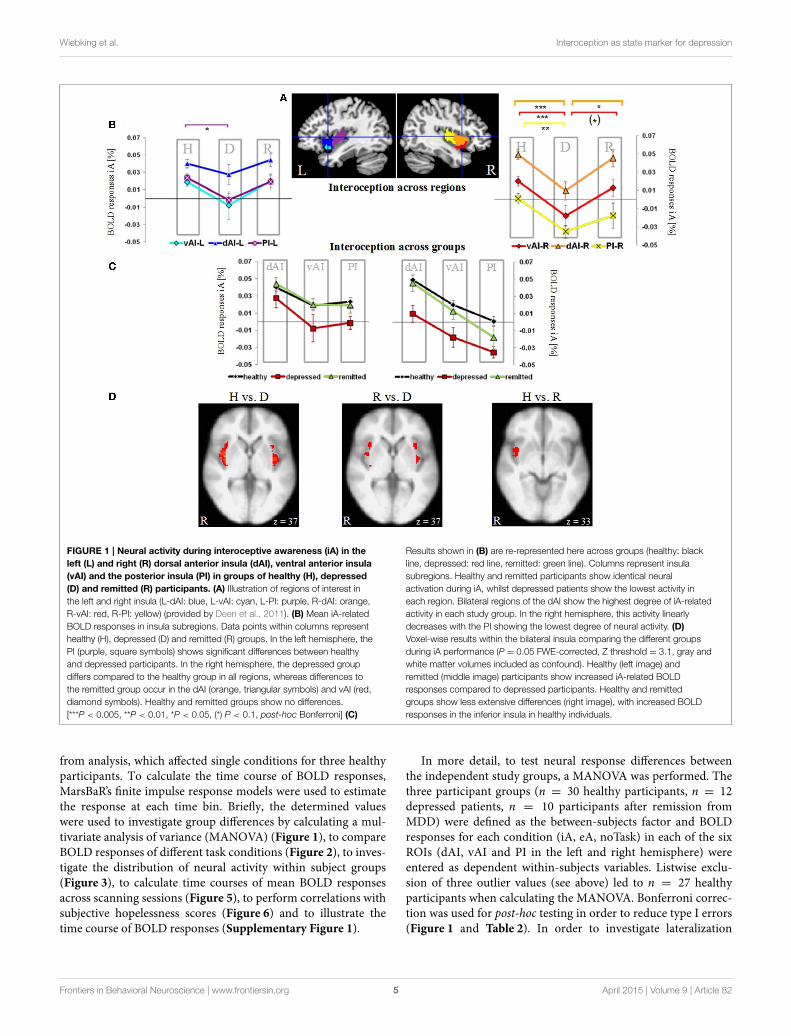
FIGURE 2 | BOLD responses (mean ± SEM) during different task
conditions in healthy (H), depressed (D) and remitted (R) participants
in the left and right dorsal anterior insula (dAI). Interoceptive awareness
(iA) is marked in yellow, exteroceptive awareness (eA) is marked in purple and
no particular task (noTask) in orange. Healthy and remitted participants show
a clear distinction between iA and specifically noTask conditions in both
regions. Additionally, iA-related BOLD responses differ to eA-related BOLD
responses in both groups and regions, whereas the R-dAI reveals also a
differentiation between eA- and noTask-related BOLD responses in the
non-psychiatric group. Depressed participants show no differentiation in both
regions between any of the three conditions. [***P < 0.0005, **P < 0.01,
*P < 0.05, (*) P ≤ 0.1, post-hoc Bonferroni].
effects during iA as indicated by theMANOVA, iA-related BOLDresponses in ROIs of each hemisphere were summarized andcompared within each group using paired t-tests.
As the dAI showed the most significant group effect andthe highest degree of iA-related BOLD responses, the relation-ship between different task conditions (iA, eA, noTask) in eachgroup (healthy, depressed and remitted participants) was inves-tigated. Differences within the R-dAI and L-dAI were identifiedusing the three task conditions as between-subjects factor andthe BOLD responses of each group as within-subjects variables.Post-hoc tests were Bonferroni corrected. In a final step, BOLDresponses in regions showing significant between-subjects effects(as assessed using MANOVA) were correlated (Pearson, two-tailed) with scores of the Beck Hopelessness Scale (BHS; Becket al., 1974).
Results
ParticipantsAn analysis of variance (ANOVA) showed no differences betweenthe three study groups for age, gender or intelligence (Table 1).BDI scores differed significantly (P ≤ 0.05) between indepen-dent groups of depressed and remitted participants, but werenot collected for healthy due to expected low statistical spreadwithin this group. Mean scores of the HRSD for eight depressedparticipants were 17.38 (± 8.03). BHS scores were not availablefor remitted participants and differed significantly (P ≤ 0.001)between non-psychiatric and depressed participants.
Results across Insula Regions (Figure 1, Table 2)The MANOVA across groups, regions and conditions revealed asignificant effect for group [F(hypothesis df : 36, error df : 58) = 1.696,
P = 0.036; Wilk’s Lambda = 0.237; partial η2 = 0.513; observedpower = 0.973 at alpha 0.05; please see Table 2A]. As detailedin Table 2B, significant between-subjects effects occurred mainlyduring iA conditions in the R-dAI [F(2, 46) = 6.603; P = 0.003;partial η
2 = 0.223; observed power = 0.893], L-PI [F(2, 46) =
3.843; P = 0.029; partial η2 = 0.143; observed power = 0.668],R-PI [F(2, 46) = 5.225; P = 0.009; partial η2 = 0.185; observedpower = 0.806] and R-vAI [F(2, 46) = 6.019; P = 0.005; partialη2 = 0.207; observed power = 0.861]. EA conditions, on the
other hand, showed a single significant main group differencein the R-PI [F(2, 46) = 3.861; P = 0.028; partial η
2 = 0.144;observed power = 0.671] and a marginal effect in the R-dAI[F(2, 46) = 2.670; P = 0.08; partial η2 = 0.104; observed power=0.504]. No group effects occurred during noTask conditions. Lev-ene’s test of equality of error variances (Table 2B) showed nosignificant results (ranging from P = 0.354–0.887), indicatingsimilar error variances in each of the three subject groups.
Figure 1A illustrates the regions of interest provided by Deenet al. (Deen et al., 2011). The color code of each region is used tovisualize the results of the Bonferroni post-hoc tests in Figure 1B.The results of the Bonferroni post-hoc tests, used to determinewhich groups differ from each other in which region, are detailedin Table 2B and illustrated in Figure 1B (interoception acrossregions). Neural activity during iA in the R-dAI of depressedindividuals (mean ± SD: 0.01% ± 0.034, n = 12) was signifi-cantly lower compared to both healthy (0.049%± 0.032, n = 27,P = 0.003) and remitted participants (0.045% ± 0.030,n = 10,P = 0.037) (orange line, Figure 1B). There were no statisticallysignificant differences between healthy and remitted participants(P = 1, see also Table 2B).
A similar pattern of neural responses during performance ofthe iA task occurred in the R-vAI (red line, Figure 1B): BOLD
Frontiers in Behavioral Neuroscience | www.frontiersin.org 6 April 2015 | Volume 9 | Article 82
Wiebking et al. Interoception as state marker for depression
FIGURE 3 | Detailed overview of the distribution of neural
activity in the left and right dorsal anterior insula (dAI)
across groups for different conditions (awareness toward
internal stimuli on the left side, awareness toward external
stimuli in the middle and awareness toward no particular
task on the right side). Black bars indicate the non-psychiatric
group, red bars indicate the depressed group and green bars
indicate the remitted group.
FIGURE 4 | Visualization of the fMRI paradigm to study interoceptive
awareness. Each condition contained both stimuli types: external tone and
internal heartbeat were concurrently ongoing events throughout a scanning
session. The different conditions were matched as closely as possible and
participants had to direct their awareness either to internal, external or no
stimuli.
responses during iA in depressed patients (−0.018% ± 0.040)were significantly reduced compared to those in healthy (0.020%± 0.028, P = 0.004) and marginally reduced compared to remit-ted participants (0.013% ± 0.030, P = 0.088). Values betweenhealthy and remitted participants did not differ (P = 1, seealso Table 3 detailing mean BOLD responses in insula subre-gions showing significant between-subjects effects as revealed byMANOVA).
In addition, depressed showed significant differences com-pared to healthy participants in the bilateral PI during iA (lefthemisphere, purple: P = 0.026; right hemisphere, yellow: P =
0.008). Depressed participants showed lower BOLD responsesin the PI (L:−0.001%± 0.026; R: −0.035% ± 0.024) comparedto healthy (L: 0.024% ± 0.025; R: 0.001% ± 0.032). No signif-icant differences existed between remitted (L: 0.019% ± 0.029;R: −0.018% ± 0.045) and healthy (L: P = 1; R: P = 0.395),nor between remitted and depressed patients in the PI (L: P =
0.214; R: P = 0.665). The purple line in Figure 1B illustrates
the results for the L-PI; the yellow line illustrates results for theR-PI. The two remaining regions on the left side, the dAI (blueline, Figure 1B) and the vAI (cyan line, Figure 1B), showed nosignificant group differences.
In summary, predominantly iA-related BOLD responses ininsula subregions of the right hemisphere showed significantgroup differences when comparing depressed participants toboth remitted as well as healthy (Table 2B). This lateralizationeffect was confirmed by comparing summarized mean BOLDresponses during iA in the left vs. right hemisphere (independentof insula subregion) using a paired t-test: neural activity duringiA differed between left and right ROIs in depressed patients[t(70) = 2.151, P = 0.035], with significantly lower activity onthe right side (R: −0.015% ± 0.04, L: 0.006% ± 0.04). No differ-ences were seen in healthy [t(163) = 0.652, P= 0.516] or remittedparticipants [t(49) = 1.526, P = 0.134].
By illustrating BOLD responses during iA across different sub-ject groups (Figure 1C) rather than across regions (as done in
Frontiers in Behavioral Neuroscience | www.frontiersin.org 7 April 2015 | Volume 9 | Article 82
Wiebking et al. Interoception as state marker for depression
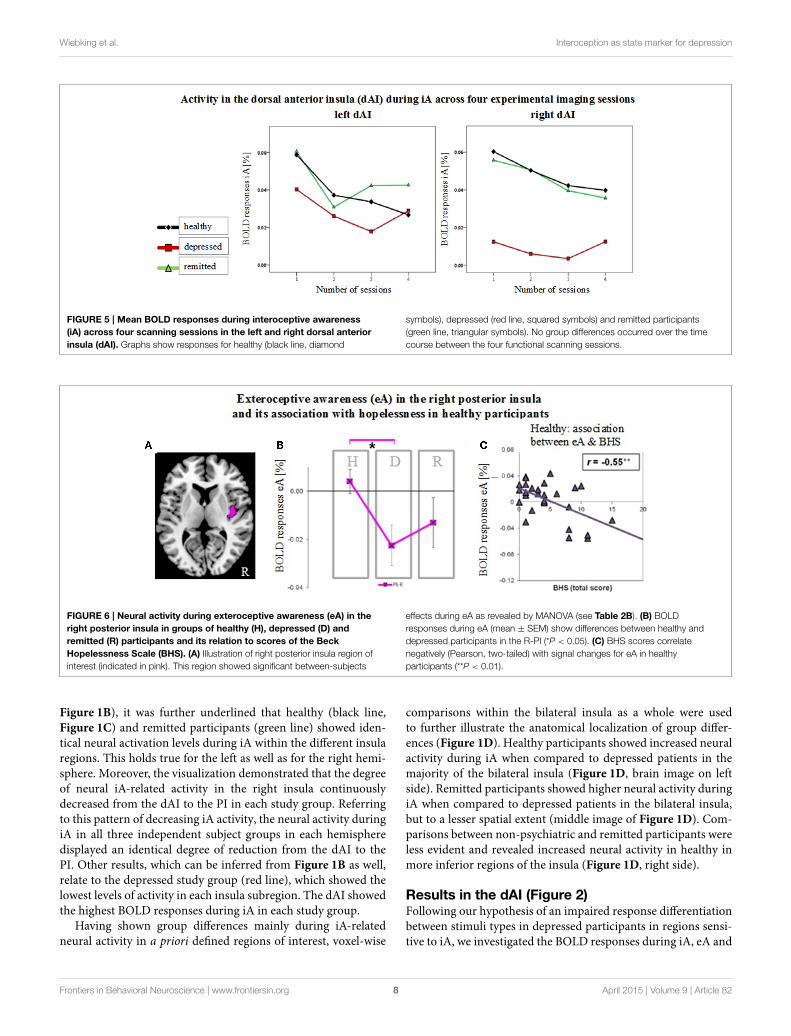
FIGURE 5 | Mean BOLD responses during interoceptive awareness
(iA) across four scanning sessions in the left and right dorsal anterior
insula (dAI). Graphs show responses for healthy (black line, diamond
symbols), depressed (red line, squared symbols) and remitted participants
(green line, triangular symbols). No group differences occurred over the time
course between the four functional scanning sessions.
FIGURE 6 | Neural activity during exteroceptive awareness (eA) in the
right posterior insula in groups of healthy (H), depressed (D) and
remitted (R) participants and its relation to scores of the Beck
Hopelessness Scale (BHS). (A) Illustration of right posterior insula region of
interest (indicated in pink). This region showed significant between-subjects
effects during eA as revealed by MANOVA (see Table 2B). (B) BOLD
responses during eA (mean ± SEM) show differences between healthy and
depressed participants in the R-PI (*P < 0.05). (C) BHS scores correlate
negatively (Pearson, two-tailed) with signal changes for eA in healthy
participants (**P < 0.01).
Figure 1B), it was further underlined that healthy (black line,Figure 1C) and remitted participants (green line) showed iden-tical neural activation levels during iA within the different insularegions. This holds true for the left as well as for the right hemi-sphere. Moreover, the visualization demonstrated that the degreeof neural iA-related activity in the right insula continuouslydecreased from the dAI to the PI in each study group. Referringto this pattern of decreasing iA activity, the neural activity duringiA in all three independent subject groups in each hemispheredisplayed an identical degree of reduction from the dAI to thePI. Other results, which can be inferred from Figure 1B as well,relate to the depressed study group (red line), which showed thelowest levels of activity in each insula subregion. The dAI showedthe highest BOLD responses during iA in each study group.
Having shown group differences mainly during iA-relatedneural activity in a priori defined regions of interest, voxel-wise
comparisons within the bilateral insula as a whole were usedto further illustrate the anatomical localization of group differ-ences (Figure 1D). Healthy participants showed increased neuralactivity during iA when compared to depressed patients in themajority of the bilateral insula (Figure 1D, brain image on leftside). Remitted participants showed higher neural activity duringiA when compared to depressed patients in the bilateral insula,but to a lesser spatial extent (middle image of Figure 1D). Com-parisons between non-psychiatric and remitted participants wereless evident and revealed increased neural activity in healthy inmore inferior regions of the insula (Figure 1D, right side).
Results in the dAI (Figure 2)Following our hypothesis of an impaired response differentiationbetween stimuli types in depressed participants in regions sensi-tive to iA, we investigated the BOLD responses during iA, eA and
Frontiers in Behavioral Neuroscience | www.frontiersin.org 8 April 2015 | Volume 9 | Article 82
Wiebking et al. Interoception as state marker for depression
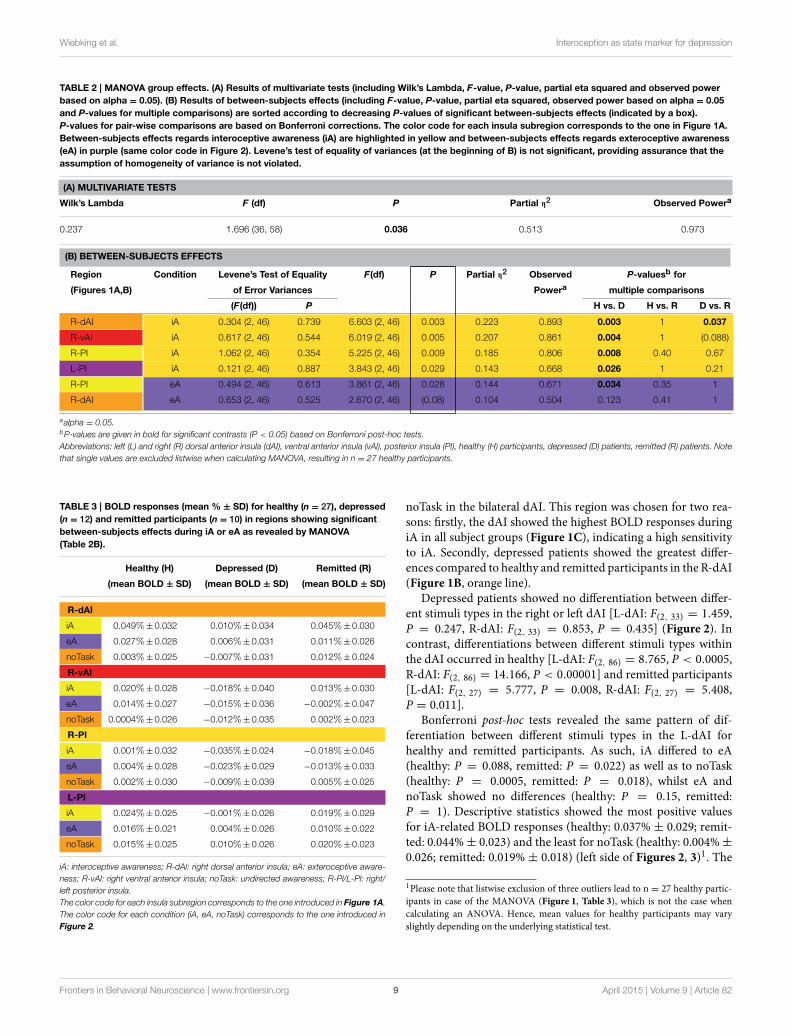
TABLE 2 | MANOVA group effects. (A) Results of multivariate tests (including Wilk’s Lambda, F-value, P-value, partial eta squared and observed power
based on alpha = 0.05). (B) Results of between-subjects effects (including F-value, P-value, partial eta squared, observed power based on alpha = 0.05
and P-values for multiple comparisons) are sorted according to decreasing P-values of significant between-subjects effects (indicated by a box).
P-values for pair-wise comparisons are based on Bonferroni corrections. The color code for each insula subregion corresponds to the one in Figure 1A.
Between-subjects effects regards interoceptive awareness (iA) are highlighted in yellow and between-subjects effects regards exteroceptive awareness
(eA) in purple (same color code in Figure 2). Levene’s test of equality of variances (at the beginning of B) is not significant, providing assurance that the
assumption of homogeneity of variance is not violated.
(A) MULTIVARIATE TESTS
Wilk’s Lambda F (df) P Partial η2 Observed Powera
0.237 1.696 (36, 58) 0.036 0.513 0.973
(B) BETWEEN-SUBJECTS EFFECTS
Region Condition Levene’s Test of Equality F(df) P Partial η2 Observed P-valuesb for
(Figures 1A,B) of Error Variances Powera multiple comparisons
(F(df)) P H vs. D H vs. R D vs. R
R-dAI iA 0.304 (2, 46) 0.739 6.603 (2, 46) 0.003 0.223 0.893 0.003 1 0.037
R-vAI iA 0.617 (2, 46) 0.544 6.019 (2, 46) 0.005 0.207 0.861 0.004 1 (0.088)
R-PI iA 1.062 (2, 46) 0.354 5.225 (2, 46) 0.009 0.185 0.806 0.008 0.40 0.67
L-PI iA 0.121 (2, 46) 0.887 3.843 (2, 46) 0.029 0.143 0.668 0.026 1 0.21
R-PI eA 0.494 (2, 46) 0.613 3.861 (2, 46) 0.028 0.144 0.671 0.034 0.35 1
R-dAI eA 0.653 (2, 46) 0.525 2.670 (2, 46) (0.08) 0.104 0.504 0.123 0.41 1
aalpha = 0.05.bP-values are given in bold for significant contrasts (P < 0.05) based on Bonferroni post-hoc tests.
Abbreviations: left (L) and right (R) dorsal anterior insula (dAI), ventral anterior insula (vAl), posterior insula (PI), healthy (H) participants, depressed (D) patients, remitted (R) patients. Note
that single values are excluded listwise when calculating MANOVA, resulting in n = 27 healthy participants.
TABLE 3 | BOLD responses (mean % ± SD) for healthy (n = 27), depressed
(n = 12) and remitted participants (n = 10) in regions showing significant
between-subjects effects during iA or eA as revealed by MANOVA
(Table 2B).
Healthy (H) Depressed (D) Remitted (R)
(mean BOLD ± SD) (mean BOLD ± SD) (mean BOLD ± SD)
R-dAI
iA 0.049%± 0.032 0.010%±0.034 0.045%±0.030
eA 0.027%± 0.028 0.006%±0.031 0.011%±0.026
noTask 0.003%± 0.025 −0.007%±0.031 0.012%±0.024
R-vAI
iA 0.020%± 0.028 −0.018%±0.040 0.013%±0.030
eA 0.014%± 0.027 −0.015%±0.036 −0.002%±0.047
noTask 0.0004%± 0.026 −0.012%±0.035 0.002%±0.023
R-PI
iA 0.001%± 0.032 −0.035%±0.024 −0.018%±0.045
eA 0.004%± 0.028 −0.023%±0.029 −0.013%±0.033
noTask 0.002%± 0.030 −0.009%±0.039 0.005%±0.025
L-PI
iA 0.024%± 0.025 −0.001%±0.026 0.019%±0.029
eA 0.016%± 0.021 0.004%±0.026 0.010%±0.022
noTask 0.015%± 0.025 0.010%±0.026 0.020%±0.023
iA: interoceptive awareness; R-dAl: right dorsal anterior insula; eA: exteroceptive aware-
ness; R-vAl: right ventral anterior insula; noTask: undirected awareness; R-Pl/L-Pl: right/
left posterior insula.
The color code for each insula subregion corresponds to the one introduced in Figure 1A.
The color code for each condition (iA, eA, noTask) corresponds to the one introduced in
Figure 2.
noTask in the bilateral dAI. This region was chosen for two rea-sons: firstly, the dAI showed the highest BOLD responses duringiA in all subject groups (Figure 1C), indicating a high sensitivityto iA. Secondly, depressed patients showed the greatest differ-ences compared to healthy and remitted participants in the R-dAI(Figure 1B, orange line).
Depressed patients showed no differentiation between differ-ent stimuli types in the right or left dAI [L-dAI: F(2, 33) = 1.459,P = 0.247, R-dAI: F(2, 33) = 0.853, P = 0.435] (Figure 2). Incontrast, differentiations between different stimuli types withinthe dAI occurred in healthy [L-dAI: F(2, 86) = 8.765, P < 0.0005,R-dAI: F(2, 86) = 14.166, P < 0.00001] and remitted participants[L-dAI: F(2, 27) = 5.777, P = 0.008, R-dAI: F(2, 27) = 5.408,P = 0.011].
Bonferroni post-hoc tests revealed the same pattern of dif-ferentiation between different stimuli types in the L-dAI forhealthy and remitted participants. As such, iA differed to eA(healthy: P = 0.088, remitted: P = 0.022) as well as to noTask(healthy: P = 0.0005, remitted: P = 0.018), whilst eA andnoTask showed no differences (healthy: P = 0.15, remitted:P = 1). Descriptive statistics showed the most positive valuesfor iA-related BOLD responses (healthy: 0.037% ± 0.029; remit-ted: 0.044%± 0.023) and the least for noTask (healthy: 0.004%±
0.026; remitted: 0.019% ± 0.018) (left side of Figures 2, 3)1. The
1Please note that listwise exclusion of three outliers lead to n = 27 healthy partic-ipants in case of the MANOVA (Figure 1, Table 3), which is not the case whencalculating an ANOVA. Hence, mean values for healthy participants may varyslightly depending on the underlying statistical test.
Frontiers in Behavioral Neuroscience | www.frontiersin.org 9 April 2015 | Volume 9 | Article 82
Wiebking et al. Interoception as state marker for depression
same differentiation of iA compared to eA and noTask occurredin both healthy and remitted participants in the R-dAI. In detail,iA-related BOLD responses differed to eA (healthy: P = 0.094,remitted: P = 0.023) as well as to BOLD responses for thenoTask condition (healthy: P = 0.0005, remitted: P = 0.028).Healthy showed an additional difference between eA and noTask(P = 0.009). Again, iA-related BOLD responses showed themost positive values (healthy: 0.045% ± 0.033; remitted: 0.045%± 0.030) and the least estimates for noTask (healthy: 0.003% ±
0.035; remitted: 0.012%± 0.024) (right side of Figures 2, 3).No group differences were observed over the time course
of the four functional sessions in the different insula regions[F(hypothesis df : 6, error df : 88) = 0.39, P = 0.88; Wilk’s Lambda =0.95, partial η
2 = 0.026]. Figure 5 shows mean BOLDresponses during iA across the four scanning sessions in theleft and right dAI. BOLD time courses (0 - 10 s) for eachgroup in regions showing between-subjects effects are shown inSupplementary Figure 1.
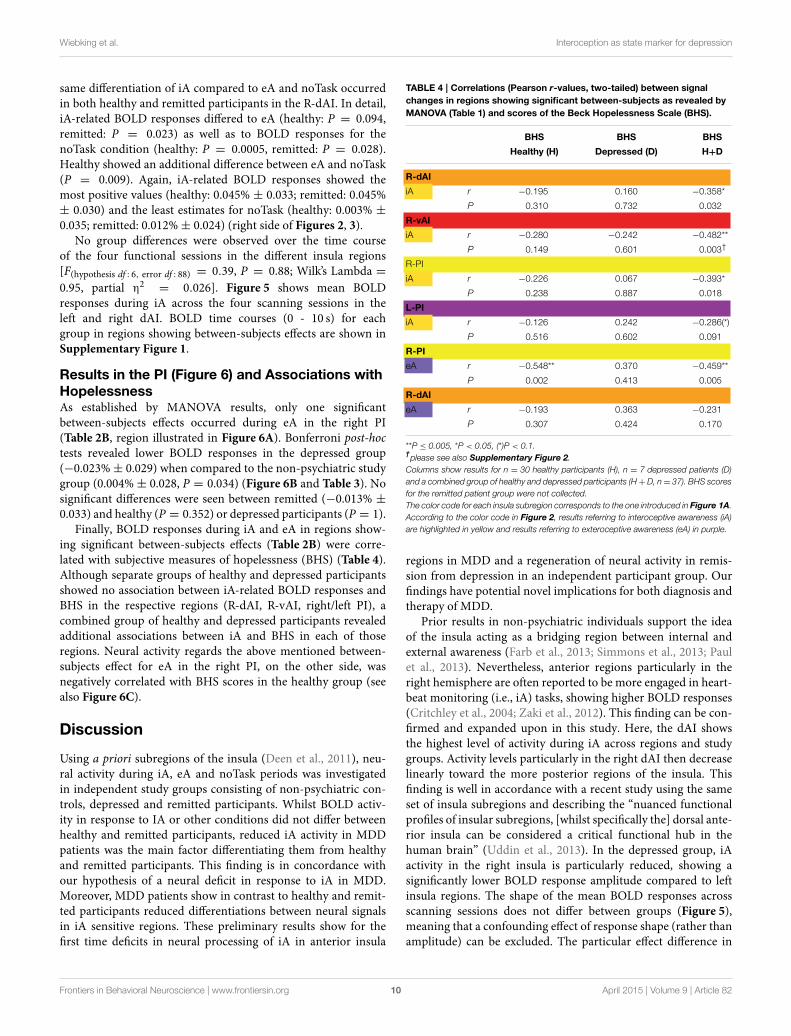
Results in the PI (Figure 6) and Associations withHopelessnessAs established by MANOVA results, only one significantbetween-subjects effects occurred during eA in the right PI(Table 2B, region illustrated in Figure 6A). Bonferroni post-hoctests revealed lower BOLD responses in the depressed group(−0.023%± 0.029) when compared to the non-psychiatric studygroup (0.004% ± 0.028, P = 0.034) (Figure 6B and Table 3). Nosignificant differences were seen between remitted (−0.013% ±
0.033) and healthy (P = 0.352) or depressed participants (P = 1).Finally, BOLD responses during iA and eA in regions show-
ing significant between-subjects effects (Table 2B) were corre-lated with subjective measures of hopelessness (BHS) (Table 4).Although separate groups of healthy and depressed participantsshowed no association between iA-related BOLD responses andBHS in the respective regions (R-dAI, R-vAI, right/left PI), acombined group of healthy and depressed participants revealedadditional associations between iA and BHS in each of thoseregions. Neural activity regards the above mentioned between-subjects effect for eA in the right PI, on the other side, wasnegatively correlated with BHS scores in the healthy group (seealso Figure 6C).
Discussion
Using a priori subregions of the insula (Deen et al., 2011), neu-ral activity during iA, eA and noTask periods was investigatedin independent study groups consisting of non-psychiatric con-trols, depressed and remitted participants. Whilst BOLD activ-ity in response to IA or other conditions did not differ betweenhealthy and remitted participants, reduced iA activity in MDDpatients was the main factor differentiating them from healthyand remitted participants. This finding is in concordance withour hypothesis of a neural deficit in response to iA in MDD.Moreover, MDD patients show in contrast to healthy and remit-ted participants reduced differentiations between neural signalsin iA sensitive regions. These preliminary results show for thefirst time deficits in neural processing of iA in anterior insula
TABLE 4 | Correlations (Pearson r-values, two-tailed) between signal
changes in regions showing significant between-subjects as revealed by
MANOVA (Table 1) and scores of the Beck Hopelessness Scale (BHS).
BHS BHS BHS
Healthy (H) Depressed (D) H+D
R-dAI
iA r −0.195 0.160 −0.358*
P 0.310 0.732 0.032
R-vAI
iA r −0.280 −0.242 −0.482**
P 0.149 0.601 0.003†
R-PI
iA r −0.226 0.067 −0.393*
P 0.238 0.887 0.018
L-PI
iA r −0.126 0.242 −0.286(*)
P 0.516 0.602 0.091
R-PI
eA r −0.548** 0.370 −0.459**
P 0.002 0.413 0.005
R-dAI
eA r −0.193 0.363 −0.231
P 0.307 0.424 0.170
**P ≤ 0.005, *P < 0.05, (*)P < 0.1.†please see also Supplementary Figure 2.
Columns show results for n = 30 healthy participants (H), n = 7 depressed patients (D)
and a combined group of healthy and depressed participants (H+D, n= 37). BHS scores
for the remitted patient group were not collected.
The color code for each insula subregion corresponds to the one introduced in Figure 1A.
According to the color code in Figure 2, results referring to interoceptive awareness (iA)
are highlighted in yellow and results referring to exteroceptive awareness (eA) in purple.
regions in MDD and a regeneration of neural activity in remis-sion from depression in an independent participant group. Ourfindings have potential novel implications for both diagnosis andtherapy of MDD.
Prior results in non-psychiatric individuals support the ideaof the insula acting as a bridging region between internal andexternal awareness (Farb et al., 2013; Simmons et al., 2013; Paulet al., 2013). Nevertheless, anterior regions particularly in theright hemisphere are often reported to be more engaged in heart-beat monitoring (i.e., iA) tasks, showing higher BOLD responses(Critchley et al., 2004; Zaki et al., 2012). This finding can be con-firmed and expanded upon in this study. Here, the dAI showsthe highest level of activity during iA across regions and studygroups. Activity levels particularly in the right dAI then decreaselinearly toward the more posterior regions of the insula. Thisfinding is well in accordance with a recent study using the sameset of insula subregions and describing the “nuanced functionalprofiles of insular subregions, [whilst specifically the] dorsal ante-rior insula can be considered a critical functional hub in thehuman brain” (Uddin et al., 2013). In the depressed group, iAactivity in the right insula is particularly reduced, showing asignificantly lower BOLD response amplitude compared to leftinsula regions. The shape of the mean BOLD responses acrossscanning sessions does not differ between groups (Figure 5),meaning that a confounding effect of response shape (rather thanamplitude) can be excluded. The particular effect difference in
Frontiers in Behavioral Neuroscience | www.frontiersin.org 10 April 2015 | Volume 9 | Article 82
Wiebking et al. Interoception as state marker for depression
the right insula is consistent with previous lateralization findings(Kotani et al., 2009), with hypotheses that posit a major role forthe right insula in iA (Craig, 2002, 2003, 2004), and with find-ings of distinct network connectivity in the right dAI and vAI(Touroutoglou et al., 2012).
Interestingly, the general pattern of insula activation acrossthe different subregions is similar in all three study groups(Figure 1C). This suggests that the iA-related processing deficitseen in MDD is not restricted to a particular portion of theinsula but is instead a general hypo-response across the differ-ent anatomical and functional subregions of the insula. This is inaccordance with suggested abnormalities in amino acid neuro-transmitter function and impaired energy metabolism in MDD(Abdallah et al., 2014), which might argue for a global brainmechanism underlying the observed neural hypo-responses, asdistinguished from neural responses to specific content. Mostimportantly, the neural hypo-response during iA performancethat is seen in patients suffering from depression is not observ-able in the other two independent participant groups. The neuralactivity during iA in the insula seen in patients recovered frommajor depression is very similar to the neural activity during iAseen in non-psychiatric participants, indicating that the neuralinsula responses during iAmight serve as a state marker ofMDD.However, deficits in energy metabolism in major depression andits potential normalization after remission need to be includedin future studies as an additional variable, e.g., by using 13CMRS (magnetic resonance spectroscopy) to provide additionalinformation about glucose dynamics. By this, it will be possibleto further unravel general from specific deficits underlying thepathophysiology of MDD.
As well as a general insula hypo-response, there is a lack ofstimulus differentiation in anterior insula regions in MDD. Incontrast, healthy and remitted participants show a clear differen-tiation between the different stimulus types (iA, eA and noTask)in these regions. This differentiation was made even though boththe heartbeat and the tone stimuli were continuously present dur-ing all trials. In depressed participants the different stimuli pro-duce comparable neural responses; if a role of the insula is to inte-grate intero-/exteroceptive stimuli for homeostatic purposes andin doing so produce a sense of material self (Craig, 2002), thenthis lack of differentiationmay lead to an altered self-awareness indepression. Such an effect would be consistent with the observedabnormal bodily awareness in heautoscopy that has been linkedto iA processing in the insula (Heydrich and Blanke, 2013).Finally, such a dis-integration of intero-/exteroceptive stimuli inMDD can be related to the interoceptive predictive coding modelproposed by Paulus and Stein (Paulus and Stein, 2010), accord-ing to which noisy afferent input in the insula in depressionleads to an interoceptive prediction error. Both findings–non-differential responses to different stimulus types and a generalinsula hypo-metabolism–may provide evidence for such a codingerror where insula stimulus responses are too unspecific duringacute MDD.
Regards eA-related BOLD responses, only one significantbetween-subjects effects occurred in the right PI. Depressed par-ticipants showed decreased neural activity as compared to non-psychiatric controls, which may reflect altered awareness of the
environment that is reported in MDD (Grimm et al., 2009;Wiebking et al., 2010; Northoff et al., 2011). A strong relationshipbetween eA and BHS scores in healthy individuals supports thissuggestion (increased hopelessness is associated with reduced eAactivity). Decreased activity in the PI–a region that has anatom-ical connections to the auditory cortex (Cloutman et al., 2012)and is involved in basic interoceptive (Craig, 2002; Deen et al.,2011) and auditory processes (Bamiou et al., 2003; Cloutmanet al., 2012)–might be an indicator that environmental stimulicannot be integrated with interoceptive states in MDD (Critch-ley, 2009; Sliz and Hayley, 2012). In regions showing significantbetween-subjects effects of iA-related BOLD responses there wasno correlation with BHS scores in the depressed or healthy groupalone, but a combined group of depressed and healthy (mirroringa group with higher variances) showed significant negative corre-lations in each region that was identified by means of MANOVA(Table 4). In conjunction with the insula hypo-responsiveness inMDD, this suggests that depressed individuals can be consid-ered to be at the lower extreme end of a continuous relationshipbetween interoception, depression and hopelessness.
The insula, along with the dorsal anterior cingulate cortex(dACC) and superior temporal lobe, forms part of the so-calledsalience network (Seeley et al., 2007). This network is thought tobe involved in the coordination of behavioral responses (Med-ford and Critchley, 2010; Menon and Uddin, 2010) through thedetection of and orientation to subjectively relevant internal orexternal stimuli (Seeley et al., 2007). In MDD, intrinsic func-tional connectivity between the network’s constituent regions hasbeen reported to be reduced (Hamilton et al., 2012; Sliz and Hay-ley, 2012; Manoliu et al., 2013; Belleau et al., 2014; Yuen et al.,2014). The right anterior insula in particular appears to displayaltered connectivity in MDD (Manoliu et al., 2013), which cor-responds with the altered responses in that region reported here.As well as connectivity within the salience network, connectiv-ity between it and other brain networks—specifically the defaultmode network (DMN) and the executive control network—isalso altered in MDD (Manoliu et al., 2013; Belleau et al., 2014).This in turn has been linked to a pathological preponderance ofDMN activity over that in the salience and executive control net-works (Hamilton et al., 2012; Manoliu et al., 2013). The overallblunting of task responses in MDD seen here, along with the lackof differentiation between the stimulus types, is thus suggestiveof a network interaction dysfunction influencing the task-specificresponses. This possibility remains to be investigated in the con-text of iA, however, as does the directionality of any interactions(i.e., salience network to DMN or vice versa; although it may benoted that initial evidence suggests that the former may be thecase (Ham et al., 2013).
Several limitations of the study may be considered. Althoughthe sample sizes exceed similar studies investigating pre- andpost-depression in fMRI (Schaefer et al., 2006), the observedpower of the MANOVA indicates robustness and the statisti-cal power of the fMRI paradigm is excellent (48 repetitions percondition), the current results must be treated as preliminaryfindings. Confirmation through a larger study containing equalsample sizes would therefore be worthwhile. A second poten-tial limitation is that depressed patients were medicated. That
Frontiers in Behavioral Neuroscience | www.frontiersin.org 11 April 2015 | Volume 9 | Article 82

Wiebking et al. Interoception as state marker for depression
this factor could be driving the results observed is unlikely,however, given that remitted participants were also medicated.Despite this, future studies may wish to include an unmedi-cated depressed group to confirm the effects seen here, giventhat a medication effect in comparison to non-psychiatric con-trols cannot be excluded. Finally, inclusion of additional behav-ioral measurements will help increase the explanatory power offuture fMRI studies investigating iA. These may contain longerheartbeat counting phases during fMRI and ECG (electrocardio-gram) measurements during fMRI as well as outside the scannerin order to obtain robust measurements of task accuracy. Theinterpretation of interoceptive accuracy is difficult, however, asprevious studies pointed out unreliable results in non-psychiatriccontrols (Willem Van der Does et al., 2000), inconsistent findingsin depression (Dunn et al., 2007; Pollatos et al., 2009; Furmanet al., 2013) and even opposite effects in anxiety patients (WillemVan der Does et al., 2000; Domschke et al., 2010). Given thehigh prevalence of depressive/anxiety comorbidity and the influ-ence of anxiety traits on insula activity (Terasawa et al., 2013),this needs to be further disentangled in future studies and maybe seen as limitation factor of the current study as well, as noclinical or psychometric measures for anxiety were applied. Itneeds to be pointed out that the current study did not aim toinvestigate heartbeat accuracy (see Garfinkel et al., 2014 for con-ceptualization), but rather the neural activity changes due to focalawareness shift directed toward intero-/exteroceptive stimuli,respectively (see also Avery et al., 2014).
In conclusion, we show an insula hypo-response inMDD, par-ticularly during iA conditions in comparison to remitted andnon-psychiatric participants. This effect is no longer presentafter remission from depression, implying a flexible mechanism.Since all participant groups showed a comparable activity pat-tern across the insula subregions, aberrant IA-related BOLDresponses in depressed patients can be traced back to an over-all attenuation of activity. Supporting a hypothesis of alteredprocessing of interoceptive afferents in depression (Paulus andStein, 2010), the MDD group showed no differentiation betweendifferent stimulus types in iA-sensitive regions. Given this, ourresults have potential implications for the feasibility of usinginteroception-related neurofeedback to help speed recovery inMDD by normalizing insula activity (Wiebking and Northoff,2014). These therapies may also serve as preventative strategiesfor individuals in remitted states following depression.
Acknowledgments
The authors would like to thank Ben Deen (Yale Child StudyCenter, Yale University School of Medicine, New Haven) forproviding the insula masks (Deen et al., 2011); the Department
of Neurology and the staff from the state hospital of Ucht-springe for their excellent cooperation; Dave J. Hayes for sta-tistical advice; and the patients for their participation in thisstudy. The results were partly presented in oral and postersessions at OHBM’s annual meeting 2014 in Hamburg, Ger-many. The work was made possible by financial contributionsfrom Lilly Germany, the Salus Foundation, the Hope of Depres-sion Research Foundation and the German Research Founda-tion (DFG, Sonderforschungsbereich 779-A6). CW was fundedby an IMHR Postdoctoral Fellowship and acknowledges the sup-port of the Open Access Publication Fund of Potsdam Uni-versity. The funders had no role in study design, data collec-tion and analysis, decision to publish, or preparation of themanuscript.
Supplementary Material
The Supplementary Material for this article can be foundonline at: http://www.frontiersin.org/journal/10.3389/fnbeh.2015.00082/abstract
Supplementary Figure 1 | BOLD responses (% mean ± SEM) per time bin
(TR = 2000ms) in each of the six regions of interest (please refer also to
Figure 1A) for each condition (iA, eA, noTask) in each subject group
(healthy, depressed and remitted participants). The border of each chart
serves to identify the insula region (cyan: left ventral anterior insula, blue: left dorsal
anterior insula, purple: left posterior insula, red: right ventral anterior insula,
orange: right dorsal anterior insula, yellow: right posterior insula). Corresponding
to the color code introduced in Figure 2, interoceptive awareness is marked in
yellow, exteroceptive awareness is marked in purple and no particular task in
orange. Group-specific charts are arranged vertically. Please note different
intervals of y-axis.
Supplementary Figure 2 | (A) Mean total scores of the Beck Hopelessness
Scale (BHS), Body Perception Questionnaire (BPQ) subscale awareness of
autonomic nervous system reactivity (ANSR) and stress style (BPQ-stressStyle).
Depressed patients score significantly higher on each questionnaire (see also
Supplementary Table 1). (B,C) Correlation (Pearson, two-tailed) between
awareness of autonomic nervous system reactivity (ANSR) and BHS (B) and
BOLD responses during iA in the R-vAI (C) for a combined group of healthy and
depressed participants (see also Supplementary Table 1, n = 35). (D)
Correlation (Pearson, two-tailed) between BOLD responses during iA in the R-vAI
and BHS for a combined group of healthy and depressed participants (see also
Table 4). (E,F) Correlation (Pearson, two-tailed) between BPQ’s subscale for
stress style and BHS (E) and BOLD responses during iA in the R-vAI (F) for a
combined group of healthy and depressed participants (see also
Supplementary Table 1).
Supplementary Table 1 | Significantly different BPQ (Body Perception
Questionnaire) scores between healthy (n = 30) and depressed
participants (n = 6) (upper part of table). Correlation (Pearson, two-tailed)
between BPQ and scores of the Beck Hopelessness Scale (BHS) for healthy,
depressed and a combined group (middle part of table). Correlation (Pearson,
two-tailed) between BPQ and BOLD responses in regions showing significant
group differences according to MANOVA (Table 1).
References
Abdallah, C. G., Jiang, L., De Feyter, H. M., Fasula, M., Krystal, J. H. Rothman,D. L., et al. (2014). Glutamate metabolism in major depressive disorder. Am. J.
Psychiatry 171, 1320–1327. doi: 10.1176/appi.ajp.2014.14010067
Ashburner, J., and Friston, K. J. (1999). Nonlinear spatial normalization using basisfunctions. Hum. Brain Mapp. 7, 254–266.
Avery, J. A., Drevets, W. C., Moseman, S. E., Bodurka, J., Barcalow, J.C., and Simmons, W. K. (2014). Major depressive disorder is asso-ciated with abnormal interoceptive activity and functional connectivity
Frontiers in Behavioral Neuroscience | www.frontiersin.org 12 April 2015 | Volume 9 | Article 82
Wiebking et al. Interoception as state marker for depression
in the insula. Biol. Psychiatry 76, 258–266. doi: 10.1016/j.biopsych.2013.11.027
Bamiou, D.-E., Musiek, F. E., and Luxon, L. M. (2003). The insula (Island of Reil)and its role in auditory processing. Literature review. Brain Res. Brain Res. Rev.
42, 143–154. doi: 10.1016/S0165-0173(03)00172-3Bechara, A., and Naqvi, N. (2004). Listening to your heart: interoceptive awareness
as a gateway to feeling. Nat. Neurosci. 7, 102–103. doi: 10.1038/nn0204-102Beck, A. T., Ward, C. H., Mendelson, M., Mock, J., and Erbaugh, J. (1961). An
inventory for measuring depression. Arch. Gen. Psychiatry 4, 561–571. doi:10.1001/archpsyc.1961.01710120031004
Beck, A. T., Weissman, A., Lester, D., and Trexler, L. (1974). The measurement ofpessimism: the hopelessness scale. J. Consult. Clin. Psychol. 42, 861–865. doi:10.1037/h0037562
Beckmann, C. F., and Smith, S. M. (2004). Probabilistic independent componentanalysis for functional magnetic resonance imaging. IEEE Trans. Med. Imaging
23, 137–152. doi: 10.1109/TMI.2003.822821Belleau, E. L., Taubitz, L. E., and Larson, C. L. (2014). Imbalance of default mode
and regulatory networks during externally focused processing in depression.Soc. Cogn. Affect. Neurosci. doi: 10.1093/scan/nsu117. [Epub ahead of print].
Bjärehed, J., Sarkohi, A., and Andersson, G. (2010). Less positive or more nega-tive? Future-directed thinking in mild to moderate depression. Cogn. Behav.Ther. 39, 37–45. doi: 10.1080/16506070902966926
Brooks, J. O., Wang, P. W., Bonner, J. C., Rosen, A. C., Hoblyn, J. C., Hill, S. J.,et al. (2009). Decreased prefrontal, anterior cingulate, insula, and ventral striatalmetabolism in medication-free depressed outpatients with bipolar disorder.J. Psychiatr. Res. 43, 181–188. doi: 10.1016/j.jpsychires.2008.04.015
Cerliani, L., Thomas, R. M., Jbabdi, S., Siero, J. C. W., Nanetti, L., Crippa, A., et al.(2012). Probabilistic tractography recovers a rostrocaudal trajectory of connec-tivity variability in the human insular cortex.Hum. BrainMapp. 33, 2005–2034.doi: 10.1002/hbm.21338
Chang, L. J., Yarkoni, T., Khaw, M. W., and Sanfey, A. G. (2013). Decoding therole of the insula in human cognition: functional parcellation and large-scalereverse inference. Cereb. Cortex 23, 739–749. doi: 10.1093/cercor/bhs065
Cloutman, L. L., Binney, R. J., Drakesmith, M., Parker, G. J. M., and Lambon Ralph,M. A. (2012). The variation of function across the human insula mirrors itspatterns of structural connectivity: evidence from in vivo probabilistic tractog-raphy. Neuroimage 59, 3514–3521. doi: 10.1016/j.neuroimage.2011.11.016
Craig, A. D. (2002). How do you feel? Interoception: the sense of the physiologicalcondition of the body. Nat. Rev. Neurosci. 3, 655–666. doi: 10.1038/nrn894
Craig, A. D. (2003). Interoception: the sense of the physiological condition of thebody. Curr. Opin. Neurobiol. 13, 500–505. doi: 10.1016/S0959-4388(03)00090-4
Craig, A. D. (2004). Human feelings: why are somemore aware than others?TrendsCogn. Sci. 8, 239–241. doi: 10.1016/j.tics.2004.04.004
Craig, A. D. (2009). How do you feel–now? The anterior insula and humanawareness. Nat. Rev. Neurosci. 10, 59–70. doi: 10.1038/nrn2555
Craig, A. D. B. (2011). Significance of the insula for the evolution of humanawareness of feelings from the body. Ann. N.Y. Acad. Sci. 1225, 72–82. doi:10.1111/j.1749-6632.2011.05990.x
Critchley, H. D. (2009). Psychophysiology of neural, cognitive and affective inte-gration: fMRI and autonomic indicants. Int. J. Psychophysiol. 73, 88–94. doi:10.1016/j.ijpsycho.2009.01.012
Critchley, H. D., Wiens, S., Rotshtein, P., Ohman, A., and Dolan, R. J. (2004). Neu-ral systems supporting interoceptive awareness. Nat. Neurosci. 7, 189–195. doi:10.1038/nn1176
Damasio, A. R. (1999). The Feeling of What Happens?: Body and Emotion in the
Making of Consciousness, 1st Edn. New York, NY: Harcourt Brace.Deen, B., Pitskel, N. B., and Pelphrey, K. A. (2011). Three systems of insular func-
tional connectivity identified with cluster analysis.Cereb. Cortex 21, 1498–1506.doi: 10.1093/cercor/bhq186
Domschke, K., Stevens, S., Pfleiderer, B., and Gerlach, A. L. (2010). Inte-roceptive sensitivity in anxiety and anxiety disorders: an overview andintegration of neurobiological findings. Clin. Psychol. Rev. 30, 1–11. doi:10.1016/j.cpr.2009.08.008
Dunn, B. D., Dalgleish, T., Ogilvie, A. D., and Lawrence, A. D. (2007).Heartbeat perception in depression. Behav. Res. Ther. 45, 1921–1930. doi:10.1016/j.brat.2006.09.008
Farb, N. A. S., Segal, Z. V., and Anderson, A. K. (2013). Attentional modulationof primary interoceptive and exteroceptive cortices. Cereb. Cortex 23, 114–126.doi: 10.1093/cercor/bhr385
Fitzgerald, P. B., Laird, A. R., Maller, J., and Daskalakis, Z. J. (2008). A meta-analytic study of changes in brain activation in depression. Hum. Brain Mapp.
29, 683–695. doi: 10.1002/hbm.20426Friston, K. J., Holmes, A. P., Worsley, K. J., Poline, J. B., Frith, C., and Frackowiak,
R. S. J. (1995). Statistical parametric maps in functional imaging: a generallinear approach. Hum. Brain Mapp. 2, 189–210. doi: 10.1002/hbm.460020402
Furman, D. J., Waugh, C. E., Bhattacharjee, K., Thompson, R. J., and Gotlib,I. H. (2013). Interoceptive awareness, positive affect, and decision mak-ing in major depressive disorder. J. Affect. Disord. 151, 780–785. doi:10.1016/j.jad.2013.06.044
Garfinkel, S. N., Seth, A. K., Barrett, A. B., Suzuki, K., and Critch-ley, H. D. (2014). Knowing your own heart: distinguishing interocep-tive accuracy from interoceptive awareness. Biol. Psychol. 104, 65–74. doi:10.1016/j.biopsycho.2014.11.004
Grimm, S., Ernst, J., Boesiger, P., Schuepbach, D., Hell, D., Boeker, H., et al.(2009). Increased self-focus in major depressive disorder is related to neuralabnormalities in subcortical-cortical midline structures. Hum. Brain Mapp. 30,2617–2627. doi: 10.1002/hbm.20693
Guo, W., Sun, X., Liu, L., Xu, Q., Wu, R., Liu, Z., et al. (2011). Disruptedregional homogeneity in treatment-resistant depression: a resting-state fMRIstudy. Prog. Neuro-Psychopharmacol. Biol. Psychiatry 35, 1297–1302. doi:10.1016/j.pnpbp.2011.02.006
Ham, T., Leff, A., de Boissezon, X., Joffe, A., and Sharp, D. J. (2013). Cognitivecontrol and the salience network: an investigation of error processing and effec-tive connectivity. J. Neurosci. 33, 7091–7098. doi: 10.1523/JNEUROSCI.4692-12.2013
Hamilton, J., Furman, D., Chang, C., Thomason, M., Dennis, E., and Gotlib,I. (2012). Default-mode and task-positive network activity in major depres-sive disorder: implications for adaptive and maladaptive rumination. Biol.Psychiatry 70, 327–333. doi: 10.1016/j.biopsych.2011.02.003
Hamilton, M. (1967). Development of a rating scale for primary depressive illness.Br. J. Soc. Clin. Psychol. 6, 278–296. doi: 10.1111/j.2044-8260.1967.tb00530.x
Harshaw, C. (2015). Interoceptive dysfunction: toward an integrated frameworkfor understanding somatic and affective disturbance in depression. Psychol.Bull. 141, 311–363. doi: 10.1037/a0038101
Henningsen, P., Zimmermann, T., and Sattel, H. (2003). Medically unexplainedphysical symptoms, anxiety, and depression: a meta-analytic review. Psycho-som. Med. 65, 528–533. doi: 10.1097/01.PSY.0000075977.90337.E7
Heydrich, L., and Blanke, O. (2013). Distinct illusory own-body perceptions causedby damage to posterior insula and extrastriate cortex. Brain 136(Pt 3), 790–803.doi: 10.1093/brain/aws364
Kotani, Y., Ohgami, Y., Kuramoto, Y., Tsukamoto, T., Inoue, Y., and Aihara, Y.(2009). The role of the right anterior insular cortex in the right hemisphere pre-ponderance of stimulus-preceding negativity (SPN): an fMRI study. Neurosci.Lett. 450, 75–79. doi: 10.1016/j.neulet.2008.11.032
Lamm, C., and Singer, T. (2010). The role of anterior insular cortex in socialemotions. Brain Struct. Funct. 214, 579–591. doi: 10.1007/s00429-010-0251-3
Liu, Z., Xu, C., Xu, Y., Wang, Y., Zhao, B., Lv, Y., et al. (2010). Decreased regionalhomogeneity in insula and cerebellum: a resting-state fMRI study in patientswith major depression and subjects at high risk for major depression. PsychiatryRes. 182, 211–215. doi: 10.1016/j.pscychresns.2010.03.004
MacLeod, A. K., Tata, P., Tyrer, P., Schmidt, U., Davidson, K., and Thompson, S.(2005). Hopelessness and positive and negative future thinking in parasuicide.The Br. J. Clin. Psychol. 44(Pt 4), 495–504. doi: 10.1348/014466505X35704
Manoliu, A., Meng, C., Brandl, F., Doll, A., Tahmasian, M., Scherr, M., et al.(2013). Insular dysfunction within the salience network is associated with sever-ity of symptoms and aberrant inter-network connectivity in major depressivedisorder. Front. Hum. Neurosci. 7:930. doi: 10.3389/fnhum.2013.00930
Medford, N., and Critchley, H. D. (2010). Conjoint activity of anterior insularand anterior cingulate cortex: awareness and response. Brain Struct. Funct. 214,535–549. doi: 10.1007/s00429-010-0265-x
Menon, V., and Uddin, L. Q. (2010). Saliency, switching, attention and control:a network model of insula function. Brain Struct. Funct. 214, 655–667. doi:10.1007/s00429-010-0262-0
Mesulam, M. M., and Mufson, E. J. (1985). “The insula of reil in man and mon-key: architectonics, connectivity, and function,” in Cerebral Cortex, Vol. 4, edsA. Peters and E. G. Jones (New York, NY: Plenum Press), 179–226.
Morel, A., Gallay, M. N., Baechler, A., Wyss, M., and Gallay, D. S.(2013). The human insula: Architectonic organization and postmortem MRI
Frontiers in Behavioral Neuroscience | www.frontiersin.org 13 April 2015 | Volume 9 | Article 82
Wiebking et al. Interoception as state marker for depression
registration. Neuroscience 236, 117–135. doi: 10.1016/j.neuroscience.2012.12.076
Northoff, G., Qin, P., and Feinberg, T. E. (2011). Brain imaging of the self–conceptual, anatomical and methodological issues. Conscious. Cogn. 20, 52–63.doi: 10.1016/j.concog.2010.09.011
Nyboe Jacobsen, L., Smith Lassen, I., Friis, P., Videbech, P., and Wentzer Licht, R.(2006). Bodily symptoms inmoderate and severe depression.Nord. J. Psychiatry60, 294–298. doi: 10.1080/08039480600790358
Paul, N. A., Stanton, S. J., Greeson, J. M., Smoski, M. J., and Wang, L.(2013). Psychological and neural mechanisms of trait mindfulness in reduc-ing depression vulnerability. Soc. Cogn. Affect. Neurosci. 8, 56–64. doi:10.1093/scan/nss070
Paulus, M. P., and Stein, M. B. (2010). Interoception in anxiety and depression.Brain Struct. Funct. 214, 451–463. doi: 10.1007/s00429-010-0258-9
Pollatos, O., Schandry, R., Auer, D. P., and Kaufmann, C. (2007). Brain structuresmediating cardiovascular arousal and interoceptive awareness. Brain Res. 1141,178–187. doi: 10.1016/j.brainres.2007.01.026
Pollatos, O., Traut-Mattausch, E., and Schandry, R. (2009). Differential effectsof anxiety and depression on interoceptive accuracy. Depress. Anxiety 26,167–173. doi: 10.1002/da.20504
Porges, S. W. (1993). Body Perception Questionnaire (German version). Laboratoryof Developmental Assessment, University of Maryland.
Schaefer, H. S., Putnam, K. M., Benca, R. M., and Davidson, R. J. (2006). Event-related functional magnetic resonance imaging measures of neural activity topositive social stimuli in pre- and post-treatment depression. Biol. Psychiatry60, 974–986. doi: 10.1016/j.biopsych.2006.03.024
Seeley, W. W., Menon, V., Schatzberg, A. F., Keller, J., Glover, G. H.,Kenna, H., et al. (2007). Dissociable intrinsic connectivity networks forsalience processing and executive control. J. Neurosci. 27, 2349–2356. doi:10.1523/JNEUROSCI.5587-06.2007
Shulman, R. G., Hyder, F., and Rothman, D. L. (2009). Baseline brain energy sup-ports the state of consciousness. Proc. Natl. Acad. Sci. U.S.A. 106, 11096–11101.doi: 10.1073/pnas.0903941106
Simmons, W. K., Avery, J. A., Barcalow, J. C., Bodurka, J., Drevets, W. C., and Bell-gowan, P. (2013). Keeping the body inmind: insula functional organization andfunctional connectivity integrate interoceptive, exteroceptive, and emotionalawareness. Hum. Brain Mapp. 11, 2944–2958. doi: 10.1002/hbm.22113
Sliz, D., and Hayley, S. (2012). Major depressive disorder and alterations in insu-lar cortical activity: a review of current functional magnetic imaging research.Front. Hum. Neurosci. 6:323. doi: 10.3389/fnhum.2012.00323
Smith, S. M. (2002). Fast robust automated brain extraction.Hum. Brain Mapp. 17,143–155. doi: 10.1002/hbm.10062
Smith, S. M., Jenkinson, M., Woolrich, M. W., Beckmann, C. F., Behrens, T. E.J., Johansen-Berg, H., et al. (2004). Advances in functional and structural MRimage analysis and implementation as FSL. Neuroimage 23, S208–S219. doi:10.1016/j.neuroimage.2004.07.051
Sprengelmeyer, R., Steele, J. D., Mwangi, B., Kumar, P., Christmas, D., Milders, M.,et al. (2011). The insular cortex and the neuroanatomy of major depression.J. Affect. Disord. 133, 120–127. doi: 10.1016/j.jad.2011.04.004
Sridharan, D., Levitin, D. J., and Menon, V. (2008). A critical role forthe right fronto-insular cortex in switching between central-executive anddefault-mode networks. Proc. Natl. Acad. Sci. U.S.A. 105, 12569–12574. doi:10.1073/pnas.0800005105
Terasawa, Y., Shibata, M., Moriguchi, Y., and Umeda, S. (2013). Anterior insularcortex mediates bodily sensibility and social anxiety. Soc. Cogn. Affect. Neurosci.8, 259–266. doi: 10.1093/scan/nss108
Touroutoglou, A., Hollenbeck, M., Dickerson, B. C., and Feldman Barrett, L.(2012). Dissociable large-scale networks anchored in the right anterior insula
subserve affective experience and attention. Neuroimage 60, 1947–1958. doi:10.1016/j.neuroimage.2012.02.012
Uddin, L. Q., Kinnison, J., Pessoa, L., and Anderson, M. L. (2013). Beyond the tri-partite cognition–emotion–interoception model of the human insular cortex.J. Cogn. Neurosci. 26, 1–10. doi: 10.1162/jocn_a_00462
Wiebking, C., Bauer, A., de Greck, M., Duncan, N. W., Tempelmann, C., andNorthoff, G. (2010). Abnormal body perception and neural activity in the insulain depression: an fMRI study of the depressed “material me.” World J. Biol.
Psychiatry 11, 538–549. doi: 10.3109/15622970903563794Wiebking, C., Duncan, N. W., Qin, P., Hayes, D. J., Lyttelton, O., Gravel, P., et al.
(2014a). External awareness and GABA—A multimodal imaging study com-bining fMRI and [18F]flumazenil-PET. Hum. Brain Mapp. 35, 173–184. doi:10.1002/hbm.22166
Wiebking, C., Duncan, N. W., Tiret, B., Hayes, D. J., Marjanska, M., Doyon, J.,et al. (2014b). GABA in the insula - a predictor of the neural response to inte-roceptive awareness. Neuroimage 86, 10–18. doi: 10.1016/j.neuroimage.2013.04.042
Wiebking, C., and Northoff, G. (2014). Interoceptive awareness and the insula –application of neuroimaging techniques in psychotherapy. GSTF Int. J. Psychol.1, 53–60. doi: 10.5176/2345-7872_1.1.8
Wiens, S. (2005). Interoception in emotional experience. Curr. Opin. Neurol. 18,442–447. doi: 10.1097/01.wco.0000168079.92106.99
Willem Van der Does, A. J., Antony, M. M., Ehlers, A., and Barsky, A. J. (2000).Heartbeat perception in panic disorder: a reanalysis. Behav. Res. Ther. 38,47–62. doi: 10.1016/S0005-7967(98)00184-3
Woolrich, M. W., Jbabdi, S., Patenaude, B., Chappell, M., Makni, S., Behrens, T.,et al. (2009). Bayesian analysis of neuroimaging data in FSL. Neuroimage 45,S173–S186. doi: 10.1016/j.neuroimage.2008.10.055
Worsley, K. J. (2001). “Statistical analysis of activation images,” in Functional MRI:
An Introduction to Methods, eds P. Jezzard, P. Matthews, and S. Smith (Oxford:Oxford University Press), 1–23.
Yao, Z., Wang, L., Lu, Q., Liu, H., and Teng, G. (2009). Regional homo-geneity in depression and its relationship with separate depressive symp-tom clusters: a resting-state fMRI study. J. Affect. Disord. 115, 430–438. doi:10.1016/j.jad.2008.10.013
Yuen, G. S., Gunning-Dixon, F. M., Hoptman, M. J., AbdelMalak, B., McGov-ern, A. R., Seirup, J. K., et al. (2014). The salience network in the apathyof late-life depression. Int. J. Geriatr. Psychiatry 29, 1116–1124. doi: 10.1002/gps.4171
Zaki, J., Davis, J. I., and Ochsner, K. N. (2012). Overlapping activity in ante-rior insula during interoception and emotional experience. Neuroimage 62,493–499. doi: 10.1016/j.neuroimage.2012.05.012
Zhang, Y., Brady, M., and Smith, S. (2001). Segmentation of brain MRimages through a hidden Markov random field model and the expectation-maximization algorithm. IEEE Trans. Med. Imaging 20, 45–57. doi:10.1109/42.906424
Conflict of Interest Statement: The authors declare that the research was con-ducted in the absence of any commercial or financial relationships that could beconstrued as a potential conflict of interest.
Copyright © 2015Wiebking, de Greck, Duncan, Tempelmann, Bajbouj and Northoff.
This is an open-access article distributed under the terms of the Creative Commons
Attribution License (CC BY). The use, distribution or reproduction in other forums
is permitted, provided the original author(s) or licensor are credited and that the
original publication in this journal is cited, in accordance with accepted academic
practice. No use, distribution or reproduction is permitted which does not comply
with these terms.
Frontiers in Behavioral Neuroscience | www.frontiersin.org 14 April 2015 | Volume 9 | Article 82