internship project report final saransh
TRANSCRIPT
OPTIMIZATON OF PORT CAPACITY – A STUDY OF VADINAR OIL TERMINAL Page i
PROJECT REPORT
ON
OPTIMIZATON OF PORT CAPACITY – A STUDY OF
VADINAR OIL TERMINAL
Submitted to the University of Petroleum & Energy Studies in partial fulfillment
of the requirements leading to the award of the Degree of
MBA in Port & Shipping Management
By
Mr. Saransh Tewari
(Reg. No. R310212018)
2012-2014
COLLEGE OF MANAGEMENT & ECONOMIC STUDIES
UNIVERSITY OF PETROLEUM & ENERGY STUDIES Energy Acres, P.O. Bidholi
Dehradun – 248007
OPTIMIZATON OF PORT CAPACITY – A STUDY OF VADINAR OIL TERMINAL Page ii
CERTIFICATE
This is to certify that the dissertation, entitled “OPTIMIZATION OF
PORT CAPACITY – A STUDY OF VADINAR OIL TERMINAL”, submitted
to the University of Petroleum & Energy studies, in partial fulfillment of the
requirements for the award of the Degree of MBA in Port & Shipping
Management is a record of study done by Mr. Ashish Sharma and Mr. Saransh
Tewari, during the period of their study (2012-2014) in the Department of
Transportation under College of Management & Economic Studies at University of
Petroleum and Energy Studies, Dehradun, under my supervision and guidance and
has not formed the basis for the award of any Degree / Diploma / Associateship /
Fellowship or other similar title to any candidate of any university.
______________________
Guide and Supervisor
_______________ _________________________
Dean Course Coordinator/
Head of the Department

OPTIMIZATON OF PORT CAPACITY – A STUDY OF VADINAR OIL TERMINAL Page iii
DECLARATION
I hereby declare that the dissertation, entitled “OPTIMIZATION OF PORT
CAPACITY – A STUDY OF VADINAR OIL TERMINAL”, submitted to the University
of Petroleum & Energy Studies, in partial fulfillment of the requirements for the
award of the Degree of MBA in Port and Shipping Management is a record of
original research work done by me during the period of 2012-2014 under the
supervision and guidance , and it has not formed the basis for the award of any
Degree / Diploma / Associateship / Fellowship or other similar title to any
candidate in any university.
Place:
Date: Signature of the Candidate
Signature of the Candidate

OPTIMIZATON OF PORT CAPACITY – A STUDY OF VADINAR OIL TERMINAL Page iv
ACKNOWLEDGEMENT
I take this opportunity to thank Captain Deepak Sachdeva who has
mentored me on this project. He believed in me and gave me a free hand to work
independently, thereby, helping me improve my decision making and problem
solving skills.
I would like to mention that Captain Deepak not only approved my
recommendations but gave us an opportunity to implement the same successfully,
which was definitely a different experience for me as I had to face practical
problems during implementation.
I gratefully acknowledge the regular support from Captain Alok Kumar
(Head of Marine Operations), Captain Banshiva Ladva (Port Captain), Mr.
Saurabh Darshan (Sr. Manager, Marine Operations), Mr. Ajay Pokiya
(Marine Maintenance Incharge), Mr. Rajil Nagrecha (Marine Operations),
Mr. Deep Sompura (Marine Operations), Mr. Sanjay Barpatre (HSEF), Mr.
Shankar Roy (Administration).
I gratefully acknowledge the regular support from Dr. T. B. Raju who
continuously took feeds from us regarding the project and motivated us
thoroughly.

OPTIMIZATON OF PORT CAPACITY – A STUDY OF VADINAR OIL TERMINAL Page 1
ABSTRACT
This study provides a methodological framework which uses and evaluates internally
generated information in order to find the relation between various factors and the throughput of
an oil terminal and how it can be optimized. Global ports are operating in an extremely complex
and competitive environment, wherein measuring, monitoring, and improving, port performance
are key elements of port competitiveness. Assessing port performance is a multileveled task. Port
practice is not different, as port planning, modernisation and capacity expansion are processes
commonly based on the outcome of these measurements of port efficiency. This study focuses
mainly on the operations of an oil terminal and compares berth throughput with berth capacity in
order to find out whether the terminal is operating at an optimum level or not.
Here the researcher is trying to study the effect of factors such as loading rate, parcel size,
loading time and number of vessels handled per year on the total throughput of the terminal. The
study examines and reveals that there are various discrepancies and factors involved in
calculating the port capacity of dedicated terminal and tells how it can be fully optimized.
Keywords:- Port Capacity, Optimization, Port efficiency, Berth throughput, Loading rate,
Loading time, Number of ships.

OPTIMIZATON OF PORT CAPACITY – A STUDY OF VADINAR OIL TERMINAL Page 2
TABLE OF CONTENTS
ABBREVIATIONS ....................................................................................................................... 4
CHAPTER 1 – INTRODUCTION OF TOPIC .......................................................................... 6
1.1 PORT CAPACITY ................................................................................................................... 6
1.2 PLANNING AND SCHEDULING .......................................................................................... 6
1.3 PORT THROUGHPUT ............................................................................................................ 8
1.4 PORT EFFICIENCY ................................................................................................................ 8
1.5 OBJECTIVE OF THE STUDY ................................................................................................ 9
CHAPTER 2- INTRODUCTION OF ORGANISATION ...................................................... 11
2.1 ESSAR PORTS ....................................................................................................................... 11
2.2 ESSAR PORT LIMITED - PERFORMANCE FOR YEAR ENDED ON 31st MARCH, 2013.
....................................................................................................................................................... 12
2.2.1 SECTOR OVERVIEW ........................................................................................................ 12
2.2.2 COMPANY OVERVIEW ................................................................................................... 13
2.2.3 KEY HIGHLIGHTS ............................................................................................................ 14
2.3 VADINAR OIL TERMINAL LIMITED (VOTL) ................................................................. 14
2.3.1 FACELITIES ....................................................................................................................... 15
2.3.2 CROSS-COUNTRY PIPELINES ........................................................................................ 15
2.3.3 SERVICES ........................................................................................................................... 16
2.3.4 SAFETY AND SECURITY ................................................................................................ 17
2.3.5 STATISTICS AND TARIFFS ............................................................................................. 18
2.3.6 VADINAR HIGHLIGHTS .................................................................................................. 18
CHAPTER 3- LITERATURE REVIEW AND REFERENCES ............................................ 25
3.1 LITERATURE REVIEW ....................................................................................................... 25
3.2 REFERENCES ....................................................................................................................... 26
CHAPTER 4- METHODOLOGY ............................................................................................ 28
4.1 RESEARCH METHODOLOGY............................................................................................ 28
4.2 RESEARCH DESIGN ............................................................................................................ 28
4.3 AREA OF THE STUDY ........................................................................................................ 29
4.4 SOURCES OF DATA ............................................................................................................ 29

OPTIMIZATON OF PORT CAPACITY – A STUDY OF VADINAR OIL TERMINAL Page 3
4.5 STATISTICAL TOOL USED ................................................................................................ 29
4.6 DATA ANALYSIS ................................................................................................................. 29
4.7 CORRELATION AND REGRESSION ................................................................................. 30
4.8 LIMITATIONS OF THE STUDY.......................................................................................... 30
CHAPTER 5- ANALYSIS AND INTERPRETATION .......................................................... 32
5.1 DETERMINING FACTORS WHICH AFFECT PORT CAPCITY, EFFICIEENCY AND
THROUGHPUT ........................................................................................................................... 32
5.1.1 SHORE ELEMENTS........................................................................................................... 33
5.1.2 SHIP ELEMENTS. .............................................................................................................. 34
5.2 TO CHECK THE ACCURACY OF THE DATA PROVIDED BY THE COMPANY BY
CALCULTING TERMINAL THROUGHPUT AND BERTH OCCUPANCY. ......................... 35
5.3 TO KNOW THE EFFECT OF CHANGE IN EACH FACTOR ON TERMINAL
THROUGHPUT WHEN OTHER FACTORS REMAINS CONSTANT AND DETERMINING
THE PERCENTAGE CONTRIBUTION OF EACH FACTOR ON THROUGHPUT. .............. 40
5.3.1 EFFECT OF LOADING RATE ON THE THROUGHPUT. .............................................. 40
5.3.2 EFFECT OF LOADING TIME ON THE THROUGHPUT. .............................................. 42
5.3.3 EFFECT OF BERTH OCCUPANCY ON THE THROUGHPUT. .................................... 44
ASSUMPTIONS: .......................................................................................................................... 46
5.4.1 WHEN PUMPING CAPACITY FROM PIT IS 100% ACHIEVED WITH BERTH
OCCUPANCY OF 80.57% [AS PER FY – 13] ........................................................................... 46
5.4.2 WHEN PUMPING CAPACITY FROM PIT IS 100% ACHIEVED WITH BERTH
OCCUPANCY OF 70% [AS PER FY - 13] ................................................................................. 48
5.5 FINDINGS .............................................................................................................................. 51
5.6 SUGGESTIONS ..................................................................................................................... 52
5.7 CONCLUSION ....................................................................................................................... 53
BIBLIOGRAPHY ....................................................................................................................... 55

OPTIMIZATON OF PORT CAPACITY – A STUDY OF VADINAR OIL TERMINAL Page 4
ABBREVIATIONS
ABS American Bureau of Shipping
ATF Aviation Turbine Fuel
Avg. Average
BS Bharat Stage
COT Crude Oil Tanks
DNV Det Norske Veritas
EBITDA Earnings before Interest, Tax, Depreciation and Amortization
EOL Essar Oil Limited
EPL Essar Ports Limited
FO Fuel Oil
FY Fiscal Year
GDP Gross Domestic Product
Hrs. Hours
HSD High Speed Diesel
HSE Health, Safety and Environment
ISO International Organisation for Standardization
ISO/TS ISO Technical Specification
KL Kilo Litres
LPG Liquidified Petroleum Gas
MARPOL International Convention for the Prevention of Pollution from Ships
MMTPA Million Metric Tons Per Annum
MS Motor Spirit
MT Metric Tons
No. Number
OHSAS International Occupational Health and Safety Management System
PAT Profit After Tax
PHA Petroleum Handling Agreement
PIT Product Intermediate Tanks
POL Petroleum, Oil and Lubricants

OPTIMIZATON OF PORT CAPACITY – A STUDY OF VADINAR OIL TERMINAL Page 5
PSU Public Sector Unit
RoSPA Royal Society for the Prevention of Accidents
SKO Superior Kerosene Oil
Tph Tons Per Hour
SPM Single Point Mooring
VGO Vacuum Gas Oil
VOTL Vadinar Oil Terminal Limited
W/O White Oil

OPTIMIZATON OF PORT CAPACITY – A STUDY OF VADINAR OIL TERMINAL Page 6
CHAPTER 1 – INTRODUCTION OF TOPIC
1.1 PORT CAPACITY
PORT CAPACITY is the estimated capacity of a port to clear cargo in 24 hours usually
expressed in metric tons. It is the important factor to stimulate port competitiveness and boost
regional development. With the growing international sea traffic and change in technology in the
maritime transportation industry seaports are coping with mounting pressure to upgrade and
provide cutting edge technology. They are also being forced to improve their efficiency to
provide comparative advantages that will attract more traffic.
Capacity utilization of the port is considered to be very important factor in calculating the
efficiency of the port. No port can utilize 100% of its capacity. There will always be discrepancy
in the capacity of the port it is handling and actual capacity it is utilizing. What should be the
capacity of the port? Is the most important question which every company has to deal with.
There are different methods of calculating the capacity of the port. The companies adopt those
method(s) which suits them considering different aspect of it.
Measures of port capacity indicators use a diverse range of techniques for assessment and
analysis, but although many analytical tools and instrument exist, a problem arises when one
tries to apply them across ports and terminals.
If the capacity of berth is 100% utilized, the cost of handling per ship would reduce but
will increase the waiting time of ship outside the port leading to increase in cost to ship owner. If
number of berths are exceeded, the capacity will reduce at that period of time and will add to the
cost of the company due to developing of a new berth as well as handling cost per ship will also
increase in that period. But the contradiction to this method is rather increasing the number of
berth, cargo can be transshipped which will neither increase the cost of port nor the cost of ship
owner and waiting time of ships will also be reduced.
1.2 PLANNING AND SCHEDULING
Managing a modern dedicated oil berth, with its complex and varied activities, demands a
systematic and comprehensive approach to operations planning. Detailed planning is essential to
OPTIMIZATON OF PORT CAPACITY – A STUDY OF VADINAR OIL TERMINAL Page 7
ensure the proper allocation of the resources and the effective co-ordination of the activities,
particularly those involving individuals and organisations outside the port. No matter how well
day-to-day control and supervisory functions are, it is impossible to achieve the cargo throughput
of which the berth is capable unless operations are planned effectively, to produce a smooth,
cost-effective and balanced flow of cargo through the berth. Planning is an essential management
task for all activities on the berth.
Scheduling and planning are essential for keeping a company organized and focused on
long-term goals. Planning and scheduling go together in any business. Planning involves
determining what goals, company will accomplish and what path will it take to reach and attract
customers. Scheduling is determining when these plans will materialize.
Effective Communication is the key to build and manage a successful business. Effective
communication between various departments and between different employees with in that
department acts as oil that keeps engine of the vehicles working effectively.
Economic Planning and Scheduling department (EPS) is responsible for planning and
scheduling for Essar Oil Ltd. (EOL) and act as a linkage between Refinery, Product Intermediate
Tank and Crude Oil Tank. It develops schedule and plans on monthly and daily basis and is also
responsible for re-scheduling in case of any changes that might occur. It also keeps a check on its
implementation. There are Sales and Distribution Departments which deals with Domestic
vessels and International Supply and Trading Department which deals with export vessels.
Vadinar Oil Terminal Ltd. (VOTL) acts as facilitator. Quality, quantity and dates on
which crude oil is required are decided by EPS which communicates to IST, Mumbai for
arranging it. Once it is arranged Vessel unloads crude oil at VOTL and through SPM it goes to
COT. Then Schedules and Plans regarding quality and quantity of products required are directed
to refinery. As per the target set by EPS, refinery refines and extracts the products from crude oil
and sends it to PIT. Then S & D dept. and IST dept. communicates with the domestic and
international customers and develops a schedule for loading the product to their vessels. The
schedule is forwarded to EPS which further develops daily and monthly plans for VOTL

OPTIMIZATON OF PORT CAPACITY – A STUDY OF VADINAR OIL TERMINAL Page 8
regarding number of vessels, quality and quantity of product, etc. PIT pumps out the product as
per the directions and VOTL loads it on the vessel of customers.
1.3 PORT THROUGHPUT
The average quantity of cargo and passengers that can pass through a port/terminal on a
daily basis from arrival at the port to loading onto a ship, or from the discharge from a ship to the
exit (clearance) from the port complex. Throughput is usually expressed in measurement tons, or
passengers. Reception and storage limitation may affect final throughput.
The method adopted in this study in calculating throughput of port is depending upon
four factors: -Turnaround time, loading rate, berth occupancy, handling time and number of ships
handled in the year.
Loading rate is given in m3/Hr., which has to be converted into metric tons as per the
specific gravity of the respective products port is handling.
Berth Throughput = Average Parcel Size* Total No. of Vessels.
Average Parcel Size = Average Loading Rate (effective)*Loading Time
No. of Vessel = Total Port Time (each product) / Turnaround Time
Adding the throughput of each product will give the Total Throughput of the port/terminal
which can further be compared with Total Capacity and delta can be assessed.
1.4 PORT EFFICIENCY
The comparison of what is actually produced or performed with what can be achieved
with the same consumption of resources (e.g. money, time, labor etc.). It is an important factor in
determination of Productivity.
In general, efficiency is a measurable concept, quantitatively determined by the ratio of
output to input. In several of these cases, efficiency can be expressed as a result as percentage of
what ideally could be expected, hence with 100% as ideal case.

OPTIMIZATON OF PORT CAPACITY – A STUDY OF VADINAR OIL TERMINAL Page 9
Here the researcher has defined efficiency as the capacity utilization factor of the
terminal i.e. how much of the capacity it is utilizing of the total available capacity. The utilized
capacity is the total throughput of the berth and the total capacity available is the designed
capacity of the terminal.
The measure of efficiency is a concept directly related to the measure of productivity i.e.
total throughput. However, they are not analogous notions, even though they are treated as
synonymous, especially when the interest of the research/study is concentrated on comparing the
performance of the firms.
The idea behind the use of both concepts analogously is that a firm‟s performance
improves the more efficient and productive it is. Meanwhile, the fact that changes in productivity
are due to changes in efficiency, among other factors, may have had an influence in considering
both terms as equivalent.
1.5 OBJECTIVE OF THE STUDY
To get familiar with industry work ethics and connect theoretical learning to day to day
work carried out on an oil terminal.
To study and analyze the operations being carried out at Vadinar Oil Terminal.
To understand how berth capacity can be fully utilized.
To study how berth throughput is calculated at Vadinar Oil Terminal.
To ensure berth efficiency is maintained even if the capacity is increased.
To understand various factors which are affecting the capacity utilization of the terminal.
To study the relation between the factors affecting the berth capacity with the berth
throughput.

OPTIMIZATON OF PORT CAPACITY – A STUDY OF VADINAR OIL TERMINAL Page 10
To identify and study elements required in deciding the efficiency of the port.
To identify constraints involved in optimizing berth capacity.
To identify the constraints faced by VOTL pertaining to satisfaction of its customers.

OPTIMIZATON OF PORT CAPACITY – A STUDY OF VADINAR OIL TERMINAL Page 11
CHAPTER 2- INTRODUCTION OF ORGANISATION
2.1 ESSAR PORTS
Essar Ports develops, owns and operates ports and terminals, and is India's second-largest
private sector port and terminal company by capacity and throughput. The company's ports
business is held by Essar Ports Limited (EPL), which is listed on the Bombay Stock Exchange
and National Stock Exchange of India.
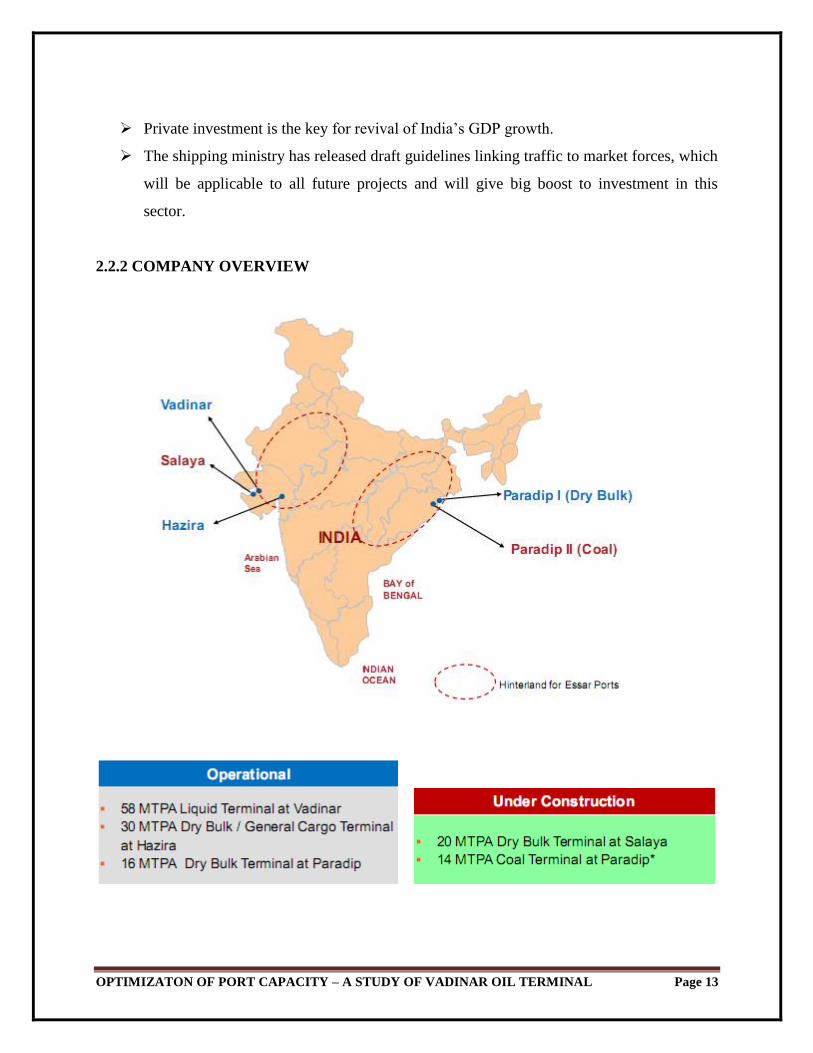
Essar Ports provides port and terminal services for liquid, dry bulk, break bulk and
general cargo, with an existing aggregate capacity of 104 MMTPA across two facilities located
at Vadinar (58 MMTPA) and Hazira (30 MMTPA) in the state of Gujarat, on the west coast of
India.
The Vadinar facility provides handling, storage and terminalling services for crude oil
and petroleum products to refineries and traders. The Hazira facility is an all-weather deep draft
bulk terminal for import of iron ore, pellets, coal, limestone and export of finished steel products.
The company is in the process of increasing its aggregate ports capacity to 158 MMTPA
with expansion projects at Vadinar and Hazira, a new port at Salaya in Gujarat and two terminals
at Paradip in the state of Orissa on the east coast of India.
The company's sites at Vadinar, Hazira and Salaya are strategically located on the
western coast of India in the state of Gujarat to service the growing demand from the land-locked
northern, north-western and central regions of India and are well connected to the state highways
and have, or will in the future have, connectivity to the railway network. Its sites at Paradip are
located on the eastern coast of the state of Orissa to service mineral and metal-rich eastern India
and are well positioned to service cargo for the steel and power industries.
OPTIMIZATON OF PORT CAPACITY – A STUDY OF VADINAR OIL TERMINAL Page 12
2.2 ESSAR PORT LIMITED - PERFORMANCE FOR YEAR ENDED ON 31st MARCH,
2013.
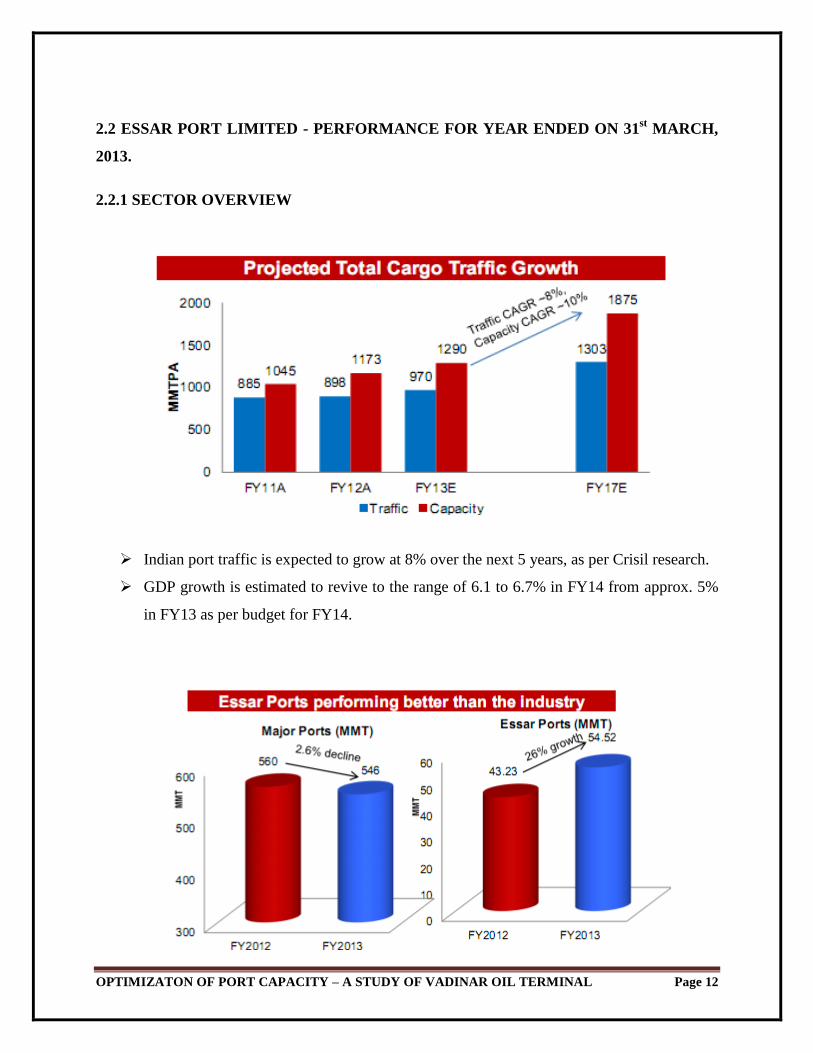
2.2.1 SECTOR OVERVIEW
Indian port traffic is expected to grow at 8% over the next 5 years, as per Crisil research.
GDP growth is estimated to revive to the range of 6.1 to 6.7% in FY14 from approx. 5%
in FY13 as per budget for FY14.
OPTIMIZATON OF PORT CAPACITY – A STUDY OF VADINAR OIL TERMINAL Page 13
Private investment is the key for revival of India‟s GDP growth.
The shipping ministry has released draft guidelines linking traffic to market forces, which
will be applicable to all future projects and will give big boost to investment in this
sector.
2.2.2 COMPANY OVERVIEW

OPTIMIZATON OF PORT CAPACITY – A STUDY OF VADINAR OIL TERMINAL Page 14
Current capacity of 104 MMTPA being scaled up to 158 MMTPA by 2015
3 stand-alone ports on west coast and 2 terminals on east coast of India.
2.2.3 KEY HIGHLIGHTS
2.3 VADINAR OIL TERMINAL LIMITED (VOTL)
It is located within the conservancy of Kandla Port Trust, in the Jamnagar district of
Gujarat. It has Petroleum Handling Agreement (PHA) with Essar Oil Limited for handling POL,
crude from its onshore and offshore facilities. It started handling vessels from December, 2006.
It serves oil refinery and traders. The marine facilities consist of two product berths, one single-
point mooring (SPM) and cross-country pipelines.

OPTIMIZATON OF PORT CAPACITY – A STUDY OF VADINAR OIL TERMINAL Page 15
The berths are located at Pathfinder Inlet creek, which lies between the two islands of
Kalubhar Tapu and Narara Bet. The pathfinder inlet is well sheltered from monsoon waves and
thereby permits uninterrupted navigation for ships approaching the berths. The jetty is capable of
handling vessels from 10,000 to 100,000DWT, and the SPM can accommodate 87,000 to
350,000DWT vessels.
2.3.1 FACILITIES
MARINE FACILITIES
FACILITIES JETTY LENGTH DRAFT DESIGN CAPACITY*
Jetty A 305m 20m 7 MMTPA
Jetty B 295m 16m 7 MMTPA
SPM NA 32m 27 MMTPA
*Basis Assumed Parcel Size
Tugs facility for towage and pilotage are provided by the Kandla Port.
The company operates tug and supporting crafts for marine support such as live diving, oil spill
detection and security.
SHORE FACILITIES
FACILITIES NUMBER OF UNITS CAPACITY
Crude storage tanks 13 and 3 slop tanks 1,136,800 KL
Product storage tanks
(liquid and gaseous products)
56 1,103,670 KL
Intermediate tanks 37 618,500 KL
2.3.2 CROSS-COUNTRY PIPELINES
Product pipelines: Products are transferred from the product intermediate tank (PIT) area
to the ships through pipelines and rigid loading arms. At Vadinar, three cross-country pipelines
OPTIMIZATON OF PORT CAPACITY – A STUDY OF VADINAR OIL TERMINAL Page 16
of 24" diameter and 21.5 km long have been laid through the pipeline corridor between the PIT
and marine terminal for the transfer and ship loading of various products.
Crude pipeline: The crude that is unloaded from the tanker at the SPM is directly
transferred to the crude oil tanker (COT) via the facility's 48" subsea and 48" onshore pipeline
laid through its piping corridor.
Completed construction of 3 HSD tankages of 1,80,000 KL capacity during the FY13.
2.3.3 SERVICES
Petroleum product handling at the two product jetties.
Crude handling is carried out at the SPM.
Pilotage: The Kandla Port Trust provides pilotage and tugs for the terminal's berthing /
unberthing operations.
SLOP RECEPTION
In compliance with MARPOL, a slop reception facility is available at both jetties.
SHORE LEAVE AND TRANSPORTATION
Crew change and shore leave facility is available with prior permission from the
concerned authorities.
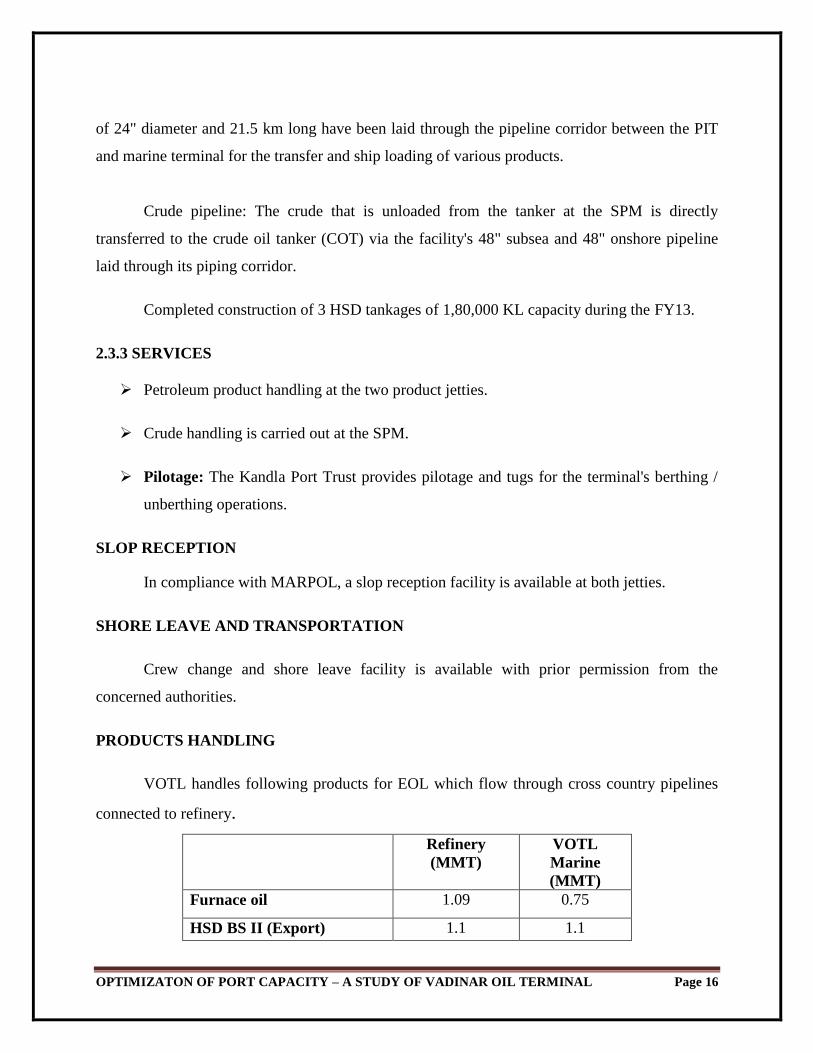
PRODUCTS HANDLING
VOTL handles following products for EOL which flow through cross country pipelines
connected to refinery.
Refinery
(MMT)
VOTL
Marine
(MMT)
Furnace oil 1.09 0.75
HSD BS II (Export) 1.1 1.1

OPTIMIZATON OF PORT CAPACITY – A STUDY OF VADINAR OIL TERMINAL Page 17
HSD BS III 6.09 3.96
HSD Euro IV 1.72 1.56
MS BS II (Export) 2.01 2.01
MS BS III 0.86 0.42
MS Euro IV 0.07 0.03
Naphtha 0.78 0.78
SKO 0.57 0.37
VGO 1.62 1.62
ATF 0.01 0
Bitumen 0.2 0
LPG 0.82 0
TOTAL 16.95 12.6
2.3.4 SAFETY AND SECURITY
5 Star rating by the British Safety Council for health and safety.
Winner of the Sword of Honour from British Safety Council for health and safety.
The following safety standards have been implemented and the terminal certified by
ABS/DNV:
ISO 9001:2008 for Quality Management.
ISO 14001:2004 for Environment Management.
OHSAS 18001:2007 for Occupational Health.
ISO/TS 29001:2010 for Quality Management – Petroleum Sector.
ISO 28000:2007 for Security Management.
5 Star rating in the Environmental Management System. It is the first facility to get a
double five star in its very first audit.
Winner of the Greentech Award for Safety Management.

OPTIMIZATON OF PORT CAPACITY – A STUDY OF VADINAR OIL TERMINAL Page 18
Vadinar continued to be award winning asset in the FY13 for the world class HSE
practices. Awards won during the year at India Shipping Summit, Gujarat Star Awards
and from the Royal Society for the Prevention of Accidents (RoSPA).
2.3.5 STATISTICS AND TARIFFS
The details of cargo handled in FY 2011-12 are as below (figures are in million metric
tonnes):
PARTICULARS FY 11 FY12 FY 13
Crude handling 13.20 12.18 16.49
Product handling
Jetty 8.70 8.29 12.60
Road 2.49 2.46 1.50
Rail 2.14 1.88 2.38
Gail pipeline 0.38 -- 0.46
Intermediate 3.14 6.40 6.40
TOTAL (MMT) 30.05 31.21 39.83
TARIFF
Wharfage for the handling of products at the marine terminal is as per the agreement
between Kandla Port Trust - Essar Oil Limited and Vadinar.
Pilotage and associated charges are as per the published scales of rates of the Kandla Port
Trust.
Port dues are as per the published scale of rates of the Kandla Port Trust.
2.3.6 VADINAR HIGHLIGHTS
OPTIMIZATON OF PORT CAPACITY – A STUDY OF VADINAR OIL TERMINAL Page 19
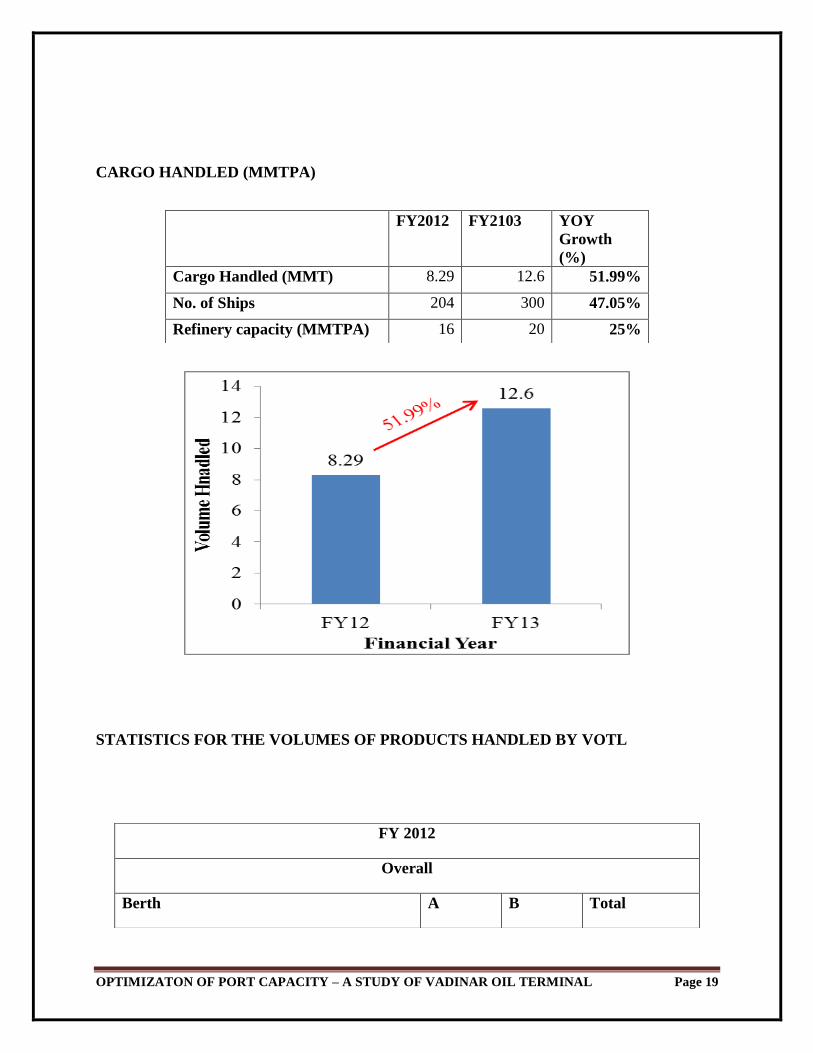
CARGO HANDLED (MMTPA)
STATISTICS FOR THE VOLUMES OF PRODUCTS HANDLED BY VOTL
FY2012 FY2103 YOY
Growth
(%)
Cargo Handled (MMT) 8.29 12.6 51.99%
No. of Ships 204 300 47.05%
Refinery capacity (MMTPA) 16 20 25%
FY 2012
Overall
Berth A B Total
OPTIMIZATON OF PORT CAPACITY – A STUDY OF VADINAR OIL TERMINAL Page 20
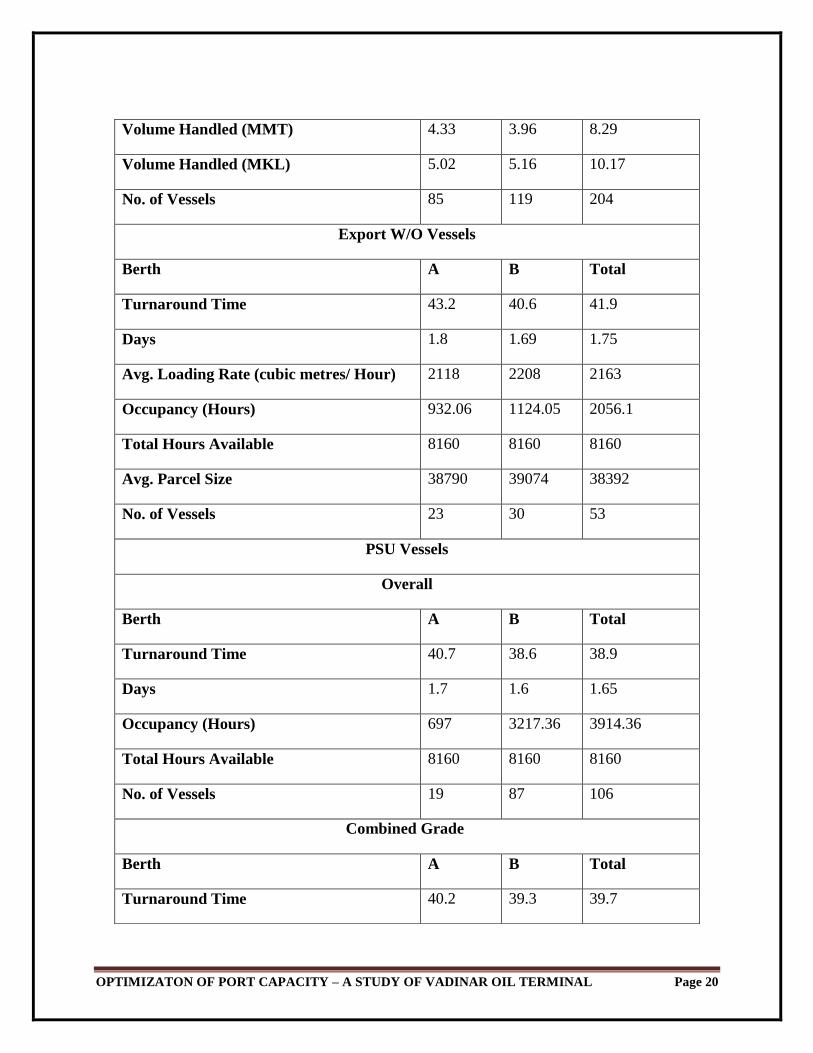
Volume Handled (MMT) 4.33 3.96 8.29
Volume Handled (MKL) 5.02 5.16 10.17
No. of Vessels 85 119 204
Export W/O Vessels
Berth A B Total
Turnaround Time 43.2 40.6 41.9
Days 1.8 1.69 1.75
Avg. Loading Rate (cubic metres/ Hour) 2118 2208 2163
Occupancy (Hours) 932.06 1124.05 2056.1
Total Hours Available 8160 8160 8160
Avg. Parcel Size 38790 39074 38392
No. of Vessels 23 30 53
PSU Vessels
Overall
Berth A B Total
Turnaround Time 40.7 38.6 38.9
Days 1.7 1.6 1.65
Occupancy (Hours) 697 3217.36 3914.36
Total Hours Available 8160 8160 8160
No. of Vessels 19 87 106
Combined Grade
Berth A B Total
Turnaround Time 40.2 39.3 39.7

OPTIMIZATON OF PORT CAPACITY – A STUDY OF VADINAR OIL TERMINAL Page 21
Days 1.7 1.6 1.65
Avg. Loading Rate (cubic metres/ Hour) 1626 1308 1467
Occupancy (Hours) 346.32 1818.5 2164.82
Total Hours Available 8160 8160 8160
Avg. Parcel Size 6929 25863 16396
No. of Vessels 38 58 96
Single Grade
Berth A B Total
Turnaround Time 41.3 37.7 39.5
Days 1.7 1.6 1.65
Avg. Loading Rate (cubic metres/ Hour) 1541 1589 1565
Occupancy (Hours) 350.28 1398.46 1748.7
Total Hours Available 8160 8160 8160
Avg. Parcel Size 27653 30027 28840
No. of Vessels 9 39 48
F.O Vessels
Berth A B Total
Turnaround Time 71.14 - 71.14
Days 2.96 - 2.96
Avg. Loading Rate (cubic metres/ Hour) 1344 - 1344
Occupancy (Hours) 3001.25 - 3001.25
Total Hours Available 8160 - 8160
Avg. Parcel Size 67975 - 67975

OPTIMIZATON OF PORT CAPACITY – A STUDY OF VADINAR OIL TERMINAL Page 22
No. of Vessels 43 - 43
V.G.O Vessels
Berth A B Total
Turnaround Time - - -
Days - - -
Avg. Loading Rate (cubic metres/ Hour) - - -
Occupancy (Hours) - - -
Total Hours Available - - -
Avg. Parcel Size - - -
No. of Vessels - - -
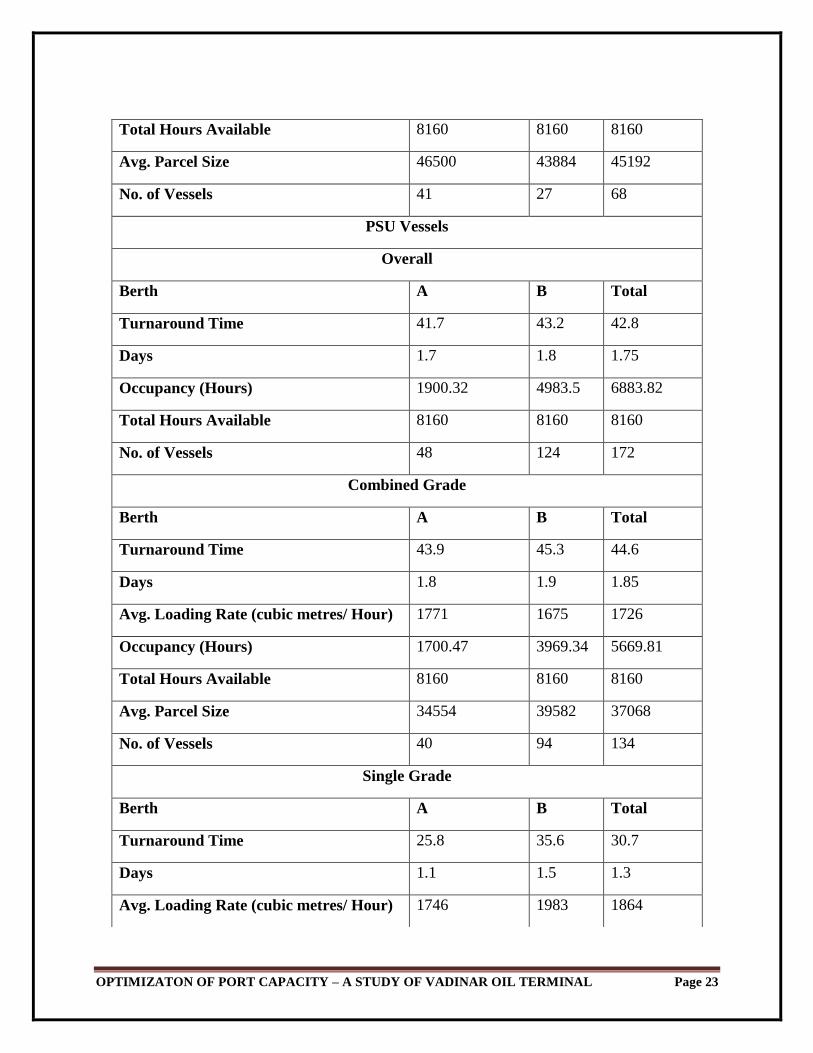
FY 2013
Overall
Berth A B Total
Volume Handled (MMT) 6.13 6.48 12.6
Volume Handled (MKL) 7.69 8.19 15.88
No. of Vessels 139 161 300
Export W/O Vessels
Berth A B Total
Turnaround Time 45.2 43.4 44.3
Days 1.89 1.81 1.85
Avg. Loading Rate (cubic metres/ Hour) 2274 2234 2254
Occupancy (Hours) 1792.59 1083.58 2876.2
OPTIMIZATON OF PORT CAPACITY – A STUDY OF VADINAR OIL TERMINAL Page 23
Total Hours Available 8160 8160 8160
Avg. Parcel Size 46500 43884 45192
No. of Vessels 41 27 68
PSU Vessels
Overall
Berth A B Total
Turnaround Time 41.7 43.2 42.8
Days 1.7 1.8 1.75
Occupancy (Hours) 1900.32 4983.5 6883.82
Total Hours Available 8160 8160 8160
No. of Vessels 48 124 172
Combined Grade
Berth A B Total
Turnaround Time 43.9 45.3 44.6
Days 1.8 1.9 1.85
Avg. Loading Rate (cubic metres/ Hour) 1771 1675 1726
Occupancy (Hours) 1700.47 3969.34 5669.81
Total Hours Available 8160 8160 8160
Avg. Parcel Size 34554 39582 37068
No. of Vessels 40 94 134
Single Grade
Berth A B Total
Turnaround Time 25.8 35.6 30.7
Days 1.1 1.5 1.3
Avg. Loading Rate (cubic metres/ Hour) 1746 1983 1864

OPTIMIZATON OF PORT CAPACITY – A STUDY OF VADINAR OIL TERMINAL Page 24
Occupancy (Hours) 199.45 1014.16 1213.6
Total Hours Available 8160 8160 8160
Avg. Parcel Size 20793 31819 26306
No. of Vessels 9 33 42
F.O Vessels
Berth A B Total
Turnaround Time 72.12 - 72.12
Days 3 - 3
Avg. Loading Rate (cubic metres/ Hour) 1438 - 1438
Occupancy (Hours) 1086.02 - 1086.02
Total Hours Available 8160 - 8160
Avg. Parcel Size 47107 - 47107
No. of Vessels 16 - 16
V.G.O Vessels
Berth A B Total
Turnaround Time 70.2 - 70.2
Days 2.92 - 2.92
Avg. Loading Rate (cubic metres/ Hour) 1631 - 1631
Occupancy (Hours) 1975.31 - 1975.31
Total Hours Available 8160 - 8160
Avg. Parcel Size 55832 - 55832
No. of Vessels 29 - 29
OPTIMIZATON OF PORT CAPACITY – A STUDY OF VADINAR OIL TERMINAL Page 25
CHAPTER 3- LITERATURE REVIEW AND REFERENCES
3.1 LITERATURE REVIEW
According to Osaretin, (2006)1, Sea-port operation is defined as cargo handling (or
moving) activity, performed by a designed company (gang or team), consisting of labor and
machines. It is also defined as the operation of a wharf and other port facilities, operation of port
passenger transport service, operation of cargo loading/unloading, haulage and warehousing
services within a port area and so on.
Presently, there is difficulty in defining port efficiency due to non-universal definition of
what indicates an efficient port or what port efficiency entails [3], an efficient sea-port should be
one that is competent in operations [3]. Based on this definition, efficiency of sea-port operations
is determined by duration (time) of ship's stay in a port, quality of cargo handling and quality of
service to inland transport vehicle during passage through the port [4]. Quality of cargo handling
is in the form of berth throughput and quality of service to inland vehicle is dependent on port
infrastructure. According to Tongzon and Heng (2005)2, Productivity has been identified as a
measure of sea-port operational efficiency.
TRUGILLO and NOMBELA (1999)5 stated that, there are various ways of measuring
port efficiency or productivity, although reducible to three categories: physical indicators, factor
productivity indicators and economical and financial indicators. Here in this study only physical
indicator has been discussed. Physical indicator generally refer to the time measures and are
mainly concerned with the ship (e.g. ship turnaround time, ship waiting time, berth occupancy
time, working time at berth).
Performance is the result of activities, strategic choices, allocation of resources and
ultimately operations deployed by an organisation over a given period of time. Measuring a
business performance provides a clear–cut image on how well this business functions comparing
to its predefined targets and/or comparing with its competitors. Following Bititci et al (2002)6,
businesses tend to measure performance in order to monitor and control; drive improvement;
OPTIMIZATON OF PORT CAPACITY – A STUDY OF VADINAR OIL TERMINAL Page 26
maximize the effectiveness of the improvement effort; achieve alignment with organizational
goals and objectives; and reward and discipline users/customers.
The most complicated and intricate problem existing in the transport field today is the
turnaround time of the ships in the ports. An excellent indicator to maintain of port effectiveness
is the quantity of cargo worked per ship hour in ports with a high figure being desirable [7].
The few studies that have examined the main determinant factors have particularly
stressed the importance of the cargo handled and the type of the ship in which they were carried.
Contrary to the belief that a subdivision into liquid bulk, solid bulk and general cargo may well
be sufficient, a far more detailed analysis of the cargo mix is required to grasp the essential
differences in productivity [8].
3.2 REFERENCES
1. P. A. Osaretin, "Efficient Port Operations and Benefits of Actors--A Case Study of Tin
Can Island Port, Nigeria," Masters Dissertation, Goteborg University, Gothenburg, 2006.
2. J. Tongzon and W. Heng, "Port Privatization, Efficiency and Competitiveness: Some
Empirical Evidence from Container Ports (Terminal)," Transportation Research, Part A,
Vol. 39, No. 5, 2005, pp. 405-424.
3. G. De Monie, "Measuring and Evaluating Port Performance and Productivity," CEPAL
Review, No. 99, 2009, p. 173.
4. B. A. Blonigen and W. W. Wilson, "New Measures of Port Efficiency Using
International Trade Data," NBER Working Paper No. 12052, 2006.
5. TRUGILLO, L and NOMBELA, G., 1999, Privatisation and Regulation of the Seaport
Industry. Policy Research Working Paper 2181. Washington, DC: The World Bank.
6. Bititci, U., Carrie, A. and Turner, T. (2002) „Integrated performance measurement
systems: Structure and dynamics‟, in Neely, A. (ed.) Business Performance
Measurement: Theory and Practice, Cambridge University Press, Cambridge.
OPTIMIZATON OF PORT CAPACITY – A STUDY OF VADINAR OIL TERMINAL Page 27
7. United Nations. United Nations Conference on Trade and Development. Port
Performance Indicators. 1976. (TD/B/C.4.131.Supp. 1/Rev.1).
8. Suykens, F. A Few Observations on Productivity in Seaport. Maritime Policy and
Management (Cardiff). Vol.10, No. 1, 17-40.
OPTIMIZATON OF PORT CAPACITY – A STUDY OF VADINAR OIL TERMINAL Page 28
CHAPTER 4- METHODOLOGY
4.1 RESEARCH METHODOLOGY
Research methodology is a way to systematically solve the research problem. It deals
with the various steps that are generally adopted by a researcher in studying the research problem
along with the logic behind them.
A broad definition of research is given by Martyn Shuttleworth - "In the broadest sense of
the word, the definition of research includes any gathering of data, information and facts for the
advancement of knowledge."
Another definition of research is given by Creswell who states - "Research is a process of
steps used to collect and analyze information to increase our understanding of a topic or issue". It
consists of three steps: Pose a question, collect data to answer the question, and present an
answer to the question.
The process used to collect information and data for the purpose of making business
decision. The methodology may include publication research, interviews, surveys and other
research techniques, and could include both present and historical information.
4.2 RESEARCH DESIGN
A research design is the arrangement of conditions for collection and analysis data in a
manner that aims to combine relevance to the research purpose with economy in procedure.
The type of research design selected for this study is Descriptive in nature. A descriptive
research uses a set of scientific methods and procedure to collect raw data structures that
describe the existing characteristics of a defined target population of a market structure. The data
and information generated through this descriptive design can provide the decision makers with
evidence that can leave to course of action.
Three main purposes of descriptive research are to describe, explain, and validate
findings. Description emerges following creative exploration, and serves to organize the findings
in order to fit them with explanations, and then test or validate those explanations (Krathwohl,
1993). The overall research design for the study is descriptive and analytical type.
OPTIMIZATON OF PORT CAPACITY – A STUDY OF VADINAR OIL TERMINAL Page 29
4.3 AREA OF THE STUDY
The area of the study selected is factors and elements involved in calculating and
optimizing port capacity in Vadinar Oil Terminal Ltd., located in Gujarat.
4.4 SOURCES OF DATA
Data collection is the process of obtaining information from the respondents. It can be
obtained from primary or secondary sources. Primary data are the data obtained first hand by the
researcher.
The sources of data in this study are primary in nature.
Here in this study the data is collected through primary sources. The data used here by
the researcher is taken from company record files and master data sheet prepared by the
company for its own internal uses which basically constitute the base for the planning and
managing the whole operations for optimizing its functioning. Small interviews were also
conducted under the permission of the related authority for the questions which arises while
analyzing the data and for the proper understanding of the operations carried out at VOTL.
Observation method was also used to gather the data and analyze the operations.
4.5 STATISTICAL TOOL USED
The following statistical tools are used in the study for the analysis and interpretation of
data.
Correlation and Regression.
4.6 DATA ANALYSIS
Data analysis plays an important role in any research because ultimately it is an apt
analysis that would be of great use to the organization. However the entered data has to be
prepared for the analysis and this was done by calculation the Throughput of the terminal for the
FY12 and FY13 and comparing it with actual Throughput. The following tool has been taken for
analyzing the data collected and interpreting them.

OPTIMIZATON OF PORT CAPACITY – A STUDY OF VADINAR OIL TERMINAL Page 30
4.7 CORRELATION AND REGRESSION
Correlation is the statistical tool which studies the relation between the two variables
and correlation analysis involves various methods and techniques used for studying and
measuring the extent of the relationship between the two variables.
“The two variables are said to be in correlation if the change in one of the variable results
in the change in other variable.’’
Regression analysis is used to predict the value of one variable (the dependent variable)
on the basis of other variables (the independent variables).
Dependent variable: denoted Y
Independent variables: denoted X1, X2, …, Xk
If we have only one independent variable then the model is
Y = a + bX
This is referred to as simple linear regression. The researchers would be interested in estimating
a and b from the data collected.
4.8 LIMITATIONS OF THE STUDY
The researcher may be biased on the part of respondents.
With the change in one factor, other factors also changes. But the researcher has
considered them constant.
While calculating berth occupancy VGO & FO are considered to be handled in both the
berth A & B whereas in actual it is handled only in berth A.
OPTIMIZATON OF PORT CAPACITY – A STUDY OF VADINAR OIL TERMINAL Page 31
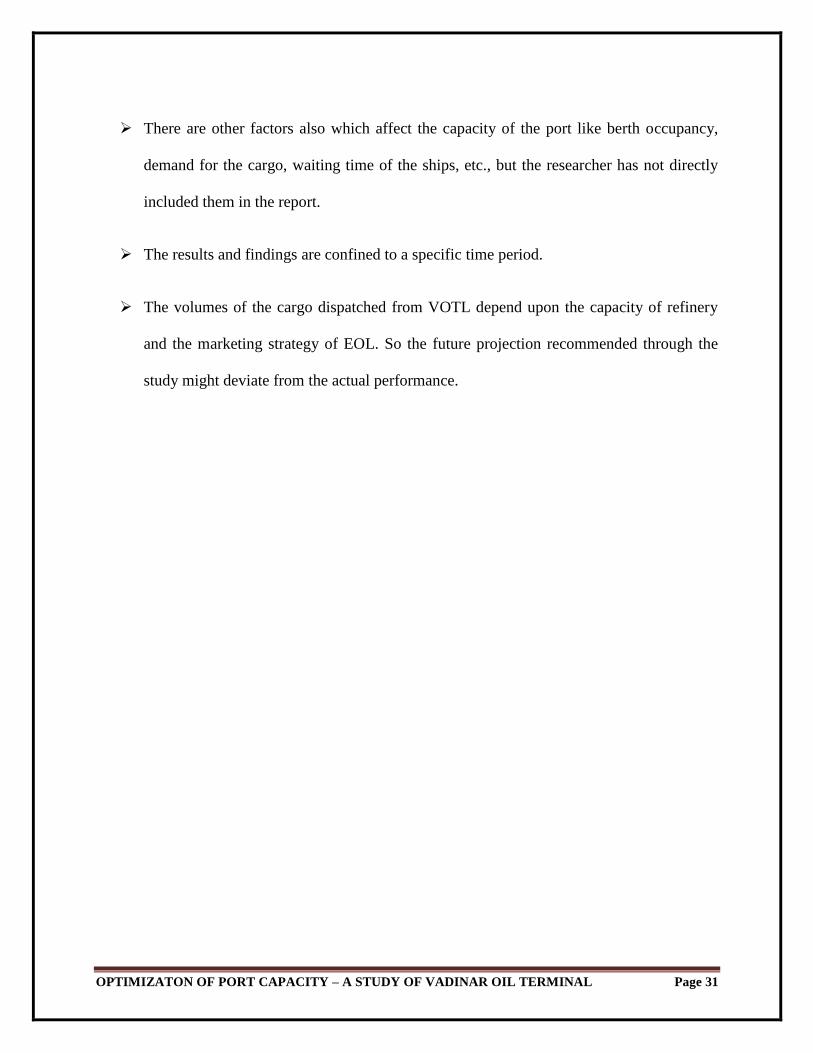
There are other factors also which affect the capacity of the port like berth occupancy,
demand for the cargo, waiting time of the ships, etc., but the researcher has not directly
included them in the report.
The results and findings are confined to a specific time period.
The volumes of the cargo dispatched from VOTL depend upon the capacity of refinery
and the marketing strategy of EOL. So the future projection recommended through the
study might deviate from the actual performance.

OPTIMIZATON OF PORT CAPACITY – A STUDY OF VADINAR OIL TERMINAL Page 32
CHAPTER 5- ANALYSIS AND INTERPRETATION
The term analysis refers to the computation of certain measure along with searching for
patterns of relationship that exist among data – groups. In the process of analysis, relationships
or differences supporting or conflicting with original with what validity data can be said to
indicate any conclusions. Analysis of data in general way involves a number of closely related
operations which are performed with the purpose of summarizing the collected data and
organizing there in such a manner that they answer the research questions.
The objectives of the study on the basic of which analysis and interpretation are done are
as follows:
5.1 To determine the factors which affect capacity, efficiency and throughput of an oil terminal.
5.2 To check the accuracy of the data provided by the company by calculating terminal
throughput and berth occupancy.
5.3 To know the effect of change in each factor on terminal throughput when other factors
remains constant and determining the percentage contribution of each factor on throughput.
5.4 To project how much VOTL can handle effectively when pumping capacity from PIT is
100% utilized.
5.1 DETERMINING FACTORS WHICH AFFECT PORT CAPCITY, EFFICIEENCY
AND THROUGHPUT
Every port/ terminal want to determine its efficiency and throughput in order to take
decisions regarding its operations and management and to make it capable of taking on the
competition it face from other ports/terminals.
Here question arises on what factors the capacity, efficiency and throughput of a
port/terminal depend?
The answer is a number of factors which may vary port to port or terminal to terminal.
OPTIMIZATON OF PORT CAPACITY – A STUDY OF VADINAR OIL TERMINAL Page 33
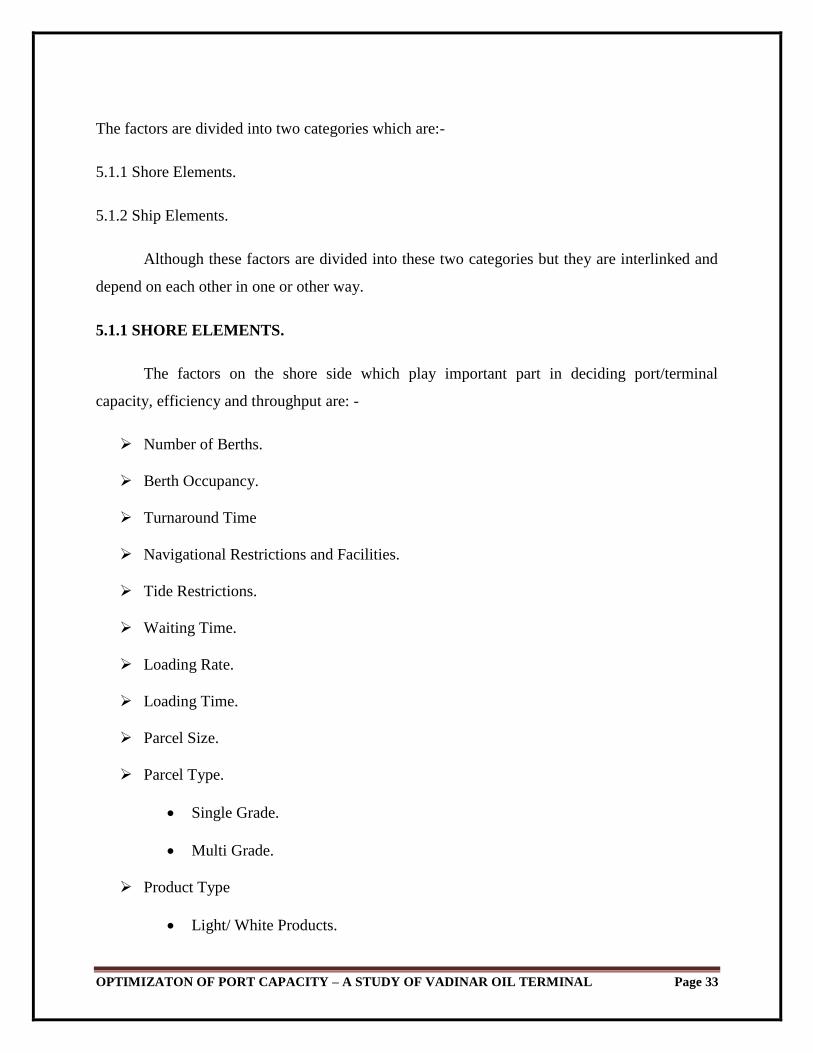
The factors are divided into two categories which are:-
5.1.1 Shore Elements.
5.1.2 Ship Elements.
Although these factors are divided into these two categories but they are interlinked and
depend on each other in one or other way.
5.1.1 SHORE ELEMENTS.
The factors on the shore side which play important part in deciding port/terminal
capacity, efficiency and throughput are: -
Number of Berths.
Berth Occupancy.
Turnaround Time
Navigational Restrictions and Facilities.
Tide Restrictions.
Waiting Time.
Loading Rate.
Loading Time.
Parcel Size.
Parcel Type.
Single Grade.
Multi Grade.
Product Type
Light/ White Products.
OPTIMIZATON OF PORT CAPACITY – A STUDY OF VADINAR OIL TERMINAL Page 34
Heavy/ Black Products.
Shore Infrastructure.
Numbers & Configuration of Loading Arms.
Storage Capacity.
Pumping Capacity & Rate.
Compliance with various Regulations and Guidelines.
Communication between the stakeholders.
5.1.2 SHIP ELEMENTS.
Only shore elements cannot decide the port/terminal capacity, efficiency and throughput,
there are various factors on the ship side which play a significant role in deciding these.
Following are the Factors:-
Ship Operator.
Age of Ship.
Ship Size.
Tank Size.
Type of Ship.
Number of Tanks.
Concurrent De-Ballasting Capability.
Ship Venting Capability.
Number of Manifolds.
Capacity of Each Manifold.
OPTIMIZATON OF PORT CAPACITY – A STUDY OF VADINAR OIL TERMINAL Page 35
5.2 TO CHECK THE ACCURACY OF THE DATA PROVIDED BY THE COMPANY
BY CALCULTING TERMINAL THROUGHPUT AND BERTH OCCUPANCY.
ASSUMPTIONS
Calculations based to sustain maximum annually evacuation projection by EOL through
Vadinar Oil Terminal in mmtpa.
Calculations are based on number of vessels handled in a year and loading rate achieved
by VOTL.
Ships are available at 1st day of Laycan.
Certified cargo is available as per shipping schedule.
No delays on account of unforeseen incidents i.e. product contamination, additional time
incurred on pigging/flushing.
Efficiency Factor is been calculated by dividing actual loading rate achieved with the
maximum pumping capacity of PIT.

OPTIMIZATON OF PORT CAPACITY – A STUDY OF VADINAR OIL TERMINAL Page 36
FY 2011 – 12 TOTAL
Annual
Throughput
[mmtpa] 0.38 0.49 0.05 2.92 - 1.64 0.25 - 1.73 0.82 8.29
Annual
Throughput
[mmtpa] 384484.
3
488842.2 54917.8 2922940.
7
- 1635868.
6
252062.
0
- 1731681.
6
815044.
3 8285841.
5
Product
details
SKO Naphtha HSD
(Export)
FO VGO MS
(Export)
MS BS
III
MS Euro
IV
HSD BS
III
HSD
Euro IV
-
Specific
Gravity
0.78 0.6838 0.8285 0.9292 0.852
8
0.709 0.7205 0.719
8
0.8152 0.8184 -
Parcel Size [tonne] 24030.3 28755.4 54917.8 67975.4 - 44212.7 25206.2 - 33954.5 28105.0
No. of VSL 16 17 1 43 - 37 10 - 51 29 204
Turnaround Time at Oil Terminal
Rated Loading
Rate
[m3/hr] 1700 4000 4000 2000 - 4000 1700 - 4000 4000
Rated Loading
Rate
[tph] 1326.0 2735.2 3314.0 1858.4 - 2836.0 1224.9 - 3260.8 3273.6
Efficiency
Factor
0.819 0.550 0.552 0.680 - 0.547 0.836 - 0.450 0.386
Max Loading
Rate
[m3/hr] 1700 4000 4000 2000 2000 4000 1700 4000 4000 4000
Effective
Loading Rate
[m3/hr] 1392.9 2201.0
8
2207.2
5
1359.47 - 2189.68 1421.93 - 1798.51 1543.4
Effective
Loading Rate
[tph] 1086.46 1505.1
0
1828.7
1
1263.22 - 1552.48 1024.50 - 1466.15 1263.12
Loading Time [hrs] 22.12 19.11 30.03 53.81 - 28.48 24.60 - 23.16 22.25 223.557
POB to Loading [hrs] 4 4 4 4 - 4 4 - 4 4
Connecting
Loading Arm
[hrs] 1 1 1 1 - 1 1 - 1 1
Disconnecting
Loading Arm
[hrs] 1 1 1 1 - 1 1 - 1 1
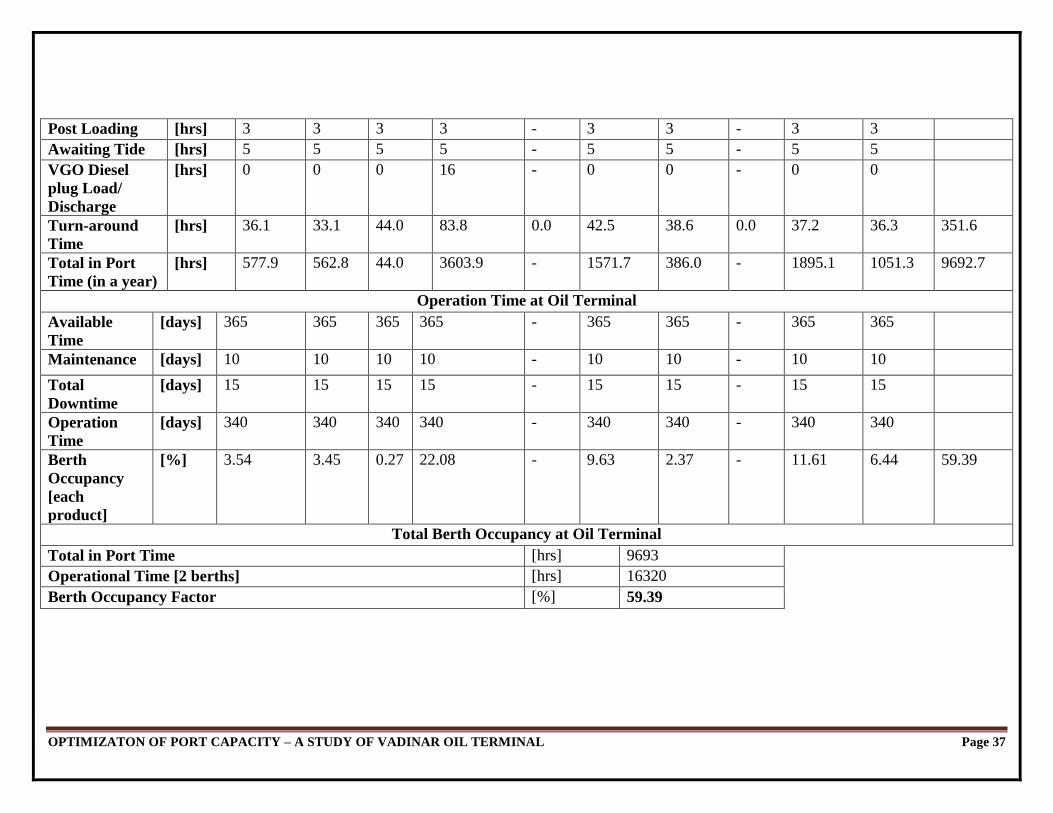
OPTIMIZATON OF PORT CAPACITY – A STUDY OF VADINAR OIL TERMINAL Page 37
Post Loading [hrs] 3 3 3 3 - 3 3 - 3 3
Awaiting Tide [hrs] 5 5 5 5 - 5 5 - 5 5
VGO Diesel
plug Load/
Discharge
[hrs] 0 0 0 16 - 0 0 - 0 0
Turn-around
Time
[hrs] 36.1 33.1 44.0 83.8 0.0 42.5 38.6 0.0 37.2 36.3 351.6
Total in Port
Time (in a year)
[hrs] 577.9 562.8 44.0 3603.9 - 1571.7 386.0 - 1895.1 1051.3 9692.7
Operation Time at Oil Terminal
Available
Time
[days] 365 365 365 365 - 365 365 - 365 365
Maintenance [days] 10 10 10 10 - 10 10 - 10 10
Total
Downtime
[days] 15 15 15 15 - 15 15 - 15 15
Operation
Time
[days] 340 340 340 340 - 340 340 - 340 340
Berth
Occupancy
[each
product]
[%] 3.54 3.45 0.27 22.08 - 9.63 2.37 - 11.61 6.44 59.39
Total Berth Occupancy at Oil Terminal
Total in Port Time [hrs] 9693
Operational Time [2 berths] [hrs] 16320
Berth Occupancy Factor [%] 59.39

OPTIMIZATON OF PORT CAPACITY – A STUDY OF VADINAR OIL TERMINAL Page 38
FY 2012 - 13 TOTAL
Annual
Throughput
[mmtpa] 0.37 0.78 1.10 0.75 1.62 2.01 0.42 0.03 3.96 1.56 12.60
Annual
Throughput
[mmtpa] 367024 780501 1095528 753658 1619119 2014925 418503 34504 395990
1
1560091 1260375
9
Product Type
SKO Naphtha HSD
(Export)
FO VGO MS
(Export)
MS BS
III
MS
Euro
IV
HSD
BS III
HSD
Euro IV
Specific
Gravity
0.78 0.6838 0.8285 0.9292 0.8528 0.709 0.7205 0.7198 0.8152 0.8184
Parcel
Size
[tonne] 30585.4 31220.1 52168.0 47103.7 55831.7 54457.4 14946.6 17252.
1
43998.9 39002.3
No. of
VSL
12 25 21 16 29 37 28 2 90 40 300
Turnaround Time At Oil Terminal
Rated
Loading Rate
[m3/hr] 1700 4000 4000 2000 2000 4000 1700 4000 4000 4000
Rated
Loading Rate
[tph] 1326 2735 3314 1858 1706 2836 1225 2879 3261 3274
Efficiency
Factor
0.976 0.553 0.558 0.702 0.835 0.580 0.901 0.452 0.489 0.472
Max
Pumping
Rate [PIT]
[m3/hr] 1700 4000 4000 2000 2000 4000 1700 4000 4000 4000
Effective
Loading Rate
[m3/hr] 1660 2210.
1
2233.8
1
1404 1670 2320 1532.36 1807.1 1957 1886.11
Effective
Loading Rate
[tph] 1294.8 1511.
3
1850.7 1304.6 1424.2 1644.9 1104.1 1300.8 1595.3 1543.6
Loading
Time
[hrs] 23.6 20.7 28.2 36.1 39.2 33.1 13.5 13.3 27.6 25.3 260.5
POB to [hrs]

OPTIMIZATON OF PORT CAPACITY – A STUDY OF VADINAR OIL TERMINAL Page 39
Loading 4 4 4 4 4 4 4 4 4 4
Connecting
Loading Arm
[hrs] 1 1 1 1 1 1 1 1 1 1
Disconnecting
Loading Arm
[hrs] 1 1 1 1 1 1 1 1 1 1
Post Loading [hrs] 3 3 3 3 3 3 3 3 3 3
Awaiting Tide [hrs] 5 5 5 5 5 5 5 5 5 5
VGO Diesel
plug Load/
Discharge
[hrs] 0 0 0 16 16 0 0 0 0 0
Turn-around
Time
[hrs] 37.6 34.7 42.2 66.1 69.2 47.1 27.5 27.3 41.6 39.3 432.5
Total in Port
Time (in a
year)
[hrs] 451.5 866.5 885.9 1057.7 2006.9 1743.0 771.1 54.5 3742.2 1570.7 13149.8
Operation Time At Oil Terminal
Available Time [days] 365 365 365 365 365 365 365 365 365 365
Maintenance [days] 10 10 10 10 10 10 10 10 10 10
Total
Downtime
[days] 15 15 15 15 15 15 15 15 15 15
Operation
Time
[days] 340 340 340 340 340 340 340 340 340 340
Berth
Occupancy
[each product]
[%] 2.77 5.31 5.43 6.48 12.30 10.68 4.72 0.33 22.93 9.62 80.57
Total Berth Occupancy At Oil Terminal
Total In Port Time [hrs] 13150
Operational Time [2 berths] [hrs] 16320
Berth Occupancy Factor [%] 80.57

OPTIMIZATON OF PORT CAPACITY – A STUDY OF VADINAR OIL TERMINAL Page 40
5.3 TO KNOW THE EFFECT OF CHANGE IN EACH FACTOR ON TERMINAL
THROUGHPUT WHEN OTHER FACTORS REMAINS CONSTANT AND
DETERMINING THE PERCENTAGE CONTRIBUTION OF EACH FACTOR ON
THROUGHPUT.
TABLE - 1
5.3.1 EFFECT OF LOADING RATE ON THE THROUGHPUT.
Loading Rate [X] Throughput [Y] X2 XY
1295 0.367 1677025 475.265
1511 0.78 2283121 1178.58
1851 1.095 3426201 2026.845
1305 0.753 1703025 982.665
1424 1.619 2027776 2305.456
1645 2.015 2706025 3314.675
1104 0.418 1218816 461.472
1300 0.034 1690000 44.2
1595 3.959 2544025 6314.605
1544 1.56 2383936 2408.64
14574 12.6 21659950 19512.403

OPTIMIZATON OF PORT CAPACITY – A STUDY OF VADINAR OIL TERMINAL Page 41
From the above table the value of R = 0.5208 indicates that the loading rate and the throughput
are positively related and the relation is strong. The value of R2 = 0.2712 states that 27.12% of
the total variation in the throughput is explained by the loading rate. Thus it indicates that there
are some other factors which also have some effect on the throughput alongwith loading rate.
CHART - 1
Correlation
Equation
b a Coefficient of
Correlation (R)
R2
Y = a + bX .00273739 -2.729472562 0.52080339 0.27123617

OPTIMIZATON OF PORT CAPACITY – A STUDY OF VADINAR OIL TERMINAL Page 42
When loading rate will increase throughput will also increase, other factors
remaining constant.
With the rise in loading rate efficiency of the berth will also increase.
TABLE - 2
5.3.2 EFFECT OF LOADING TIME ON THE THROUGHPUT.
Loading Time [X] Throughput [Y] X2
XY
23.62 0.367 557.9044 8.66854
20.66 0.78 426.8356 16.1148
28.19 1.095 794.6761 30.86805
36.11 0.753 1303.9321 27.19083
30.2 1.619 912.04 48.8938
33.11 2.015 1096.2721 66.71665
13.54 0.418 183.3316 5.65972
13.26 0.034 175.8276 0.45084
27.58 3.959 760.6564 109.18922
25.27 1.56 638.5729 39.4212
251.54 12.6 6850.0488 353.17365
OPTIMIZATON OF PORT CAPACITY – A STUDY OF VADINAR OIL TERMINAL Page 43
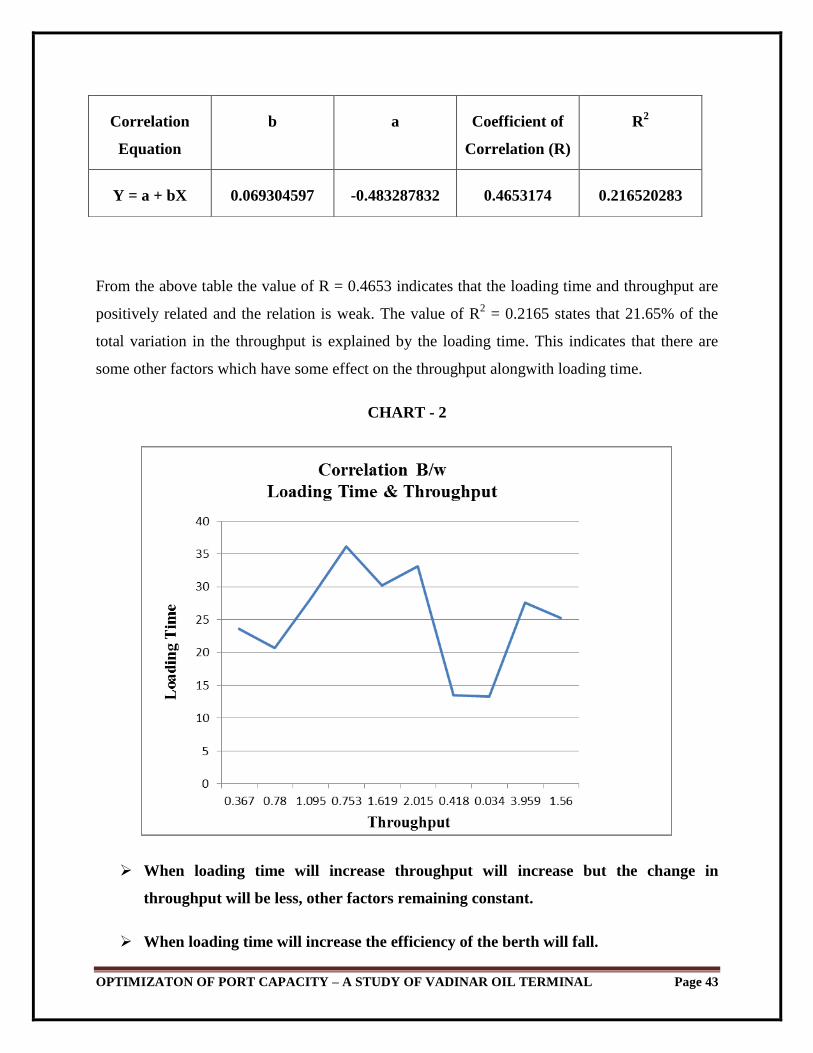
From the above table the value of R = 0.4653 indicates that the loading time and throughput are
positively related and the relation is weak. The value of R2 = 0.2165 states that 21.65% of the
total variation in the throughput is explained by the loading time. This indicates that there are
some other factors which have some effect on the throughput alongwith loading time.
CHART - 2
When loading time will increase throughput will increase but the change in
throughput will be less, other factors remaining constant.
When loading time will increase the efficiency of the berth will fall.
Correlation
Equation
b a Coefficient of
Correlation (R)
R2
Y = a + bX 0.069304597 -0.483287832 0.4653174 0.216520283
OPTIMIZATON OF PORT CAPACITY – A STUDY OF VADINAR OIL TERMINAL Page 44
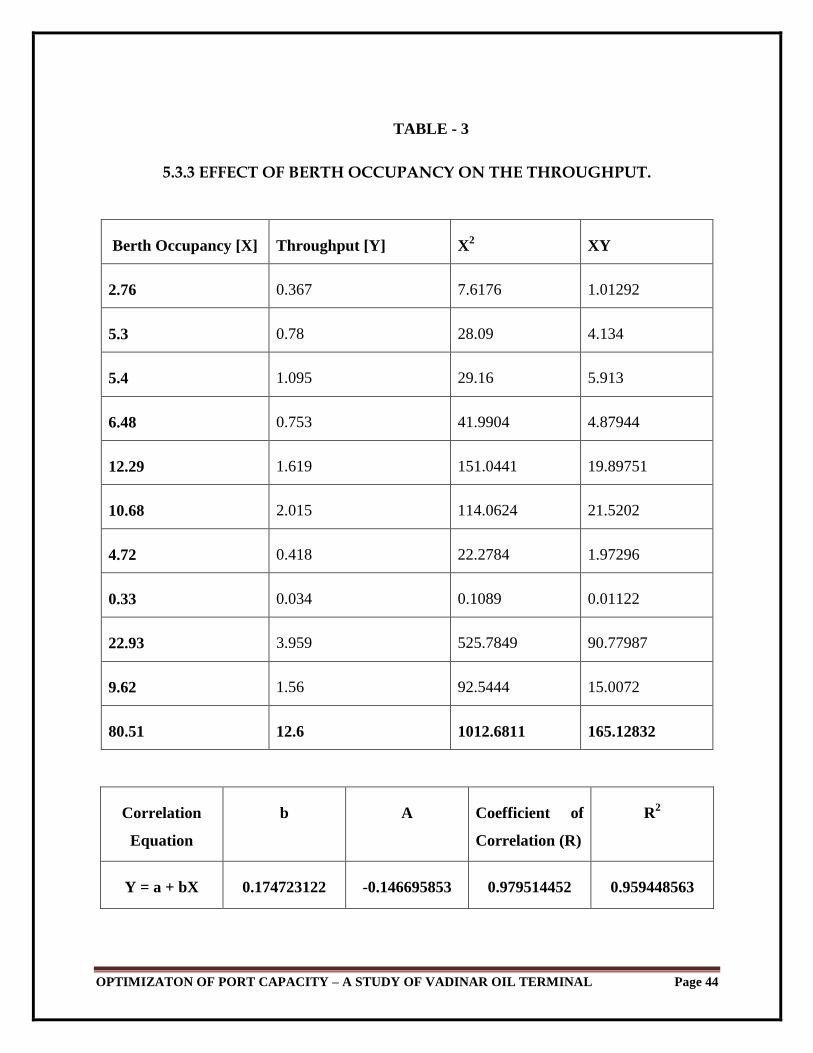
TABLE - 3
5.3.3 EFFECT OF BERTH OCCUPANCY ON THE THROUGHPUT.
Berth Occupancy [X] Throughput [Y] X2
XY
2.76 0.367 7.6176 1.01292
5.3 0.78 28.09 4.134
5.4 1.095 29.16 5.913
6.48 0.753 41.9904 4.87944
12.29 1.619 151.0441 19.89751
10.68 2.015 114.0624 21.5202
4.72 0.418 22.2784 1.97296
0.33 0.034 0.1089 0.01122
22.93 3.959 525.7849 90.77987
9.62 1.56 92.5444 15.0072
80.51 12.6 1012.6811 165.12832
Correlation
Equation
b A Coefficient of
Correlation (R)
R2
Y = a + bX 0.174723122 -0.146695853 0.979514452 0.959448563
OPTIMIZATON OF PORT CAPACITY – A STUDY OF VADINAR OIL TERMINAL Page 45
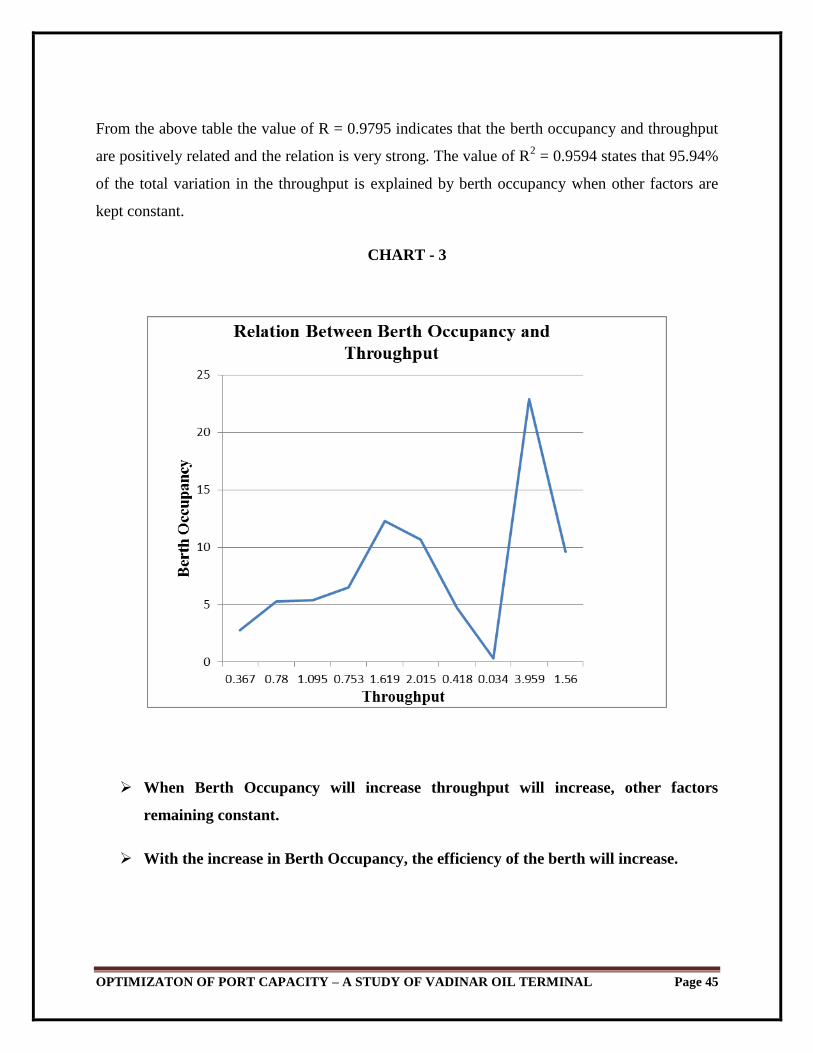
From the above table the value of R = 0.9795 indicates that the berth occupancy and throughput
are positively related and the relation is very strong. The value of R2 = 0.9594 states that 95.94%
of the total variation in the throughput is explained by berth occupancy when other factors are
kept constant.
CHART - 3
When Berth Occupancy will increase throughput will increase, other factors
remaining constant.
With the increase in Berth Occupancy, the efficiency of the berth will increase.
OPTIMIZATON OF PORT CAPACITY – A STUDY OF VADINAR OIL TERMINAL Page 46
5.4 TO PROJECT HOW MUCH VOTL CAN HANDLE EFFECTIVELY WHEN
PUMPING CAPACITY FROM PIT IS 100% UTILIZED.
ASSUMPTIONS:
In the table 5.4.1 loading time is assumed to be same as in Financial year 2013 for each
product.
In the table 5.4.2 loading time is calculated through unitary method by converting loading
time at 80% berth occupancy to loading time at 70% berth occupancy
80 % -------- 261 Days
Therefore 70 % ------- (261*70)/80 = 228.37 Days
In both the tables Total Port time of each product is calculated through the ratio of
effective loading rate.
5.4.1 WHEN PUMPING CAPACITY FROM PIT IS 100% ACHIEVED WITH BERTH
OCCUPANCY OF 80.57% [AS PER FY – 13]

OPTIMIZATON OF PORT CAPACITY – A STUDY OF VADINAR OIL TERMINAL Page 47
Total
Annual
Throughput
[mmtpa] 1.0 1.5 2.2 1.8 1.9 2.8 0.4 0.7 2.3 1.9 16.6
Annual
Throughput
[mmtpa] 101266
9
147592
3
2181738 183859
3
189427
3
2814106 43198
3
68099
1
233838
5
188326
4 1655192
4
Product Type
SKO Naphtha HSD
(Export)
FO VGO MS
(Export)
MS BS
III
MS
Euro
IV
HSD
BS III
HSD
Euro
IV
Specific Gravity 0.78 0.6838 0.8285 0.9292 0.8528 0.709 0.7205 0.7198 0.8152 0.8184
Parcel Size [tonne] 31824 48823 64954 66902 66518 79550 17148 28072 69618 58311
No. of VSL 32 30 34 27 28 35 25 24 34 32 302
Turnaround Time At Oil Terminal
Max Pumping
Rate [PIT]
[m3/hr] 1700 4000 4000 2000 2000 4000 1700 4000 4000 4000
Effective
Loading Rate
(assumed)
[m3/hr] 1700 3400 2800 2000 2000 3400 1700 3000 3050 2850
Effective
Loading Rate
[tph] 1326 2325 2320 1858 1706 2411 1225 2159 2486 2332
Loading Time [hrs] 24 21 28 36 39 33 14 13 28 25
POB to Loading [hrs] 4 4 4 4 4 4 4 4 4 4
Connecting
Loading Arm
[hrs] 1 1 1 1 1 1 1 1 1 1
Disconnecting
Loading Arm
[hrs] 1 1 1 1 1 1 1 1 1 1
Post Loading [hrs] 3 3 3 3 3 3 3 3 3 3
Awaiting Tide [hrs] 5 5 5 5 5 5 5 5 5 5
VGO Diesel
plug
Load/Discharge
[hrs] 0 0 0 16 16 0 0 0 0 0

OPTIMIZATON OF PORT CAPACITY – A STUDY OF VADINAR OIL TERMINAL Page 48
Turn-around
Time
[hrs] 38 35 42 66 69 47 28 27 42 39
Total in Port
Time (in a year)
[hrs] 1209 1058 1411 1814 1965 1663 705 655 1411 1260 13150
Operation Time At Oil Terminal
Available Time [days] 365 365 365 365 365 365 365 365 365 365
Maintenance [days] 10 10 10 10 10 10 10 10 10 10
Total Downtime [days] 15 15 15 15 15 15 15 15 15 15
Operation Time [days] 340 340 340 340 340 340 340 340 340 340
Total Berth Occupancy At Oil Terminal
Total In Port Time [hrs] 13150
Operational Time [2 berths] [hrs] 16320
Berth Occupancy Factor [%] 80.576
5.4.2 WHEN PUMPING CAPACITY FROM PIT IS 100% ACHIEVED WITH BERTH OCCUPANCY OF 70% [AS PER FY - 13]
Total
Annual
Throughput
[mmtpa] 0.52 2.00 1.99 0.81 0.65 2.18 0.42 1.68 2.34 2.02 14.6
Annual
Throughput
[mmtpa] 515738 2000304 1989978 80698
8
645731 2177333 42318
8
168087
5
234053
0
201552
2 14596192.
4
Product Type
SKO Naphtha HSD
(Export)
FO VGO MS
(Export)
MS
BS III
MS
Euro
IV
HSD
BS III
HSD
Euro
IV
Specific
Gravity
0.78 0.6838 0.8285 0.929
2
0.8528 0.709 0.720
5
0.7198 0.8152 0.8184
Parcel Size [tonne] 19896.
7
61166.1 60897.0 39081
.7
32919.
2
65757.5 16977
.0
52766.8 69955.7 61562.4

OPTIMIZATON OF PORT CAPACITY – A STUDY OF VADINAR OIL TERMINAL Page 49
No. of VSL 26 33 33 21 20 33 25 32 33 33 288
Turnaround Time At Oil Terminal
Max Pumping
Rate [PIT]
[m3/hr] 1700 400
0
4000 2000 2000 4000 1700 4000 4000 4000
Effective
Loading Rate
[m3/hr] 1700 340
0
2800 2000 2000 3400 1700 3000 3050 2850
Effective
Loading Rate
[tph] 1326 232
5
2320 1858 1706 2411 1225 2159 2486 2332
Loading Time [hrs] 15 26 26 21 19 27 14 24 28 26
POB to
Loading
[hrs] 4 4 4 4 4 4 4 4 4 4
Connecting
Loading Arm
[hrs] 1 1 1 1 1 1 1 1 1 1
Disconnecting
Loading Arm
[hrs] 1 1 1 1 1 1 1 1 1 1
Post Loading [hrs] 3 3 3 3 3 3 3 3 3 3
Awaiting Tide [hrs] 5 5 5 5 5 5 5 5 5 5
VGO Diesel
plug Load/
Discharge
[hrs] 0 0 0 16 16 0 0 0 0 0
Turn-around
Time
[hrs] 29 40 40 51 49 41 28 38 42 40 400
Operation Time At Oil Terminal
Available
Time
[days] 365 365 365 365 365 365 365 365 365 365
Maintenance [days] 10 10 10 10 10 10 10 10 10 10
Total
Downtime
[days] 15 15 15 15 15 15 15 15 15 15
Operation
Time
[days] 340 340 340 340 340 340 340 340 340 340
OPTIMIZATON OF PORT CAPACITY – A STUDY OF VADINAR OIL TERMINAL Page 50
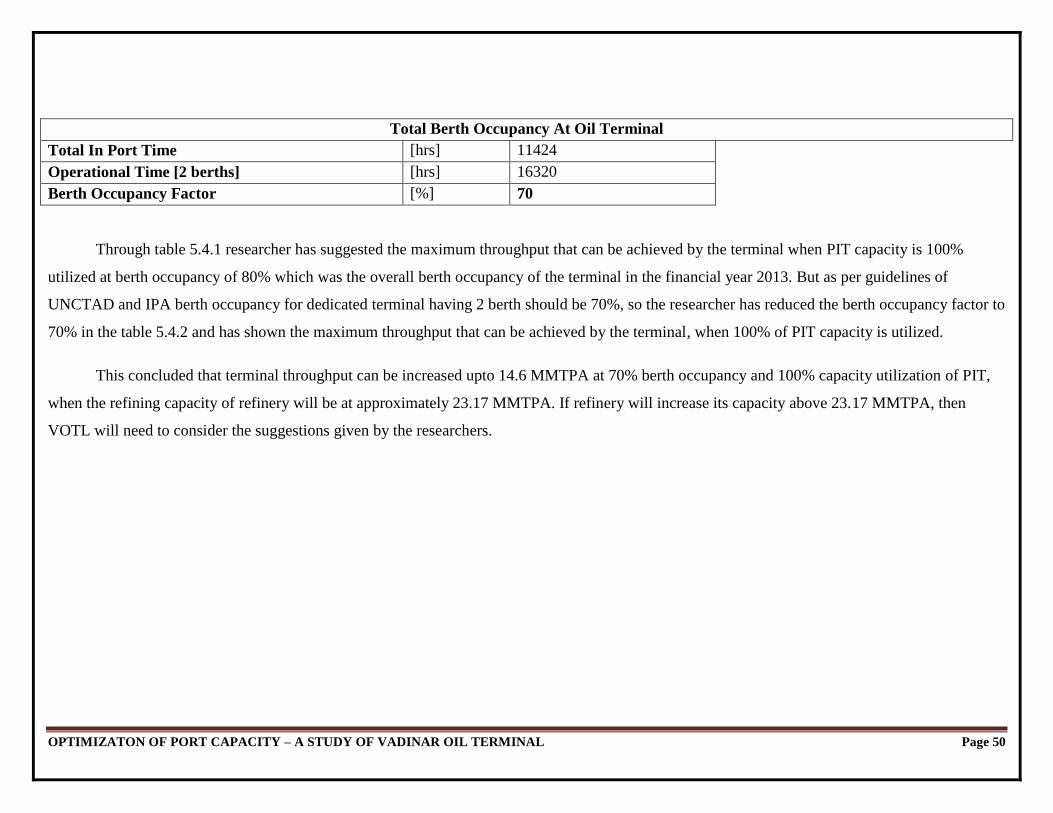
Total Berth Occupancy At Oil Terminal
Total In Port Time [hrs] 11424
Operational Time [2 berths] [hrs] 16320
Berth Occupancy Factor [%] 70
Through table 5.4.1 researcher has suggested the maximum throughput that can be achieved by the terminal when PIT capacity is 100%
utilized at berth occupancy of 80% which was the overall berth occupancy of the terminal in the financial year 2013. But as per guidelines of
UNCTAD and IPA berth occupancy for dedicated terminal having 2 berth should be 70%, so the researcher has reduced the berth occupancy factor to
70% in the table 5.4.2 and has shown the maximum throughput that can be achieved by the terminal, when 100% of PIT capacity is utilized.
This concluded that terminal throughput can be increased upto 14.6 MMTPA at 70% berth occupancy and 100% capacity utilization of PIT,
when the refining capacity of refinery will be at approximately 23.17 MMTPA. If refinery will increase its capacity above 23.17 MMTPA, then
VOTL will need to consider the suggestions given by the researchers.
OPTIMIZATON OF PORT CAPACITY – A STUDY OF VADINAR OIL TERMINAL Page 51
5.5 FINDINGS
Determining Port/ Terminal throughput is a complex task and involves a number of
factors.
All the factors are not of same significance but their contribution towards Terminal
throughput cannot be neglected.
Loading rates are dependent on the specific gravity of each product. So loading rate of
each product should be defined separately as per its specific gravity.
At present the terminal is operating at overall berth occupancy of 80% and efficiency of
more than 90%.
Terminal efficiency is directly linked with the total Terminal throughput.
Efficiency of a Terminal will decrease if loading time and Ship turnaround time
increases.
Terminal efficiency will increase with increase in loading rate.
Terminal efficiency is strongly explained by the berth occupancy when other factors are
kept constant but in reality every factor changes and thus the relation between the berth
occupancy and throughput loses its characteristics.
One connection for installing loading arms for black and white product each is available
at Berth A and one connection for installing loading arm for white product is available at
Berth B.
Communication between terminal and PIT area is one of the most significant factors for
efficient operations.
Use of latest technologies is one another factor for increasing the efficiency of operations
at a dedicated terminal.

OPTIMIZATON OF PORT CAPACITY – A STUDY OF VADINAR OIL TERMINAL Page 52
Although loading rates of terminal up to 2500 m3/Hr./Line are available but cannot be
fully utilized due to restrictions like less ship loading rate, multigrade consignment,
pipeline restrictions and pumping capacity of PIT area.
All the safety and security measures are followed strictly helping VOTL to avoid
accidents and loss of working hours (both machine and men) and thus saving the cost
implications. Till 30th
June, 2013 there were 2472 accident free days.
Capacity of loading arm is greater than pumping capacity of PIT area.
In order to increase throughput of the terminal, pumping capacity of PIT area should be
increased by increasing the size of the product tanks.
Delay in operations due to mixing of grades resulted due to human error, interruption in
loading for changing product line, pigging and draining of loading arm in case of
multigrade consignment.
There is loss of time in operations and money in the form of deadfreight due to diesel
plugging of VGO pipeline. This operation requires at least 14 hours which increases berth
occupancy but decreases the efficiency and throughput. The deadfreight paid depend
upon the freight rates which vary with each consignment.
5.6 SUGGESTIONS
In order to increase the efficiency of Terminal, Effective loading rate should be increased
which can be done if ships with high loading intake rate are berthed on Berth B instead of
Berth A and vice versa.
Pumping capacity of Loading arm is greater than the pumping capacity of the PIT area,
so in order to increase the port throughput pumping capacity has to be increased from the
PIT by increasing the sizes of product tanks.

OPTIMIZATON OF PORT CAPACITY – A STUDY OF VADINAR OIL TERMINAL Page 53
There should be a dedicated cross-country pipeline for Diesel as it is the one product with
maximum production at refinery and transportation through the jetty. In FY 13, 6.62
MMT of diesel was dispatched through jetty.
There is space and connections available on berths for installing new loading arms which
should be utilized to increase overall loading rate.
The loss of time and money can be avoided if the FO/VGO pipeline is insulated which
will save the time of operations and dead freight payment to ships. This time then can be
utilized to serve other ships or other useful work on the berth like maintenance of loading
arms which will increase efficiency and thus throughput of the terminal
As terminal is having 80% berth occupancy and 90% efficiency, so in order to increase
the capacity of the terminal and maintain its efficiency, to cope up with the increasing
capacity of the refinery, either VOTL can install more loading arms as connections are
available or has to develop the new berth for white products as the demand is more than
black products.
5.7 CONCLUSION
This study has provided an insight to the functioning of a dedicated oil terminal and
various operations which are carried out there for safe and efficient functioning of the terminal.
This study also provided an insight on the various elements which are important part of day to
day functions alongwith the operations part.
Through this study it is concluded that parcel size, loading rate, no. of vessels & average
loading time are the four main pillars on which berth throughput stands and in order to bring it
equivalent to actual capacity, those four pillars should be kept in focus. Researcher has
determined the effect of each factor on throughput by using correlation. This will help Vadinar
oil Terminal to focus on those factors and maintain its present terminal efficiency which is 90%
even if capacity of refinery is increased in future. As per the study Essar refinery had capacity of
10 MMTPA in FY 10, 14MMTPA in FY 11, 16MMTPA in FY 12 & 20MMTPA in FY 13, this
shows consistent increase in the capacity of the refinery each year and it has also been proposed

OPTIMIZATON OF PORT CAPACITY – A STUDY OF VADINAR OIL TERMINAL Page 54
by the refinery to increase up to 34MMTPA in near future. This study will help VOTL in
identifying the barriers it will face in order to increase its berth throughput and will show the
way to achieve optimum capacity in order to cope up with the capacity of the refinery. This study
also bring forward the cost incurred in the form of dead freight payment to ships and time lost in
the diesel plugging operation. VOTL can also focus on these problems to save cost and time and
thus helping it in optimizing operations and costs and thus being more efficient.

OPTIMIZATON OF PORT CAPACITY – A STUDY OF VADINAR OIL TERMINAL Page 55
BIBLIOGRAPHY
“Essar Ports.” Essarports.com. Web. 27 May 2013.
<http://www.essarports.com/vadinaroilterminal/facelities.>
“Essar Ports.” Essarnet.com. Web. 27 May, 2013.
<http://www.essarnet.com/ports/vadinaroilterminal/statistics.>
“Vadinar Oil Terminal.” Essarports.com. Web. 27 May 2013.
<http://www.essarports.com/vadinaroilterminal>.
“Port capacity.” Definitions.net. STANDS4 LLC, 2013. Web. 2 Jun 2013.
<http://www.definitions.net/definition/port capacity>.
“Throughput.” Definitions.net. STANDS4 LLC, 2013. Web. 2 Jun 2013.
<http://www.definitions.net/definition/throughput>.
“Port capacity.” Unctad.org. Web. 28 May, 2013.
<http:www.unctad.org/publications/portperformanceindicators>.
“Efficiency.” Businessdictionary.com Web. 29 May, 2013.
<http://www.businessdictionary.com/definition/efficiency.html>
Wikipedia.org.
UNCTAD.org
UNCTAD Monographs on Port Management.
UNCTAD Monograph on Operations Planning in Ports.
UNCTAD Monograph on Measuring and Evaluating Port Performance and Productivity.
UNCTAD Manual on a Uniform System of Port Statistics and Performance Indicators.