internet of things for indoor farming
TRANSCRIPT

INTERNET OF THINGS FOR INDOOR FARMING
By
CHONG KAI CHIAN
150ACB3270
A REPORT
SUBMITTED TO
Universiti Tunku Abdul Rahman
in partial fulfillment of the requirements
for the degree of
BACHELOR OF INFORMATION TECHNOLOGY (HONS)
COMMUNICATIONS AND NETWORKING (CN)
Faculty of Information and Communication Technology(FICT)
(Perak Campus)
JANUARY 2018

UNIVERSITI TUNKU ABDUL RAHMAN

INTERNET OF THINGS FOR INDOOR FARMING
By
CHONG KAI CHIAN
150ACB3270
A REPORT
SUBMITTED TO
Universiti Tunku Abdul Rahman
in partial fulfillment of the requirements
for the degree of
BACHELOR OF INFORMATION TECHNOLOGY (HONS)
COMMUNICATIONS AND NETWORKING (CN)
Faculty of Information and Communication Technology(FICT)
(Perak Campus)
JANUARY 2018

i BCN (Hons) Communication and Networking
Faculty of Information and Communication Technology (Perak Campus), UTAR
UNIVERSITI TUNKU ABDUL RAHMAN
FACULTY OF INFORMATION & COMMUNICATION
TECHNOLOGY (PERAK CAMPUS)
CHECKLIST FOR FYP1 THESIS SUBMISSION
Student Id
Student Name
Supervisor Name
TICK
(√)
DOCUMENT
Title Page
Signed form of the Declaration of Originality
Abstract
Table of Contents
List of Figures (if applicable)
List of Tables (if applicable)
List of Symbols (if applicable)
List of Abbreviations (if applicable)
Chapters / Content
Bibliography (or References)
All references in bibliography are cited in the thesis, especially in the
chapter of literature review
Appendices (if applicable)
Poster
Signed Turnitin Report (Plagiarism Check Result – Form Number: FM-
IAD-005)
*Include this form (checklist) in the thesis (Bind together as page 2)
______________________ ____________________
(Signature of Student) (Signature of Supervisor)
Date: Date:

ii BCN (Hons) Communication and Networking
Faculty of Information and Communication Technology (Perak Campus), UTAR
DECLARATION OF ORIGINALITY
I declare that this report entitled “Internet of Things For Indoor Farming” is my own work
except as cited in the references. The report has not been accepted for any degree and is not
being submitted concurrently in candidature for any degree or other award.
Signature : _________________________
Name : CHONG KAI CHIAN_______
Date : 10th April 2018______________

iii BCN (Hons) Communication and Networking
Faculty of Information and Communication Technology (Perak Campus), UTAR
ACKNOWLEDGEMENTS
I would like to express my sincere thanks and appreciation to my supervisors, Dr. Goh
Hock Guan who has given me this bright opportunity to engage in IoT-based project.
It is my first step to establish a career in embedded network and IoT application. A
million thanks to you and appreciate your helpful guidance along the project goes.
Then, I would like to thank my dearest course mate Johnson Khong, Chow Wen Chai
and Low Kim Ching as they teach me lots for the study. Finally, I must say thanks to
my parents and my family for their love, support and continuous encouragement
throughout the course.

iv BCN (Hons) Communication and Networking
Faculty of Information and Communication Technology (Perak Campus), UTAR
ABSTRACT
This paper proposed an indoor farming method integrated with the concept of the
Internet of Things (IoT). The traditional agriculture might be vulnerable to the climate
change. This is because, since the crops or plants are grown in an outdoor field, they
are exposed to the natural environment. As they have their optimal temperature and
conditions to grow, a climate change may bring a huge loss to the farmer because the
productivity might have a significant drop as resulted by the climate change. At the
same time, during traditional agriculture, most of the farmers are using their
experience and prediction for the agriculture work and this may decrease the food
productivity as well. Furthermore, the large-size field will requires more labour to
manage the field but this does not guarantee an increase in food production.
Thus, indoor farming environment is designed to provide a stable condition which
suitable for the plants or crops to grow. To achieve that, the concept of precision
agriculture is a “MUST”. By implementing different types of sensors such as the
temperature and air humidity sensors, we will able to monitor the field parameters and
these data will be sent to the Cloud for a real-time display purpose. At the same time,
if the parameters are out of a pre-defined threshold value, the Raspberry Pi as the IoT
gateway which receives the data from the sensors will issue the command to trigger
the actuator in the field to make adjustment or control the abnormal parameter. On the
other hand, the system will perform the irrigation system automatically by using the
timers. To conclude, this project is expected to establish a smart environment that is
suitable for indoor farming and able to reduce the labour cost and labour daily task yet
increase the productivity and efficiency.

v BCN (Hons) Communication and Networking
Faculty of Information and Communication Technology (Perak Campus), UTAR
Table of Contents
INTERNET OF THINGS FOR INDOOR FARMING ............................................................... i
INTERNET OF THINGS FOR INDOOR FARMING ............................................................. iii
DECLARATION OF ORIGINALITY ...................................................................................... ii
ABSTRACT .............................................................................................................................. iv
LIST OF FIGURES ................................................................................................................ viii
LIST OF TABLES ..................................................................................................................... x
LIST OF ABBREVIATION ...................................................................................................... x
Chapter 1: Introduction .............................................................................................................. 1
1.1 Problem Statements and Motivation .......................................................................... 3
1.2 Objectives .................................................................................................................. 5
1.3 Project Scope ............................................................................................................. 6
1.4 Expected Contribution from the Project .................................................................... 7
1.5 Report Organisation ................................................................................................... 8
Chapter 2: Literature Review ..................................................................................................... 9
2.1 IoT infrastructure ....................................................................................................... 9
2.2 Raspberry Pi ............................................................................................................. 10
2.3 Light Spectrum......................................................................................................... 13
2.4 Review on the Existing Systems/Applications ........................................................ 14
2.4.1 Application of Wireless Sensor Networks for Greenhouse Parameter Control in
Precision Agriculture ....................................................................................................... 14
2.4.2 Precision Agriculture Monitoring System using Wireless Sensor Network and
Raspberry Pi Local Server ............................................................................................... 15
2.4.3 Design and Simulation of a Wireless Sensor Network Greenhouse-Monitoring
System Based on 3G Network Communication .............................................................. 16
2.4.4 Wireless Sensor Based Remote Monitoring System for Agriculture Using
ZigBee and GPS ............................................................................................................... 16
2.5 Critical remarks of previous works .......................................................................... 18
Paper 2: Precision Agriculture Monitoring System using Wireless Sensor Network
and Raspberry Pi Local Server. (Flores et al., 2017) ....................................................... 18
Chapter 3: System Methodology ............................................................................................. 20
3.1 System Development Models .................................................................................. 20
3.1.1 Agile Model ......................................................................................................... 20
3.1.2 Waterfall Model ................................................................................................... 21

vi BCN (Hons) Communication and Networking
Faculty of Information and Communication Technology (Perak Campus), UTAR
3.1.3 Selected Model ..................................................................................................... 22
3.2 System Requirement ................................................................................................ 23
3.3 Functional Requirement ................................................................................................. 27
3.4 Project Milestone ........................................................................................................... 28
3.5 Cost and Budget ............................................................................................................. 29
3.6 Concluding Remark ....................................................................................................... 30
Chapter 4: System Design ........................................................................................................ 31
4.1 System Architecture ................................................................................................. 31
4.2 Functional Modules in the System ................................................................................. 33
4.2.1 The Sensor Module ................................................................................................. 33
4.2.2 The Camera Module ............................................................................................... 34
4.2.3 The Fan Module ...................................................................................................... 35
4.2.4 The Irrigation Module ............................................................................................. 36
4.3 System Flow .................................................................................................................. 37
4.4 GUI Design .................................................................................................................... 39
4.5 Concluding Remark ....................................................................................................... 40
Chapter 5: System Implementation .......................................................................................... 41
5.1 Hardware Implementation ............................................................................................. 41
5.2 Software Implementation ............................................................................................... 47
5.2.1 Install MobaXterm .................................................................................................. 47
5.2.2 Installing Apache web server .................................................................................. 48
5.2.3 Installing Screen ...................................................................................................... 49
5.2.4 Installing fswebcam ................................................................................................ 50
5.3 Setting and Configuration .............................................................................................. 50
5.3.1 Python program ....................................................................................................... 50
5.3.2 HTML content ........................................................................................................ 54
5.3.3 Dashboard customization ........................................................................................ 54
5.3.4 Others ...................................................................................................................... 57
5.4 System Operation ........................................................................................................... 59
5.5 Concluding Remarks ...................................................................................................... 62
Chapter 6: System Evaluation and Discussion ........................................................................ 63
6.1 System Testing and Evaluation .................................................................................. 63
6.2 Objective Evaluation .................................................................................................. 64

vii BCN (Hons) Communication and Networking
Faculty of Information and Communication Technology (Perak Campus), UTAR
6.3 SWOT ........................................................................................................................ 65
Chapter 7: Conclusion and Recommendation .......................................................................... 66
7.1 Conclusion ................................................................................................................. 66
7.2 Recommendation ....................................................................................................... 66
Reference ................................................................................................................................. 67
Appendices ............................................................................................................................. A-1
Appendix A: Bi-weekly Report ......................................................................................... A-1
Appendix B: Poster ............................................................................................................. B-1
Appendix C: Plagiarism Check Summary .......................................................................... C-1

viii BCN (Hons) Communication and Networking
Faculty of Information and Communication Technology (Perak Campus), UTAR
LIST OF FIGURES
Figure Number Title Page
Figure 1-1-1 The world population from 1965-2050 3
Figure 2-1-1 IoT infrastructure 9
Figure 2-2-1 Raspberry Pi 2 model B 10
Figure 2-2-2 Raspbeery Pi 2 GPIO pin diagram 11
Figure 2-2-3 SPI bus topology 12
Figure 2-3-1 Absorption spectra of Chlorophyll. 13
Figure 2-4-1-1 Sensor and structure of greenhouse 14
Figure 2-4-4-1 The proposed system architecture in section 2.3.4 17
Figure 3-1-1 The agile system development life cycle (SDLC) model 20
Figure 3-1-2 The waterfall system development life cycle (SDLC)
model.
21
Figure 4-1 System overview 31
Figure 4-2-1 The flowchart of sensor module 33
Figure 4-2-2 The flowchart of camera module 34
Figure 4-2-3 The flowchart of fan module 35
Figure 4-2-4 The flowchart of irrigation module 36
Figure 4-3-1 The flowchart of python program 37
Figure 4-4-1 GUI design of the html file in local web services 39
Figure 4-4-2 GUI Design of the dashboard 40
Figure 5-1-1 The system prototype 41
Figure 5-1-2 The RPi and 4-channel relay module 42
Figure 5-1-3 The DHT11 sensor and FC-28 sensor comparator board. 42
Figure 5-1-4 The FC-28 soil moisture sensor. 43
Figure 5-1-5 The 9V motor 44
Figure 5-1-6 Raspberry Pi wiring diagram. 45
Figure 5-2-1-1 MobaXterm website 47
Figure 5-2-1-2 SSH session setup. 47
Figure 5-2-2-1 Testing apache web server. 48
Figure5-2-3-1 Screen is installed successfully. 49

ix BCN (Hons) Communication and Networking
Faculty of Information and Communication Technology (Perak Campus), UTAR
Figure 5-2-3-2 Reconnect to screen instance. 50
Figure 5-3-1-1 Python program content page 1. 51
Figure 5-3-1-2 Python program content page 2. 52
Figure 5-3-1-3 Python program content page 3. 53
Figure 5-3-2-1 HTML content. 54
Figure 5-3-3-1 Data source 1 for Dashboard 54
Figure 5-3-3-2 Data source 2 for Dashboard 55
Figure 5-3-3-3 Dashboard pane for Humidity. 55
Figure 5-3-3-4 Dashboard pane for Humidity trend. 56
Figure 5-3-3-5 Dashboard pane for Temperature. 56
Figure 5-3-3-6 Dashboard pane for Temperature trend. 56
Figure 5-3-3-7 Dashboard pane for Time. 57
Figure 5-3-3-8 Dashboard pane for soil condition. 57
Figure 5-3-4-1 Shell script camera.sh 58
Figure 5-3-4-2 Process list 58
Figure 5-3-4-3 Kill unwanted process. 58
Figure 5-4-1 The running program in Terminal. 59
Figure 5-4-2 Sensor and Fan modules in Terminal. 59
Figure 5-4-3 Fan switched-off. 60
Figure 5-4-4 Fan switched-on. 60
Figure 5-4-5 Irrigation switched-on. 61
Figure 5-4-6 Web hosted in local Apache web server. 61
Figure 5-4-7 The Dashboard. 62

x BCN (Hons) Communication and Networking
Faculty of Information and Communication Technology (Perak Campus), UTAR
LIST OF TABLES
Table Number Title Page
Table 2-5-1 Summarized strengths and limitations of previous works 18
Table 3-2-1 Hardware and software requirements of this project 23
Table 3-4-1 The gantt chart of project task during FYP 1 28
Table 3-4-2 The gantt chart of project task during FYP 2 29
Table 3-5-1 Cost plan 29
Table 5-1-1 Pin connection between RPi, relay and sensor.
46
LIST OF ABBREVIATION
3G Third generation of mobile network
ADC Analogue-digital-converter
CMS Central Monitoring Station
𝐶𝑂2 Carbon dioxide
COM Commom
GPIO General purpose input/output
GPRS General Packet Radio Service
GSM Global System for Mobile Communication
GUI Graphical User Interface
𝐼2𝐶 Inter-Integrated Circuit
IoT Internet of Things
NO Normal Open
PA Precision Agriculture
RFID Radio Frequency Identification
RPi Raspberry Pi
SDLC System Development Life Cycle
SPI Serial Peripheral Protocol
TCP/IP Transmission control protocol/Internet protocol

CHAPTER 1 INTRODUCTION
1 BCN (Hons) Communication and Networking
Faculty of Information and Communication Technology (Perak Campus), UTAR
Chapter 1: Introduction
The term “the Internet of Things” (IoT) was coined by Kevin Ashton, the co-
founder of MIT’s Auto-ID Center in 1999 (Tozzi, C., 2016). IoT is a system of
interrelated computing devices, mechanical and digital machines, objects, animals
or people that are provided with unique identifiers and the ability to transfer data
over a network without requiring human-to-human or human-to-computer
interaction. The first idea of Ashton on IoT was focused on using radio frequency
identification (RFID) technology to connect the devices together. But, now, IoT is
primarily relies on IP networking for the information exchange between devices.
This is because the introduction of IPv6 has resulted in a huge increase in address
space and enables the humans to assign an IP address to every “thing” in order to
let them communication to each other.
On the other hand, indoor farming is a way of growing the plants entirely indoors
and it is usually related to greenhouse. This is because this farming method
mostly deploys the artificial lights to replace the sunlight and implements some
growing methods such as hydroponics to provide the plants the nutrients and
other basic requirements for growth. This farming method has a significant
improvement then before as the plants and crops are not exposed to the
uncontrollable natural environment. Moreover, the scale can be large or small,
and a wide variety of plants can be grown indoors such as the vegetables, herb,
spices and fruits. With a more advance way, indoor farming nowadays is mostly
related to the concept of precision agriculture.
As mentioned above, the precision agriculture (PA), is a farming management
concept based on observing, measuring and responding to inter and intra-field
variability in crops. For examples, predictive analytics can be performed to make
a smarter decision based on the real-time data on weather, soil and air quality,
crop maturity and even equipment and labour costs and availability. PA is
provisioned to improve the agriculture yields, reduce the fertilizer cost and
pollution through poor use of chemicals and provide better information for
management decision.

CHAPTER 1 INTRODUCTION
2 BCN (Hons) Communication and Networking
Faculty of Information and Communication Technology (Perak Campus), UTAR
However, there is a key enabler to the previous mentioned PA in order to make
the PA to function well. It is the sensor. Undeniably, the PA will uses numerous
types of data such as the temperature, air and soil humidity and even the nitrogen
content of the soil to perform the predictive analytics and also some follow-up
action. Thus, the sensor is playing the most important role in the PA and cannot
be replaced or ignored.
As summary, this project proposes an indoor farming method with the concept of
IoT and PA. By implementing different types of sensors within the farming
environment, the project system is expected to perform some automatic processes
such as maintaining the temperature and humidity parameters, perform irrigation
procedure and able to present the environment situation such as by an image and
numerical values of the parameters to the user.
CHAPTER 1 INTRODUCTION
3 BCN (Hons) Communication and Networking
Faculty of Information and Communication Technology (Perak Campus), UTAR
1.1 Problem Statements and Motivation
The traditional agriculture has few limitations in terms of the crop yields, the crop
resilience to climate changes, the field size required and the labour cost.
The traditional agriculture may vulnerable to the food shortage crisis. This is
because the farmers used to predict the crops’ condition, the weather, the harvest
time and other important aspects based on their working experiences. However,
these working experiences and predictions are not always correct and perfect.
Sometimes, it will results a poorer performance in terms of the productivity and
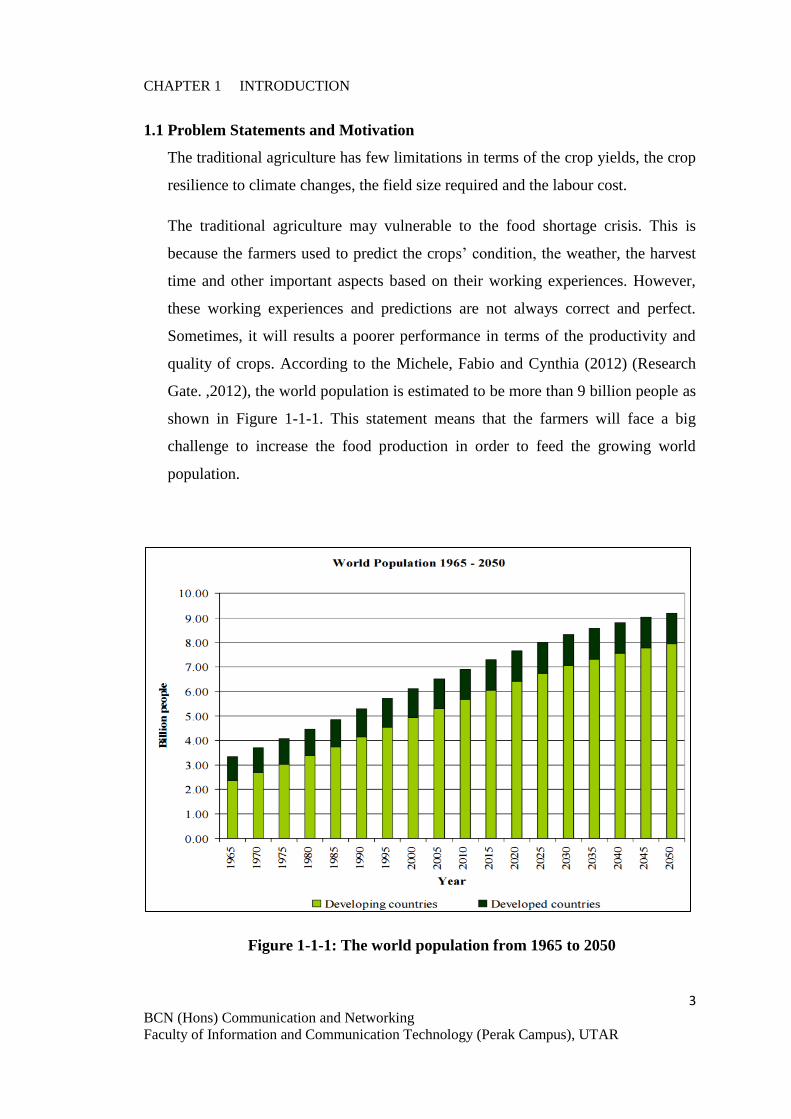
quality of crops. According to the Michele, Fabio and Cynthia (2012) (Research
Gate. ,2012), the world population is estimated to be more than 9 billion people as
shown in Figure 1-1-1. This statement means that the farmers will face a big
challenge to increase the food production in order to feed the growing world
population.
Figure 1-1-1: The world population from 1965 to 2050

CHAPTER 1 INTRODUCTION
4 BCN (Hons) Communication and Networking
Faculty of Information and Communication Technology (Perak Campus), UTAR
Furthermore, the crops in the outdoor field are vulnerable to the climate change.
Every plants are having their specific living environment’ requirements
respectively and these requirements can eventually affect the food supply
significantly. The reason is that the changes of optimal temperature for crops’
growth due to the climate change will lead to the decline of crop yields. For
instant, the premature budding due to a warm winter caused $220 million in losses
of Michigan cherries in 2012. (National Climate Assessment, 2014)
Besides that, during traditional agriculture, the plantation field size is very huge.
This is a challenge to future agriculture as more and more free spaces need to be
developed into plantation field for agriculture purposes only. However, the
production of food might not directly proportional to the increase of plantation
fields due to certain reason such as the climate changes mentioned above. At the
same time, a large field would require a large number of labours during the
monitoring process. To conclude, the traditional agriculture might be inefficient in
terms of the land utilisation and labour cost.

CHAPTER 1 INTRODUCTION
5 BCN (Hons) Communication and Networking
Faculty of Information and Communication Technology (Perak Campus), UTAR
1.2 Objectives
As to enhance the situation that traditional agriculture encountered, lot of efforts
has been done for improvement. The objectives of this project are:
1. To establish an indoor farming environment.
2. To provide the real-time monitoring system on crops and farming
environment parameter.
3. To establish a simple user interface for the users to view the data and control
the environment remotely.
4. To provide an automatic irrigation system.
5. To reduce the labour daily duty.
6. To implement simple analytics and produces helpful information for decision
making.
Since the indoor farming environment will implement the concept of precision
agriculture, there is a need to capture and record the environment situation and their
changes from time to time. Thus, the sensors will play their roles to gather their
respective data and send to the central control unit. The control unit will then further
sending the data to the Cloud for storage and provide and a simple user interface to
the user. The user interface provides an interaction method to the user to monitor the
farm and perform some control mechanism such as to change the environment
parameter explicitly. At the same time, the system will implement an automatic
irrigation system with a timer manner and other control-modules controlled by the
control unit. It is expected to reduce the labour daily duty such as to monitor and
water the crops with lesser efforts and time-consumed. Furthermore, the system is
expected to perform some simple analytics based on the data captured and produce
the helpful information for decision making such as to determine whether the
environment parameters suitable for certain type of crops or are the crops ready to be
harvest.

CHAPTER 1 INTRODUCTION
6 BCN (Hons) Communication and Networking
Faculty of Information and Communication Technology (Perak Campus), UTAR
1.3 Project Scope
In this project, it mainly focuses to 3 major parts which are to build a real-time
monitoring system, a simple GUI for the user and a remote-control system.
For the real-time monitoring system, the sensors will be allocated at specific
points within the indoor farming area. The sensors are connected to the central
control unit. Each time the sensors successfully captured the data, they will send
the data to control unit and the control unit will be responsible to send it to the
Cloud. For the information, the data captured would relate to the temperature and
air humidity. These data will then be shown to the user through the user computer
with the GUI.
From the perspective of user, the data is kept in a Cloud service provider named
dweet.io and it can be used to show the data and information sent by the sensor
nodes. The system is having a simple GUI to show the data and giving the user an
option to make adjustment to the environment condition such as the temperature.
At the same time, the system is expected to implement the data analysis to
produce some meaningful information which is useful for decision making.
Back to the indoor farming area, the camera module and irrigation system are
perform in a timer-manner such that the camera will take screenshot every
specific period of time whereas the soil moisture sensor will detect the soil
moisture every few seconds to activate or deactivate the irrigation system.

CHAPTER 1 INTRODUCTION
7 BCN (Hons) Communication and Networking
Faculty of Information and Communication Technology (Perak Campus), UTAR
1.4 Expected Contribution from the Project
According to Chakraborty and Newton (2011), in order to meet the demand of the
world’s population by 2050, the global food production must increase by 50%. In
his words, 25% of the world’s cereal production will be affected by the climate
change as it will increase the uncertainty over the availability of water and
affecting the pests and pathogen impacts. Also, it might destroy they optimal
growth environment for the crops. Thus, this project suggest a stable indoor
farming environment which does not vulnerable to climate change and a system
used to control the farming environment which provide the increase the
productivity and work efficiency of the labour.
Firstly, instead of using the experience to make predictions, the sensors provide
the farmers a more reliable statistic which is closed to the actual value of the
critical information such as the environment temperature for decision making
process. Then, the indoor farming environment can be designed with control
feature to enable the remote-controlling of the environment condition. As an
example, if the sensors detect the temperature is not within the optimal
temperature, the system is able to adjust the temperature back to the normal level.
Moreover, on one hand, indoor farming of PA by vertical farming is small-field-
size friendly, yet no worries about the expose to sunlight because sufficient
artificial light is provided to the plants. On the other hand, the monitoring task can
be handled by the sensors which will be more efficient and effective compared to
the performance of labours.

CHAPTER 1 INTRODUCTION
8 BCN (Hons) Communication and Networking
Faculty of Information and Communication Technology (Perak Campus), UTAR
1.5 Report Organisation
The remainder of this report is organised as follows: In Chapter 2, the existing
system and technologies are introduced. Chapter 3 has shown system
methodology which included the system development model, system and
functional requirements, cost, and project timeline. In Chapter 4, the system
design and the current implementation of system with functional modules’ details
are shown. In Chapter 5, details of setting up the system are elaborated. In
Chapter 6, the system performance is evaluated. Lastly in Chapter 7, conclusion
is and recommendations on future improvement are made.

CHAPTER 2 LITERATURE REVIEW
9 BCN (Hons) Communication and Networking
Faculty of Information and Communication Technology (Perak Campus), UTAR
Chapter 2: Literature Review
2.1 IoT infrastructure
Figure 2-1-1: IoT Infrastructure. (MSV, 2015)
The IoT infrastructure can be classified into 3 stages as shown in Figure 2-1-1:
the sensors/actuator, the IoT gateway, and data centre/Cloud.
For the stage 1, the sensors collect data from an object or the environment and
turn it into the useful and meaningful data. On the other hand, the actuator
changes the physical conditions that generate data. For an instance, shut off a
power supply, adjust an air flow valve and etc. This stage enables many IoT
applications such as the camera module in monitoring system, air quality
monitoring and temperature control. For the information, the sensors network
can be wired or wireless with their strength and limitation respectively. Since
the data is the core of the IoT technology, the data processing is important and
it can occur in all three stages. However, the data processing in sensors are
limited by the processing power of the device that the sensors attached to.
Thus, a more extensive processing would be made in stage 2 or stage 3.

CHAPTER 2 LITERATURE REVIEW
10 BCN (Hons) Communication and Networking
Faculty of Information and Communication Technology (Perak Campus), UTAR
Then, for the stage 2, the sensor nodes will send the data to a central location
via low-energy radio communication network such as the ZigBee. The central
location that aggregates the raw data generated by during the stage 1 is called
an IoT gateway. The IoT gateway works by receiving data from IoT sensors,
which it can then send onwards to the cloud; it also receives information from
the cloud which then forward it back to the actuator to help it performs some
control functions such as regulating environmental changes. All information
moving from stage 1 to stage 3, or vice versa, goes through the connected IoT
gateway. By managing this connection, the gateway can perform security tasks,
help manage devices and translate protocols.
Lastly, stage 3 refers to the data centre or Cloud. Data that needs more in-
depth processing are forwarded to physical data centre or cloud-based systems,
where more powerful IT systems can analyse, manage, and securely store the
data. Besides that, the integration of the dashboard service with the Cloud
enables the visualisation of those data to the user.
2.2 Raspberry Pi
Figure 2-2-1: Raspberry Pi 2 Model B (Rhydolabz.com, 2015)
The Raspberry Pi is a series of small single-board computer which developed
by the Raspberry Pi Foundation in United Kingdom. It act as an important
platform to develop the IoT project.
CHAPTER 2 LITERATURE REVIEW
11 BCN (Hons) Communication and Networking
Faculty of Information and Communication Technology (Perak Campus), UTAR
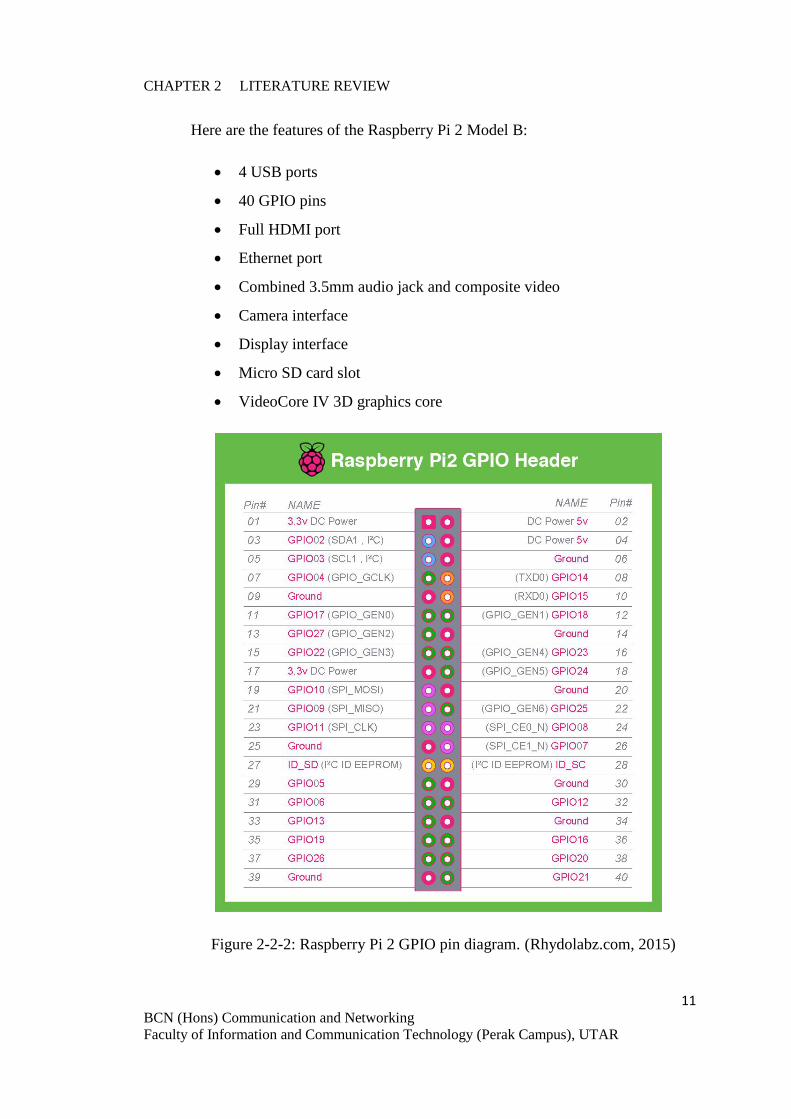
Here are the features of the Raspberry Pi 2 Model B:
4 USB ports
40 GPIO pins
Full HDMI port
Ethernet port
Combined 3.5mm audio jack and composite video
Camera interface
Display interface
Micro SD card slot
VideoCore IV 3D graphics core
Figure 2-2-2: Raspberry Pi 2 GPIO pin diagram. (Rhydolabz.com, 2015)
CHAPTER 2 LITERATURE REVIEW
12 BCN (Hons) Communication and Networking
Faculty of Information and Communication Technology (Perak Campus), UTAR
Refer to the Figure 2-2-2, the Raspberry Pi 2 is having 40 GPIO pins. It
provides 3.3v and 5v power DC power. The Raspberry Pi also support 2 type
of protocol which are SPI and I2C.
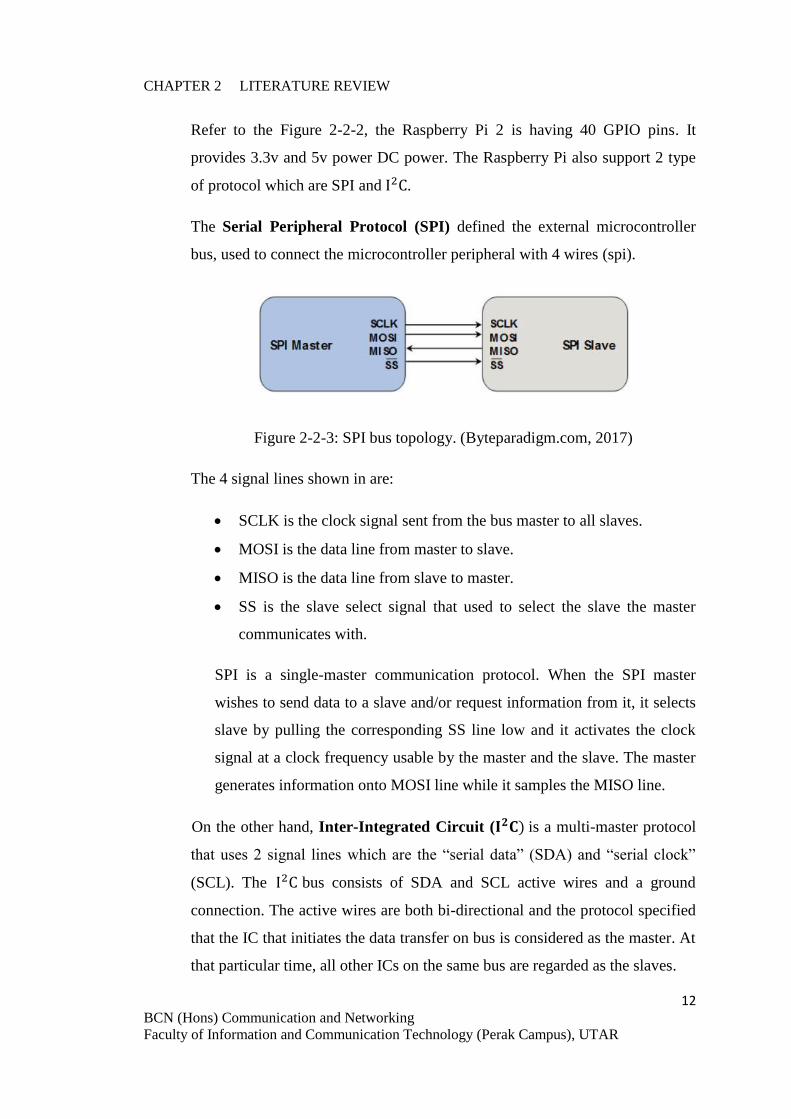
The Serial Peripheral Protocol (SPI) defined the external microcontroller
bus, used to connect the microcontroller peripheral with 4 wires (spi).
Figure 2-2-3: SPI bus topology. (Byteparadigm.com, 2017)
The 4 signal lines shown in are:
SCLK is the clock signal sent from the bus master to all slaves.
MOSI is the data line from master to slave.
MISO is the data line from slave to master.
SS is the slave select signal that used to select the slave the master
communicates with.
SPI is a single-master communication protocol. When the SPI master
wishes to send data to a slave and/or request information from it, it selects
slave by pulling the corresponding SS line low and it activates the clock
signal at a clock frequency usable by the master and the slave. The master
generates information onto MOSI line while it samples the MISO line.
On the other hand, Inter-Integrated Circuit (𝐈𝟐𝐂) is a multi-master protocol
that uses 2 signal lines which are the “serial data” (SDA) and “serial clock”
(SCL). The I2C bus consists of SDA and SCL active wires and a ground
connection. The active wires are both bi-directional and the protocol specified
that the IC that initiates the data transfer on bus is considered as the master. At
that particular time, all other ICs on the same bus are regarded as the slaves.

CHAPTER 2 LITERATURE REVIEW
13 BCN (Hons) Communication and Networking
Faculty of Information and Communication Technology (Perak Campus), UTAR
2.3 Light Spectrum
All Green plants contain a pigment called chlorophyll in chloroplast and the
chloroplasts are found in their leaves. The main use of the chlorophyll to a plant is
that it will absorb sun light to be used during the photosynthesis. As detailed, the
chlorophyll will absorbs certain wavelengths of light within the visible light spectrum
such as the red light (long wavelength) and blue light (short wavelength) while it will
reflected the green light thus making the plant appear green.
Figure 2-3-1: Absorption spectra of Chlorophyll. (Webexhibits.org., 2008)
From Figure 2-3-1, we can observe that the green plants best absorbed the red (about
465nm) by chlorophyll b and blue light (about 665nm) by chlorophyll a. Thus, in the
proposed system, the floodlight that is emitting the purple light which comprised the
red and blue light is used to act as the artificial light for the plant.

CHAPTER 2 LITERATURE REVIEW
14 BCN (Hons) Communication and Networking
Faculty of Information and Communication Technology (Perak Campus), UTAR
2.4 Review on the Existing Systems/Applications
In this section, 4 existing system have been review for the WSN monitoring system.
1. Application of Wireless Sensor Networks for Greenhouse Parameter Control
in Precision Agriculture. (Chaudhary, Nayse and Waghmare, 2011)
2. Precision Agriculture Monitoring System using Wireless Sensor Network and
Raspberry Pi Local Server. (Flores et al., 2017)
3. Design and Simulation of a Wireless Sensor Network Greenhouse-Monitoring
System Based on 3G Network Communication ( Zhou, Y. and Duan, J. ,2016)
4. Wireless Sensor Based Remote Monitoring System for Agriculture Using
ZigBee and GPS (G. V., S. and SD, M., 2013)
2.4.1 Application of Wireless Sensor Networks for Greenhouse Parameter
Control in Precision Agriculture
This journal article proposed the use of Programmable System on Chip
Technology as a part of Wireless Sensor Network. There are three type of
sensors used which are the outside climate sensor that gather the data of wind
flow, wind direction, temperature, humidity and percentage of carbon dioxide;
the inside climate sensor that monitor the same data as last mentioned sensor
but inside the greenhouse; the soil sensor to detect the soil condition.
Figure 2-4-1-1: Sensor and structure of greenhouse.

CHAPTER 2 LITERATURE REVIEW
15 BCN (Hons) Communication and Networking
Faculty of Information and Communication Technology (Perak Campus), UTAR
In their prototype greenhouse, the greenhouse size is 70m x 150m and
required 40 to 50 wireless nodes. The sensor nodes will send information to
the central node. They have combine 802.11, 802.15.4 and 802.15.5 in their
wireless communication. The application based wireless sensor network with a
specific protocol and system on chip based hardware with programmable radio
is able to overcome the data congestion and intercommunication between
nodes.
For the temperature and humidity control, this paper uses forced-air heaters as
the heating system as well as the dehumidifier. On the other hand, the soil
condition such as the soil temperature and moisture are control by the
irrigation system.
2.4.2 Precision Agriculture Monitoring System using Wireless Sensor Network
and Raspberry Pi Local Server
This paper introduce an wireless sensor network to gather the field data of
temperature, humidity, moisture, luminosity, electrical conductivity and pH
using various type of sensors with the Raspberry Pi as the local server which
used for data processing and transfer.
All the sensors are connected to single microcontroller board with a mounted
Xbee shield for wireless communication. The RF transmission between the
sensors and the Raspberry Pi is handled by the XBee module and its
transmission is set to five minutes interval. The sensors collect the data and
sent the data to the Raspberry Pi, then enter to sleep mode. When the
Raspberry Pi receives the data, it stores it into the local database, and then
forwards the data to the main server via the Internet. To visualize the data, a
website is specially designed with a combination of PHP and HTML scripts.

CHAPTER 2 LITERATURE REVIEW
16 BCN (Hons) Communication and Networking
Faculty of Information and Communication Technology (Perak Campus), UTAR
2.4.3 Design and Simulation of a Wireless Sensor Network Greenhouse-
Monitoring System Based on 3G Network Communication
This paper proposes the WSN for the real-time monitoring of the temperature,
humidity, light and carbon dioxide (CO2) concentration based on the third-
generation (3G) network communication.
For the design scheme of this paper, the data collected by multiple terminal
nodes are transmitted to the monitoring centre through the AP node based on
the infrastructure network model and the transmission control
protocol/Internet protocol (TCP/IP). The terminal nodes are the sensors
whereas the AP node is responsible for transmitting the data from terminal
nodes to the monitoring host.
In this paper, since all nodes in the system work in the same channel, only 1
terminal node and 1 AP node exist for each communication under a time
control. When the time is full, the sensor is dormant and change to
unconnected state.
2.4.4 Wireless Sensor Based Remote Monitoring System for Agriculture Using
ZigBee and GPS
In this paper, the researchers implemented WSN and monitoring system by
using the ZigBee, GPRS, GSM and GPS technologies as shown in Figure 2-4-
4-1. ZigBee is used in connecting the WSN to a central node, GPRS or GSM
is used in connecting the central node to the Central Monitoring Station
(CMS). At the same time, GPS parameters related to the field are sent to the
CMS as well in order to help in finding the location of the agriculture field
location.
In this approach, the data is stored in local temporarily and in a Web database
server. Besides that, the GPRS module is control to achieve the function of
sending SMS or MMS alarm to the managers when an exception occurs with
the field of monitoring field.

CHAPTER 2 LITERATURE REVIEW
17 BCN (Hons) Communication and Networking
Faculty of Information and Communication Technology (Perak Campus), UTAR
Nevertheless, the most significant difference of this paper from the others is
that the gateway node is solar energy power supplied instead of using normal
power supply.
Figure 2-4-4-1: The proposed system architecture in section 2.4.4

CHAPTER 2 LITERATURE REVIEW
18 BCN (Hons) Communication and Networking
Faculty of Information and Communication Technology (Perak Campus), UTAR
2.5 Critical remarks of previous works
In this section, critical remarks of the 4 literature review papers are done and
summarized in Table 2-3-1.
Paper 1: Application of Wireless Sensor Networks for Greenhouse Parameter
Control in Precision Agriculture. (Chaudhary, Nayse and Waghmare,
2011)
Paper 2: Precision Agriculture Monitoring System using Wireless Sensor
Network and Raspberry Pi Local Server. (Flores et al., 2017)
Paper 3: Design and Simulation of a Wireless Sensor Network Greenhouse-
Monitoring System Based on 3G Network Communication ( Zhou, Y.
and Duan, J. ,2016)and Duan, J. ,2016)
Paper 4: Wireless Sensor Based Remote Monitoring System for Agriculture
Using ZigBee and GPS (G. V., S. and SD, M., 2013)
Table 2-5-1: Summarized strengths and limitations of previous works
Paper Strength Limitation Comments
1 High flexibility
Able to
overcome data
congestion
Limited battery
Available bandwidth
might not enough if
number of the
parameters still
increase.
Deploy a variety of
parameter monitoring
and control.
Lack of display or
visualization of data
and information to the
user.
2 Low cost
Monitoring area
can be extended
to large size.
High flexibility
The sensors are exposed
to outdoor environment
and require special
protection.
The transmission
interval has to be
As wireless sensor has
limited battery, the
sampling or
transmission interval
has to be defined
carefully.

CHAPTER 2 LITERATURE REVIEW
19 BCN (Hons) Communication and Networking
Faculty of Information and Communication Technology (Perak Campus), UTAR
defined carefully. Lack of parameter
control mechanism.
3 High speed data
transmission
Low power
dissipation
Stable operation
Division of 3G
technology occur:
- W-CDMA (Europe)
- CDMA2000 (USA)
- Time-division
synchronous CDMA
(China)
Interference and noise
exist
Lack of parameter
control mechanism.
4 Low cost
Low power
consumption
Low complexity
Solar power
supply for
gateway node
Low data flow
Star and Tree topology
may lead to network
failure
Lack of parameter
control mechanism.
Solar power supply is a
good and stable way to
ease the problem of
limited battery.

CHAPTER 3: SYSTEM METHODOLOGY
20 BCN (Hons) Communication and Networking
Faculty of Information and Communication Technology (Perak Campus), UTAR
Chapter 3: System Methodology
3.1 System Development Models
The software development of this project is related to study, design and develop
an indoor farming environment which includes the monitoring system, a simple
GUI for user to view the monitoring data with remote-control feature.
3.1.1 Agile Model
Figure 3-1-1: The agile system development life cycle (SDLC) model
The software development life cycle throughout the project lifetime will based on
the Agile SDLC method as shown in Figure 3-1-1.(tutorialspoint. ,n.d.). This is a
combination of iterative and incremental process models with focus on process
adaptability. This agile method will break the project into smaller incremental
builds, then iterative approach is taken and working sub-system is delivered after
each iteration.
The advantages of the agile model are having shorter iterations can reduce
complexity and risk, the functionality can be developed rapidly and demonstrated,
resource requirements are minimum and little or no planning required. On the

CHAPTER 3: SYSTEM METHODOLOGY
21 BCN (Hons) Communication and Networking
Faculty of Information and Communication Technology (Perak Campus), UTAR
other hand, the disadvantages of this model are it is not suitable for handling
complex dependencies, it brings more risk of sustainability, maintainability and
extensibility, it requires a strict delivery management dictates the scope,
functionality to be delivered, and adjustments to meet the deadlines and an agile
leader or project manager is necessary,
3.1.2 Waterfall Model
Figure 3-1-2: The waterfall system development life cycle (SDLC) model.
(www.tutorialspoint.com., n.d.)
The waterfall model is the first process model to be introduced and it simple to
understand and use. In this approach, the whole system life cycle is divided into
separate process and the outcome of one phase will become the input for the next
sequential process.
The advantages of this SDLC model are it is easy to manage, process are
completed one at a time with clearly defined stages, easy to arrange task and
works well for smaller project that requirements are well understood.

CHAPTER 3: SYSTEM METHODOLOGY
22 BCN (Hons) Communication and Networking
Faculty of Information and Communication Technology (Perak Campus), UTAR
However, this linear-sequential life cycle require one phase must complete in
order to begin the next phase and this might raises a high amount of risk and
uncertainty along the project lifetime. Then, no working software is produced
until late during the life cycle and it cannot accommodate the changing
requirement. Moreover, adjusting scope during the life cycle can end a project.
3.1.3 Selected Model
After considering the agile and water model in section 3.1.1 and 3.1.2, the agile
model will be chosen as the software development life cycle throughout the
project lifetime.
As related to this project, the software development will firstly started with the
designing of the monitoring system and further break it down into sub features to
perform its SDLC such as to develop and test its functionality, then new SDLC of
implementing monitoring system on the farming area, followed by new SDLC of
sending out the data collected to cloud and so on to include the other functionality.
In this way, there is no detailed planning and there is clarity on future tasks only
in respect of what features need to be developed. The feature driven development
adapts to the changing product requirements dynamically and is tested very
frequently, through the release iterations, minimizing the risk of any major
failures in future. And, it can deliver early partial working solutions and enables
concurrent development and delivery within an overall planned context.

CHAPTER 3: SYSTEM METHODOLOGY
23 BCN (Hons) Communication and Networking
Faculty of Information and Communication Technology (Perak Campus), UTAR
3.2 System Requirement
The hardware and software components of system requirements are shown in
Table 3-2-1:
Table 3-2-1: Hardware and software requirements of this project
Hardware
Raspberry Pi 2
DHT11 sensor
2 DC Fan
Camera
(Logitech
Webcam
C270)
CHAPTER 3: SYSTEM METHODOLOGY
24 BCN (Hons) Communication and Networking
Faculty of Information and Communication Technology (Perak Campus), UTAR
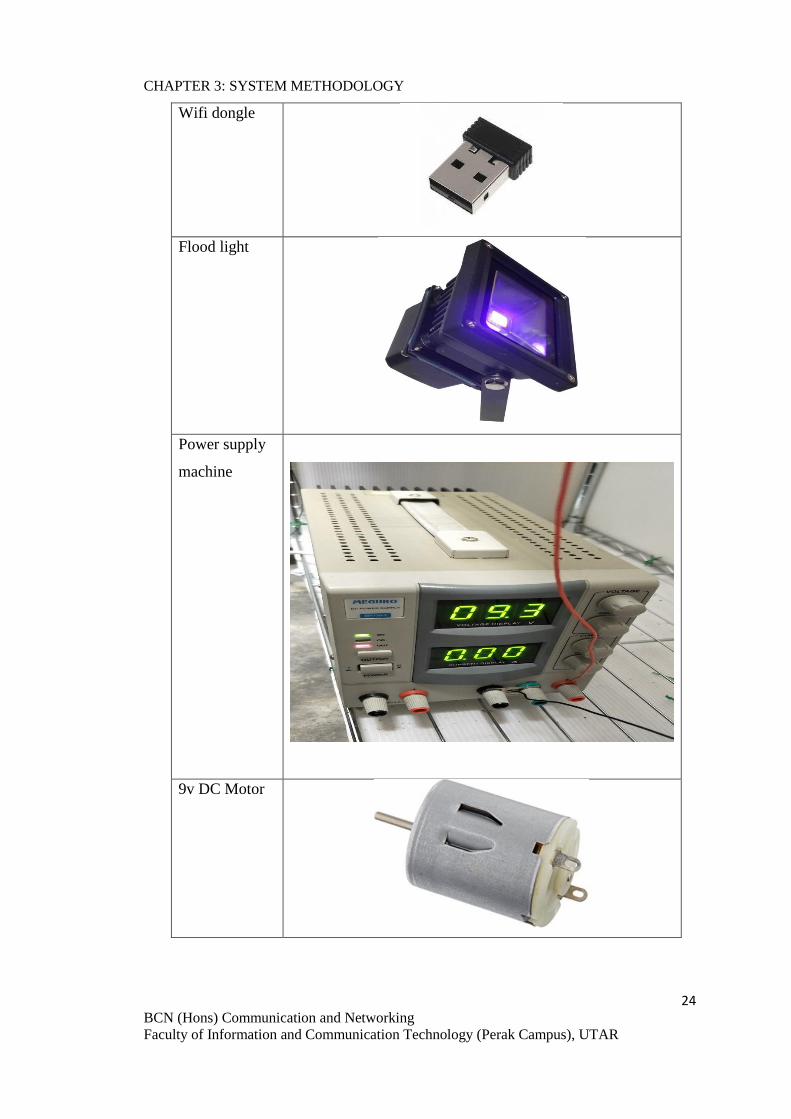
Wifi dongle
Flood light
Power supply
machine
9v DC Motor

CHAPTER 3: SYSTEM METHODOLOGY
25 BCN (Hons) Communication and Networking
Faculty of Information and Communication Technology (Perak Campus), UTAR
FC-28 Soil
Moisture
Sensor
4-Channel
relay
Water pump
pipe (4mm x
1meter)
Software
Raspbian
Jessie

CHAPTER 3: SYSTEM METHODOLOGY
26 BCN (Hons) Communication and Networking
Faculty of Information and Communication Technology (Perak Campus), UTAR
MobaXterm
For the hardware requirement, Raspberry Pi 2 will be used as the central control unit
that running the python program and control the power supply to the sensors, camera,
9V motor and fan switch. To connect to the Internet in order to push the sensor data,
the Raspberry Pi 2 needed to connect to a wifi dongle. For the sensors deployed, the
DHT11 sensor is used to sense the temperature and air humidity whereas the FC-28
soil moisture is used to detect the presence of water in the soil. Furthermore, the fans
and motor are provided 9v DC power by the power supply machine. Moreover, the
flood light is used as the artificial light for the plants.
On the other hand, the softwares needed are open source and free to download. The
Raspbian Jessie is the operating system used in the Raspberry Pi 2. Then, the
MobaXterm is used to connect the Raspberry Pi with monitor via a SSH connection.

CHAPTER 3: SYSTEM METHODOLOGY
27 BCN (Hons) Communication and Networking
Faculty of Information and Communication Technology (Perak Campus), UTAR
3.3 Functional Requirement
The system shall sense the temperature and air humidity data from time to time.
Once the changes of the data have shown that either one of them has exceeded
the pre-defined threshold values, the fans will turn on to reduce the temperature
and air humidity level by using the air-circulation. Before integrate the sensors
into the system, the functionality of the sensors are tested respectively.
The system shall sense the moisture level of the soil such that to drive the motor
to activate the irrigation system when the soil is too dry or deactivate the
irrigation system when the soil is not dry anymore.
The system shall capture a screenshot of the plant with a periodically manner and
display the image to user via a web browser.
The system shall display the real-time data trend to user for monitoring purpose.

CHAPTER 3: SYSTEM METHODOLOGY
28 BCN (Hons) Communication and Networking
Faculty of Information and Communication Technology (Perak Campus), UTAR
3.4 Project Milestone
The current project timeline of FYP 1 and the expected FYP 2 project timeline is
shown in Table 3-5-1 and Table 3-5-2.
Table 3-4-1: The Gantt chart of project task during FYP 1.
Project Task
Project Week
1 2 3 4 5 6 7 8 9 10 11 12 13 14
Determine FYP title
Information collecting
Determine objective & project
scope
Literature review
Determine system
requirement
Generate system prototype
System testing & finalize the
report
FYP 1 documentation
FYP 1 presentation

CHAPTER 3: SYSTEM METHODOLOGY
29 BCN (Hons) Communication and Networking
Faculty of Information and Communication Technology (Perak Campus), UTAR
Table 3-4-2: the Gantt chart of project task during FYP 2.
Project Task
Project Week
1 2 3 4 5 6 7 8 9 10 11 12 13 14
Plan, Design & Implement the
camera module
Test the camera module
Plan, Design & implement the
irrigation system
Test the irrigation system
Determine other possible
functionality
Grow different plants in the
field
FYP 2 documentation
FYP 2 presentation
3.5 Cost and Budget
Table 3-5-1: Cost plan.
Item Quantity Expected
Price
Supplied by
UTAR
Raspberry Pi 2 1 RM 309. 14 Yes
DHT11 sensor 1 RM 13. 50 Yes
DC fan 2 RM 9. 87 Yes
Camera 1 RM 46. 00 Yes
Wifi dongle 1 RM 16. 00 Yes
UV Floodlight 1 RM 21. 90 Yes
Power supply machine 1 RM 449. 44 Yes
Single core wire 1 RM 43.80
(per 100 meters)
Yes

CHAPTER 3: SYSTEM METHODOLOGY
30 BCN (Hons) Communication and Networking
Faculty of Information and Communication Technology (Perak Campus), UTAR
9V DC Motor 1 RM 26.50 Yes
FC-28 soil moisture
sensor
1 RM 8.10 Yes
Water pump pipe
(4mm x 1meter)
1 RM 1.50 Yes
Total RM 945. 75
Total in this project RM 0. 00 (all supplied by
UTAR)
All the hardware needed is provided by Universiti Tunku Abdul Rahman
(UTAR). The expected item prices are obtained from www.lazada.com.my and
www.mybotic.com.my.On the other hand, the software needed are open source
and can be obtained freely by online.
3.6 Concluding Remark
To conclude, agile system development life cycle is chosen to develop the system
throughout the whole FYP life cycle. The system requirements are stated in order
to build the system in current FYP 1 and for the coming FYP 2. Project timeline
and budget are stated as well so that the project can be delivered in time with a
controlled budget.

CHAPTER 4: SYSTEM DESIGN
31 BCN (Hons) Communication and Networking
Faculty of Information and Communication Technology (Perak Campus), UTAR
Chapter 4: System Design
4.1 System Architecture
Farming area
Figure 4-1: System overview.
Humidity
sensor
Temperature
sensor
Floodlight
Plants
Fan
Fan
Camera Water
pump
Raspberry Pi
Cloud User
FC-28

CHAPTER 4: SYSTEM DESIGN
32 BCN (Hons) Communication and Networking
Faculty of Information and Communication Technology (Perak Campus), UTAR
From Figure 4-1, the system consists of three sensors which are humidity and
temperature sensor, a soil moisture sensor and other components such as a
camera, a flood light, two dc fans, a water pump and a centralized control unit of
Raspberry Pi. For a brief system procedure, the sensors will keep reading the
temperature and humidity of the farming environment and detect whether the soil
is dry whereas the camera will captures the image of the plants condition and they
will send the readings and image to the Raspberry Pi. Then, the Raspberry Pi will
push the data to the Cloud. At the same time, the Raspberry Pi as central control
unit, it will analyses whether the temperature or humidity value is still underlying
within the predetermined threshold value in order to control the fan such as turn
on the fan when the temperature is too high. On the other hand, the Raspberry Pi
will control the water pump to water the plant which triggered by the FC-28
moisture sensor. Since the data are push to the Cloud, the user can view the data
by accessing to the Cloud.

CHAPTER 4: SYSTEM DESIGN
33 BCN (Hons) Communication and Networking
Faculty of Information and Communication Technology (Perak Campus), UTAR
4.2 Functional Modules in the System
4.2.1 The Sensor Module
Figure 4-2-1: The flowchart of sensor module.
As shown in Figure 4-2-1, when the system starts to run, the DHT11 sensor will
start to sense the humidity and temperature of the environment. When it was done,
it will send the data to the Raspberry Pi and start the timer respectively in order to
sense the next readings.

CHAPTER 4: SYSTEM DESIGN
34 BCN (Hons) Communication and Networking
Faculty of Information and Communication Technology (Perak Campus), UTAR
4.2.2 The Camera Module
Figure 4-2-2: The flowchart of camera module.
According to Figure 4-2-2, the camera captures an image and sends it back to the
Raspberry P. Then it start a timer to initiate the next capture.

CHAPTER 4: SYSTEM DESIGN
35 BCN (Hons) Communication and Networking
Faculty of Information and Communication Technology (Perak Campus), UTAR
4.2.3 The Fan Module
Figure 4-2-3: The flowchart of fan module.
In Figure 4-2-3, the fans are always waiting for the control command of the
Raspberry Pi. If the command received is a turn-on-command, the fan start to
spin; if the command is turn-off-command, the spinning fan will stop to spin.

CHAPTER 4: SYSTEM DESIGN
36 BCN (Hons) Communication and Networking
Faculty of Information and Communication Technology (Perak Campus), UTAR
4.2.4 The Irrigation Module
Figure 4-2-4: The flowchart of irrigation module.
As shown in Figure 4-2-4, the FC-28 sensor will firstly try to detect whether the
soil is wet or dry. If the soil is dry: the Raspberry Pi will turn-on the water pump
to activate the irrigation system; if soil is dry: the Raspberry Pi will stop the water
pump. After that, the timer starts to count, and initiates the next moisture
detection.

CHAPTER 4: SYSTEM DESIGN
37 BCN (Hons) Communication and Networking
Faculty of Information and Communication Technology (Perak Campus), UTAR
4.3 System Flow
Figure 4-3-1: The flowchart of python program.

CHAPTER 4: SYSTEM DESIGN
38 BCN (Hons) Communication and Networking
Faculty of Information and Communication Technology (Perak Campus), UTAR
The flowchart of the main python program is shown in Figure 4-3-1. The
program is running in the Raspberry Pi 2 (RPi). Initially, the RPi will set the pre-
defined threshold values for the temperature and humidity. Then, it will set the
General-Purpose Input / Output (GPIO) pins of the RPi according to the physical
wiring of the sensors, fans and the water pump. After that, the program will
create 3 threads for the functions of temperature and humidity sensing, the
camera, and irrigation.
For the thread 1 that defined the temperature and humidity sensing, RPi will
initially starting a timer of 3seconds, and followed by the detection of
temperature and humidity values by the DHT11 sensor. Once the sensor has sent
the reading back to the RPi, the RPi will send the data to the Cloud (dweet.io) and
then determine whether to turn the fans on or off according to the temperature
and humidity values if any of these two values have exceeded the predefined
threshold values. After that, this thread starts the timer again to continue the
iteration of this function.
On the other hand, for the thread 2 that defined the camera function, RPi will start
a timer of 30minutes. Once the timer has done count off, the RPi will execute a
shell script to capture the plant image. In this script, the image file will then be
moved to the apache2 root folder as it will be used to display the image via the
web browser within the local network. Lastly, the timer starts again to trigger
next camera function.
Lastly, for the thread 3 that defined the irrigation function, RPi will start firstly
starting a timer of 3seconds and trigger the FC-28 soil moisture sensor. The
sensor will return its detection to RPi in the form of a digital input. Once the RPi
has received the digital input, it will send the detection as a description of the soil
condition in text to the Cloud. Then RPi will decide to control the water pump
whether turn it on to pump to activate the irrigation system or turn it off if the soil
is not dry anymore. Finally, this function starts again after the timer has count off.

CHAPTER 4: SYSTEM DESIGN
39 BCN (Hons) Communication and Networking
Faculty of Information and Communication Technology (Perak Campus), UTAR
4.4 GUI Design
Figure 4-4-1: GUI design of the html file in local web services
Figure 4-4-1 shows the simple HTML file hosted in the apache2 web server. This
simple HTML file is used to display the plant image captured by the thread 2 in
section 4.3. At the bottom of this HTML file, there is a link point to custom dashboard
service provided by http://www.freeboard.io/.

CHAPTER 4: SYSTEM DESIGN
40 BCN (Hons) Communication and Networking
Faculty of Information and Communication Technology (Perak Campus), UTAR
Figure 4-4-2: GUI Design of the dashboard
Figure 4-4-2 shows the GUI design of the custom dashboard. There will be 4 pane in
this dashboard to display the local time, the temperature, the humidity and the soil
condition. The local time and soil condition are display in text whereas the
temperature and humidity are display by using the gauge and sparkline indicator.
4.5 Concluding Remark
In summary, the system architecture with its functional modules are explained in this
section 4. The system flow and the GUI Design of html and dashboard are illustrated
as well.

CHAPTER 5: SYSTEM IMPLEMENTATION
41 BCN (Hons) Communication and Networking
Faculty of Information and Communication Technology (Perak Campus), UTAR
Chapter 5: System Implementation
5.1 Hardware Implementation
Figure 5-1-1: The system prototype.

CHAPTER 5: SYSTEM IMPLEMENTATION
42 BCN (Hons) Communication and Networking
Faculty of Information and Communication Technology (Perak Campus), UTAR
Figure 5-1-2: The RPi and 4-channel relay module.
Figure 5-1-3: The DHT11 sensor and FC-28 sensor comparator board.

CHAPTER 5: SYSTEM IMPLEMENTATION
43 BCN (Hons) Communication and Networking
Faculty of Information and Communication Technology (Perak Campus), UTAR
Figure 5-1-4: The FC-28 soil moisture sensor.

CHAPTER 5: SYSTEM IMPLEMENTATION
44 BCN (Hons) Communication and Networking
Faculty of Information and Communication Technology (Perak Campus), UTAR
Figure 5-1-5: The 9V motor

CHAPTER 5: SYSTEM IMPLEMENTATION
45 BCN (Hons) Communication and Networking
Faculty of Information and Communication Technology (Perak Campus), UTAR
Figure 5-1-6: Raspberry Pi wiring diagram.

CHAPTER 5: SYSTEM IMPLEMENTATION
46 BCN (Hons) Communication and Networking
Faculty of Information and Communication Technology (Perak Campus), UTAR
Table 5-1-1: Pin connection between RPi, relay and sensor.
Component Pin Component Pin
RPi
11 (GPIO 17)
DHT11
Output
17 (3.3V) Power(+ve)
25 (Ground) GND(-ve)
4 (5V)
FC-28 Soil Moisture
Sensor
VCC
20 (Ground) GND
40 (GPIO 21) DO
2 (5V)
Relay
VCC
6 (Ground) GND
8 (GPIO 14) IN1
16 (GPIO 23) IN2
18 (GPIO 24) IN3
The system prototype is shown in Figure 5-1-1. According to Figure 5-1-6, the
RPi is connected to the 4-channel relay and the relay is act as the switch to
control the fans and 9V motor. For the relay, the 9V motor is connected to the
Normal Open (NO) of channel 1 whereas the two fans are connected to the NO
port of channel 2 and channel 3 respectively. The COM port of channel 1,
channel 2 and channel 3 are supply with 5V voltage. The relay inputs of these 3
channels are connected to RPi pin 6, pin 16 and pin 18. The channel is switch
on when the pin of RPi is sending voltage to the relay input to control the fans
and motor.
The DHT11 and FC-28 sensors are connected to the RPi as illustrated in Figure
5-1-6 and in Table 5-1-1. The FC-28 sensor has 2 output type which are digital
output (DO) and analogue output (AO). In this system, the DO is used instead
of AO as AO will need to use an analogue-digital-converter (ADC) and the
ADC is not provided by UTAR.

CHAPTER 5: SYSTEM IMPLEMENTATION
47 BCN (Hons) Communication and Networking
Faculty of Information and Communication Technology (Perak Campus), UTAR
5.2 Software Implementation
This section will include the steps of installing the software needed in this project.
5.2.1 Install MobaXterm
Figure 5-2-1-1: MobaXterm website
Figure 5-2-1-2: SSH session setup.
CHAPTER 5: SYSTEM IMPLEMENTATION
48 BCN (Hons) Communication and Networking
Faculty of Information and Communication Technology (Perak Campus), UTAR
MobaXterm is use to connect the Raspberry Pi via a SSH session. Firstly,
download the installer from MobaXterm website as shown in Figure 5-2-1-1,
then set the SSH session with host = raspberrypi.local, username = pi, port =22
as shown in Figure 5-2-1-2. Then, connect the laptop to the raspberry pi by
using a Ethernet cable and chose to start the SSH session created just now and
open the user interface by typing “/etc/X11/Xsession”.
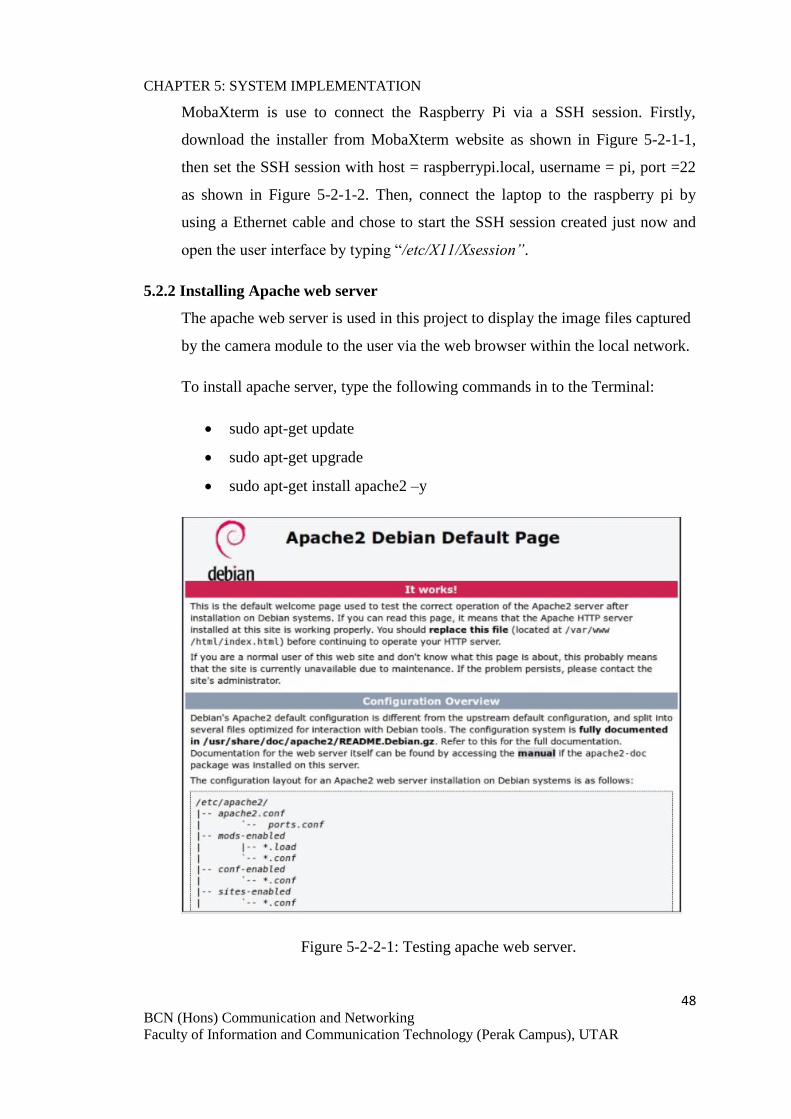
5.2.2 Installing Apache web server
The apache web server is used in this project to display the image files captured
by the camera module to the user via the web browser within the local network.
To install apache server, type the following commands in to the Terminal:
sudo apt-get update
sudo apt-get upgrade
sudo apt-get install apache2 –y
Figure 5-2-2-1: Testing apache web server.

CHAPTER 5: SYSTEM IMPLEMENTATION
49 BCN (Hons) Communication and Networking
Faculty of Information and Communication Technology (Perak Campus), UTAR
After installation is done, type in “http://localhost/” in the browser in Pi itself or
“http://<ip address of Pi>” to test the apache web server is functioning and you
should see the html page as shown in Figure 5-2-2-1. In Terminal, type in “cd
/var/www/html” to move the directory to the apache root folder and “sudo nano
index.html” to edit the html content.
5.2.3 Installing Screen
In order to let the python program runs continuously after disconnect the SSH
connection between the Raspberry Pi and the monitor, a program called “screen”
is used. This program is able to run the program as the background process so
that the program is still running after SSH connection is break as long as the
Raspberry Pi is powered. To install it, type apt-get install screen and type
screen bash after it is done installed. Then, it will open another terminal
instance and run the python program here. After that, press CTRL + A +D to
detach the terminal session and screen –r to view reconnect to the instance.
Figure 5-2-3-1: Screen is installed successfully.

CHAPTER 5: SYSTEM IMPLEMENTATION
50 BCN (Hons) Communication and Networking
Faculty of Information and Communication Technology (Perak Campus), UTAR
Figure 5-2-3-2: Reconnect to screen instance.
5.2.4 Installing fswebcam
The fswebcam module allow user in suing a standard USB camera to take
pictures or video on the Raspberry Pi. To install the fswebcam package, type in
the “sudo apt-get install fswebcam” in Terminal:
5.3 Setting and Configuration
This section elaborates the steps in setting up of the system. Among the steps, we
need to create the main python program and a shell script to use fswebcam, edit the
html content and customize the dashboard to display the data.
5.3.1 Python program
In Raspberry Pi, create a new text file and add the content as shown in Figure5-3-1-1,
Figure 5-3-1-2 and Figure 5-3-1-3. Then, save the file with name “fyprun.py”. The
python program declares some local variables, setting up the GPIO Pin, define and
execute the thread and send the values of variable Temperature and Humidity to the
object named “chongfyp1” in the Cloud

CHAPTER 5: SYSTEM IMPLEMENTATION
51 BCN (Hons) Communication and Networking
Faculty of Information and Communication Technology (Perak Campus), UTAR
Figure 5-3-1-1: Python program content page 1.

CHAPTER 5: SYSTEM IMPLEMENTATION
52 BCN (Hons) Communication and Networking
Faculty of Information and Communication Technology (Perak Campus), UTAR
Figure 5-3-1-2: Python program content page 2.

CHAPTER 5: SYSTEM IMPLEMENTATION
53 BCN (Hons) Communication and Networking
Faculty of Information and Communication Technology (Perak Campus), UTAR
Figure 5-3-1-3: Python program content page 3.

CHAPTER 5: SYSTEM IMPLEMENTATION
54 BCN (Hons) Communication and Networking
Faculty of Information and Communication Technology (Perak Campus), UTAR
5.3.2 HTML content
At directory “/var/www/html”, typing “sudo nano index.html” to edit the html content
by replacing the <body> section as shown in Figure 5-3-2-1.
Figure 5-3-2-1: HTML content.
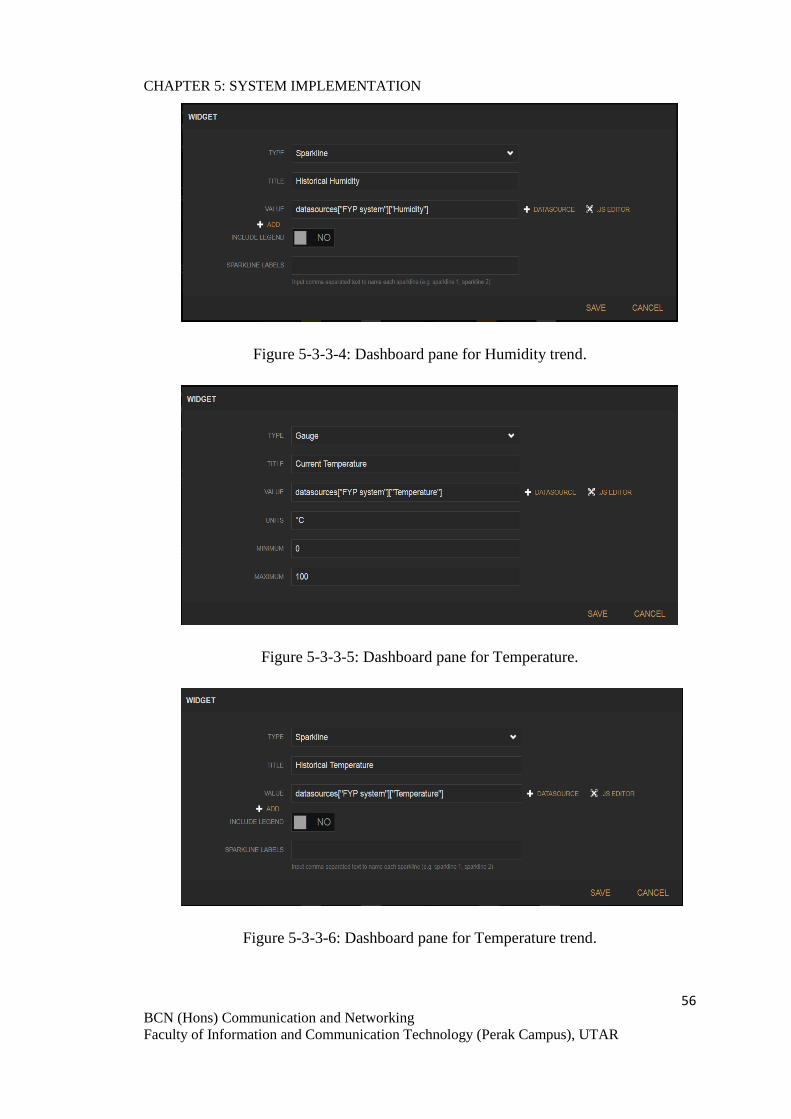
5.3.3 Dashboard customization
The Freeboard.io provides a platform to create a dynamic dashboard for the IoT
application. Firstly, sign up for a account at https://freeboard.io/account. Secondly,
login with the account and create a new dashboard. Then, add a data source name
“FYP system” with thing name “chongfyp1” as shown in Figure 5-3-3-1. After that,
add 6 pane to display the temperature, humidity, soil condition description and time
respectively as shown in Figure 5-3-3-2 to Figure 5-3-3-8.
Figure 5-3-3-1: Data source 1 for Dashboard

CHAPTER 5: SYSTEM IMPLEMENTATION
55 BCN (Hons) Communication and Networking
Faculty of Information and Communication Technology (Perak Campus), UTAR
Figure 5-3-3-2: Data source 2 for Dashboard
Figure 5-3-3-3: Dashboard pane for Humidity.
CHAPTER 5: SYSTEM IMPLEMENTATION
56 BCN (Hons) Communication and Networking
Faculty of Information and Communication Technology (Perak Campus), UTAR
Figure 5-3-3-4: Dashboard pane for Humidity trend.
Figure 5-3-3-5: Dashboard pane for Temperature.
Figure 5-3-3-6: Dashboard pane for Temperature trend.

CHAPTER 5: SYSTEM IMPLEMENTATION
57 BCN (Hons) Communication and Networking
Faculty of Information and Communication Technology (Perak Campus), UTAR
Figure 5-3-3-7: Dashboard pane for Time.
Figure 5-3-3-8: Dashboard pane for soil condition.
5.3.4 Others
Besides from creating the python program, we still need to create a shell script to
execute the fswebcam command in order to use the USB camera. Now, create another
text file named “camera.sh” and add the content as shown in Figure 5-3-4-1. This
script will call the fswebcam to capture a image and save as “image1.jpg” and move it
to the apache root folder. Furthermore, we have to check is there any other process is
using the USB camera to ensure the camera functionality by type in “ps -A” to check

CHAPTER 5: SYSTEM IMPLEMENTATION
58 BCN (Hons) Communication and Networking
Faculty of Information and Communication Technology (Perak Campus), UTAR
all process. After that found that there is another application called “motion” is
utilizing the camera thus we have to kill the process. In this case, the motion process
id is 691 and we kill the process by command “sudo kill –SIGTERM 691” as shown in
Figure 5-3-4-3.
Figure 5-3-4-1: Shell script camera.sh
Figure 5-3-4-2: Process list
Figure 5-3-4-3: Kill unwanted process.
CHAPTER 5: SYSTEM IMPLEMENTATION
59 BCN (Hons) Communication and Networking
Faculty of Information and Communication Technology (Perak Campus), UTAR
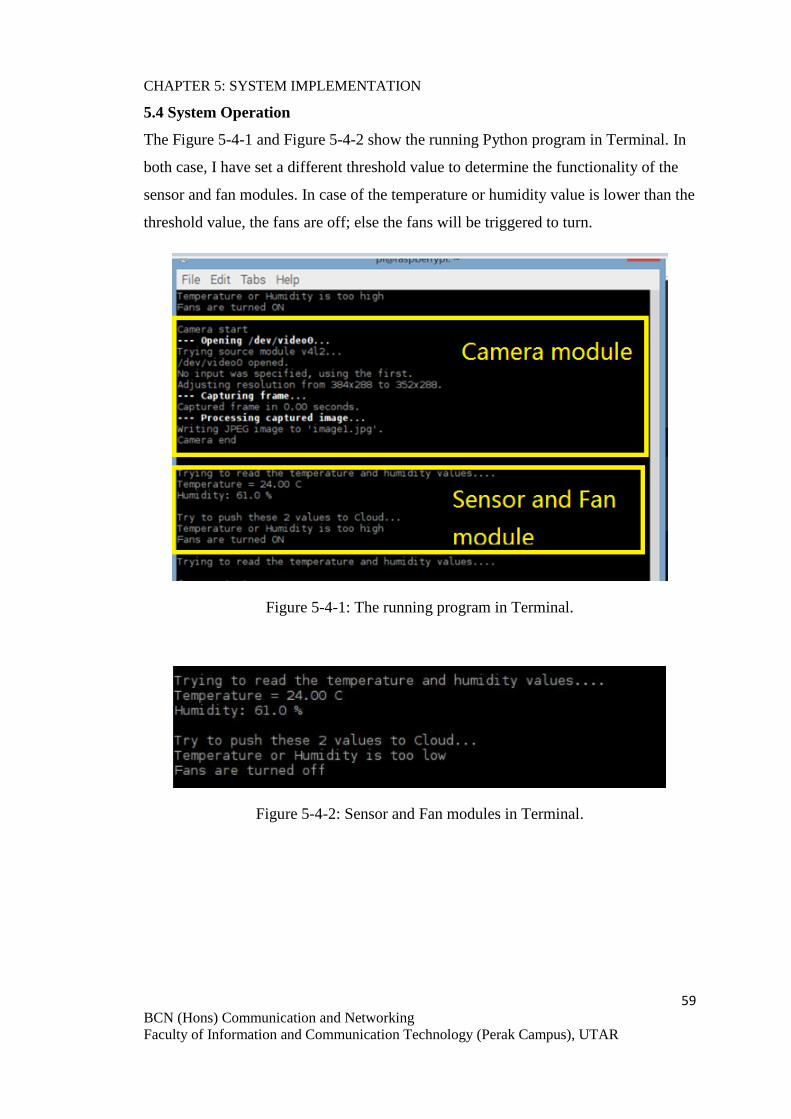
5.4 System Operation
The Figure 5-4-1 and Figure 5-4-2 show the running Python program in Terminal. In
both case, I have set a different threshold value to determine the functionality of the
sensor and fan modules. In case of the temperature or humidity value is lower than the
threshold value, the fans are off; else the fans will be triggered to turn.
Figure 5-4-1: The running program in Terminal.
Figure 5-4-2: Sensor and Fan modules in Terminal.

CHAPTER 5: SYSTEM IMPLEMENTATION
60 BCN (Hons) Communication and Networking
Faculty of Information and Communication Technology (Perak Campus), UTAR
Figure 5-4-3: Fan switched-off.
Figure 5-4-4: Fan switched-on.

CHAPTER 5: SYSTEM IMPLEMENTATION
61 BCN (Hons) Communication and Networking
Faculty of Information and Communication Technology (Perak Campus), UTAR
Figure 5-4-5: Irrigation switched-on.
The FC-28 soil moisture sensor is detecting the soil condition. In Figure 5-4-5, the
sensor detected the soil is dry and triggered the motor to pump the water. Then the
water is pumped to the pipe and watering the plant.
Figure 5-4-6: Web hosted in local Apache web server.

CHAPTER 5: SYSTEM IMPLEMENTATION
62 BCN (Hons) Communication and Networking
Faculty of Information and Communication Technology (Perak Campus), UTAR
Figure 5-4-7: The Dashboard.
The plant image captured by the USB camera is display in the web page hosted in
local apache web server as shown in Figure 5-4-6. And, the link in bottom will
redirect to the dashboard shown in Figure 5-4-7
5.5 Concluding Remarks
In summary, all the hardware and software implementations are explained section
5. Moreover, the system operation is shown as well which includes the physical
system and the display mechanisms of data.

CHAPTER 6: SYSTEM EVALUATION AND DISCUSSION
63 BCN (Hons) Communication and Networking
Faculty of Information and Communication Technology (Perak Campus), UTAR
Chapter 6: System Evaluation and Discussion
6.1 System Testing and Evaluation
The system is tested by growing the bean-sprout and pak choi. According to
Limwiwattana, Tongkhao and Na Jom (2015), the optimal growing temperature
of bean sprout is 35 °C and relative humidity of 80%. On the other hand,
according to Quickcrop.co.uk.(n.d.), pak choi is a cool-weather plant which
grows in temperature ranging from 45°F to 75 °F (about 7.22°C to 23.89°C).Thus
the pre-defined threshold value for temperature and humidity will be 24 °C and
80%.
During the system testing, the temperature and humidity recorded is around 24°C
and 61%. In other words, the room temperature of 24 is below the threshold value
of temperature but the threshold value of humidity exceeds the threshold value of
humidity. Thus, this has triggered the fans to spin. Ideally, the air circulation
generated by the fans should be able to reduce the temperature and humidity level.
However, no significant impact is observed in reducing the humidity level. The
reason might most probably due to few reasons. For example, the space for
farming area is relatively too big for the fans to generate strong air circulation or
might due to the locations of fans installation are not able to generate a strong
circulation direction.
On the other hand, the FC-28 soil moisture sensor is able to detect the moisture in
the soil can able to activate and deactivate the motor to pump the water in
irrigation system. However there is a challenge in ensuring the irrigation system
can water the whole farming pot or container evenly.
The camera function is working fine and display the image to user by using a web
page whereas the dashboard is displaying the current and historical temperature
and humidity readings with other information such as the local time and soil
condition.

CHAPTER 6: SYSTEM EVALUATION AND DISCUSSION
64 BCN (Hons) Communication and Networking
Faculty of Information and Communication Technology (Perak Campus), UTAR
6.2 Objective Evaluation
As we glance back the objectives of this project, the system built in this project
has achieved some of them as described below:
The system has established an indoor farming environment.
The system provided the real-time monitoring system on crops and
farming environment parameter such as the temperature, humidity and
soil moisture.
The system established a simple user interface for the users to view the
data via the local web server and dashboard service provided by
Freeboard.io.
The system provided an automatic irrigation system.
The system may help to reduce the labour daily duty as some of the work
has been made automated.
To conclude, the system has achieved 5 objectives out of 6.

CHAPTER 6: SYSTEM EVALUATION AND DISCUSSION
65 BCN (Hons) Communication and Networking
Faculty of Information and Communication Technology (Perak Campus), UTAR
6.3 SWOT
Strength Weakness
The system controls the sensors,
fans, water pump, camera
automatically to perform the
monitoring and control on indoor
farming.
User can view the reading easily
via Internet.
The dashboard enables the real-
time monitoring on indoor farming.
The temperature and humidity
control performance is not
significant.
The irrigation system facing
challenge to perform perfect and
evenly watering on soil.
Opportunity Threat
Indoor farming is still new in
Malaysia.
Automated process is hoped to
increase the work efficiency and
effectiveness.
Automated process is hoped to
reduce much labour cost.
Indoor farming environment seems
easier to be maintained thus
suitable in growing rare plant or the
plants that facing extinction
problems
Productivity of indoor farming
might less than traditional farming
under the perfect situation because
large indoor space is not common.
Reduce in labour cost but increase
in utility cost such as for the 7/24
electricity supply.

CHAPTER 7: CONCLUSION AND RECOMMENDATION
66 BCN (Hons) Communication and Networking
Faculty of Information and Communication Technology (Perak Campus), UTAR
Chapter 7: Conclusion and Recommendation
7.1 Conclusion
As the global food demand is rising, the food security has become a popular issue.
The traditional agriculture might have some flaws during the agriculture activities,
such as the weather is uncontrollable and led the loss of optimal growing environment
for the crops and plants, the agriculture activities mostly depend on the farmer’s
experiences, a large number of labour is employed but efficiency and productivity is
not guaranteed. Thus, this project proposed the title “IoT on indoor farming”. There
are some existing related systems, but most of them are emphasize on the data
monitoring. As compared, this project applies the concept of precious agriculture, by
using sensors, the environment parameter is monitored. As the enhancement, this
project proposed some automation processes such as to control the air temperature
and humidity by air circulation generated by the implemented fans. At the same time,
the monitored results will be sending to the Cloud and provides a channel for the user
to view the real-time data. This indoor farming system also implemented the camera,
irrigation module and is expected to implement other possible useful function in
future in order to achieve the project objectives.
7.2 Recommendation
There are some possible future improvements to enhance this indoor farming
monitoring system:
Implement an “All in one” dashboard which display the data yet provide
interactive control function.
The light can be controlled by the microprocessor instead of manually
controlled.
Water level of container in irrigation system can be detected automatically.
Implement chemical substances monitoring for soil.
Apply analytical mechanism to analyse the growing stages of plants.

REFERENCE
67 BCN (Hons) Communication and Networking
Faculty of Information and Communication Technology (Perak Campus), UTAR
Reference
1. Tozzi, C. (2016). IoT Past and Present: The History of IoT, and Where It's
Headed Today. [online] Talk in cloud. Available at:
http://talkincloud.com/cloud-computing/iot-past-and-present-history-iot-and-
where-its-headed-today [Accessed 6 Apr. 2017].
2. Research Gate. (2012). Agricultural innovations for sustainable crop
production intensification. [online] Available at:
https://www.researchgate.net/publication/258216861_Agricultural_innovation
s_for_sustainable_crop_production_intensification. [Accessed 6 Apr. 2017].
3. National Climate Assessment. (2014). Agricultural. [online] Available at:
http://nca2014.globalchange.gov/report/sectors/agriculture [Accessed 6 Apr.
2017].
4. Lin, H., et (2015). The Construction of a Precise Agricultural Information
System Based on Internet of Things. [online] iJOE. Available at:
http://dx.doi.org/10.3991/ijoe.v11i6.4847 [Accessed 6 Apr. 2017].
5. Zhou, Y. and Duan, J. (2016). Design and Simulation of a Wireless Sensor
Network Greenhouse-Monitoring System Based on 3G Network
Communication. [online] iJOE. Available at: http://online-
journals.org/index.php/i-joe/article/view/5736 [Accessed 6 Apr. 2017].
6. G. V., S. and SD, M. (2013). Wireless Sensor Based Remote Monitoring
System for Agriculture Using ZigBee and GPS. [online] Atlantis-press.
Available at: http://www.atlantis-
press.com/php/download_paper.php?id=6287. [Accessed 6 Apr. 2017].
7. tutorialspoint. (n.d.). SDLC Agile Model. [online] Available at:
https://www.tutorialspoint.com/sdlc/sdlc_agile_model.htm [Accessed 6 Apr.
2017].
8. Byteparadigm.com. (2017). Introduction to I²C and SPI protocols – Byte
Paradigm – Speed up embedded system verification. [online] Available at:
http://www.byteparadigm.com/applications/introduction-to-i2c-and-spi-
protocols/ [Accessed 15 Aug. 2017].

REFERENCE
68 BCN (Hons) Communication and Networking
Faculty of Information and Communication Technology (Perak Campus), UTAR
9. Chakraborty, S. and Newton, A. (2011). Climate change, plant diseases and
food security: an overview. Plant Pathology, [online] 60(1), pp.2-14.
Available at: http://onlinelibrary.wiley.com/doi/10.1111/j.1365-
3059.2010.02411.x/full [Accessed 28 Jul. 2017].
10. Chaudhary, D., Nayse, S. and Waghmare, L. (2011). Application of Wireless
Sensor Networks for Greenhouse Parameter Control in Precision
Agriculture. International Journal of Wireless & Mobile Networks, [online]
3(1), pp.140-149. Available at:
https://pdfs.semanticscholar.org/5f71/20d409a0eb7228f282c7898b501667624
38e.pdf [Accessed 16 Jul. 2017].
11. Flores, K., Butaslac, I., Gonzales, J., Dumlao, S. and Reyes, R. (2017).
Precision Agriculture Monitoring System using Wireless Sensor Network and
Raspberry Pi Local Server. [online] Available at:
http://ieeexplore.ieee.org/abstract/document/7848600/ [Accessed 18 Jul. 2017].
12. Limwiwattana, D., Tongkhao, K. and Na Jom, K. (2015). Effect of Sprouting
Temperature and Air Relative Humidity on Metabolic Profiles of Sprouting
Black Gram (Vigna mungoL.). Journal of Food Processing and Preservation,
[online] 40(2), pp.306-315. Available at:
https://www.researchgate.net/publication/283976006_Effect_of_Sprouting_Te
mperature_and_Air_Relative_Humidity_on_Metabolic_Profiles_of_Sprouting
_Black_Gram_Vigna_Mungo_L [Accessed 14 Jul. 2017].
13. MSV, J. (2015). Tutorial: Prototyping a Sensor Node and IoT Gateway with
Arduino and Raspberry Pi - Part 1 - The New Stack. [online] The New Stack.
Available at: https://thenewstack.io/tutorial-prototyping-a-sensor-node-and-
iot-gateway-with-arduino-and-raspberry-pi-part-1/ [Accessed 11 Aug. 2017].
14. Rhydolabz.com. (2015). Raspberry Pi 2: Logging on to the 2nd generation.
[online] Available at: http://www.rhydolabz.com/wiki/?p=5782 [Accessed 11
Aug. 2017]

REFERENCE
69 BCN (Hons) Communication and Networking
Faculty of Information and Communication Technology (Perak Campus), UTAR
15. Quickcrop.co.uk. (n.d.). How to Grow Pak Choi (Chinese Cabbage) - Growing
Guide. [online] Available at:
https://www.quickcrop.co.uk/learning/plant/chinese-cabbage [Accessed 4 Mar.
2].
16. Webexhibits.org. (2008). Chlorophyll | Causes of Color. [online] Available at:
http://www.webexhibits.org/causesofcolor/7A.html [Accessed 24 Mar. 2018].
17. www.tutorialspoint.com. (n.d.). SDLC Waterfall Model. [online] Available at:
https://www.tutorialspoint.com/s

APPENDICES
A-1 BCN (Hons) Communication and Networking
Faculty of Information and Communication Technology (Perak Campus), UTAR
Appendices
Appendix A: Bi-weekly Report
FINAL YEAR PROJECT WEEKLY REPORT
(Project I )
Trimester, Year: Year 3 Sem 3 Study week no.: 3
Student Name & ID: CHONG KAI CHIAN 1503270
Supervisor: DR GOH HOCK GUAN
Project Title: INTERNET OF THINGS FOR INDOOR FARMING
1. WORK DONE
In week 3, a brief discussion about the project and components needed to be bought.
2. WORK TO BE DONE
To implement the irrigation system and camera function in the project.
3. PROBLEMS ENCOUNTERED
New components need to buy to implement the functions mentioned above.
4. SELF EVALUATION OF THE PROGRESS
Waiting the component to be delivered before proceed to next step.
_________________________ _________________________
Student’s signature Supervisor’s signature

APPENDICES
A-2 BCN (Hons) Communication and Networking
Faculty of Information and Communication Technology (Perak Campus), UTAR
FINAL YEAR PROJECT WEEKLY REPORT
(Project I )
Trimester, Year: Year 3 Sem 3 Study week no.: 9
Student Name & ID: CHONG KAI CHIAN 1503270
Supervisor: DR GOH HOCK GUAN
Project Title: INTERNET OF THINGS FOR INDOOR FARMING
1. WORK DONE
The new component has reached. This included the 9V motor, FC-28 soil moisture
sensors, 4-channel relay module, 4mm water pipe and jumper wires.
2. WORK TO BE DONE
Integrated the irrigation system and camera into the system.
3. PROBLEMS ENCOUNTERED
Zero experience in using the relay module thus no much progress is done.
4. SELF EVALUATION OF THE PROGRESS
Weak in time management. Have to follow the project timeline without delay.
_________________________ _________________________
Student’s signature Supervisor’s signature

APPENDICES
A-3 BCN (Hons) Communication and Networking
Faculty of Information and Communication Technology (Perak Campus), UTAR
FINAL YEAR PROJECT WEEKLY REPORT
(Project I )
Trimester, Year: Year 3 Sem 3 Study week no.: 10
Student Name & ID: CHONG KAI CHIAN 1503270
Supervisor: DR GOH HOCK GUAN
Project Title: INTERNET OF THINGS FOR INDOOR FARMING
1. WORK DONE
Discuss with supervisor on how to use the relay module
2. WORK TO BE DONE
Integrated the irrigation system and camera into the system.
3. PROBLEMS ENCOUNTERED
N/A
4. SELF EVALUATION OF THE PROGRESS
Weak in time management. Have to follow the project timeline without delay.
_________________________ _________________________
Student’s signature Supervisor’s signature

APPENDICES
A-4 BCN (Hons) Communication and Networking
Faculty of Information and Communication Technology (Perak Campus), UTAR
FINAL YEAR PROJECT WEEKLY REPORT
(Project I )
Trimester, Year: Year 3 Sem 3 Study week no.: 11
Student Name & ID: CHONG KAI CHIAN 1503270
Supervisor: DR GOH HOCK GUAN
Project Title: INTERNET OF THINGS FOR INDOOR FARMING
1. WORK DONE
The camera module is done implemented and a simple web page is designed to
display the image captured by the camera.
2. WORK TO BE DONE
Integrated the irrigation system into the system.
3. PROBLEMS ENCOUNTERED
The soil was over compressed and making the pak choi has all died.
4. SELF EVALUATION OF THE PROGRESS
No experience in growing plants with soil and need to regrow the pak choi again.
_________________________ _________________________
Student’s signature Supervisor’s signature

APPENDICES
A-5 BCN (Hons) Communication and Networking
Faculty of Information and Communication Technology (Perak Campus), UTAR
FINAL YEAR PROJECT WEEKLY REPORT
(Project I )
Trimester, Year: Year 3 Sem 3 Study week no.: 12
Student Name & ID: CHONG KAI CHIAN 1503270
Supervisor: DR GOH HOCK GUAN
Project Title: INTERNET OF THINGS FOR INDOOR FARMING
1. WORK DONE
The dashboard to display data has been updated.
The irrigation system is done implemented.
2. WORK TO BE DONE
Finish the FYP2 report.
Burn the report into CD.
3. PROBLEMS ENCOUNTERED
Accidently fell the farming container and make the new grown pak choi seedling died.
The time to grow pak choi is not enough thus grow green beans and pakchoi together.
4. SELF EVALUATION OF THE PROGRESS
Careless in handling the container. Need to regrow the pak choi.
_________________________ _________________________
Student’s signature Supervisor’s signature

APPENDICES
A-5 BCN (Hons) Communication and Networking
Faculty of Information and Communication Technology (Perak Campus), UTAR
FINAL YEAR PROJECT WEEKLY REPORT
(Project I )
Trimester, Year: Year 3 Sem 3 Study week no.: 13
Student Name & ID: CHONG KAI CHIAN 1503270
Supervisor: DR GOH HOCK GUAN
Project Title: INTERNET OF THINGS FOR INDOOR FARMING
1. WORK DONE
The FYP2 report is done
2. WORK TO BE DONE
N/A
3. PROBLEMS ENCOUNTERED
N/A
4. SELF EVALUATION OF THE PROGRESS
Report has been completed.
_________________________ _________________________
Student’s signature Supervisor’s signature
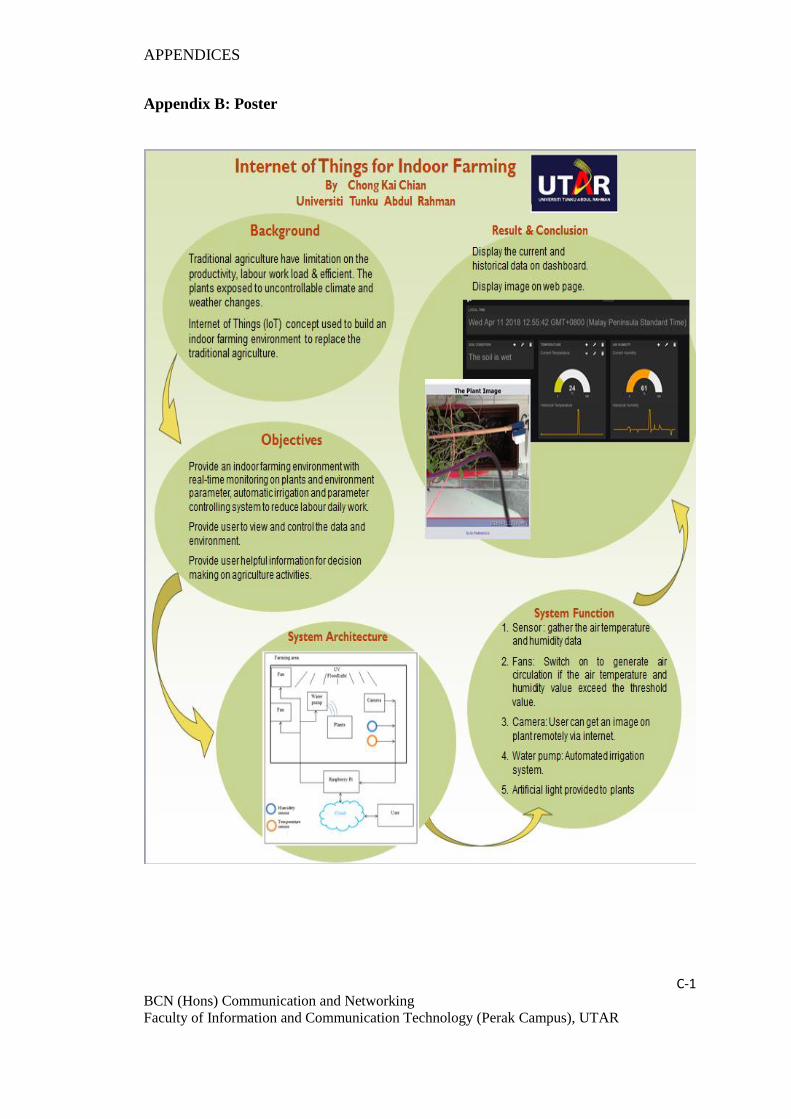
APPENDICES
C-1 BCN (Hons) Communication and Networking
Faculty of Information and Communication Technology (Perak Campus), UTAR
Appendix B: Poster
APPENDICES
C-1
Appendix C: Plagiarism Check Summary

APPENDICES
C-2 BCN (Hons) Communication and Networking
Faculty of Information and Communication Technology (Perak Campus), UTAR

APPENDICES
C-3 BCN (Hons) Communication and Networking
Faculty of Information and Communication Technology (Perak Campus), UTAR

APPENDICES
C-4 v BCN (Hons) Communication and Networking
Faculty of Information and Communication Technology (Perak Campus), UTAR

APPENDICES
C-5 BCN (Hons) Communication and Networking
Faculty of Information and Communication Technology (Perak Campus), UTAR

APPENDICES
C-6 BCN (Hons) Communication and Networking
Faculty of Information and Communication Technology (Perak Campus), UTAR
FACULTY OF INFORMATION AND COMMUNICATION
TECHNOLOGY
Full Name(s) of Candidate(s) CHONG KAI CHIAN
ID Number(s)
1503270
Programme / Course COMMUNICATION AND NETWORKING
Title of Final Year Project INTERNET OF THINGS FOR INDOOR FARMING
Similarity Supervisor’s Comments
(Compulsory if parameters of originality exceeds the
limits approved by UTAR) Overall similarity index: ___ %
Similarity by source
Internet Sources: _______________%
Publications: _________ %
Student Papers: _________ %
Number of individual sources listed of more
than 3% similarity:
Parameters of originality required and limits approved by UTAR are as Follows:
(i) Overall similarity index is 20% and below, and
(ii) Matching of individual sources listed must be less than 3% each, and
(iii) Matching texts in continuous block must not exceed 8 words
Note: Parameters (i) – (ii) shall exclude quotes, bibliography and text matches which are less than 8
words.
Note Supervisor/Candidate(s) is/are required to provide softcopy of full set of the originality
report to Faculty/Institute
Based on the above results, I hereby declare that I am satisfied with the originality of the
Final Year Project Report submitted by my student(s) as named above.
______________________________ ______________________________
Signature of Supervisor
Signature of Co-Supervisor
Name: __________________________
Name: _________________________
Date: ___________________________ Date: __________________________
Universiti Tunku Abdul Rahman
Form Title : Supervisor’s Comments on Originality Report Generated by Turnitin
for Submission of Final Year Project Report (for Undergraduate Programmes)
Form Number: FM-IAD-005 Rev No.: 0 Effective Date: 01/10/2013 Page No.: 1of 1