international shale development optimization. unconventional resources development reservoir quality...
TRANSCRIPT

International Shale Development Optimization

Unconventional Resources Development
Reserv
oir Q
uality
Comple
tion Q
uality

Controls for Reservoir ProductivityDefining Reservoir Quality TOC and maturation Mineralogy Pore Pressure Petrophysics: porosity, saturations, permeability, thickness Gas in place: adsorbed, interstitial
Defining Completion Quality Structure: faults, natural fractures, curvature Hydraulic fracture containment: geomechanical anisotropy, in-situ stress Rock fracturability: surface area per reservoir volume, texture, complexity Retention of surface area and fracture conductivity: stress, mechanical properties Fracturing fluid sensitivity: mineralogy, fluid chemistry
Good Reservoir Quality + Good Completion Quality = Economic Success
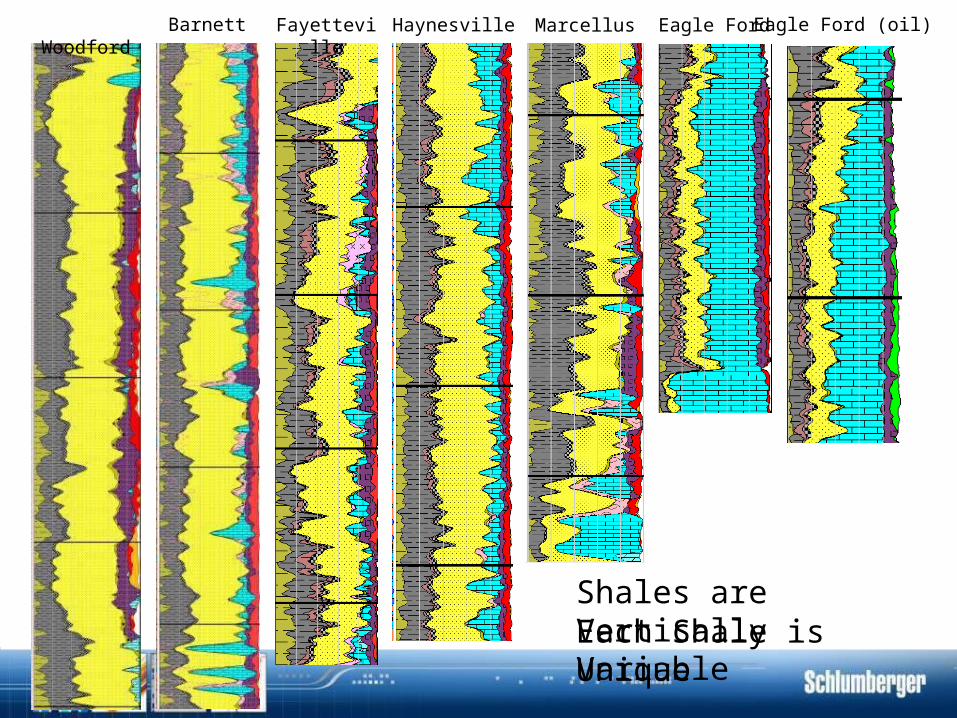
MarcellusHaynesvilleBarnett Woodford Fayetteville Eagle Ford Eagle Ford (oil)
Each Shale is UniqueShales are Vertically Variable

Core/Log Petrophysical AnalysisECSXRD
SwPorosity
TOCPermPorosity
Gasin PlaceELAN
RHOBRHOMResGR
TOC: > 2 wt %Permeability: > 100 nd
Effective phi: 4 to 12 puSaturations: Sliquid < 45%

Shale in Perspective: Permeability 100 nD = 0.0000001 D = 1 ten millionth of a Darcy

Consequence of Extremely Low Matrix Permeabilities:
Matrix-Block - Gas Pressure (psia)
12/28/2003 00:00:00 180.0000 days
3500
3000
2500
2000
1500
1000
500
10 ft
10 Year Pressure Profile
Shale in Perspective: Permeability
– Majority of Pressure Drop at Fracture Face– At Initial Reservoir Pressure 10s of meters from fracture for years– Hydraulic Fracturing is a REQUIREMENT– Hydraulic Fracture Complexity can induce a pressure drop from multiple directions
5 Year Pressure Transient
10 Year Pressure Transient
60 Year Pressure Transient
5 Year Pressure Transient
10 Year Pressure Transient
60 Year Pressure Transient
Hydraulic Fractures at 250 ft Spacing (400 nd)
100 nD = 0.0000001 D = 1 ten millionth of a Darcy
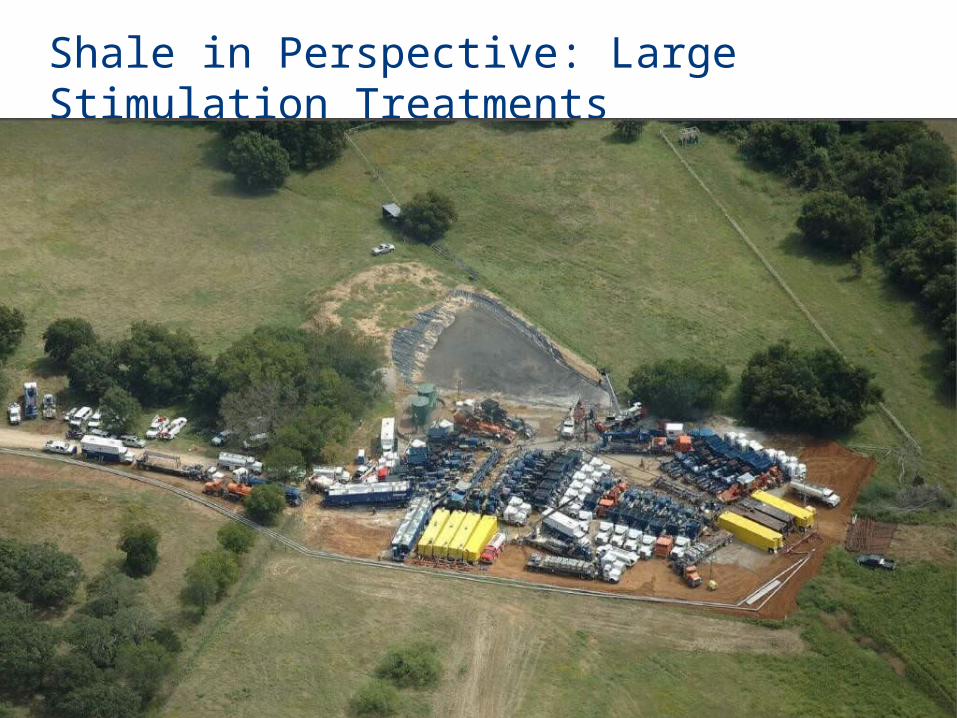
Shale in Perspective: Large Stimulation Treatments
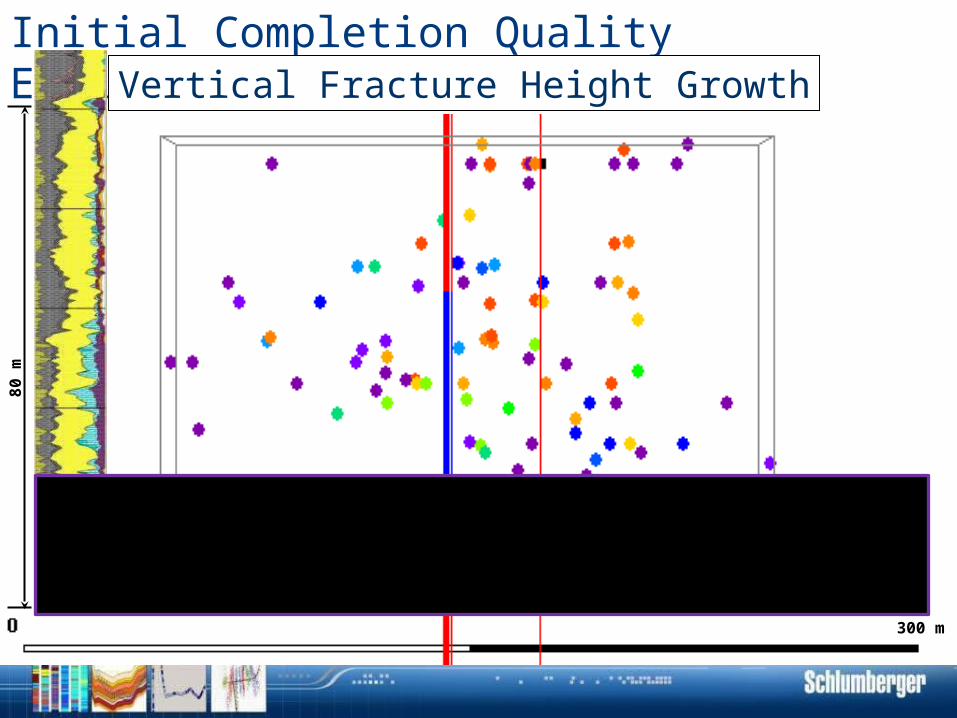
Initial Completion Quality Evaluation:8
0 m
300 m
Vertical Fracture Height Growth
80
m
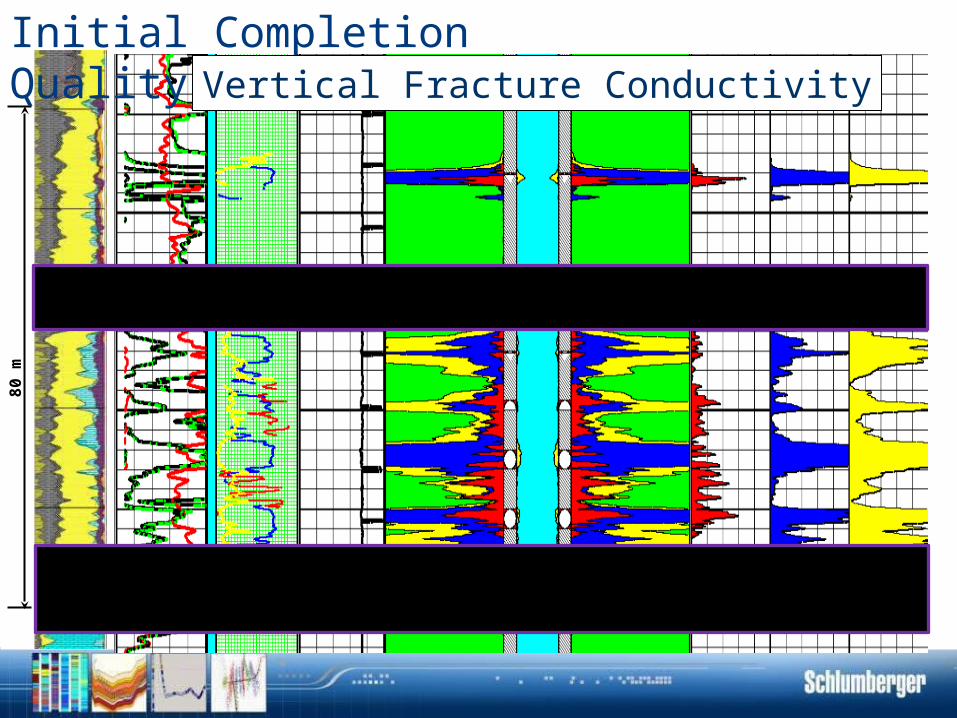
Initial Completion Quality Evaluation:Vertical Fracture Conductivity
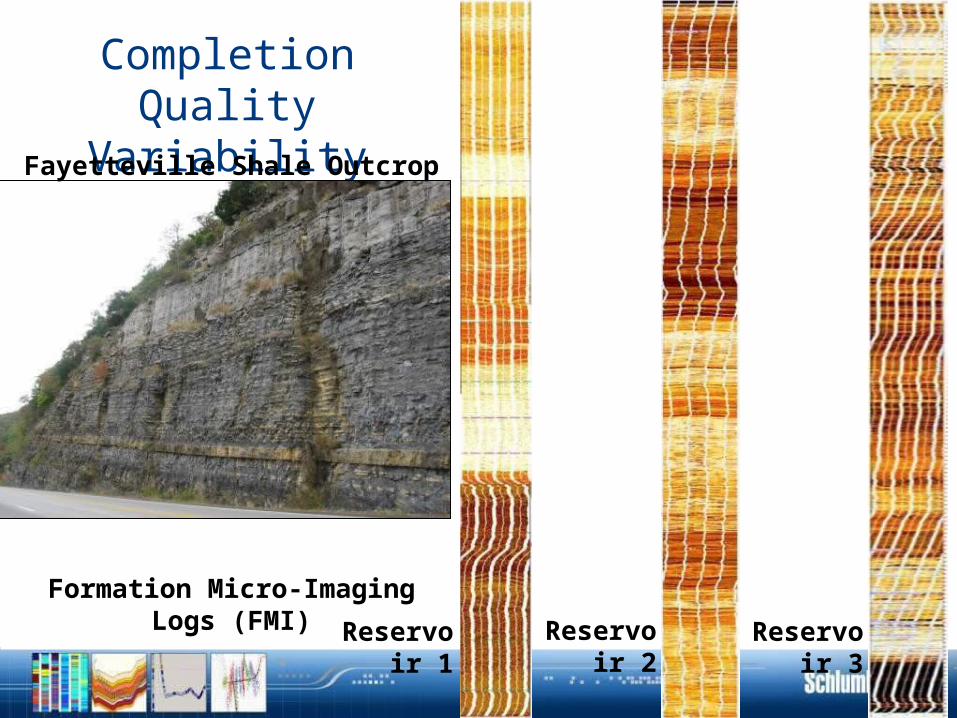
Completion Quality Variability
Reservoir 3Reservoir 2Reservoir 1
Formation Micro-Imaging Logs (FMI)
Fayetteville Shale Outcrop

Lateral Heterogeneity – Horizontal Image Logs
Reservoir 3
Reservoir 2
Reservoir 1
600 m
500 m
700 m
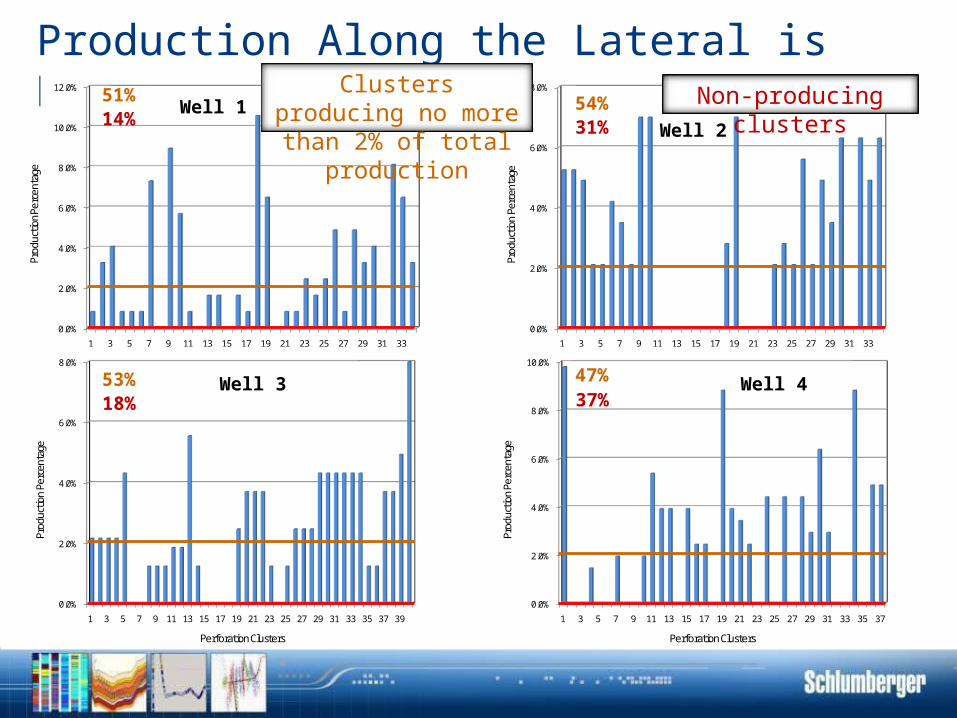
Production Along the Lateral is Not Uniform
0.0%
2.0%
4.0%
6.0%
8.0%
10.0%
12.0%
1 3 5 7 9 11 13 15 17 19 21 23 25 27 29 31 33
Perforation Clusters
Prod
uctio
nPer
cent
age
0.0%
2.0%
4.0%
6.0%
8.0%
1 3 5 7 9 11 13 15 17 19 21 23 25 27 29 31 33
Perforation Clusters
Prod
uctio
nPe
rcen
tage
0.0%
2.0%
4.0%
6.0%
8.0%
1 3 5 7 9 11 13 15 17 19 21 23 25 27 29 31 33 35 37 39
Perforation Clusters
Prod
uctio
nPe
rcen
tage
0.0%
2.0%
4.0%
6.0%
8.0%
10.0%
1 3 5 7 9 11 13 15 17 19 21 23 25 27 29 31 33 35 37
Perforation Clusters
Prod
uctio
nPe
rcen
tage
51%
53%
54%
47%
14%
18%
31%
37%
Clusters producing no more than 2% of total production
Non-producing clusters
Well 3 Well 4
Well 1Well 2

Addressing Variable Completion QualityWireline Horizontal Geomechanical Analysis Quantify lateral stress variation Indentify stress anisotropy Group frac stages in “Like Rock” Perforate similarly stressed rock
Stage 1Stage 2Stage 3Stage 4
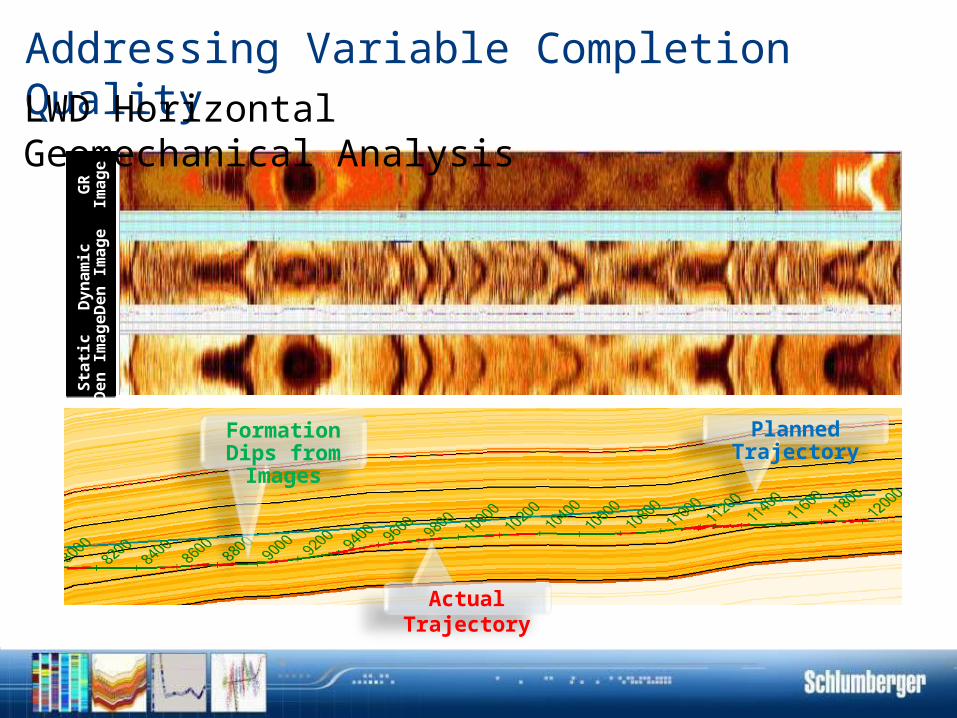
Addressing Variable Completion Quality
Formation Dips from Images
AB BC CH H HG GF FE ED DI IG
Gam
ma
Ray
Res
istiv
ityD
en /N
euPo
rosi
tySt
atic
D
en Im
age
Dyn
amic
D
en Im
age
GR
Imag
e
Planned Trajectory
Actual Trajectory
LWD Horizontal Geomechanical Analysis
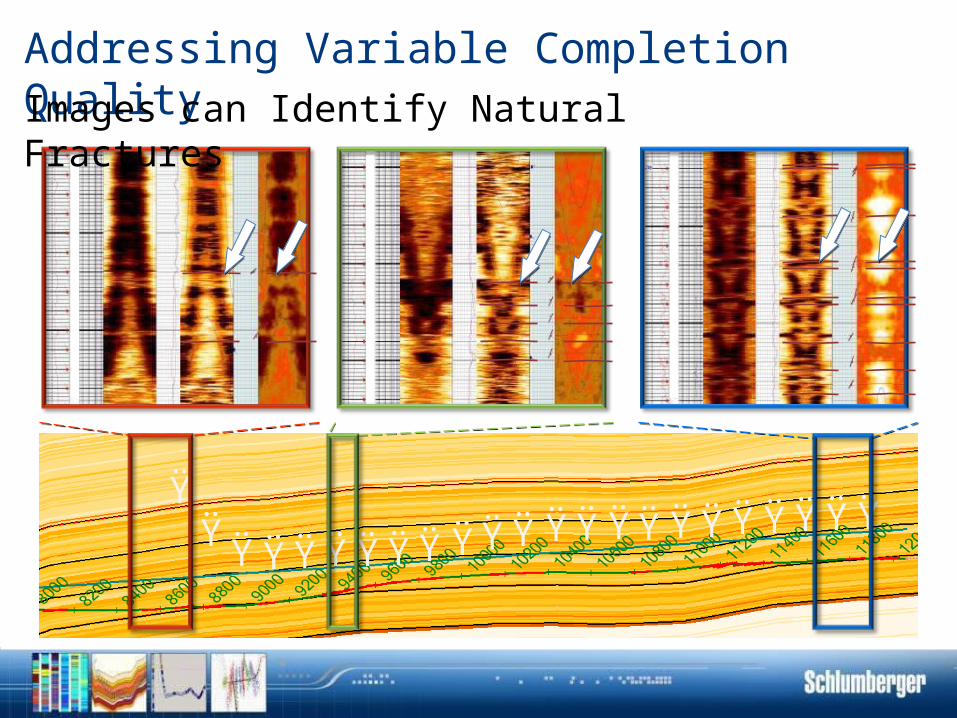
Ÿ Ÿ ŸŸ Ÿ Ÿ ŸŸ Ÿ Ÿ Ÿ Ÿ Ÿ Ÿ Ÿ ŸŸŸ
ŸŸ ŸŸ Ÿ
Addressing Variable Completion QualityImages can Identify Natural Fractures

Putting it All Together
Reservoir Quality
Completion Quality
Den Image
Spectroscopy
Volumetric
Porosity /Saturations
TOC
HC in Place
Reservoir, Pay
Rock Strength
Frac gradient

Addressing Variable Completion QualityEagle Ford Shale Example – Geometrical Staging
SPE134827

Addressing Variable Completion QualityEagle Ford Shale Example – Selective Staging
SPE134827

0
10000
20000
30000
40000
50000
Pre Optimization (6 Wells) Post Optimization (3 Wells)
3 M
onth
BO
E
Completion Optimization to Maximize Production New wells used Reservoir Quality and Completion Quality to optimize completions 33% increase in 3 month average cumulative BOE on new wells compared to offsets
SPE134827
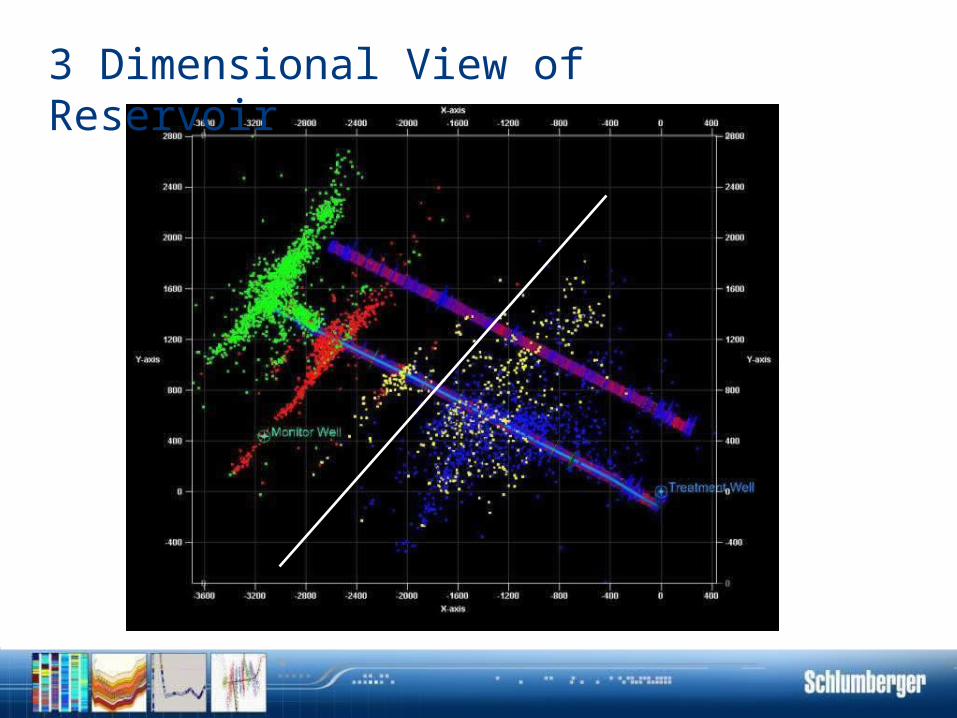
3 Dimensional View of Reservoir

Integrating Seismic Attributes with Fracture Geometry
Microseismic event locations along with the azimuth of most negative curvature (arrows) and magnitude of most positive curvature (background color)
SPE131779

Coupling Fracture Geometry to Reservoir SimulationEvaluation of Completion Quality
hmax
hmin
Unconventional Fracture Geometry Model
Eclipse Reservoir Simulation
Petrel platform allows stress heterogeneity integration
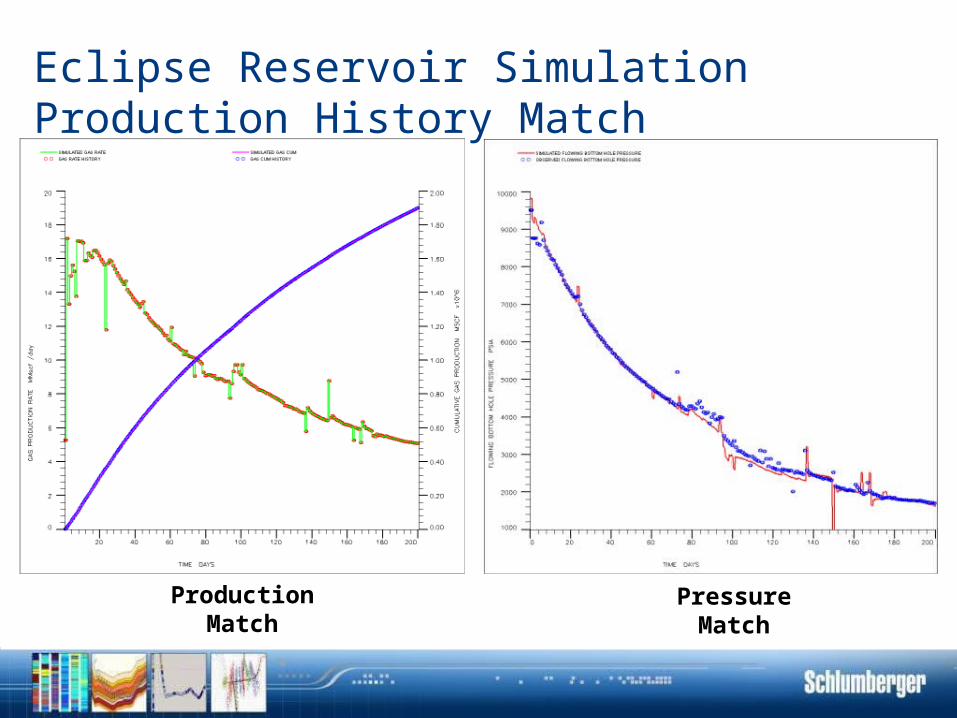
Eclipse Reservoir Simulation Production History Match
Production Match Pressure Match

Reservoir Exploitation
Estimated Ultimate
Recoveries
Recovery Factors
Reservoir Development
Completion Quality Optimization

Minimum data utilized Accept statistical variation in well performance Compensate by drilling more wells Factory approach to drilling and completion Large footprint – high rates & large fluid volumes
Collect optimum data Understand the reservoir and completion quality Reservoir based well placement Utilize technology to improve drilling & completion efficiency Reduced equipment footprint and fluid volumes
Model 1… Model 2…
What is the right model for success?
Good Reservoir Quality + Good Completion Quality = Economic Success

Thank You
Contour map of Reservoir Quality
Contour map of Completion Quality
Good Reservoir Quality + Good Completion Quality = Economic Success