international journal of learning - … · predictions” (casti 1990, p. 31). hence we have come...
TRANSCRIPT

Edited by Mary Kalantzis and Bill Cope
WHAT LEARNING MEANS: Proceedings of the Learning Conference 2003
C-TOOLS
Concept-Connector Tools for Online Learning
in Science
Douglas B. Luckie, Janet McCray Batzli, Scott Harrisonand Diane Ebert-May
INTERNATIONAL JOURNAL OF LEARNINGVolume 10, 2003
Article: LC03-0088-2003

This journal and individual papers published at http://LearningConference.Publisher-Site.com/a series imprint of theUniversityPress.com
First published in Australia in 2004 by Common Ground Publishing Pty Ltd athttp://LearningConference.Publisher-Site.com/
Selection and editorial matter copyright © Mary Kalantzis and Bill Cope 2003/2004Individual chapters copyright © individual contributors 2003/2004
All rights reserved. Apart from fair dealing for the purposes of study, research, criticism or review as permittedunder the Copyright Act, no part of this book may be reproduced by any process without written permissionfrom the publisher.
ISSN 1447-9494 (Print)ISSN 1447-9540 (Online)
The International Journal of Learning is a peer-refereed journal which is published annually. Full papers submitted for publicationare refereed by the Associate Editors through an anonymous referee process.
Papers presented at the Tenth International Literacy and Education Research Network Conference on Learning.Institute of Education, University of London 15-18 July 2003

Editors
Mary Kalantzis, Faculty of Education, Language and Community Services, RMITUniversity, Melbourne, Australia.
Bill Cope, Centre for Workplace Communication and Culture, Australia.
Editorial Advisory Board of the International Journal of LearningMichael Apple, University of Wisconsin-Madison, USA.David Barton, Director, Literacy Research Centre, Lancaster University, UK.Ruth Finnegan, Faculty of Social Sciences, Open University, UK.James Paul Gee, University of Wisconsin-Madison, USA.Kris Gutierrez, University of California, Los Angeles, USA.Roz Ivanic, Lancaster University, UK.Carey Jewitt, Institute of Education, University of London, UK.Andeas Kazamias, University of Wisconsin, Madison, USA.Gunther Kress, Institute of Education, University of London.Sarah Michaels, Jacob Hiatt Center for Urban Education, Clark University,
Massachusetts, USA.Denise Newfield, University of Witwatersrand, South Africa.Ambigapathy Pandian, School of Humanities, Universiti Sains Malaysia, Penang,
Malaysia.Miguel A. Pereyra, University of Granada, Spain.Scott Poynting, University of Western Sydney, Australia.Michel Singh, University of Western Sydney, Australia.Pippa Stein, University of Witwatersrand, South Africa.Brian Street, King’s College, University of London, UK.Gella Varnava-Skoura , Department of Early Childhood Education, National and
Kapodistrian University of Athens, Greece.Nicola Yelland, Head, Department of School and Early Childhood Education, RMIT
University, Australia.Wang Yingjie, School of Education, Beijing Normal University, China.Zhou Zuoyu, School of Education, Beijing Normal University, China.

International Journal of Learning, Volume 10 • www.LearningConference.Publisher-Site.comCopyright © Common Ground ISSN 1447-9494 (Print) • ISSN 1447-9540 (Online)Paper presented at the Tenth International Literacy and Education Research Network Conference on Learning.Institute of Education, University of London 15-18 July 2003 • www.LearningConference.com
C-TOOLS
Concept-Connector Tools for Online Learning in Science
Douglas B. Luckie, Janet McCray Batzli, Scott Harrisonand Diane Ebert-May
Abstract
This manuscript describes the activities of an interdisciplinary team of faculty fromMichigan State University in a three-year National Science Foundation (NSF)-funded project to develop and validate a new assessment tool, the ConceptConnector, consisting of a web-based, concept mapping Java applet withautomatic scoring and feedback functionality.
The value of knowledge scaffolding tools such as concept maps, flow charts andvenn diagrams is that they reveal student understanding about the directrelationships and organization among many concepts, elements not easily assessedby multiple choice questions or even extended responses. The Concept Connectortool is being designed to enable students in large introductory science classes tovisualize their thinking online and receive immediate formative feedback. TheConcept Connector’s flexible scoring system, based on tested scoring schemes aswell as instructor input, has enabled automatic and immediate online scoring ofconcept map homework. The Concept Connector has been successful in ‘makingtransparent’ when students do not understand concepts and has motivated studentsto address these deficiencies.
The validity of the Concept Connector is being determined by a ‘design’experiment (Suter and Frechtling 2000) that involves testing the tool withundergraduate science-majors in introductory biology, geology, physics andchemistry courses. A cohort of over 1000 students, those enrolled in participatingcourses, are being recruited to test the effectiveness of the tool to assess(mis)understanding.
Introduction
The Model
In teaching, how many of us have walked away from a wonderfully engaging classfeeling confident our students understood the material we presented, to later bedisappointed with the exam scores? In our biology classes we have observedbrilliant students that could teach their peers the intricacies of DNA replication butwere stumped by the “easy” questions on the exam that required them to explainthe relationship between a gene, DNA and a chromosome. Students often seem tounderstand the details, but do not see the big picture or the connections between a
International Journal of Learning, Volume 10, 2003
1052
new concept and the last. Those of us that teach science should reflect on our bestpractices as scientists. In our own learning as scientists, we use visual models tounderstand complex systems, to communicate our ideas to our peers, and to deducetestable hypotheses. Models are one of the common themes in science; they are“the main vehicle by which science actually produces its explanations andpredictions” (Casti 1990, p. 31). Hence we have come to believe that students andscientists alike should use visual models to describe, evaluate and learn science. Inour own quest to find modelling approaches that could help our students reflect onthe big picture, we discovered a cornucopia of educational tools. Vee diagrams,venn diagrams, concept maps, flow charts, and storyboards, to name just a few,were all developed by experts to resolve this dilemma. But what does the researchliterature say about the effectiveness of each tool? And can we get a good onlineversion that all students can access and use?
In our research we found that many tools showed great potential, but theconcept mapping approach developed by Novak et al (1984, 1998) was the beststudied and validated visual tool for student learning. It forces students to confrontand grapple with the alternative or mis- conceptions they bring to their learning.Nearly thirty years of research and numerous studies show concept maps cansucceed as both an effective instruction and formative assessment tool for higher-level learning. Currently, online formative assessment tools are rare, and web-based concept mapping software is either not readily available or does not exist.After much discussion with colleagues who teach large introductory sciencecourses and the realization that “(they) won’t really use it, unless it grades itself,”we decided to create software that delivers online concept mapping capability withautomated grading feedback.
As a result, an interdisciplinary team of faculty from the College of NaturalScience and the Lyman Briggs School at Michigan State University (Figure 1) aredeveloping, validating, and disseminating a new assessment tool called the“Concept Connector” (now available in beta version at http://ctools.msu.edu/). TheConcept Connector is a web-based concept mapping Java applet that is beingdeveloped and paired with automatic scoring and feedback functionality. This toolwill enable students in introductory science courses (and any other courses thatfind concept maps useful) to visualize their thinking online as well as to receiveimmediate formative feedback. The assessment tool and the methods of itsapplication in the classroom are being designed to motivate students to reflect,revise and share their thinking with peers as an extension of the learning process.The value of knowledge scaffolding tools such as concept maps, flow charts andvenn diagrams is that they reveal student understanding about the directrelationships and organization among many concepts, elements not easily assessedby multiple choice questions or even extended responses.
C-TOOLSDouglas B. Luckie, Janet McCray Batzli, Scott Harrison and Diane Ebert-May
1053
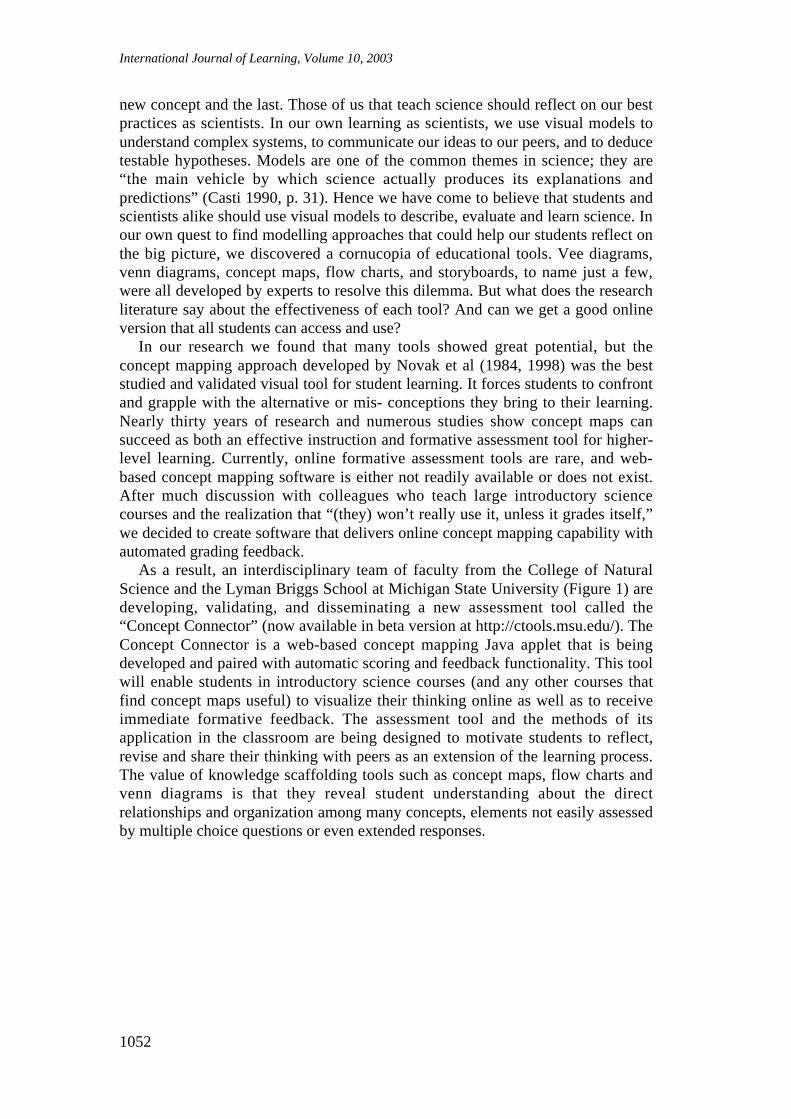
Figure 1A flow diagram of the C-TOOLS project activities. Faculty will work withProgrammers to develop the software, as well as the problem sets with conceptmaps for their courses. Faculty will teach using the Concept Connector in onlinehomework assignments and arrange to observe and interview some studentsworking on the homework. Students will work individually and in groupsreflecting on the concepts they learned in class and also talk to the Faculty andProgrammers about problem sets, software and science.
Background on Concept Maps
Knowledge diagramming tools like concept mapping can enable students toorganize and retrieve ideas, to construct new knowledge and link it to existingknowledge. The ability to connect seemingly disparate terms and ideas is one ofthe skills that distinguishes expert from novice problem solvers. A meta-analysis of19 studies revealed that concept mapping had positive effects on both studentachievement and students’ attitudes toward science (Horton et al. 1993). Studentsconstruct new knowledge from their personal experiences and communication withothers by adding new concepts to memory, making new connections betweenconcepts and subdividing existing concepts (Edelson 2001). These tools enablestudents to build on scientific ideas as they develop more interconnectedunderstanding of scientific principles and abstract concepts (Linn and Hsi 2000).
Concept maps and semantic networking have been the focus of manyresearchers’ studies, particularly at the K-12 level (Novak and Gowin 1984, Mason1992, Novak 1998, Mintzes et al. 1999, 2000, Fisher 2000). Among the mostcomprehensive reviews of concept maps as assessment tools was Ruiz-Primo andShavelson (1996). They compared 21 different methods of assessing concept mapsfor level of validity and found Novak and Gowin (1984) among the besttechniques. We will use a similar algorithm as the starting point of our automatedscoring functionality while allowing instructors to add new algorithms through thevalidation process. Concept map scores will be based on hierarchy as well as agraduated scale of valid to invalid nodes and links between nodes.

International Journal of Learning, Volume 10, 2003
1054
Although the idea of concept mapping has been recognized for nearly threedecades and computer-based tools for implementation are available to universityfaculty, few are web-based and none of the online tools have embedded assessmentcomponents for automated scoring (‘Visio’ by Microsoft, ‘Concept Mapping withMultimedia’ by IBM, Anderson-Inman and Zeitz 1993, ‘Inspiration’ Inc. 1995,‘PIViT’ 1996, ‘MindJet/MindMapping’ by Buzan, ‘Concept Map Toolkit’ byIHMC, ‘Decision Explorer’, ‘VisiMap’, ‘Cmap 2.0’, ‘ECCE!/LifeMap’, Anderson-Inman et al. 1998, ‘SemNet’ Fisher et al. 1990). “SemNet” by Kathleen Fisher’sgroup is the most impressive tool we have found (Fisher 2000). It is an excellentexample of the power of tracking and scoring student work using visual models(spider-style concept maps). Unlike SemNet, our Concept Connector tool will beweb-based, use hierarchical concept maps, and send automated scoring feedback toboth students and instructors. We believe this approach will improve studentlearning and make the tool very useful for faculty. Automated feedback to studentswill allow instructors to use the tool on a large scale, and web-based conceptmapping can enable students to save, revisit, reflect upon, share and explorecomplex problems in a seamless, fluid manner from any internet terminal (Pea etal. 1999).
Theoretical Framework of Concept Mapping
Our project is influenced by Bruner (1960, 1966), Ausubel (1963; 1968) and otherswho have studied the role of representation (Fosnot 1996) and visualization inlearning (Pea et al. 1999). While we recognize that students are continuallyconstructing meaning of information, we also know that we, as teachers, can aidthis process through our pedagogical strategies and instructional designs. Researchon learning theory indicates that the use of generative learning strategies, such asmaking concept maps or semantic networks, facilitates meaningful learning byhelping students build new mental relationships and/or reconstruct priorconceptions to further learning (Wittrock 1992, Fisher 2000, Ritchie and Volkl2000). Since concept maps are not domain-specific, using them across differentdisciplines can provide a knowledge structure to students as they explore complexproblems in other courses (Pea et al. 1999).
Concept maps have been referred to as the “cartography of cognition”(Wandersee 1990) because a learner maps words in a network where each wordrefers to other words in a spatially defined relationship. For instance, the concept‘sun’ conjures up the sensory and perceptual terms: heat, yellow, bright, light,round, ball of fire (Figure 2).
Figure 2A hierarchical concept map of ‘sun’ constructed using the ‘Concept Connector’Java applet containing initial sensory terms of student.

C-TOOLSDouglas B. Luckie, Janet McCray Batzli, Scott Harrison and Diane Ebert-May
1055
Figure 3A student’s concept map constructed after more learning about ‘light.’
With more experience the learner may integrate additional terms like: photons,radiation, and energy. Each of these terms is connected slightly differently to theconcept of ‘sun’. These different relations and organization can be modelled in aconcept map so that they are explicit, easily recognizable and comparable (Figure3). The relationship between concepts given on a map is defined with the use of‘linking words’ that reflect the meaning and context of the concepts being used.Although explanations of connections are possible through the use of textual orspoken explanations alone, the multiple connections are not as explicit as they arein the form of a concept map. “To achieve integrated understanding, students linkand connect ideas. Students with integrated understanding have a cohesive view ofa domain and can apply their ideas to personally relevant problems.” (Linn 1995,p.104).
Overview Of C-TOOLS Project
I. The Goals and Timeline
With both the literature providing a solid theoretical basis for using concept mapsand the field of computer science providing the proper software development toolsand technology, the C-TOOLS project began in late 2002. A team of faculty fromMichigan State University spent much of the first year of a three-year project“developing” both the Java applet, called the Concept Connector, and the problemssets with concept maps for science students. In parallel with software developmentis the study of how students use the tool. The validity of the Concept Connector isbeing determined by a ‘design’ experiment (Suter and Frechtling 2000) thatinvolves testing the tool with undergraduate science-majors in introductorybiology, geology, physics and chemistry courses. A cohort of over 1000 students,those enrolled in participating courses, are being recruited to test the effectivenessof the tool to assess their (mis)understanding and help them progress in theirlearning. In addition to students, the C-TOOLS project also strives to help facultydevelop skills and best practices to use concept maps in their classroom and furtherdisseminate good teaching practices to their colleagues.
The specific goals and timeline (Figure 4) of the C-TOOLS project are:

International Journal of Learning, Volume 10, 2003
1056
• Develop and validate a web-based concept mapping tool that can provideimmediate feedback (automated) to both students and instructors.
• Develop and test concept map-based problem sets made for biology,chemistry, geology and physics courses that are designed to motivatestudents to grapple with the relationships and organization amongfundamental concepts within and between each discipline.
• Enable students to use and revise concept maps individually, and thenexplain and modify the maps with their peers (to recognize their ownarea(s) of incomplete understanding).
• Document how undergraduate students use web-based concept mappingindividually and in groups (and correct their own area(s) of incompleteunderstanding).
• Detect and document students’ misconceptions regarding relationshipsbetween concepts (e.g., relation between ecology and quantum physics, orstructure and function of DNA).
• Provide affiliate faculty workshops to design curricula that enables studentsto represent their understanding, to use and revise concept maps and theConcept Connector, and to assess student learning throughout the process.
•
Figure 4
The C-TOOLS project timeline. During years 1 and 2 of the project, faculty createproblem sets, test the tool, and teach with problem sets. Additionally, PIs conductobservations, interviews and start the dissemination process. Programmers begandeveloping the primary tool during year 1, followed by revisions/support. Studentswere first involved in the project to test the tool in spring 2003, and used the tool inclassroom online homework problem sets.
II. The Programmers: Software Development
The Concept Connector beta version has been created as the combination of anonline Java applet that serves as a map drawing tool residing in an html page thatcommunicates with unix-based (unix, linux, osx) server side software to allowstudents to seamlessly create, save in a “gallery”, restore, revise and submit

C-TOOLSDouglas B. Luckie, Janet McCray Batzli, Scott Harrison and Diane Ebert-May
1057
concept maps and receive automatic scoring feedback. The system also allowsfaculty to develop problems, review student maps and send feedback online viafreeware course management software (currently using “Moodle”). In year 1, theautomatic scoring feedback, named “Robograder”, gave only feedback concerningthe validity of the semantic relationship between linked words in a proposition (i.e.concept A -> linking word -> concept B; see colour feedback in Figure 5). In year2, feedback concerning the arrangement of hierarchy (more broad concepts abovesubordinate concepts etc) will be added to the software.
In terms of architecture, as a technology, C-TOOLS does not require anythingsophisticated. Cross-linking databases, resource-specific handlers, and the usage ofservlets for interactivity have been in effective widespread use, and while thesoftware is “bleeding edge” we are not reinventing the wheel. Our current workingJava applet is browser-compatible on every OS platform and presents a menu-driven, interactive GUI (Figure 5). The applet is only 37 kilobytes in size and thusfunctions well at data speeds relevant to modem connections.
Figure 5A screenshot of the C-TOOLS website and Concept Connector Java applet graphicuser interface (GUI). Along the top grey bar are two javascript pull down menusfor Assignments and Navigation respectively, as well as a help ? button to provideuser assistance. This particular screenshot shows the Java applet’s GUI (bluecoloured areas), how the software draws a concept map, and how new colours(green and yellow rectangular halos or red X’s) appear when the Robograder isasked to GRADE a concept map (try it yourself online at http://ctools.msu.edu).
Figure 6 provides a simplified view of how the C-TOOLS software will bedesigned. Our primary interest is focused more on the two ‘ends’ of the flowchart,the instructor/student interface and the assessment algorithms. Much of the middleregion of the schematic can be replaced with any other database andcommunication system. The central portion consists of 6 relational databases thatare cross-linked together and interact with data from the student or instructor via

International Journal of Learning, Volume 10, 2003
1058
‘handlers’. Currently free course management software called Moodle is beingused but during the C-TOOLS study, software will be run from MSU’s LON-CAPA course management system and these databases and handlers provide asimple, stand-alone functionality to the C-TOOLS application, yet they can bereplaced in whole or in part with course management systems like Angel(http://www.angel.com), Blackboard (http://www.blackboard.com) or WebCT(http://www.webct.com). At MSU we are still exploring licensing issues associatedwith this integration, but the ability to integrate into other educational serversystems ensures longevity and a robust design methodology.
Figure 6A flow diagram of the software architecture of the Concept Connector. The flowchart provides a simplified view of how software will be modularised.
Automated scoring algorithms are being developed and embedded in theConcept Connector to allow for immediate feedback to students. The ConceptConnector’s flexible scoring system, based on tested scoring schemes as well asinstructor input, will enable automatic and immediate online scoring. As expertfaculty score connections on a graduated scale, their input will be added to agrowing computer-based library that will ultimately have full capacity to score allconnections stored in the library automatically. Criteria for scoring will be basedon agreed upon structure and connections by “expert” faculty in the content area.Faculty will conduct and analyse students’ dialogue as they use the ConceptConnector and conduct focus group interviews about the students’ use of the toolsand their resultant maps. In this project we strive to develop a tool for detection ofproblems in learning that include inaccurate, incomplete or vague conceptualunderstanding. The Concept Connector will enable faculty and students to readilyrecognize when students do not understand concepts and motivate both to addressthese deficiencies.

C-TOOLSDouglas B. Luckie, Janet McCray Batzli, Scott Harrison and Diane Ebert-May
1059
Supporting a concept tool in an interactive system presents a number of open-ended design challenges. In creating the software tool two main challenges exist:(1) algorithm design, the effective construction of automated grading algorithms,(2) interface design, the effective construction of the appearance of guidedinput/output of the computer in response to users.
Algorithm Design
It is reasonably straightforward to set up an online functional automated gradingsystem. Compared to asking a computer to grade an essay (which is also possible),grading a concept map is relatively simple. Automated grading is both technicallyfeasible, reliable and testable since the Concept Connector software will havemany controlled parameters to work with from its scoring database (10 concepts, a‘linking word’ pool, valid and invalid proposition information etc). Initial scoringwill count and assess items such as:
• Valid links; validity of links drawn from link pool or compared withcriterion maps.
• Hierarchy; grid system evaluates if major concepts are on top withsubordinates beneath.
• Crosslinks; detection of connections between distinct clusters of concepts.Beyond initial scoring, the software will automatically be able to “learn” to be a
better grader as it gathers more data. The software will start with a discrete pool ofinformation derived from expert criterion maps, but the pool is automaticallyexpanded by the actions of an instructor. For each concept map hand-graded onlineby an instructor (with the toolbox, Figure 8) more entries are added to the database.As a result the computer will slowly learn. The software will first work with smallmaps with 10 concepts, yet this system is designed to ramp up to larger maps andultimately to assess maps where concepts are student-generated.
Interface Design
A functional interface (intuitive appearance) is important. It will be important tocreate and revise a user-friendly interface so both the instructor and student canfocus on the task and not the software. Our current working applet shows that theentry and output of map data can be done online. The presentation of automatedfeedback and other features associated with C-TOOLS is a stylistic questionrelying on surveys and observation as opposed to experimental proof. Exampleinterface designs are shown in Figures 7, 8 and 9.

International Journal of Learning, Volume 10, 2003
1060
Figure 7A “Student’s View” of the interface after their first attempt at a concept map hasbeen submitted to the server. Notice the student rating and feedback for betterscores etc.

C-TOOLSDouglas B. Luckie, Janet McCray Batzli, Scott Harrison and Diane Ebert-May
1061
Figure 8An “Instructor’s View” of the map from Figure 7. After the computer sends thestudent automated feedback the instructor can view student data, try differentscoring algorithms/modules and use export buttons to move data to a MicrosoftExcel spreadsheet (Figure 9). The instructor can decide to give personal feedbackto this student and use the proposition toolbox (top right) to hand score a map orjust use the ‘drawing wand’ to circle problem areas for the student to revise.

International Journal of Learning, Volume 10, 2003
1062
Figure 9Exported data of the same map from Figure 7 represented in a spreadsheet.
III. The Faculty: Developing problem sets with concept maps.
In each course the instructor designs a question or problem that actively engagesthe students in the topic and has the potential for diagnosing students’misconception about the topic. The students explore the problem and makepredictions and/or hypotheses based on their current knowledge and assumptions.Students illustrate the relations among the key concepts in the problem byconstructing a concept map with the web-based tool. Then students can explaintheir map to the computer and explain their understanding to their peers verballyand in writing. Following this, students have the opportunity to revise their visualrepresentation of the map. In each course, for two problem sets, students create aminimum of 5 concept maps for data analysis. The concept map problem sets canbe developed and used by a faculty member in different instructional contexts.“Sources” faculty use for the concept maps include: analysis of readings from thescientific literature, answering a particular homework question designed to besolved with the tool, or creating concept maps in which student demonstrates theirmastery of the topic discussed in a class meeting. The concept maps are designedto:
• Actively engage students in critically analysing and reflecting on what theyknow.
• Illustrate their understanding of relationships and revise their representationas they learn.
• Make predictions and/or hypotheses based on assumptions and arguments.• Reveal fundamental deficiencies in the students’ understanding of the topic.
Whatever the objective of the instructors’ problem set in their course, the mapsand procedures for using them follow a protocol. Each instructor creates twoconcept map-based problem sets for their class. In creating a concept map toanswer the problem, at first, a list of 10 concepts about a topic is generated by theinstructor (this is all the student will be given). Then the instructor and colleaguescreate ‘expert’ criterion maps (keys). Expected hierarchy and an inventory of linksand propositions are extracted from the criterion maps by the computer for itsscoring database. WebPages are designed by the instructors and incorporated into

C-TOOLSDouglas B. Luckie, Janet McCray Batzli, Scott Harrison and Diane Ebert-May
1063
the Michigan State University ‘Learning Online Network’ system (LON-CAPA,http://lon-capa.org/) to present the problem sets and mapping tools to the student.Students ‘login’ to a problem set on LON, grapple with the 10 pre-definedconcepts and develop their own concept maps. Once a finished map is submitted,the computer then compares a student's map to the scoring database and sends thestudent their score and constructive feedback immediately. Currently this feedbackis colourized halo’s around the various links (Figure 5).
Each of the faculty involved in the project plan their instruction based on use ofthe online Concept Connector twice during their course(s). This represents aunique framework for research because faculty from four different disciplines(biology, chemistry, geology, and physics) each will use the tool differently in thecontext of their courses, yet the tool itself is the same. Therefore, a case study ofeach faculty’s use of the tool and subsequent student learning outcomes will enableus to triangulate the data to determine the effect of the tool in the context of sixdifferent courses. The case studies will provide data about the following questions:
• How was the course designed and instruction implemented using conceptmaps?
• What was the basis for the instructor developing two specific problemsand/or instructional units that involved using the tool? e.g., Was theproblem selected because students have a particularly difficult timeunderstanding the concepts involved?
• What is the role of hierarchy of concepts in the problems developed by thefaculty?
• How were students introduced to the use of C-TOOLS in class?• How do the students go about learning the tool and completing the
assignment? (Data from student interviews in the selected courses).During spring 2003, three faculty utilized the Concept Connector in three
different courses: Organismal biology (LBS-144), Cellular and Molecular biology(LBS-145), and Environmental science (ISB-202). Each instructor implementeddifferent strategies for using concept maps in their course and at the end of thesemester, Luckie and Ebert-May interviewed students from each other’s coursesabout use of C-TOOLS.
Interviews
In each course we use interviews and observations to examine studentconstructions of maps using the Concept Connector. After students complete alltheir individual work on the concept maps, eight students from each course (4pairs, two students selected randomly from quartiles based on grades) are selectedfor observation and interviews while they work together on the online maps. Allinterviews are transcribed and analysed by established inductive analysis methodsin social science (Bodgen and Bilkin, 1998).
Protocol for Interviews: We recruit 4 pairs of students/course to observe andinterview while they are constructing a concept map. First, we describe the projectin terms of two objectives; (1) how useable is the concept connector, (2) what isthe students’ current understanding of the problem. All interviews are audio-recorded. Each student writes a short response to the problem or question beforethey use the tool. Then together the pair of students design a concept map anddiscuss aloud comments, ideas, questions and rationales for what they are

International Journal of Learning, Volume 10, 2003
1064
constructing. The instructor observes only. After the students complete the map,the instructor then discusses the process and content of the map with them. Thestudents explain further their understanding of the problem and experience withusing the Concept Connector. After the interview is completed, the instructor hand-scores the maps to provide comparison data for the programmers. Concept mapsare scored by hand as described by Novak and Gowin 1984 (p.37) based onhierarchy, valid relationships, and cross-links (if valid and significant).
IV. The Students: Using concept mapping in large classrooms.
For the C-TOOLS study, we are recruiting a cohort of ~1000 freshman andsophomore students enrolled in each of the six introductory science-major courses:Biology I & II, Chemistry I & II, and Physics I & II, as well as two non-majorscience courses Introductory Biology and Geology. The faculty have agreed tocollaborate throughout the duration of the project (Table 1).
Table 1Targeted C-TOOLS courses for testing Concept Connector assessment tool.
C-TOOLS courses, instructors and enrollment
Course(Sequence)
Title Instructor Enrollment(semester)
LBS 144 (I) Organismal Biology (I) James Smith 150
LBS 145 (II) Cellular Biology (II) Douglas Luckie 85
LBS 171 (I) General Chemistry (I) Lynmarie Posey 250
LBS 172 (II) General Chemistry (II) Steven Spees 200
LBS 271 (I) Introductory Physics (I) Walter Benenson 200
LBS 272 (II) Introductory Physics (II) Walter Benenson 200
ISB 202 Integrative Studies in theBiological Sciences
Diane Ebert-May(non-majors)
250
ISP 203 Integrative Studies in thePhysical Sciences
Duncan Sibley(non-majors)
250
Many of the same students will take more than one of above the listed courses.We predict ~1000 different individual students will participate in the C-TOOLSstudy. The students are asked to participate in the project as described in theapproved Michigan State University UCRIHS (University Committee on ResearchInvolving Human Subjects) protocol.
Students complete the concept maps as an integral part of the course (twoassigned homework problem sets at week 5 and 10 of the 15-week semester).During class meetings in computer laboratories, students learn how to use the webtools. As indicated, online concept map-based homework assignments may varyfrom analysis of scientific literature to answering a particular homework question.To complete an assignment students login to a website (LON) and are presentedwith instructions and a new concept map with only 10 pre-defined concepts (in acluster). Students need to move the concept words around, organize hierarchy, addlinking words and lines. Students first construct a map individually, submit it to thecomputer and receive a score. They then can revise the map and resubmit. Finallythey work with a partner to complete the final concept map (Figure 7). Each newconcept map submitted receives a new (frequently improved) score.

C-TOOLSDouglas B. Luckie, Janet McCray Batzli, Scott Harrison and Diane Ebert-May
1065
Broader Impacts Of Project
We believe the results of this project will strategically contribute to thedevelopment of a readily accessible and acceptable assessment tool that will enablescience faculty who teach large, introductory science courses to gather substantivedata about student learning. Ideally, these data will motivate faculty to criticallyexamine their educational practice and consider implementing various instructionaldesigns that enable more students to learn. Through use of the Concept Connector,we hope students will strive to find interconnections between their science courses,recognize concepts that span disciplines more readily and, therefore, find greatermeaning in further study.
Intellectual Merit
In order for Science, Technology, Engineering, and Mathematics (STEM) facultyto achieve the new expectations advocated by the NSF (1996) and the NRC (1999),faculty need to develop and use more effective curricula and instructional designs.Importantly, faculty within SMET departments who wish to pursue the requisiteresearch on how individuals learn must be provided support to do so. Given theimportance of this challenge, it is striking to note the paucity of substantiveresearch that has actually influenced the development of curricular materials,technological tools, and accompanying instructional design of undergraduatescience courses. Scientists traditionally are not trained in the conduct ofeducational research, thus, this research represents an example of a study thatintegrates research with practical applications for scientists who teachundergraduates science. Just as the Force Concept Inventory (Hestenes et al 1992)captured the attention of physics instructors who thought their students understoodmechanics, we hypothesize that the Concept Connector will reveal to faculty andstudents a useful picture of their understandings and misconceptions.
Companion Projects and Support
Our assessment project has the support of colleagues and facilities associated withseveral other funded initiatives at Michigan State University including: a HowardHughes Medical Institute grant (“First Year Online” PI Estelle McGroarty) todevelop online learning modules in biology, a NSF ITR grant (“LON-CAPA” PIGerd Kortemeyer) and a Hewlett Foundation grant (“Assessing Student Outcomesin Integrative Studies” PI Duncan Sibley) to develop a technology infrastructure tosupport and research online learning. This C-TOOLS proposal articulates well withanother Michigan State University proposal recently funded under the NationalScience Foundation’s ASA program called “DQA” (PI Joyce Parker). The “DQA”project is intended to diagnose student misconceptions of which the conceptconnector tool should dovetail nicely to illuminate the nature of misconceptions.Dissemination of the findings of the C-TOOLS project is already utilizing anexternal network of faculty involved in the “FIRST II” NSF grant (PIs DianeEbert-May, MSU, and Jan Hodder, University of Oregon.) FIRST II is a facultydevelopment project that creates a national dissemination of instructional practices,materials such as C-TOOLS, and support systems that give faculty the ability tohelp all students learn science. C-TOOLS is delivered through the Learning-OnlineNetwork (LON-CAPA) test administration system developed at Michigan State

International Journal of Learning, Volume 10, 2003
1066
University in 1997 (http://lon-capa.org). This system supplies the infrastructure(hardware and software) with which to reliably deliver our web content 24hours/day.
Final Dissemination
The C-TOOLS faculty are committed to disseminating their findings andapproaches to their colleagues. When the ‘gold master’ final version of theConcept Connector software is completed at the end of 2005, the source code andall supporting documentation and resources will be released and open for usageand further development under the June 1991 General Public License(http://www.gnu.org/copyleft/gpl.html). Although the software is still indevelopment, all software is freely available online to any and all instructorsinterested in using online concept maps in their course (http://ctools.msu.edu/).
BibliographyAnderson-Inman, L. and Zeitz, L.1993. Computer-based concept mapping: Active study
for active learners. The Computing Teacher, 21: 1-5.Anderson-Inman, L, Ditson, L. A., and Ditson, M. T. 1998. Computer-based concept
mapping: Promoting meaningful learning in science for students with disabilities.Information Technology and Disabilities 5: [WWW document]. URL:http://www.rit.edu/~easi/itd/itdv05n1-2/article2.html (visited May 23, 2000).
Ausubel, D. 1963. The Psychology of Meaningful Verbal Learning. Grune and Stratton.New York, NY.
Ausubel, D. 1968. Educational Psychology. A cognitive view. New York: Holt Rinehartand Winston.
Bogdan R. C. and S. K. Biklen. 1998. Qualitative Research for Education: AnIntroduction to Theory and Methods. Allyn and Bacon. Boston, MA.
Bruner, J. 1960. The process of Education. Harvard University Press. Cambridge, MA.Bruner, J. 1966. Toward a theory of Instruction. Harvard University Press. Cambridge,
MA.Casti, J.L., 1990. Searching for certainty: what scientists can know about the future. New
York, W. Morrow, 496 p.C m a p 2 . 0 b y S c o t t B . H u n t e r a n d H o w a r d S t a h l
gopher://oldal.mannlib.cornell.edu/40/misc/Cmap_2.0.hqxConcept Map Toolkit by IHMC http://cmap.coginst.uwf.edu/Concept Mapping with Multimedia by IBM (Sherman Alpert and Keith Grueneberg)
http://www.research.ibm.com/AppliedLearningSciWeb/recent.htmlDecision Explorer (formerly called Graphics COPE) by Banxia Software
http://www.banxia.com/demain.htmlEdelson, D.C. 2001. Learning-for-Use: A Framework for the Design of Technology-
Supported Inquiry Activities. Journal of Research in Science Teaching, Vol. 38 No. 3,pp. 355-385
ECCE!/LifeMap2.8.1 by Educational Development Resource Centre Hong KongP o l y t e c h n i c U n i v e r s i t y ,http://hednet.polyu.edu.hk/CMWkshp_folder/CM.ResFolder.html
Fisher, K. M., Faletti, J., Patterson, H., Thornton, R., Lipson, J., and Spring, C. 1990.Computer-based concept mapping. Journal of College Science Teaching 19: 347-352.
Fisher, K. M. 2000. SemNet software as an assessment tool. In J.J.Mintzes, J. H.Wandersee, and J. D.Novak (eds.), Assessing science understanding: A humanconstructivist view. Academic Press. San Diego, CA.

C-TOOLSDouglas B. Luckie, Janet McCray Batzli, Scott Harrison and Diane Ebert-May
1067
Fosnot, C. 1996. Constructivism: A psychological theory of learning. In C. Fosnot (ed.),Constructivism: Theory, Perspectives, and Practice. Teach. Coll. Press. New York,NY. 8-33.
Hestenes, D., Wells, M., Swackhamer, G. 1992. Force concept inventory. The PhysicsTeacher 30: 144-145.
Horton, B., McConney, A. A., Gallo, M., Woods, A. L., Senn, G. J. and Hamelin D. 1993.An investigation of the effectiveness of concept mapping as an instructional tool.Science Education 77: 95-11.
Inspiration, Inc. 1995. Inspiration (software program). Beaverton, OR.Linn. M. 1995. Designing computer learning environments for engineering and computer
science: the scaffolded knowledge integration framework. Journal of ScienceEducation and Technology 4(2):103-126.
Linn, M. and S. Hsi, 2000. Computers, Teachers, Peers: Science Learning Partners. L.Erlbaum Associates. Mahwah, NJ.
Mason, C. 1992. Concept mapping: a tool to develop reflective science instruction.Science Education 76(1): 51-63.
McClure J.R., Sonak B., and Suen H.K. 1999 Concept Map Assessment of ClassroomLearning: Reliability, Validity, and Logistical Practicality. Journal of Research inScience Teaching 36 (4) 475-492.
MindJet -Out of Tony Buzan's Mind Mapping http://www.mindjet.com/Mintzes, J. J., Wandersee, J. H., and Novak, J. D. 1999. Teaching for Science
Understanding: A human constructivist view. Academic Press. San Diego, CA.Mintzes, J. J., Wandersee, J. H., and Novak, J. D. 2000. Assessing Science Understanding:
A human constructivist view. Academic Press. San Diego, CA.National Research Council. 1999. Transforming Undergraduate Education in Science,
Mathematics, Engineering, and Technology. National Academy Press. Washington,DC
National Science Foundation. 1996. Shaping the Future: New expectations forundergraduate education in science, mathematics, engineering, and technology.Report by Advisory Committee to NSF, Directorate for Education and HumanResources. Washington, DC.
Novak, J.D. and D.D. Gowin. 1984. Learning How to Learn. Cambridge University Press.New York, NY.
Novak, J. 1998. Learning, Creating, and Using Knowledge: Concept Maps as FacilitativeTools in Schools and Corporations. Lawrence Erlbaum Associates Publishers.Mahwah, NJ.
Pea, R., R. Tinker, M. Linn, B. Means, J. Bransford, J. Roschelle, S. His, S. Brophy, andN. Songer. 1999. Toward a learning technologies knowledge network. ETR&D.47(2): 19-38.
PIViT, 1996. University of Michigan, Ann Arbor, MI.Ritchie, D. and C. Volkl. 2000. Effectiveness of two generative learning strategies in the
science classroom. School Science and Mathematics 100(2): 83-89.Ruiz-Primo, M. A. and Shavelson, R. J. 1996. Problems and Issues in the Use of Concept
Maps in science assessment. Journal of Research in Science Teaching 33: 569-600.Ruiz-Primo, M. A., Schultz S.E., Li M. and Shavelson, R. J. 2001. Comparison of the
reliability and validity of scores from two concept-mapping techniques. Journal ofResearch in Science Teaching 38 (2) 260-278.
Suter, L. and J. Frechtling 2000. Guiding principles for mathematics and science educationresearch methods. NSFReport 00-113.
Visimap by CoCo Systems Ltd. http://www.coco.co.uk/prodvml.htmlVisio by Microsoft http://www.microsoft.com/office/visio/Wandersee, J. 1990. Concept mapping and the cartography of cognition. Journal of
Research in Science Teaching 27:923-936.