international finance chapter 19 c h a p t e r c h e c k l i s t when you have completed your study...
TRANSCRIPT
International Finance
CHAPTER19
C H A P T E R C H E C K L I S T
When you have completed your study of this chapter, you will be able to
1 Describe a country’s balance of payments accounts and explain what determines the amount of international borrowing and lending.
2 Explain how the exchange rate is determined and why it fluctuates.
19.1 FINANCING INTERNATIONAL TRADE
Balance of Payment Accounts
Balance of payments are the accounts in which a nation records its international trading, borrowing, and lending.
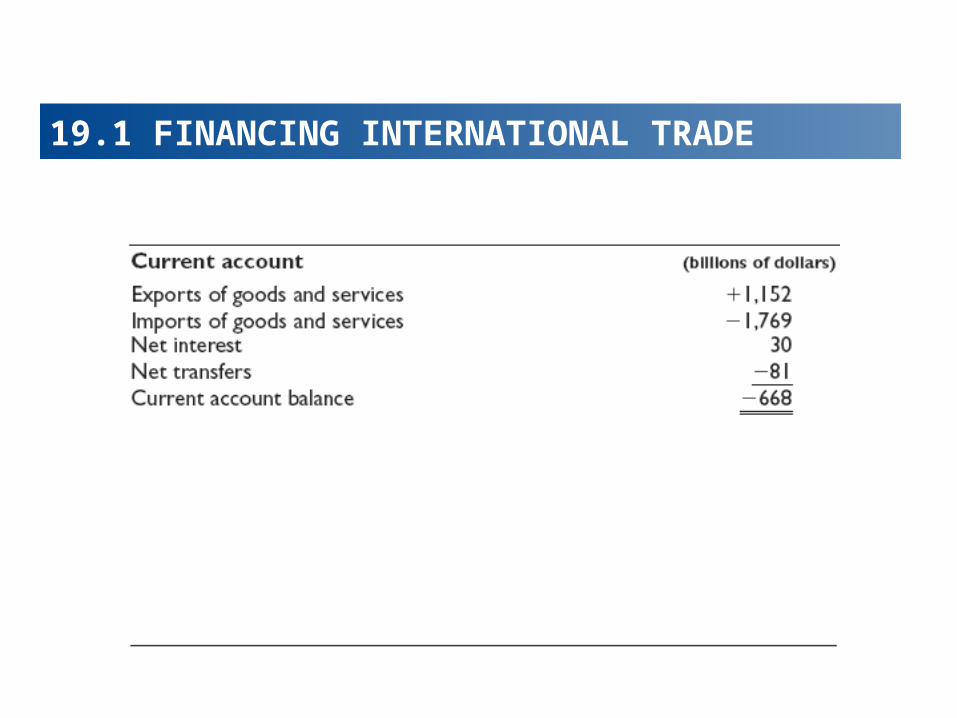
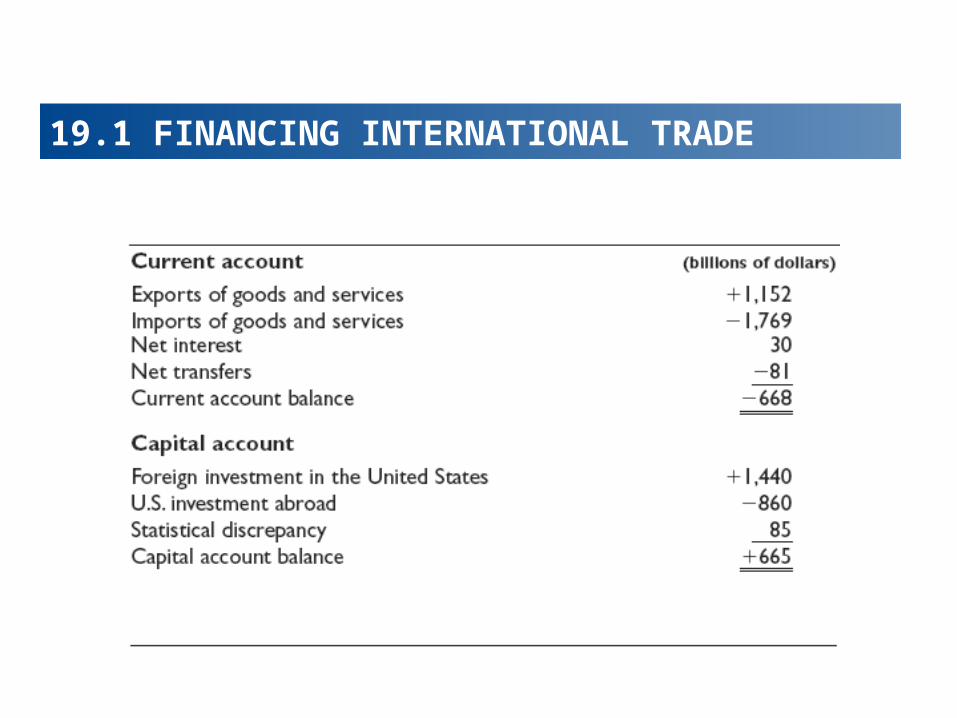
Current account records goods and services to other countries (exports), minus payments for goods and services bought from other countries (imports), plus the net amount of interest and transfers received from and paid to other countries.
19.1 FINANCING INTERNATIONAL TRADE
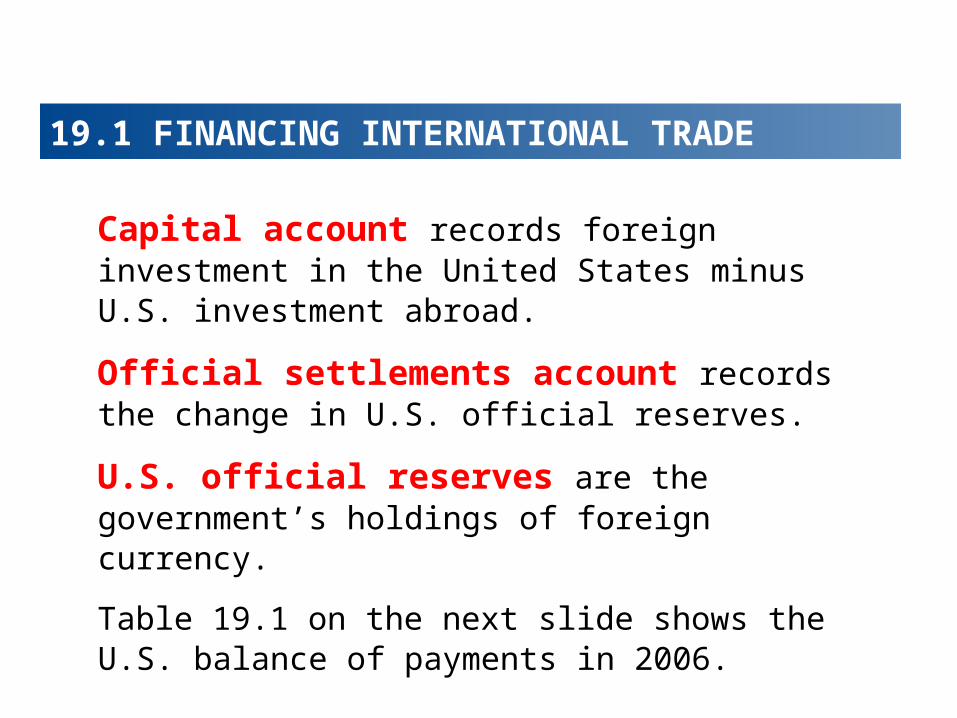
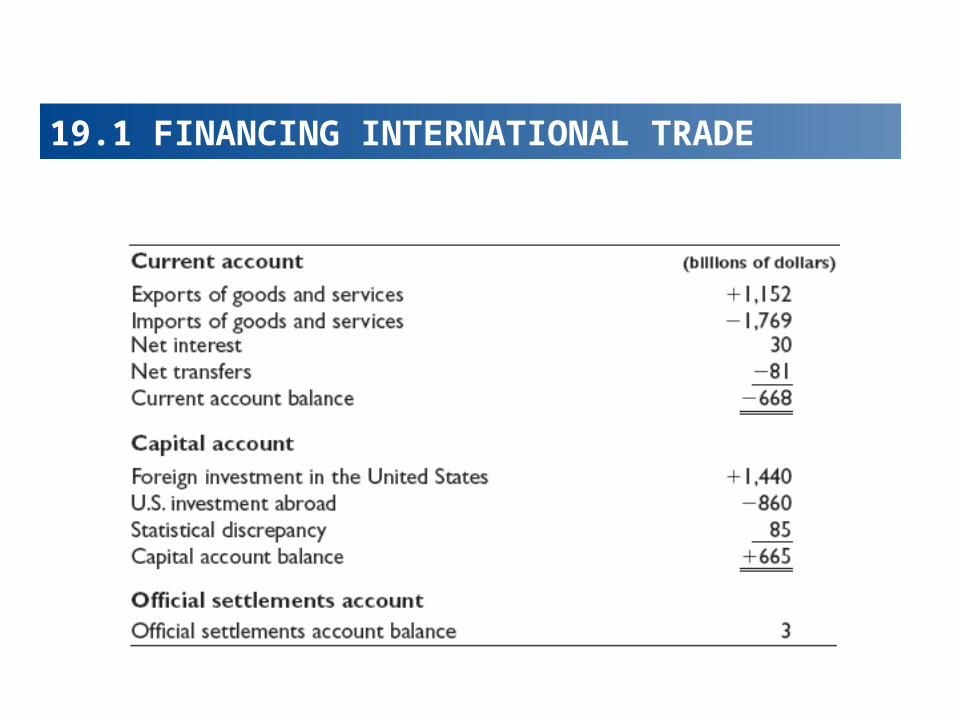
Capital account records foreign investment in the United States minus U.S. investment abroad.
Official settlements account records the change in U.S. official reserves.
U.S. official reserves are the government’s holdings of foreign currency.
Table 19.1 on the next slide shows the U.S. balance of payments in 2006.
19.1 FINANCING INTERNATIONAL TRADE
19.1 FINANCING INTERNATIONAL TRADE
19.1 FINANCING INTERNATIONAL TRADE
19.1 FINANCING INTERNATIONAL TRADE
Personal Analogy
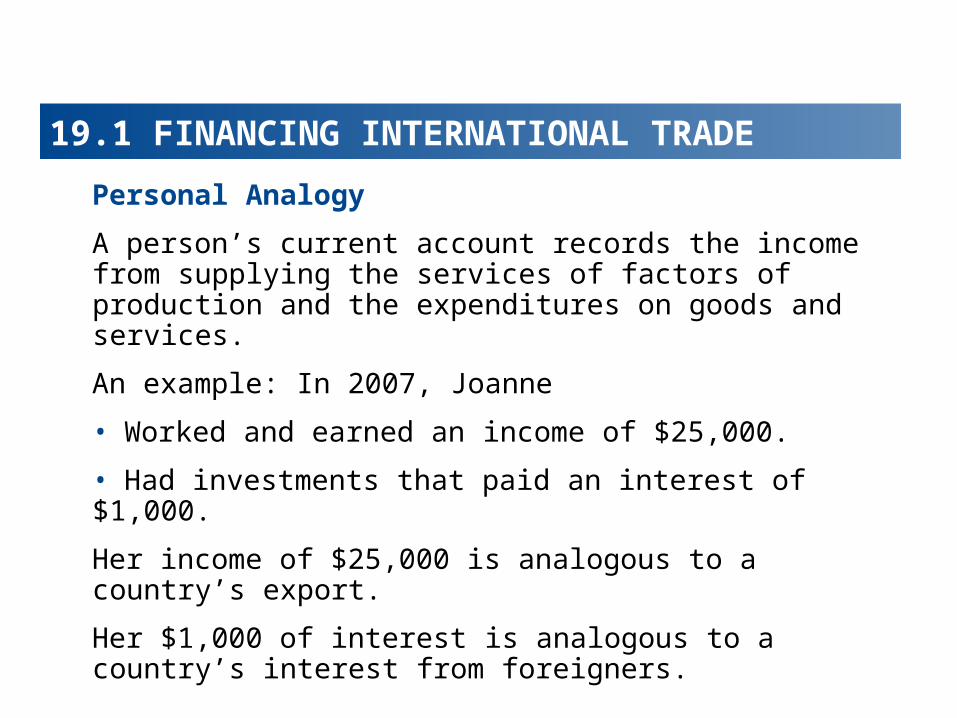
A person’s current account records the income from supplying the services of factors of production and the expenditures on goods and services.
An example: In 2007, Joanne
• Worked and earned an income of $25,000.
• Had investments that paid an interest of $1,000.
Her income of $25,000 is analogous to a country’s export.
Her $1,000 of interest is analogous to a country’s interest from foreigners.
19.1 FINANCING INTERNATIONAL TRADE
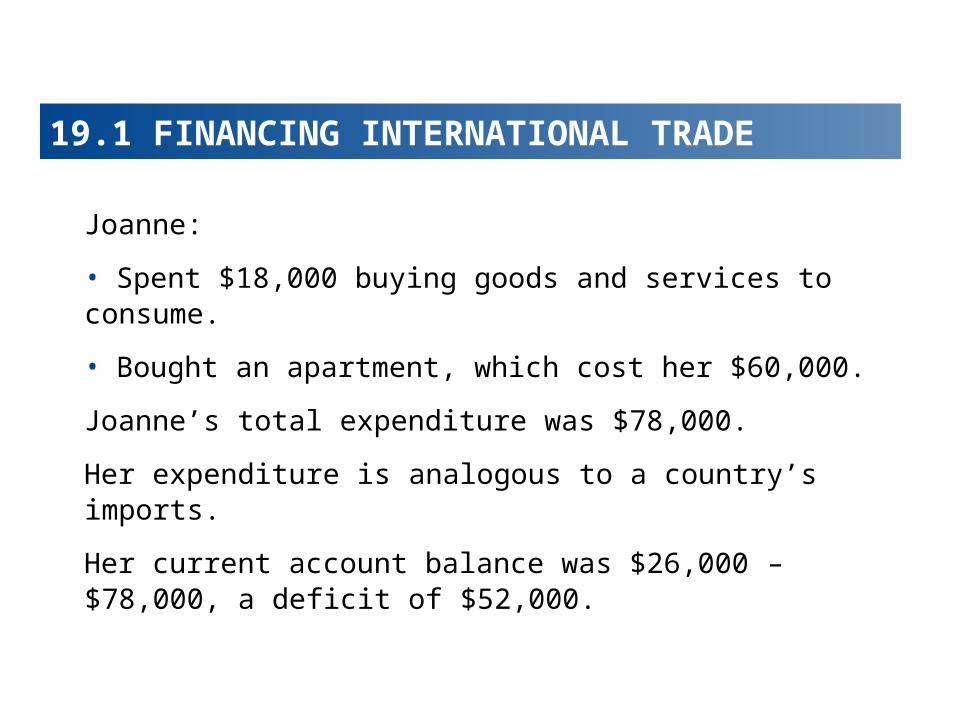
Joanne:
• Spent $18,000 buying goods and services to consume.
• Bought an apartment, which cost her $60,000.
Joanne’s total expenditure was $78,000.
Her expenditure is analogous to a country’s imports.
Her current account balance was $26,000 – $78,000, a deficit of $52,000.
19.1 FINANCING INTERNATIONAL TRADE
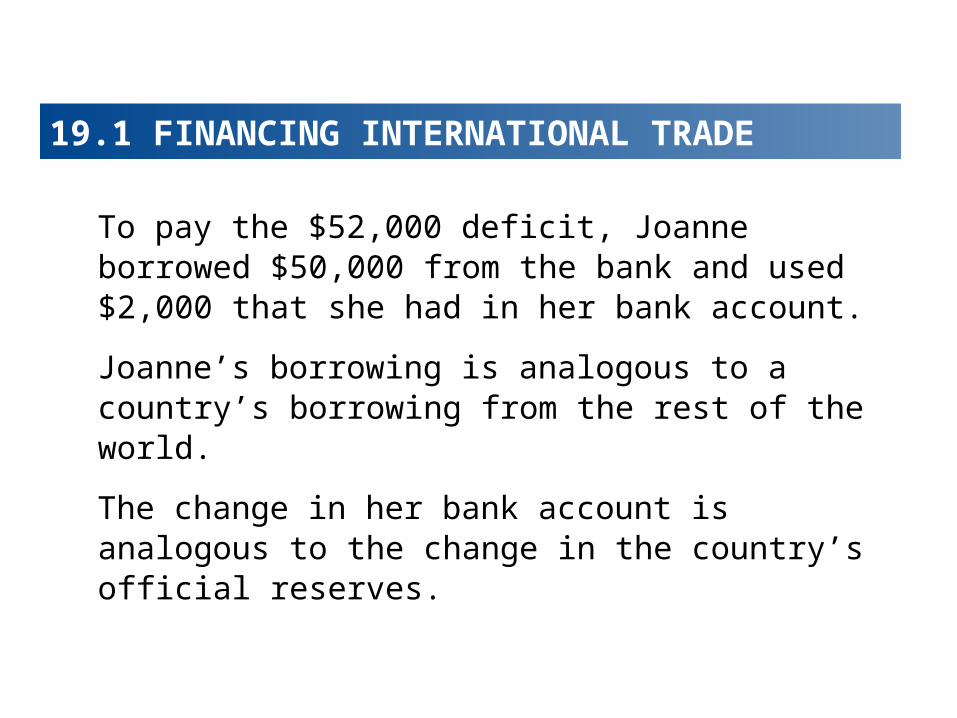
To pay the $52,000 deficit, Joanne borrowed $50,000 from the bank and used $2,000 that she had in her bank account.
Joanne’s borrowing is analogous to a country’s borrowing from the rest of the world.
The change in her bank account is analogous to the change in the country’s official reserves.
19.1 FINANCING INTERNATIONAL TRADE
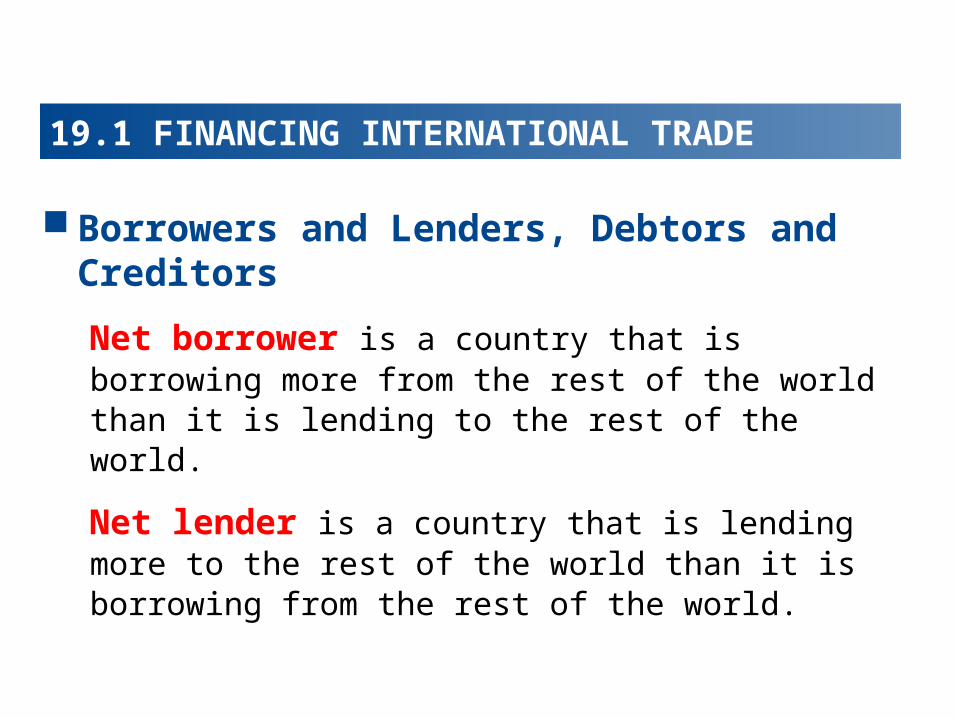
Borrowers and Lenders, Debtors and Creditors
Net borrower is a country that is borrowing more from the rest of the world than it is lending to the rest of the world.
Net lender is a country that is lending more to the rest of the world than it is borrowing from the rest of the world.
19.1 FINANCING INTERNATIONAL TRADE
Debtor nation is a country that during its entire history has borrowed more from the rest of the world than it has lent to it.
A debtor nation has a stock of outstanding debt to the rest of the world that exceeds the stock of its own claims on the rest of the world.
Creditor nation is a country that has invested more in the rest of the world than other countries have invested in it.
19.1 FINANCING INTERNATIONAL TRADE
Flows and Stocks
• Borrowing and lending are flows.
• Debts are stocks—amounts owed at a point in time.
The flow of borrowing and lending changes the stock of debt.
Since 1989, the total stock of U.S. borrowing from the rest of the world has exceeded U.S. lending to the rest of the world.
19.1 FINANCING INTERNATIONAL TRADE
Current Account Balance
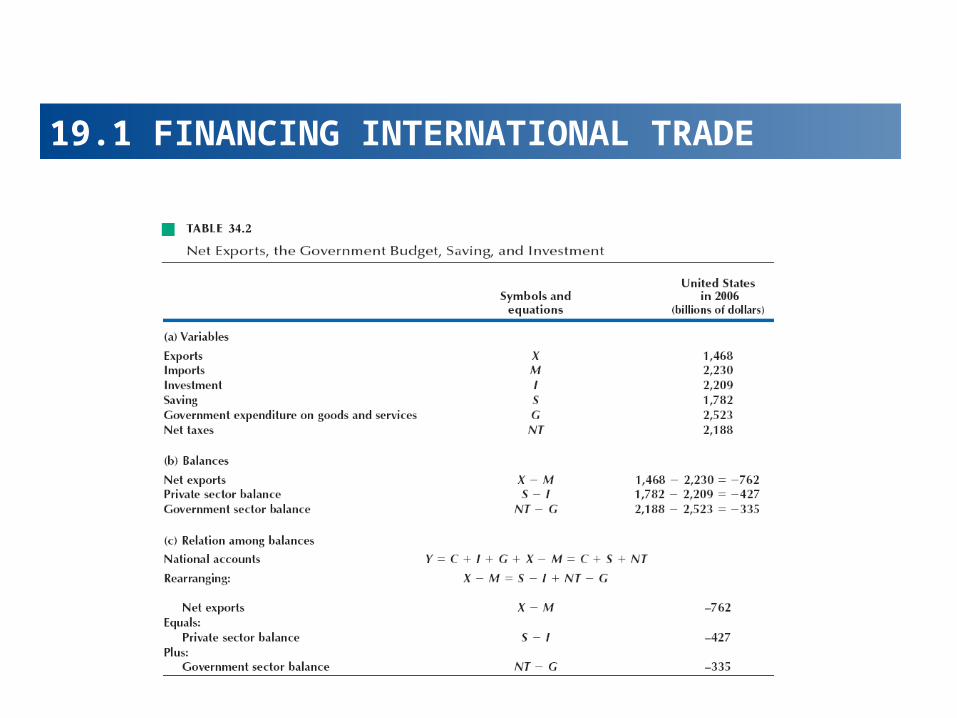
The largest items in the current account are exports and imports. So net exports are the main component of the current account.
We can define the current account balance (CAB) as
CAB = NX + Net interest and transfers from abroad
Net interest and transfers from abroad are small and don’t fluctuate much, so to study the current account balance we look at what determines net exports.
19.1 FINANCING INTERNATIONAL TRADE
Net Exports
Private sector balance is saving minus investment.
Government sector balance is equal to net taxes minus government expenditure on goods and services.
Table 19.2 on the next slide shows what determines net exports.
19.1 FINANCING INTERNATIONAL TRADE
19.2 THE EXCHANGE RATE
Foreign exchange market is the market in which the currency of one country is exchanged for the currency of another.
The foreign exchange market that is made up of importers and exporters, banks, and specialist dealers who buy and sell currencies.
19.2 THE EXCHANGE RATE
Foreign exchange rate is the price at which one currency exchanges for another.
For example, in October 2007, one U.S. dollar bought 70 euro cents. The exchange rate was 70 euro cents per U.S. dollar.
This exchange rate can be expressed in terms of dollars (or cents) per euro. In October 2007, the exchange rate was $1.42 per euro.
19.2 THE EXCHANGE RATE
Currency appreciation is the rise in the value of one currency in terms of another currency.
For example, when the dollar rose from 86 euro cents in 1999 to 1.18 euros in 2001, the dollar appreciated by 37 percent.
Currency depreciation is the fall in the value of one currency in terms of another currency.
For example, when the dollar fell from 1.18 euros in 2001 to 0.70 euros in 2007, the dollar depreciated by 40 percent.
19.2 THE EXCHANGE RATE
The value of the foreign exchange rate fluctuates.Sometimes the U.S. dollar depreciates and sometimes it appreciates. Why?
The foreign exchange rate is a price and like all prices, and demand and supply in the foreign exchange market determine its value.
19.2 THE EXCHANGE RATE
Demand in the Foreign Exchange Market
The quantity of dollars demanded in the foreign exchange market is the amount that traders plan to buy during a given period at a given exchange rate.
The quantity of dollars demanded depends on• The exchange rate• Interest rates in the United States and other
countries• The expected future exchange rate
19.2 THE EXCHANGE RATE
The Law of Demand for Foreign Exchange
Other things remaining the same, the higher the exchange rate, the smaller is the quantity of dollars demanded.
The exchange rate influences the quantity of dollars demanded for two reasons:
• Exports effect• Expected profit effect
19.2 THE EXCHANGE RATE
Exports Effect
The larger the value of U.S. exports, the larger is the quantity of dollars demanded on the foreign exchange market.
The lower the exchange rate, the cheaper are U.S.-made goods and services to people in the rest of the world, the more the United States exports, and the greater is the quantity of U.S. dollars demanded to pay for them.
19.2 THE EXCHANGE RATE
Expected Profit Effect
The larger the expected profit from holding dollars, the greater is the quantity of dollars demanded in the foreign exchange market.
But the expected profit depends on the exchange rate.
The lower the exchange rate, other things remaining the same, the larger is the expected profit from holding dollars and the greater is the quantity of dollars demanded.
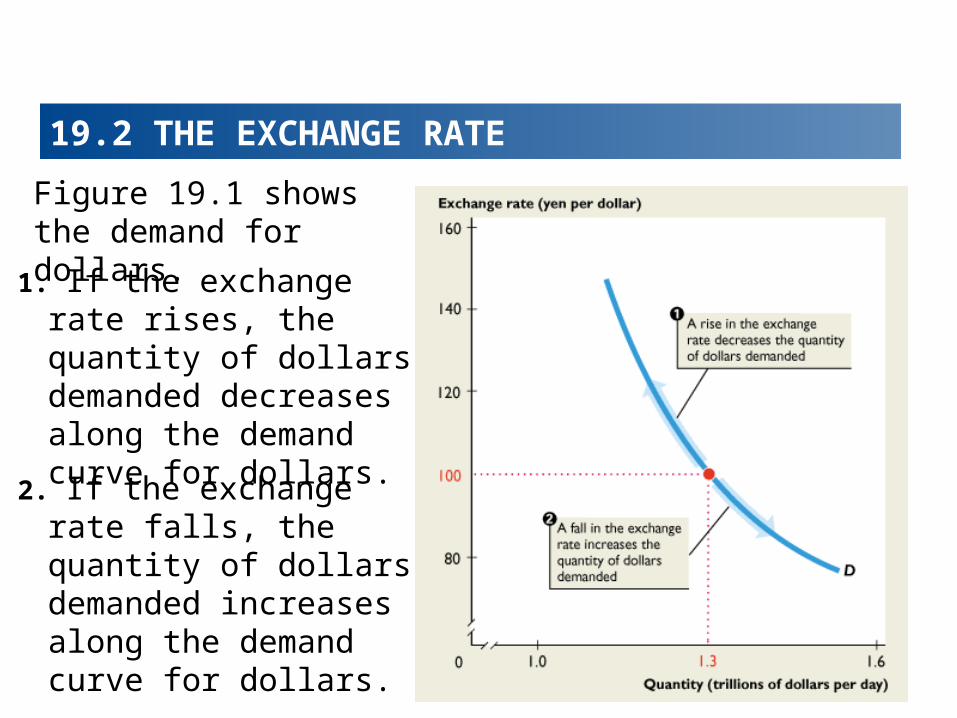
Figure 19.1 shows the demand for dollars.
2. If the exchange rate falls, the quantity of dollars demanded increases along the demand curve for dollars.
1. If the exchange rate rises, the quantity of dollars demanded decreases along the demand curve for dollars.
19.2 THE EXCHANGE RATE
19.2 THE EXCHANGE RATE
Changes in the Demand for Dollars
A change in any influence (other than the exchange rate) on the quantity of U.S. dollars that people plan to buy in the foreign exchange market changes the demand for U.S. dollars and shifts the demand curve for dollars.
These influences are
• Interest rates in the United States and other countries
• Expected future exchange rate
19.2 THE EXCHANGE RATE
Interest Rates in the United States and Other Countries
U.S. interest rate differential is the U.S. interest rate minus the foreign interest rate.
Other things remaining the same, the larger the U.S. interest rate differential, the greater is the demand for U.S. assets and the greater is the demand for dollars on the foreign exchange market.
19.2 THE EXCHANGE RATE
The Expected Future Exchange Rate
Other things remaining the same, the higher the expected future exchange rate, the greater is the demand for dollars.
The higher the expected future exchange rate, the larger is the expected profit from holding dollars, so the larger is the quantity of dollars that people plan to buy on the foreign exchange market.
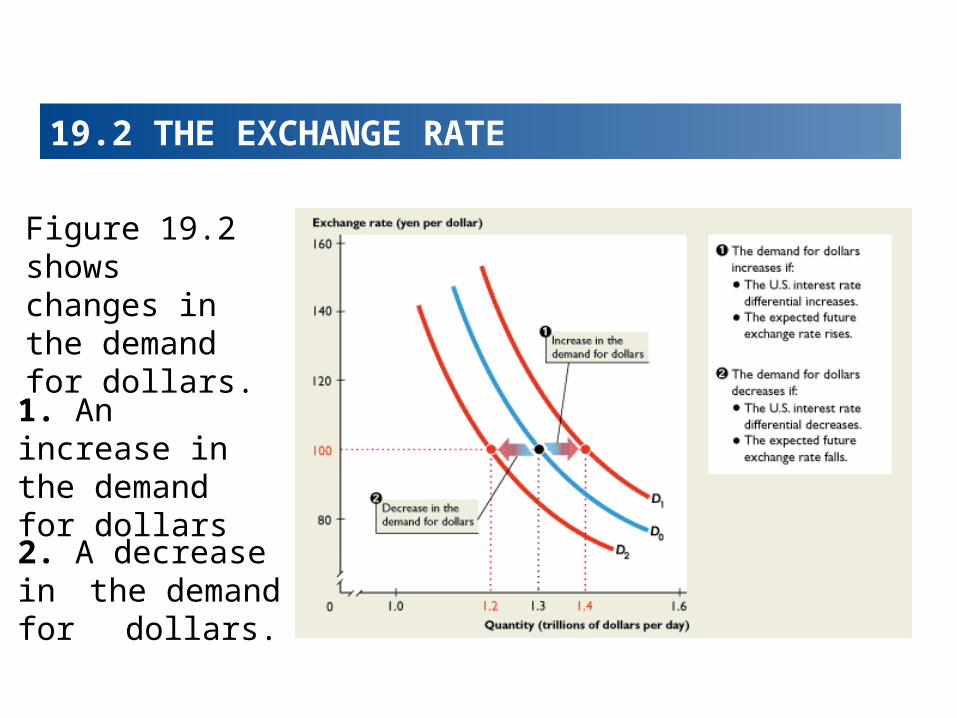
Figure 19.2 shows changes in the demand for dollars.
19.2 THE EXCHANGE RATE
1. An increase in the demand
for dollars
2. A decrease in the demand for dollars.
19.2 THE EXCHANGE RATE
Supply in the Foreign Exchange Market
The quantity of U.S dollars supplied in the foreign exchange market is the amount that traders plan to sell during a given time period at a given exchange rate.
The quantity of U.S. dollars supplied depends on many factors, but the main ones are
• The exchange rate• Interest rates in the United States and other
countries• The expected future exchange rate
19.2 THE EXCHANGE RATE
The Law of Supply of Foreign Exchange
Traders supply U.S. dollars in the foreign exchange market when they buy other currencies.
Other things remaining the same, the higher the exchange rate, the greater is the quantity of U.S. dollars supplied in the foreign exchange market.
The exchange rate influences the quantity of dollars supplied for two reasons:
• Imports effect• Expected profit effect
19.2 THE EXCHANGE RATE
Imports Effect
The larger the value of U.S. imports, the larger is the quantity of foreign currency demanded to pay for these imports.
When people buy foreign currency, they supply dollars.
Other things remaining the same, the higher the exchange rate, the cheaper are foreign-made goods and services to Americans. So the more the United States imports, the greater is the quantity of U.S. dollars supplied on the foreign exchange market.
19.2 THE EXCHANGE RATE
Expected Profit Effect
The larger the expected profit from holding a foreign currency, the greater is the quantity of that currency demanded and so the greater is the quantity of dollars supplied in the foreign exchange market.
The expected profit depends on the exchange rate.
Other things remaining the same, the higher the exchange rate, the larger is the expected profit from selling dollars and the greater is the quantity of dollars supplied in the foreign exchange market.
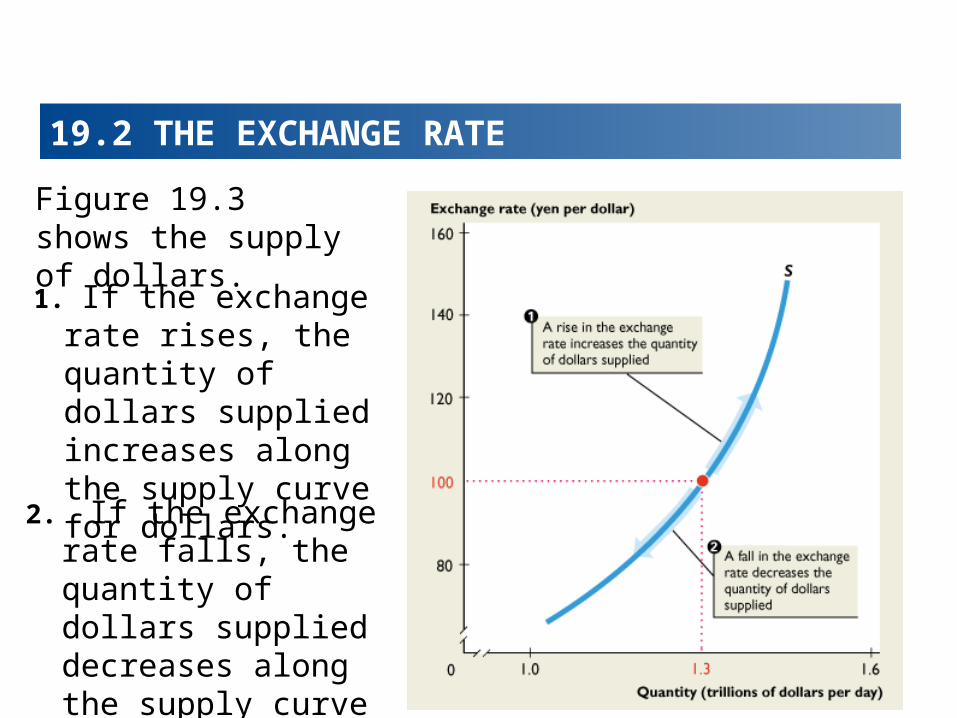
Figure 19.3 shows the supply of dollars.
2. If the exchange rate falls, the quantity of dollars supplied decreases along the supply curve for dollars.
1. If the exchange rate rises, the quantity of dollars supplied increases along the supply curve for dollars.
19.2 THE EXCHANGE RATE
19.2 THE EXCHANGE RATE
Changes in the Supply of Dollars
A change in any influence (other than the current exchange rate) on the quantity of U.S. dollars that people plan to sell in the foreign exchange market changes the supply of U.S. dollars and shifts the supply curve for dollars.
These influences are
• Interest rates in the United States and other countries
• Expected future exchange rate
19.2 THE EXCHANGE RATE
Interest Rates in the United States and Other Countries
The larger the U.S. interest rate differential, the smaller is the demand for foreign assets, so the smaller is the supply of U.S. dollars on the foreign exchange market.
19.2 THE EXCHANGE RATE
The Expected Future Exchange Rate
Other things remaining the same, the higher the expected future exchange rate, the smaller is the expected profit from selling U.S. dollars today, so the smaller is the supply of dollars today.
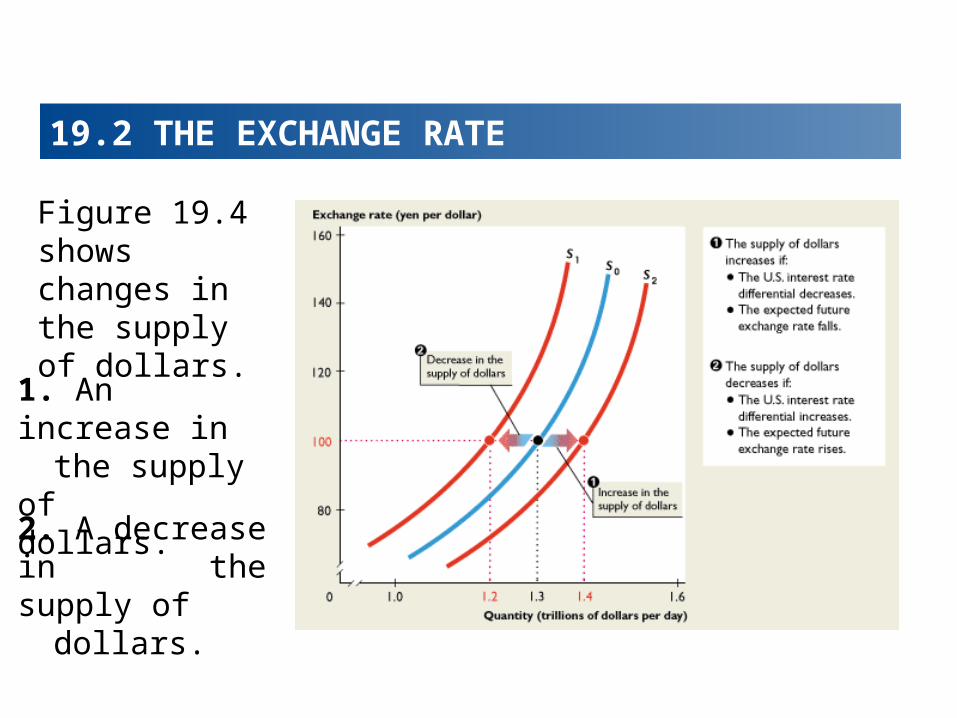
Figure 19.4 shows changes in the supply of dollars.
19.2 THE EXCHANGE RATE
1. An increase in the supply of dollars.
2. A decrease in the supply of dollars.
19.2 THE EXCHANGE RATE
Market Equilibrium
Demand and supply in the foreign exchange market determines the exchange rate.
If the exchange rate is too low, there is a shortage of dollars.
If the exchange rate is too high, there is a surplus of dollars.
At the equilibrium exchange rate, there is neither a shortage nor a surplus of dollars.
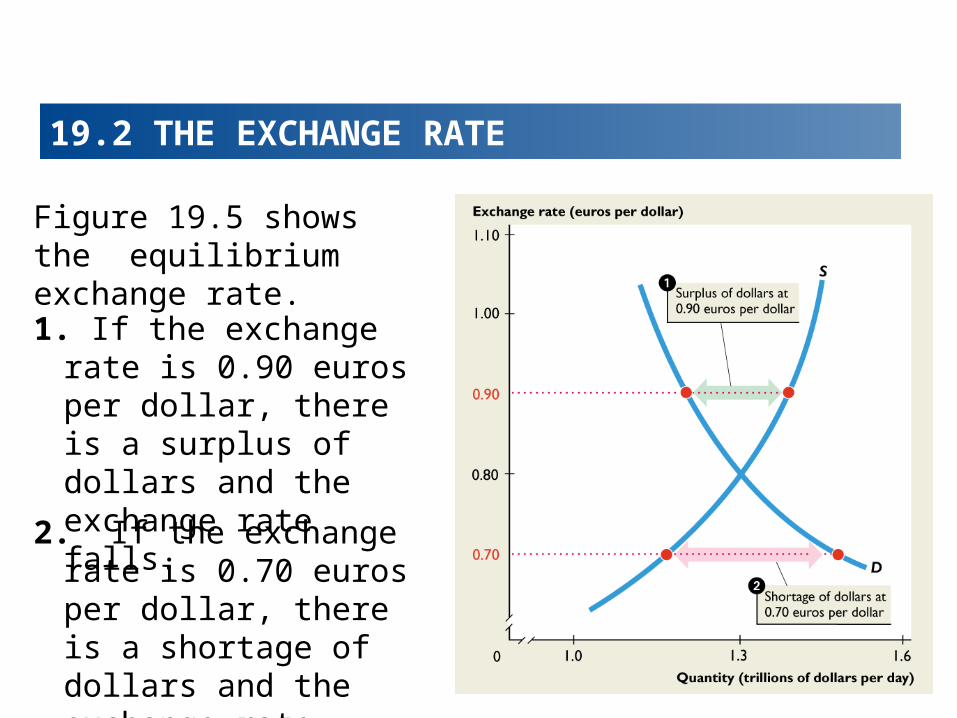
Figure 19.5 shows the equilibrium exchange rate.
1. If the exchange rate is 0.90 euros per dollar, there is a surplus of dollars and the exchange rate falls.
2. If the exchange rate is 0.70 euros per dollar, there is a shortage of dollars and the exchange rate rises.
19.2 THE EXCHANGE RATE
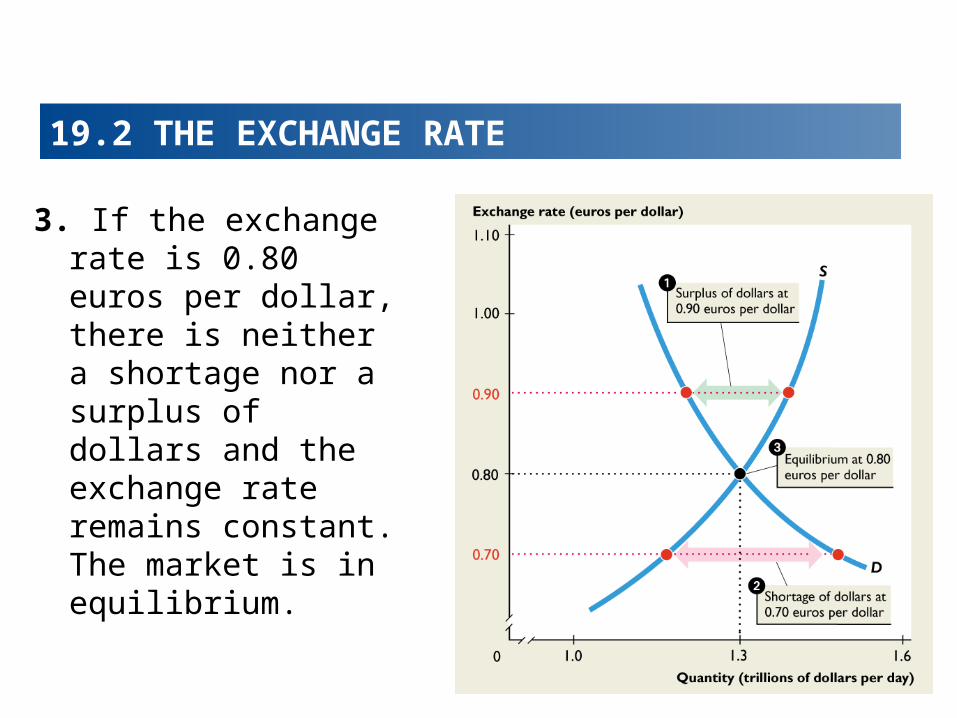
3. If the exchange rate is 0.80 euros per dollar, there is neither a shortage nor a surplus of dollars and the exchange rate remains constant. The market is in equilibrium.
19.2 THE EXCHANGE RATE
19.2 THE EXCHANGE RATE
Changes in the Exchange Rate
The predictions about the effects of changes in the demand for and supply of dollars are exactly the same as for any other market.
An increase in the demand for dollars with no change in supply raises the exchange rate.
A increase in the supply of dollars with no change in demand lowers the exchange rate.
19.2 THE EXCHANGE RATE
An Appreciating Dollar: 1999–2001
Between 1999 and 2001, the dollar appreciated against the euro. The exchange rate rose from 0.86 euros to 1.18 euros per dollar.
A Depreciating Dollar: 2001–2007
Between 2001 and 2007, the dollar depreciated against the euro. The exchange rate fell from 1.18 euros to 0.70 euros per dollar.
19.2 THE EXCHANGE RATE
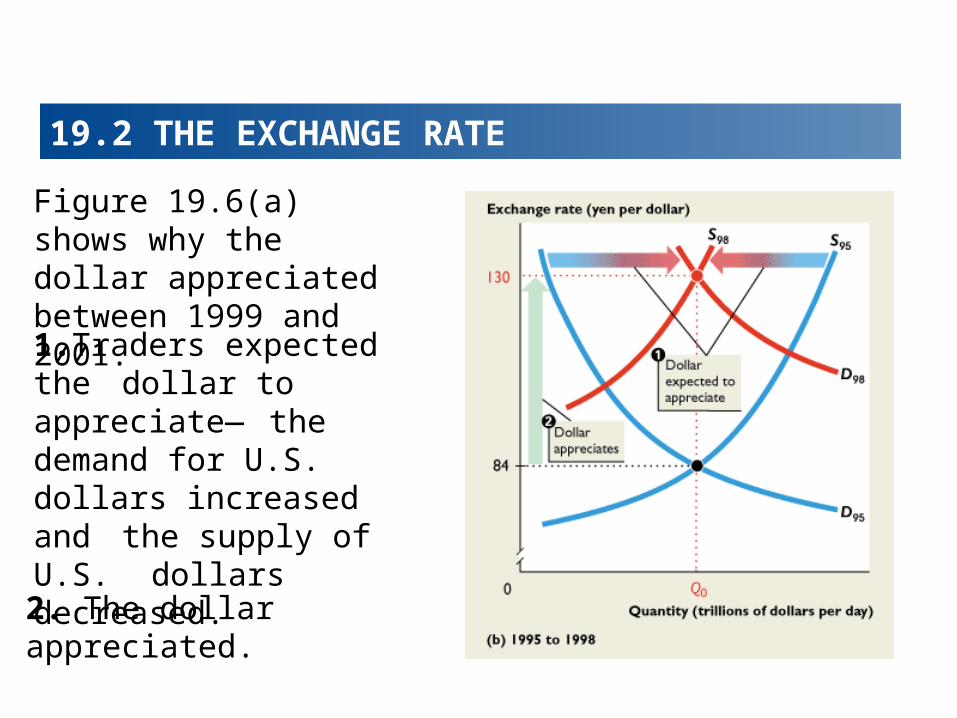
Figure 19.6(a) shows why the dollar appreciated between 1999 and 2001.
1.Traders expected the dollar to appreciate— the demand for U.S. dollars increased and the supply of U.S. dollars decreased.
2. The dollar appreciated.
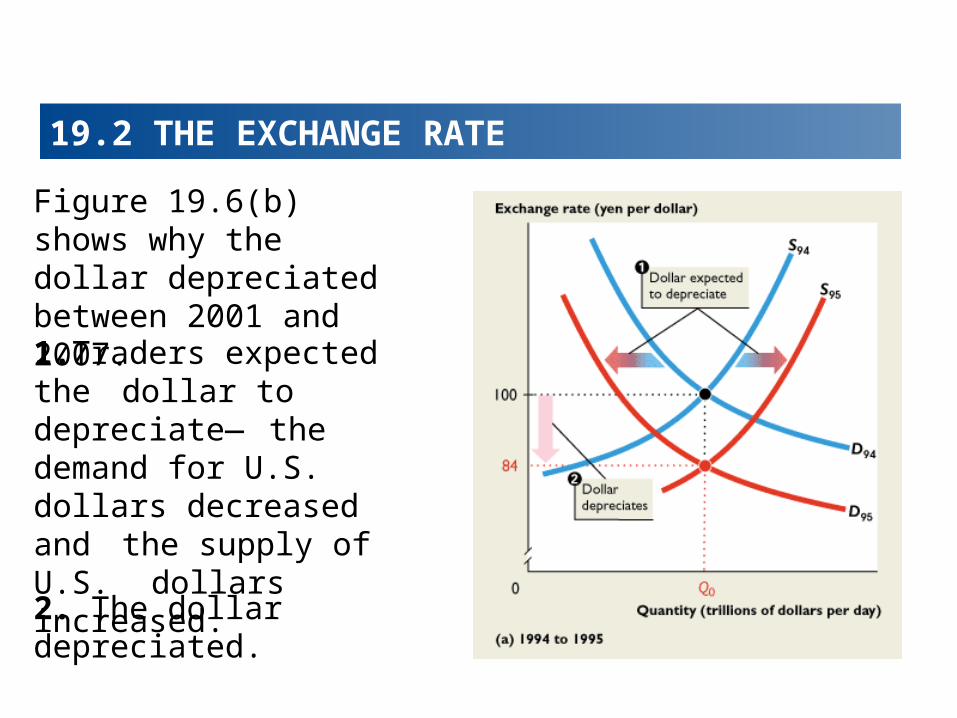
Figure 19.6(b) shows why the dollar depreciated between 2001 and 2007.
19.2 THE EXCHANGE RATE
1.Traders expected the dollar to depreciate— the demand for U.S. dollars decreased and the supply of U.S. dollars increased.
2. The dollar depreciated.
19.2 THE EXCHANGE RATE
Why the Exchange Rate Is Volatile
Sometimes the dollar appreciates and sometimes it depreciates, but the quantity of dollars traded each day barely changes.
Why?
The main reason is that demand and supply are not independent in the foreign exchange market.
19.2 THE EXCHANGE RATE
Exchange Rate Expectations
Why do exchange rate expectations change?
There are two forces:• Purchasing power parity• Interest rate parity
Purchasing power parity means equal value of money—a situation in which money buys the same amount of goods and services in different currencies.
19.2 THE EXCHANGE RATE
Suppose that a Big Mac costs $4 (Canadian) in Toronto and $3 (U.S.) in New York.
If the exchange rate is $1.33 Canadian per U.S. dollar, then the two monies have the same value—you can buy a Big Mac in Toronto or New York for either $4 (Canadian) or $3 (U.S.).
But if a Big Mac in New York rises to $4 and the exchange rate remains at $1.33 Canadian per U.S. dollar, then money buys more in Canada than in the United States.
Money does not have equal value.
19.2 THE EXCHANGE RATE
The value of money is determined by the price level.
If prices in the United States rise faster than those of other countries, people will generally expect the foreign exchange value of the U.S. dollar to fall.
Demand for U.S. dollars will decrease, and supply of U.S. dollars will increase.
The U.S. dollar exchange rate will fall.
The U.S. dollar depreciates.
19.2 THE EXCHANGE RATE
If prices in the United States rise more slowly than those of other countries, people will generally expect the foreign exchange value of the U.S. dollar to rise.
Demand for U.S. dollars will increase, and supply of U.S. dollars will decrease.
The U.S. dollar exchange rate will rise.
The U.S. dollar appreciates.
19.2 THE EXCHANGE RATE
Interest Rate Parity
Interest rate parity means equal interest rates—a situation in which the interest rate in one currency equals the interest rate in another currency when exchange rate changes are taken into account.
19.2 THE EXCHANGE RATE
Suppose a Canadian dollar deposit in a Toronto bank earns 5 percent a year and the U.S. dollar deposit in New York earns 3 percent a year.
If people expect the Canadian dollar to depreciate by 2 percent in a year, then the expected fall in the value of the Canadian dollar must be subtracted to calculate the net return on the Canadian dollar deposit.
The net return on the Canadian dollar deposit is 3 percent (5 percent minus 2 percent) a year. Interest rate parity holds.
19.2 THE EXCHANGE RATE
Adjusted for risk, interest rate parity always holds.
Traders in the foreign exchange market move their funds into the currencies that earn the highest return.
This action of buying and selling currencies brings about interest rate parity.
19.2 THE EXCHANGE RATE
Monetary Policy and the Exchange Rate
Monetary policy influence the U.S. interest rate, so the Fed’s actions influence the U.S. dollar exchange rate.
If the U.S. interest rate rises relative to those in other countries, the value of the U.S. dollar rises on the foreign exchange market.
If foreign interest rate rises relative to U.S. interest rate, the value of the U.S. dollar falls on the foreign exchange market.
So the exchange rate responds to monetary policy.
19.2 THE EXCHANGE RATE
Pegging the Exchange Rate
But the Fed can intervene directly in the foreign exchange market to influence the exchange rate.
The Fed can try to smooth out fluctuations in the exchange rate by changing the supply of U.S. dollars.
The Fed changes the supply of U.S. dollars on the foreign exchange market by buying or selling U.S. dollars.
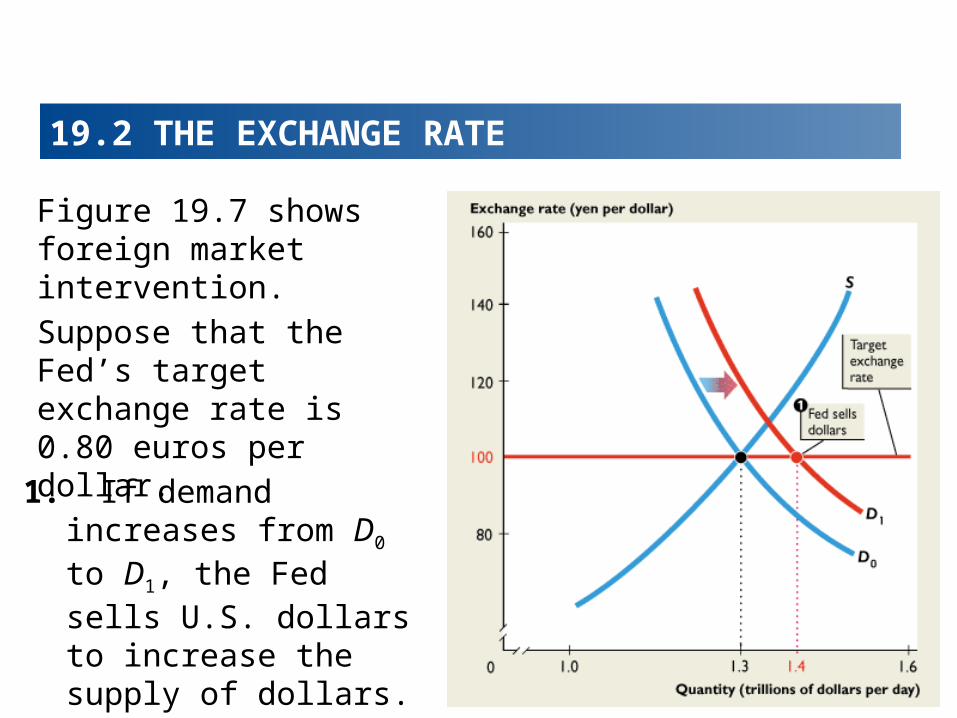
Figure 19.7 shows foreign market intervention.
1. If demand increases from D0 to D1, the Fed sells U.S. dollars to increase the supply of dollars.
19.2 THE EXCHANGE RATE
Suppose that the Fed’s target exchange rate is 0.80 euros per dollar.
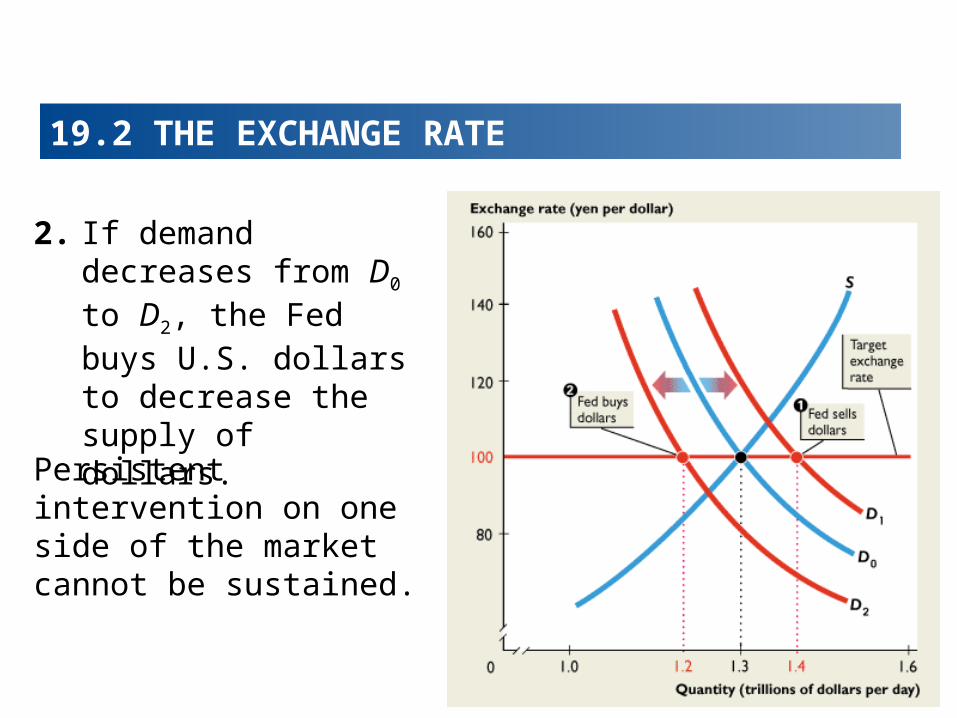
2. If demand decreases from D0 to D2, the Fed buys U.S. dollars to decrease the supply of dollars.
19.2 THE EXCHANGE RATE
Persistent intervention on one side of the market cannot be sustained.
19.2 THE EXCHANGE RATE
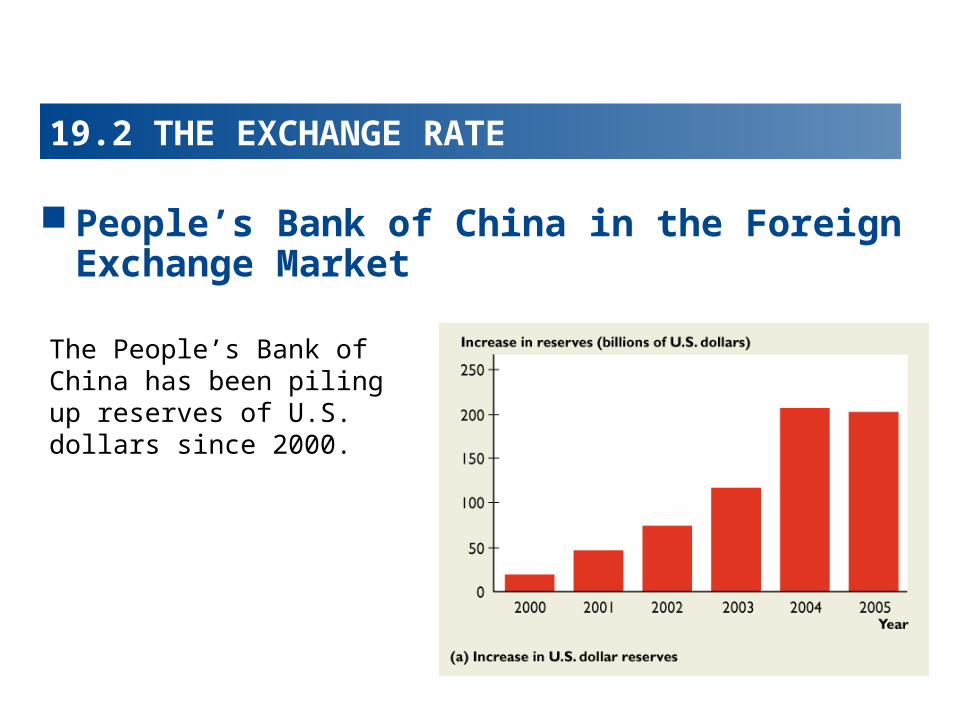
People’s Bank of China in the Foreign Exchange Market
The People’s Bank of China has been piling up reserves of U.S. dollars since 2000.
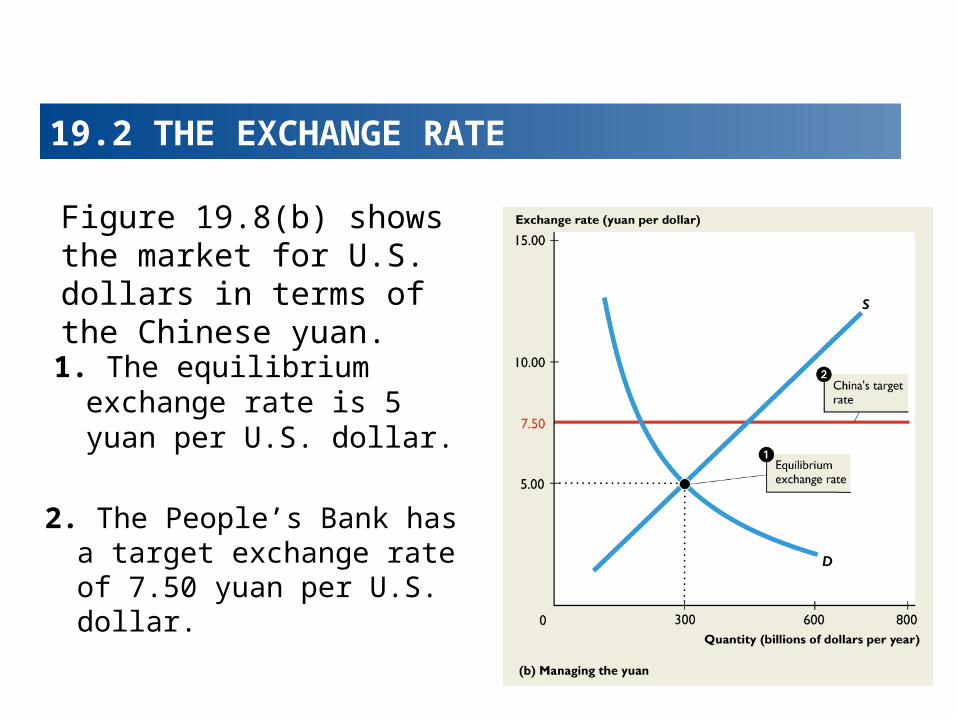
Figure 19.8(b) shows the market for U.S. dollars in terms of the Chinese yuan.
19.2 THE EXCHANGE RATE
1. The equilibrium exchange rate is 5 yuan per U.S. dollar.
2. The People’s Bank has a target exchange rate of 7.50 yuan per U.S. dollar.
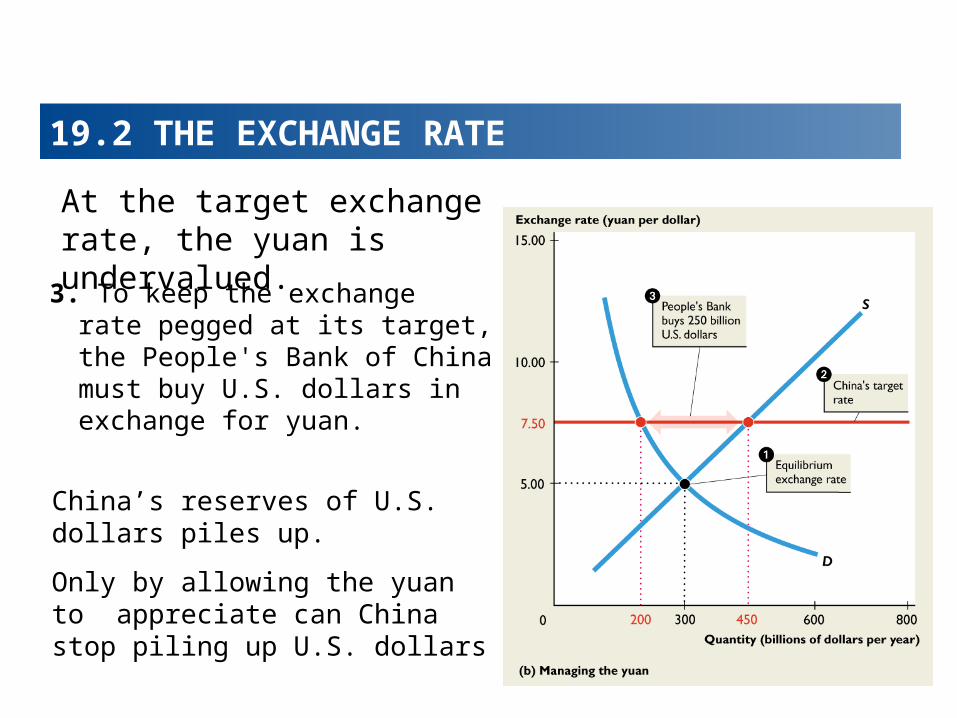
At the target exchange rate, the yuan is undervalued.
19.2 THE EXCHANGE RATE
3. To keep the exchange rate pegged at its target, the People's Bank of China must buy U.S. dollars in exchange for yuan.
China’s reserves of U.S. dollars piles up.
Only by allowing the yuan to appreciate can China stop piling up U.S. dollars