international energy outlook 2010 - professor robert b. laughlin
TRANSCRIPT

DOE/EIA-0484(2010)
I n t e r n a t i o n a l
E n e r g y O u t l o o k
2 0 1 0
July 2010
U.S. Energy Information AdministrationOffice of Integrated Analysis and Forecasting
U.S. Department of EnergyWashington, DC 20585
This report was prepared by the U.S. Energy Information Administration (EIA), the statistical andanalytical agency within the U.S. Department of Energy. By law, EIA’s data, analyses, and forecastsare independent of approval by any other officer or employee of the United States Government. Theviews in this report therefore should not be construed as representing those of the Department ofEnergy or other Federal agencies.
This publication is on the WEB at:
www.eia.gov/oiaf/ieo/index.html.

Contacts
The International Energy Outlook is prepared by the U.S.Energy Information Administration (EIA). Generalquestions concerning the contents of the report shouldbe referred to John J. Conti, Director, Office of Integrated
Analysis and Forecasting ([email protected], 202-586-2222). Specific questions about the report should bereferred to Linda E. Doman (202-586-1041) or the follow-ing analysts:
World energy demandand economic outlook . . . . . . . . . . . . . . . Linda E. Doman ([email protected], 202-586-1041)
Macroeconomic assumptions . . . . . . Kay A. Smith ([email protected], 202-586-1132)Liquid fuels . . . . . . . . . . . . . . . . . . . . . . . . Lauren D. Mayne ([email protected], 202-586-3005)
Emre M. Yucel ([email protected], 202-586-9503)Natural gas . . . . . . . . . . . . . . . . . . . . . . . . . Justine L. Barden ([email protected], 202-586-3508)
Aloulou M. Fawzi ([email protected], 202-586-1344)Phyllis D. Martin ([email protected], 202-586-9592)Victoria V. Zaretskaya ([email protected], 202-287-5501)
Coal . . . . . . . . . . . . . . . . . . . . . . . . . . . . . . . Michael L. Mellish ([email protected], 202-586-2136)Diane R. Kearney ([email protected], 202-586-2415)
Electricity . . . . . . . . . . . . . . . . . . . . . . . . . . Brian T. Murphy ([email protected], 202-586-1398)Industrial sector . . . . . . . . . . . . . . . . . . . . . Kenneth R. Vincent ([email protected], 202-586-6582)Transportation sector . . . . . . . . . . . . . . . . Linda E. Doman ([email protected], 202-586-1041)Energy-related carbon dioxideemissions. . . . . . . . . . . . . . . . . . . . . . . . . . . Perry M. Lindstrom ([email protected], 202-586-0934)
Carbon capture and storage . . . . . . . Michael T. Leff ([email protected], 202-586-1297)
The following also contributed to production of the IEO2010 report: Adrian Geagla, John Holte, Barry Kapilow-Cohen,Marie LaRiviere, Charles L. Smith, John Staub, Glen Sweetnam, and Peggy Wells.
ii U.S. Energy Information Administration / International Energy Outlook 2010
Electronic access and related reports
IEO2010 will be available on the EIA Home Page (http://www.eia.gov/oiaf/ieo/index.html) by August 2010, includingtext, forecast tables, and graphics. To download the entire publication in Portable Document Format (PDF), go tohttp://www.eia.gov/oiaf/ieo/pdf/0484(2010).pdf.
For ordering information and questions on other energy statistics available from EIA, please contact EIA’s NationalEnergy Information Center. Addresses, telephone numbers, and hours are as follows:
National Energy Information Center, EI-30U.S. Energy Information AdministrationForrestal BuildingWashington, DC 20585
Telephone: 202/586-8800 E-mail: [email protected]: For people who are deaf World Wide Web Site: http://www.eia.gov
or hard of hearing: 202/586-11819 a.m. to 4 p.m., eastern time, M-F

ContentsPage
U.S. Energy Information Administration / International Energy Outlook 2010 iii
Preface . . . . . . . . . . . . . . . . . . . . . . . . . . . . . . . . . . . . . . . . . . . . . . . . . . . . . . . . . . . . . . . . . . . . . . . . . . . . . . . . . . . . . . . . . . . . ix
Highlights . . . . . . . . . . . . . . . . . . . . . . . . . . . . . . . . . . . . . . . . . . . . . . . . . . . . . . . . . . . . . . . . . . . . . . . . . . . . . . . . . . . . . . . . . 1World energy markets by fuel type . . . . . . . . . . . . . . . . . . . . . . . . . . . . . . . . . . . . . . . . . . . . . . . . . . . . . . . . . . . . . . . . . . 2World delivered energy use by sector . . . . . . . . . . . . . . . . . . . . . . . . . . . . . . . . . . . . . . . . . . . . . . . . . . . . . . . . . . . . . . . . 5World carbon dioxide emissions . . . . . . . . . . . . . . . . . . . . . . . . . . . . . . . . . . . . . . . . . . . . . . . . . . . . . . . . . . . . . . . . . . . . 7
World Energy Demand and Economic Outlook . . . . . . . . . . . . . . . . . . . . . . . . . . . . . . . . . . . . . . . . . . . . . . . . . . . . . . . . . 9Outlook for world energy consumption by source . . . . . . . . . . . . . . . . . . . . . . . . . . . . . . . . . . . . . . . . . . . . . . . . . . . . . 11Delivered energy consumption by end-use sector . . . . . . . . . . . . . . . . . . . . . . . . . . . . . . . . . . . . . . . . . . . . . . . . . . . . . . 13World economic outlook. . . . . . . . . . . . . . . . . . . . . . . . . . . . . . . . . . . . . . . . . . . . . . . . . . . . . . . . . . . . . . . . . . . . . . . . . . . 15Sensitivity analyses in IEO2010 . . . . . . . . . . . . . . . . . . . . . . . . . . . . . . . . . . . . . . . . . . . . . . . . . . . . . . . . . . . . . . . . . . . . . 20References . . . . . . . . . . . . . . . . . . . . . . . . . . . . . . . . . . . . . . . . . . . . . . . . . . . . . . . . . . . . . . . . . . . . . . . . . . . . . . . . . . . . . . . 21
Liquid Fuels . . . . . . . . . . . . . . . . . . . . . . . . . . . . . . . . . . . . . . . . . . . . . . . . . . . . . . . . . . . . . . . . . . . . . . . . . . . . . . . . . . . . . . . 23Overview. . . . . . . . . . . . . . . . . . . . . . . . . . . . . . . . . . . . . . . . . . . . . . . . . . . . . . . . . . . . . . . . . . . . . . . . . . . . . . . . . . . . . . . . 23World liquids consumption . . . . . . . . . . . . . . . . . . . . . . . . . . . . . . . . . . . . . . . . . . . . . . . . . . . . . . . . . . . . . . . . . . . . . . . . 25World oil prices . . . . . . . . . . . . . . . . . . . . . . . . . . . . . . . . . . . . . . . . . . . . . . . . . . . . . . . . . . . . . . . . . . . . . . . . . . . . . . . . . . 25Recent market trends. . . . . . . . . . . . . . . . . . . . . . . . . . . . . . . . . . . . . . . . . . . . . . . . . . . . . . . . . . . . . . . . . . . . . . . . . . . . . . 26World liquids production . . . . . . . . . . . . . . . . . . . . . . . . . . . . . . . . . . . . . . . . . . . . . . . . . . . . . . . . . . . . . . . . . . . . . . . . . . 27World oil reserves . . . . . . . . . . . . . . . . . . . . . . . . . . . . . . . . . . . . . . . . . . . . . . . . . . . . . . . . . . . . . . . . . . . . . . . . . . . . . . . . 37References . . . . . . . . . . . . . . . . . . . . . . . . . . . . . . . . . . . . . . . . . . . . . . . . . . . . . . . . . . . . . . . . . . . . . . . . . . . . . . . . . . . . . . . 38
Natural Gas . . . . . . . . . . . . . . . . . . . . . . . . . . . . . . . . . . . . . . . . . . . . . . . . . . . . . . . . . . . . . . . . . . . . . . . . . . . . . . . . . . . . . . . . 41Overview. . . . . . . . . . . . . . . . . . . . . . . . . . . . . . . . . . . . . . . . . . . . . . . . . . . . . . . . . . . . . . . . . . . . . . . . . . . . . . . . . . . . . . . . 41World natural gas consumption . . . . . . . . . . . . . . . . . . . . . . . . . . . . . . . . . . . . . . . . . . . . . . . . . . . . . . . . . . . . . . . . . . . . . 42World natural gas production. . . . . . . . . . . . . . . . . . . . . . . . . . . . . . . . . . . . . . . . . . . . . . . . . . . . . . . . . . . . . . . . . . . . . . . 45World natural gas trade . . . . . . . . . . . . . . . . . . . . . . . . . . . . . . . . . . . . . . . . . . . . . . . . . . . . . . . . . . . . . . . . . . . . . . . . . . . . 51World natural gas reserves . . . . . . . . . . . . . . . . . . . . . . . . . . . . . . . . . . . . . . . . . . . . . . . . . . . . . . . . . . . . . . . . . . . . . . . . . 57References . . . . . . . . . . . . . . . . . . . . . . . . . . . . . . . . . . . . . . . . . . . . . . . . . . . . . . . . . . . . . . . . . . . . . . . . . . . . . . . . . . . . . . . 58
Coal. . . . . . . . . . . . . . . . . . . . . . . . . . . . . . . . . . . . . . . . . . . . . . . . . . . . . . . . . . . . . . . . . . . . . . . . . . . . . . . . . . . . . . . . . . . . . . . 61Overview. . . . . . . . . . . . . . . . . . . . . . . . . . . . . . . . . . . . . . . . . . . . . . . . . . . . . . . . . . . . . . . . . . . . . . . . . . . . . . . . . . . . . . . . 61World coal consumption. . . . . . . . . . . . . . . . . . . . . . . . . . . . . . . . . . . . . . . . . . . . . . . . . . . . . . . . . . . . . . . . . . . . . . . . . . . 61World coal production . . . . . . . . . . . . . . . . . . . . . . . . . . . . . . . . . . . . . . . . . . . . . . . . . . . . . . . . . . . . . . . . . . . . . . . . . . . . 65World coal trade. . . . . . . . . . . . . . . . . . . . . . . . . . . . . . . . . . . . . . . . . . . . . . . . . . . . . . . . . . . . . . . . . . . . . . . . . . . . . . . . . . 65World coal reserves . . . . . . . . . . . . . . . . . . . . . . . . . . . . . . . . . . . . . . . . . . . . . . . . . . . . . . . . . . . . . . . . . . . . . . . . . . . . . . . 71References . . . . . . . . . . . . . . . . . . . . . . . . . . . . . . . . . . . . . . . . . . . . . . . . . . . . . . . . . . . . . . . . . . . . . . . . . . . . . . . . . . . . . . . 74
Electricity. . . . . . . . . . . . . . . . . . . . . . . . . . . . . . . . . . . . . . . . . . . . . . . . . . . . . . . . . . . . . . . . . . . . . . . . . . . . . . . . . . . . . . . . . . 77Overview. . . . . . . . . . . . . . . . . . . . . . . . . . . . . . . . . . . . . . . . . . . . . . . . . . . . . . . . . . . . . . . . . . . . . . . . . . . . . . . . . . . . . . . . 77Electricity supply by energy source . . . . . . . . . . . . . . . . . . . . . . . . . . . . . . . . . . . . . . . . . . . . . . . . . . . . . . . . . . . . . . . . . . 78Regional electricity outlooks . . . . . . . . . . . . . . . . . . . . . . . . . . . . . . . . . . . . . . . . . . . . . . . . . . . . . . . . . . . . . . . . . . . . . . . 82References . . . . . . . . . . . . . . . . . . . . . . . . . . . . . . . . . . . . . . . . . . . . . . . . . . . . . . . . . . . . . . . . . . . . . . . . . . . . . . . . . . . . . . . 92
Industrial Sector Energy Consumption . . . . . . . . . . . . . . . . . . . . . . . . . . . . . . . . . . . . . . . . . . . . . . . . . . . . . . . . . . . . . . . . 97Overview. . . . . . . . . . . . . . . . . . . . . . . . . . . . . . . . . . . . . . . . . . . . . . . . . . . . . . . . . . . . . . . . . . . . . . . . . . . . . . . . . . . . . . . . 97Energy-intensive industries . . . . . . . . . . . . . . . . . . . . . . . . . . . . . . . . . . . . . . . . . . . . . . . . . . . . . . . . . . . . . . . . . . . . . . . . 99Regional industrial energy outlooks . . . . . . . . . . . . . . . . . . . . . . . . . . . . . . . . . . . . . . . . . . . . . . . . . . . . . . . . . . . . . . . . . 101References . . . . . . . . . . . . . . . . . . . . . . . . . . . . . . . . . . . . . . . . . . . . . . . . . . . . . . . . . . . . . . . . . . . . . . . . . . . . . . . . . . . . . . . 106
Transportation Sector Energy Consumption. . . . . . . . . . . . . . . . . . . . . . . . . . . . . . . . . . . . . . . . . . . . . . . . . . . . . . . . . . . . 109Overview. . . . . . . . . . . . . . . . . . . . . . . . . . . . . . . . . . . . . . . . . . . . . . . . . . . . . . . . . . . . . . . . . . . . . . . . . . . . . . . . . . . . . . . . 109Regional transportation energy outlooks . . . . . . . . . . . . . . . . . . . . . . . . . . . . . . . . . . . . . . . . . . . . . . . . . . . . . . . . . . . . . 110References . . . . . . . . . . . . . . . . . . . . . . . . . . . . . . . . . . . . . . . . . . . . . . . . . . . . . . . . . . . . . . . . . . . . . . . . . . . . . . . . . . . . . . . 120

Contents (continued) Page
Appendixes
Tables
iv U.S. Energy Information Administration / International Energy Outlook 2010
1. World marketed energy consumption by country grouping, 2007-2035 . . . . . . . . . . . . . . . . . . . . . . . . . . . . . . . . . 92. World gross domestic product by country grouping, 2007-2035 . . . . . . . . . . . . . . . . . . . . . . . . . . . . . . . . . . . . . . . 163. World liquid fuels production in the Reference case, 2007-2035. . . . . . . . . . . . . . . . . . . . . . . . . . . . . . . . . . . . . . . . 244. World oil prices in four cases, 2008-2035 . . . . . . . . . . . . . . . . . . . . . . . . . . . . . . . . . . . . . . . . . . . . . . . . . . . . . . . . . . . 265. World oil reserves by country as of January 1, 2010 . . . . . . . . . . . . . . . . . . . . . . . . . . . . . . . . . . . . . . . . . . . . . . . . . . 376. World natural gas production by region and country in the Reference case, 2007-2035. . . . . . . . . . . . . . . . . . . . . 467. World natural gas reserves by country as of January 1, 2010 . . . . . . . . . . . . . . . . . . . . . . . . . . . . . . . . . . . . . . . . . . . 578. World coal production by region, 2007-2035 . . . . . . . . . . . . . . . . . . . . . . . . . . . . . . . . . . . . . . . . . . . . . . . . . . . . . . . . 669. World coal flows by importing and exporting regions, Reference case, 2008, 2020, and 2035 . . . . . . . . . . . . . . . . 67
10. World recoverable coal reserves as of January 1, 2008 . . . . . . . . . . . . . . . . . . . . . . . . . . . . . . . . . . . . . . . . . . . . . . . . 7311. OECD and Non-OECD net electricity generation by energy source, 2007-2035 . . . . . . . . . . . . . . . . . . . . . . . . . . . 7812. OECD and Non-OECD net renewable electricity generation by energy source, 2007-2035. . . . . . . . . . . . . . . . . . 8113. World industrial delivered energy consumption by region and energy source, 2007-2035. . . . . . . . . . . . . . . . . . 9714. World energy consumption for transportation by country grouping, 2007-2035 . . . . . . . . . . . . . . . . . . . . . . . . . . 11015. World energy consumption for passenger transportation by country grouping, 2007-2035. . . . . . . . . . . . . . . . . 11116. World energy consumption for freight transportation by country grouping, 2007-2035. . . . . . . . . . . . . . . . . . . . 11117. Fleet renewal schemes in OECD Europe, 2009 and 2010 . . . . . . . . . . . . . . . . . . . . . . . . . . . . . . . . . . . . . . . . . . . . . . 11418. World energy-related carbon dioxide emissions by region, 1990-2035 . . . . . . . . . . . . . . . . . . . . . . . . . . . . . . . . . . 12319. Emissions mitigation goals announced by selected countries . . . . . . . . . . . . . . . . . . . . . . . . . . . . . . . . . . . . . . . . . . 12520. Kaya component values by region and country, 1990-2035 . . . . . . . . . . . . . . . . . . . . . . . . . . . . . . . . . . . . . . . . . . . . 13121. Energy-related carbon dioxide emissions per capita by region and country, 1990-2035 . . . . . . . . . . . . . . . . . . . . 133
A. Reference Case Projections . . . . . . . . . . . . . . . . . . . . . . . . . . . . . . . . . . . . . . . . . . . . . . . . . . . . . . . . . . . . . . . . . . . . . . . 143B. High Economic Growth Case Projections . . . . . . . . . . . . . . . . . . . . . . . . . . . . . . . . . . . . . . . . . . . . . . . . . . . . . . . . . . . 161C. Low Economic Growth Case Projections. . . . . . . . . . . . . . . . . . . . . . . . . . . . . . . . . . . . . . . . . . . . . . . . . . . . . . . . . . . . 177D. High Oil Price Case Projections . . . . . . . . . . . . . . . . . . . . . . . . . . . . . . . . . . . . . . . . . . . . . . . . . . . . . . . . . . . . . . . . . . . 193E. Low Oil Price Case Projections . . . . . . . . . . . . . . . . . . . . . . . . . . . . . . . . . . . . . . . . . . . . . . . . . . . . . . . . . . . . . . . . . . . . 209F. Reference Case Projections by End-Use Sector and Country Grouping . . . . . . . . . . . . . . . . . . . . . . . . . . . . . . . . . . 225G. Projections of Liquid Fuels and Other Petroleum Production in Five Cases. . . . . . . . . . . . . . . . . . . . . . . . . . . . . . . 247H. Reference Case Projections for Electricity Capacity and Generation by Fuel . . . . . . . . . . . . . . . . . . . . . . . . . . . . . . 269I. Projections of Natural Gas Production in Five Cases . . . . . . . . . . . . . . . . . . . . . . . . . . . . . . . . . . . . . . . . . . . . . . . . . . 291J. Kaya Identity Factor Projections. . . . . . . . . . . . . . . . . . . . . . . . . . . . . . . . . . . . . . . . . . . . . . . . . . . . . . . . . . . . . . . . . . . 313K. Comparisons With International Energy Agency and IEO2009 Projections. . . . . . . . . . . . . . . . . . . . . . . . . . . . . . . 319L. Models Used To Generate the IEO2010 Projections . . . . . . . . . . . . . . . . . . . . . . . . . . . . . . . . . . . . . . . . . . . . . . . . . . . 325M.Regional Definitions . . . . . . . . . . . . . . . . . . . . . . . . . . . . . . . . . . . . . . . . . . . . . . . . . . . . . . . . . . . . . . . . . . . . . . . . . . . . 327
Energy-Related Carbon Dioxide Emissions . . . . . . . . . . . . . . . . . . . . . . . . . . . . . . . . . . . . . . . . . . . . . . . . . . . . . . . . . . . . 123Overview. . . . . . . . . . . . . . . . . . . . . . . . . . . . . . . . . . . . . . . . . . . . . . . . . . . . . . . . . . . . . . . . . . . . . . . . . . . . . . . . . . . . . . . . 123Emissions by region. . . . . . . . . . . . . . . . . . . . . . . . . . . . . . . . . . . . . . . . . . . . . . . . . . . . . . . . . . . . . . . . . . . . . . . . . . . . . . . 124Emissions by fuel . . . . . . . . . . . . . . . . . . . . . . . . . . . . . . . . . . . . . . . . . . . . . . . . . . . . . . . . . . . . . . . . . . . . . . . . . . . . . . . . . 125Factors influencing trends in energy-related carbon dioxide emissions . . . . . . . . . . . . . . . . . . . . . . . . . . . . . . . . . . . . 128The Kaya decomposition of emissions trends. . . . . . . . . . . . . . . . . . . . . . . . . . . . . . . . . . . . . . . . . . . . . . . . . . . . . . . . . . 129Emissions per capita . . . . . . . . . . . . . . . . . . . . . . . . . . . . . . . . . . . . . . . . . . . . . . . . . . . . . . . . . . . . . . . . . . . . . . . . . . . . . . 132Alternative Economic Growth cases . . . . . . . . . . . . . . . . . . . . . . . . . . . . . . . . . . . . . . . . . . . . . . . . . . . . . . . . . . . . . . . . . 133References . . . . . . . . . . . . . . . . . . . . . . . . . . . . . . . . . . . . . . . . . . . . . . . . . . . . . . . . . . . . . . . . . . . . . . . . . . . . . . . . . . . . . . . 134
Data Sources . . . . . . . . . . . . . . . . . . . . . . . . . . . . . . . . . . . . . . . . . . . . . . . . . . . . . . . . . . . . . . . . . . . . . . . . . . . . . . . . . . . . . . . 135

Figures Page
U.S. Energy Information Administration / International Energy Outlook 2010 v
1. World marketed energy consumption, 2007-2035 . . . . . . . . . . . . . . . . . . . . . . . . . . . . . . . . . . . . . . . . . . . . . . . . . . . 12. World marketed energy use by fuel type, 1990-2035 . . . . . . . . . . . . . . . . . . . . . . . . . . . . . . . . . . . . . . . . . . . . . . . . . 13. World liquids production, 1990-2035 . . . . . . . . . . . . . . . . . . . . . . . . . . . . . . . . . . . . . . . . . . . . . . . . . . . . . . . . . . . . . . 24. Net change in world natural gas production by region, 2007-2035 . . . . . . . . . . . . . . . . . . . . . . . . . . . . . . . . . . . . . . 35. World coal consumption by region, 1990-2035 . . . . . . . . . . . . . . . . . . . . . . . . . . . . . . . . . . . . . . . . . . . . . . . . . . . . . . 36. World net electricity generation by fuel, 2007-2035 . . . . . . . . . . . . . . . . . . . . . . . . . . . . . . . . . . . . . . . . . . . . . . . . . . 47. World renewable electricity generation by energy source, excluding wind and hydropower, 2007-2035 . . . . . 48. World delivered energy consumption in the industrial sector, 2007-2035. . . . . . . . . . . . . . . . . . . . . . . . . . . . . . . . 59. World delivered energy consumption in the transportation sector, 2005-2035. . . . . . . . . . . . . . . . . . . . . . . . . . . . 6
10. World energy-related carbon dioxide emissions, 2007-2035 . . . . . . . . . . . . . . . . . . . . . . . . . . . . . . . . . . . . . . . . . . . 811. Impacts of four Kaya factors on world carbon dioxide emissions, 1990-2035 . . . . . . . . . . . . . . . . . . . . . . . . . . . . . 812. World marketed energy consumption, 1990-2035 . . . . . . . . . . . . . . . . . . . . . . . . . . . . . . . . . . . . . . . . . . . . . . . . . . . 913. World marketed energy consumption: OECD and Non-OECD, 1990-2035 . . . . . . . . . . . . . . . . . . . . . . . . . . . . . . 1014. Shares of world energy consumption in the United States, China, and India, 1990-2035. . . . . . . . . . . . . . . . . . . . 1015. Marketed energy use in Non-OECD economies by region, 1990-2035 . . . . . . . . . . . . . . . . . . . . . . . . . . . . . . . . . . . 1016. World marketed energy use by fuel type, 1990-2035 . . . . . . . . . . . . . . . . . . . . . . . . . . . . . . . . . . . . . . . . . . . . . . . . . 1117. Coal consumption in selected world regions, 1990-2035 . . . . . . . . . . . . . . . . . . . . . . . . . . . . . . . . . . . . . . . . . . . . . . 1218. World electricity generation by fuel, 2007-2035. . . . . . . . . . . . . . . . . . . . . . . . . . . . . . . . . . . . . . . . . . . . . . . . . . . . . . 1219. Renewable electricity generation in China by energy source, 2007-2035 . . . . . . . . . . . . . . . . . . . . . . . . . . . . . . . . . 1320. World nuclear generating capacity by region, 2007 and 2035 . . . . . . . . . . . . . . . . . . . . . . . . . . . . . . . . . . . . . . . . . . 1321. OECD and Non-OECD total gross domestic product, 1990-2035 . . . . . . . . . . . . . . . . . . . . . . . . . . . . . . . . . . . . . . . 1622. World marketed energy consumption in three Economic Growth cases, 1990-2035 . . . . . . . . . . . . . . . . . . . . . . . 2023. World oil prices in three Oil Price cases, 1990-2035 . . . . . . . . . . . . . . . . . . . . . . . . . . . . . . . . . . . . . . . . . . . . . . . . . . . 2024. World marketed energy consumption in three Oil Price cases, 2007-2035. . . . . . . . . . . . . . . . . . . . . . . . . . . . . . . . 2125. World marketed energy consumption by fuel in three Oil Price cases, 2035 . . . . . . . . . . . . . . . . . . . . . . . . . . . . . . 2126. World liquids consumption by sector in three Oil Price cases, 2035 . . . . . . . . . . . . . . . . . . . . . . . . . . . . . . . . . . . . . 2127. World liquids consumption by region and country group, 2007 and 2035 . . . . . . . . . . . . . . . . . . . . . . . . . . . . . . . 2328. World liquid fuels production in three cases, 2007 and 2035 . . . . . . . . . . . . . . . . . . . . . . . . . . . . . . . . . . . . . . . . . . . 2329. World total liquids production, 1990-2035. . . . . . . . . . . . . . . . . . . . . . . . . . . . . . . . . . . . . . . . . . . . . . . . . . . . . . . . . . 2430. World production of unconventional liquid fuels in three cases, 2007 and 2035. . . . . . . . . . . . . . . . . . . . . . . . . . . 2531. World liquids consumption by sector, 2007-2035 . . . . . . . . . . . . . . . . . . . . . . . . . . . . . . . . . . . . . . . . . . . . . . . . . . . . 2532. World oil prices in three cases, 1980-2035. . . . . . . . . . . . . . . . . . . . . . . . . . . . . . . . . . . . . . . . . . . . . . . . . . . . . . . . . . . 2633. Non-OPEC conventional liquids production by region, 2007 and 2035 . . . . . . . . . . . . . . . . . . . . . . . . . . . . . . . . . . 3034. OPEC conventional liquids production by region, 2007 and 2035 . . . . . . . . . . . . . . . . . . . . . . . . . . . . . . . . . . . . . . 3235. World proved oil reserves by geographic region as of January 1, 2010. . . . . . . . . . . . . . . . . . . . . . . . . . . . . . . . . . . 3736. World natural gas consumption, 2007-2035. . . . . . . . . . . . . . . . . . . . . . . . . . . . . . . . . . . . . . . . . . . . . . . . . . . . . . . . . 4137. Change in world natural gas production by region, 2007-2035 . . . . . . . . . . . . . . . . . . . . . . . . . . . . . . . . . . . . . . . . . 4238. Natural gas consumption in North America by country, 2007-2035. . . . . . . . . . . . . . . . . . . . . . . . . . . . . . . . . . . . . 4239. Natural gas consumption in OECD Europe by end-use sector, 2007-2035. . . . . . . . . . . . . . . . . . . . . . . . . . . . . . . . 4340. Natural gas consumption in OECD Asia by country and end-use sector, 2007 and 2035. . . . . . . . . . . . . . . . . . . . 4341. Natural gas consumption in Non-OECD Europe and Eurasia, 2007-2035 . . . . . . . . . . . . . . . . . . . . . . . . . . . . . . . . 4442. Natural gas consumption in Non-OECD Asia by country, 2007-2035 . . . . . . . . . . . . . . . . . . . . . . . . . . . . . . . . . . . 4443. OECD natural gas production by country, 1990-2035. . . . . . . . . . . . . . . . . . . . . . . . . . . . . . . . . . . . . . . . . . . . . . . . . 4544. OECD Europe natural gas production, 1990-2035. . . . . . . . . . . . . . . . . . . . . . . . . . . . . . . . . . . . . . . . . . . . . . . . . . . . 4745. Middle East natural gas production, 1990-2035. . . . . . . . . . . . . . . . . . . . . . . . . . . . . . . . . . . . . . . . . . . . . . . . . . . . . . 4746. Non-OECD Europe and Eurasia natural gas production, 1992-2035 . . . . . . . . . . . . . . . . . . . . . . . . . . . . . . . . . . . . 4847. Africa natural gas production, 1990-2035. . . . . . . . . . . . . . . . . . . . . . . . . . . . . . . . . . . . . . . . . . . . . . . . . . . . . . . . . . . 4948. Non-OECD Asia natural gas production, 1990-2035 . . . . . . . . . . . . . . . . . . . . . . . . . . . . . . . . . . . . . . . . . . . . . . . . . 4949. China natural gas production, 1990-2035 . . . . . . . . . . . . . . . . . . . . . . . . . . . . . . . . . . . . . . . . . . . . . . . . . . . . . . . . . . . 5050. Central and South America natural gas production, 1990-2035 . . . . . . . . . . . . . . . . . . . . . . . . . . . . . . . . . . . . . . . . 5051. OECD North America net natural gas trade, 2007-2035 . . . . . . . . . . . . . . . . . . . . . . . . . . . . . . . . . . . . . . . . . . . . . . . 5152. OECD Asia net natural gas trade, 2007-2035 . . . . . . . . . . . . . . . . . . . . . . . . . . . . . . . . . . . . . . . . . . . . . . . . . . . . . . . . 5253. Non-OECD Europe and Eurasia net natural gas trade, 2007-2035 . . . . . . . . . . . . . . . . . . . . . . . . . . . . . . . . . . . . . . 5354. Non-OECD Asia net natural gas trade, 2007-2035. . . . . . . . . . . . . . . . . . . . . . . . . . . . . . . . . . . . . . . . . . . . . . . . . . . . 5455. Middle East net natural gas trade, 2007-2035. . . . . . . . . . . . . . . . . . . . . . . . . . . . . . . . . . . . . . . . . . . . . . . . . . . . . . . . 5556. Africa net natural gas trade, 2007-2035 . . . . . . . . . . . . . . . . . . . . . . . . . . . . . . . . . . . . . . . . . . . . . . . . . . . . . . . . . . . . . 56
Figures (continued) Page
vi U.S. Energy Information Administration / International Energy Outlook 2010
57. Non-OECD Central and South America net natural gas trade, 2007-2035 . . . . . . . . . . . . . . . . . . . . . . . . . . . . . . . . 5658. World natural gas reserves by geographic region as of January 1, 2010 . . . . . . . . . . . . . . . . . . . . . . . . . . . . . . . . . . 5759. World natural gas reserves by region, 1980-2010 . . . . . . . . . . . . . . . . . . . . . . . . . . . . . . . . . . . . . . . . . . . . . . . . . . . . 5760. World coal consumption by country grouping, 1980-2035 . . . . . . . . . . . . . . . . . . . . . . . . . . . . . . . . . . . . . . . . . . . . 6161. Coal share of world energy consumption by sector, 2007, 2020, and 2035 . . . . . . . . . . . . . . . . . . . . . . . . . . . . . . . . 6162. OECD coal consumption by region, 1980, 2007, 2020, and 2035 . . . . . . . . . . . . . . . . . . . . . . . . . . . . . . . . . . . . . . . . 6263. Non-OECD coal consumption by region, 1980, 2007, 2020, and 2035 . . . . . . . . . . . . . . . . . . . . . . . . . . . . . . . . . . . . 6364. Coal consumption in China by sector, 2007, 2020, and 2035. . . . . . . . . . . . . . . . . . . . . . . . . . . . . . . . . . . . . . . . . . . . 6365. Coal imports by major importing region, 1995-2035. . . . . . . . . . . . . . . . . . . . . . . . . . . . . . . . . . . . . . . . . . . . . . . . . . 6866. Coal imports to Asia by major importing region, 2007 and 2035 . . . . . . . . . . . . . . . . . . . . . . . . . . . . . . . . . . . . . . . . 6867. Growth in world electric power generation and total energy consumption, 1990-2035 . . . . . . . . . . . . . . . . . . . . 7768. World net electricity generation by region, 1990-2035 . . . . . . . . . . . . . . . . . . . . . . . . . . . . . . . . . . . . . . . . . . . . . . . . 7769. Non-OECD net electricity generation by region, 1990-2035 . . . . . . . . . . . . . . . . . . . . . . . . . . . . . . . . . . . . . . . . . . . 7870. World net electricity generation by fuel, 2006-2030 . . . . . . . . . . . . . . . . . . . . . . . . . . . . . . . . . . . . . . . . . . . . . . . . . . 7971. World net electricity generation from nuclear power by region, 2007-2030 . . . . . . . . . . . . . . . . . . . . . . . . . . . . . . 8072. Net electricity generation in North America, 1990-2035. . . . . . . . . . . . . . . . . . . . . . . . . . . . . . . . . . . . . . . . . . . . . . . 8273. Net electricity generation in North America by fuel, 2007 and 2035 . . . . . . . . . . . . . . . . . . . . . . . . . . . . . . . . . . . . . 8274. Net electricity generation in OECD Europe by fuel, 2007-2035. . . . . . . . . . . . . . . . . . . . . . . . . . . . . . . . . . . . . . . . . 8475. Net electricity generation in OECD Asia, 2007-2035 . . . . . . . . . . . . . . . . . . . . . . . . . . . . . . . . . . . . . . . . . . . . . . . . . 8576. Net electricity generation in Non-OECD Europe and Eurasia, 2007-2035 . . . . . . . . . . . . . . . . . . . . . . . . . . . . . . . . 8677. Net electricity generation in Non-OECD Asia by fuel, 2007-2035 . . . . . . . . . . . . . . . . . . . . . . . . . . . . . . . . . . . . . . . 8778. Net electricity generation in the Middle East by fuel, 2007-2035 . . . . . . . . . . . . . . . . . . . . . . . . . . . . . . . . . . . . . . . . 8979. Net electricity generation in Africa by fuel, 2007-2035 . . . . . . . . . . . . . . . . . . . . . . . . . . . . . . . . . . . . . . . . . . . . . . . . 9080. Net electricity generation in Brazil by fuel, 2007-2035 . . . . . . . . . . . . . . . . . . . . . . . . . . . . . . . . . . . . . . . . . . . . . . . . 9181. Net electricity generation in Other Central and South America by fuel, 2007-2035 . . . . . . . . . . . . . . . . . . . . . . . . 9282. Annual changes in world industrial and all other end-use energy consumption
from previous year, 2006-2010. . . . . . . . . . . . . . . . . . . . . . . . . . . . . . . . . . . . . . . . . . . . . . . . . . . . . . . . . . . . . . . . . . . . 9883. World delivered energy consumption in the industrial and all other end-use sectors, 2005-2035 . . . . . . . . . . . . 9884. OECD and Non-OECD industrial sector energy consumption, 2007-2035 . . . . . . . . . . . . . . . . . . . . . . . . . . . . . . . 9885. World industrial sector energy consumption by fuel, 2007 and 2035 . . . . . . . . . . . . . . . . . . . . . . . . . . . . . . . . . . . . 9886. World industrial sector energy consumption by major energy-intensive industry shares, 2007 . . . . . . . . . . . . . 9987. OECD and Non-OECD major steel producers, 2008. . . . . . . . . . . . . . . . . . . . . . . . . . . . . . . . . . . . . . . . . . . . . . . . . . 10088. OECD industrial sector energy consumption by fuel, 2007 and 2035 . . . . . . . . . . . . . . . . . . . . . . . . . . . . . . . . . . . . 10289. Non-OECD industrial sector energy consumption by fuel, 2007 and 2035 . . . . . . . . . . . . . . . . . . . . . . . . . . . . . . . 10490. Industrial sector energy consumption in Brazil by energy source, IEO2009 and IEO2010 Reference cases,
2006, 2020, and 2030 . . . . . . . . . . . . . . . . . . . . . . . . . . . . . . . . . . . . . . . . . . . . . . . . . . . . . . . . . . . . . . . . . . . . . . . . . . . . 10691. World liquids consumption by end-use sector, 2007-2035. . . . . . . . . . . . . . . . . . . . . . . . . . . . . . . . . . . . . . . . . . . . . 10992. OECD and Non-OECD transportation sector liquids consumption, 2007-2035 . . . . . . . . . . . . . . . . . . . . . . . . . . . 10993. OECD transportation energy use by region, 2007, 2025, and 2035 . . . . . . . . . . . . . . . . . . . . . . . . . . . . . . . . . . . . . . 11294. North America transportation energy use by country, 2007 and 2035 . . . . . . . . . . . . . . . . . . . . . . . . . . . . . . . . . . . 11295. OECD Europe transportation energy use, 2007-2035 . . . . . . . . . . . . . . . . . . . . . . . . . . . . . . . . . . . . . . . . . . . . . . . . . 11396. OECD Asia transportation energy use by country, 2007-2035. . . . . . . . . . . . . . . . . . . . . . . . . . . . . . . . . . . . . . . . . . 11597. Non-OECD transportation energy use by region, 2007-2035. . . . . . . . . . . . . . . . . . . . . . . . . . . . . . . . . . . . . . . . . . . 11598. Non-OECD Asia transportation energy use by country, 2007-2035 . . . . . . . . . . . . . . . . . . . . . . . . . . . . . . . . . . . . . 11699. Transportation energy use per capita in China and South Korea, 2007-2035. . . . . . . . . . . . . . . . . . . . . . . . . . . . . . 116
100. Middle East transportation energy use, 2007-2035 . . . . . . . . . . . . . . . . . . . . . . . . . . . . . . . . . . . . . . . . . . . . . . . . . . . 118101. Central and South America transportation energy use by country, 2007 and 2035. . . . . . . . . . . . . . . . . . . . . . . . . 119102. Non-OECD Europe and Eurasia transportation energy use by country, 2007-2035 . . . . . . . . . . . . . . . . . . . . . . . . 119103. World energy-related carbon dioxide emissions, 2007-2035 . . . . . . . . . . . . . . . . . . . . . . . . . . . . . . . . . . . . . . . . . . . 123104. World energy-related carbon dioxide emissions by fuel type, 1990-2035 . . . . . . . . . . . . . . . . . . . . . . . . . . . . . . . . 124105. U.S. energy-related carbon dioxide emissions by fuel in IEO2009 and IEO2010, 2007, 2015, and 2030. . . . . . . . . 128106. Average annual growth in energy-related carbon dioxide emissions in OECD economies, 2007-2035 . . . . . . . . 128107. Average annual growth in energy-related carbon dioxide emissions in Non-OECD economies, 2007-2035 . . . 128108. World carbon dioxide emissions from liquids combustion, 1990-2035 . . . . . . . . . . . . . . . . . . . . . . . . . . . . . . . . . . 129109. World carbon dioxide emissions from natural gas combustion, 1990-2035 . . . . . . . . . . . . . . . . . . . . . . . . . . . . . . . 129110. World carbon dioxide emissions from coal combustion, 1990-2035 . . . . . . . . . . . . . . . . . . . . . . . . . . . . . . . . . . . . . 129

Figures (continued) Page
U.S. Energy Information Administration / International Energy Outlook 2010 vii
111. World carbon dioxide emissions per capita, 1990-2035 . . . . . . . . . . . . . . . . . . . . . . . . . . . . . . . . . . . . . . . . . . . . . . . 132112. Non-OECD carbon dioxide emissions per capita by country and region, 1990-2035 . . . . . . . . . . . . . . . . . . . . . . . 132113. OECD carbon dioxide emissions per capita by country and region, 1990-2035. . . . . . . . . . . . . . . . . . . . . . . . . . . . 132114. Carbon dioxide emissions in three Economic Growth cases, 2007 and 2035 . . . . . . . . . . . . . . . . . . . . . . . . . . . . . . 133

This page intentionally left blank.

PrefaceThis report presents international energy projections through 2035,
prepared by the U.S. Energy Information Administration, including outlooks
for major energy fuels and associated carbon dioxide emissions.
The International Energy Outlook 2010 (IEO2010) presentsan assessment by the U.S. Energy Information Adminis-tration (EIA) of the outlook for international energymarkets through 2035. U.S. projections appearing inIEO2010 are consistent with those published in EIA’sAnnual Energy Outlook 2010 (AEO2010) in April 2010.
The IEO2010 projections are based to the extent possibleon U.S. and foreign laws, regulations, and standards ineffect at the start of 2010. The potential impacts of pend-ing or proposed legislation, regulations, and standardsare not reflected in the projections, nor are the impacts oflegislation for which the implementing mechanismshave not yet been announced. In addition, mechanismswhose implementation cannot be modeled given cur-rent capabilities or whose impacts on the energy sectorare unclear are not included in IEO2010. For example,the European Union’s Emissions Trading System,which includes non-carbon dioxide emissions and non-energy-related emissions, are not included in thisanalysis.
IEO2010 focuses exclusively on marketed energy.Non-marketed energy sources, which continue to playan important role in some developing countries, are notincluded in the estimates.
The IEO2010 consumption projections are groupedaccording to Organization for Economic Cooperationand Development membership. (OECD includes allmembers of the organization as of March 1, 2010,throughout all time series included in this report. Chilebecame a member on May 7, 2010, but its membership isnot reflected in IEO2010.) There are three basic group-ings of OECD countries: North America (United States,Canada, and Mexico); OECD Europe; and OECD Asia(Japan, South Korea, and Australia/New Zealand).Non-OECD is divided into five separate regional sub-groups: non-OECD Europe and Eurasia, non-OECDAsia, Africa, Middle East, and Central and South Amer-ica. Russia is represented in non-OECD Europe and Eur-asia; China and India are represented in non-OECDAsia; and Brazil is represented in Central and SouthAmerica. In some instances, the IEO2010 productionmodels have different regional aggregations to reflectthe important producer regions (for example, MiddleEast OPEC is a key region in the projections of liquidsupplies). The complete regional definitions are listed inAppendix M.
The report begins with a review of world trends inenergy demand and the major macroeconomic assump-tions used in deriving the IEO2010 projections, which—
U.S. Energy Information Administration / International Energy Outlook 2010 ix
Objectives of the IEO2010 Projections
The projections in IEO2010 are not statements of what will happen, but what might happen given the specificassumptions and methodologies used for any particular scenario. The Reference case projection is a busi-ness-as-usual trend estimate, given known technology and technological and demographic trends. EIA explores theimpacts of alternative assumptions in other scenarios with different macroeconomic growth rates and world oilprices. The IEO2010 cases generally assume that current laws and regulations are maintained throughout the projec-tions. Thus, the projections provide policy-neutral baselines that can used to analyze international energy markets.
While energy markets are complex, energy models are simplified representations of energy production and con-sumption, regulations, and producer and consumer behavior. Projections are highly dependent on the data, meth-odologies, model structures, and assumptions used in their development. Behavioral characteristics are indicativeof real-world tendencies, rather than representations of specific outcomes.
Energy market projections are subject to much uncertainty. Many of the events that shape energy markets cannot befully anticipated. In addition, future developments in technologies, demographics, and resources cannot be foreseenwith certainty. Key uncertainties in the IEO2010 projections for economic growth and oil prices are addressedthrough alternative cases.
EIA has endeavored to make these projections as impartial, reliable, and relevant as possible. They should, however,serve as an adjunct to, not a substitute for, a complete and focused analysis of public policy initiatives.
for the first time—extend to 2035. In addition to Refer-ence case projections, High Economic Growth and LowEconomic Growth cases were developed to consider theeffects of higher and lower growth paths for economicactivity than are assumed in the Reference case. IEO2010also includes a High Oil Price case and, alternatively, aLow Oil Price case. The resulting projections—and theuncertainty associated with international energy projec-tions in general—are discussed in Chapter 1, “WorldEnergy Demand and Economic Outlook.”
Projections for energy consumption and production byfuel—liquids (primarily petroleum), natural gas, andcoal—are presented in Chapters 2, 3, and 4, along withreviews of the current status of each fuel on a worldwidebasis. Chapter 5 discusses the projections for world elec-tricity markets—including nuclear power, hydropower,and other commercial renewable energy resources—and presents forecasts of world installed generatingcapacity. Chapter 6 provides a discussion of industrialsector energy use. Chapter 7 includes a detailed look atthe world’s transportation energy use. Finally, Chapter 8discusses the outlook for global energy-related carbondioxide emissions.
Appendix A contains summary tables for the IEO2010Reference case projections of world energy consump-tion, gross domestic product, energy consumption byfuel, carbon dioxide emissions, and regional populationgrowth. Summary tables of projections for the High andLow Economic Growth cases are provided in Appen-dixes B and C, respectively, and projections for the Highand Low Oil Price cases are provided in Appendixes Dand E, respectively. Reference case projections of deliv-ered energy consumption by end-use sector and regionare presented in Appendix F. Appendix G contains
summary tables of projections for world liquids produc-tion in all cases. Appendix H contains summary tables ofReference case projections for installed electric powercapacity by fuel and regional electricity generation.Appendix I contains summary tables for projections ofworld natural gas production in all cases. Appendix Jincludes a set of tables for each of the four Kaya Identitycomponents. In Appendix K, a set of comparisons ofprojections from the International Energy Agency’sWorld Energy Outlook 2009 with the IEO2010 projectionsis presented. Comparisons of the IEO2010 and IEO2009projections are also presented in Appendix K. AppendixL describes the models used to generate the IEO2010projections, and Appendix M defines the regional desig-nations included in the report.
The IEO2010 projections of world energy consumptionwere generated from EIA’s World Energy ProjectionsPlus (WEPS+) modeling system. WEPS+ is used to buildthe Reference case energy projections, as well as alterna-tive energy projections based on different assumptionsfor GDP growth and fossil fuel prices. The IEO2010 pro-jections of global natural gas production and trade weregenerated from EIA’s International Natural Gas Model(INGM), which estimates natural gas production,demand, and international trade by combining esti-mates of natural gas reserves, natural gas resources andresource extraction costs, energy demand, and transpor-tation costs and capacity in order to estimate future pro-duction. The Generate World Oil Balance (GWOB)application is used to create a “bottom up” projection ofworld liquids supply—based on current productioncapacity, planned future additions to capacity, resourcedata, geopolitical factors, and oil prices—and to gener-ate conventional crude oil production cases.
x U.S. Energy Information Administration / International Energy Outlook 2010

HighlightsWorld marketed energy consumption increases by 49 percent from 2007 to 2035
in the Reference case. Total energy demand in non-OECD countries increases
by 84 percent, compared with an increase of 14 percent in OECD countries.
In the IEO2010 Reference case, which does not includeprospective legislation or policies, world marketedenergy consumption grows by 49 percent from 2007 to2035. Total world energy use rises from 495 quadrillionBritish thermal units (Btu) in 2007 to 590 quadrillion Btuin 2020 and 739 quadrillion Btu in 2035 (Figure 1).
The global economic recession that began in 2008 andcontinued into 2009 has had a profound impact on worldenergy demand in the near term. Total world marketedenergy consumption contracted by 1.2 percent in 2008and by an estimated 2.2 percent in 2009, as manufactur-ing and consumer demand for goods and servicesdeclined. Although the recession appears to have ended,the pace of recovery has been uneven so far, with Chinaand India leading and Japan and the European Unionmember countries lagging. In the Reference case, as theeconomic situation improves, most nations return to theeconomic growth paths that were anticipated before therecession began.
The most rapid growth in energy demand from 2007to 2035 occurs in nations outside the Organizationfor Economic Cooperation and Development1 (non-OECD nations). Total non-OECD energy consumption
increases by 84 percent in the Reference case, comparedwith a 14-percent increase in energy use among OECDcountries. Strong long-term growth in gross domesticproduct (GDP) in the emerging economies of non-OECDcountries drives their growing energy demand. In allnon-OECD regions combined, economic activity—asmeasured by GDP in purchasing power parity terms—increases by 4.4 percent per year on average, comparedwith an average of 2.0 percent per year for OECDcountries.
The IEO2010 Reference case projects increased worldconsumption of marketed energy from all fuel sourcesover the 2007-2035 projection period (Figure 2). Fossilfuels are expected to continue supplying much of theenergy used worldwide. Although liquid fuels remainthe largest source of energy, the liquids share of worldmarketed energy consumption falls from 35 percent in2007 to 30 percent in 2035, as projected high world oilprices lead many energy users to switch away from liq-uid fuels when feasible. In the Reference case, the use ofliquids grows modestly or declines in all end-use sectorsexcept transportation, where in the absence of signifi-cant technological advances liquids continue to providemuch of the energy consumed.
U.S. Energy Information Administration / International Energy Outlook 2010 1
495543
590639
687739
2007 2015 2020 2025 2030 20350
200
400
600
800
OECD
Non-OECD
Figure 1. World marketed energy consumption,2007-2035 (quadrillion Btu)
1990 2000 2007 2015 2025 20350
50
100
150
200
250History Projections
Liquids
Natural gas
Coal
Renewables
Nuclear
Figure 2. World marketed energy use by fuel type,1990-2035 (quadrillion Btu)
1Current OECD member countries (as of March 10, 2010) are the United States, Canada, Mexico, Austria, Belgium, Czech Republic, Den-mark, Finland, France, Germany, Greece, Hungary, Iceland, Ireland, Italy, Luxembourg, the Netherlands, Norway, Poland, Portugal,Slovakia, Spain, Sweden, Switzerland, Turkey, the United Kingdom, Japan, South Korea, Australia, and New Zealand. Chile became amember on May 7, 2010, but its membership is not reflected in IEO2010.

Average oil prices2 increased strongly from 2003 tomid-July 2008, when prices collapsed as a result of con-cerns about the deepening recession. In 2009, oil pricestrended upward throughout the year, from about $42per barrel in January to $74 per barrel in December. Oilprices have been especially sensitive to demand expecta-tions, with producers, consumers, and traders continu-ally looking for an indication of possible recovery inworld economic growth and a likely correspondingincrease in oil demand. On the supply side, OPEC’sabove-average compliance to agreed-upon productiontargets increased the group’s spare capacity to roughly5 million barrels per day in 2009. Further, many of thenon-OPEC projects that were delayed during the priceslump in the second half of 2008 have not yet beenrevived.
After 2 years of declining demand, world liquids con-sumption is expected to increase in 2010 and strengthenthereafter as the world economies recover fully from theeffects of the recession. In the IEO2010 Reference case,the price of light sweet crude oil in the United States (inreal 2008 dollars) rises from $79 per barrel in 2010 to $108per barrel in 2020 and $133 per barrel in 2035.
World energy markets by fuel typeLiquid fuels
Liquids remain the world’s largest energy sourcethroughout the IEO2010 Reference case projection,given their importance in the transportation and indus-trial end-use sectors. World use of liquids and otherpetroleum3 grows from 86.1 million barrels per day in2007 to 92.1 million barrels per day in 2020, 103.9 millionbarrels per day in 2030, and 110.6 million barrels per dayin 2035. On a global basis, liquids consumption remainsflat in the buildings sector, increases modestly in theindustrial sector, but declines in the electric power sectoras electricity generators react to rising world oil pricesby switching to alternative fuels whenever possible. Inthe transportation sector, despite rising prices, use ofliquid fuels increases by an average of 1.3 percent peryear, or 45 percent overall from 2007 to 2035.
To meet the increase in world demand in the Referencecase, liquids production (including both conventionaland unconventional liquid supplies) increases by a totalof 25.8 million barrels per day from 2007 to 2035. The
Reference case assumes that OPEC countries will investin incremental production capacity in order to maintaina share of approximately 40 percent of total worldliquids production through 2035, consistent with theirshare over the past 15 years. Increasing volumes of con-ventional liquids (crude oil and lease condensate, natu-ral gas plant liquids, and refinery gain) from OPECproducers contribute 11.5 million barrels per day to thetotal increase in world liquids production, and conven-tional supplies from non-OPEC countries add another4.8 million barrels per day (Figure 3).
Unconventional resources (including oil sands, extra-heavy oil, biofuels, coal-to-liquids, gas-to-liquids, andshale oil) from both OPEC and non-OPEC sources growon average by 4.9 percent per year over the projectionperiod. Sustained high oil prices allow unconventionalresources to become economically competitive, par-ticularly when geopolitical or other “above ground”constraints4 limit access to prospective conventionalresources. World production of unconventional liquidfuels, which totaled only 3.4 million barrels per day in2007, increases to 12.9 million barrels per day andaccounts for 12 percent of total world liquids supply in2035. Oil sands from Canada and biofuels, largely fromBrazil and the United States, are the largest componentsof future unconventional production in the IEO2010Reference case, providing a combined 70 percent of theincrement in total unconventional supply over the pro-jection period.
2 U.S. Energy Information Administration / International Energy Outlook 2010
1990 2000 2007 2015 2025 20350
25
50
75
100
125
Total
OPEC conventional
Non-OPEC conventional
Unconventional
History Projections
Figure 3. World liquids production, 1990-2035(million barrels per day)
2The oil price reported in IEO2010 is for light sweet crude oil delivered to Cushing, Oklahoma. The price series is consistent with spotprices for light sweet crude oil reported on the New York Mercantile Exchange (NYMEX). All oil prices are in real 2008 dollars per barrel,unless otherwise noted.
3Liquid fuels and other petroleum include petroleum-derived fuels and non-petroleum-derived liquid fuels, such as ethanol andbiodiesel, coal-to-liquids, and gas-to-liquids. Petroleum coke, which is a solid, is included. Also included are natural gas liquids, crude oilconsumed as a fuel, and liquid hydrogen.
4“Above-ground” constraints refer to those nongeological factors that might affect supply, including: government policies that limitaccess to resources; conflict; terrorist activity; lack of technological advances or access to technology; price constraints on the economicaldevelopment of resources; labor shortages; materials shortages; weather; environmental protection actions; and other short- and long-termgeopolitical considerations.

Natural gas
Natural gas consumption worldwide increases by 44percent in the Reference case, from 108 trillion cubic feetin 2007 to 156 trillion cubic feet in 2035. In 2009, worldnatural gas consumption declined by an estimated 1.1percent, and natural gas use in the industrial sector felleven more sharply, by 6.0 percent, as demand for manu-factured goods declined during the recession. Theindustrial sector currently consumes more natural gasthan any other end-use sector, and in the projection itcontinues as the largest user through 2035, when 39 per-cent of the world’s natural gas supply is consumed forindustrial purposes. Electricity generation is anotherimportant use for natural gas throughout the projection,and its share of the world’s total natural gas consump-tion increases from 33 percent in 2007 to 36 percent in2035.
In the near term, as world economies begin to recoverfrom the downturn, global demand for natural gas isexpected to rebound, with natural gas supplies from avariety of sources keeping markets well supplied andprices relatively low. The largest projected increase innatural gas production is for the non-OECD region(Figure 4), with the major increments coming from theMiddle East (an increase of 16 trillion cubic feet from2007 to 2035), Africa (7 trillion cubic feet), and Russiaand the other countries of non-OECD Europe and Eur-asia (6 trillion cubic feet).
Although the extent of the world’s tight gas, shale gas,and coalbed methane resource base has not yet beenassessed fully, the IEO2010 Reference case projects asubstantial increase in those supplies—especially fromthe United States but also from Canada and China. In theUnited States, one of the keys to increasing natural gasproduction has been advances in horizontal drilling andhydraulic fracturing technologies, which have made it
possible to exploit the country’s vast shale gas resources.Rising estimates of shale gas resources have helped toincrease total U.S. natural gas reserves by almost 50 per-cent over the past decade, and shale gas rises to 26 per-cent of U.S. natural gas production in 2035 in theIEO2010 Reference case. Tight gas, shale gas, and coal-bed methane resources are even more important for thefuture of domestic natural gas supplies in Canada andChina, where they account for 63 percent and 56 percentof total domestic production, respectively, in 2035 in theReference case.
World natural gas trade, both by pipeline and by ship-ment in the form of liquefied natural gas (LNG), ispoised to increase in the future. Most of the projectedincrease in LNG supply comes from the Middle East andAustralia, where a number of new liquefaction projectsare expected to become operational within the nextdecade. In the IEO2010 Reference case, world liquefac-tion capacity increases 2.4-fold, from about 8 trillioncubic feet in 2007 to 19 trillion cubic feet in 2035. In addi-tion, new pipelines currently under construction orplanned will increase natural gas exports from Africa toEuropean markets and from Eurasia to China.
Coal
In the absence of national policies and/or binding inter-national agreements that would limit or reduce green-house gas emissions, world coal consumption isprojected to increase from 132 quadrillion Btu in 2007 to206 quadrillion Btu in 2035, at an average annual rate of1.6 percent. Much of the projected increase in coal useoccurs in non-OECD Asia, which accounts for 95 percentof the total net increase in world coal use from 2007 to2035 (Figure 5). Increasing demand for energy to fuelelectricity generation and industrial production in theregion is expected to be met in large part by coal. Forexample, installed coal-fired generating capacity in
U.S. Energy Information Administration / International Energy Outlook 2010 3
Middle East
Non-OECD Asia
Africa
Non-OECD Europe/Eurasia
Central/South America
United States
Australia/New Zealand
Other OECD
0 5 10 15 20-5
Figure 4. Net change in world natural gasproduction by region, 2007-2035 (trillion cubic feet)
1990 2000 2007 2015 2025 20350
25
50
75
100
125
150
Rest of World
North America
Non-OECD Asia
History Projections
Figure 5. World coal consumption by region,1990-2035 (quadrillion Btu)

China more than doubles in the Reference case from2007 to 2035, and coal use in China’s industrial sectorgrows by 55 percent. The development of China’s elec-tric power and industrial sectors will require not onlylarge-scale infrastructure investments but also substan-tial investment in both coal mining and coal transporta-tion infrastructure.
Electricity
World net electricity generation increases by 87 percentin the Reference case, from 18.8 trillion kilowatthours in2007 to 25.0 trillion kilowatthours in 2020 and 35.2trillion kilowatthours in 2035. Although the recessionslowed the growth in electricity demand in 2008 and2009, growth returns to pre-recession rates by 2015 in theReference case. In general, in OECD countries, whereelectricity markets are well established and consump-tion patterns are mature, the growth of electricitydemand is slower than in non-OECD countries, where alarge amount of potential demand remains unmet. In theReference case, total net generation in non-OECD coun-tries increases by 3.3 percent per year on average, ascompared with 1.1 percent per year in OECD nations.
The rapid increase in world energy prices from 2003 to2008, combined with concerns about the environmentalconsequences of greenhouse gas emissions, has led torenewed interest in alternatives to fossil fuels—particu-larly, nuclear power and renewable resources. As aresult, long-term prospects continue to improve forgeneration from both nuclear and renewable energysources—supported by government incentives and byhigher fossil fuel prices.
From 2007 to 2035, world renewable energy use for elec-tricity generation grows by an average of 3.0 percent peryear (Figure 6), and the renewable share of world elec-tricity generation increases from 18 percent in 2007 to23 percent in 2035. Coal-fired generation increases by
an annual average of 2.3 percent in the Reference case,making coal the second fastest-growing source for elec-tricity generation in the projection. The outlook for coalcould be altered substantially, however, by any futurelegislation that would reduce or limit the growth ofgreenhouse gas emissions. Generation from naturalgas and nuclear power—which produce relatively lowlevels of greenhouse gas emissions (natural gas) or none(nuclear)—increase by 2.1 and 2.0 percent per year,respectively, in the Reference case.
Much of the world increase in renewable electricity sup-ply is fueled by hydropower and wind power. Of the 4.5trillion kilowatthours of increased renewable generationover the projection period, 2.4 trillion kilowatthours(54 percent) is attributed to hydroelectric power and 1.2trillion kilowatthours (26 percent) to wind. Except forthose two sources, most renewable generation technolo-gies are not economically competitive with fossil fuelsover the projection period, outside a limited number ofniche markets. Typically, government incentives or poli-cies provide the primary support for construction ofrenewable generation facilities. Although they remain asmall part of total renewable generation, renewablesother than hydroelectricity and wind—including solar,geothermal, biomass, waste, and tidal/wave/oceanicenergy—do increase at a rapid rate over the projectionperiod (Figure 7).
Electricity generation from nuclear power increasesfrom about 2.6 trillion kilowatthours in 2007 to a pro-jected 3.6 trillion kilowatthours in 2020 and then to 4.5trillion kilowatthours in 2035. Higher future prices forfossil fuels make nuclear power economically competi-tive with generation from coal, natural gas, and liquidfuels, despite the relatively high capital costs of nuclearpower plants. Moreover, higher capacity utilizationrates have been reported for many existing nuclear
4 U.S. Energy Information Administration / International Energy Outlook 2010
2007 2015 2020 2025 2030 20350
10
20
30
40
Liquids
Coal
Natural gas
Renewables
Nuclear
Figure 6. World net electricity generation by fuel,2007-2035 (trillion kilowatthours)
2007 2015 2020 2025 2030 20350
200
400
600
800
1,000Biomass, waste, andtidal/wave/ocean
Solar Geothermal
Figure 7. World renewable electricity generationby energy source, excluding wind and hydropower,2007-2035 (billion kilowatthours)
facilities, and the projection anticipates that most of theolder nuclear power plants in OECD countries andnon-OECD Eurasia will be granted extensions to theiroperating lives.
Around the world, nuclear generation is attracting newinterest as countries seek to increase the diversity oftheir energy supplies, improve energy security, and pro-vide a low-carbon alternative to fossil fuels. Still, there isconsiderable uncertainty associated with nuclear powerprojections. Issues that could slow the expansion ofnuclear power in the future include plant safety, radio-active waste disposal, rising construction costs andinvestment risk, and nuclear material proliferation con-cerns. Those issues continue to raise public concern inmany countries and may hinder the development ofnew nuclear power reactors. Nevertheless, the IEO2010Reference case incorporates improved prospects forworld nuclear power. The projection for nuclear electric-ity generation in 2030 is 9 percent higher than the projec-tion published in last year’s IEO.
On a regional basis, the Reference case projects the stron-gest growth in nuclear power for the countries ofnon-OECD Asia, where nuclear power generation isprojected to grow at an average rate of 7.7 percent peryear from 2007 to 2035, including projected increasesaveraging 8.4 percent per year in China and 9.5 percentper year in India. Outside Asia, the largest projectedincrease in installed nuclear capacity is in Central andSouth America, with increases in nuclear power genera-tion averaging 4.3 percent per year. Prospects fornuclear generation in OECD Europe have undergone asignificant revision from last year’s outlook, because anumber of countries in the region are reversing policiesthat require the retirement of nuclear power plants andmoratoria on new construction. In the IEO2010 Refer-ence case, nuclear generation in OECD Europe increaseson average by 0.8 percent per year, as compared with thesmall decline projected in IEO2009.
World delivered energy useby sectorThis section discusses delivered energy use, which doesnot include losses associated with electricity generationand transmission.
Industry
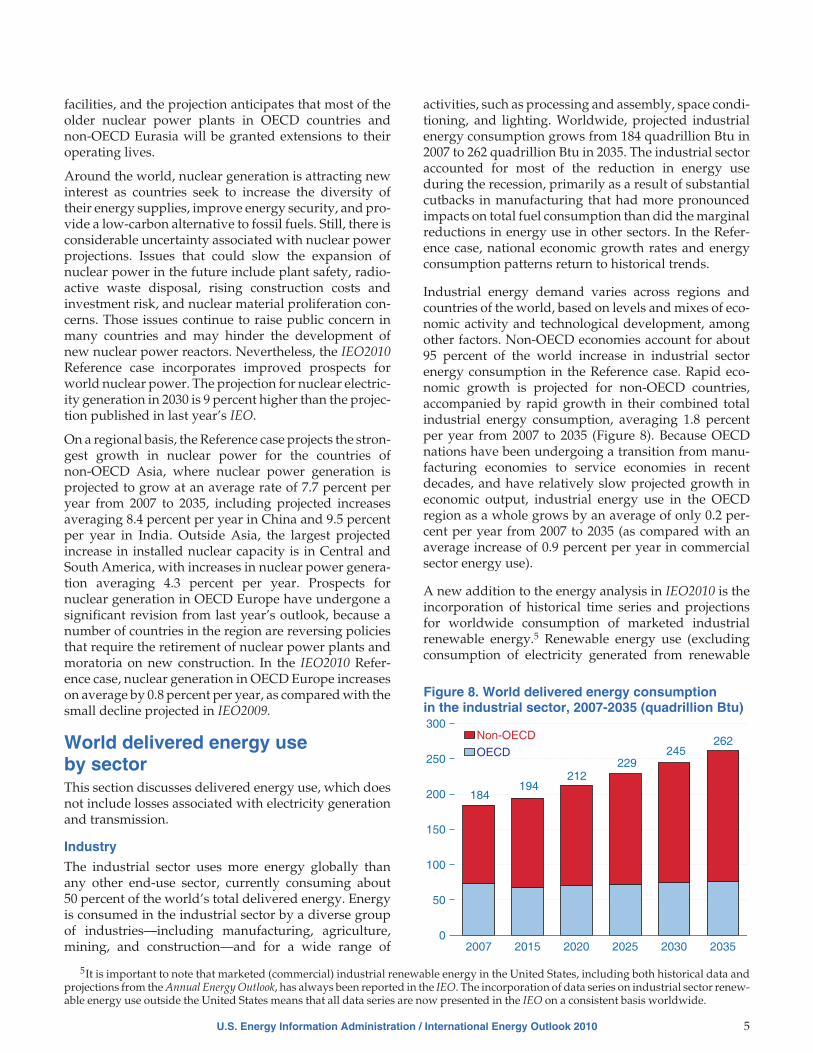
The industrial sector uses more energy globally thanany other end-use sector, currently consuming about50 percent of the world’s total delivered energy. Energyis consumed in the industrial sector by a diverse groupof industries—including manufacturing, agriculture,mining, and construction—and for a wide range of
activities, such as processing and assembly, space condi-tioning, and lighting. Worldwide, projected industrialenergy consumption grows from 184 quadrillion Btu in2007 to 262 quadrillion Btu in 2035. The industrial sectoraccounted for most of the reduction in energy useduring the recession, primarily as a result of substantialcutbacks in manufacturing that had more pronouncedimpacts on total fuel consumption than did the marginalreductions in energy use in other sectors. In the Refer-ence case, national economic growth rates and energyconsumption patterns return to historical trends.
Industrial energy demand varies across regions andcountries of the world, based on levels and mixes of eco-nomic activity and technological development, amongother factors. Non-OECD economies account for about95 percent of the world increase in industrial sectorenergy consumption in the Reference case. Rapid eco-nomic growth is projected for non-OECD countries,accompanied by rapid growth in their combined totalindustrial energy consumption, averaging 1.8 percentper year from 2007 to 2035 (Figure 8). Because OECDnations have been undergoing a transition from manu-facturing economies to service economies in recentdecades, and have relatively slow projected growth ineconomic output, industrial energy use in the OECDregion as a whole grows by an average of only 0.2 per-cent per year from 2007 to 2035 (as compared with anaverage increase of 0.9 percent per year in commercialsector energy use).
A new addition to the energy analysis in IEO2010 is theincorporation of historical time series and projectionsfor worldwide consumption of marketed industrialrenewable energy.5 Renewable energy use (excludingconsumption of electricity generated from renewable
U.S. Energy Information Administration / International Energy Outlook 2010 5
2007 2015 2020 2025 2030 20350
50
100
150
200
250
300
OECD
Non-OECD
184194
212229
245262
Figure 8. World delivered energy consumptionin the industrial sector, 2007-2035 (quadrillion Btu)
5It is important to note that marketed (commercial) industrial renewable energy in the United States, including both historical data andprojections from the Annual Energy Outlook, has always been reported in the IEO. The incorporation of data series on industrial sector renew-able energy use outside the United States means that all data series are now presented in the IEO on a consistent basis worldwide.

energy sources) constitutes a substantial portion of theworld’s industrial sector energy consumption. In 2007,the industrial sector consumed 13 quadrillion Btu ofnon-electricity renewables, or about 7 percent of the sec-tor’s total delivered energy use. From 2007 to 2035,renewable energy use in the industrial sector worldwideincreases by an average of 1.8 percent per year, and therenewable share of total delivered energy use in theindustrial sector increases to 8 percent in 2035. Biomassfor heat and power production currently provides thevast majority of renewable energy consumed in theindustrial sector (90 percent), and it is expected toremain the largest component of the industrial sector’srenewable energy mix through the projection period.
Transportation
Energy use in the transportation sector includes theenergy consumed in moving people and goods by road,rail, air, water, and pipeline. The transportation sector issecond only to the industrial sector in terms of totalend-use energy consumption. Almost 30 percent of theworld’s total delivered energy is used for transportation,most of it in the form of liquid fuels. The transportationshare of world total liquids consumption increases from53 percent in 2007 to 61 percent in 2035 in the IEO2010Reference case, accounting for 87 percent of the totalincrease in world liquids consumption. Thus, under-standing the development of transportation energy useis the most important factor in assessing future trends indemand for liquid fuels.
World oil prices reached historically high levels in 2008,in part because of a strong increase in demand for trans-portation fuels, particularly in emerging non-OECDeconomies (Figure 9). Non-OECD energy use for trans-portation increased by 4.5 percent in 2007 and 7.3 per-cent in 2008, before the impact of the 2008-2009 globaleconomic recession resulted in a slowdown in
transportation sector activity. Even in 2009, non-OECDtransportation energy use grew by an estimated 3.2 per-cent, in part because many non-OECD countries (in par-ticular, but not limited to, the oil-rich nations) providefuel subsidies to their citizens. With robust economicrecovery expected to continue in China, India, and othernon-OECD nations, growing demand for raw materials,manufactured goods, and business and personal travelis projected to support fast-paced growth in energy usefor transportation both in the short term and over thelong term. In the IEO2010 Reference case, non-OECDtransportation energy use grows by 2.6 percent per yearfrom 2007 to 2035.
In comparison with non-OECD economies, high oilprices and economic recession had more profoundimpacts on OECD economies. OECD energy use fortransportation declined by an estimated 1.3 percent in2008, followed by a further decrease estimated at 2.0 per-cent in 2009. Indications are that a return to growth intransportation energy use in OECD nations will notbegin before late 2010, given the relatively slow recoveryfrom the global recession anticipated for many of the keyOECD nations. Moreover, the United States and some ofthe other OECD countries have instituted a number ofnew policy measures to increase the fuel efficiency oftheir vehicle fleets, as well as fuel taxation regimes toencourage fuel conservation. Thus, OECD transporta-tion energy use, growing by only 0.3 percent per yearover the entire projection period, does not return to its2007 level until after 2020.
In the long term, for both non-OECD and OECD econo-mies, steadily increasing demand for personal travel is aprimary factor underlying projected increases in energydemand for transportation. Increases in urbanizationand in personal incomes have contributed to increases inair travel and motorization (more vehicles per capita) inthe growing economies. Increases in the transport ofgoods are expected to result from continued economicgrowth in both OECD and non-OECD economies. Forfreight transportation, trucking is expected to lead thegrowth in demand for transportation fuels. In addition,as trade among countries increases, the volume offreight transported by air and marine vessels is expectedto increase rapidly.
Residential and commercial buildings
The buildings sector—comprising residential and com-mercial consumers—accounts for about one-fifth of theworld’s total delivered energy consumption. In the resi-dential sector, energy use is defined as the energy con-sumed by households, excluding transportation uses.The type and amount of energy used by householdsvary from country to country, depending on incomelevels, natural resources, climate, and available energyinfrastructure. Typical households in OECD nations use
6 U.S. Energy Information Administration / International Energy Outlook 2010
2005 2010 2015 2020 2025 2030 20350
20
40
60
80
OECD
Non-OECD
Figure 9. World delivered energy consumptionin the transportation sector, 2005-2035(quadrillion Btu)

more energy than those in non-OECD nations, in partbecause higher income levels in OECD nations supportpurchases of larger homes and more energy-usingequipment.
For residential buildings, the physical size of a structureis one key indicator of the amount of energy used by itsoccupants, although income level and a number of otherfactors, such as weather, also can affect the amount ofenergy consumed per household. Controlling for thosefactors, larger homes generally require more energy toprovide heating, air conditioning, and lighting, and theytend to include more energy-using appliances, such astelevisions and laundry equipment. Smaller structuresusually require less energy, because they contain lessspace to be heated or cooled, produce less heat transferwith the outdoor environment, and typically have feweroccupants.
In the IEO2010 Reference case, world residential energyuse increases by 1.1 percent per year over the projectionperiod, from 50 quadrillion Btu in 2007 to 69 quadrillionBtu in 2035. Much of the growth in residential energyconsumption occurs in non-OECD nations, whererobust economic growth improves standards of livingand fuels demand for residential energy. Non-OECDresidential energy consumption rises by 1.9 percent peryear, compared with the much slower rate of 0.4 percentper year for OECD countries, where patterns of residen-tial energy use already are well established, and slowerpopulation growth and aging populations translate tosmaller increases in energy demand.
The commercial sector—often referred to as the servicessector or the services and institutional sector—consistsof businesses, institutions, and organizations that pro-vide services. The sector encompasses many differenttypes of buildings and a wide range of activities andenergy-related services. Examples of service sector facil-ities include schools, stores, correctional institutions,restaurants, hotels, hospitals, museums, office build-ings, banks, and sports arenas. Most commercial energyuse occurs in buildings or structures, supplying servicessuch as space heating, water heating, lighting, cooking,and cooling. Energy consumed for services not associ-ated with buildings, such as for traffic lights and citywater and sewer services, is also categorized as commer-cial energy use. Economic trends and population growthdrive activity in the commercial sector and the resultingenergy use.
The need for services (health, education, financial, andgovernment) increases as populations grow. The degreeto which additional needs are met depends in largemeasure on economic resources—whether from domes-tic or foreign sources—and economic growth. Economicgrowth also determines the degree to which additionalactivities are offered and used in the commercial sector.
Higher levels of economic activity and disposableincome lead to increased demand for hotels and restau-rants to meet business and leisure requirements; foroffice and retail space to house and service new andexpanding businesses; and for cultural and leisurespace, such as theaters, galleries, and arenas.
OECD commercial energy use expands by 0.9 percentper year in the IEO2010 Reference case. Slow expansionof GDP and low or declining population growth inmany OECD nations contribute to slower anticipatedrates of increase in commercial energy demand. In addi-tion, continued efficiency improvements moderate thegrowth of energy demand over time, as energy-usingequipment is replaced with newer, more efficient stock.Conversely, continued economic growth is expected toinclude growth in business activity, with its associatedenergy use, in areas such as retail and wholesale tradeand business, financial services, and leisure services.
In non-OECD nations, economic activity and commerceincrease rapidly over the 2007-2035 projection period,fueling additional demand for energy in the service sec-tors. Population growth also is expected to be morerapid than in OECD countries, portending increases inthe need for education, health care, and social servicesand the energy required to provide them. In addition, asdeveloping nations mature, they are expected to transi-tion to more service-related enterprises, which willincrease demand for energy in the commercial sector.The energy needed to fuel growth in commercial build-ings will be substantial, with total delivered commercialenergy use among non-OECD nations projected to growby 2.7 percent per year from 2007 to 2035.
World carbon dioxide emissionsWorld energy-related carbon dioxide emissions risefrom 29.7 billion metric tons in 2007 to 33.8 billion metrictons in 2020 and 42.4 billion metric tons in 2035—anincrease of 43 percent over the projection period. Withstrong economic growth and continued heavy relianceon fossil fuels expected for most non-OECD economiesunder current policies, much of the projected increase incarbon dioxide emissions occurs among the developingnon-OECD nations. In 2007, non-OECD emissionsexceeded OECD emissions by 17 percent; in 2035, theyare projected to be double OECD emissions (Figure 10).
A significant degree of uncertainty surrounds any long-term projection of energy-related carbon dioxide emis-sions. Major sources of uncertainty include estimates ofenergy consumption in total and by fuel source. TheKaya Identity provides an intuitive approach to theinterpretation of historical trends and future projec-tions of carbon dioxide emissions. It is a mathematicalexpression that is used to describe the relationship
U.S. Energy Information Administration / International Energy Outlook 2010 7

among the factors that influence trends in emissions:carbon intensity of energy (the amount of energy-relatedcarbon dioxide emissions emitted per unit of energyproduced), energy intensity of the economy (energyconsumed per dollar of GDP), output per capita (GDPper person), and population.
Of the four Kaya components, policymakers are mostactively concerned with the energy intensity of the
economy and carbon intensity of energy, which aremore readily affected by the policy levers available tothem for reducing greenhouse gas emissions. In the IEO-2010 Reference case, assuming no new climate policies,worldwide increases in output per capita and relativelymoderate population growth overwhelm projectedimprovements in energy intensity and carbon intensity(Figure 11).
8 U.S. Energy Information Administration / International Energy Outlook 2010
2007 2015 2020 2025 2030 20350
20
40
60OECD Non-OECD World total
Figure 10. World energy-related carbon dioxideemissions, 2007-2035 (billion metric tons)
1990 2000 2007 2015 2025 20350.4
0.6
0.8
1.0
1.2
1.4
1.6
1.8
2.0History Projections
Carbon intensity
Energy intensity
PopulationCO2 emissionsOutput per ca
pita
Figure 11. Impacts of four Kaya factors on worldcarbon dioxide emissions, 1990-2035(index: 2007 = 1.0)

Chapter 1
World Energy Demand and Economic OutlookIn the IEO2010 projections, total world consumption of marketed energy
increases by 49 percent from 2007 to 2035. The largest projected
increase in energy demand is for non-OECD economies.
In the IEO2010 Reference case, world energy consump-tion increases by 49 percent, or 1.4 percent per year, from495 quadrillion Btu in 2007 to 739 quadrillion Btu in 2035(Figure 12 and Table 1). The global economic recessionthat began in 2008 and continued into 2009 had a pro-found impact on world income (as measured by GDP)and energy use. After expanding at an average annualrate of 4.9 percent from 2003 to 2007, worldwide GDPgrowth slowed to 3.0 percent in 2008 and contracted by1.0 percent in 2009. Similarly, growth in world energyuse slowed to 1.2 percent in 2008 and then declined byan estimated 2.2 percent in 2009.
Global economic recovery from the recession has beenuneven so far. Developing non-OECD Asian economieshave led the global recovery, and many are already outof recession. While there are indications that the reces-sion in the United States has ended, recovery in Europeand Japan has lagged. The IEO2010 Reference caseassumes that, by 2015, most nations of the world willhave resumed their expected rates of long-term growthbefore the recession. World GDP rises by an average of3.2 percent per year from 2007 to 2035 in the Referencecase, with non-OECD economies averaging 4.4 percentper year and OECD economies 2.0 percent per year.
Historically, OECD member countries6 have account-ed for the largest share of current world energy
consumption; however, in 2007—for the first time—energy use among non-OECD nations exceeded thatamong OECD nations (Figure 13). The discrepancybetween OECD and non-OECD energy use grows in thefuture, given the more rapid growth in energy demandexpected for the emerging non-OECD economies.
In 2007, energy use in non-OECD nations was 1.5 per-cent higher than that in OECD nations. In the IEO2010
U.S. Energy Information Administration / International Energy Outlook 2010 9
Table 1. World marketed energy consumption by country grouping, 2007-2035 (quadrillion Btu)
Region 2007 2015 2020 2025 2030 2035
Average annualpercent change,
2007-2035
OECD . . . . . . . . . . . . . . . . . . . . . 245.7 246.0 254.2 263.2 271.4 280.7 0.5North America . . . . . . . . . . . . . . 123.7 124.3 129.4 134.9 140.2 146.3 0.6Europe . . . . . . . . . . . . . . . . . . . . 82.3 82.0 83.0 85.0 86.5 88.2 0.2Asia . . . . . . . . . . . . . . . . . . . . . . 39.7 39.7 41.8 43.3 44.8 46.3 0.5
Non-OECD . . . . . . . . . . . . . . . . . 249.5 297.5 336.3 375.5 415.2 458.0 2.2Europe and Eurasia . . . . . . . . . . 51.5 52.4 54.2 56.2 57.8 60.2 0.6Asia . . . . . . . . . . . . . . . . . . . . . . 127.1 159.3 187.8 217.0 246.9 277.3 2.8Middle East . . . . . . . . . . . . . . . . 25.1 32.9 36.5 39.1 41.8 45.7 2.2Africa . . . . . . . . . . . . . . . . . . . . . 17.8 20.8 22.5 24.6 26.5 29.0 1.8Central and South America . . . . 28.0 32.1 35.5 38.7 42.2 45.7 1.8
Total World . . . . . . . . . . . . . . . . . 495.2 543.5 590.5 638.7 686.5 738.7 1.4
1990
1995
2000
2007
2015
2020
2025
2030
2035
0
200
400
600
800History Projections
355 374406
495543
590639
687739
Figure 12. World marketed energy consumption,1990-2035 (quadrillion Btu)
6For consistency, OECD includes all members of the organization as of March 1, 2010, throughout all the time series included in thisreport. Chile became a member on May 7, 2010, but its membership is not reflected in IEO2010.

Reference case, non-OECD economies consume 32 per-cent more energy than OECD economies in 2020 and 63percent more in 2035. OECD energy use grows slowlyover the projection period, averaging 0.5 percent peryear from 2007 to 2035, as compared with 2.2 percent peryear for the emerging non-OECD economies.
Two nations that were among the least affected by theglobal recession were China and India, and they con-tinue to lead the world’s economic growth and energydemand growth in the Reference case. Since 1990,energy consumption as a share of total world energy usehas increased significantly in both countries, andtogether they accounted for about 10 percent of theworld’s total energy consumption in 1990 and 20 percentin 2007. Strong economic growth in both countries con-tinues over the projection period, with their combinedenergy use more than doubling and accounting for 30percent of total world energy consumption in 2035 in the
Reference case. In contrast, the U.S. share of worldenergy consumption falls from 21 percent in 2007 toabout 16 percent in 2035 (Figure 14).
Energy use in non-OECD Asia (led by China and India)shows the most robust growth of all the non-OECDregions, rising by 118 percent from 2007 to 2035 (Figure15). However, strong growth in energy use also is pro-jected for much of the rest of the non-OECD regions.With fast-paced growth in population and access to richresources, energy demand in the Middle East increasesby 82 percent over the projection period. In Central andSouth America and Africa, energy consumptionincreases by 63 percent. The slowest projected growthamong non-OECD regions is for non-OECD Europe andEurasia, which includes Russia and the other formerSoviet Republics. Growth in energy use for the regiontotals 17 percent from 2007 to 2035, as its populationdeclines and substantial gains in energy efficiency areachieved through the replacement of inefficient Soviet-era capital equipment.
This chapter presents an overview of the IEO2010 out-look for global marketed energy consumption by energysource. It also includes discussions of the major assump-tions that form the basis for the IEO2010 projections,including macroeconomic assumptions for the keyOECD and non-OECD regions. As with any set of pro-jections, there is significant uncertainty associated withthe IEO2010 energy projections. Two sets of sensitivitycases, which vary some of the assumptions behind theprojections, are also examined in this chapter: the HighEconomic Growth and Low Economic Growth cases andthe High Oil Price and Low Oil Price cases. The sensitiv-ity cases are intended to illustrate alternative scenarios.They are not intended to identify any bounds on un-certainty, which can also be affected by policy and
10 U.S. Energy Information Administration / International Energy Outlook 2010
1990 2000 2007 2015 2025 20350
100
200
300
400
500History Projections
OECD
Non-OECD
Figure 13. World marketed energy consumption:OECD and Non-OECD, 1990-2035 (quadrillion Btu)
1990 1995 2000 2007 2015 2020 2025 2030 20350
5
10
15
20
25
30United States China India
History Projections
Figure 14. Shares of world energy consumptionin the United States, China, and India, 1990-2035(percent of world total)
1990 1995 2000 2007 2015 2020 2025 2030 20350
100
200
300
400
500History Projections
Non-OECD AsiaMiddle EastCentral and South AmericaAfricaNon-OECD Europe and Eurasia
Figure 15. Marketed energy use in Non-OECDeconomies by region, 1990-2035(percent of world total)
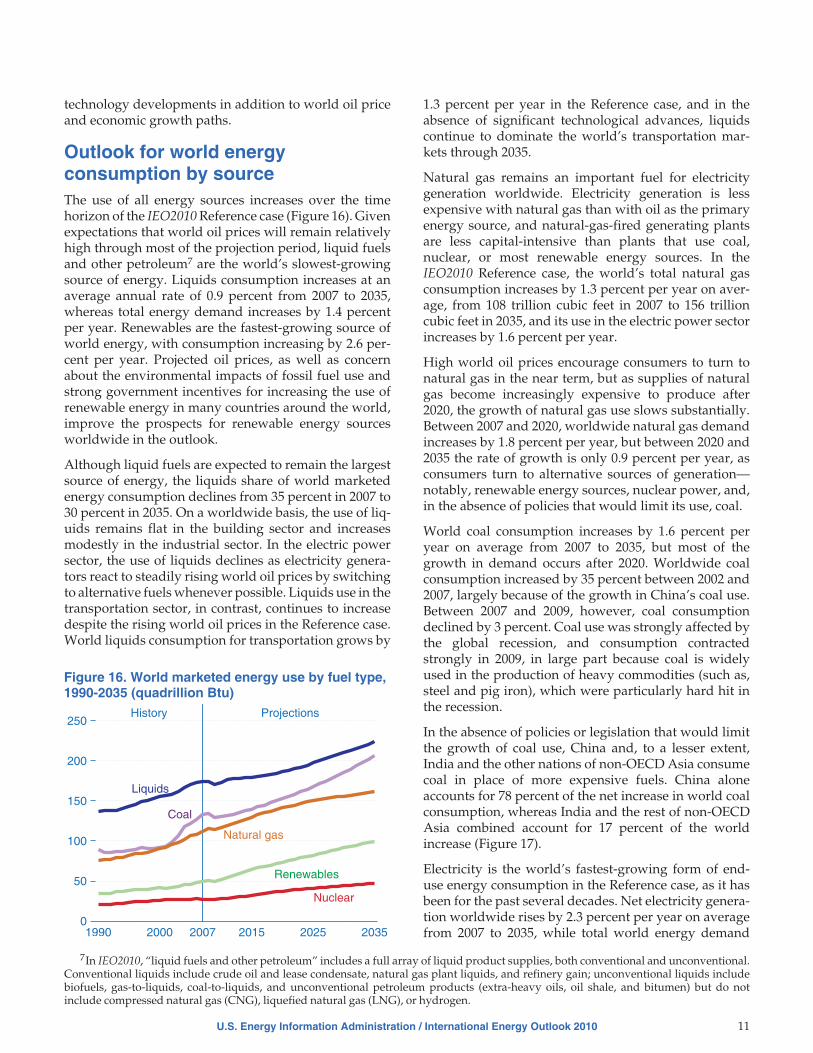
technology developments in addition to world oil priceand economic growth paths.
Outlook for world energyconsumption by sourceThe use of all energy sources increases over the timehorizon of the IEO2010 Reference case (Figure 16). Givenexpectations that world oil prices will remain relativelyhigh through most of the projection period, liquid fuelsand other petroleum7 are the world’s slowest-growingsource of energy. Liquids consumption increases at anaverage annual rate of 0.9 percent from 2007 to 2035,whereas total energy demand increases by 1.4 percentper year. Renewables are the fastest-growing source ofworld energy, with consumption increasing by 2.6 per-cent per year. Projected oil prices, as well as concernabout the environmental impacts of fossil fuel use andstrong government incentives for increasing the use ofrenewable energy in many countries around the world,improve the prospects for renewable energy sourcesworldwide in the outlook.
Although liquid fuels are expected to remain the largestsource of energy, the liquids share of world marketedenergy consumption declines from 35 percent in 2007 to30 percent in 2035. On a worldwide basis, the use of liq-uids remains flat in the building sector and increasesmodestly in the industrial sector. In the electric powersector, the use of liquids declines as electricity genera-tors react to steadily rising world oil prices by switchingto alternative fuels whenever possible. Liquids use in thetransportation sector, in contrast, continues to increasedespite the rising world oil prices in the Reference case.World liquids consumption for transportation grows by
1.3 percent per year in the Reference case, and in theabsence of significant technological advances, liquidscontinue to dominate the world’s transportation mar-kets through 2035.
Natural gas remains an important fuel for electricitygeneration worldwide. Electricity generation is lessexpensive with natural gas than with oil as the primaryenergy source, and natural-gas-fired generating plantsare less capital-intensive than plants that use coal,nuclear, or most renewable energy sources. In theIEO2010 Reference case, the world’s total natural gasconsumption increases by 1.3 percent per year on aver-age, from 108 trillion cubic feet in 2007 to 156 trillioncubic feet in 2035, and its use in the electric power sectorincreases by 1.6 percent per year.
High world oil prices encourage consumers to turn tonatural gas in the near term, but as supplies of naturalgas become increasingly expensive to produce after2020, the growth of natural gas use slows substantially.Between 2007 and 2020, worldwide natural gas demandincreases by 1.8 percent per year, but between 2020 and2035 the rate of growth is only 0.9 percent per year, asconsumers turn to alternative sources of generation—notably, renewable energy sources, nuclear power, and,in the absence of policies that would limit its use, coal.
World coal consumption increases by 1.6 percent peryear on average from 2007 to 2035, but most of thegrowth in demand occurs after 2020. Worldwide coalconsumption increased by 35 percent between 2002 and2007, largely because of the growth in China’s coal use.Between 2007 and 2009, however, coal consumptiondeclined by 3 percent. Coal use was strongly affected bythe global recession, and consumption contractedstrongly in 2009, in large part because coal is widelyused in the production of heavy commodities (such as,steel and pig iron), which were particularly hard hit inthe recession.
In the absence of policies or legislation that would limitthe growth of coal use, China and, to a lesser extent,India and the other nations of non-OECD Asia consumecoal in place of more expensive fuels. China aloneaccounts for 78 percent of the net increase in world coalconsumption, whereas India and the rest of non-OECDAsia combined account for 17 percent of the worldincrease (Figure 17).
Electricity is the world’s fastest-growing form of end-use energy consumption in the Reference case, as it hasbeen for the past several decades. Net electricity genera-tion worldwide rises by 2.3 percent per year on averagefrom 2007 to 2035, while total world energy demand
U.S. Energy Information Administration / International Energy Outlook 2010 11
1990 2000 2007 2015 2025 20350
50
100
150
200
250History Projections
Liquids
Natural gas
Coal
Renewables
Nuclear
Figure 16. World marketed energy use by fuel type,1990-2035 (quadrillion Btu)
7In IEO2010, “liquid fuels and other petroleum” includes a full array of liquid product supplies, both conventional and unconventional.Conventional liquids include crude oil and lease condensate, natural gas plant liquids, and refinery gain; unconventional liquids includebiofuels, gas-to-liquids, coal-to-liquids, and unconventional petroleum products (extra-heavy oils, oil shale, and bitumen) but do notinclude compressed natural gas (CNG), liquefied natural gas (LNG), or hydrogen.

grows by 1.4 percent per year. The strongest growth inelectricity generation is for non-OECD countries.Non-OECD electricity generation increases by an aver-age annual rate of 3.3 percent in the Reference case, asrising standards of living increase demand for homeappliances and the expansion of commercial services,including hospitals, office buildings, and shoppingmalls. In OECD nations, where infrastructures are moremature and population growth is relatively slow,growth in generation is much slower, averaging 1.1 per-cent per year from 2007 to 2035.
Coal provides the largest share of world electricity gen-eration in the Reference case. It accounted for 42 percentof total generation in 2007, and its share is largelyunchanged through 2035 (Figure 18). In contrast,liquids, natural gas, and nuclear power all lose marketshare of world generation over the course of the projec-tion period, displaced by the strong growth projected forrenewable sources of generation. Renewable generationis the world’s fastest-growing source of electric power inthe IEO2010 Reference case, rising at an average annualrate of 3.0 percent over the projection period, as com-pared with increases of 2.3 percent per year for coal, 2.1percent per year for natural gas, and 2.0 percent per yearfor nuclear power. With government policies and incen-tives throughout the world supporting the rapid con-struction of renewable generation facilities, therenewable share of world generation increases from 18percent in 2007 to 23 percent in 2035.
Worldwide, hydroelectricity and wind provide thelargest shares of the projected increase in total renew-able generation, accounting for 54 percent and 26 per-cent of the total increment, respectively. The relative mixof fuels in the OECD and non-OECD regions, however,differs dramatically. In OECD nations, the majority of
economically exploitable hydroelectric resourcesalready have been developed. With the exception ofCanada and Turkey, there are few large-scale hydroelec-tric power projects planned for the future. Instead, mostrenewable energy growth in OECD countries isexpected to come from nonhydroelectric sources, espe-cially wind. Many OECD countries, particularly those inEurope, have government policies (including feed-intariffs,8 tax incentives, and market-share quotas) thatencourage the construction of wind and othernonhydroelectric renewable electricity facilities.
In non-OECD nations, hydroelectric power is the pre-dominant source of renewable energy growth. Strongincreases in hydroelectric generation, primarily frommid- to large-scale power plants, are expected in Braziland in non-OECD Asia (especially, China and India),which in combination account for 83 percent of the totalincrease in non-OECD hydroelectric generation over theprojection period. Growth rates for wind-powered elec-tricity generation also are high in non-OECD countries.The fastest-growing non-OECD regional market forwind power is attributed to China, where total genera-tion from wind power plants increases from 6 billionkilowatthours in 2007 to 374 billion kilowatthours in2035. Still, the total increase in China’s wind-poweredgeneration is less than half the increase in its hydroelec-tric generation (Figure 19).
Electricity generation from nuclear power worldwideincreases from 2.6 trillion kilowatthours in 2007 to 4.5trillion kilowatthours in 2035 in the IEO2010 Referencecase, as high fossil fuel prices and concerns about energysecurity and greenhouse gas emissions support thedevelopment of new nuclear generating capacity. Worldaverage capacity utilization rates have continued to riseover time, from about 65 percent in 1990 to about 80
12 U.S. Energy Information Administration / International Energy Outlook 2010
1990 2000 2007 2015 2025 20350
20
40
60
80
100
120History Projections
China
Other Non-OECD Asia
Rest of world
India
Figure 17. Coal consumption in selected worldregions, 1990-2035 (quadrillion Btu)
2007 2015 2020 2025 2030 20350
10
20
30
40
Liquids
Coal
Natural gas
Renewables
Nuclear
Figure 18. World electricity generation by fuel,2007-2035 (trillion kilowatthours)
8A feed-in tariff is an incentive structure to encourage the adoption of renewable energy through government legislation. Under afeed-in tariff structure, regional or national electric utilities are obligated to purchase renewable electricity at a higher rate than retail, inorder to allow renewable energy sources to overcome price disadvantages.

percent today, with some increases still anticipated inthe future. In addition, most older plants now operatingin OECD countries and in non-OECD Eurasia probablywill be granted extensions to their operating licenses.
There is still considerable uncertainty about the future ofnuclear power, however, and a number of issues couldslow the development of new nuclear power plants.Plant safety, radioactive waste disposal, and nuclearmaterial proliferation concerns, which continue to raisepublic concerns in many countries, may hinder plans fornew installations, and high capital and maintenancecosts may keep some countries from expanding theirnuclear power programs.
Nearly 72 percent of the world expansion in installednuclear power capacity is expected in non-OECD coun-tries (Figure 20). China, India, and Russia account for thelargest increment in world net installed nuclear powerbetween 2007 and 2035. In the Reference case, Chinaadds 66 gigawatts of nuclear capacity between 2007 and2035, India 23 gigawatts, and Russia 25 gigawatts.Within the OECD, every region increases its installednuclear capacity to some extent, except for Australia andNew Zealand, where existing policies that discouragenuclear power are assumed to remain unchangedthrough the end of the projection period.
In a change from past IEOs, OECD Europe sees anincrease in nuclear power capacity over the projectionperiod, as a number of European countries havereassessed their nuclear stance in the past year. The gov-ernments of several countries have announced changesin their positions since 2009, including the Belgian gov-ernment, which decided to delay its phaseout plans by10 years; the German government, which has expressedwillingness to reconsider its nuclear phaseout policies;
and the Italian government, which has formally endedits anti-nuclear policies and announced plans for con-structing a new reactor by 2020 [1]. There are also indica-tions that several other European countries, includingPoland and Turkey, plan to begin new nuclear genera-tion programs. In this year’s IEO, OECD Europe adds anet 10 gigawatts of installed nuclear capacity between2006 and 2030, as compared with a net loss of 11gigawatts of nuclear capacity projected in IEO2009.
In the United States, Title XVII of the Energy Policy Actof 2005 (EPACT2005, Public Law 109-58) authorizes theU.S. Department of Energy to issue loan guarantees forinnovative technologies that “avoid, reduce, or seques-ter greenhouse gases.” In addition, subsequent legisla-tive provisions in the Consolidated Appropriation Actof 2008 (Public Law 110-161) allocated $18.5 billion inguarantees for nuclear power plants [2]. That legislation,along with high fossil fuel prices, results in increases of8.4 gigawatts of capacity at newly built U.S. nuclearpower plants between 2007 and 2035 and 4.0 gigawattsfrom expansion projects at existing plants. All existingU.S. nuclear units continue to operate through 2035 inthe Reference case, which assumes that the owners willapply for and receive operating license renewals includ-ing, in some cases, a second extension after they reach60 years of operation.
Delivered energy consumptionby end-use sectorUnderstanding patterns in the consumption of energydelivered to end users9 is important to the developmentof projections for global energy use. Outside the trans-portation sector, which at present is dominated by liquidfuels, the mix of energy use in the residential, commer-cial, and industrial sectors varies widely by region,
U.S. Energy Information Administration / International Energy Outlook 2010 13
2007 2015 2020 2025 2030 20350
500
1,000
1,500
2,000
Hydroelectricity
Wind
Solar
Other
Figure 19. Renewable electricity generationin China by energy source, 2007-2035 (billionkilowatthours)
131
115
67
9
23
4
30
144
136
94
75
48
27
68
OECD Europe
North America
OECD Asia
China
Russia
India
Rest of world
0 25 50 75 100 125 150
2007
2035
131
115
67
9
23
4
30
144
136
94
75
48
27
68
Figure 20. World nuclear generating capacityby region, 2007 and 2035 (gigawatts)
9Delivered energy consumption in the end-use sectors consists of primary energy consumption and electricity retail sales excluding elec-trical system energy losses.

depending on a combination of regional factors, such asthe availability of energy resources, levels of economicdevelopment, and political, social, and demographicfactors.
Residential sector
Energy use in the residential sector, which accounted forabout 14 percent of world delivered energy consump-tion in 2007, is defined as the energy consumed byhouseholds, excluding transportation uses. Residentialenergy use grows at an average rate of 1.1 percent peryear from 2007 to 2035. The type and amount of energyused by households vary from country to country,depending on income levels, natural resources, climate,and available energy infrastructure. In general, typicalhouseholds in OECD nations use more energy thanthose in non-OECD nations, in part because higherincome levels allow OECD households to have largerhomes and purchase more energy-using equipment. Inthe United States, for example, GDP per capita in 2007was $43,076 (in real 2005 dollars per person), and resi-dential energy use per capita was estimated at 37.2 mil-lion Btu. In contrast, China’s per-capita income in 2007,at $5,162, was only about one-eighth the U.S. level, andits residential energy use per capita, at 4.0 million Btu,was about one-ninth the U.S. level.
For residential buildings, the physical size of a structureis one key indicator of the amount of energy used by itsoccupants, although income level and a number of otherfactors, such as weather, can also affect the amount ofenergy consumed per household. Controlling for thosefactors, larger homes generally require more energy toprovide heating, air conditioning, and lighting, and theytend to include more energy-using appliances, such astelevisions and laundry equipment. Smaller structuresusually require less energy, because they contain lessspace to be heated or cooled, produce less heat transferwith the outdoor environment, and typically have feweroccupants. For instance, residential energy consumptionis lower in China, where the average residence currentlyhas an estimated 300 square feet of living space or lessper person, than in the United States, where the averageresidence has an estimated 680 square feet of livingspace per person [3].
Although the IEO2010 projections account for marketedenergy use only, households in many non-OECD coun-tries still rely heavily on traditional, non-marketedenergy sources, including wood and waste, for heatingand cooking. Much of Africa remains unconnected topower grids, and the International Energy Agency esti-mates that more than 70 percent of the sub-Saharan Afri-can population does not have access to electricity [4].About 37 percent of the world population—largely inIndia and Africa—still relies on animal dung, fuelwood,and agricultural residues for cooking fuel. Some areas of
China and India also rely heavily on fuelwood, woodwaste, and charcoal for cooking. As incomes rise in thedeveloping world over the course of the projection,households replace the use of traditional fuels with mar-keted ones, such as propane and electricity, as theybecome more widely accessible.
Commercial sector
The commercial sector—often referred to as the servicesector or the services and institutional sector—consistsof businesses, institutions, and organizations that pro-vide services. The sector, which accounted for 7 percentof total delivered energy consumption in 2007, encom-passes many different types of buildings and a widerange of activities and energy-related services. Commer-cial sector energy use grows by an average of 1.5 percentper year from 2007 to 2035. Examples of commercial-sector facilities include schools, stores, correctional insti-tutions, restaurants, hotels, hospitals, museums, officebuildings, banks, and sports arenas. Most commercialenergy use occurs in buildings or structures, supplyingservices such as space heating, water heating, lighting,cooking, and cooling. Energy consumed for services notassociated with buildings, such as for traffic lights andcity water and sewer services, is also categorized as com-mercial energy use.
Economic trends and population growth drive commer-cial-sector activity and the resulting energy use. Theneed for services (health, education, financial, and gov-ernment) increases as populations increase. The degreeto which additional needs are met depends in large mea-sure on economic resources—whether from domestic orforeign sources—and economic growth.
Economic growth also determines the degree to whichadditional activities are offered and used in the commer-cial sector. Higher levels of economic activity and dis-posable income lead to increased demand for hotels andrestaurants to meet business and leisure requirements;for office and retail space to house and service new andexpanding businesses; and for cultural and leisure spacesuch as theaters, galleries, and arenas. In the commercialsector, energy intensity—or energy use per dollar ofincome as measured by GDP—in non-OECD countriesis much lower than in OECD countries. Non-OECDcommercial energy intensity in 2007, at 281 Btu per dol-lar of GDP, was only about half the OECD level (522 Btuper dollar of GDP).
In the future, slower expansion of GDP and low ordeclining population growth in many OECD nationscontribute to slower anticipated rates of increase in com-mercial energy demand. In addition, continued effi-ciency improvements moderate the growth of energydemand over time, as energy-using equipment isreplaced with newer, more efficient stock. Conversely,continued economic growth is expected to include
14 U.S. Energy Information Administration / International Energy Outlook 2010

growth in business activity, with its associated energyuse, in areas such as retail and wholesale trade and busi-ness, financial services, and leisure services. The UnitedStates is the largest consumer of commercial deliveredenergy in the OECD and remains in that positionthroughout the projection, accounting for about 45 per-cent of the OECD total in 2035.
In non-OECD nations, economic activity and commerceincrease rapidly, fueling additional demand for energyin the service sectors. Population growth also is morerapid than in OECD countries, portending increases inthe need for education, health care, and social servicesand the energy required to provide them. In addition, asdeveloping nations mature, they transition to more ser-vice-related enterprises, increasing demand for energyin the commercial sector. The energy needed to fuelgrowth in commercial buildings will be substantial, withtotal delivered commercial energy use among non-OECD nations growing by 2.7 percent per year from2007 to 2035.
Industrial sector
Energy is consumed in the industrial sector by a diversegroup of industries—including manufacturing, agricul-ture, mining, and construction—and for a wide range ofactivities, such as processing and assembly, space condi-tioning, and lighting. The industrial sector comprised 51percent of global delivered energy use in 2007 andgrows by an average annual 1.3 percent over the projec-tion. Industrial energy demand varies across regionsand countries of the world, based on the level and mix ofeconomic activity and technological development,among other factors. Industrial energy use also includesnatural gas and petroleum products used as feedstocksto produce non-energy products, such as plastics andfertilizer. In aggregate, the industrial sector uses moreenergy than any other end-use sector, consuming aboutone-half of the world’s total delivered energy.
OECD economies generally have more energy-efficientindustrial operations and a mix of industrial output thatis more heavily weighted toward non-energy-intensivesectors than the mix in non-OECD countries. As a result,the ratio of industrial energy consumption to total GDPtends to be higher in non-OECD economies than inOECD economies. On average, industrial energy inten-sity (the consumption of energy consumed in the indus-trial sector per dollar of economic output) in non-OECDcountries is double that in OECD countries.
Transportation sector
Energy use in the transportation sector includes theenergy consumed in moving people and goods by road,rail, air, water, and pipeline. The transportation sectoraccounted for 27 percent of total world delivered energyconsumption in 2007, and transportation energy use
increases by 1.3 percent per year from 2007 to 2035. Theroad transport component includes light-duty vehicles,such as automobiles, sport utility vehicles, minivans,small trucks, and motorbikes, as well as heavy-dutyvehicles, such as large trucks used for moving freightand buses used for passenger travel. Growth rates foreconomic activity and population are the key factors fortransportation energy demand. Economic growth spursincreases in industrial output, which requires the move-ment of raw materials to manufacturing sites, as well asthe movement of manufactured goods to end users.
For both non-OECD and OECD economies, steadilyincreasing demand for personal travel is a primary fac-tor underlying projected increases in energy demand fortransportation. Increases in urbanization and in per-sonal incomes have contributed to increases in air traveland motorization (more vehicles per capita) in the grow-ing economies. Increases in the transport of goods resultfrom continued economic growth in both OECD andnon-OECD economies. For freight transportation, truck-ing leads the growth in demand for transportation fuels.In addition, as trade among countries increases, the vol-ume of freight transported by air and marine vesselsincreases rapidly.
World economic outlookEconomic growth is among the most important factorsto be considered in projecting changes in world energyconsumption. In IEO2010, assumptions about regionaleconomic growth—measured in terms of real GDP in2005 U.S. dollars at purchasing power parity rates—underlie the projections of regional energy demand.Starting in 2008, the world experienced its worst reces-sion of the past 60 years [5]. Although it appears thatrecovery has begun, its strength and timing are notentirely clear. The emerging economies of Asia (led byChina and India) appear to be recovering quickly. Theadvanced economies, particularly the European coun-tries and Japan, are improving much more slowly andhave had concerns about a return to recession in theshort term [6].
Substantial stimulus packages in the United States andChina, as well as in a number of other countries aroundthe world, are widely credited with averting anotherGreat Depression [7]. China’s $586 billion stimuluspackage has been used largely to fund infrastructureprojects (including railways, roads, airports, urbanpower grids, and irrigation projects) and also for socialprograms, both domestically and abroad [8]. Manynon-OECD Asian economies that are trading partnerswith China also have benefited from their ties withChina. The emerging Asian economies—particularlythose strongly dependent on exports for revenues—sawprofound decreases in economic activity in 2008 and into
U.S. Energy Information Administration / International Energy Outlook 2010 15

2009, as demand for goods among OECD economiesdeclined sharply. The recovery in China has bolsteredtheir recovery.
From 2007 to 2035, growth in world real GDP (on a pur-chasing power parity basis) averages 3.2 percent peryear in the Reference case (Table 2). In the long term, theability to produce goods and services (the supply side)determines the growth potential of each country’s econ-omy. Growth potential is influenced by populationgrowth, labor force participation rates, capital accumu-lation, and productivity improvements. In addition, forthe developing economies, progress in building humanand physical capital infrastructures, establishing credi-ble regulatory mechanisms to govern markets, andensuring political stability also are important determi-nants of medium- to long-term growth potential.
Annual growth in world GDP over the 28-year projec-tion period in IEO2010 (3.23 percent per year) is aboutthe same as the rate recorded over the past 30 years (3.25percent per year). Growth in the more mature industrial-ized economies of the OECD is expected to be slower,and growth in the emerging non-OECD economies isprojected to be higher, than in the past. The combinedGDP of OECD countries, which increased by an annualaverage of 2.9 percent from 1977 to 2007, averages 2.0percent per year from 2007 to 2035. In contrast, the com-bined GDP of non-OECD countries, which increased byan annual average of 3.7 percent from 1977 to 2007, aver-ages 4.4 percent per year growth from 2007 to 2035,based in a large part on the strong growth projected forChina and India. With non-OECD economies account-ing for an increasing share of world GDP, their more
rapid economic growth rates offset the slower growthrates for OECD economies in the Reference case (Figure21).
OECD economies
In the IEO2010 Reference case, overall OECD economicgrowth averages 2.0 percent per year and U.S. GDPgrowth averages 2.4 percent per year from 2007 to 2035.The U.S. recession, which began in December 2007, is thelongest of the 10 recessions the United States has experi-enced since 1947, with four quarters of negative growth.It was also the country’s deepest recession since 1957.10
In 2009, U.S. GDP declined by 2.4 percent, and in 2010 itis expected to increase at a considerably slower rate than
16 U.S. Energy Information Administration / International Energy Outlook 2010
Table 2. World gross domestic product by country grouping, 2007-2035 (billion 2005 dollars, purchasingpower parity)
Region 2007 2015 2020 2025 2030 2035
Average annualpercent change,
2007-2035
OECD . . . . . . . . . . . . . . . . . . . . . 36,361 40,819 46,146 51,492 57,260 63,480 2.0North America . . . . . . . . . . . . . . 15,662 18,081 21,023 24,072 27,445 31,142 2.5Europe . . . . . . . . . . . . . . . . . . . . 14,849 16,208 18,035 19,864 21,771 23,807 1.7Asia . . . . . . . . . . . . . . . . . . . . . . 5,850 6,530 7,089 7,557 8,044 8,531 1.4
Non-OECD . . . . . . . . . . . . . . . . . 26,769 40,301 51,286 63,247 76,179 90,179 4.4Europe and Eurasia . . . . . . . . . . 3,481 4,193 4,940 5,731 6,557 7,440 2.7Asia . . . . . . . . . . . . . . . . . . . . . . 14,323 24,055 31,832 40,307 49,366 59,023 5.2Middle East . . . . . . . . . . . . . . . . 2,261 3,071 3,742 4,473 5,336 6,328 3.7Africa . . . . . . . . . . . . . . . . . . . . . 2,638 3,639 4,406 5,221 6,102 7,094 3.6Central and South America . . . . 4,066 5,343 6,366 7,516 8,818 10,294 3.4
Total World . . . . . . . . . . . . . . . . . 63,130 81,120 97,433 114,740 133,439 153,658 3.2
Source: IHS Global Insight and EIA.
1990 2000 2007 2015 2025 20350
20
40
60
80
100History Projections
OECD
Non-OECD
Figure 21. OECD and Non-OECD totalgross domestic product, 1990-2035(trillion 2005 U.S. dollars)
10 The National Bureau of Economic Research defines a recession as “a significant decline in economic activity spread across the econ-omy, lasting more than a few months, normally visible in real GDP, real income, employment, industrial production, and wholesale-retailsales.” However, the shorthand version of a recession is often given as two consecutive quarters of negative growth in GDP. In December2008, the National Bureau of Economic Research declared that the United States had entered a recession in December 2007.

the annual average of 2.9 percent over the past twodecades [9]. The U.S. economic recovery is expected tointensify in 2011, with employment recovering moreslowly. As a result, real GDP returns to its 2007 pre-recessionary level by 2011, but employment rates do notreturn to 2007 levels until 2019.
Canada was also affected substantially by the worldrecession, with GDP contracting by 2.3 percent in 2009.The strong trade ties between Canada and the UnitedStates mean that weak U.S. economic growth, coupledwith a relatively strong (by historical standards) Cana-dian dollar, helped lead Canada into economic recession[10]. Like many countries in the industrialized world,Canada instituted a substantial 2-year stimulus spend-ing program in early 2009—about $30 billion or 1.9 per-cent of GDP—for infrastructure improvements, incometax reductions, and housing construction incentives,among other programs [11].
The Canadian economy showed signs of recovery at theend of 2009, with 5.0-percent GDP growth in the fourthquarter. In 2010, the government announced plans tophase out stimulus spending by March 2011 and,through budget austerity measures, to cut Canada’s $54billion deficit in half within 2 years [12]. In the long term,as U.S. consumer demand returns and export marketsimprove, economic growth in Canada returns to itspotential. In the IEO2010 Reference case, Canada’s GDPgrows by an average of 2.1 percent per year from 2007 to2035.
Mexico was the Western Hemisphere’s hardest-hit econ-omy in the 2008-2009 recession [13]. Not only did it suf-fer when worldwide commodity exports collapsed, butthe impact of the recession was compounded by theoutbreak of H1N1 “swine flu” in 2009. Mexico’s highreliance on the United States as a market for its manufac-turing exports suggests that its economic recovery willbe dependent on the U.S. recovery. About 80 percent ofMexico’s exports are sent to the United States. Risingworld oil prices and recovery of the U.S. economy areexpected to support Mexico’s return to trend growth,with GDP increasing by an average of 3.5 percent peryear from 2007 to 2035.
In 2009, GDP in the economies of OECD Europe con-tracted by 3.9 percent—much more sharply than the0.2-percent decline anticipated in last year’s IEO. In2010, economic growth in OECD Europe is expected toaverage only 1.0 percent. Several economies in theregion, notably those of Greece, Spain, Portugal, and Ire-land, are currently carrying very high debt levels [14]. InGreece, for instance, the high current account deficit,which surpassed 12 percent of total GDP and triggered adebt crisis, led the country nearly to default. However, arescue package assembled jointly by the EuropeanUnion, the International Monetary Fund, and the
European Central Bank was implemented in May 2010to prevent default and stop the crisis from spreading toother economies of the European Union [15]. Greeceaccounts for less than 3 percent of the European Union’stotal GDP, but signs of structural problems in the econo-mies of Spain, Portugal, Ireland, and to a lesser extentItaly may weigh heavily on the economic recovery ofOECD Europe as a whole [16]. In the IEO2010 Referencecase, total GDP in OECD Europe does not recover to its2007 level until 2012. Economic growth in the regionaverages 1.7 percent per year from 2007 to 2035, belowthe increase of 2.0 percent per year for the OECD as awhole.
Japan was among the OECD economies hardest hit bythe global economic downturn. Beginning in the secondquarter of 2008, its GDP declined in four consecutivequarters. The International Monetary Fund estimatesthat, on an annualized basis, Japan’s GDP contracted bymore than 10 percent per year in the fourth quarter of2008 and the first quarter of 2009 [17]. Although the Jap-anese banking sector was relatively insulated from theglobal financial crisis that began in 2007 and worsenedin 2008, demand for Japanese goods declined precipi-tously as some of Japan’s largest customers fell intorecession [18]. In the past, Japan has relied on exports togenerate about one-third of its GDP growth, and thedecrease in exports strongly affected its economy.
Although improving exports and government incentiveprograms (which have stimulated domestic consumerdemand) should allow Japan’s GDP growth rate toimprove in 2010, the pace of recovery is likely to be tiedto those of its major customers in the United States andOECD Europe [19]. In the long term, Japan’s aging laborforce and declining population are likely to result in sub-stantially slower economic growth over the projectionperiod, averaging 1.4 percent per year from 2009 to 2020and 0.3 percent per year from 2020 to 2035.
More robust economic growth occurs in the rest ofOECD Asia. In South Korea, GDP growth averages 2.9percent per year from 2007 to 2035. The global recessionled to profound declines in Korea’s exports and domes-tic demand in 2008 and into 2009 [20]. In response to thedeepening economic crisis, the Bank of Korea cut itsinterest rate six times between October 2008 and Febru-ary 2009, to 2.0 percent, where it remained into 2010 [21].In addition, the South Korean government introducedstimulus packages worth about $44 billion (50 trillionwon) into the economy to stimulate domestic demand.South Korea’s economy began to recover in the secondhalf of 2009, recording double-digit growth rates in thesecond and third quarters, as exports to China increasedsharply and the effects of the stimulus funds were felt[22]. A return to world demand for Korean goods willsupport the South Korean economic recovery in the near
U.S. Energy Information Administration / International Energy Outlook 2010 17

term. In the long term, however, its growth tapers off asthe growth of its labor force slows.
GDP growth in Australia/New Zealand averages 2.6percent per year from 2007 to 2035 in the IEO2010 Refer-ence case. To address GDP growth that slowed mark-edly in Australia and declined in New Zealand as aresult of the global recession, the Reserve Bank of Aus-tralia and the Reserve Bank of New Zealand eased mon-etary policies substantially in 2008-2009, helping tocushion the impact of the global economic downturn[23]. Australia’s recovery is already well underway,with GDP growth expected to return to pre-crisis trendlevels of about 3.0 percent per year in 2010. In fact, Aus-tralia was the first “Group of 20” nation to begin tighten-ing monetary policy and increasing interest rates inOctober 2009. Interest rates have increased periodicallysince that time, reaching 4.0 percent in 2010. In compari-son with Australia, New Zealand’s economic recoveryhas been tepid, and interest rates remained at record lowlevels of 2.5 percent through the first quarter of 2010with assurances that monetary policy would begin to betightened by mid-year [24]. Long-term prospects in bothcountries are relatively healthy, given their consistenttrack records of fiscal prudence and structural reformsaimed at maintaining competitive product markets andflexible labor markets.
Non-OECD economies
Overall non-OECD economic growth averages 4.4 per-cent per year in the IEO2010 Reference case from 2007 to2035. Economic growth in non-OECD Europe and Eur-asia as a whole averages 2.7 percent per year. After sev-eral years of strong regional economic growth (theregion’s GDP grew by an average of 6.7 percent per yearfrom 2000 to 2008), GDP in non-OECD Europe and Eur-asia contracted by 7.3 percent in 2009. The region has afairly diverse set of economies, and while some suffereddeep recessions in 2008-2009, others saw economicgrowth slow but remain positive.
Those nations reliant on commodity exports tended tofare worse than their neighbors in the recent recession.For example, in Russia—the region’s largest economy—GDP declined by 8.0 percent in 2009; Ukraine’s GDPdeclined by 15.0 percent; and Kazakhstan’s GDPdeclined by a more modest 1.1 percent. In contrast to thesharp economic declines among the energy-exportingnations of non-OECD Europe and Eurasia, other smallerregional economies with strong domestic demand wereaffected only slightly by the global economic downturn.For instance, both Albania and Uzbekistan recordedGDP growth of more than 4 percent in 2009.
Beginning in late 2007, it became more difficult for banksand other entities in non-OECD Europe and Eurasia—particularly, Russia, Kazakhstan, and Ukraine—to gain
access to foreign loans [25]. The impact was softenedsomewhat by higher world market prices for commod-ity exports, but with the subsequent collapse of com-modity prices and worsening global economic situation,the region’s economic growth declined sharply. In themid- to long term, a return to high world oil prices stim-ulates investment outlays, especially in the energy sec-tor of the Caspian region. Given the volatility of energymarket prices, however, it is unlikely that the economiesof non-OECD Europe and Eurasia will be able to sustaintheir recent growth rates until they have achieved morebroad-based diversification from energy productionand exports.
Much of the growth in world economic activity between2007 and 2035 occurs among the nations of non-OECDAsia, where regional GDP growth averages 5.2 percentper year. China, non-OECD Asia’s largest economy,continues playing a major role in both the supply anddemand sides of the global economy. IEO2010 projectsan average annual growth rate of approximately 5.8 per-cent for China’s economy from 2007 to 2035—the high-est among all the world’s economies.
Non-OECD Asia is leading the recovery from the2008-2009 global economic recession. The substantialChinese stimulus, considerable loosening of lendingterms, and tax breaks for new cars and appliances havetranslated to a 17-percent increase in retail sales (thelargest increase in more than 20 years) and an 18-percentincrease in industrial production [26]. It now appearsthat China posted a 9-percent increase in GDP in 2009,and that it is on its way to returning to double-digitgrowth in 2010. One caveat is that the government isattempting to remove stimulus spending and tightenlending terms in order to eliminate incentives foroverinvestment and to control price inflation in the shortterm [27]. Many non-OECD Asian economies that aretrade partners with China have also benefited from theirties with China. Although these emerging Asian econo-mies—particularly those strongly dependent on exportsfor revenues—experienced profound decreases in eco-nomic activity in 2008 and into 2009 as demand forgoods among OECD economies sharply declined, therecovery in China has bolstered their recovery.
Structural issues that have implications for economicgrowth in China in the mid- to long term include thepace of reform affecting inefficient state-owned compa-nies and a banking system that is carrying a significantamount of nonperforming loans. Development ofdomestic capital markets continues in the IEO2010 Ref-erence case, providing macroeconomic stability andensuring that China’s large domestic savings are usedmore efficiently.
India’s economy is not as dependent on export revenuesas are the economies of China and some of the other
18 U.S. Energy Information Administration / International Energy Outlook 2010

non-OECD Asian countries. About 75 percent of India’spopulation still depends on farming for income [28]. Asa result, India was affected far less by the global eco-nomic downturn than were many other nations of theworld. India’s GDP grew by about 6.0 percent in 2008and 2009 and is expected to grow by 7.5 percent in 2010.Its GDP growth is expected to return to pre-recessiontrends over the next year or so, with positive prospectsfor the economy in the mid-term, as it continues to pri-vatize state enterprises and increasingly adopts freemarket policies. Accelerating structural reforms—including ending regulatory impediments to the consol-idation of labor-intensive industries, labor market andbankruptcy reforms, and agricultural and trade liberal-ization—remain essential for stimulating potentialgrowth and reducing poverty in India over the mid- tolong term. In the IEO2010 Reference case, GDP growthin India averages 5.0 percent per year from 2007 to 2035.
Outside China and India, recovery from the globalrecession in the countries of non-OECD Asia is likely tovary. Those economies that are export-dependent(including Hong Kong, Indonesia, Singapore, and Tai-wan) weakened substantially in 2009, as demand in theUnited States, Europe, and Asia declined and industrialproduction contracted by about 25 percent [29]. For theexport-dependent nations, China’s strong economicrebound is likely to support recovery in the near term.For nations where domestic demand remains healthy(including Vietnam and the Philippines), the impact ofthe global recession was less severe, although theirgrowth did slow in 2009 [30]. Overall, long-term eco-nomic activity in the nations of non-OECD Asia remainsrobust. From 2007 to 2035, national economic growthrates for the region—excluding China and India—aver-age 4.3 percent per year, as labor force growth ratesdecline and economies mature.
From 2003 to 2008, rising oil production and priceshelped boost economic growth in the oil-exportingcountries of the Middle East, many of which also bene-fited from spillover effects on trade, tourism, and finan-cial flows from the region’s oil exports [31]. The sharpdecline in world oil prices at the end of 2008 and into2009, combined with OPEC-imposed production cuts,declining demand for other exports, and reduced capitalinflows, slowed economic growth to its lowest rate since1994. Stimulus funding from Saudi Arabia, the UnitedArab Emirates, and other countries in the region helpedto keep GDP from falling lower. With strengthening oilprices and rebounding demand for the region’s exportcommodities, prospects for economic growth remainfavorable. The Middle East’s reliance on oil and naturalgas revenues continues for much of the projectionperiod.
The impact of the global recession on the economies ofAfrica varied across the continent. In the countries of
Southern Africa, GDP declined by 1.9 percent in 2009.South Africa—the region’s largest economy—experi-enced its first recession since 1992, and the impactspread to neighboring countries [32]. Western Africa’seconomic growth slowed but remained positive, asNigeria—the second largest economy in sub-SaharanAfrica after South Africa—saw increases in agriculturaloutput that offset declines in industrial output and oilproduction. Northern African nations benefited fromstrong domestic demand and high agricultural outputfrom Algeria and Morocco. Eastern African nationsexperienced robust economic growth in 2009, largelybecause of strong economic performance in Ethiopiaand the member countries of the East African Commu-nity (Kenya, Uganda, Rwanda, Burundi, and Tanzania).
In the IEO2010 Reference case, Africa’s combined econ-omy grows at an average annual rate of 3.6 percent from2007 to 2035, supported by the expansion of exports androbust domestic demand in many of the continent’snational economies. Nevertheless, both economic andpolitical factors—such as low savings and investmentrates, lack of strong economic and political institutions,limited quantity and quality of infrastructure andhuman capital, negative perceptions on the part of inter-national investors, protracted civil unrest and politicaldisturbances, and the impact of disease—present formi-dable obstacles to growth in a number of Africancountries.
As in Africa, the impact of the global economic down-turn on the nations of Central and South America variedacross the region. Brazil—the region’s largest econ-omy—is already well along the path of recovery afterexperiencing a relatively short and mild recession in2009. Its recovery is supported by domestic and foreigninvestment, along with strengthening domestic con-sumption [33]. Other countries—including Argentina,Bolivia, Ecuador, and Venezuela—are expected torecover much more slowly.
Investment in the countries of Central and South Amer-ica is constrained by adverse economic circumstances,and revenues from commodities exports are notexpected to provide the level of government revenuethat they had from 2003 to 2008. The proximity of theregion to the United States and the trade relationships ofits national economies with the U.S. economy suggestthat the region’s recovery will be linked, in part, to thepace of the U.S. recovery. Even so, the long-term pros-pects for Central and South America remain positive.Most countries in the region have flexible exchangerates, positive trade balances, and relatively low fiscaldeficits and public debts. Regional inflation is lowerthan it was in the mid-1990s, and a relatively younglabor force supports the region’s economic growth pros-pects over the next 30 years. Economic growth in Centraland South America averages 3.4 percent per year from
U.S. Energy Information Administration / International Energy Outlook 2010 19

2007 to 2035 in the Reference case, as the region benefitsfrom the expected recovery in world economic growthafter 2010, and foreign capital flows are revived.
Sensitivity analyses in IEO2010
Alternative Economic Growth cases
Expectations for the future rates of economic growth area major source of uncertainty in the IEO2010 projections.To illustrate the uncertainties associated with economicgrowth trends, IEO2010 includes a High EconomicGrowth case and a Low Economic Growth case in addi-tion to the Reference case. The two alternative growthcases use different assumptions about future economicgrowth paths, while maintaining the same relationshipsbetween changes in GDP and changes in energy con-sumption that are used in the Reference case. The alter-native growth cases maintain the oil price path of theIEO2010 Reference case.
In the High Economic Growth case, 0.5 percentage pointis added to the annual growth rate assumed for eachcountry or country grouping in the Reference case. In theLow Economic Growth case, 0.5 percentage point is sub-tracted from the Reference case annual growth rates.The IEO2010 Reference case shows total world energyconsumption reaching 739 quadrillion Btu in 2035—281quadrillion Btu in OECD countries and 458 quadrillionBtu in non-OECD countries. In the High Growth case,world energy use in 2035 totals 810 quadrillion Btu—71quadrillion Btu (about 35 million barrels oil equivalentper day) higher than in the Reference case. In the LowGrowth case, total world energy use in 2035 is 60 qua-drillion Btu (30 million barrels oil equivalent per day)lower than in the Reference case. Thus, the projectionsfor 2035 in the High and Low Economic Growth casesspan a range of uncertainty equal to 134 quadrillion Btu(Figure 22).
Alternative Oil Price cases
Assumptions about world oil prices are another impor-tant factor that underscores the considerable uncertaintyin long-term energy market projections. The effects ofdifferent assumptions about future oil prices are illus-trated in IEO2010 by two alternative oil price cases. Inthe High Oil Price case, world oil prices (in real 2008 dol-lars) climb from $59 per barrel in 2009 to $210 per barrelin 2035; in the Low Oil Price case, they decline to $52 perbarrel in 2015 and remain approximately at that reallevel through 2035. In comparison, world oil prices riseto $133 per barrel in 2035 in the Reference case (Figure23). These three oil price cases are the same as those usedin EIA’s Annual Energy Outlook 2010.
Although the difference in world oil prices between theHigh and Low Oil Price cases is considerable, the projec-tions for total world energy consumption in 2035 do notvary substantially among the cases. The projections fortotal world energy use in 2035 in the High and Low OilPrice cases are separated by 33 quadrillion Btu (Figure24), as compared with the difference of 134 quadrillionBtu between the High and Low Economic Growth cases.
The most substantial impacts of the high and low oilprice assumptions are on the mix of energy fuels con-sumed in each region—particularly, fossil fuels (Figure25). In the High Oil Price case, total world liquids con-sumption in 2030 is about 31 quadrillion Btu lower(about 15 million barrels per day oil equivalent), coalconsumption in 2035 is 7 quadrillion Btu higher, naturalgas consumption is 5 quadrillion Btu higher, and renew-able energy use is 2 quadrillion Btu higher than pro-jected in the Reference case. The difference in nuclearpower consumption between the two cases is small.
In the IEO2010 Reference case, world oil prices begin torise after 2009 and reach $133 per barrel by 2035. As aresult, liquids consumption is curtailed in countries that
20 U.S. Energy Information Administration / International Energy Outlook 2010
1990 2000 2007 2015 2025 20350
200
400
600
800History Projections
LowEconomic
GrowthReference
HighEconomic
Growth
Figure 22. World marketed energy consumptionin three Economic Growth cases, 1990-2035(quadrillion Btu)
1990 2000 2009 2015 2025 20350
50
100
150
200
250History Projections
HighOil Price
Reference
LowOil Price
$210
$51
$133
Figure 23. World oil prices in three Oil Price cases,1990-2035 (2007 dollars per barrel)

have other fuel options available—especially in the elec-tric power sector, where coal and other fuels can be sub-stituted. Worldwide use of liquids for electricitygeneration, which falls by 1.5 quadrillion Btu from 2007to 2035 in the Reference case, increases by 1.7 quadrillionBtu in the Low Oil Price case, as non-OECD countriesretain their oil-fired generating capacity in the lowerprice environment.
In the Low Oil Price case, consumers increase their useof liquids for transportation, and there is less incentivefor movement away from liquids to other energysources in sectors where fuel substitution is fairly easy toachieve (for example, electricity). Total liquids con-sumption in 2035 is 25 quadrillion Btu (12 million barrelsper day) higher in the Low Oil Price case than in the Ref-erence case, reflecting increased demand in all theend-use sectors. In the Low Oil Price case, the industrialsector shows the largest increase in liquids consumption
(14 quadrillion Btu or 7 million barrels per day) in 2035relative to the Reference case (Figure 26), followed bythe transportation sector (7 quadrillion Btu or 3 millionbarrels per day) and the electric power sector (3 quadril-lion Btu or 2 million barrels per day).
References
U.S. Energy Information Administration / International Energy Outlook 2010 21
2007 2015 2020 2025 2030 20350
200
400
600
800High Oil Price Reference Low Oil Price
Figure 24. World marketed energy consumptionin three Oil Price cases, 2007-2035 (quadrillion Btu)
Liquids Naturalgas
Coal Nuclear Renew-ables
0
100
200
300High Oil Price Reference Low Oil Price
Figure 25. World marketed energy consumptionby fuel in three Oil Price cases, 2035 (quadrillionBtu)
0
111
96
123
Reference HighOil Price
LowOil Price
0
50
100
150
Transportation
Industrial
Residential
Commercial
Electric power
Figure 26. World liquids consumption by sectorin three Oil Price cases, 2035 (million barrels perday)
1. “Belgium Postpones Nuclear Phase-Out,” WorldNuclear News (October 13, 2009), web site www.nuclear-news.org; and “Germany’s New Govern-ment May Extend Reactor Lifetimes,” Spiegel Online(September 29, 2009), web site www.spiegel.de.
2. U.S. Department of Energy, Loan Guarantee Pro-gram, “Key Documents: Title XVII. Incentives forInnovative Technologies” (August 8, 2005), web sitewww.lgprogram.energy.gov.
3. After conversion (1 square meter = 10.76 squarefeet). Source: China Statistics 2006: Data from theNational Bureau of Statistics of the Peoples Republic ofChina, “Floor Space Completed and Housing Con-ditions of Urban and Rural Residents,” web sitewww.allcountries.org/china_statistics/10_32_floor_space_completed_and_housing.html.
4. International Energy Agency, World Energy Outlook2009 (Paris, France, November 2009), pp. 128 and134.
5. IHS Global Insight, Inc., “A New Year, a New Direc-tion for the Global Economy,” Global Executive Sum-mary (Lexington, MA, January 2010), p. 1.
6. International Monetary Fund, “IMF Revises UpGlobal Forecast to Near 4% for 2010,” IMF SurveyMagazine: In the News (Washington, DC, January 26,2010), web site www.imf.org/external/pubs/ft/survey/so/2010/NEW012610B.htm.

22 U.S. Energy Information Administration / International Energy Outlook 2010
7. See, for example, International Monetary Fund,World Economic Outlook Update (Washington, DC,January 26, 2010), p. 1; and IHS Global Insight,Global Executive Summary: A New Year, a New Direc-tion for the Global Economy (Lexington, MA, January2010), p. 1.
8. “China Updates Spending Details of StimulusFund,” Xinhua News Agency (May 21, 2009), web sitehttp://news.xinhuanet.com/english/2009-05/21/content_11415559.htm.
9. P. Newport, IHS Global Insight, Inc., QuarterlyReview and Outlook First Quarter 2010: United States,Canada, and Eurozone (Lexington, MA, March 2010),p. 11.
10. A. Kish, IHS Global Insight, Inc., Quarterly Reviewand Outlook First Quarter 2010: United States, Canada,and Eurozone (Lexington, MA, March 2010), p. 16.
11. Department of Finance Canada, “Budget 2009: Can-ada’s Economic Action Plan” (Press Announce-ment: Ottawa, Canada, January 27, 2009), web sitewww.fin.gc.ca/n08/09-11-eng.asp.
12. P. Vieira, “Budget 2010: A Second Year of StimulusSpending,” The National Post (March 4, 2010), website www.nationalpost.com).
13. International Monetary Fund, World Economic Out-look 2009 (Washington, DC, October 2009), pp.84-85, web site www.imf.org/external/pubs/ft/weo/2009/02/index.htm.
14. “New Dangers for the World Economy,” The Econo-mist (February 13, 2010), p. 13.
15. J. Carney, “The Greek Debt Crisis Was Resolved bya Confidence Game,” Business Insider: Clusterstock(March 8, 2010), web site www.businessinsider.com.
16. H. Archer, IHS Global Insight, “Eurozone—Greece:Concerns Persist Over Eurozone Despite EU’sPledge to Greece” (February 16, 2010), web sitewww.ihsglobalinsight.com (subscription site).
17. International Monetary Fund, World Economic Out-look October 2009 (Washington, DC, October 2009),p. 71, web site www.imf.org/external/pubs/ft/weo/2009/02/index.htm; and D. Ryan, IHS GlobalInsight, Quarterly Review and Outlook: Asia-Pacific(Lexington, MA, March 2010), p. 77.
18. D. Ryan, IHS Global Insight, Quarterly Review andOutlook: Asia-Pacific (Lexington, MA, March 2010),p. 79.
19. D. Ryan, IHS Global Insight, Quarterly Review andOutlook: Asia-Pacific (Lexington, MA, March 2010),p. 77.
20. D. Ryan, IHS Global Insight, Quarterly Review andOutlook: Asia-Pacific (Lexington, MA, March 2010),p. 151.
21. K. Olsen, “Bank of Korea Keeps Interest Rate atRecord Low,” Associated Press News Release (March11, 2010).
22. D. Ryan, IHS Global Insight, Quarterly Review andOutlook: Asia-Pacific (Lexington, MA, March 2010),p. 153.
23. B. Neff, IHS Global Insight, Quarterly Review andOutlook: Asia-Pacific (Lexington, MA, March 2010),pp. 1 and 109.
24. R. Howard, I. Nam, and J. Shin, “New Zealand,Korea Hold Rates,” The Wall Street Journal OnlineEdition (March 10, 2010), web site www.wsj.com(subscription site).
25. IHS Global Insight, World Overview: First Quarter2010 (Lexington, MA, March 2010), p. 74.
26. “Pulling Apart: The World’s Big Economies WereAll Hit by the Recession. Now the Field IsSpreading,” The Economist (January 23, 2010), pp.69-70.
27. International Monetary Fund, World Economic Out-look October 2009 (Washington, DC, October 2009),pp. 71-73, web site www.imf.org/external/pubs/ft/weo/2009/02/index.htm.
28. J. Narasimhan, IHS Global Insight, Quarterly Reviewand Outlook: Asia-Pacific: First Quarter 2010(Lexington, MA, March 9, 2010), p. 48.
29. International Monetary Fund, World Economic Out-look October 2009 (October 2009), p. 72, web sitewww.imf.org/external/pubs/ft/weo/2009/02/index.htm (Washington, DC, October 2009).
30. IHS Global Insight, World Overview: First Quarter2010 (Lexington, MA, March 2010), pp. 71-72 andU.S. Department of State, “Background Note: Phil-ippines,” (October 2009), web site www.state.gov/r/pa/ei/bgn/2794.htm.
31. IHS Global Insight, World Overview: First Quarter2010 (Lexington, MA, March 2010), p.119.
32. United Nations, World Economic Situation and Pros-pects 2010 (New York, NY, 2010), pp. 125-126,web site www.un.org/esa/policy/wess/wesp2010files/wesp2010.pdf.
33. IHS Global Insight, World Overview: First Quarter2010 (Lexington, MA, March 2010), pp. 102-112.

Chapter 2
Liquid FuelsWorld liquids consumption in the IEO2010 Reference case increases from 86.1 million barrels
per day in 2007 to 110.6 million barrels per day in 2035. Unconventional liquids,
at 12.9 million barrels per day, make up 12 percent of total liquids production in 2035.
OverviewConsumption of liquid fuels and other petroleum11
increases from 86.1 million barrels per day in 2007 to110.6 million barrels per day in 2035 in the IEO2010 Ref-erence case. Although world liquids consumption actu-ally declined in 2008 (to 85.8 million barrels per day) andagain in 2009 (to an estimated 84.1 million barrels perday) as the global economic recession deepened, it isexpected to recover in 2010 and beyond as economicgrowth resumes. In the long term, world liquids con-sumption increases despite world oil prices that remainabove $90 per barrel (in real 2008 dollars) after 2014 andrise to more than $130 per barrel by 2035. More than 80percent of the increase in total liquids consumption isprojected for the nations of non-OECD Asia and theMiddle East, where EIA expects strong economicgrowth (Figure 27). The transportation sector accountsfor the largest increment in total liquids demand, mak-ing up nearly 80 percent of the world increase.
To satisfy the increase in world liquids demand inthe Reference case, liquids production increases by 26
million barrels per day from 2007 to 2035, including theproduction of both conventional liquid supplies (crudeoil and lease condensate, natural gas plant liquids, andrefinery gain) and unconventional supplies (biofuels, oilsands, extra-heavy oil, coal-to-liquids, gas-to-liquids,and shale oil) (Figure 28 and Table 3). In the Referencecase, sustained high world oil prices allow for the eco-nomical development of unconventional resources andthe use of enhanced oil recovery technologies to increaseproduction of conventional resources. High world oilprices also incentivize the development of additionalconventional resources through technically difficult,high-risk, and very expensive projects, including wellsin ultra-deep water and the Arctic.
The most significant non-OPEC contributors to produc-tion growth are Russia, the United States, Brazil, andCanada. Total non-OPEC liquids production in 2035 isnearly 13 million barrels per day higher than in 2007,representing 51 percent of the total world increase(Figure 29). OPEC producers12 are assumed to restrictinvestment in incremental production capacity in theReference case, below the levels justified by high prices.
U.S. Energy Information Administration / International Energy Outlook 2010 23
25
17
15
8
6
6
5
3
27
32
14
8
8
11
5
5
North America
Non-OECD Asia
OECD Europe
OECD Asia
Central and South America
Middle East
Non-OECD Europe and Eurasia
Africa
0 10 20 30 40
2007
2035
8
8
27
8
17
Figure 27. World liquids consumption by regionand country group, 2007 and 2035 (million barrelsper day)
2007 Reference High Oil Price2035
Low Oil Price0
50
100
150
Non-OPEC conventional
OPEC conventional
Total unconventional
48 45 55
34 32 58
10
183
52
45
13
Figure 28. World liquid fuels production in threecases, 2007 and 2035 (million barrels per day)
11 Liquid fuels and other petroleum include petroleum-derived fuels and non-petroleum-derived liquid fuels, such as ethanol andbiodiesel, coal-to-liquids, and gas-to-liquids. Petroleum coke, which is a solid, is included. Also included are natural gas liquids, crude oilconsumed as a fuel, and liquid hydrogen.
12 Indonesia officially suspended its membership in OPEC on January 1, 2009. In this chapter, all references to OPEC exclude Indonesia.In addition, all time series have been updated to reflect country groupings as of January 1, 2009, so that Indonesia’s liquids production is ex-cluded from the OPEC totals for 1980 through 2035.

As a result, OPEC provides roughly 40 percent of theworld’s total liquids supply over the 2007-2035 period.
Unconventional resources from both OPEC and non-OPEC sources become increasingly competitive in theIEO2010 Reference case. Production of unconventionalpetroleum liquids, such as Canada’s oil sands andVenezuela’s extra-heavy oil, is limited somewhat byenvironmental concerns and investment restrictions.Production of nonpetroleum unconventional liquids,such as biofuels, coal-to-liquids, and gas-to-liquids(GTL), is spurred by sustained high prices in the Refer-ence and High Oil Price cases (Figure 30); however, theirdevelopment also depends on country-specific pro-grams or mandates. World production of unconven-tional liquids, which in 2007 totaled only 3.4 millionbarrels per day, increases in the Reference case to 12.9million barrels per day in 2035, when it accounts for12 percent of total world liquids production.
24 U.S. Energy Information Administration / International Energy Outlook 2010
Table 3. World liquid fuels production in the Reference case, 2007-2035 (million barrels per day)
Source 2007 2015 2020 2025 2030 2035
Average annualpercent change,
2007-2035OPECConventional liquidsa . . . . . . . 33.8 36.4 37.5 39.7 42.3 45.3 1.0Extra-heavy oil . . . . . . . . . . . . 0.6 0.8 1.1 1.2 1.3 1.4 3.1Bitumen. . . . . . . . . . . . . . . . . . 0.0 0.0 0.0 0.0 0.0 0.0 —Coal-to-liquids . . . . . . . . . . . . . 0.0 0.0 0.0 0.0 0.0 0.0 —Gas-to-liquids . . . . . . . . . . . . . 0.0 0.2 0.2 0.3 0.3 0.3 15.4Shale oil . . . . . . . . . . . . . . . . . 0.0 0.0 0.0 0.0 0.0 0.0 —Biofuels . . . . . . . . . . . . . . . . . . 0.0 0.0 0.0 0.0 0.0 0.0 —
OPEC total . . . . . . . . . . . . . . 34.4 37.4 38.8 41.2 43.9 47.0 1.1Non-OPECConventional liquidsa . . . . . . . 47.7 46.2 47.0 48.8 50.8 52.5 0.3Extra-heavy oil . . . . . . . . . . . . 0.0 0.0 0.0 0.1 0.1 0.1 —Bitumen. . . . . . . . . . . . . . . . . . 1.4 2.4 2.9 3.5 4.2 5.2 4.8Coal-to-liquids . . . . . . . . . . . . . 0.2 0.3 0.5 0.8 1.1 1.4 7.9Gas-to-liquids . . . . . . . . . . . . . 0.0 0.1 0.1 0.1 0.1 0.1 —Shale oil . . . . . . . . . . . . . . . . . 0.0 0.0 0.0 0.1 0.2 0.4 15.6Biofuels . . . . . . . . . . . . . . . . . . 1.2 2.4 2.8 3.2 3.5 4.1 4.6
Non-OPEC totalb . . . . . . . . . 50.4 51.3 53.3 56.5 60.0 63.6 0.8WorldConventional liquidsa . . . . . . . 81.4 82.6 84.5 88.5 93.1 97.7 0.7Extra-heavy oil . . . . . . . . . . . . 0.6 0.8 1.1 1.2 1.4 1.5 3.3Bitumen. . . . . . . . . . . . . . . . . . 1.4 2.4 2.9 3.5 4.2 5.2 4.8Coal-to-liquids . . . . . . . . . . . . . 0.2 0.3 0.5 0.8 1.1 1.4 7.9Gas-to-liquids . . . . . . . . . . . . . 0.1 0.3 0.3 0.3 0.4 0.4 7.3Shale oil . . . . . . . . . . . . . . . . . 0.0 0.0 0.0 0.1 0.2 0.4 15.6Biofuels . . . . . . . . . . . . . . . . . . 1.2 2.4 2.8 3.2 3.5 4.1 4.6
World total . . . . . . . . . . . . . . 84.8 88.7 92.1 97.6 103.9 110.6 1.0aIncludes conventional crude oil and lease condensate, natural gas plant liquids (NGPL), and refinery gain.bIncludes some U.S. petroleum product stock withdrawals, domestic sources of blending components, other hydrocarbons, and
ethers.
1990 2000 2007 2015 2025 20350
20
40
60
80
OPEC
Non-OPEC
History Projections
Figure 29. World total liquids production,1990-2035 (million barrels per day)

World liquids consumptionWorld liquids consumption in the IEO2010 Referencecase increases from 86.1 million barrels per day (174 qua-drillion Btu) in 2007 to 110.6 million barrels per day (223quadrillion Btu) in 2035. World GDP is a key driver,growing by 3.4 percent per year from 2007 to 2020 and3.1 percent per year from 2020 to 2035. Developingnon-OECD nations, particularly in Asia, the MiddleEast, and Central and South America, are expected tohave strong economic growth accompanied by increas-ing demand for liquids in the transportation and indus-trial sectors.
Rising prices for liquids increase the cost-competitive-ness of non-liquid fuels, leading many users of liquidsoutside the transportation sector to switch to substitutesources of energy. As a result, the transportation share oftotal liquid fuels consumption increases, accounting for77 percent of the overall increase in liquids consumedover the projection period across all sectors (Figure 31).In 2035, the transportation sector consumes 61 percent oftotal liquids supplied.
Strong expansion of liquids use is projected for non-OECD countries, fueled by a return to robust economicgrowth, burgeoning industrial activity, and rapidlyexpanding transportation use. The largest increase inregional non-OECD consumption between 2007 and2035 is projected for non-OECD Asia, at 15.5 millionbarrels per day. Within non-OECD Asia, the largestincreases in demand come from China (9.4 million bar-rels per day) and India (1.8 million barrels per day), withthe increase from China being the largest for any singlecountry worldwide. Large consumption increases arealso expected in the Middle East (4.6 million barrels per
day), and Central and South America (2.0 million barrelsper day) (see Figure 27).
Liquids consumption in OECD regions generally growsmore slowly over the next 25 years, reflecting slowlygrowing or declining populations and relatively sloweconomic growth as compared with non-OECD nations.In addition, growth in demand for liquids in manyOECD countries is slowed by government policies andlegislation aimed at improving the efficiency of personalmotor vehicles. This includes increased automobile effi-ciency standards and government incentives introducedin many nations during the recession, such as the U.S.“cash for clunkers” program, designed to encourageconsumers to trade in older, less efficient cars for newerones that are more fuel-efficient. In Japan and OECDEurope, liquids consumption declines by averageannual rates of 0.7 percent (0.9 million barrels per day)and 0.4 percent (1.6 million barrels per day), respec-tively, from 2007 to 2035.
The different growth trends for the non-OECD andOECD regions mean that, by 2025, non-OECD regionsconsume more liquids than OECD regions. Despite sig-nificant country-level consumption growth, China stillconsumes less liquid fuel than the United States in 2035.
World oil pricesThe impacts of world oil prices on energy demandare a considerable source of uncertainty in the IEO2010projections. In addition to the Reference case, High OilPrice and Low Oil Price cases illustrate the range of thatuncertainty, although they do not span the completerange of possible price paths. In the Reference case, theworld oil price13 increases from $59 per barrel in 2009 to$70 per barrel in 2010 and then rises to $95 per barrel in
U.S. Energy Information Administration / International Energy Outlook 2010 25
2007 Reference Low Oil Price2035
High Oil Price0
5
10
15
20
Oil Sands/Bitumen
Biofuels
Extra-Heavy Oil
Coal-to-Liquids
Gas-to-Liquids
Shale Oil/Other
Figure 30. World production of unconventionalliquid fuels in three cases, 2007 and 2035(million barrels per day)
86 89 9298
104111
2007 2015 2020 2025 2030 20350
50
100
150
Transportation
Industrial
Residential/Commercial
Electric Power
Figure 31. World liquids consumption by sector,2007-2035 (million barrels per day)
13 The oil price reported in IEO2010 is for light sweet crude oil delivered to Cushing, Oklahoma. The price series is consistent with spotprices for light sweet crude oil reported on the New York Mercantile Exchange (NYMEX). All oil prices are in real 2008 dollars per barrel,unless otherwise noted.
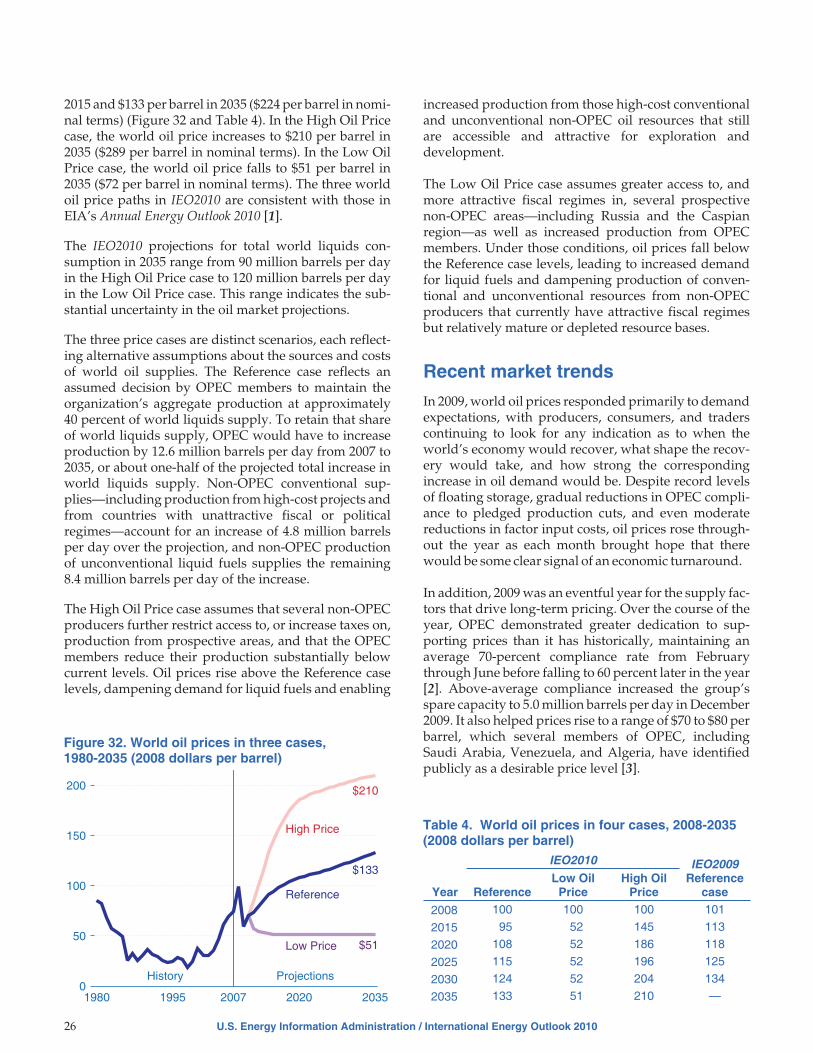
2015 and $133 per barrel in 2035 ($224 per barrel in nomi-nal terms) (Figure 32 and Table 4). In the High Oil Pricecase, the world oil price increases to $210 per barrel in2035 ($289 per barrel in nominal terms). In the Low OilPrice case, the world oil price falls to $51 per barrel in2035 ($72 per barrel in nominal terms). The three worldoil price paths in IEO2010 are consistent with those inEIA’s Annual Energy Outlook 2010 [1].
The IEO2010 projections for total world liquids con-sumption in 2035 range from 90 million barrels per dayin the High Oil Price case to 120 million barrels per dayin the Low Oil Price case. This range indicates the sub-stantial uncertainty in the oil market projections.
The three price cases are distinct scenarios, each reflect-ing alternative assumptions about the sources and costsof world oil supplies. The Reference case reflects anassumed decision by OPEC members to maintain theorganization’s aggregate production at approximately40 percent of world liquids supply. To retain that shareof world liquids supply, OPEC would have to increaseproduction by 12.6 million barrels per day from 2007 to2035, or about one-half of the projected total increase inworld liquids supply. Non-OPEC conventional sup-plies—including production from high-cost projects andfrom countries with unattractive fiscal or politicalregimes—account for an increase of 4.8 million barrelsper day over the projection, and non-OPEC productionof unconventional liquid fuels supplies the remaining8.4 million barrels per day of the increase.
The High Oil Price case assumes that several non-OPECproducers further restrict access to, or increase taxes on,production from prospective areas, and that the OPECmembers reduce their production substantially belowcurrent levels. Oil prices rise above the Reference caselevels, dampening demand for liquid fuels and enabling
increased production from those high-cost conventionaland unconventional non-OPEC oil resources that stillare accessible and attractive for exploration anddevelopment.
The Low Oil Price case assumes greater access to, andmore attractive fiscal regimes in, several prospectivenon-OPEC areas—including Russia and the Caspianregion—as well as increased production from OPECmembers. Under those conditions, oil prices fall belowthe Reference case levels, leading to increased demandfor liquid fuels and dampening production of conven-tional and unconventional resources from non-OPECproducers that currently have attractive fiscal regimesbut relatively mature or depleted resource bases.
Recent market trends
In 2009, world oil prices responded primarily to demandexpectations, with producers, consumers, and traderscontinuing to look for any indication as to when theworld’s economy would recover, what shape the recov-ery would take, and how strong the correspondingincrease in oil demand would be. Despite record levelsof floating storage, gradual reductions in OPEC compli-ance to pledged production cuts, and even moderatereductions in factor input costs, oil prices rose through-out the year as each month brought hope that therewould be some clear signal of an economic turnaround.
In addition, 2009 was an eventful year for the supply fac-tors that drive long-term pricing. Over the course of theyear, OPEC demonstrated greater dedication to sup-porting prices than it has historically, maintaining anaverage 70-percent compliance rate from Februarythrough June before falling to 60 percent later in the year[2]. Above-average compliance increased the group’sspare capacity to 5.0 million barrels per day in December2009. It also helped prices rise to a range of $70 to $80 perbarrel, which several members of OPEC, includingSaudi Arabia, Venezuela, and Algeria, have identifiedpublicly as a desirable price level [3].
26 U.S. Energy Information Administration / International Energy Outlook 2010
1980 1995 2007 2020 20350
50
100
150
200
High Price
Low Price
Reference
History Projections
$210
$51
$133
Figure 32. World oil prices in three cases,1980-2035 (2008 dollars per barrel)
Table 4. World oil prices in four cases, 2008-2035(2008 dollars per barrel)
Year
IEO2010 IEO2009Reference
caseReferenceLow Oil
PriceHigh Oil
Price
2008 100 100 100 101
2015 95 52 145 113
2020 108 52 186 118
2025 115 52 196 125
2030 124 52 204 134
2035 133 51 210 —

Since June 2009, Iraq—the only OPEC member not cur-rently assigned a quota—has held two bid rounds. Thesum of the targeted production increase from theawarded fields is about 9.5 million barrels per day, oralmost four times the country’s current production.Although most industry analysts do not expect Iraq toachieve the production targets in full, especially not inthe near to mid-term, the likely increase still could causechanges in OPEC’s quota allocation and long-term pro-duction decisions.
The year also held significant challenges and surprisesfor non-OPEC supply, some with potentially long-lasting implications. Although prices rose throughout2009, many of the supply projects delayed during theprice slump that started in 2008 have not been revived.Given the time needed for project development, there isa lag between the time of investment decision and theeventual arrival of the projects in the market. Conse-quently, mid-term supply growth may be constrained ifdelayed projects are not restarted in the short term.
A related trend that began in 2008 and continued in 2009was the decline in costs for materials, labor, and equip-ment (“factor inputs”) necessary to develop supply pro-jects. The decline may have encouraged delays in someprojects as investors waited to secure contracts at thelowest possible cost; however, the trend appears to havebottomed out at the end of 2009 after only a slight overallreduction in costs [4]. Before the recent reduction in pro-duction costs, an industry research group estimated thatcosts had approximately doubled since 2000 [5]. Highercosts serve to raise the breakeven oil price at which aproject would be considered economical, thus affectingdecisions as to which supply projects are likely to moveforward in the future.
Also starting in 2008 and continuing into 2009 was a cri-sis in the global credit market, which made it difficult tofinance some exploration and production projects. It willtake several years to realize the full effect of limits oncredit availability for oil supply projects, because theprojects stalled by the lack of financing, particularlyexploration projects, would not have brought supply tothe market for years. In addition, the recent credit crisismay also have lead to an overall and possibly lastingchange in risk appetite on the part of both lenders andinvestors. Ironically, while credit terms were beingtightened and financial risk was being trimmed, ongo-ing exploration efforts in Africa resulted in a wave ofdiscoveries and new hope for unexplored and under-explored non-OPEC frontiers (see box on page 28). Itremains unknown whether those exploration efforts willcontinue to bear fruit, and whether future efforts will behampered by credit conditions. At present these areimportant uncertainties to be considered in the projec-tions of future oil supply and demand balance.
World liquids productionIn the IEO2010 Reference case, world liquids productionin 2035 exceeds the 2007 level by 26 million barrels perday. Increases in production are expected for both OPECand non-OPEC producers. Overall, 51 percent of thetotal increase is expected to come from non-OPEC areas,including 33 percent from non-OPEC unconventionalliquids production alone. OPEC produces 47 millionbarrels per day in 2035 in the Reference case, andnon-OPEC producers provide 64 million barrels perday.
The Reference case assumes that OPEC producers willchoose to maintain their market share of world liquidssupply and will invest in incremental production capac-ity so that their liquids production represents approxi-mately 40 percent of total global liquids productionthroughout the projection. Increasing volumes of con-ventional liquids (crude oil and lease condensate, natu-ral gas plant liquids [NGPL], and refinery gain) fromOPEC members contribute 10.3 million barrels per dayto the total increase in world liquids production from2007 to 2035, and conventional liquids supplied fromnon-OPEC nations contribute 4.8 million barrels perday.
Unconventional liquids production increases by about 5percent annually on average over the projection period,because sustained high oil prices make unconventionalliquids more competitive, and above-ground factorslimit the production of economically competitive con-ventional liquids. Unconventional fuels account for 37percent (9.5 million barrels per day) of the increase intotal liquids production in the Reference case, and 8.4million barrels per day of the increase in unconventionalsupply comes from non-OPEC sources. High oil prices,improvements in exploration and extraction technolo-gies, emphasis on recovery efficiency, and the emer-gence and continued growth of unconventional resourceproduction are the primary factors supporting thegrowth of non-OPEC liquids production in the IEO2010Reference case.
Liquids production modeling approach
The IEO2010 projections are based on a two-stage ana-lytical approach. Projections of liquids productionbefore 2015 are based largely on a project-by-projectassessment of production volumes and associatedscheduling timelines, with consideration given to thedecline rates of active projects, planned exploration anddevelopment activity, and country-specific geopoliticalsituations and fiscal regimes. There are often lengthydelays between the point at which supply projects areannounced and when they begin producing. The exten-sive and detailed information available about such pro-jects, including project scheduling and the investment
U.S. Energy Information Administration / International Energy Outlook 2010 27

28 U.S. Energy Information Administration / International Energy Outlook 2010
Is offshore West Africa the world’s next frontier for oil?
The development of non-OPEC oil supply centers hasgrown and diversified widely over time. North Amer-ica dominated non-OPEC supply in the early 1970s, theNorth Sea and Mexico evolved as major sources in the1980s, and much of the new production in the 1990sand into the 2000s came from developing countries inCentral and South America, the non-OPEC MiddleEast, and China. Now industry has shifted its attentionto offshore resources along Africa’s western coast, sug-gesting that Africa may become an important non-OPEC oil-producing region within a decade.
Between 2007 and 2009, oil discoveries off the WestAfrican coast resulted in a flurry of exploration andproduction activity, with a number of companiesshowing active interest in obtaining explorationblocks. In June 2007, the Jubilee field was discovered bythe United Kingdom’s Tullow Oil in the deep coastalwaters of Ghana.a Initial estimates suggest that theJubilee field contains approximately 490 million bar-rels of proven reserves and may have as much as 1.8billion barrels of potential reserves.b Work on the Jubi-lee field began in 2009. Initial production is expected tobegin at the end of 2010, increasing to 120,000 barrelsper day in 2011.
The discovery of Jubilee spurred interest in oil explora-tion along the coast of several other West Africannations, notably, Côte d’Ivoire, Liberia, and SierraLeone. In September 2009, Anadarko Petroleum dis-covered oil off the coast of Sierra Leone at the Venus-B1exploratory well—the first deepwater discovery in theSierra Leone-Liberian Basin. Although its commercialviability has not yet been confirmed, the discoveryserves to frame a “new oil frontier” area of the WestAfrican coast, extending from Ghana to Sierra Leone,with significant resource potential.c
A 2010 assessment by the U.S. Geological Survey(USGS) of two West African provinces, the SenegalProvince and the Gulf of Guinea Province, estimatedmean undiscovered resources of 2.4 billion barrels and4.1 billion barrels, respectively.d This represents a sig-nificant increase in the undiscovered potential of the
two provinces since the 2000 USGS World PetroleumAssessment. In 2000, the Senegal Province was esti-mated to hold a mere 157 million barrels of oil. TheGulf of Guinea Province estimate has grown from 1.0billion barrels of oil resource in 2000 to 4.1 billion bar-rels in 2010.
While the potential resource base offshore West Africaappears to be ample, there are other important consid-erations that may deter the region’s oil development.Investment climates vary among countries, and thereare risks that must be evaluated before foreign compa-nies commit to investing in oil production. Foreigninvestors attempt to limit their risks, including but notlimited to political, economic, operational, andgeopolitical risks.
Many West African nations have only recently recov-ered from civil war or other periods of political insta-bility, and they may still be dealing with inexperiencedgovernments, potentially suffering from corruptionand mismanagement. Companies can be dissuadedfrom investing if they believe that business operationsmight be hampered by government interference. Forexample, the recent dispute between Kosmos Energyand the government of Ghana concerning the pro-posed sale of Kosmos’s stake in the Jubilee field toExxonMobil signaled potential problems for compa-nies operating in offshore Ghana.e Although the dis-pute was resolved—at least temporarily—whenKosmos agreed to remain a partner until the fieldbegins first production, the issue over transfer of assetscould have negative impacts on future internationalinvestment.
Because this is the first time that oil production hasbeen a consideration for many West African countries,they may have little or no legislation concerninghydrocarbon resources. Côte d’Ivoire introduced anew Oil and Gas Development Code in 1996 in anattempt to increase foreign direct investment, and theGhanaian government is scheduled to draft legislationestablishing an independent regulator to manage oilrevenues before production begins at the Jubilee field
(continued on page 29)
a“Ghana: ‘World-class’ Jubilee Oilfield Larger Than Expected,” Petroleum Economist (January 27, 2009), web site www.petroleum-economist.com (subscription site).
b“Africa: Jubilee Field: Ghana’s Oil Industry Takes Off,” iStockAnalyst.com (April 5, 2010), web site www.istockanalyst.com/arti-cle/viewiStockNews/articleid/4006121; and “Exxon’s Ghana Move Raises Hopes, Tensions,” Petroleum Intelligence Weekly, Vol. 48, No.42 (October 19, 2009), pp. 2-3, web site www.energyintel.com/publicationhomepage.asp (subscription site).
cJ. Collin, “Andarko: West Africa Find Opens New Frontier,” Oil Daily (September 17, 2009), web site www.energyintel.com (subscrip-tion site).
dU.S. Geological Survey, World Petroleum Resources Project, “Assessment of Undiscovered Oil and Gas Resources of Four West AfricaGeologic Provinces,” Fact Sheet 2010–3006 (February 2010), web site http://pubs.usgs.gov/fs/2010/3006/pdf/FS10-3006.pdf.
eE. Gismatullin and T. Patel, “Tullow Says Kosmos to Stay in Ghana Until Production Starts” (April 22, 2010), web site www.bloomberg.com/apps/news?sid=aigcwbvWOSCE&pid=20601087.

and development plans of companies and countries,make it possible to take a detailed approach to modelingmid-term supply.
Although some projects are publicized more than 7 to 10years before their first production, others can come online within 3 years. For that reason, project-by-projectanalyses are unlikely to provide a complete representa-tion of company or country production plans andachievable production volumes beyond 3 years into thefuture. Instead, production decisions made after themid-term, or 2015, are assumed to be based predomi-nantly on resource availability and the resulting eco-nomic viability of production.
In view of the residual effects of previous governmentpolicies and the unavoidable lag time between changesin policy and any potential production changes, how-ever, most country-level changes in production trendsare noticeable only in 2020 and beyond. Geopolitical andother “above-ground” constraints14 are not assumed todisappear entirely after 2015, however. Longstandingabove-ground factors for which there are no indicationsof significant future changes—for instance, the govern-ment-imposed investment conditions currently in placein Iran, or OPEC adherence to production quotas—areexpected to continue affecting world supplies long after2015. Even if above-ground constraints were relaxed, theexpansion of production capacity could be delayed,depending on the technical difficulty and typical devel-opment schedule of the projects likely to be developed ina particular country.
For some resource-rich countries it is assumed that cur-rent political barriers to production increases will notcontinue after 2015. For instance, both Mexico and Vene-zuela currently have laws that restrict foreign owner-ship of hydrocarbon resources. Their resource policieshave discouraged investment—both foreign anddomestic—and hindered their ability to increase or evenmaintain historical production levels. In the Reference
case, both Mexico and Venezuela ease restrictions atsome point after 2015, allowing some additional foreigninvolvement in their oil sectors that facilitates increasesin liquids production, including from deepwater pros-pects in Mexico and extra-heavy oils in Venezuela’sOrinoco belt.
Iraq is another resource-rich country where currentlythere are significant impediments to investment in theupstream hydrocarbon sector. Liquids production inIraq dropped substantially after the U.S.-led invasion in2003. From 2002 to 2003 production declined from 2.0million barrels per day to 1.3 million barrels per day, andsince then it has achieved only inconsistent and slowgrowth. Although Iraq’s production levels are notexpected to increase substantially in the near term, it isassumed that political and legal uncertainty subsides,and that renewed investment and development activityensue, resulting in significant growth in productionfrom 2015 to 2035.
Non-OPEC production
The return to sustained high oil prices projected in theIEO2010 Reference case encourages producers innon-OPEC nations to continue investment in conven-tional liquids production capacity and increase invest-ment in enhanced oil recovery (EOR) projects andunconventional liquids production. Non-OPEC produc-tion increases steadily in the projection, from 50 millionbarrels per day in 2007 to 64 million barrels per day in2035, as high prices attract investment in areas previ-ously considered uneconomical, and fears of supplyrestrictions encourage some net consuming nations toexpand unconventional liquids production from domes-tic resources, such as coal and crops.
Despite the maturity of most non-OPEC producing bas-ins, conventional liquids production in the Referencecase increases from 48 million barrels per day in 2007 to52 million barrels per day in 2035. The overall increaseresults primarily from production increases in four
U.S. Energy Information Administration / International Energy Outlook 2010 29
Is offshore West Africa the world’s next frontier for oil? (continued)
later this year.f The legislation aims to create an inde-pendent regulatory body and revenue managementprocedures to avoid the mismanagement and corrup-tion that have arisen elsewhere on the continent. Itremains to be seen how Sierra Leone and Liberia, bothstill recovering from recent civil wars, will manage thistask.
The coast of West Africa represents a new frontier forthe petroleum industry, but how and when theresources will be brought to market remains uncertain.Although there has been healthy exploratory activity,production from the region is still in its infancy.
fC. Hunter, IHS Global Insight, “Ghana: Oil & Gas: Government Policy,” Energy Country Profiles (April 5, 2010), web site www.ihsglobalinsight.com (subscription site).
14 “Above-ground” constraints refer to those nongeological factors that could affect supply, including but not limited to government pol-icies that limit access to resources; conflict; terrorist activity; lack of technological advances or access to technology; price constraints on theeconomic development of resources; labor shortages; materials shortages; weather; environmental protection actions; and short- andlong-term geopolitical considerations.

countries: Brazil, Russia, Kazakhstan, and the UnitedStates (Figure 33). Among non-OPEC producers, thenear absence of prospects for new, large conventionalpetroleum liquids projects, along with declines in pro-duction from existing conventional fields, results inheavy investment in the development of smaller fields.Producers are expected to concentrate their efforts onmore efficient exploitation of fields already in produc-tion, either through the use of more advanced technol-ogy for primary recovery efforts or through EOR. Thoseefforts are expected to allow most established non-OPEC producers to maintain or slow productiondeclines but not to raise production volumes.
In the Reference case, unconventional liquids produc-tion from non-OPEC suppliers rises to 6 million barrelsper day in 2020 and 11 million barrels per day in 2035. Inthe High Oil Price case, non-OPEC unconventional liq-uids production rises to 17 million barrels per day in2035, as significantly higher prices encourage the devel-opment of alternative fuel sources to the limits imposedby expected environmental protection measures andindustry expansion in general. In contrast, in the LowOil Price case, fewer unconventional resources becomeeconomically competitive, and non-OPEC production ofunconventional liquids rises to only 7 million barrels perday in 2035.
Major areas of decline in non-OPEC liquidsproduction
In the IEO2010 Reference case, Mexico and the North Seaare the only non-OPEC production areas that lose morethan 1 million barrels of liquids production per day from2007 to 2035. The most significant decline in non-OPECliquids production is for OECD Europe, with a decreasefrom 5.4 million barrels per day in 2007 to 2.9 millionbarrels per day in 2035. Most of that decline is in NorthSea production, which includes offshore operations by
Norway, the United Kingdom, the Netherlands, andGermany. Over time, fewer and fewer prospects capableof compensating for declines in existing fields have beendiscovered. The drop in North Sea liquids productiondoes not vary significantly in the High and Low Oil Pricecases, both because it is based on depletion of resourcesand because all the countries currently producing liq-uids from North Sea operations are expected to continueencouraging investment and providing open access todevelopment.
In Mexico, liquids production sinks to approximately 1.4million barrels per day in 2025 before slowly rebound-ing to 1.6 million barrels per day in 2035, still 1.9 millionbarrels per day below 2007 volumes. The rebound after2025 depends entirely on the development of potentialresources in the deepwater Gulf of Mexico, which mustbegin some years in advance of any increase in produc-tion levels. The outlook for Mexico’s liquids productionis markedly different from the IEO projection just 3 yearsago, in which production did not fall below 2.9 millionbarrels per day and a long-term recovery began in 2013.The difference between the projections is a result ofdeclines at Cantarell that were more severe thanexpected, along with diminished expectations forChicontepec production and more pessimistic assump-tions about the level of future investment, both foreignand domestic, in Mexico’s deepwater production.
Although the shortage of investment in Mexico isexpected to lead to a mid-term decline, Mexico haspotential resources to support a long-term recovery intotal production, primarily in the Gulf of Mexico. Theextent and timing of a recovery will depend in part onthe level of economic access granted to foreign investorsand operators. Mexico’s national oil company, PEMEX,currently does not have the technical capability or finan-cial means to develop potential deepwater projects inthe Gulf of Mexico.
Major areas of growth in non-OPEC liquidsproduction
The largest increase in non-OPEC total liquids produc-tion is expected for Brazil, with projected growth of 4.9million barrels per day by 2035 from its 2007 level of 2.3million barrels per day. Of that increase, 3.6 million bar-rels per day is attributed to conventional liquids produc-tion. The strong growth in Brazil’s conventionalproduction results in part from short- and mid-termincreases at producing fields for which expansions areeither planned or in progress. It also results in part fromrecent and expected discoveries in the Campos andSantos basins, including the massive Tupi and relatedGuara and Iara discoveries, which both add to produc-tion in the mid- and long term and suggest the presenceof other large fields in the same formation [6]. The vastsize of the sub-salt potential in Brazil, as well as national
30 U.S. Energy Information Administration / International Energy Outlook 2010
Russia
United States
Asia
OECD Europe
Mexico
Caspian Region
Africa
Canada
Brazil
0 5 10 15
2007
2035
Figure 33. Non-OPEC conventional liquidsproduction by region, 2007 and 2035(million barrels per day)

economic strategy and industrialization goals, have ledBrazil to pursue new petroleum legislation [7]. The legis-lative change most pertinent to production potential isthe requirement that the state oil company, Petrobras, bethe sole operator and a minimum 30-percent equityholder for all sub-salt fields.
Although Petrobras has repeatedly proven itself a leaderin deepwater development and is known to have thetechnical capabilities to develop sub-salt prospects, it isnot expected to have the resources (financial, labor, etc.)to develop its domestic plays completely on its own. Thedifferent IEO2010 price cases assume different invest-ment terms offered by Brazil to foreign investors andhence different rates of sub-salt development. The HighOil Price case assumes tighter terms of access to conven-tional resources, resulting in average annual growth of2.2 percent and conventional production that reaches 3.5million barrels per day in 2035. In comparison, the LowOil Price case assumes open terms of access to conven-tional resources, resulting in average annual growth of4.6 percent and conventional production of 6.6 millionbarrels per day in 2035.
In addition to the growth in conventional liquids pro-duction, Brazil’s ethanol production also increases, from0.3 million barrels per day in 2007 to 1.6 million barrelsper day in 2035 in the Reference case. This growth is aresult of steady increases in yields and the expansion ofcrop production. Brazil’s major ethanol production isderived from sugar cane, currently the highest-yieldingand cheapest feedstock for ethanol. Brazil also has alarge amount of land available for sugar cane produc-tion in the form of previously cleared, underutilizedpasture land. The country’s domestic consumption isnot expected to rise as fast as its expansion of ethanolproduction, making Brazil a net ethanol exporter overthe course of the projection. Thus, its productiondepends largely on other countries’ policies anddemand for ethanol.
In the High Oil Price case, Brazil’s ethanol productiontotals 2.0 million barrels per day in 2035, reflectinghigher demand for ethanol both at home and abroad. Inthe Low Oil Price case, which assumes reduced domes-tic and international demand for ethanol, Brazil’s etha-nol production totals 1.2 million barrels per day in 2035.Even in the Low Oil Price case, however, there is only asmall drop in Brazil’s domestic ethanol consumption,because of the country’s mandatory minimum E25blend and the fact that ethanol makes up a nearly50-percent share of the country’s domestic gasolinemarket [8].
The second-largest contributor to future increases innon-OPEC total liquids production is the United States.U.S. conventional liquids production grows from 8.0million barrels per day in 2007 to 9.2 million barrels per
day in 2035 in the Reference case, as rising world oilprices spur both onshore and offshore drilling. In theshort term, the vast majority of the increase in crude oilproduction comes from deepwater offshore fields.Fields that started producing in 2009, or that areexpected to start producing in the next few years,include Great White, Norman, Tahiti, Gomez, Cascade,and Chinook. All are in water depths greater than 2,600feet, and most are in the U.S. Central Gulf of Mexico.Production from those fields, combined with increasedproduction from fields that started producing in 2007and 2008, contributes to the near-term growth in U.S.offshore production. Production from other recently dis-covered and yet-to-be discovered fields offsets produc-tion declines in older fields, resulting in a net increase inliquids production through 2035.
U.S. lower 48 onshore production of crude oil continuesto grow through 2035, primarily as a result of increasedapplication of EOR techniques. In 2035, EOR accountsfor 37 percent of total onshore production. The rate ofgrowth in domestic crude oil production dependslargely on assumptions about world oil prices andimprovements in technology, because remainingonshore resources typically require more costly second-ary or tertiary recovery techniques. In a future worldwhere carbon dioxide emissions may be captured forsequestration, increased carbon dioxide supply couldspur additional EOR activities.
U.S. unconventional liquids production becomes moresignificant as world oil prices rise, with domestic pro-duction of biofuels increasing from 0.46 million barrelsper day in 2007 to 1.6 million barrels per day in 2035 inthe Reference case. Although advances in coal liquefac-tion technology have made it commercially available inother countries, including South Africa, China, and Ger-many, the technical and financial risks of building whatwould be essentially a first-of-a-kind facility in theUnited States have discouraged significant investmentthus far. In addition, the possibility of new legislationaimed at reducing U.S. greenhouse gas emissions cre-ates further uncertainty for future investment in CTL.With ongoing improvement in oil shale technology,commercial production starts in 2023 and increases rap-idly to 1.7 percent of total U.S. liquids supply in 2035.However, oil shale development suffers from environ-mental, technical, and financial uncertainties similar tothose for CTL.
Canada’s production of conventional liquids declinesslowly in the Reference case, by a total of just under 0.5million barrels per day from 2007 to 2035. However,increased production of unconventional petroleum liq-uids from oil sands more than offsets the decline in con-ventional production. As a result, Canada’s total liquidsproduction doubles in the projection, from 3.4 million
U.S. Energy Information Administration / International Energy Outlook 2010 31

barrels per day in 2007 to 6.8 million barrels per day in2035.
Russia and Kazakhstan are the other key players innon-OPEC production growth. However, non-OECDEurope and Eurasia is a region prone to territorial dis-putes, transportation blockages, contractual changes,and political intervention. For example, Russia’s pro-duction is expected to decline in the mid-term, withrecent trends indicating that tax policies which previ-ously caused companies to operate at a net financial lossmay soon be reinstated, creating a large disincentive forpotential private investment in resource development[9].
After declining to 9.4 million barrels per day in 2016,Russia’s liquids production begins a slow increase to 9.8million barrels per day in 2020 in the Reference case, asuncertainty about tax regimes lessens. In addition, theannual increases in the world oil price assumed in theIEO2010 Reference case spur liquids development andallow Russia’s production to reach 12.8 million barrelsper day in 2035. Although exploration in eastern Siberiais expected during the projection period, Arctic explora-tion is not. In the High and Low Oil Price cases, whichassume different levels of economic access granted toinvestors in the long term, Russia’s total liquids produc-tion in 2035 ranges from 8.6 to 15.7 million barrels perday, respectively.
Mid-term growth in Kazakhstan’s production dependspredominantly on the resources of the Kashagan andTengiz oil fields, as well as the ability of investors totransport production from those projects to the worldmarket. Although known and potential resources aresufficient to support the growth of liquids production inKazakhstan, they could be undermined by a lack of easyexport routes. Currently, exports are limited to sixroutes: the CPC pipeline, Atyrau-Samara pipeline, andrailway shipments can transport a total of 0.8 millionbarrels per day to Russia; another pipeline can move 0.2million barrels per day to China, and two barge routesallow shipments of about 0.1 million barrels per day toAzerbaijan and Iran.
Kazakhstan’s export potential is strongly affected by itsgeographical position. Attaining the production levelsprojected in the Reference case depends not only onresource availability and production but also on the con-struction of export routes—a task requiring regionalcooperation that has not been easy to achieve in the past.A number of possible projects to expand Kazakhstan’scapacity for liquids exports have been proposed over thepast several years. The most likely expansions in thenear term are capacity increases in the pipelines to Rus-sia and China [10].
In addition to the problem of transportation capacity,Kazakhstan has previously reopened legal contractswith private foreign investors, forcing renegotiation ofinvestment returns and making companies reluctant toincrease their investment in the country’s energy sector.Because of the varying degrees of resource access andinvestment terms, Kazakhstan’s total liquids productionin 2035 ranges from 2.2 million barrels per day in theHigh Oil Price case to 3.7 million barrels per day in theLow Oil Price case.
OPEC production
Total liquids production from OPEC nations increasesfrom the 2007 level of 34.4 million barrels per day at anaverage annual rate of 1.0 percent, resulting in the pro-duction of 47.0 million barrels of liquids per day in 2035,of which 34.3 million barrels per day originates in theMiddle East (Figure 34). OPEC decisions on investmentin additional production capacity are the primary differ-ence between the three price cases in IEO2010. The LowOil Price case assumes that OPEC members will increaseinvestment either through their own national oil compa-nies or by allowing greater economic access to foreigninvestors, depending on the country. It also assumesthat OPEC members will expand production capacity inan attempt to maximize government revenue throughincreased production. OPEC production in the Low OilPrice case increases by 27.1 million barrels per day from2007 to 2035, to 61.5 million barrels per day or approxi-mately 50 percent of total world liquids production in2035.
In the High Oil Price case, OPEC member countriesmaintain record high prices by restricting productiontargets to a smaller share of world total liquids produc-tion each year. As a result, OPEC production accountsfor less than 35 percent of the world total in 2035. Volu-metric reductions are concentrated in the mid-term,
32 U.S. Energy Information Administration / International Energy Outlook 2010
Middle East
West Africa
North Africa
South America
0 10 20 30 40
2007
2035
Figure 34. OPEC conventional liquids productionby region, 2007 and 2035 (million barrels per day)

with liquids production falling by 2.4 million barrels perday from 2007 to 2015 and gaining 1.0 million barrels perday from 2015 to 2035.
Throughout the projection period, Saudi Arabia remainsthe largest liquids producer in OPEC, with total produc-tion increasing from 10.3 million barrels per day in 2007to 15.1 million barrels per day in 2035, as prices stabilizeat historically high levels and world consumption con-tinues to grow. Thirty percent of the increase (1.4 millionbarrels per day) is expected to be NGPL productionrelated to expansion of natural gas production. The totalproduction increase equates to an average annualgrowth rate of 1.4 percent, based on the assumption thatSaudi Arabia will continue with its current plan to main-tain spare production capacity at levels between 1.5 and2.0 million barrels per day.
Iraq increases its liquids production by 3.9 percent peryear in the IEO2010 Reference case, the largest annualaverage growth in total liquids production among allOPEC members. The projection assumes that political,legislative, logistical, investment, and security uncer-tainties in Iraq will be resolved in the long term, and thatOPEC constraints and resource availability will be thefactors with the strongest influence on Iraq’s willingnessand ability to increase production (see box on page 34).
In addition to political and legislative uncertainty,import and export infrastructure are also expected tolimit production growth in Iraq to 0.5 million barrels perday from 2007 to 2015. If the country is able to achievelong-term political and economic stability and expandthe capacity of import and export routes as projected inthe Reference case, investment in production capacitycould rise by an average of 5.2 percent annually from2015 and 2030 before slowing to a more modest 3.8 per-cent per year from 2030 to 2035. The fact that Iraq has theresources necessary to support such growth in the longrun, yet produced only 2.1 million barrels per day in2007, illustrates the significant impacts that the politicalenvironment and other above-ground constraints canhave on production projections.
Qatar has the second-highest average annual growthrate in total liquids production among OPEC nationsfrom 2007 to 2035 in the Reference case, at 3.3 percent,with total volumes increasing from 1.2 million barrelsper day in 2007 to 2.5 million barrels per day in 2035.About one-half of the increase consists of crude oil andlease condensate production; production of NGPLs con-tributes another 0.4 million barrels per day; and GTLprojects add just over 0.2 million barrels per day. Despitethe current negative outlook for many previouslyannounced GTL projects around the world, the returnand persistence of historically high oil prices in the Ref-erence case supports the operation of Qatar’s Pearl facil-ity (0.1 million barrels per day capacity) and expansion
of its Oryx facility (adding another 0.1 million barrelsper day).
Total liquids production in Iran is expected to berestricted by political rather than resource-related fac-tors. The political factors include the effectiveness of thenational oil company’s operations, the ability of the gov-ernment and foreign investors to agree on contractualterms, and continuing financial sanctions. In the IEO-2010 Reference case, Iran’s oil production declines from2007 through 2035 because of both financial and politicalconstraints on the development of new oil and naturalgas prospects. In addition, the projections anticipate thatnatural gas demand for domestic electric power andheat production will limit the amount of natural gasavailable for improving oil recovery through natural gasreinjection. Political factors and investment constraintsaffect Iran’s liquids production so severely that produc-tion in 2035 varies by 2.7 million barrels per day acrossthe IEO2010 projections, from 2.6 million barrels per dayin the High Oil Price case to 5.3 million barrels per day inthe Low Oil Price case.
In the OPEC nations of Western Africa, total liquids pro-duction increases from 4.1 million barrels per day in2007 to 5.1 million barrels per day in 2035 in the Refer-ence case. Angola expands production to 2.5 million bar-rels per day in 2020—almost entirely by increasingcrude oil and condensate production from offshore pro-jects—before entering a slow but steady resource-drivendecline in the long term. Nigeria’s liquids production islikely to be hampered in the short term by conflict andinfrastructure difficulties; in the long term, however, ahigher level of known resources enables Nigeria’sliquids production to grow at an average annual rate of0.9 percent, from 2.4 million barrels per day in 2007 to atotal of 3.0 million barrels per day in 2035.
Recent history suggests that Venezuela’s national gov-ernment reacts to high oil prices by tightening invest-ment terms for foreign direct investment and limitingaccess to its reserves. As a result, in the Reference case,with prices rising in real terms through 2035, furthermandated changes in contractual terms, along withthreats of actions to recapture upside returns frompotential investors, are likely to hinder Venezuela’s pro-duction potential in the short term and discourageinvestment in and development of additional projects inthe long term. The trend will be particularly evident inthe mature conventional oil basins, with conventionalproduction declining by 1.1 million barrels per day overthe period from 2007 levels of 2.1 million barrels per day.However, development of several extra-heavy oil pro-jects in the Orinoco belt offsets some of the decline inconventional liquids production.
Ecuador rejoined OPEC in October 2007, after havingsuspended its membership in 1999. Ecuador is a
U.S. Energy Information Administration / International Energy Outlook 2010 33

34 U.S. Energy Information Administration / International Energy Outlook 2010
New Iraqi oil production: How much; how fast?
Iraq holds a considerable portion of the world’s con-ventional oil reserves, but has been unable to increaseoil production substantially in recent years due to con-flict and geopolitical constraints. As violence in Iraqhas lessened, there has been a concerted effort toincrease the country’s oil production, both to bolstergovernment revenues and to support wider economicdevelopment. Recently, Iraq offered prequalified for-eign oil companies two opportunities to bid on desig-nated fields under specific terms of investment. Thesuccess of the bidding rounds and the level of interestfrom foreign companies have raised hopes that oilproduction could increase substantially over a shortperiod of time, with some Iraqi government officialsstating that the country could increase its production to12 million barrels per day by 2017.a Although Iraq hasthe reserves to support such growth, it will need toovercome numerous challenges in order to raise pro-duction to even a fraction of that goal.
Iraq has an estimated 115 billion barrels of provenconventional oil reserves, the third largest in theworld after Saudi Arabia (260 billion barrels) and Iran(138 billion barrels).b However, Iraqi oil productionwas significantly affected not only by the U.S.-ledinvasion in 2003 and subsequent armed conflict, butalso by neglect of the oil industry infrastructure and
restrictions on investment resulting from UnitedNations sanctions imposed during the SaddamHussein regime before the invasion. Oil productioncapacity has not increased substantially since therecent abatement of hostilities, and Iraq’s current totalproduction is about 2.5 million barrels per day—stillbelow the peak annual average of 2.9 million barrelsper day in 1989.
Between June 2009 and January 2010, Iraq awardeddevelopment service contracts for 10 oil projects to for-eign companies, the majority of which were consortiaformed to share the responsibility, risk, and, ulti-mately, returns on each of the projects. Originally, theIraqi Ministry of Oil had expected the development ofthe fields up for bidding to raise Iraq’s productioncapacity to 6 million barrels per day, in line with theMinistry’s strategic goal.c However, heavy competi-tion and high expectations for the fields led biddingcompanies to propose production levels that were sig-nificantly higher than expected. As a result, rather thanraising the country’s total production to 6 million bar-rels per day, the proposed production from allawarded fields suggests that Iraq’s total productioncould increase to 12 million barrels per day in 2017 (seetable below).
(continued on page 35)
aIHS Global Insight, “Country Summary—Iraq” (updated April 30, 2010), web site www.ihsglobalinsight.com (subscription site).b“Worldwide Look at Reserves and Production,” Oil & Gas Journal, Vol. 107, No. 47 (December 21, 2009), pp. 20-21, web site www.ogj.
com (subscription site).cIHS Global Insight, “Country Summary Upstream—Iraq” (updated March 31, 2010), web site http://myinsight.ihsglobalinsight.com
(subscription site).
Results of Iraq bidding rounds, 2010
FieldConsortium
operator
Plateauproduction
target(million barrels
per day)
Remunerationfee
(dollars perbarrel)
Plateauproduction
target duration(years)
Currentproduction
(million barrelsper day)
Plannedproduction
increase(million barrels
per day)
First bid round
Rumaila . . . . . . . . . . . . . . . . . BP 2.85 2.00 7 1.00 1.85
West Qurna (Phase 1) . . . . . . ExxonMobil 2.33 1.90 7 0.27 2.06
Zubair . . . . . . . . . . . . . . . . . . . Eni 1.20 2.00 7 0.21 1.00
Second bid round
Majnoon . . . . . . . . . . . . . . . . . Royal Dutch Shell 1.80 1.39 10 0.06 1.75
Halfaya . . . . . . . . . . . . . . . . . . CNPC (PetroChina) 0.54 1.40 13 0.00 0.53
Qaiyarah . . . . . . . . . . . . . . . . . Sonangol 0.12 5.00 9 0.00 0.12
West Qurna (Phase 2) . . . . . . Lukoil 1.80 1.15 13 — 1.80
Garraf . . . . . . . . . . . . . . . . . . . Petronas 0.23 1.49 13 — 0.23
Badra . . . . . . . . . . . . . . . . . . . Gazprom 0.17 5.50 7 — 0.17
Najmah . . . . . . . . . . . . . . . . . . Sonangol 0.11 6.00 9 — 0.11
Total . . . . . . . . . . . . . . . . . . . . . . . . . . . . . . . . . . . . . . . . . . . . . . . . . . . . . . . . . . . . . . . . . . . . . . . . . . . . 1.54 9.61
Source: IHS Global Insight, Energy Country Profiles, “Iraq: Oil & Gas Upstream” (last updated March 31, 2010), web site www.ihsglobalinsight.com (subscription site).

relatively small oil producer in comparison with otherOPEC members, producing 0.5 million barrels per dayof oil in 2007. Liquids production in Ecuador declinesthrough 2015 in the Reference case, as uncertaintiesassociated with the country’s Hydrocarbons Law makeforeign companies reluctant to investment in Ecuador’soil sector [11]. After 2015, although investment in thecountry’s oil sector continues to be hindered by highinvestment risk, development of its ITT heavy oil field inthe Amazon helps to stabilize its production. Conse-quently, liquids production in Ecuador rebounds to justunder 0.5 million barrels per day in 2025 and remainsfairly flat through 2035.
Unconventional liquids production
Unconventional liquids play an increasingly importantrole in meeting demand for liquid fuels over the courseof the IEO2010 projections. In the Reference case, 11.6percent of world liquids supply in 2035 comes fromunconventional sources, including 1.7 million barrelsper day from OPEC and 11.2 million from non-OPECsources. Although the volume and composition ofunconventional production vary between the IEO2010Low and High Oil Price cases (from 17.9 million barrelsper day in the High Price case to 10.5 million barrels perday in the Low Price case), the geographic origin of eachunconventional liquid type is relatively constant acrossthe cases, usually being limited to countries where pro-jects are underway or advertised.
OPEC unconventional production
OPEC’s unconventional production consists predomi-nantly of extra-heavy oil production in Venezuela (fromthe Orinoco belt) and GTL production in Qatar. In theReference case, Venezuela’s extra-heavy oil productionrises from 0.6 million barrels per day in 2007 to 1.4 mil-lion barrels per day in 2035, and Qatar’s GTL productionincreases from a negligible amount in 2007 to 0.2 millionbarrels per day in 2035. Although the resources to sup-port production at those levels abound in the two coun-tries, large investments will be required to bring them tomarket, and the timing of such investment is uncertain.
There are four major projects currently operating in Ven-ezuela’s Orinoco belt, but they have been suffering frompoor maintenance and lack of investment. Venezuela’sability to increase its extra-heavy oil production willdepend on the level of foreign investment and expertiseit is able to attract for extraction and upgrading projects.In the Reference case, only two Orinoco belt projects aredeveloped over the course of the projection period: theJunín 4 (operated by a consortium of Chinese compa-nies) and Junín 6 (operated by a consortium Russiancompanies). The two projects add 0.4 million barrels perday of production capacity each.
In the Low Oil Price case, Venezuela improves contractterms and stabilizes its investment climate to attractmore foreign investment in the development of Orinocoresources, including Junín 2 and the Carabobo area,
U.S. Energy Information Administration / International Energy Outlook 2010 35
New Iraqi oil production: How much; how fast? (continued)
EIA analysis suggests that, even in a stable politicaland security climate, it would be extremely difficult toraise production by nearly 10 million barrels per dayover such a short period. The two recent historicalexamples of massive production capacity expansionare those of Russia, where production increased by 3.8million barrels per day over a 10-year period, andSaudi Arabia, where production increased by 2.0 mil-lion barrels per day over a 5-year period. The proposedpace and scale of Iraq’s planned production expansiondefy historical precedents and ignore a long list oflogistical and political impediments.
The IEO2010 Reference case expects significant delaysin current production plans because of limitations onIraq’s service sector; import difficulties; likely con-straints on the number of operating rigs and skilledpersonnel available; and limitations on the exportinfrastructure, with current pipelines able to only sup-port marginal increases in flows. There are also secu-rity threats from current and past conflicts, withpipelines still at risk of being attacked, field surfacespopulated with unexploded ordinances, and land
mines that must be cleared. Finally, there is legislativeuncertainty, particularly related to the Kurdistanregion. The prospects for long-term growth, however,are bright.
The uncertainty associated with the evolution of Iraq’supstream oil sector is reflected in the range of projec-tions for liquids production in 2035. In the Referencecase, the political and security situation in Iraq stabi-lizes, and a few of the operating companies overcome,in some measure, the obstacles they face. In this case,Iraq’s total liquids production rises to 2.8 millionbarrels per day in 2017 and 6.1 million barrels per dayin 2035. In the IEO2010 Low Oil Price case, Iraq’s totalliquids production reaches 8.3 million barrels per dayby 2035, reflecting greater success in addressing theconsiderable difficulties facing oil industry expansion.In the High Oil Price case, liquids production reachesonly 4.2 million barrels per day in 2035, because com-panies to a great extent are unable to reduce the diffi-culties they face in their attempts to increaseproduction.
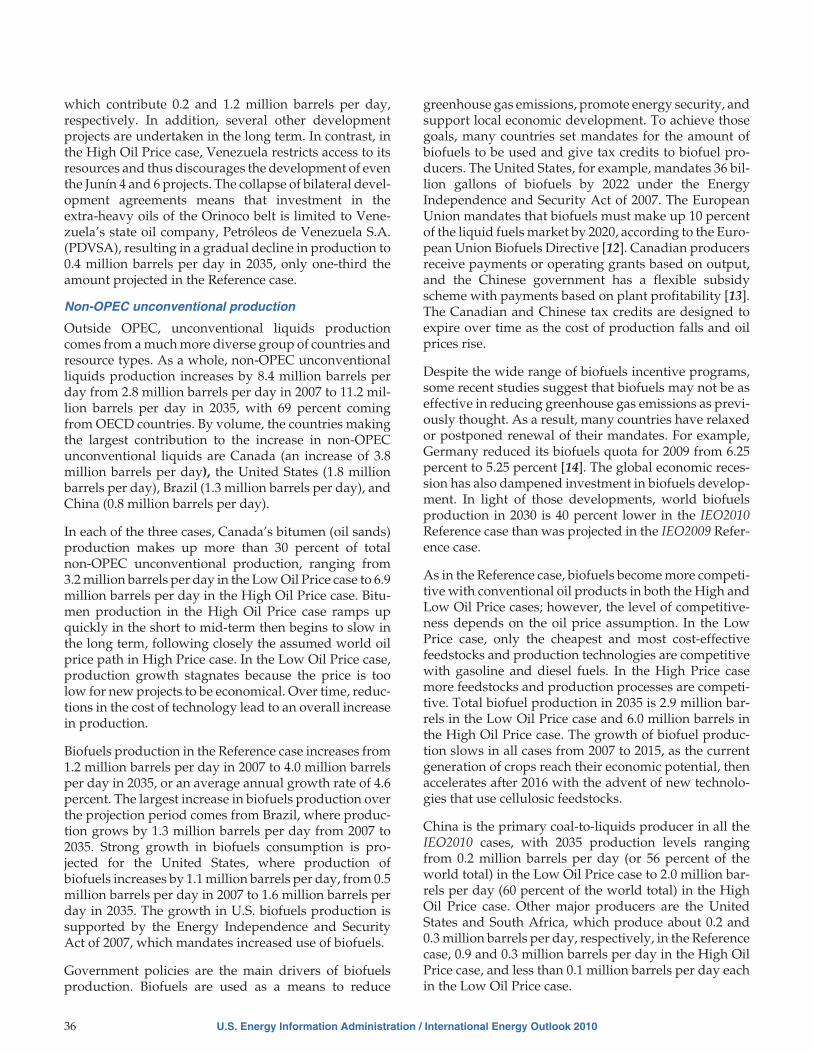
which contribute 0.2 and 1.2 million barrels per day,respectively. In addition, several other developmentprojects are undertaken in the long term. In contrast, inthe High Oil Price case, Venezuela restricts access to itsresources and thus discourages the development of eventhe Junín 4 and 6 projects. The collapse of bilateral devel-opment agreements means that investment in theextra-heavy oils of the Orinoco belt is limited to Vene-zuela’s state oil company, Petróleos de Venezuela S.A.(PDVSA), resulting in a gradual decline in production to0.4 million barrels per day in 2035, only one-third theamount projected in the Reference case.
Non-OPEC unconventional production
Outside OPEC, unconventional liquids productioncomes from a much more diverse group of countries andresource types. As a whole, non-OPEC unconventionalliquids production increases by 8.4 million barrels perday from 2.8 million barrels per day in 2007 to 11.2 mil-lion barrels per day in 2035, with 69 percent comingfrom OECD countries. By volume, the countries makingthe largest contribution to the increase in non-OPECunconventional liquids are Canada (an increase of 3.8million barrels per day), the United States (1.8 millionbarrels per day), Brazil (1.3 million barrels per day), andChina (0.8 million barrels per day).
In each of the three cases, Canada’s bitumen (oil sands)production makes up more than 30 percent of totalnon-OPEC unconventional production, ranging from3.2 million barrels per day in the Low Oil Price case to 6.9million barrels per day in the High Oil Price case. Bitu-men production in the High Oil Price case ramps upquickly in the short to mid-term then begins to slow inthe long term, following closely the assumed world oilprice path in High Price case. In the Low Oil Price case,production growth stagnates because the price is toolow for new projects to be economical. Over time, reduc-tions in the cost of technology lead to an overall increasein production.
Biofuels production in the Reference case increases from1.2 million barrels per day in 2007 to 4.0 million barrelsper day in 2035, or an average annual growth rate of 4.6percent. The largest increase in biofuels production overthe projection period comes from Brazil, where produc-tion grows by 1.3 million barrels per day from 2007 to2035. Strong growth in biofuels consumption is pro-jected for the United States, where production ofbiofuels increases by 1.1 million barrels per day, from 0.5million barrels per day in 2007 to 1.6 million barrels perday in 2035. The growth in U.S. biofuels production issupported by the Energy Independence and SecurityAct of 2007, which mandates increased use of biofuels.
Government policies are the main drivers of biofuelsproduction. Biofuels are used as a means to reduce
greenhouse gas emissions, promote energy security, andsupport local economic development. To achieve thosegoals, many countries set mandates for the amount ofbiofuels to be used and give tax credits to biofuel pro-ducers. The United States, for example, mandates 36 bil-lion gallons of biofuels by 2022 under the EnergyIndependence and Security Act of 2007. The EuropeanUnion mandates that biofuels must make up 10 percentof the liquid fuels market by 2020, according to the Euro-pean Union Biofuels Directive [12]. Canadian producersreceive payments or operating grants based on output,and the Chinese government has a flexible subsidyscheme with payments based on plant profitability [13].The Canadian and Chinese tax credits are designed toexpire over time as the cost of production falls and oilprices rise.
Despite the wide range of biofuels incentive programs,some recent studies suggest that biofuels may not be aseffective in reducing greenhouse gas emissions as previ-ously thought. As a result, many countries have relaxedor postponed renewal of their mandates. For example,Germany reduced its biofuels quota for 2009 from 6.25percent to 5.25 percent [14]. The global economic reces-sion has also dampened investment in biofuels develop-ment. In light of those developments, world biofuelsproduction in 2030 is 40 percent lower in the IEO2010Reference case than was projected in the IEO2009 Refer-ence case.
As in the Reference case, biofuels become more competi-tive with conventional oil products in both the High andLow Oil Price cases; however, the level of competitive-ness depends on the oil price assumption. In the LowPrice case, only the cheapest and most cost-effectivefeedstocks and production technologies are competitivewith gasoline and diesel fuels. In the High Price casemore feedstocks and production processes are competi-tive. Total biofuel production in 2035 is 2.9 million bar-rels in the Low Oil Price case and 6.0 million barrels inthe High Oil Price case. The growth of biofuel produc-tion slows in all cases from 2007 to 2015, as the currentgeneration of crops reach their economic potential, thenaccelerates after 2016 with the advent of new technolo-gies that use cellulosic feedstocks.
China is the primary coal-to-liquids producer in all theIEO2010 cases, with 2035 production levels rangingfrom 0.2 million barrels per day (or 56 percent of theworld total) in the Low Oil Price case to 2.0 million bar-rels per day (60 percent of the world total) in the HighOil Price case. Other major producers are the UnitedStates and South Africa, which produce about 0.2 and0.3 million barrels per day, respectively, in the Referencecase, 0.9 and 0.3 million barrels per day in the High OilPrice case, and less than 0.1 million barrels per day eachin the Low Oil Price case.
36 U.S. Energy Information Administration / International Energy Outlook 2010

The unconventional liquid product that consistentlycontributes the least to total unconventional productionin each of the IEO2010 cases is GTL. In the Reference andLow Oil Price cases, GTL production is limited primarilyto Qatar, although South Africa and Nigeria also pro-duce small volumes. In the High Oil Price case, theUnited States rapidly becomes the world’s largest GTLproducer, accounting for 0.5 million barrels per day ofthe world’s total of 0.8 million barrels per day in 2035.(For a discussion of GTL prospects in the United States,see EIA’s Annual Energy Outlook 2010, pages 39-40.)
World oil reservesAs of January 1, 2010, proved world oil reserves, asreported by the Oil & Gas Journal, were estimated at1,354 billion barrels—12 billion barrels (about 1 percent)higher than the estimate for 2009 [15]. According to theOil & Gas Journal, 56 percent of the world’s proved oilreserves are located in the Middle East (Figure 35). Justunder 80 percent of the world’s proved reserves are con-centrated in eight countries, of which only Canada (withoil sands included) and Russia are not OPEC members(Table 5).
Proved reserves of crude oil are the estimated quantitiesthat geological and engineering data indicate can berecovered in future years from known reservoirs,assuming existing technology and current economic andoperating conditions. Companies whose stocks are pub-licly traded on U.S. stock markets are required by theU.S. Securities and Exchange Commission (SEC) toreport their holdings of domestic and internationalproved reserves, following specific guidelines. InDecember 2008, the SEC released revisions to itsreserves reporting requirements in an attempt to pro-vide investors with a more complete picture of thereserves held by reporting companies by recognizing
the technologies and reserve quantification methodsthat have evolved over time. Country-level estimates ofproved reserves from the Oil and Gas Journal are devel-oped from the data reported to the SEC, from foreigngovernment reports, and from international geologicassessments. The estimates are not always updatedannually.
Whereas proved reserves include only those estimatedquantities of crude oil from known reservoirs, they areonly a subset of the entire potential oil resource base.Resource base estimates include estimated quantities ofboth discovered and undiscovered liquids that have thepotential to be classified as reserves at some time in thefuture. The resource base may include oil that currentlyis not technically recoverable, but could become recov-erable in the future as technologies advance.
Readers may notice that, in some cases in the IEO2010projections, country-level volumes for cumulative pro-duction through 2035 exceed the estimates of provedreserves. This does not imply that resources and thephysical limits of production have not been consideredin the development of production forecasts, or that theprojections assume a rapid decline in production imme-diately after the end of the projection period as reservesare depleted. EIA considers resource availability in alllong-term country-level projections, the aggregation of
U.S. Energy Information Administration / International Energy Outlook 2010 37
Table 5. World oil reserves by country as ofJanuary 1, 2010 (billion barrels)
Country Oil reservesPercent ofworld total
Saudi Arabia . . . . . . . . . . 259.9 19.20Canada. . . . . . . . . . . . . . 175.2 12.94Iran . . . . . . . . . . . . . . . . . 137.6 10.16Iraq . . . . . . . . . . . . . . . . . 115.0 8.50Kuwait. . . . . . . . . . . . . . . 101.5 7.50Venezuela . . . . . . . . . . . 99.4 7.34United Arab Emirates . . . 97.8 7.22Russia. . . . . . . . . . . . . . . 60.0 4.43Libya. . . . . . . . . . . . . . . . 44.3 3.27Nigeria . . . . . . . . . . . . . . 37.2 2.75Kazakhstan. . . . . . . . . . . 30.0 2.22Qatar . . . . . . . . . . . . . . . 25.4 1.88China . . . . . . . . . . . . . . . 20.4 1.51United States . . . . . . . . . 19.2 1.42Brazil. . . . . . . . . . . . . . . . 12.8 0.95Algeria . . . . . . . . . . . . . . 12.2 0.90Mexico . . . . . . . . . . . . . . 10.4 0.77Angola . . . . . . . . . . . . . . 9.5 0.70Azerbaijan. . . . . . . . . . . . 7.0 0.52Norway . . . . . . . . . . . . . . 6.7 0.49Rest of World . . . . . . . . . 72.2 5.33
World Total . . . . . . . . . . 1,353.7 100.00
Source: Oil & Gas Journal.
753
194
135
119
100
40
12
Middle East
North America
Central & South America
Africa
Eurasia
Asia
Europe
0 200 400 600 800
World Total:1,354 Billion Barrels
Figure 35. World proved oil reserves by geographicregion as of January 1, 2010 (billion barrels)
Source: Oil & Gas Journal.

which gives the total world production projection.However, proved reserves are not an appropriate mea-sure for judging total resource availability in the longrun. For example, despite continued production, globalreserves have not declined historically due to explora-tion, discovery, and reserve replacement.
In order to construct realistic and plausible projectionsfor liquids production, and especially for petroleum liq-uids production, underlying analysis must both con-sider production beyond the intended end of theprojection period and base production projections onthe physical realities and limitations of production. Theimportance of approaching an assessment of liquidsproduction in this way is illustrated by the recent historyof U.S. reserve estimates. Whereas the United Statesreported 22.5 billion barrels of proved reserves in 1998,proved reserves of 19.1 billion barrels were reported in2009—a decrease of only 3.4 billion barrels despite thecumulative 24.2 billion barrels of liquids supplied fromU.S. reserves between 1998 and 2009.
Proved reserves cannot provide an accurate assessmentof the physical limits on future production, but ratherare intended to provide insight as to company- or coun-try- level development plans in the very near term. Infact, because of the particularly rigid requirements forthe classification of resources as proved reserves, eventhe cumulative production levels from individual devel-opment projects may exceed the initial estimates ofproved reserves.
EIA attempts to address the lack of applicability ofproved reserves estimates to long-term production pro-jections by developing a production methodology basedon the true physical limits of production, initially-in-place volumes, and technologically limited recovery fac-tors. By basing long-term production assessments onresources rather than reserves, EIA is able to presentprojections that are physically achievable and can besupported beyond the 2035 projection horizon in IEO-2010. The realization of such production levels dependson future growth in world demand, taking into consid-eration such above-ground limitations on production asprofitability and specific national regulations, amongothers.
References
38 U.S. Energy Information Administration / International Energy Outlook 2010
1. U.S. Energy Information Administration, AnnualEnergy Outlook 2010, DOE/EIA-0383(2010) (Wash-ington, DC, April 2010), web site www.eia.gov/oiaf/aeo.
2. The OPEC compliance rate is measured as theactual aggregate reduction in output achieved byquota-restricted members as a percent of the
group’s agreed-upon production cut from Februaryto June. Compliance has fallen to average levels justabove 60 percent only since September 2009. SeePFC Energy, “OPEC Output and Quotas—Decem-ber 2009” (December 7, 2009).
3. “Oil Tops Obama’s Saudi Agenda,” UpstreamOnline(June 3, 2009), web site www.upstreamonline.com/live/article179966.ece; “Chavez Chavez Sets Sightson $80 Oil,” UpstreamOnline (May 27, 2009), web sitewww.upstreamonline.com/live/article179428.ece;and “Opec ‘Waiting on G20 Move’,” UpstreamOnline (March 17, 2009), web site www.upstreamonline.com/live/article174177.ece.
4. “Upstream Costs Bottoming Out,” UpstreamOnline(December 8, 2009), web site www.upstreamonline.com/live/article200992.ece.
5. “Upstream Players Face More Costs Pain,”UpstreamOnline (May 14, 2008), web site www.upstreamonline.com/live/article154663.ece.
6. offshore-technology.com, “Tupi Oil Field, Brazil”(2010), web site www.offshore-technology.com/projects/tupi.
7. T. Rhodes and I. Londres, “Brazil: Proposals for aNew Petroleum Regime in Brazil,” Mondaq, Ltd.(September 10, 2009), web site www.mondaq.com/article.asp?articleid=85774.
8. Agência Brasil, “ANP: Consumo de Álcool Com-bustível é 50% Maior em 2007,” Terra NetworksBrasil (July 15, 2008), web site http://economia.terra.com.br/noticias/noticia.aspx?idNoticia=200807152306_ABR_77211977.
9. “Russia Unlikely To Make Oil Tax Switch Soon,”(February 3, 2010), upstreamonline.com, web sitewww.upstreamonline.com/live/article205231.ece.
10. “KazTransOil and Transneft to expand the Atyrau-Samara pipeline,” Silk Road Intelligencer (July 10,2008), web site http://silkroadintelligencer.com/2008/07/10/kaztransoil-and-transneft-to-expand-the-atyrau-samara-pipeline.
11. J. Kerr, IHS Global Insight, Inc., “Energy Analysis:Ecuadorian President Presents HydrocarbonsReform” (September 22, 2009), web site www.ihsglobalinsight.com (subscription site).
12. U.S. Congress, Energy Independence and SecurityAct of 2007 (January 4, 2007), web site http://frwebgate.access.gpo.gov/cgi-bin/getdoc.cgi?dbname=110_cong_bills&docid=f:h6enr.txt.pdf.
13. T.W. Hertel, W.E. Tyner, and D.K. Birur, “TheGlobal Impacts of Biofuel Mandates,” Energy Jour-nal, Vol. 31, No. 1 (2010), pp. 75-100, web site www.iaee.org/en/publications/journal.aspx (subscrip-tion site).

U.S. Energy Information Administration / International Energy Outlook 2010 39
14. F.O. Licht, “Germany: Government To Lower 2009Biofuels Quota,” World Ethanol & Biofuels Report,Vol. 7, No. 3 (October 8, 2009), p. 55, web site www.agra-net.com (subscription site).
15. “Worldwide Look at Reserves and Production,” Oil& Gas Journal, Vol. 107, No. 47 (December 21, 2009),pp. 20-21, web site www.ogj.com (subscriptionsite).

This page intentionally left blank.

Chapter 3
Natural GasIn the IEO2010 Reference case, natural gas consumption in non-OECD countries grows
about three times as fast as in OECD countries. Non-OECD production increases
account for 89 percent of the growth in world production from 2007 to 2035.
OverviewTotal natural gas consumption worldwide increases44 percent in the IEO2010 Reference case, from 108 tril-lion cubic feet in 2007 to 156 trillion cubic feet in 2035(Figure 36). Demand for natural gas slowed in 2008 asthe global economic recession began to affect worldenergy markets, and in 2009 world consumption of nat-ural gas contracted by an estimated 1.1 percent. Theimpact of the recession on natural gas use was especiallyevident in the industrial sector—the end-use sector withthe highest level of natural gas consumption—wheredemand for natural gas declined by an estimated 6 per-cent from 2008 to 2009.
As world economies begin to recover from the economicdownturn, global demand for natural gas rebounds.Nonetheless, natural gas supplies from a variety ofsources help keep markets well supplied and prices rela-tively low. In the Reference case, natural gas consump-tion expands by an average of 1.8 percent per year from2007 to 2020. From 2020 to 2035, the growth in consump-tion of natural gas slows to an average of 0.9 percent peryear, as prices rise and increasingly expensive naturalgas resources are brought to market.
Natural gas remains a key energy source for industrialuses and for electricity generation throughout the pro-jection. The industrial sector accounted for approxi-mately 40 percent of total world natural gas use in 2007,
and it maintains that share through 2035. Because natu-ral gas produces less carbon dioxide when it is burnedthan does either coal or petroleum, governments imple-menting national or regional policies to reduce green-house gas emissions may encourage its use to displaceother fossil fuels. In the electric power sector, for exam-ple, natural gas is often an attractive choice for new gen-erating plants because of its relative fuel efficiency, lowemissions, quick construction timelines, and low capitalcosts. Electricity generation in the Reference casebecomes an increasingly important part of the world’snatural gas consumption, accounting for 36 percent ofthe world total in 2035, up from 33 percent in 2007.
Natural gas consumption in non-OECD countries growsapproximately three times as fast as consumption inOECD countries in the Reference case, with increasesaveraging 1.9 percent per year for non-OECD countriesand 0.6 percent per year for OECD countries from 2007to 2035. As a result, non-OECD countries account for 78percent of the total world increment in natural gas con-sumption over the projection period, and the non-OECDshare of total world natural gas consumption increasesfrom 50 percent in 2007 to 59 percent in 2035.
The major projected increase in natural gas production isexpected to occur in non-OECD regions, with the largestincrements coming from the Middle East (an increase of16 trillion cubic feet between 2007 and 2035), Africa (7trillion cubic feet), and Russia and the other countries ofnon-OECD Europe and Eurasia (6 trillion cubic feet)(Figure 37). Over the projection period, Iran and Qataralone increase their natural gas production by a com-bined 12 trillion cubic feet, nearly one-fourth of the totalincrement in world gas production. A significant shareof the increase is expected to come from a single offshorefield, which is called North Field on the Qatari side andSouth Pars on the Iranian side.
Although the extent of the world’s tight gas, shale gas,and coalbed methane resource base has not yet beenassessed fully, the IEO2010 Reference case projects asubstantial increase in those supplies—especially in theUnited States, but also in Canada and China. In theUnited States, one of the keys to increasing natural gasproduction has been advances in horizontal drillingand hydraulic fracturing technologies, which havemade it possible to develop the country’s vast shale gas
U.S. Energy Information Administration / International Energy Outlook 2010 41
108
125136
145 150 156
2007 2015 2020 2025 2030 20350
50
100
150
200
OECD
Non-OECD
Figure 36. World natural gas consumption,2007-2035 (trillion cubic feet)
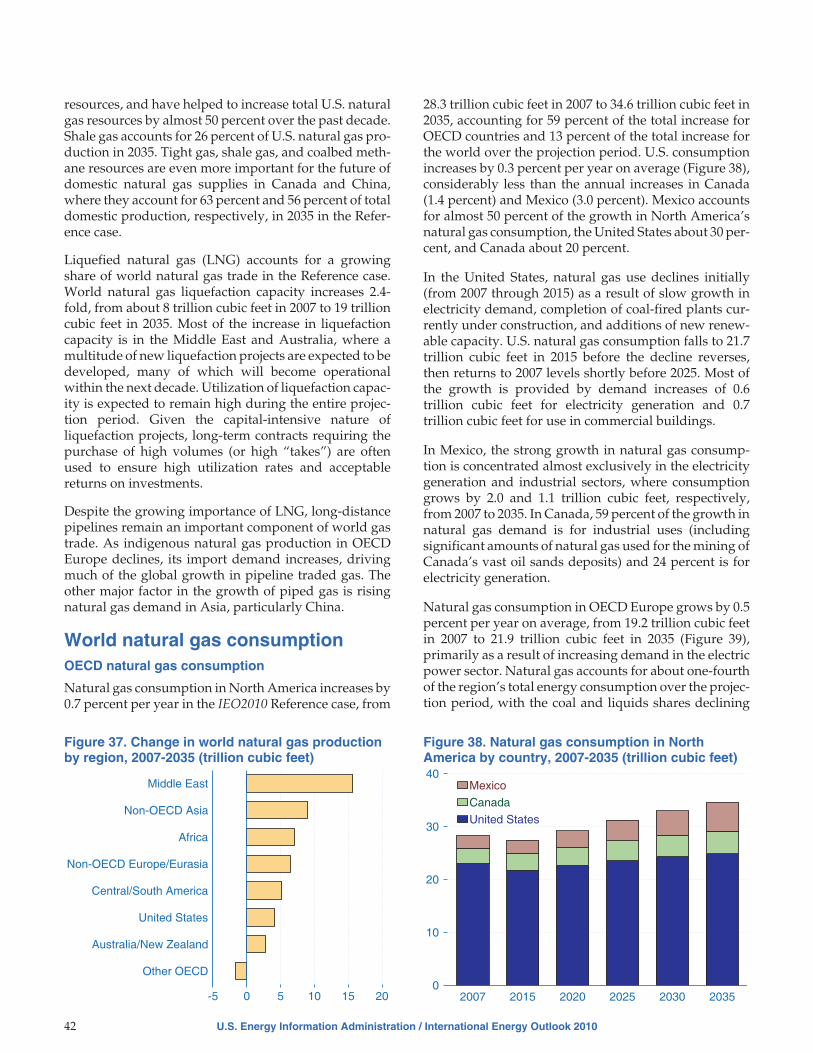
resources, and have helped to increase total U.S. naturalgas resources by almost 50 percent over the past decade.Shale gas accounts for 26 percent of U.S. natural gas pro-duction in 2035. Tight gas, shale gas, and coalbed meth-ane resources are even more important for the future ofdomestic natural gas supplies in Canada and China,where they account for 63 percent and 56 percent of totaldomestic production, respectively, in 2035 in the Refer-ence case.
Liquefied natural gas (LNG) accounts for a growingshare of world natural gas trade in the Reference case.World natural gas liquefaction capacity increases 2.4-fold, from about 8 trillion cubic feet in 2007 to 19 trillioncubic feet in 2035. Most of the increase in liquefactioncapacity is in the Middle East and Australia, where amultitude of new liquefaction projects are expected to bedeveloped, many of which will become operationalwithin the next decade. Utilization of liquefaction capac-ity is expected to remain high during the entire projec-tion period. Given the capital-intensive nature ofliquefaction projects, long-term contracts requiring thepurchase of high volumes (or high “takes”) are oftenused to ensure high utilization rates and acceptablereturns on investments.
Despite the growing importance of LNG, long-distancepipelines remain an important component of world gastrade. As indigenous natural gas production in OECDEurope declines, its import demand increases, drivingmuch of the global growth in pipeline traded gas. Theother major factor in the growth of piped gas is risingnatural gas demand in Asia, particularly China.
World natural gas consumptionOECD natural gas consumption
Natural gas consumption in North America increases by0.7 percent per year in the IEO2010 Reference case, from
28.3 trillion cubic feet in 2007 to 34.6 trillion cubic feet in2035, accounting for 59 percent of the total increase forOECD countries and 13 percent of the total increase forthe world over the projection period. U.S. consumptionincreases by 0.3 percent per year on average (Figure 38),considerably less than the annual increases in Canada(1.4 percent) and Mexico (3.0 percent). Mexico accountsfor almost 50 percent of the growth in North America’snatural gas consumption, the United States about 30 per-cent, and Canada about 20 percent.
In the United States, natural gas use declines initially(from 2007 through 2015) as a result of slow growth inelectricity demand, completion of coal-fired plants cur-rently under construction, and additions of new renew-able capacity. U.S. natural gas consumption falls to 21.7trillion cubic feet in 2015 before the decline reverses,then returns to 2007 levels shortly before 2025. Most ofthe growth is provided by demand increases of 0.6trillion cubic feet for electricity generation and 0.7trillion cubic feet for use in commercial buildings.
In Mexico, the strong growth in natural gas consump-tion is concentrated almost exclusively in the electricitygeneration and industrial sectors, where consumptiongrows by 2.0 and 1.1 trillion cubic feet, respectively,from 2007 to 2035. In Canada, 59 percent of the growth innatural gas demand is for industrial uses (includingsignificant amounts of natural gas used for the mining ofCanada’s vast oil sands deposits) and 24 percent is forelectricity generation.
Natural gas consumption in OECD Europe grows by 0.5percent per year on average, from 19.2 trillion cubic feetin 2007 to 21.9 trillion cubic feet in 2035 (Figure 39),primarily as a result of increasing demand in the electricpower sector. Natural gas accounts for about one-fourthof the region’s total energy consumption over the projec-tion period, with the coal and liquids shares declining
42 U.S. Energy Information Administration / International Energy Outlook 2010
Middle East
Non-OECD Asia
Africa
Non-OECD Europe/Eurasia
Central/South America
United States
Australia/New Zealand
Other OECD
0 5 10 15 20-5
Figure 37. Change in world natural gas productionby region, 2007-2035 (trillion cubic feet)
2007 2015 2020 2025 2030 20350
10
20
30
40
United States
Canada
Mexico
Figure 38. Natural gas consumption in NorthAmerica by country, 2007-2035 (trillion cubic feet)

from their earlier levels. Many governments in OECDEurope have made commitments to reduce greenhousegas emissions and promote development of “cleanenergy.” Because natural gas is less carbon-intensivethan either coal or petroleum, it is a more environmen-tally attractive option and thus is likely to remain animportant fuel for Europe’s electric power sector devel-opment in the long term.
Natural gas consumption in OECD Asia grows on aver-age by 0.8 percent per year from 2007 to 2035, withJapan, South Korea, and Australia/New Zealand eachadding less than 1 trillion cubic feet of natural gas con-sumption over the period (Figure 40). Total natural gasconsumption for the region as a whole increases from6.3 trillion cubic feet in 2007 to 8.0 trillion cubic feet in2035.
Japan’s natural gas consumption grows modestly, by anaverage of 0.2 percent per year, from 3.7 trillion cubicfeet in 2007 to 4.0 trillion cubic feet by 2035. A decliningpopulation and aging labor force limit the country’s nat-ural gas demand in the long term. Moreover, newnuclear generation capacity projected for Japan limitsthe need for additional natural-gas-fired generationafter 2015.
South Korea’s demand for natural gas grows by 1.4 per-cent per year from 2007 to 2035, led by strong growth inthe electric power sector. The share of the country’s nat-ural gas consumption used for electricity generationincreases from 39 percent in 2007 to 48 percent in 2035.As deregulation in the electric power sector moves for-ward, South Korea’s electricity producers will be able tocontract directly with global LNG suppliers, stimulatingfurther growth in natural gas demand for the electricpower sector. In the buildings sector, where natural gasconsumption has grown robustly over the past two
decades with the development of South Korea’s nationalnatural gas transmission grid, consumption growthslows somewhat. Still, natural gas use in the buildingssector increases by approximately 126 billion cubic feetfrom 2007 to 2035, making up about one-fifth of thecountry’s total increase in natural gas use of 596 billioncubic feet in the IEO2010 Reference case.
In Australia/New Zealand, the industrial sector is thepredominant consumer of natural gas, accounting forabout 60 percent of the region’s total natural gas con-sumption in 2007. This remains the case throughout theprojection. Natural gas use in the electric power sectorgrows modestly, from 0.3 trillion cubic feet in 2007 to 0.6trillion cubic feet in 2035, as Australia—in its efforts toreduce carbon dioxide emissions—gradually increasesthe share of natural gas in its power generation mix todiversify away from its more carbon-intensive coal-firedgeneration.
Non-OECD natural gas consumption
The countries of non-OECD Europe and Eurasia rely onnatural gas for more than 50 percent of their primaryenergy needs—a larger share than for any other countrygrouping in the IEO2010 Reference case. Russia is theworld’s second-largest consumer of natural gas after theUnited States, with demand totaling 16.7 trillion cubicfeet in 2007 and representing 55 percent of Russia’s totalenergy consumption. In the Reference case, Russia’s nat-ural gas consumption grow at a modest average rate of0.2 percent per year from 2007 to 2035. As the countrymakes progress in liberalizing domestic natural gasprices to approach parity with international market val-ues, increasing fuel costs for natural-gas-fired plants arelikely to make them less competitive with other baseloadgeneration. Furthermore, expected efficiency improve-ments and other demand-side management measures
U.S. Energy Information Administration / International Energy Outlook 2010 43
2007 2015 2020 2025 2030 20350
10
20
30
Industrial
Buildings
Electric power
Figure 39. Natural gas consumption in OECDEurope by end-use sector, 2007-2035(trillion cubic feet)
2007Japan
2035 2007South Korea
2035 2007Australia/
New Zealand
20350
1
2
3
4
Other
Industrial
Electric power
Figure 40. Natural gas consumption in OECD Asiaby country and end-use sector, 2007 and 2035(trillion cubic feet)
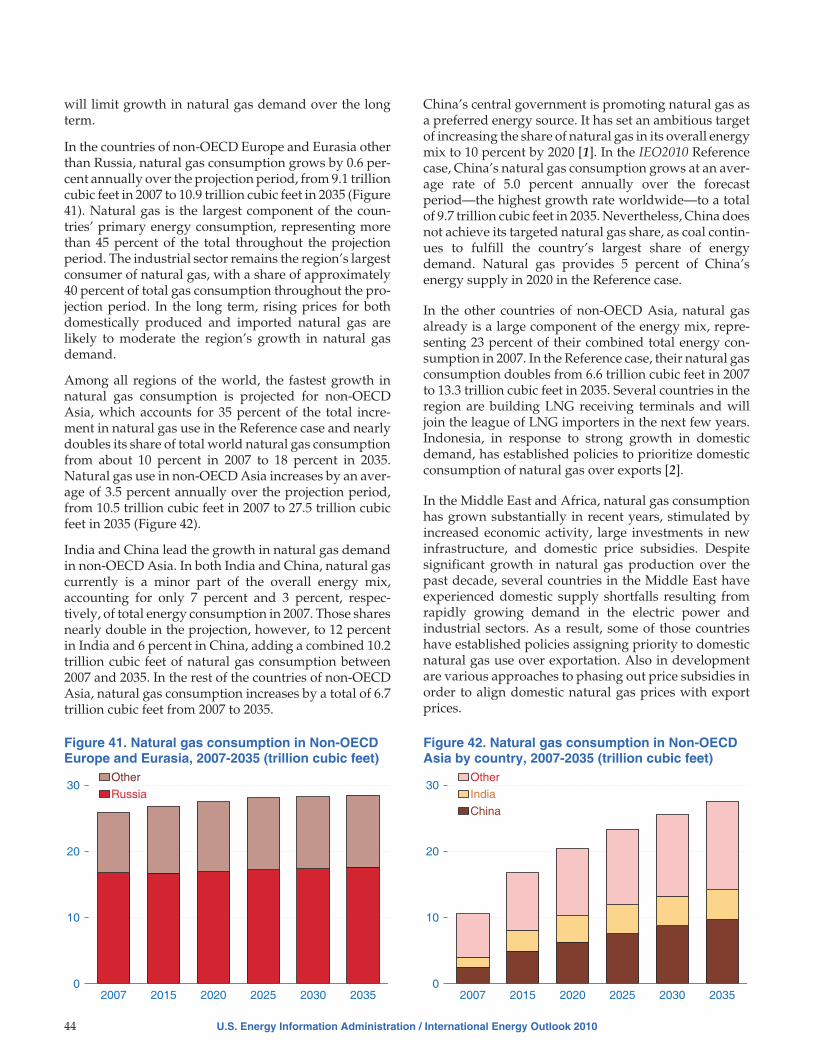
will limit growth in natural gas demand over the longterm.
In the countries of non-OECD Europe and Eurasia otherthan Russia, natural gas consumption grows by 0.6 per-cent annually over the projection period, from 9.1 trillioncubic feet in 2007 to 10.9 trillion cubic feet in 2035 (Figure41). Natural gas is the largest component of the coun-tries’ primary energy consumption, representing morethan 45 percent of the total throughout the projectionperiod. The industrial sector remains the region’s largestconsumer of natural gas, with a share of approximately40 percent of total gas consumption throughout the pro-jection period. In the long term, rising prices for bothdomestically produced and imported natural gas arelikely to moderate the region’s growth in natural gasdemand.
Among all regions of the world, the fastest growth innatural gas consumption is projected for non-OECDAsia, which accounts for 35 percent of the total incre-ment in natural gas use in the Reference case and nearlydoubles its share of total world natural gas consumptionfrom about 10 percent in 2007 to 18 percent in 2035.Natural gas use in non-OECD Asia increases by an aver-age of 3.5 percent annually over the projection period,from 10.5 trillion cubic feet in 2007 to 27.5 trillion cubicfeet in 2035 (Figure 42).
India and China lead the growth in natural gas demandin non-OECD Asia. In both India and China, natural gascurrently is a minor part of the overall energy mix,accounting for only 7 percent and 3 percent, respec-tively, of total energy consumption in 2007. Those sharesnearly double in the projection, however, to 12 percentin India and 6 percent in China, adding a combined 10.2trillion cubic feet of natural gas consumption between2007 and 2035. In the rest of the countries of non-OECDAsia, natural gas consumption increases by a total of 6.7trillion cubic feet from 2007 to 2035.
China’s central government is promoting natural gas asa preferred energy source. It has set an ambitious targetof increasing the share of natural gas in its overall energymix to 10 percent by 2020 [1]. In the IEO2010 Referencecase, China’s natural gas consumption grows at an aver-age rate of 5.0 percent annually over the forecastperiod—the highest growth rate worldwide—to a totalof 9.7 trillion cubic feet in 2035. Nevertheless, China doesnot achieve its targeted natural gas share, as coal contin-ues to fulfill the country’s largest share of energydemand. Natural gas provides 5 percent of China’senergy supply in 2020 in the Reference case.
In the other countries of non-OECD Asia, natural gasalready is a large component of the energy mix, repre-senting 23 percent of their combined total energy con-sumption in 2007. In the Reference case, their natural gasconsumption doubles from 6.6 trillion cubic feet in 2007to 13.3 trillion cubic feet in 2035. Several countries in theregion are building LNG receiving terminals and willjoin the league of LNG importers in the next few years.Indonesia, in response to strong growth in domesticdemand, has established policies to prioritize domesticconsumption of natural gas over exports [2].
In the Middle East and Africa, natural gas consumptionhas grown substantially in recent years, stimulated byincreased economic activity, large investments in newinfrastructure, and domestic price subsidies. Despitesignificant growth in natural gas production over thepast decade, several countries in the Middle East haveexperienced domestic supply shortfalls resulting fromrapidly growing demand in the electric power andindustrial sectors. As a result, some of those countrieshave established policies assigning priority to domesticnatural gas use over exportation. Also in developmentare various approaches to phasing out price subsidies inorder to align domestic natural gas prices with exportprices.
44 U.S. Energy Information Administration / International Energy Outlook 2010
2007 2015 2020 2025 2030 20350
10
20
30Russia
Other
Figure 41. Natural gas consumption in Non-OECDEurope and Eurasia, 2007-2035 (trillion cubic feet)
2007 2015 2020 2025 2030 20350
10
20
30
China
India
Other
Figure 42. Natural gas consumption in Non-OECDAsia by country, 2007-2035 (trillion cubic feet)
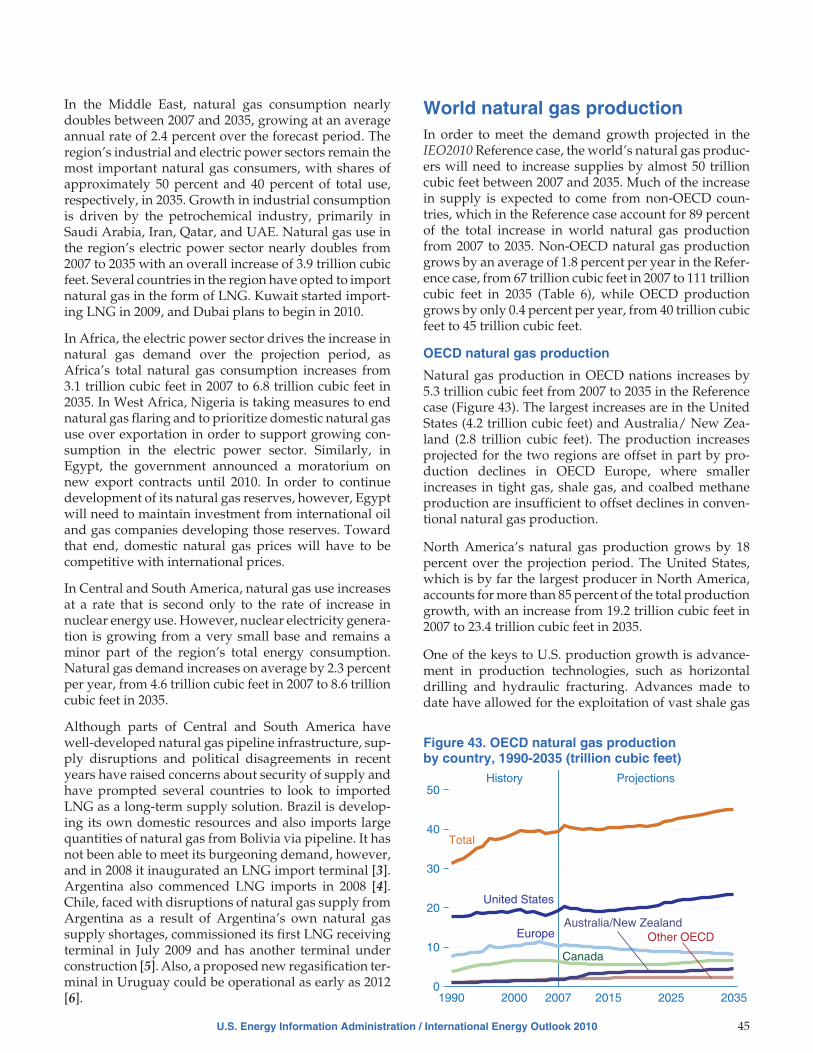
In the Middle East, natural gas consumption nearlydoubles between 2007 and 2035, growing at an averageannual rate of 2.4 percent over the forecast period. Theregion’s industrial and electric power sectors remain themost important natural gas consumers, with shares ofapproximately 50 percent and 40 percent of total use,respectively, in 2035. Growth in industrial consumptionis driven by the petrochemical industry, primarily inSaudi Arabia, Iran, Qatar, and UAE. Natural gas use inthe region’s electric power sector nearly doubles from2007 to 2035 with an overall increase of 3.9 trillion cubicfeet. Several countries in the region have opted to importnatural gas in the form of LNG. Kuwait started import-ing LNG in 2009, and Dubai plans to begin in 2010.
In Africa, the electric power sector drives the increase innatural gas demand over the projection period, asAfrica’s total natural gas consumption increases from3.1 trillion cubic feet in 2007 to 6.8 trillion cubic feet in2035. In West Africa, Nigeria is taking measures to endnatural gas flaring and to prioritize domestic natural gasuse over exportation in order to support growing con-sumption in the electric power sector. Similarly, inEgypt, the government announced a moratorium onnew export contracts until 2010. In order to continuedevelopment of its natural gas reserves, however, Egyptwill need to maintain investment from international oiland gas companies developing those reserves. Towardthat end, domestic natural gas prices will have to becompetitive with international prices.
In Central and South America, natural gas use increasesat a rate that is second only to the rate of increase innuclear energy use. However, nuclear electricity genera-tion is growing from a very small base and remains aminor part of the region’s total energy consumption.Natural gas demand increases on average by 2.3 percentper year, from 4.6 trillion cubic feet in 2007 to 8.6 trillioncubic feet in 2035.
Although parts of Central and South America havewell-developed natural gas pipeline infrastructure, sup-ply disruptions and political disagreements in recentyears have raised concerns about security of supply andhave prompted several countries to look to importedLNG as a long-term supply solution. Brazil is develop-ing its own domestic resources and also imports largequantities of natural gas from Bolivia via pipeline. It hasnot been able to meet its burgeoning demand, however,and in 2008 it inaugurated an LNG import terminal [3].Argentina also commenced LNG imports in 2008 [4].Chile, faced with disruptions of natural gas supply fromArgentina as a result of Argentina’s own natural gassupply shortages, commissioned its first LNG receivingterminal in July 2009 and has another terminal underconstruction [5]. Also, a proposed new regasification ter-minal in Uruguay could be operational as early as 2012[6].
World natural gas productionIn order to meet the demand growth projected in theIEO2010 Reference case, the world’s natural gas produc-ers will need to increase supplies by almost 50 trillioncubic feet between 2007 and 2035. Much of the increasein supply is expected to come from non-OECD coun-tries, which in the Reference case account for 89 percentof the total increase in world natural gas productionfrom 2007 to 2035. Non-OECD natural gas productiongrows by an average of 1.8 percent per year in the Refer-ence case, from 67 trillion cubic feet in 2007 to 111 trillioncubic feet in 2035 (Table 6), while OECD productiongrows by only 0.4 percent per year, from 40 trillion cubicfeet to 45 trillion cubic feet.
OECD natural gas production
Natural gas production in OECD nations increases by5.3 trillion cubic feet from 2007 to 2035 in the Referencecase (Figure 43). The largest increases are in the UnitedStates (4.2 trillion cubic feet) and Australia/ New Zea-land (2.8 trillion cubic feet). The production increasesprojected for the two regions are offset in part by pro-duction declines in OECD Europe, where smallerincreases in tight gas, shale gas, and coalbed methaneproduction are insufficient to offset declines in conven-tional natural gas production.
North America’s natural gas production grows by 18percent over the projection period. The United States,which is by far the largest producer in North America,accounts for more than 85 percent of the total productiongrowth, with an increase from 19.2 trillion cubic feet in2007 to 23.4 trillion cubic feet in 2035.
One of the keys to U.S. production growth is advance-ment in production technologies, such as horizontaldrilling and hydraulic fracturing. Advances made todate have allowed for the exploitation of vast shale gas
U.S. Energy Information Administration / International Energy Outlook 2010 45
1990 2000 2007 2015 2025 20350
10
20
30
40
50History Projections
United States
Europe Other OECD
Canada
Australia/New Zealand
Total
Figure 43. OECD natural gas productionby country, 1990-2035 (trillion cubic feet)
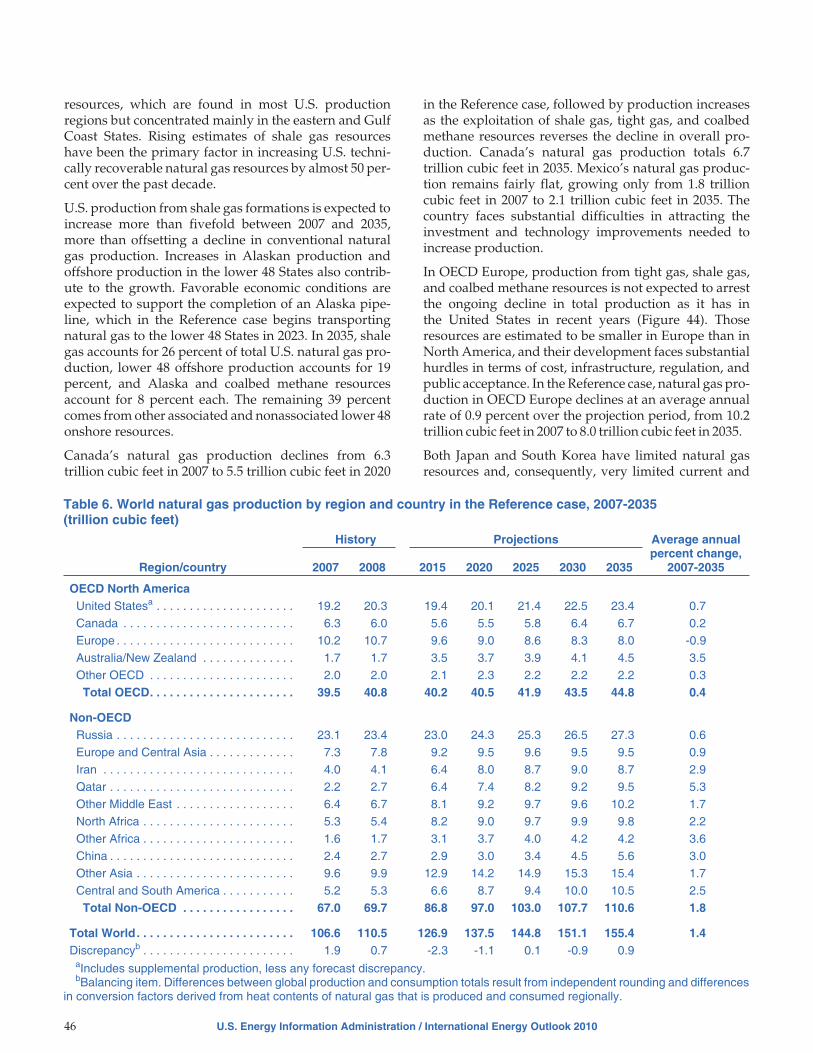
resources, which are found in most U.S. productionregions but concentrated mainly in the eastern and GulfCoast States. Rising estimates of shale gas resourceshave been the primary factor in increasing U.S. techni-cally recoverable natural gas resources by almost 50 per-cent over the past decade.
U.S. production from shale gas formations is expected toincrease more than fivefold between 2007 and 2035,more than offsetting a decline in conventional naturalgas production. Increases in Alaskan production andoffshore production in the lower 48 States also contrib-ute to the growth. Favorable economic conditions areexpected to support the completion of an Alaska pipe-line, which in the Reference case begins transportingnatural gas to the lower 48 States in 2023. In 2035, shalegas accounts for 26 percent of total U.S. natural gas pro-duction, lower 48 offshore production accounts for 19percent, and Alaska and coalbed methane resourcesaccount for 8 percent each. The remaining 39 percentcomes from other associated and nonassociated lower 48onshore resources.
Canada’s natural gas production declines from 6.3trillion cubic feet in 2007 to 5.5 trillion cubic feet in 2020
in the Reference case, followed by production increasesas the exploitation of shale gas, tight gas, and coalbedmethane resources reverses the decline in overall pro-duction. Canada’s natural gas production totals 6.7trillion cubic feet in 2035. Mexico’s natural gas produc-tion remains fairly flat, growing only from 1.8 trillioncubic feet in 2007 to 2.1 trillion cubic feet in 2035. Thecountry faces substantial difficulties in attracting theinvestment and technology improvements needed toincrease production.
In OECD Europe, production from tight gas, shale gas,and coalbed methane resources is not expected to arrestthe ongoing decline in total production as it has inthe United States in recent years (Figure 44). Thoseresources are estimated to be smaller in Europe than inNorth America, and their development faces substantialhurdles in terms of cost, infrastructure, regulation, andpublic acceptance. In the Reference case, natural gas pro-duction in OECD Europe declines at an average annualrate of 0.9 percent over the projection period, from 10.2trillion cubic feet in 2007 to 8.0 trillion cubic feet in 2035.
Both Japan and South Korea have limited natural gasresources and, consequently, very limited current and
46 U.S. Energy Information Administration / International Energy Outlook 2010
Table 6. World natural gas production by region and country in the Reference case, 2007-2035(trillion cubic feet)
Region/country
History Projections Average annualpercent change,
2007-20352007 2008 2015 2020 2025 2030 2035
OECD North AmericaUnited Statesa . . . . . . . . . . . . . . . . . . . . . 19.2 20.3 19.4 20.1 21.4 22.5 23.4 0.7Canada . . . . . . . . . . . . . . . . . . . . . . . . . . 6.3 6.0 5.6 5.5 5.8 6.4 6.7 0.2Europe . . . . . . . . . . . . . . . . . . . . . . . . . . . 10.2 10.7 9.6 9.0 8.6 8.3 8.0 -0.9Australia/New Zealand . . . . . . . . . . . . . . 1.7 1.7 3.5 3.7 3.9 4.1 4.5 3.5Other OECD . . . . . . . . . . . . . . . . . . . . . . 2.0 2.0 2.1 2.3 2.2 2.2 2.2 0.3Total OECD. . . . . . . . . . . . . . . . . . . . . . 39.5 40.8 40.2 40.5 41.9 43.5 44.8 0.4
Non-OECDRussia . . . . . . . . . . . . . . . . . . . . . . . . . . . 23.1 23.4 23.0 24.3 25.3 26.5 27.3 0.6Europe and Central Asia . . . . . . . . . . . . . 7.3 7.8 9.2 9.5 9.6 9.5 9.5 0.9Iran . . . . . . . . . . . . . . . . . . . . . . . . . . . . . 4.0 4.1 6.4 8.0 8.7 9.0 8.7 2.9Qatar . . . . . . . . . . . . . . . . . . . . . . . . . . . . 2.2 2.7 6.4 7.4 8.2 9.2 9.5 5.3Other Middle East . . . . . . . . . . . . . . . . . . 6.4 6.7 8.1 9.2 9.7 9.6 10.2 1.7North Africa . . . . . . . . . . . . . . . . . . . . . . . 5.3 5.4 8.2 9.0 9.7 9.9 9.8 2.2Other Africa . . . . . . . . . . . . . . . . . . . . . . . 1.6 1.7 3.1 3.7 4.0 4.2 4.2 3.6China . . . . . . . . . . . . . . . . . . . . . . . . . . . . 2.4 2.7 2.9 3.0 3.4 4.5 5.6 3.0Other Asia . . . . . . . . . . . . . . . . . . . . . . . . 9.6 9.9 12.9 14.2 14.9 15.3 15.4 1.7Central and South America . . . . . . . . . . . 5.2 5.3 6.6 8.7 9.4 10.0 10.5 2.5Total Non-OECD . . . . . . . . . . . . . . . . . 67.0 69.7 86.8 97.0 103.0 107.7 110.6 1.8
Total World. . . . . . . . . . . . . . . . . . . . . . . . 106.6 110.5 126.9 137.5 144.8 151.1 155.4 1.4Discrepancyb . . . . . . . . . . . . . . . . . . . . . . . 1.9 0.7 -2.3 -1.1 0.1 -0.9 0.9
aIncludes supplemental production, less any forecast discrepancy.bBalancing item. Differences between global production and consumption totals result from independent rounding and differences
in conversion factors derived from heat contents of natural gas that is produced and consumed regionally.

future production. Both countries receive the vast major-ity of their natural gas supplies in the form of importedLNG. In 2007, natural gas production in Japan and SouthKorea accounted for only 5 percent and 1 percent of theirnatural gas consumption, respectively. Although thepresence of substantial deposits of methane hydrates inboth Japan and South Korea has been confirmed, andboth countries are investigating how those resourcescould be safely and economically developed, theIEO2010 Reference case does not include methanehydrate resources in its estimates of natural gasresources, and the development of hydrates on a com-mercial scale is not anticipated during the projectionperiod.
Natural gas production in the Australia/New Zealandregion grows from 1.7 trillion cubic feet in 2007 to 4.5trillion cubic feet in 2035 in the Reference case, at anaverage rate of 3.5 percent per year—the strongestgrowth in natural gas production among OECD regions.In 2007, the Northwest Shelf area of Australia’s Carnar-von Basin accounted for around 56 percent of total pro-duction in the Australia/New Zealand region [7], withmuch of the production used as feedstock at the North-west Shelf LNG liquefaction facility. Other areas andbasins in Australia provided another 35 percent of theregion’s total production in 2007. New Zealand’s naturalgas production accounted for around 9 percent of the2007 regional total.
Coalbed methane, from the Bowen-Surat Basin in east-ern Australia, accounted for between 5 percent and 7percent of total production in Australia in 2007 [8], andits share is certain to grow in the future. The CooperBasin has also been a source of natural gas supply since1969, but its production is in decline. Coalbed methaneproduction from the Bowen-Surat Basin is expected tooffset declines from the Cooper Basin in the future, pro-viding natural gas supplies to satisfy the area’s demandgrowth and to feed proposed LNG export projects.
Non-OECD natural gas production
Middle East production
Four major natural gas producers in the Middle East—Qatar, Iran, Saudi Arabia, and the United ArabEmirates—together accounted for 84 percent of the natu-ral gas produced in the Middle East in 2007. With morethan 40 percent of the world’s proved natural gasreserves, the Middle East accounts for the largestincrease in regional natural gas production from 2007 to2035 (Figure 45) and for nearly one-third of the totalincrement in world natural gas production in the Refer-ence case.
In the IEO2010 Reference case, the strongest growthamong Middle East producers from 2007 to 2035 comesfrom Qatar, where natural gas production increases by7.2 trillion cubic feet, followed by Iran (4.8 trillion cubicfeet of new production) and Saudi Arabia (2.2 trillioncubic feet). Although Iraq is the region’s fastest-growingsupplier of natural gas, at 11.6 percent per year over theprojection, it is a relatively minor contributor to regionalgas supplies. In 2035, Iraq’s natural gas production totalsonly 1.1 trillion cubic feet, or about 4 percent of theMiddle East total.
Iran has the world’s second-largest reserves of naturalgas, after Russia, and currently is the Middle East’slargest natural gas producer. Iran is also the MiddleEast’s largest user of reinjected natural gas for enhancedoil recovery operations. In 2007, Iran reinjected morethan 1 trillion cubic feet of natural gas, or 16 percent of itsgross production. In 2009, Iran began enhanced oilrecovery operations at the Agha-Jari oil field, where itplans to raise oil production by 60,000 barrels per day byinjecting 1.3 trillion cubic feet of natural gas annually,more than doubling the 2007 reinjected volumes [9]. In2020, Iran is estimated to need between 3.7 trillion and7.3 trillion cubic feet of natural gas per year for
U.S. Energy Information Administration / International Energy Outlook 2010 47
1990 2000 2007 2015 2025 20350
2
4
6
8
10
12History Projections
Total
Unconventional
Conventional
Figure 44. OECD Europe natural gas production,1990-2035 (trillion cubic feet)
1990 2000 2007 2015 2025 20350
5
10
15
20
25
30History Projections
Total
Saudi Arabia
Qatar
Iran
Other Middle East
Figure 45. Middle East natural gas production,1990-2035 (trillion cubic feet)

reinjection [10]. The higher estimate is close to the pro-jected total for Iran’s marketed natural gas production in2020. The actual figure for reinjection use, whatever itturns out to be, will have a significant impact on Iran’sfuture marketed natural gas production.
Natural gas production in Saudi Arabia grows at anaverage annual rate of 2.2 percent, from 2.6 trillion cubicfeet in 2007 to 4.8 trillion cubic feet in 2035. The Saudinational oil company, Saudi Aramco, has made severalnatural gas finds in the Persian Gulf that are not associ-ated with oil fields. Three fields, the Karan, Arabiyahand Hasbah, are expected to begin producing in the next5 years, adding at least 1.3 trillion cubic feet of produc-tion when fully operational. Both Arabiyah and Hasbahare offshore, and both are also sour natural gas fields,making them relatively expensive to produce, with anestimated cost of $3.50 to $5.50 per million Btu [11]. TheIEO2010 Reference case assumes that Saudi Arabia’spolicy of reserving natural gas production for domesticuse persists throughout the projection period, and thatno natural gas is exported. Thus, in the long term, pro-duction is more dependent on domestic demand growthand domestic prices than on resource availability.
Non-OECD Europe and Eurasia production
After the Middle East, the world’s second-largestregional increase in natural gas production is expectedin non-OECD Europe and Eurasia, which includesRussia, Central Asia, and non-OECD Europe. In the Ref-erence case, natural gas production in the region as awhole increases from 30.4 trillion cubic feet in 2007 to36.8 trillion cubic feet in 2035 (Figure 46). Russia remainsthe dominant natural gas producer, accounting for morethan 70 percent of the region’s production throughoutthe projection.
In 2007, Russia produced 23.1 trillion cubic feet of natu-ral gas. Preliminary EIA data for 2008 show a 1.4-percent
increase in natural gas production over 2007, to 23.4 tril-lion cubic feet. Early estimates for 2009, however, indi-cate a decline of 12.4 percent (2 to 3 trillion cubic feet) inRussia’s natural gas production from the 2008 total [12].The production decline was due not to a lack ofresources or production capacity, but rather to the globaleconomic downturn and the resultant decline in naturalgas demand in Russia and in its gas export markets,especially those in Europe. Russia’s exports to Europewere down by 24.5 percent in 2009, and its total naturalgas exports were down by almost 9 percent, offset in partby new LNG exports from Sakhalin II to Asian markets[13]. In the IEO2010 Reference case, Russia’s natural gasproduction largely recovers by 2015. Nevertheless, thelong-term outlook remains less optimistic than it was inIEO2009, mainly as a result of lower projections for natu-ral gas demand in Russia and Europe in IEO2010.
The recent natural gas supply-demand balances inEurope and North America, and their implications forthe future, are affecting investment and future produc-tion plans in Russia. Official development plans for thegiant Shtokman field in Russia’s Arctic offshore hadcalled for first pipeline natural gas and LNG to begin toflow in 2014. In early 2010, however, those plans wererevised, pushing the official target date for first pipelineflows back to 2016 and for first LNG flows back to 2017[14]. It had been widely believed that the pipeline flowsfrom the Shtokman field would be used to fill the secondpipe of the Nord Stream export pipeline to Germany andbeyond. With Russian pipeline exports to Europe downso severely in 2009, however, many doubt the need forthe additional export capacity that the second pipelinewould provide. Furthermore, North America had beenthe intended market for LNG exports from theShtokman field, but recent declines in expectations offuture U.S. demand for natural gas imports have ledmany to conclude that North America will be relativelyself-sufficient in natural gas production for some time tocome and will not need large volumes of imported LNG.
Despite the uncertain future of natural gas importdemand in Europe and North America, Russia muststill invest in new fields if it is to realize its goal ofincreasing exports to Asia. Moreover, it will require suchinvestments simply to maintain total natural gas pro-duction levels, because production at its three largestfields (Yamburg, Urengoy, and Medvezh’ye) is indecline [15]. Accordingly, investment is proceeding atthe Bovanenkovo field on Russia’s northern Yamal Pen-insula and at the Chayandinskoye field in eastern Sibe-ria, among other projects. The Bovanenkovo field iscurrently scheduled to start production in the thirdquarter of 2012, ramping up production from an initial0.3 trillion cubic feet per year to an eventual level ofalmost 5 trillion cubic feet per year [16]. Output from theBovanenkovo field is aimed mainly at Western markets,while production from the smaller and more easterly
48 U.S. Energy Information Administration / International Energy Outlook 2010
1992 2000 2007 2015 2025 20350
10
20
30
40History Projections
Total
Non-OECD Europe
Russia
Central Asia
Figure 46. Non-OECD Europe and Eurasia naturalgas production, 1992-2035 (trillion cubic feet)

Chayandinskoye field is aimed at Asian markets. Pro-duction from Chayandinskoye could eventually reach apeak of slightly more than 1 trillion cubic feet per year.Initial production is currently planned for 2016, but theactual start date is dependent on the agreements andinfrastructure that must be in place before the naturalgas can be exported to Asia [17].
Natural gas production in Central Asia (which includesthe former Soviet Republics) grows by 1.0 percent peryear on average, from 6.1 trillion cubic feet in 2007 to 8.2trillion cubic feet in 2035. Much of the growth isexpected to come from Turkmenistan, which already is amajor producer accounting for 40 percent of the region’stotal production in 2007. Turkmenistan is just beginningto develop its recently assessed giant Yolotan field. Itwill be developed in several phases, with each of theinitial four phases adding around 0.4 trillion cubic feet ofannual natural gas production and the first productionexpected in 2010 or 2011 [18]. Initial natural gas produc-tion from the Yolotan field will probably be exported bypipeline to China, with further expansion of Turkmenand Central Asian production dependent on securingmarkets and transit routes to reach those markets. Alsocontributing to Central Asia’s projected productiongrowth is Azerbaijan, which has been planning to bringon line the second phase of natural gas production at itsShah Deniz field. Upon reaching peak production, ShahDeniz will add around 0.7 trillion cubic feet to the coun-try’s annual production.
Africa production
Substantial growth in natural gas production is also pro-jected for Africa, where production increases from 6.8trillion cubic feet in 2007 to 12.7 trillion cubic feet in 2020and 14.0 trillion cubic feet in 2035 (Figure 47). In 2007, 77percent of Africa’s natural gas was produced in NorthAfrica, mainly in Algeria, Egypt, and Libya. West Africaaccounted for another 20 percent of the 2007 total, and
the rest of Africa accounted for 3 percent. Remainingresources are more promising in West Africa than inNorth Africa, which has been producing large volumesof natural gas over a much longer period. Indeed, fasterproduction growth is projected for West Africa, with anaverage annual rate of 4.0 percent, versus 2.2 percent forNorth Africa.
Nigeria is the predominant natural gas producer in WestAfrica, although recent production increases in theregion have also come from Equatorial Guinea, whichbrought an LNG liquefaction facility on line in 2007.Angola also is expected to add to West Africa’s produc-tion in the near term, with its first LNG liquefaction facil-ity, currently under construction, expected to come online in 2012 [19]. Still, because security concerns anduncertainty over terms of access in Nigeria limit produc-tion growth in West Africa, North Africa remains thecontinent’s leading region for natural gas productionover the course of the projection.
Non-OECD Asia production
Non-OECD Asia’s natural gas production increases by8.9 trillion cubic feet from 2007 to 2035 in the Referencecase, with China accounting for 35 percent of the growthand India 24 percent (Figure 48). Another 30 percent ofthe growth is attributed to the Asian LNG-exportingcountries, including traditional exporters Indonesia,Malaysia, and Brunei, as well as Papua New Guinea,which appears poised to become a significant LNGexporter within the next 5 to 10 years.
From 2007 to 2035, China has the largest projectedincrease in natural gas production in non-OECD Asia,from 2.4 trillion cubic feet in 2007 to 5.6 trillion cubic feetin 2035, for an average annual increase of 3.0 percent(Figure 49). Increases in natural gas supplies that are eas-ily accessible account for most of the total productiongrowth between 2007 and 2020. After 2020, continued
U.S. Energy Information Administration / International Energy Outlook 2010 49
1990 2000 2007 2015 2025 20350
5
10
15
History Projections
Total
North Africa
West Africa
Other Africa
Figure 47. Africa natural gas production, 1990-2035(trillion cubic feet)
1990 2000 2007 2020 2025 20350
5
10
15
20
25
China
India
LNG producers
Other Non-OECD Asia
History Projections
Figure 48. Non-OECD Asia natural gas production,1990-2035 (trillion cubic feet)

growth in natural gas production in China comes frommore expensive tight gas, shale gas, and coalbed meth-ane resources, which in 2035 provide more than threetimes as much production as the same three resourcetypes in OECD Europe.
The outlook for unconventional natural gas productionis more positive in China than in OECD Europe first andforemost because China’s geology suggests a greaterunconventional resource potential than in Europe. Fur-ther, although natural gas production from conven-tional resources in China, as in Europe, cannot keep upwith domestic demand, China’s government stronglysupports unconventional gas development, and publicresistance is likely to be less of an impediment in Chinathan in OECD Europe. The outlook for unconventionalnatural gas production is also more positive in Chinathan in the rest of the non-OECD countries, becauseChina is unique among non-OECD nations in havingboth significant unconventional gas potential and insuf-ficient conventional natural gas resources to satisfygrowing demand through 2035.
Natural gas production in India grows at an averageannual rate of 4.0 percent over the projection period, thefastest growth in non-OECD Asia. Most of the growth inIndia’s natural gas production is expected in the nearterm, averaging 11.7 percent per year as total productiongrows from 1.1 trillion cubic feet in 2007 to 2.7 trillioncubic feet in 2015. The increase is due mainly to a singledevelopment. Production from the Dhirubhai-6 block inthe Krishna Godavari Basin (KG-D6 block) began inApril 2009 and reached an annual production rate ofaround 0.8 trillion cubic feet by mid-January 2010 [20].Natural gas production from the KG-D6 block is readyto flow at its plateau rate of just over 1 trillion cubic feetper year as soon as the government-designated custom-ers are ready to receive it. From 2015 to 2035, India’snatural gas production grows much more slowly, by an
average of 1.0 percent per year, as production from olderfields declines.
Natural gas production in the LNG-exporting countriesof non-OECD Asia grows at an average annual rate ofonly 1.6 percent. Indonesia, Malaysia, and Brunei cur-rently export LNG, and Papua New Guinea is on theverge of becoming another regional LNG exporter in thenear term. In 2007, Malaysia and Indonesia togetheraccounted for more than 90 percent of total productionfrom the four countries. In the future, however, signifi-cant production growth is expected for Papua NewGuinea, where several proposed LNG export projects, ifbuilt according to plan, will require more than 0.7 tril-lion cubic feet per year of new natural gas production[21]. Both Malaysia and Indonesia, on the other hand,face declining production from many older fields andmust make substantial investments to maintain currentproduction levels. In the short term, Indonesia’s naturalgas production rises somewhat as the new TangguhLNG export project, which came on line in the secondhalf of 2009, ramps up to full production in 2010 [22].
Central and South America production
Natural gas production in Central and South Americadoubles between 2007 and 2035 (Figure 50). The fastestgrowth is projected for Brazil, averaging 7.4 percent peryear. The majority of Brazil’s current natural gas pro-duction comes from fields located offshore of the Rio deJaneiro and Espírito Santo states in the Campos andEspírito Santo basins, respectively. In addition, numer-ous recent discoveries of oil and natural gas in thesubsalt Santos basin to the southwest of the Camposbasin are expected to increase the country’s natural gasproduction potential. The Merluza and Lagosta fields, apair of smaller natural gas and condensate fields in theSantos basin, currently are producing and sendingnatural gas and liquids to shore via a pipeline that ismore than 100 miles long [23]. By 2015, another pipeline,
50 U.S. Energy Information Administration / International Energy Outlook 2010
1990 2000 2007 2020 2025 20350
2
4
6
Other (conventional)
Tight gas,shale gas,coalbed methane(unconventional)
History Projections
Figure 49. China natural gas production, 1990-2035(trillion cubic feet)
1990 2000 2007 2020 2025 20350
5
10
15
Brazil
Northern producers
Central America and Carribean
Other South America
History Projections
Figure 50. Central and South America natural gasproduction, 1990-2035 (trillion cubic feet)
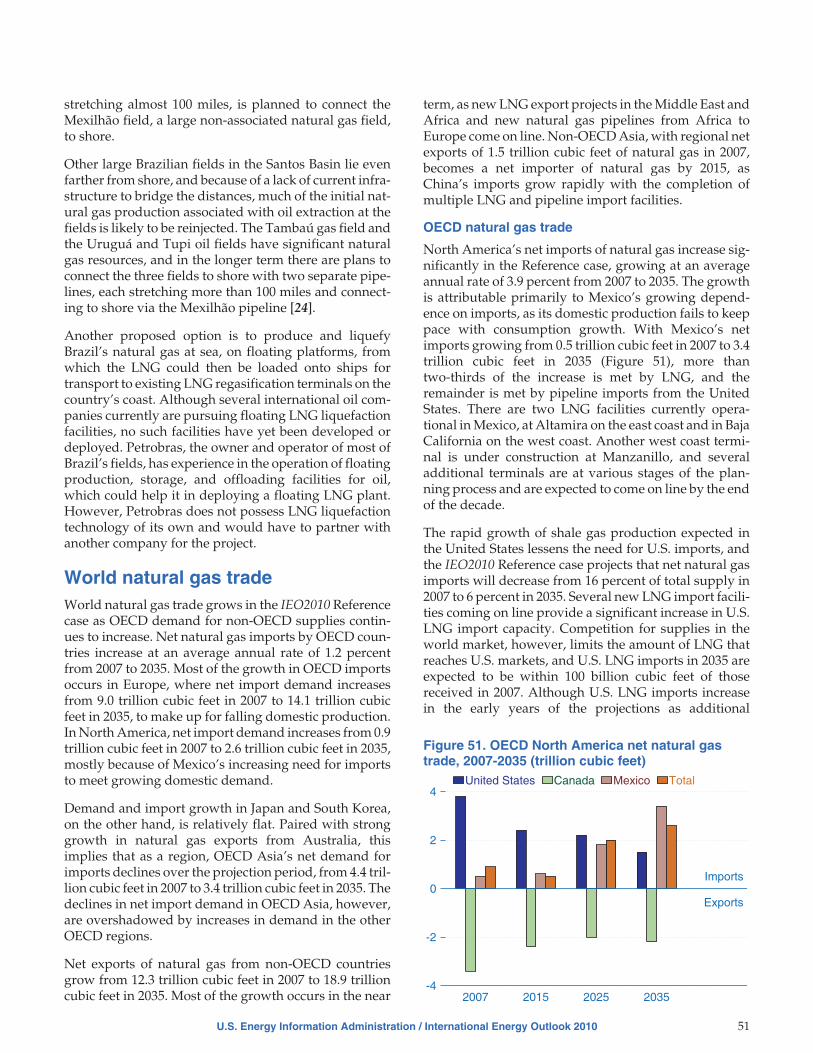
stretching almost 100 miles, is planned to connect theMexilhão field, a large non-associated natural gas field,to shore.
Other large Brazilian fields in the Santos Basin lie evenfarther from shore, and because of a lack of current infra-structure to bridge the distances, much of the initial nat-ural gas production associated with oil extraction at thefields is likely to be reinjected. The Tambaú gas field andthe Uruguá and Tupi oil fields have significant naturalgas resources, and in the longer term there are plans toconnect the three fields to shore with two separate pipe-lines, each stretching more than 100 miles and connect-ing to shore via the Mexilhão pipeline [24].
Another proposed option is to produce and liquefyBrazil’s natural gas at sea, on floating platforms, fromwhich the LNG could then be loaded onto ships fortransport to existing LNG regasification terminals on thecountry’s coast. Although several international oil com-panies currently are pursuing floating LNG liquefactionfacilities, no such facilities have yet been developed ordeployed. Petrobras, the owner and operator of most ofBrazil’s fields, has experience in the operation of floatingproduction, storage, and offloading facilities for oil,which could help it in deploying a floating LNG plant.However, Petrobras does not possess LNG liquefactiontechnology of its own and would have to partner withanother company for the project.
World natural gas tradeWorld natural gas trade grows in the IEO2010 Referencecase as OECD demand for non-OECD supplies contin-ues to increase. Net natural gas imports by OECD coun-tries increase at an average annual rate of 1.2 percentfrom 2007 to 2035. Most of the growth in OECD importsoccurs in Europe, where net import demand increasesfrom 9.0 trillion cubic feet in 2007 to 14.1 trillion cubicfeet in 2035, to make up for falling domestic production.In North America, net import demand increases from 0.9trillion cubic feet in 2007 to 2.6 trillion cubic feet in 2035,mostly because of Mexico’s increasing need for importsto meet growing domestic demand.
Demand and import growth in Japan and South Korea,on the other hand, is relatively flat. Paired with stronggrowth in natural gas exports from Australia, thisimplies that as a region, OECD Asia’s net demand forimports declines over the projection period, from 4.4 tril-lion cubic feet in 2007 to 3.4 trillion cubic feet in 2035. Thedeclines in net import demand in OECD Asia, however,are overshadowed by increases in demand in the otherOECD regions.
Net exports of natural gas from non-OECD countriesgrow from 12.3 trillion cubic feet in 2007 to 18.9 trillioncubic feet in 2035. Most of the growth occurs in the near
term, as new LNG export projects in the Middle East andAfrica and new natural gas pipelines from Africa toEurope come on line. Non-OECD Asia, with regional netexports of 1.5 trillion cubic feet of natural gas in 2007,becomes a net importer of natural gas by 2015, asChina’s imports grow rapidly with the completion ofmultiple LNG and pipeline import facilities.
OECD natural gas trade
North America’s net imports of natural gas increase sig-nificantly in the Reference case, growing at an averageannual rate of 3.9 percent from 2007 to 2035. The growthis attributable primarily to Mexico’s growing depend-ence on imports, as its domestic production fails to keeppace with consumption growth. With Mexico’s netimports growing from 0.5 trillion cubic feet in 2007 to 3.4trillion cubic feet in 2035 (Figure 51), more thantwo-thirds of the increase is met by LNG, and theremainder is met by pipeline imports from the UnitedStates. There are two LNG facilities currently opera-tional in Mexico, at Altamira on the east coast and in BajaCalifornia on the west coast. Another west coast termi-nal is under construction at Manzanillo, and severaladditional terminals are at various stages of the plan-ning process and are expected to come on line by the endof the decade.
The rapid growth of shale gas production expected inthe United States lessens the need for U.S. imports, andthe IEO2010 Reference case projects that net natural gasimports will decrease from 16 percent of total supply in2007 to 6 percent in 2035. Several new LNG import facili-ties coming on line provide a significant increase in U.S.LNG import capacity. Competition for supplies in theworld market, however, limits the amount of LNG thatreaches U.S. markets, and U.S. LNG imports in 2035 areexpected to be within 100 billion cubic feet of thosereceived in 2007. Although U.S. LNG imports increasein the early years of the projections as additional
U.S. Energy Information Administration / International Energy Outlook 2010 51
2007 2015 2025 2035
0
2
4
-2
-4
United States Canada Mexico Total
Imports
Exports
Figure 51. OECD North America net natural gastrade, 2007-2035 (trillion cubic feet)

liquefaction capacity comes on line, they peak at 1.5 tril-lion cubic feet in 2020, then decline through 2035 as theworld market absorbs the additional supplies.
The continuing decline in Canada’s pipeline exports istempered by increases in production of tight gas, shalegas, and coalbed methane, along with LNG imports thatallow Canada to continue exporting pipeline gas to theUnited States. Currently, Canada has one LNG importfacility in operation at St. Johns, New Brunswick, and atleast five others that are either approved or in the plan-ning stages. LNG could play a significant role in Can-ada’s natural gas markets by the end of the projectionperiod, depending on the rate at which natural gas sup-plies can increase. The expected growth in LNG imports,particularly for Mexico and Canada, means that NorthAmerica as a whole moves from a relatively self-contained natural gas market to one that is a growingparticipant in, and increasingly influenced by, the globalnatural gas market.
Natural gas trade involving OECD Europe has recentlyexperienced some major shifts. In 2009, natural gasdemand was down approximately 8 percent from 2008.At the same time, imports of LNG were up 27 percent[25], and imports of Russian pipeline gas were downalmost 25 percent [26]. Continental Europe’s long-termnatural gas contracts have some flexibility in terms ofvolumes, but the prices generally are linked to laggedprices for oil products. Thus, despite the drop indemand following the global economic recession, mostnatural gas prices remained high, with the extremelyhigh oil prices from 2008 continuing to figure into con-tract natural gas prices until the second half of 2009.
The recession and long-expected increases in global sup-plies of LNG combined to push European spot prices fornatural gas well below those of long-term oil-linkedprices, spurring those consumers who could access LNGon the spot market to increase their LNG purchases. InEurope in 2009, oil-linked prices were, at times, twice ashigh as LNG spot prices [27]. Volume flexibility inlong-term contracts was inadequate to deal with thedrop in demand and the increased LNG supplies. As aresult, European consumers accepted less natural gasthan contractual minimums and may have failed to takeas much as $2.8 billion worth of natural gas undertake-or-pay contracts [28].
Contributing to abundant European supplies in 2009were additional LNG imports from Qatar, whichbrought three new liquefaction trains online, and newregasification facilities in the United Kingdom and Italy.Continued growth is expected for natural gas imports,as global LNG supplies continue to expand rapidly over
the next few years and as the Medgaz pipeline fromAlgeria begins exporting gas to Spain in 2010 [29]. Fur-thermore, the Nord Stream pipeline from Russia and theGalsi pipeline from Algeria could push additional natu-ral gas supplies into OECD Europe as soon as 2012 and2014, respectively, according to planned start dates. Inthe IEO2010 Reference case, net natural gas imports toOECD Europe grow on average by 1.6 percent per yearfrom 2007 to 2035.
In OECD Asia, Japan and South Korea continue to bealmost entirely dependent on LNG imports for naturalgas supplies (Figure 52). The two countries continue tobe major players in LNG markets (with Japan represent-ing 41 percent of global LNG imports in 2007 and SouthKorea 14 percent) despite consuming relatively smallamounts of natural gas on a global scale (representing 3and 1 percent, respectively, of world consumption in2007).
Japanese and South Korean companies are also influen-tial in LNG markets as foundation customers15 forgreenfield Pacific liquefaction projects. For example,Japanese and South Korean companies have signed firmcontracts for significant shares of the output from Rus-sia’s Sakhalin liquefaction project, which came on line in2009, as well as from Australia’s Pluto project, which isnear completion, and Australia’s Gorgon LNG project,which is just starting construction in 2010 [30]. In addi-tion, Japanese and South Korean companies have signedeither firm contracts or preliminary agreements withseveral projects that have not yet made final investmentdecisions, including the Wheatstone and Fisherman’sLanding projects in Australia; an ExxonMobil-led pro-ject in Papua New Guinea; and the Kitimat project inCanada. Japanese and South Korean companies have
52 U.S. Energy Information Administration / International Energy Outlook 2010
2007 2015 2025 2035
0
2
4
-2
-4
Japan South Korea Australia/New Zealand
Imports
Exports
Figure 52. OECD Asia net natural gas trade,2007-2035 (trillion cubic feet)
15 A “foundation customer” is a company with a good credit rating that has signed an agreement to buy a certain amount of natural gasfrom a new LNG project at a certain price. By signing contracts with foundation customers, a company trying to develop a new LNG projectis able to show that the project is financially viable and thus is able to obtain financing more readily and move forward with the project.

also taken small equity stakes in several of the projects,and Japan’s Inpex is leading the Ichthys project in Aus-tralia, with a final investment decision expected in early2011 [31].
In 2007, Australia exported 0.7 trillion cubic feet of natu-ral gas from its two operating LNG liquefaction facili-ties—North West Shelf LNG, which draws gas from theCarnarvon Basin off Australia’s northwest coast, andDarwin LNG, which draws gas from the BonaparteBasin north of the Carnarvon Basin. Australia is one ofthe most active areas for future LNG development. Itsexports of natural gas more than double by 2015, to 1.8trillion cubic feet, in the Reference case and continue togrow throughout the projection period. Australia hastwo new liquefaction projects under construction in2010, Pluto and Gorgon, both drawing gas from fields inthe Carnarvon Basin. There are also at least four separateliquefaction projects in eastern Australia that aim toreach final investment decisions in 2010. All are plan-ning to use coalbed methane from the Bowen-SuratBasin as supply, and most are planning to produce firstgas around 2014 or 2015 [32].
Two additional liquefaction projects based off Austra-lia’s northwest coast aim for final investment decisionsin 2010 or 2011. The Wheatstone project would be thefourth independent liquefaction project to draw gasfrom the Carnarvon Basin, and Ichthys LNG would bethe first project to draw gas from the Browse Basin,which lies between the Carnarvon and Bonaparte Basins[33]. Several of the Australian LNG projects have plansto expand, and at least seven other separate liquefactionprojects have been proposed and plan to make finalinvestment decisions at some point after 2011. Not all ofthe proposed projects and expansions are assumed to goforward in the IEO2010 Reference case, because some ofthem appear to be competing for the same reserves tosupply their facilities.
Non-OECD natural gas trade
Russia’s net exports of natural gas grow from 6.3 trillioncubic feet in 2007 to 9.7 trillion cubic feet in 2035 in thereference case (Figure 53). Despite the recent dramaticdeclines in demand for Russian natural gas in Europe,construction of the first pipe of the new Nord Streampipeline is moving forward. Construction on the Rus-sian onshore sections began in 2009, and construction onthe offshore portions of the first line is set to begin inApril 2010, with first natural gas exports planned for theend of 2011. When complete, the first line will carry 1.0trillion cubic feet of natural gas per year from Russia,across the Baltic Sea to Germany, bypassing easternEuropean transit states with which Russia has had pric-ing and payment disputes in the past. Russia has severalother proposed export pipeline projects, including plansfor a second parallel pipe on the Nord Stream pipelineby the end of 2012 and for the South Stream pipeline,which would carry natural gas across the Black Sea,bypassing Ukraine on its way to European markets [34].
A pipeline explosion in April 2009 forced Turkmenistanto discontinue all natural gas exports to Russia [35].With demand in Russia and Europe down, Russia didnot need the contracted volumes, and flows were notresumed at any point in 2009 while Russia tried to nego-tiate better contract prices and lower contract volumes.As a result, natural gas exports from Turkmenistan toRussia totaled only about 0.4 trillion cubic feet in2009, just one-quarter of the approximately 1.6 trillioncubic feet traded in 2008 [36]. Historically, Russia hasaccounted for more than 85 percent of Turkmenistan’stotal natural gas exports. Turkmenistan was estimatedto have been losing $1 billion per month during the haltin Russian imports [37]. The remaining 12 to 13 percentof Turkmen natural gas exports in 2007 and 2008 wasdelivered to Iran [38].
Turkmenistan has been pursuing alternative exportmarkets and routes, with developments moving quicklysince the cut-off of Russian imports in April 2009. In July2009, Turkmenistan and Iran agreed to increase Iraniancontractual natural gas volumes from 0.3 trillion cubicfeet to 0.5 trillion cubic feet and to build a newcross-border pipeline. It may take some time to reach fullcontractual volumes, however, as actual flows havenever reached the previous contractual levels sinceexports began in 1997 [39]. An existing pipeline runsfrom the Korpedzhe field in Turkmenistan to the townof Kurt Kui in northeastern Iran. The first phase of thenew pipeline, completed in December 2009, can carry 0.2trillion cubic feet per year from Turkmenistan’s sizableDauletabad field to a natural gas processing plant justinside Iran’s northern border. In the second phase, withconstruction scheduled to begin in 2010 and completionexpected 1 to 2 years later, the pipeline will be extendedto reach more of the Iranian market.
U.S. Energy Information Administration / International Energy Outlook 2010 53
2007 2015 2025 2035
0
4
-4
-8
-12
Russia Central Asia Non-OECD Europe
Imports
Exports
Figure 53. Non-OECD Europe and Eurasianet natural gas trade, 2007-2035 (trillion cubic feet)

In late 2009, Turkmenistan completed the first line of atwo-line pipeline to China, which runs from theBagtyyarlyk, Saman-Depe, and Altyn Asyr natural gasfields in Turkmenistan through Uzbekistan andKazakhstan, before connecting with China’s secondWest-East pipeline in Xinjiang province [40]. The firstline has a capacity of 0.7 trillion cubic feet per year, butinitial flows are likely to be much lower, because theWest-East pipeline that will link it to more of China’sdemand centers will not be complete until 2012. By thattime, the second line of the Central Asia-China pipelineshould be complete, bringing total cross-border capacityto 1.4 trillion cubic feet per year [41]. Additional exportvolumes are expected to come from Turkmenistan’sgiant South Yolotan-Osman field and could also comefrom fields in Kazakhstan.
In 2005, China had no imports of natural gas and none ofthe infrastructure necessary to accommodate imports(Figure 54). In 2007, China’s net imports amounted tojust 1.8 percent of its total natural gas consumption, with85 percent of those imports coming from a single coun-try, Australia. At the time, China had just one operatingimport facility, China National Offshore Oil Corpora-tion’s LNG regasification terminal in Guangdong prov-ince, and just one long-term import contract withAustralia. In the IEO2010 Reference case, China meets43 percent of its consumption in 2035 with importednatural gas. To meet its future import demands, China isactively pursuing multiple potential sources for naturalgas imports.
At the end of 2009, China had three LNG import termi-nals in operation, two under construction, and severalmore proposed or in various stages of development. Atthat time, China was importing natural gas underlong-term contract from four different countries—Aus-tralia, Indonesia, Malaysia, and Qatar—with no singlecountry signed up to provide more than 37 percent ofthe total contracted volume. Chinese companies have
signed contracts to increase imports from Australia,Qatar, and Malaysia, but Australia is likely to remainChina’s main LNG supplier because of its geographicproximity and its large and growing list of upcomingLNG export projects. Chinese companies have alsosigned agreements to bring in LNG from Iran and PapuaNew Guinea. Although there has been little progress onIran’s LNG projects, those in Papua New Guinea areprogressing quickly and could be delivering natural gasby 2015.
At the same time that China is pursuing multiplesources for LNG imports, it is pursuing multiple sourcesfor pipeline natural gas imports. As noted above, thefirst line of China’s first natural gas import pipeline,completed in late 2009, will transport supplies fromTurkmenistan and Kazakhstan. Another new pipelinefrom Myanmar, scheduled for completion in 2013, willcarry 0.4 trillion cubic feet of natural gas per year fromMyanmar’s offshore fields in the Bay of Bengal toKunming in China’s Yunnan province [42].
China and Russia continue to discuss future natural gaspipeline connections between the two countries. Theysigned an agreement in 2006 stating that natural gasdeliveries should begin by 2011, and then in 2009 theysigned another agreement stating that deliveries shouldbegin by 2014 or 2015. Both agreements envision twoseparate pipelines: an eastern line and a western line. Noagreement has been reached with regard to prices andvolumes, and the lack of agreement on prices has beenthe main impediment to the project’s progress. The 2006agreement suggested volumes of 1.1 to 1.4 trillion cubicfeet per year of natural gas. In the 2009 agreement, how-ever, the volumes under discussion grew to 2.5 to 2.8 tril-lion cubic feet per year [43].
In 2007, India imported 0.4 trillion cubic feet of naturalgas through its two operating LNG regasification termi-nals, accounting for about 24 percent of the natural gasconsumed in India that year. In the IEO2010 Referencecase, India’s imports as a share of its total natural gasconsumption fall to 14 percent in 2015, as new produc-tion from the Krishna Godavari Basin comes on line. Inthe long term, however, demand growth outpaces pro-duction growth: consumption grows by 1.8 percent peryear from 2015 to 2035, while domestic productiongrows by 1.0 percent per year. Accordingly, India isexpected to continue expanding its LNG importinfrastructure.
Although India has discussed pipeline projects withIran, Central Asia, and Myanmar in the past, there aresignificant barriers to those plans, including politics,geography, and costs. Two LNG regasification terminalswere operating in India in 2007, at Dahej and Hazira. Inaddition, a third terminal at Dabhol is to be brought par-tially on line in 2010, and a fourth, under construction atKochi, is expected to come on line in 2012. Numerous
54 U.S. Energy Information Administration / International Energy Outlook 2010
2007 2015 2025 2035
0
2
4
-2
-4
China India LNG exporters Other Non-OECD Asia
Imports
Exports
Figure 54. Non-OECD Asia net natural gas trade,2007-2035 (trillion cubic feet)

other facilities have been proposed, but progress hasbeen hindered, first by difficulties in finding long-termsupplies at acceptable prices and more recently by await-and-see attitude in the Indian natural gas industryas participants wait to see how quickly production fromthe Krishna Godavari field will be absorbed.
In 2007, three countries in non-OECD Asia—Indonesia,Malaysia, and Brunei—had LNG export facilities. Inaddition, Papua New Guinea is preparing to become anLNG exporter. There are several LNG liquefaction pro-jects proposed for Papua New Guinea. At the end of2009, a project led by ExxonMobil became the first toreach a final investment decision [44]. Construction is setto begin in 2010, and first gas is expected in 2014. Twoliquefaction trains are planned, with total annualexports of 0.3 trillion cubic feet of natural gas. In themid-term, growth in exports from Papua New Guineaand Indonesia’s Tangguh LNG, which came on line in2009, increases net exports from these Asian producersas a region. Production from the Arun and Bontang LNGfacilities currently in operation in Indonesia, however, isexpected to continue declining [45]. Indonesia has plansto build at least one LNG regasification facility on itsown shores, which would further decrease net exportsfrom the region. In the Reference case net exports fromthese four countries, as a region, decline from 2.6 trillioncubic feet in 2007 to 2.1 trillion cubic feet in 2035.
Qatar is the world’s largest LNG exporter. Its total LNGexports grew by 17.5 percent per year on average from2000 to 2007 and by another 30.6 percent from 2007 to2008. In the IEO2010 Reference case, Qatar’s LNGexports grow throughout the projection period. Most ofthe growth is projected for the 2007-2015 period, asQatar brings on line six mega-sized liquefaction trains.Each train has the capacity to produce the equivalent of0.36 trillion cubic feet of natural gas per year for export.The first of the six liquefaction trains came on line in2009, and the last is scheduled for completion in 2011.
Qatar’s natural gas exports grow by an estimated aver-age of 13.5 percent per year from 2007 to 2015 in theReference case (Figure 55), then slow to an averageincrease of just 2.1 percent per year after 2015, when pro-jects currently under construction will have been com-pleted. Because of a current moratorium on furtherdevelopment from the North Field, no new projects arebeing initiated. The moratorium was put in place in 2005in order to give Qatar a chance to assess the effect of theongoing ramp-up in production on the North Fieldbefore it commits to further production increases. Ori-ginally set to expire in 2008, the moratorium has recentlybeen extended to 2014 [46].
If Qatar decides to lift the moratorium on North Fielddevelopment in 2014, its stated development priority isto ensure that it can meet long-term domestic natural gasneeds for power generation, water desalination, and
local industry. Only after those needs are met will it con-sider further increases in exports, and any increases areexpected to come primarily from optimization of currentfacilities [47]. The six mega-trains currently beingbrought on line are the largest liquefaction trains in theworld, and they employ several new technologies.Although the new technologies have contributed to thesometimes problematic commissioning process, theyalso are likely to provide opportunities for increasingoperating capacity through process optimization and“de-bottlenecking” operations [48].
Iran, which shares the North Field/South Pars Fieldwith Qatar, has the world’s second-largest natural gasreserves (behind Russia but ahead of Qatar). Despite itsabundant reserves, Iran was a net importer of naturalgas in 2007, importing slightly more from Turkmenistanthan it exported to Turkey. Although its first LNGexport plant is under construction, Iran is without inter-national partners and without any obvious source forobtaining the actual liquefaction technology, which itcurrently does not possess domestically [49]. Otherexport projects continue to be discussed, but as a resultof international and internal politics there has been littleprogress on most projects. In the Reference case, Iranbecomes a net exporter of natural gas with a combina-tion of LNG and pipelines through Turkey to Europe,but it does not become a major exporter, because domes-tic demand and demand for reinjected gas limit itsexports despite its massive resources.
Yemen began production at its first LNG export plant in2009. At full capacity, the plant is expected to export theequivalent of 0.3 trillion cubic feet of natural gas peryear. Two additional countries in the Middle East—Oman and the United Arab Emirates (UAE)—alsoexport LNG. Both countries also import natural gas viapipeline from Qatar, and while the UAE maintained aslim margin as a net exporter in 2007, preliminary datafor 2008 indicate that it became a net importer. The
U.S. Energy Information Administration / International Energy Outlook 2010 55
2007 2015 2025 2035
0
2
-2
-4
-6
-8
Imports
Exports
Qatar Iran Arabian producers Other Middle East
Figure 55. Middle East net natural gas trade,2007-2035 (trillion cubic feet)

IEO2010 Reference case projects a similar trend for theArabian Peninsula producers, which include Kuwait,Oman, UAE, and Yemen. As a group, they exported atotal of 0.5 trillion cubic feet of natural gas in 2007; but by2030 the region becomes a net importer of natural gas,and in 2035 its net imports total 0.3 trillion cubic feet.
In addition to pipeline natural gas from neighboringcountries, countries in the Arabian Peninsula are begin-ning to import small volumes of LNG. In 2010, the emir-ate of Dubai in the UAE will begin importing LNG tomeet peak summer natural gas demand via a floatingLNG regasification terminal. A similar facility allowedKuwait to begin importing natural gas in the summer of2009, also to meet seasonal peak demand [50].
In 2007, North Africa exported almost 3 trillion cubicfeet of natural gas (Figure 56), or 56 percent of its pro-duction, with about one-half of the exports coming fromAlgeria, Egypt, and Libya via pipelines to Spain, Italy,and parts of the Middle East. The remainder wasexported as LNG from liquefaction facilities in Algeria,Egypt, and Libya.
Algeria is in the process of expanding its natural gasexport capacity both by pipeline and from LNG termi-nals. The Medgaz pipeline from Algeria to Spain isexpected to come on line in mid-2010, with sufficientcapacity to carry 0.3 trillion cubic feet of natural gas peryear. Two liquefaction projects are also progressing inAlgeria: the Gassi Touil project and a new liquefactiontrain at the existing Skikda export facility [51]. Togetherthey are expected to increase Algeria’s LNG exportcapacity by 0.4 trillion cubic feet per year by 2013. Inaddition, the Galsi pipeline from Algeria to Italy isplanning to make a final investment decision before theend of 2010 and to initiate gas flow on a 0.4 trillion cubicfoot per year pipeline by 2014 [52].
Any additional major expansions of export capacityfrom North Africa are projected to be dependent on the
Trans-Sahara natural gas pipeline. The pipeline, if built,would stretch 2,800 miles to bring natural gas fromNigeria, across Niger, and connecting in Algeria toexport pipelines to Europe. The Trans-Sahara pipelinewas given the official go-ahead in 2009, having beendeclared economically and technically feasible, and 2015was set as the official targeted start date. However, theproject still faces significant security issues and has notyet secured financing.
As recently as 2007, South America was an almostentirely self-contained market for natural gas, with nomeans of importing gas to the continent (Figure 57) andonly one avenue for exporting it: the LNG liquefactionfacilities on the island of Trinidad and Tobago. Sincethen, natural gas in South America has become increas-ingly globalized. In late 2008, Brazil opened its first float-ing LNG storage and regasification facility, the Pecemterminal in the country’s northeast. A second floatingLNG regasification unit followed in 2009 at the Guana-bara Bay terminal in the southeast [53]. Brazil also hasproposals to employ floating LNG liquefaction at its off-shore subsalt natural gas fields. The primary goal of theoffshore liquefaction project is to bring gas to Brazil’sown regasification terminals, exporting it only whenthere is excess supply.
In the IEO2010 Reference case, Central and South Amer-ica’s northern natural gas producers (Colombia, Ecua-dor, Trinidad and Tobago, and Venezuela) account formost of the region’s net exports, which increase from 0.7trillion cubic feet in 2007 to 1.8 trillion cubic feet in 2035.The rest of South America—mainly, Bolivia, Argentina,Chile, and Peru—was a net natural gas exporting regionin 2007, with 0.4 trillion cubic feet of natural gasexported from Bolivia to Brazil. However, in the Refer-ence case, increases in Brazil’s domestic productiondiminish the need for Bolivian supplies. In addition,LNG imports to Argentina, Chile, and possibly Uruguaymore than offset exports from Peru, where an LNG
56 U.S. Energy Information Administration / International Energy Outlook 2010
2007 2015 2025 2035
0
2
-2
-4
-6
-8
North Africa West Africa Other Africa Total Africa
Imports
Exports
Figure 56. Africa net natural gas trade, 2007-2035(trillion cubic feet)
2007 2015 2025 2035
0
1
-1
-2
-3
Brazil Northern producers Other South America
Imports
Exports
Figure 57. Non-OECD Central and South Americanet natural gas trade, 2007-2035 (trillion cubic feet)

project is likely to come on line in 2011 with an exportcapacity of 0.2 trillion cubic feet per year.
As of January 2010, there were two LNG import facilitiesoperating in South America outside Brazil. The first, inArgentina, came on line in 2008 with a nominal capacityof 0.1 trillion cubic feet per year. The second, atQuintero, Chile, opened in 2009 and brought theregion’s total import capacity to 0.3 trillion cubic feet[54]. Chile’s second regasification facility is currentlyunder construction at Mejillones, and additional importcapacity has been proposed for Uruguay and Argentina.There is no additional export capacity proposed for theregion.
World natural gas reservesAlmost three-quarters of the world’s natural gasreserves are located in the Middle East and Eurasia(Figure 58). Russia, Iran, and Qatar together accountedfor about 55 percent of the world’s natural gas reservesas of January 1, 2010 (Table 7).
Historically, world natural gas reserves have generallytrended upward (Figure 59). As of January 1, 2010, theworld’s total proved natural gas reserves, as reported byOil & Gas Journal,16 were estimated at 6,609 trillion cubicfeet—355 trillion cubic feet (6 percent) higher than theestimate of 6,254 trillion cubic feet for 2009 [55].
The largest increases in reported natural gas reserves in2010 were for Turkmenistan and Australia. In Turk-menistan, natural gas reserves are now estimated at
U.S. Energy Information Administration / International Energy Outlook 2010 57
2,658
2,170
539
495
319
267
161
Middle East
Eurasia
Asia
Africa
North America
Central and South America
Europe
0 1,000 2,000 3,000
World total:6,609 trillion cubic feet
Figure 58. World natural gas reserves bygeographic region as of January 1, 2010(trillion cubic feet)
Source: Oil & Gas Journal.
Table 7. World natural gas reserves by countryas of January 1, 2010
Country
Reserves(trillion
cubic feet)Percent ofworld total
World . . . . . . . . . . . . . . . . . 6,609 100.0Top 20 Countries. . . . . . . . 6,003 90.8Russia . . . . . . . . . . . . . . . . 1,680 25.4Iran . . . . . . . . . . . . . . . . . . 1,046 15.8Qatar . . . . . . . . . . . . . . . . . 899 13.6Turkmenistan . . . . . . . . . . 265 4.0Saudi Arabia . . . . . . . . . . . 263 4.0United States. . . . . . . . . . . 245 3.7United Arab Emirates . . . . 210 3.2Nigeria. . . . . . . . . . . . . . . . 185 2.8Venezuela . . . . . . . . . . . . . 176 2.7Algeria . . . . . . . . . . . . . . . . 159 2.4Iraq . . . . . . . . . . . . . . . . . . 112 1.7Australia . . . . . . . . . . . . . . 110 1.7China. . . . . . . . . . . . . . . . . 107 1.6Indonesia. . . . . . . . . . . . . . 106 1.6Kazakhstan . . . . . . . . . . . . 85 1.3Malaysia . . . . . . . . . . . . . . 83 1.3Norway . . . . . . . . . . . . . . . 82 1.2Uzbekistan . . . . . . . . . . . . 65 1.0Kuwait . . . . . . . . . . . . . . . . 63 1.0Canada . . . . . . . . . . . . . . . 62 0.9
Rest of World. . . . . . . . . . . 606 9.2
Source: Oil & Gas Journal.
1980 1985 1990 1995 2000 2005 20100
2,500
5,000
7,500Total
Other Non-OECD
Non-OECD Europe and Eurasia
OECD
Figure 59. World natural gas reserves by region,1980-2010 (trillion cubic feet)
Sources: International Petroleum Encyclopedia and Oil &Gas Journal.
16 Proved reserves, as reported by the Oil & Gas Journal, are estimated quantities that can be recovered under present technology andprices. Natural gas reserves reported by the Oil & Gas Journal are compiled from voluntary survey responses and do not always reflect themost recent changes. U.S. proved reserves of natural gas are reported by the U.S. Energy Information Administration and are defined as theestimated quantities of natural gas reserves as of December 31, 2009, which analysis of geological and engineering data demonstrates withreasonable certainty to be recoverable in future years from known reservoirs under existing economic and operating conditions. Significantnatural gas discoveries made in 2009 are not likely to be reflected in the reported reserves.

265 trillion cubic feet, an increase of 171 trillion cubic feet(182 percent) over its 2009 proved reserves, followingreappraisals of the giant South Yolotan-Osman gas field[56]. The reserves in the South Yolotan-Osman field arenow estimated at between 141 and 494 trillion cubic feet,making it the fifth-largest natural gas field in the world[57].
In Australia, reserve estimates were revised upward by80 trillion cubic feet, from 30 trillion cubic feet to 110trillion cubic feet. The increase is attributed to the report-ing of reserves under the Australian government’sMcKelvey reporting system rather than the traditionalpetroleum industry classification.17 Smaller but still sub-stantial increases were reported for Iran and China. Iranadded an estimated 54 trillion cubic feet, a 5-percentincrease over 2009 reserves, and China added 27 trillioncubic feet, a 34-percent increase. In the Middle East,Qatar and Saudi Arabia added 7 trillion cubic feet and5 trillion cubic feet, respectively. In North America, theUnited States and Canada added a combined 11 trillioncubic feet. In South America, Venezuela added 5 trillioncubic feet. Declines in natural gas reserves werereported for Trinidad and Tobago (a decrease of 3trillion cubic feet, or 18 percent) and the United King-dom (a decrease of almost 2 trillion cubic feet, or 15percent).
Despite high rates of increase in natural gas consump-tion, particularly over the past decade, the aboveincreases in reserves imply that reserves-to-productionratios for most regions have remained substantial.Worldwide, the reserves-to-production ratio is esti-mated at 60 years [58]. By region, the highest ratios areabout 46 years for Central and South America, 72 yearsfor Russia, 68 years for Africa, and more than 100 yearsfor the Middle East.
References
58 U.S. Energy Information Administration / International Energy Outlook 2010
1. N. Higashi, Natural Gas in China, Market Evolutionand Strategy, International Energy Agency (Paris,France, June 2009), p. 9.
2. LNG Daily, “Terminal Tracker Asia” (August 18,2009), p. 7.
3. “Brazil Inaugurates Its First LNG Terminal,” Oil &Gas Journal (August 26, 2008), web site www.ogj.com (subscription site).
4. “LNG Project Inventory: South America,” Zeus Liq-uefied Natural Gas Report, Vol. 19, No. 6 (March 25,2009), pp. 24-25
5. “Two LNG Terminals Receive Commissioning Car-goes,” Oil & Gas Journal, Vol. 107, No. 27 (July 20,2009), p. 35; and “Americas To See LNG TerminalsCommissioned in June,” Oil & Gas Journal, Vol. 107,No. 20 (May 25, 2009), p. 33; web site www.ogj.com(subscription site).
6. N. Crooks, “Minister: LNG Plant Could Be Opera-tional by 2013,” Business News Americas (June 18,2009), web site www.bnamericas.com (subscriptionsite).
7. Australian Bureau of Agricultural and ResourceEconomics, Australian Mineral Statistics (Canberra,Australia, published quarterly), “Table 18. Petro-leum Production, by Basin” (June, September, andDecember Quarters 2007, March Quarter 2008), website http://pandora.nla.gov.au/tep/24607.
8. Australian Bureau of Agricultural and ResourceEconomics, Energy in Australia 2009 (Canberra,Australia, April 2009), Table 22, p. 48, “AustralianGas Production by State.” Note: For the 2006-2007Australian fiscal year (1 July 2006 to 30 June 2007),coalbed methane accounted for 5.3 percent of totalproduction. For the 2007-2008 fiscal year, coalbedmethane accounted for 7.3 percent of totalproduction.
9. U.S. Energy Information Administration, “CountryAnalysis Briefs: Iran” (Washington, DC, January2010), web site www.eia.gov/emeu/cabs/Iran/Background.html.
10. F. Fesharaki and S. Adibi, “Iran’s Oil and GasIndustry: Short and Long Term Drivers Impactingthe Future of Petroleum Production and ExportRevenues,” FACTS Global Energy (August 2009), pp.9-10.
11. U.S. Energy Information Administration, “CountryAnalysis Briefs: Saudi Arabia” (Washington, DC,November 2009), web site www.eia.gov/emeu/cabs/Saudi_Arabia/ Background.html.
12. “Gazprom 2010 Selling, Spending Goals,” WorldGas Intelligence, Vol. 21, No. 2 (January 13, 2010), pp.2-3.
13. “Gazprom 2010 Selling, Spending Goals,” WorldGas Intelligence, Vol. 21, No. 2 (January 13, 2010), pp.2-3.
14. “Russian Aims for LNG Diversity,” World Gas Intel-ligence, Vol. 21, No. 6 (February 10, 2010), p. 2.
15. IHS Global Insight, Inc., European Natural Gas Sup-ply and Demand Report (Lexington, MA, January2009), p. 35.
17 Geosciences Australia reports petroleum resources under two classification systems: the traditional industry classification and theMcKelvey classification. For further information, see web site www.ga.gov.au/oceans/pub_reports.jsp. Use of different reporting systemsunderscores the inherent uncertainty associated with the reported world reserves estimates. Definitions may vary among country reports,with potentially substantial impacts on the reported levels of reserves.

U.S. Energy Information Administration / International Energy Outlook 2010 59
16. W. Powell, “Russia Looks Likely To Miss Its Tar-gets,” Platts International Gas Report, No. 627 (July 6,2009), p. 4.
17. M. Smedley, “IEA Study of Giant Gasfields Sug-gests Rapid Decline Rates,” World Gas Intelligence,Vol. 20, No. 52 (December 23, 2009), p. 8.
18. M. Smedley, “IEA Study of Giant Gasfields Sug-gests Rapid Decline Rates,” World Gas Intelligence,Vol. 20, No. 52 (December 23, 2009), p. 8.
19. “Doubt Surrounds New Angolan Gas Law,” WorldGas Intelligence, Vol. 20, No. 14 (April 8, 2009), pp.4-5.
20. “India’s Reliance Trims Plans in Price Protest,”World Gas Intelligence, Vol. 21, No. 2 (January 13,2010), p. 4.
21. “PNG Eyes Ambitious Role in Asian LNG,” WorldGas Intelligence, Vol. 21, No. 6 (February 10, 2010), p.4.
22. “BP MIGAS: Tangguh To Achieve Full Capacity in2010,” Zeus Liquefied Natural Gas Report, Vol. 20, No.1 (January 13, 2010), p. 19.
23. Wood Mackenzie Pathfinder, “International Explo-ration and Production Database” (First Quarter2010), web site www.woodmacresearch.com/cgi-bin/wmprod/portal/energy/overview.jsp?overview_title=PathFinder+-+Basin+Shapefile&productOID=664098 (subscription site).
24. Wood Mackenzie Pathfinder, “International Explo-ration and Production Database” (First Quarter2010), web site www.woodmacresearch.com/cgi-bin/wmprod/portal/energy/overview.jsp?overview_title=PathFinder+-+Basin+Shapefile&productOID=664098 (subscription site).
25. E. Chan, “Horizon: Coming in 2010: The Full Impactof Lots More Flexible LNG,” World Gas Intelligence(February 17, 2010), p. 8.
26. “Gazprom 2010 Selling, Spending Goals,” WorldGas Intelligence (January 13, 2010), p. 3.
27. “Gazprom Hits Take-or-Pay Dirt,” Platts Interna-tional Gas Report (October 26, 2009), p. 5.
28. “Gazprom’s Kinder, Gentler Strategy,” World Gasintelligence (January 27, 2010), p. 3.
29. M. Smedley and J. Junnola, “European Irony: NewPipes With Lots of Gas But No Demand,” World GasIntelligence, Vol. 21, No. 5 (February 3, 2010), p. 8.
30. U.S. Energy Information Administration, “CountryAnalysis Briefs: Sakhalin Island” (Washington, DC,January 2010), web site www.eia.gov/emeu/cabs/Sakhalin/Background.html; and “As Expected,Chevron Approves Gorgon, Makes History,” ZeusLiquefied Natural Gas Report, Vol. 19, No. 18 (Septem-ber 18, 2009), pp. 17-18.
31. T. Grieder, IHS Global Insight, “Japan: CountryReports: Oil & Gas” (January 11, 2010), web sitewww.ihsglobalinsight.com (subscription site); andIHS Global Insight, “Energy—Analysis: Australia:INPEX Delays FID for Ichthys LNG Project in Aus-tralian City of Darwin” (December 15, 2009), website www.ihsglobalinsight.com (subscription site).
32. R. Al-Rikabi, “Global Recession Complicates Aus-tralian, PNG LNG Projects,” World Gas Intelligence,Vol. 20, No. 8 (February 25, 2009), p. 8.
33. “Australia Acts Tough on Leases,” World Gas Intelli-gence, Vol. 20, No. 52 (December 23, 2009), pp. 1-2.
34. “Nord Stream Finds Financing,” World Gas Intelli-gence, Vol. XXI, No. 4 (January 27, 2010), p. 2.
35. “Russia Set To Resume Turkmen Imports,” WorldGas Intelligence, Vol. 21, No. 1 (January 6, 2010), p. 2.
36. S Adibi, “Role of Turkmen Gas in Middle East andAsian Gas Markets: How Much Gas Will Be Sup-plied from Turkmenistan,” FACTS Global Energy(February 2010), p. 3.
37. “Turkmenistan Advances Gas Line,” Oil Daily(August 14, 2009), p. 7.
38. The BP Statistical Review of World Energy 2009 (June2009) and BP Statistical Review of World Energy 2008(June 2008) report flows of 6.50 billion cubic metersfor 2008 and 6.10 billion cubic meters for 2007. EIAdata show total exports of approximately 48.51 bil-lion cubic meters for 2008 and 49.41 billion cubicmeters for 2007.
39. S. Adibi, “Role of Turkmen Gas in Middle East andAsian Gas Markets: How Much Gas Will Be Sup-plied from Turkmenistan,” FACTS Global Energy(February 2010), p. 1.
40. S. Adibi, “Role of Turkmen Gas in Middle East andAsian Gas Markets: How Much Gas Will Be Sup-plied from Turkmenistan,” FACTS Global Energy(February 2010), p. 2.
41. S. Adibi, “Role of Turkmen Gas in Middle East andAsian Gas Markets: How Much Gas Will Be Sup-plied from Turkmenistan,” FACTS Global Energy(February 2010), p. 2.
42. “Asia Pacific LNG Monthly,” FACTS Global Energy(July 2009) p. 9.
43. “Russia Going After China Deal—Hard,” World GasIntelligence, Vol. 20, No. 41 (October 14, 2009), p. 4.
44. “PNG Eyes Ambitious Role in Asian LNG,” WorldGas Intelligence, Vol. 21, No. 6 (February 10, 2010), p.4.
45. “Indonesia’s Inward Looking LNG Strategy,” WorldGas Intelligence, Vol. 20, No. 8 (February 25, 2009), p.3.

60 U.S. Energy Information Administration / International Energy Outlook 2010
46. S. Ciszuk, IHS Global Insight, Inc., “Qatar: CountryReports: Oil & Gas: Upstream” (February 24, 2010),web site www.globalinsight.com (subscriptionsite).
47. N. al Harthy, “North Field Gas Moratorium To StayUntil 2014,” The Peninsula (posted December 8,2009), web site www.thepeninsulaqatar.com.
48. M. Smedley, “Horizon: Size of Liquefaction TrainsKeeps Growing—But Should It?” World Gas Intelli-gence (June 6, 2007), p. 8.
49. IHS Global Insight, “Iran: ONGC, Hinduja TurnDown Request for US $1-bil. LNG DealDown-Payment from Iran” (November 24, 2009),web site www.ihsglobalinsight.com (subscriptionsite).
50. “Kuwait’s LNG Future,” World Gas Intelligence, Vol.21, No. 7 (February 17, 2010), p. 5.
51. “Khelil’s Bright Algerian Export Picture,” World GasIntelligence, Vol. 20, No. 41 (October 14, 2009), pp.2-3.
52. M. Smedley and J. Junnola, “European Irony: NewPipes With Lots of Gas But No Demand,” World GasIntelligence, Vol. 21, No. 5 (February 3, 2010), p. 8.
53. U.S. Energy Information Administration, “CountryAnalysis Briefs: Brazil” (Washington, DC, Septem-ber 2009), web site www.eia.gov/emeu/cabs/Brazil/Background.html.
54. “LatAm LNG Import Boost Forecast,” Platts Interna-tional Gas Report (July 20, 2009), p. 32.
55. “Worldwide Look at Reserves and Production,” Oil& Gas Journal, Vol. 107, No. 47 (December 21, 2009),pp. 18-21, web site www.ogj.com (subscriptionsite).
56. M. Radler, “Special Report: Oil, Gas Reserves RiseAs Oil Output Declines,” Oil & Gas Journal, Vol. 107,No. 47 (December 21, 2009), p. 18, web site www.ogj.com (subscription site).
57. G. Chazan, “Turkmenistan Gas Field Is One ofWorld’s Largest,” The Wall Street Journal (Oct 16,2008), p. A9.
58. BP Statistical Review of World Energy 2009 (London,UK, June 2009), p. 22, web site www.bp.com.
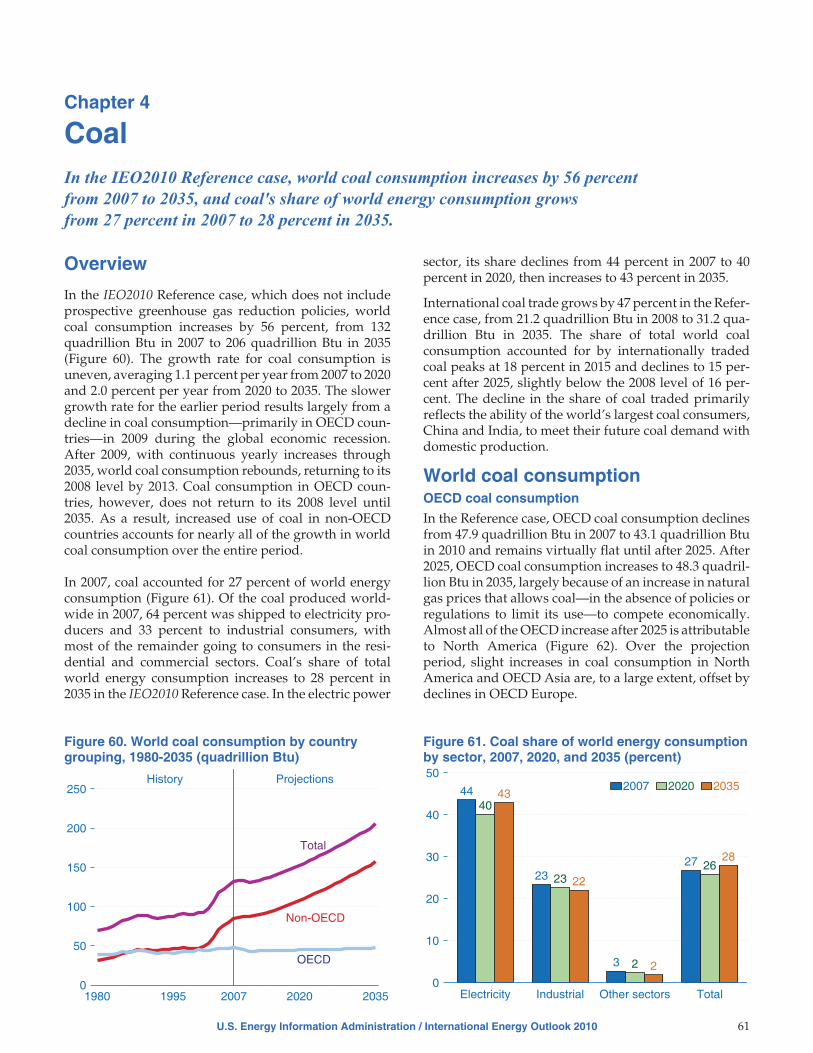
Chapter 4
CoalIn the IEO2010 Reference case, world coal consumption increases by 56 percent
from 2007 to 2035, and coal's share of world energy consumption grows
from 27 percent in 2007 to 28 percent in 2035.
Overview
In the IEO2010 Reference case, which does not includeprospective greenhouse gas reduction policies, worldcoal consumption increases by 56 percent, from 132quadrillion Btu in 2007 to 206 quadrillion Btu in 2035(Figure 60). The growth rate for coal consumption isuneven, averaging 1.1 percent per year from 2007 to 2020and 2.0 percent per year from 2020 to 2035. The slowergrowth rate for the earlier period results largely from adecline in coal consumption—primarily in OECD coun-tries—in 2009 during the global economic recession.After 2009, with continuous yearly increases through2035, world coal consumption rebounds, returning to its2008 level by 2013. Coal consumption in OECD coun-tries, however, does not return to its 2008 level until2035. As a result, increased use of coal in non-OECDcountries accounts for nearly all of the growth in worldcoal consumption over the entire period.
In 2007, coal accounted for 27 percent of world energyconsumption (Figure 61). Of the coal produced world-wide in 2007, 64 percent was shipped to electricity pro-ducers and 33 percent to industrial consumers, withmost of the remainder going to consumers in the resi-dential and commercial sectors. Coal’s share of totalworld energy consumption increases to 28 percent in2035 in the IEO2010 Reference case. In the electric power
sector, its share declines from 44 percent in 2007 to 40percent in 2020, then increases to 43 percent in 2035.
International coal trade grows by 47 percent in the Refer-ence case, from 21.2 quadrillion Btu in 2008 to 31.2 qua-drillion Btu in 2035. The share of total world coalconsumption accounted for by internationally tradedcoal peaks at 18 percent in 2015 and declines to 15 per-cent after 2025, slightly below the 2008 level of 16 per-cent. The decline in the share of coal traded primarilyreflects the ability of the world’s largest coal consumers,China and India, to meet their future coal demand withdomestic production.
World coal consumptionOECD coal consumption
In the Reference case, OECD coal consumption declinesfrom 47.9 quadrillion Btu in 2007 to 43.1 quadrillion Btuin 2010 and remains virtually flat until after 2025. After2025, OECD coal consumption increases to 48.3 quadril-lion Btu in 2035, largely because of an increase in naturalgas prices that allows coal—in the absence of policies orregulations to limit its use—to compete economically.Almost all of the OECD increase after 2025 is attributableto North America (Figure 62). Over the projectionperiod, slight increases in coal consumption in NorthAmerica and OECD Asia are, to a large extent, offset bydeclines in OECD Europe.
U.S. Energy Information Administration / International Energy Outlook 2010 61
1980 1995 2007 2020 20350
50
100
150
200
250
Non-OECD
OECD
Total
History Projections
Figure 60. World coal consumption by countrygrouping, 1980-2035 (quadrillion Btu)
44
23
3
27
40
23
2
26
43
22
2
28
Electricity Industrial Other sectors Total0
10
20
30
40
502007 2020 2035
Figure 61. Coal share of world energy consumptionby sector, 2007, 2020, and 2035 (percent)

North America
Coal use in the United States totaled 22.7 quadrillion Btuin 2007—92 percent of total coal use in North Americaand 47 percent of the OECD total. U.S. coal demand risesto 25.1 quadrillion Btu in 2035 in the Reference case.Coal’s share of total U.S. electricity generation (includ-ing electricity produced at combined heat and powerplants in the industrial and commercial sectors) declinesfrom 48 percent in 2007 to 44 percent in 2035.
Increasing use of coal for electricity generation at newand existing plants, combined with the startup of severalcoal-to-liquids (CTL) plants toward the end of the pro-jection, leads to modest growth in U.S. coal consump-tion, averaging 0.4 percent per year from 2007 to 2035.Although an assumed increase in the cost of capital forgreenhouse-gas-intensive technologies dampens invest-ment in new coal-fired power plants in the UnitedStates, the increase in coal-fired electricity generationstill is substantial, exceeded only by growth in genera-tion from renewables. Increased generation fromcoal-fired power plants accounts for 26 percent of thegrowth in total U.S. electricity generation from 2007 to2035, while increased generation from renewables(including conventional hydroelectric resources)accounts for 49 percent of the growth. U.S. production ofcoal-based synthetic liquids increases to 243,000 barrelsper day in 2035.
In Canada and Mexico, there are only minor changes incoal consumption over the projection period: a decreaseof 0.3 quadrillion Btu in Canada from 2007 to 2035, andan increase of 0.2 quadrillion Btu in Mexico. The declinein Canada’s coal consumption is attributable primarilyto the Ontario government’s plans to phase out the Prov-ince’s remaining 6.1 gigawatts of coal-fired generatingcapacity by the end of 2014 [1]. In a recent announce-ment, Ontario Power Generation indicated that approxi-mately 2 gigawatts of coal-fired generating capacity at
its Nanticoke and Lambton plants will be retired in late2010. In Mexico, an additional 0.7 gigawatts of coal-firedgenerating capacity is scheduled to be completed in 2010at the existing 2.1-gigawatt Petacalco plant on the Pacificcoast [2].
OECD Europe
Total coal consumption in the countries of OECDEurope declines in the IEO2010 Reference case from 13.2quadrillion Btu in 2007 (28 percent of the OECD total) to11.0 quadrillion Btu in 2035 (23 percent). In 2007, theelectricity and industrial sectors accounted for 95 per-cent of the coal consumed in OECD Europe, with elec-tricity producers using 9.0 quadrillion Btu of coal andindustrial plants using 3.6 quadrillion Btu. Over the pro-jection period, the use of coal declines in both sectors,falling at an average rate of 1.6 percent per year in theindustrial sector and 0.3 percent per year in the electric-ity sector. In 2035, OECD Europe’s electric power sectoraccounts for 75 percent of the region’s total coal use, upfrom 68 percent in 2007.
Although total installed coal-fired electricity generatingcapacity in OECD Europe declines from 200 gigawatts in2007 to 177 gigawatts in 2035, coal remains an importantcomponent of Europe’s power generation, providingnearly one-fifth or the region’s total generation in 2035.Plans to retire aging and inefficient generating capacitywill, to some extent, be offset by new coal-fired capacity.Currently, between 15 and 20 gigawatts of new coal-fired generating capacity is under construction in OECDEurope, with projects in Germany representing morethan one-half of the new construction [3]. In addition,there are plans to refurbish some existing coal-firedcapacity to make it more efficient.
OECD Asia
The slight increase in coal consumption for the OECDAsia region in the Reference case is the net result of twodivergent trends, consisting of a decline in coal use of 1.1quadrillion Btu for Japan and an increase of 1.3 quadril-lion Btu projected for South Korea from 2007 to 2035.Japan is the region’s largest coal-consuming nation, butdeclining population and increasing reliance on nuclearpower for electricity generation lowers the demand forcoal in the future.
Unlike Japan, Australia and New Zealand increase theircoal consumption slightly, by an average of 0.2 percentper year, from 2.9 quadrillion Btu in 2007 to 3.0 quadril-lion Btu in 2035. Of the two countries, Australia is by farthe larger coal consumer, with 97 percent of the regionaltotal in 2007. With substantial coal reserves (primarily inAustralia), the region continues to rely heavily on coalfor electricity generation; however, coal’s share of totalgeneration declines gradually. Compared with coal,generation from both renewables and natural gasincreases at a more rapid pace, so that those fuels
62 U.S. Energy Information Administration / International Energy Outlook 2010
NorthAmerica
OECDEurope
OECDAsia
TotalOECD
0
10
20
30
40
50
601980 2007 2020 2035
Figure 62. OECD coal consumption by region,1980, 2007, 2020, and 2035 (quadrillion Btu)

capture an increasing share of Australia/New Zealand’stotal generation. Coal-fired power plants supplied 70percent of the region’s total electricity generation in2007, as compared with a 58-percent share in 2035.
South Korea is OECD Asia’s fastest-growing consumerof coal. Its coal use increases by an average of 1.6 percentper year, from 2.3 quadrillion Btu in 2007 to 3.6 quadril-lion Btu in 2035. The 56-percent overall increase from2007 to 2035 results primarily from growing demand forcoal in the electric power sector. According to SouthKorea’s most recent long-term power plan, published inlate 2008, the country’s generating companies plan toadd as much as 15 gigawatts of new coal-fired generat-ing capacity during the years 2008 through 2022 [4].
Non-OECD coal consumption
In contrast to coal consumption in OECD economies,fast-paced growth is projected for non-OECD nations,particularly among the Asian economies. Led by strongeconomic growth and rising energy demand in non-OECD Asia, total coal consumption in non-OECD coun-tries increases to 157.9 quadrillion Btu in 2035, growingby 87 percent from the 2007 total of 84.6 quadrillion Btu(Figure 63). The substantial increase in non-OECD coalconsumption illustrates the importance of coal in meet-ing the region’s energy needs. Over the entire periodfrom 2007 to 2035, coal accounts for about one-third oftotal non-OECD energy consumption.
Non-OECD Asia
The countries of non-OECD Asia account for 95 percentof the projected increase in world coal consumptionfrom 2007 to 2035. Strong economic growth is expectedfor non-OECD Asia, averaging 5.2 percent per year from2007 to 2035, with China’s economy averaging 5.8 per-cent per year and India’s 5.0 percent per year. In IEO-2010, much of the increase in demand for energy in
non-OECD Asia, particularly in the electric power andindustrial sectors, is met with coal.
Coal use in China’s electricity sector increases from 27.7quadrillion Btu in 2007 to 72.2 quadrillion Btu in 2035, atan average rate of 3.5 percent per year (Figure 64). Incomparison, coal consumption in the U.S. electric powersector grows by 0.4 percent annually, from 20.8 quadril-lion Btu in 2007 to 23.1 quadrillion Btu in 2035. At theend of 2007, China had an estimated 496 gigawatts ofcoal-fired capacity in operation. To meet the demand forelectricity that accompanies its rapid economic growth,an additional 736 gigawatts of coal-fired capacity (net ofretirements) is expected to be brought on line in Chinaby 2035, requiring large financial investments in newcoal-fired power plants and associated electricity trans-mission and distribution systems. In the near term, theIEO2010 projections show a substantial amount of newcoal plant builds, with 138 gigawatts of capacity addi-tions between 2007 and 2010. Notwithstanding the sub-stantial growth in coal-fired generating capacity andgeneration projected for China in the IEO2010 Referencecase, coal’s share of the country’s total generationdeclines from 80 percent in 2007 to 74 percent in 2035, asgeneration from nuclear and renewables grows at aneven more rapid pace than generation from coal.
Nearly one-half (49 percent) of China’s coal use in 2007was in the non-electricity sectors, primarily in the indus-trial sector and notably for the production of steel andpig iron. In the IEO2010 Reference case, coal consump-tion in those sectors increases by 13.1 quadrillion Btu (48percent) from 2007 to 2035. Within the industrial sector,the single largest use of coal is for the production of coke,which in turn is used primarily to produce pig iron. In2007, Chinese coke plants consumed 459 million tons18
of coal, representing, on a tonnage basis, about 17 per-cent of the total amount of coal consumed in all sectors in
U.S. Energy Information Administration / International Energy Outlook 2010 63
Non-OECDEurope
and Eurasia
Non-OECDAsia
OtherNon-OECD
TotalNon-OECD
0
40
80
120
1601980 2007 2020 2035
Figure 63. Non-OECD coal consumption by region,1980, 2007, 2020, and 2035 (quadrillion Btu)
Electricity Industrial Other sectors Total0
20
40
60
80
100
1202007 2020 2035
Figure 64. Coal consumption in China by sector,2007, 2020, and 2035 (quadrillion Btu)
18 Throughout this chapter, tons refer to short tons (2,000 pounds).

China during 2007 [5 ]. China was the world’s leadingproducer of both steel and pig iron in 2007, accountingfor 36 percent of global raw steel output and 50 percentof world pig iron production [6].
Coal remains the leading source of energy for China’sindustrial sector in the Reference case, although its shareof industrial energy consumption declines over the pro-jection period, with electricity and other energy sourcesmaking up an increasing share of the total. Electricity’sshare of total industrial energy use rises from 19 percentin 2007 to 32 percent in 2035, while coal’s share dropsfrom 60 percent to 47 percent. However, with coal-firedpower plants satisfying approximately three-fourths ofChina’s total power generation requirements through-out the period from 2007 to 2035, the increase in electric-ity demand in the industrial sector can be viewedindirectly as an increase in the demand for coal.
In India, 56 percent of the growth in coal consumption isexpected to be in the electric power sector and most ofthe remainder in the industrial sector. In 2007, India’scoal-fired power plants consumed 6.6 quadrillion Btu ofcoal, representing 65 percent of the country’s total coaldemand. Coal use for electricity generation in Indiagrows by 1.3 percent per year on average, to 9.5 quadril-lion Btu in 2035, requiring an additional 51 gigawatts ofcoal-fired capacity (net of retirements). As a result,India’s coal-fired generating capacity increases from 84gigawatts in 2007 to 135 gigawatts in 2035. Despite a45-percent increase in the use of coal for electricity gen-eration over the projection period, growth in generationfrom natural gas, nuclear power, and renewable energysources is even more rapid, and coal’s share of India’stotal generation declines from 71 percent in 2007 to 51percent in 2035.
In the nations of non-OECD Asia outside China andIndia, coal consumption grows by an average of 3.0 per-cent per year, from 5.4 quadrillion Btu in 2007 to 12.4quadrillion Btu in 2035. Growing demand for energy inthe region’s electric power and industrial sectors drivesthe increase in coal use. In the electric power sector, sig-nificant growth in coal consumption is expected in Indo-nesia and Vietnam, where considerable amounts of newcoal-fired generating capacity are expected to be built.
Non-OECD Europe and Eurasia
Coal consumption in non-OECD Europe and Eurasiaincreases in the IEO2010 Reference case by an average of0.3 percent per year, from 8.7 quadrillion Btu in 2007 to9.4 quadrillion Btu in 2035. Russia is the region’s largestcoal consumer, at 4.3 quadrillion Btu in 2007, or 49 per-cent of the total for non-OECD Europe and Eurasia. Coalmet 14 percent of Russia’s total energy requirements in2007, and coal-fired power plants provided 23 percent ofits electricity. In the Reference case, coal consumption in
Russia in 2035 totals 5.2 quadrillion Btu, its share of totalenergy consumption increases slightly to 15 percent,and its share of electricity generation increases to 24 per-cent. Although natural gas is the leading source of elec-tricity generation in Russia, and continues to hold thatposition throughout the projection, increased genera-tion from nuclear and coal-fired power plants, takentogether, accounts for 68 percent of the country’s genera-tion growth. The natural gas share of Russia’s total elec-tricity generation declines from 40 percent in 2007 to 32percent in 2035 in the Reference case, and the nuclearshare rises from 15 percent to 25 percent.
Coal consumption in the other countries of non-OECDEurope and Eurasia declines slightly, from 4.4 quadril-lion Btu in 2007 to 4.1 quadrillion Btu in 2035. The use ofcoal declines in every end-use sector of the region exceptfor the electric power sector, where it increases by anaverage of 0.7 percent per year. From 2007 to 2035, coal,natural gas, and nuclear power satisfy much of the addi-tional electricity requirement for non-OECD Europe andEurasia, with increased output from coal-fired plantsmeeting 18 percent of the growth, natural-gas-firedplants 41 percent, and nuclear plants 29 percent. Coal’sshare of total electricity generation declines from 29 per-cent in 2007 to 25 percent in 2035. Currently, a number ofnew coal-fired power projects are in the planning stagesin the region [7]. Locally mined lignite is the proposedfuel for most of the proposed plants, although importedcoal is the likely fuel source for several plants that maybe constructed in coastal areas.
Africa
Africa’s coal consumption increases by 1.9 quadrillionBtu from 2007 to 2035 in the Reference case. South Africacurrently accounts for 91 percent of the coal consumedon the continent and is expected to continue to accountfor much of Africa’s total coal consumption over the pro-jection period.
In South Africa, increasing demand for electricity inrecent years has led to a decision by Eskom, the coun-try’s state-owned electricity supplier, to restart threelarge coal-fired plants (Camden, Grootvlei, and Komati)that have been closed for more than a decade [8]. Theindividual units at those plants, with a combined gener-ating capacity of 3.8 gigawatts, are scheduled to returnto service by 2011. In addition, Eskom is proceedingwith the construction of two new coal-fired powerplants, Medupi and Kusile, with a combined generatingcapacity of 9.6 gigawatts. The 12 individual units at theMedupi and Kusile plants are scheduled to be fullyoperational by the end of 2016. In April 2010, the WorldBank approved a $3.8 billion loan for Eskom to help withthe financing of several energy-related projects, includ-ing $3.1 billion allocated for completion of the Medupiplant [9].
64 U.S. Energy Information Administration / International Energy Outlook 2010

Recent power shortages and a general lack of spare gen-erating capacity in southern Africa also have led toincreased interest in new coal-fired power projects incountries other than South Africa. Of particular signifi-cance are major investments being made by severalinternational energy companies to develop coal reservesin Mozambique and Botswana for the purpose of sup-plying both domestic coal-fired generating plants andinternational markets[10].
In the industrial sector, increasing coal use results fromproduction of steam and process heat for industrialapplications, production of coke for the steel industry,and production of coal-based synthetic liquids. Cur-rently, two large-scale CTL plants in South Africa (SasolII and Sasol III) can supply up to 150,000 barrels of syn-thetic liquids per day and account for about 20 percent ofthe country’s total liquid fuel supply [11]. About 25 per-cent of South Africa’s total coal consumption is used forsynthetic liquids production [12].
Central and South America
Central and South America consumed 0.9 quadrillionBtu of coal in 2007. Brazil, with the world’s ninth-largeststeel production in 2007, accounted for 51 percent of theregion’s coal demand, and Chile, Colombia, Puerto Rico,Argentina, and Peru accounted for most of the remain-der [13]. In the Reference case, coal consumption in Cen-tral and South America increases by 0.8 quadrillion Btufrom 2007 to 2035, with most of the increase in Brazil,primarily for coke manufacture and electricity genera-tion. Brazil’s steel companies currently plan to expandproduction capacity by a substantial amount over themid-term to meet increasing domestic and internationaldemand for steel [14].
Middle East
Countries in the Middle East consumed 0.4 quadrillionBtu of coal in 2007. Israel accounted for 85 percent of thetotal and Iran most of the remainder. The region’s coaluse remains near the current level through 2035.
World coal productionIn the IEO2010 Reference case, 75 percent of the increasein world coal production occurs in China, where outputrises by 54.7 quadrillion Btu from 2007 to 2035 (Table 8).This outlook is based on the assumption that much ofthe demand for coal in China will continue to be met bydomestic production. Other substantial increases inregional coal production from 2007 to 2035 include 7.1quadrillion Btu in Australia/New Zealand (represent-ing 10 percent of the increase in world coal production),4.0 quadrillion Btu in non-OECD Asia (excludingChina), 3.0 quadrillion Btu in Africa, 2.8 quadrillion Btu
in the United States, and 2.4 quadrillion Btu in Centraland South America.
Most of the growth in coal production in Australia/NewZealand and other Central and South America is basedon continuing increases in coal exports, whereasproduction growth in Africa and non-OECD Asia(excluding China) is attributable to both rising levels ofcoal consumption and increasing exports. For theUnited States, growth in coal production is a result pri-marily of increases in domestic coal consumption. Theprojected increases in coal production for these sixregions dominate the overall trends for the OECD andnon-OECD regions as a whole, accounting for more than100 percent of the increase in net production for OECDcountries and 97 percent of the net increase fornon-OECD countries.
World coal tradeWith the global recession, international trade in coal in2009, moving via ship or barge, is estimated to havefallen slightly from the 2008 level (even though China’scoal imports doubled in 2009 compared with 2008). Still,the rapid decommissioning of small coal mines inChina’s historically most productive coal province(Shanxi), a cold winter in China, delays in some infra-structure projects in exporting nations, and continuedtransportation bottlenecks kept international coal sup-ply tight in 2009. The volume of seaborne coal trade con-tinues its long-term trend, rising through 2035 mainly inresponse to large increases in non-OECD coal demand—predominantly from China and India.
Although both steam coal and coking coal are tradedinternationally, most of the trade is in steam coal, whichrepresents 72 percent of world coal trade in 2035(slightly higher than the current level of 70 percent). In2008, 58 percent of the world’s exported steam coal wasimported by Asian countries, and their share of the totalincreases to 72 percent in 2035.
The share of coking coal imports destined for Asiancountries increases from 62 percent in 2008 to an esti-mated 70 percent in 2009 and never falls below 67 per-cent in the Reference case. China, India, and Iran werethe only significant steel-producing countries in whichsteel production increased from 2008 to 2009.19 Chinaincreased its production by 73 million tons, India by2 million tons, and Iran by 1 million tons [15]. Most ofthe other countries producing crude steel reduced theirsteel production by double-digit percentages from2008 to 2009, and there were similar declines in blastfurnace iron production, part of the steelmaking processthat requires coking coal. Although some coke plantshave been closed down since 2008, most appear to be
U.S. Energy Information Administration / International Energy Outlook 2010 65
19 Ecuador, Morocco, and Saudi Arabia increased raw steel production from 64,000 to 291,00 tons, from 527,000 tons to 528,000 tons, andfrom 5,145,000 tons to 5,170,000 tons, respectively, from 2008 to 2009.
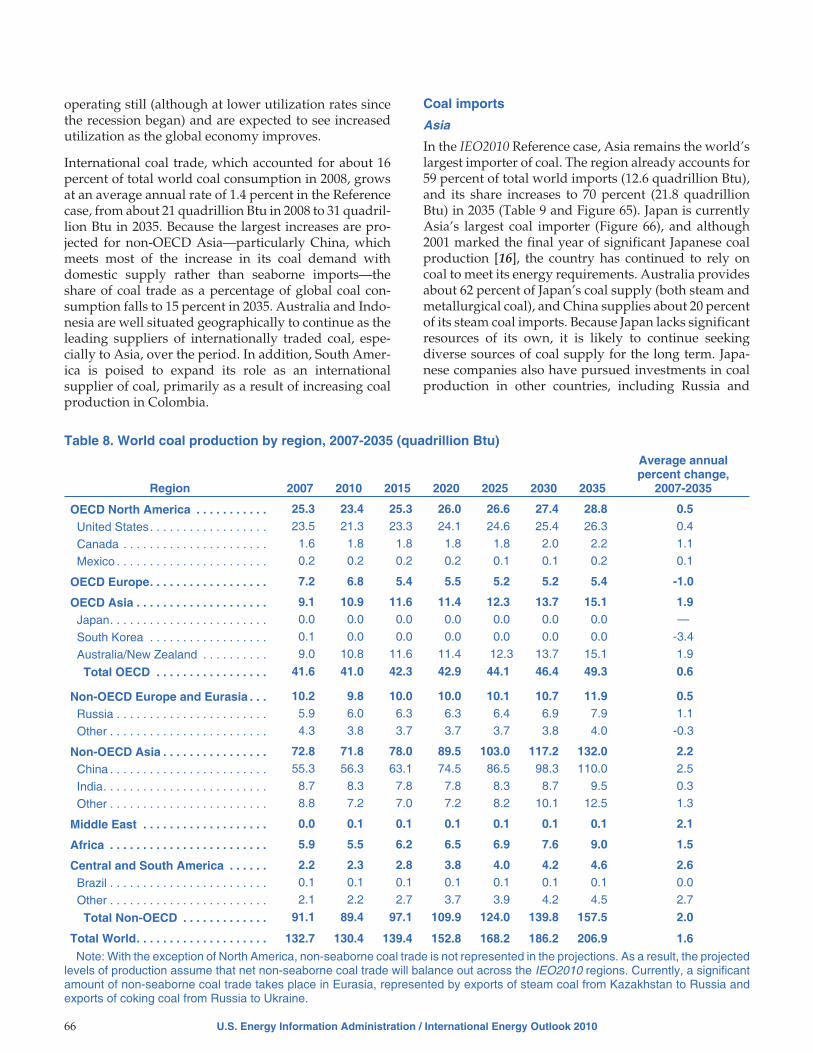
operating still (although at lower utilization rates sincethe recession began) and are expected to see increasedutilization as the global economy improves.
International coal trade, which accounted for about 16percent of total world coal consumption in 2008, growsat an average annual rate of 1.4 percent in the Referencecase, from about 21 quadrillion Btu in 2008 to 31 quadril-lion Btu in 2035. Because the largest increases are pro-jected for non-OECD Asia—particularly China, whichmeets most of the increase in its coal demand withdomestic supply rather than seaborne imports—theshare of coal trade as a percentage of global coal con-sumption falls to 15 percent in 2035. Australia and Indo-nesia are well situated geographically to continue as theleading suppliers of internationally traded coal, espe-cially to Asia, over the period. In addition, South Amer-ica is poised to expand its role as an internationalsupplier of coal, primarily as a result of increasing coalproduction in Colombia.
Coal imports
Asia
In the IEO2010 Reference case, Asia remains the world’slargest importer of coal. The region already accounts for59 percent of total world imports (12.6 quadrillion Btu),and its share increases to 70 percent (21.8 quadrillionBtu) in 2035 (Table 9 and Figure 65). Japan is currentlyAsia’s largest coal importer (Figure 66), and although2001 marked the final year of significant Japanese coalproduction [16], the country has continued to rely oncoal to meet its energy requirements. Australia providesabout 62 percent of Japan’s coal supply (both steam andmetallurgical coal), and China supplies about 20 percentof its steam coal imports. Because Japan lacks significantresources of its own, it is likely to continue seekingdiverse sources of coal supply for the long term. Japa-nese companies also have pursued investments in coalproduction in other countries, including Russia and
66 U.S. Energy Information Administration / International Energy Outlook 2010
Table 8. World coal production by region, 2007-2035 (quadrillion Btu)
Region 2007 2010 2015 2020 2025 2030 2035
Average annualpercent change,
2007-2035
OECD North America . . . . . . . . . . . 25.3 23.4 25.3 26.0 26.6 27.4 28.8 0.5
United States. . . . . . . . . . . . . . . . . . 23.5 21.3 23.3 24.1 24.6 25.4 26.3 0.4
Canada . . . . . . . . . . . . . . . . . . . . . . 1.6 1.8 1.8 1.8 1.8 2.0 2.2 1.1
Mexico . . . . . . . . . . . . . . . . . . . . . . . 0.2 0.2 0.2 0.2 0.1 0.1 0.2 0.1
OECD Europe. . . . . . . . . . . . . . . . . . 7.2 6.8 5.4 5.5 5.2 5.2 5.4 -1.0
OECD Asia . . . . . . . . . . . . . . . . . . . . 9.1 10.9 11.6 11.4 12.3 13.7 15.1 1.9
Japan. . . . . . . . . . . . . . . . . . . . . . . . 0.0 0.0 0.0 0.0 0.0 0.0 0.0 —
South Korea . . . . . . . . . . . . . . . . . . 0.1 0.0 0.0 0.0 0.0 0.0 0.0 -3.4
Australia/New Zealand . . . . . . . . . . 9.0 10.8 11.6 11.4 12.3 13.7 15.1 1.9
Total OECD . . . . . . . . . . . . . . . . . 41.6 41.0 42.3 42.9 44.1 46.4 49.3 0.6
Non-OECD Europe and Eurasia . . . 10.2 9.8 10.0 10.0 10.1 10.7 11.9 0.5
Russia . . . . . . . . . . . . . . . . . . . . . . . 5.9 6.0 6.3 6.3 6.4 6.9 7.9 1.1
Other . . . . . . . . . . . . . . . . . . . . . . . . 4.3 3.8 3.7 3.7 3.7 3.8 4.0 -0.3
Non-OECD Asia . . . . . . . . . . . . . . . . 72.8 71.8 78.0 89.5 103.0 117.2 132.0 2.2
China . . . . . . . . . . . . . . . . . . . . . . . . 55.3 56.3 63.1 74.5 86.5 98.3 110.0 2.5
India. . . . . . . . . . . . . . . . . . . . . . . . . 8.7 8.3 7.8 7.8 8.3 8.7 9.5 0.3
Other . . . . . . . . . . . . . . . . . . . . . . . . 8.8 7.2 7.0 7.2 8.2 10.1 12.5 1.3
Middle East . . . . . . . . . . . . . . . . . . . 0.0 0.1 0.1 0.1 0.1 0.1 0.1 2.1
Africa . . . . . . . . . . . . . . . . . . . . . . . . 5.9 5.5 6.2 6.5 6.9 7.6 9.0 1.5
Central and South America . . . . . . 2.2 2.3 2.8 3.8 4.0 4.2 4.6 2.6
Brazil . . . . . . . . . . . . . . . . . . . . . . . . 0.1 0.1 0.1 0.1 0.1 0.1 0.1 0.0
Other . . . . . . . . . . . . . . . . . . . . . . . . 2.1 2.2 2.7 3.7 3.9 4.2 4.5 2.7
Total Non-OECD . . . . . . . . . . . . . 91.1 89.4 97.1 109.9 124.0 139.8 157.5 2.0
Total World. . . . . . . . . . . . . . . . . . . . 132.7 130.4 139.4 152.8 168.2 186.2 206.9 1.6
Note: With the exception of North America, non-seaborne coal trade is not represented in the projections. As a result, the projectedlevels of production assume that net non-seaborne coal trade will balance out across the IEO2010 regions. Currently, a significantamount of non-seaborne coal trade takes place in Eurasia, represented by exports of steam coal from Kazakhstan to Russia andexports of coking coal from Russia to Ukraine.

U.S. Energy Information Administration / International Energy Outlook 2010 67
Table 9. World coal flows by importing and exporting regions, Reference case, 2008, 2020, and 2035(quadrillion Btu)
Exporters
Importers
Steam Coking Total
Europea Asia Americas Totalb Europea Asiac Americas Totalb Europea Asia Americas Totalb
2008
Australia . . . . . . . . . 0.12 2.98 0.04 3.17 0.76 2.67 0.20 3.62 0.88 5.64 0.23 6.79
United States . . . . . 0.36 0.02 0.45 0.83 0.76 0.11 0.30 1.17 1.11 0.13 0.75 1.99
Southern Africad. . . 1.17 0.26 0.05 1.55 0.00 0.00 0.00 0.01 1.17 0.26 0.05 1.56
Eurasia . . . . . . . . . . 1.16 0.38 0.00 1.55 0.08 0.08 0.00 0.16 1.24 0.47 0.00 1.71
Poland . . . . . . . . . . 0.11 0.00 0.00 0.11 0.00 0.00 0.00 0.00 0.11 0.00 0.00 0.11
Canada. . . . . . . . . . 0.01 0.11 0.03 0.14 0.19 0.43 0.11 0.74 0.20 0.55 0.14 0.88
China . . . . . . . . . . . 0.04 1.02 0.00 1.07 0.00 0.09 0.00 0.09 0.04 1.11 0.00 1.16
South Americae . . . 0.96 0.00 0.99 1.95 0.00 0.00 0.00 0.00 0.96 0.00 0.99 1.95
Vietnam . . . . . . . . . 0.01 0.45 0.00 0.46 0.00 0.00 0.00 0.00 0.01 0.45 0.00 0.46
Indonesiaf . . . . . . . . 0.49 3.45 0.10 4.07 0.00 0.53 0.00 0.54 0.49 3.99 0.10 4.60Total. . . . . . . . . . . 4.42 8.67 1.66 14.89 1.80 3.92 0.60 6.33 6.21 12.59 2.26 21.23
2020
Australia . . . . . . . . . 0.00 4.19 0.00 4.19 0.32 3.97 0.04 4.33 0.32 8.15 0.04 8.52
United States . . . . . 0.16 0.04 0.06 0.26 0.74 0.17 0.40 1.31 0.90 0.20 0.47 1.57
Southern Africad. . . 1.01 0.76 0.20 1.96 0.05 0.34 0.02 0.40 1.05 1.09 0.21 2.36
Eurasia . . . . . . . . . . 1.43 0.51 0.00 1.94 0.07 0.21 0.00 0.28 1.50 0.72 0.00 2.22
Poland . . . . . . . . . . 0.10 0.00 0.01 0.11 0.03 0.00 0.00 0.03 0.13 0.00 0.01 0.14
Canada. . . . . . . . . . 0.11 0.00 0.00 0.11 0.32 0.25 0.30 0.87 0.43 0.25 0.30 0.98
China . . . . . . . . . . . 0.00 0.97 0.00 0.97 0.00 0.02 0.00 0.02 0.00 0.99 0.00 0.99
South Americae . . . 2.13 0.37 1.25 3.75 0.00 0.00 0.00 0.00 2.13 0.37 1.25 3.75
Vietnam . . . . . . . . . 0.00 0.24 0.00 0.24 0.00 0.00 0.00 0.00 0.00 0.24 0.00 0.24
Indonesiaf . . . . . . . . 0.00 4.13 0.09 4.21 0.01 0.49 0.00 0.50 0.01 4.62 0.09 4.72Total. . . . . . . . . . . 4.93 11.20 1.61 17.74 1.54 5.44 0.77 7.75 6.47 16.64 2.38 25.49
2035
Australia . . . . . . . . . 0.06 6.77 0.00 6.83 0.38 4.67 0.22 5.27 0.44 11.44 0.22 12.10
United States . . . . . 0.23 0.09 0.05 0.37 0.49 0.04 0.65 1.19 0.72 0.14 0.71 1.56
Southern Africad. . . 0.70 1.67 0.18 2.55 0.05 0.32 0.03 0.40 0.75 1.99 0.21 2.95
Eurasia . . . . . . . . . . 1.37 0.64 0.13 2.13 0.22 0.27 0.00 0.49 1.58 0.91 0.13 2.62
Poland . . . . . . . . . . 0.07 0.00 0.02 0.09 0.01 0.00 0.00 0.01 0.09 0.00 0.02 0.10
Canada. . . . . . . . . . 0.21 0.00 0.00 0.21 0.40 0.22 0.37 0.99 0.61 0.22 0.37 1.20
China . . . . . . . . . . . 0.00 0.97 0.00 0.97 0.00 0.02 0.00 0.02 0.00 0.99 0.00 0.99
South Americae . . . 2.09 1.06 1.38 4.53 0.00 0.00 0.00 0.00 2.09 1.06 1.38 4.53
Vietnam . . . . . . . . . 0.00 0.24 0.00 0.24 0.00 0.00 0.00 0.00 0.00 0.24 0.00 0.24
Indonesiaf . . . . . . . . 0.00 4.29 0.12 4.41 0.01 0.49 0.00 0.50 0.01 4.78 0.12 4.91Total. . . . . . . . . . . 4.73 15.73 1.87 22.32 1.56 6.04 1.29 8.88 6.28 21.77 3.16 31.21
aIncludes coal shipments to the Middle East and Africa.bIn 2008, total world coal flows include a balancing item used to reconcile discrepancies between reported exports and imports. The 2008
balancing items by coal type were 0.14 quadrillion Btu (steam coal), 0.01 quadrillion Btu (coking coal), and 0.16 quadrillion Btu (total).cIncludes 0.8 quadrillion Btu of coal for pulverized coal injection at blast furnaces shipped to Japanese steelmakers in 2008.dSouthern Africa includes South Africa, Mozambique, and Botswana.eCoal exports from South America originate from mines in Colombia and Venezuela.fIncludes shipments from other countries not modeled for the projection period. The 2008 exports from other countries by coal type were
0.07 quadrillion Btu (steam coal), 0.03 quadrillion Btu (coking coal), and 0.10 quadrillion Btu (total).Notes: Data exclude non-seaborne shipments of coal to Europe and Asia. Totals may not equal sum of components due to independent
rounding.Sources: SSY Consultancy and Research, Ltd., and EIA.

Canada [17]. Japan is a leader in steel production, rank-ing second only to China [18], and continues to importcoking coal for use in its steelmaking plants through2035.
Like Japan, South Korea continues importing most of thecoal it consumes through 2035. With planned increasesin coal-fired generating capacity, South Korea (in OECDAsia) and Taiwan (in non-OECD Asia) maintain a com-bined 17 -percent share of world imports in 2035, despitesizable increases in coal imports by other countries.
In 2035, China’s coal imports total 3.7 quadrillion Btuin the Reference case. China remains a net importerthrough 2035, but even with a substantial increase inimports, a preponderant share of the coal consumed inChina will continue to be supplied by its own coalmines. Extremely cold weather has played a key role inChina’s strong coal demand in the winter of 2009-2010.In addition, the unpredictability of China’s coal marketsraises the level of uncertainty surrounding the worldtrade projections.
China began to increase its coal imports at the end of2008, while accelerating the closure of the country’ssmall, inefficient, and comparatively less safe mines inShanxi Province. Shanxi has typically been China’s topcoal-producing region, and although it appears to haveproduced more coal in 2009 than in 2008, productionwas not sufficient to keep up with demand, creating coalshortages within the region that contributed to the needfor imports. However, past consolidations in other Chi-nese provinces suggest that the country could quicklyreopen small mines should international suppliestighten and international coal prices rise substantially.
The removal of coal import tariffs is a possible indicationof China’s intention to import large quantities of coal, at
least in the short term, while Shanxi’s coal industry isbeing restructured. An expected influx of dry bulk carri-ers beginning in 2010 may provide another short-termboost for Chinese coal imports by lowering the cost ofbulk freight. The country may also manage any coal sup-ply deficit in the future by importing more coal overland(trade that is not captured in Table 9) from new produc-tion sources in Mongolia and Russia. In addition, Chinaplans to build strategic coal stocks in various provincesas a hedge against future volatility in coal import levelsand prices.
China’s steel production increased by an estimated 13percent from 2008 to 2009. To feed the steelmaking pro-cess and compensate for production losses in Shanxi,China’s coking coal imports rose from approximately 0.1quadrillion Btu to 0.9 quadrillion Btu, and they areassumed to remain at roughly the same level through2035. The Chinese government is planning to addressissues of overcapacity in the steel industry in partthrough consolidation of various steel- and coke-making companies, which has potential to affect cokingcoal imports by moderating demand for coking coal. Onthe other hand, with new facilities strategically locatedin coastal areas (one possible outcome of consolidation),China’s steel plants could have greater flexibility to useeither domestic or foreign coal.
India also has been increasing its imports of coal whilefacing ongoing coal transportation challenges. Itsimprovements in infrastructure include the expandeduse of smaller ports to satisfy increasing demand for coalimports. Like China, India increased its coal imports inboth 2008 and 2009 (although preliminary data suggestthat the growth in 2009 was much less than that inChina). In 2035, India’s coal imports in the Referencecase are four times the 2008 level, spurred by risingimports of both coking and steam coal.
68 U.S. Energy Information Administration / International Energy Outlook 2010
1995 2007 2015 2025 20350
5
10
15
20
25
30
Asia
America
Total
History Projections
Europe
Figure 65. Coal imports by major importing region,1995-2035 (quadrillion Btu)
Sources: SSY Consultancy and Reseach, Ltd., and EIA.
1.2
4.0
1.7
4.93.7
5.46.8
3.8
China andHong Kong
North Korea,South Korea,and Taiwan
Indian Sub-continent
andSouth Asia
Japan0.0
2.0
4.0
6.0
8.0
10.02007 2035
Figure 66. Coal imports to Asia by major importingregion, 2007 and 2035 (quadrillion Btu)
Sources: SSY Consultancy and Reseach, Ltd., and EIA.

The large coal-fired electricity plants planned for India’scoastal areas will be fueled by imported steam coal. Thecountry is faced with domestic coal supply and qualityissues and, while it is building new plants, its demandfor coal imports continues to grow. Unfortunately,delays in meeting established construction schedulesare commonplace in India, and transportation infra-structure issues abound. For instance, in 2009 India haddifficulty handling coal imports at its river port ofHaldia because of an unexpected loss of water depth. Inorder for tonnage to be handled at the port, larger shipshave been diverted to deeper ports, where their coal car-gos are transferred to smaller ships for delivery toHaldia [19].
India’s planned infrastructure improvements includecoastal port expansions at Goa and Paradip [20]. Freightcapacity at Paradip is expected to increase from about 55million tons in 2009 to 77 million tons in 2012, but recentbottlenecks at the port must be overcome in order forthat goal to be achieved [21]. In addition, coal-handlingcapability at the port of Mormugao will be expandedfrom 6 million tons to 17 million tons by 2014 [22]. Indiacompleted the new port of Gangavaram in 2009, onlyone of two (the second being the Mundra port) capableof handling capesize vessels. Gangavaram already han-dled about 17 million tons of freight (not all of it coal) in2009. In the long term, Gangavaram’s owners would liketo expand its freight handling capability to 221 milliontons per year. The new port of Dharma, also capable ofhandling capesize ships, should begin operation by theend of 2010.
India has domestic resources of coking coal, but its qual-ity is poor in comparison with foreign-sourced cokingcoal. India’s long-term plans include expansion of itssteel industry to between 165 and 198 million tons of rawsteel output by 2020, up from about 62 million tons in2008 [23], with increased imports of coking coal support-ing the expansion. Some plans for new steelmakingcapacity, such as ArcelorMittal’s new coastal steel plantin Orissa, appear to have been delayed by land acquisi-tion difficulties and environmental issues and thus areunlikely to add to India’s demand for coking coalimports until after 2014. Largely because of its importsof coking coal, India surpass Japan as the world’s largestimporter of coal by 2025 in the IEO2010 Reference case.
Europe, Middle East, and Africa
In the IEO2010 Reference case, total coal imports toEurope (including the Middle East and Africa) in 2035are about the same as in 2008 (Figure 66). With mostEuropean countries placing greater emphasis on naturalgas in their power sectors, coal becomes a less significantcomponent of the fuel mix for electricity generation.Europe’s demand for lower sulfur coal (from South
America and Eurasia, for example) will be temperedover time by the gradual addition of flue gas desulfuri-zation equipment at existing coal-fired power plants.
Some European countries will import more coal to com-pensate for their own dwindling coal production, whichwill offset some of the decline expected for coal importsto other European nations. For example, Germany’splanned closure of its remaining hard coal mines by 2018results in increasing imports of coal for electricity gener-ation [24]. In Turkey, electricity demand and steel indus-try growth also are projected to offset some of thedecline in Europe’s coal use. Over time, however, Tur-key is expected to rely more heavily on electric arc fur-nace steelmaking technology, which does not requirecoking coal. Italy’s conversion of power plants from oilto coal also offsets some of the decline in Europe’s coaldemand.
The Americas
In the mid- to long term, port expansions are expected tofacilitate U.S. coal imports. In 2008, Kinder MorganEnergy Partners LP completed an expansion of annualcapacity at its import terminal in Newport News, Vir-ginia, by 6 million tons; and in late 2009, it received an airpermit enabling it to expand its coal terminal in Jackson-ville, Florida [25]. Keystone Coal Co. is planning a coalimport terminal in Jacksonville, Florida, as well. Withdeclining productivity and mining difficulties in CentralAppalachia and rising domestic demand for coal,imports are expected to remain competitive for coastalStates in the East and South. South America (Colombia,in particular) is expected to be an important source ofU.S. coal imports.
Canada has been the largest importer of U.S. coal inrecent years, but exports of U.S. steam coal to Canada in2035 are projected to fall below their 2008 level. A por-tion of Ontario’s coal-fired generating capacity isassumed to be shut down by 2035 for environmental rea-sons, as legislated by the Provincial government. (By2014, if the plan proceeds, there could be a decline of 0.4quadrillion Btu in U.S. exports of thermal coal toCanada.)
Brazil’s steelmaking capacity increase in the Referencecase, taking advantage of its domestic resources of ironore but requiring increased use of coking-grade coal thatthe country does not produce domestically [26]. TheUnited States, Canada, Australia, and southern Africaall provide a portion of the coal needed to meet Brazil’simport requirements. Overall, South America’s importsof coking coal—driven primarily by demand inBrazil—grow from about 0.4 quadrillion Btu in 2008 to1.1 quadrillion Btu in 2035. Brazil and Chile account formost of the increase in thermal coal imports to SouthAmerica through 2035.
U.S. Energy Information Administration / International Energy Outlook 2010 69
Coal exports
Most of the world’s coal trade is in the form of steamcoal, at nearly 15 quadrillion Btu (about 70 percent oftotal coal exports) in 2008. The top five exporters ofsteam coal in 2008 were Indonesia, Australia, SouthAmerica (primarily Colombia), Russia, and southernAfrica (primarily South Africa). Although Indonesiacurrently is the world’s largest exporter of steam coal,exports from Australia exceed those from Indonesia on aBtu basis in most years of the projection. In terms of cok-ing coal, Australia, the United States, and Canada rankas the three top exporters and are expected to remain thetop three through 2035. Poland, Vietnam, and China areexpected to lower their coking coal exports in the longterm—for Poland, largely because of geological difficul-ties, and for Vietnam and China, because increasingdomestic demand for coal constrains exports.
Already the world’s leading exporter of coal (steam andcoking coal combined), Australia dominates futureinternational coal trade in the Reference case as it contin-ues to improve and expand its inland transportation andport infrastructure to expedite coal shipments to inter-national markets. For instance, a new coal terminal atKooragang Island in New South Wales will add about66 million tons of capacity, about half of which isexpected to be operational by 2011 [27]. Expansion ofQueensland’s Dalrymple Bay port in 2009 is expected toincrease its annual export capacity from about 75 milliontons to 94 million tons [28]. Australia remains the pri-mary exporter of metallurgical coal to Asian markets,supplying about 77 percent of Asia’s import demand forcoking coal in 2035, compared with about 71 percent in2008. Numerous mine expansions could add close to 100million tons of coal capacity by 2015, equivalent tonearly one-quarter of Australia’s coal production in2008. As of 2009, Australia’s primary supply choke pointappears to be in rail movement from mine to port.Although some improvements in this area have alreadytaken place, more needs to be done to accommodate theexpected growth in coal exports.
Indonesia, with its relatively low-cost surface mines, hasalso demonstrated its potential for significant growth incoal exports. Despite this potential, Indonesia’s govern-ment has been warning for years that it plans to restrictcoal exports in favor of domestic coal use. The rate ofexport growth slowed in 2009, probably due to the slow-down in global economic activity rather than concernsabout meeting domestic coal demand.
The Indonesian company Bumi Akit plans to add 37 mil-lion tons of export capacity over the next 5 to 6 years andis simultaneously involved in a rail project from itsSouth Sumatran reserves to the port of Lampung. Therail link, with a planned capacity of 20 million tons,should begin operation by 2013. Another Indonesiancompany, PT Adaro Energy Tbk, also plans to expand
coal production by about 44 million tons between 2009and 2014 [29].
Over the long term, areas of uncertainty for Indonesianexports include the rate of growth in its domestic coalconsumption; whether domestic coal demand is, in fact,given preference over coal exports; the adequacy of itsinternal transportation infrastructure; the continueddevelopment of new mines; and environmental con-cerns. In the Reference case Indonesia continues to be animportant source of coal supply for other nationsthrough 2035, but its exports increase only slightly, at anaverage annual rate of 0.4 percent.
South America remains the world’s third-largestcoal-exporting region in 2035, primarily as a result ofcontinued increases in exports from Colombia. The gov-ernment of Colombia expects the nation’s coal produc-tion to reach 160 million tons by 2019, up from about 87million tons in 2008 [30]. The expansion will require siz-able investments in mine capacity, rail infrastructure,and port capacity. Drummond Coal is now producingfrom its El Descanso mine, and it expects ultimately toattain export production of 40 million tons per yearthrough 2032 [31]. The El Hatillo mine is planning toincrease production from 1.8 million tons to 4.5 milliontons by 2011 [32].
Increasing coal transportation infrastructure is also aconcern for Colombia. There is a proposal to build a tun-nel that would expedite coal transportation via truck toColombia’s Pacific Ocean port of Buenaventura when itis completed in 2013. Another planned infrastructureproject, the Carare railway, now appears to be at riskbecause the government has decided not to providefinancial support for the project [33], which wasintended to facilitate coal transport from central Colom-bia to the Caribbean coast. Other expansion projects onColombia’s Caribbean coast appear to be on track,including a coal terminal at the port of Cienaga, PuertoNuevo, ultimately handling 66 million tons per year,roughly one-half of which would be available by 2013[34]. Brazil’s MPX is planning a coal export terminalalong the Colombia’s Atlantic seaboard with a capacityof 20 million tons per year [35]. An expanded river-to-port terminal at Barranquilla, Colombia, with anannual capacity of about 39 million tons, is also planned[36].
Many of Colombia’s port expansions lie on the Carib-bean near the eastward opening of the Panama Canal.Begun in 2008 and slated for completion by 2015, thePanama Canal expansion should enhance opportunitiesfor coal exports from both the United States and SouthAmerica traveling westward to Asian markets. Theso-called “post-panamax” vessels, which are capable ofholding about 20 percent more than current panamaxvessels, will be able to transit the Canal. Because manyports may not be able to accommodate the larger vessels
70 U.S. Energy Information Administration / International Energy Outlook 2010

without dredging, however, some opportunities couldbe limited.
South Africa’s coal exports have remained flat over thepast few years, primarily as a result of domestic infra-structure constraints; however, coal mining is expectedto continue playing an important role in South Africa’seconomy. Delays in the scheduled expansion of theRichards Bay Coal Terminal to an annual productivecapacity of 100 million tons have kept South Africa fromincreasing coal exports in recent years, but the project isscheduled for completion by the end of 2010[37]. Evenwith completion of the expansion, export levels still mayfall short of expectations because rail capacity into theport is limited. An additional Richards Bay terminalwith a capacity of 10 million tons has also been proposed[38].
Rail bottlenecks from coal basins to port facilities alsoappear to be Russia’s primary limitation in its efforts toexpand exports. Nevertheless, Russia has managed totriple its seaborne coal exports from 2000 levels to a totalof 76 million tons in 2008. The Russian mining and steelproduction company, Mechel, is on track to begin opera-tions at Russia’s Elga coking coal deposit in 2010 andultimately plans to produce 27 to 30 million tons peryear [39]. Russia’s coal exports to Asia will be facilitatedby capacity expansion at the new Pacific port of Muchka,where SUEK (Siberia’s coal energy company) has builtabout 13 million tons of an annual export capacity, andMechel has plans for about 28 million tons of exportcapacity at the new Muchka Bay Terminal 2 [40]. As in2008, Eurasia (primarily Russia) supplies 8 percent of thecoal traded internationally in 2035.
The African countries of Mozambique and Botswana areexpected to play an emerging role in world coal trade, asimporting countries seek to secure additional and diver-sified sources of supply. For example, India’s Tata Steel,Brazil’s Companhia Vale do Rio Doce (CVRD), and Aus-tralia’s Riversdale Mining all have financial stakes inmine operations in the Moatize basin of Mozambique[41]. The Moatize project, expected to be completed by2011, will produce between 9 to 14 million tons of mar-ketable coking coal and 3 to 5 million tons of thermalcoal [42]. An expansion of the port of Beira in Mozam-bique to handle an annual capacity of about 20 milliontons is also planned, and the rail link between Moatizecoal basin and Beira (Sena Railway) is being updated[43]. Landlocked Botswana is also interested in expand-ing coal mining and in constructing a railroad to connectinland coal mines to an Atlantic port on the Namibiancoast.
U.S. coal exports decline in the IEO2010 Referencecase from their high 2008 levels but remain steady,
contributing an average of about 1.6 quadrillion Btu peryear to international coal supply through 2035. Thegeographic distance of the United States from Asianmarkets—where much of the growth in coal demand iscentered—places it at a distinct disadvantage relative toother countries with large coal reserves (see box on page72). The comparatively high transportation costs associ-ated with shipping coal from the United States to Asianmarkets mean that U.S. coal exports cannot typicallycompete economically in that region. Thus, the UnitedStates remains a marginal supplier of world coal tradethroughout the projection period.
There have been recent shipments of coal to Japan fromAlaska, but the volumes have been small; likewise, east-ern U.S. miners have shipped small volumes to Asianmarkets. There is also some possibility that smaller coalshipments to Asia might be accommodated at other bulkterminals in Washington State in lieu of a dedicatedwestern coal terminal. Some coal has also shipped toAsian markets through Canada’s Westshore Terminal.
World coal reservesTotal recoverable reserves of coal around the world areestimated at 909 billion tons—reflecting a currentreserves-to-production ratio of 129 years (Table 10).20
Historically, estimates of world recoverable coalreserves, although relatively stable, have declined grad-ually from 1,145 billion tons in 1991 to 1,083 billion tonsin 2000 and 909 billion tons in 2008 [44]. Although thedecline in estimated reserves is sizable, the largereserves-to-production ratio for world coal indicatesthat sufficient coal will be available to meet demand wellinto the future. Further, because recoverable reservesare a subset of total coal resources, recoverable reserveestimates for a number of regions with large coalresource bases—notably, China and the United States—could increase substantially as coal mining technologyimproves and as additional geological assessments ofthe coal resource base are completed.
The most recent assessment of world coal reservesincludes a substantial downward adjustment for Africa,from 55 billion tons reported in the 2007 edition of theWorld Energy Council’s Survey of Energy Resources to 35billion tons in the 2009 interim update [45]. The update isbased on a new estimate for recoverable reserves inSouth Africa, which was derived on the basis of factorsthat include: a reduction in estimated reserves resultingfrom the subtraction of cumulative production by coal-field for the years 1982 through 2007 from previouslycompleted estimates of reserves; and some additions tothe reserve base resulting from several new assessmentsof coal resources in the Waterberg, Springbok Flats,Limpopo, and Free State coalfields.
U.S. Energy Information Administration / International Energy Outlook 2010 71
20 Recoverable reserves are those quantities of coal which geological and engineering information indicates with reasonable certainty canbe extracted in the future under existing economic and operating conditions. The reserves-to-production ratio is based on the reserves esti-mates and data on world coal production for 2007 shown in Table 9.
72 U.S. Energy Information Administration / International Energy Outlook 2010
Future role of the United States in world coal trade
U.S. coal exports increased each year from 2002 to 2008at an average annual rate of 12.8 percent, to 82 milliontons in 2008. Some analysts have viewed the sharpincrease in U.S. exports as an indication of the growingimportance of the United States as a world coal sup-plier. There has also been speculation that China’sgrowing demand for coal will support this trend in thefuture. However, U.S. coal is a relatively high-cost sup-ply source when shipped to Asian markets, and in thelong term U.S. coal will be competing in the Chinesemarket with lower cost suppliers, notably Australiaand Indonesia among others. U.S. exports competemost strongly in European markets and then onlywhen less expensive options are unavailable. In IEO-2010, the United States remains a marginal coalsupplier over the long term, responding to short-term disruptions or spikes in demand rather thansignificantly expanding its market share of world coaltrade.
International coal trade patterns can be parsed into twodistinct regions, the Atlantic region and the Pacificregion. The Americas and Europe are the primarydemand centers for international coal trade in theAtlantic region. Asia, dominated by Japan, SouthKorea, India, and China, is the demand stakeholder inthe Pacific region. Historically, geography has been acritical component in determining which suppliersserve which markets, with most suppliers primarilyserving only one region. The United States is consid-ered a marginal or “swing” supplier to both marketsbut rarely participates in the Pacific market, meaningthat the United States produces coal at a higher deliv-ered cost than other international suppliers and“swings in” to satisfy demand only when a supplyshortage occurs.
Competition is an important factor in assessing theability of the United States to take a larger share ofworld coal trade in the future. The cost of production,primarily the expense of mining, is just one of the costsinvolved in international trade. In terms of the cost ofproduction, the United States tends to be among themore expensive worldwide, primarily because mostcoal exports come from the Appalachian region, whichhas been mined more extensively than other U.S. coalbasins and generally has higher production costs.Beyond the costs of production, transportation costsassociated with moving export coal to port can also besubstantial, adding as much as an additional 30 to 50percent to the total cost for Appalachian coal. Oceanfreight rates to transport coal from the United States to
Asian markets tend to be volatile and are as much as 40percent higher than the freight costs for transportingcoal from Australia to Asia. As a result, the UnitedStates represents a less attractive option for satisfyingAsian coal demand in the long run.
U.S. coal exports to Asian markets might be more com-petitive if large volumes of western coal could beexported from the U.S. West Coast. However, the lackof a dedicated large coal terminal on the West Coastmakes it less likely that such an expansion will occur.Previous unsuccessful efforts to operate a western coalterminal also make new western coal ports less likely.In the late 1990s, substantial investments were made atthe Los Angeles Export Terminal to support coalexports, but the terminal closed in 2003 when the antic-ipated surge in U.S. coal exports to Asian markets didnot materialize. While Asia’s coal import demandgrew during that period, its demand for U.S. coal didnot.
The Atlantic markets of Europe and Canada currentlyaccount for the largest portion of U.S. coal exports(approximately three-fourths of total exports in recentyears). In 2008, the largest increases in U.S. coal exportswere destined for Europe rather than China. On aworldwide basis, international coal trade in 2008 wasaffected by significant supply disruptions in severalkey coal-exporting countries. Floods in Indonesia andAustralia affected mine operations, electricity short-ages closed mines in South Africa, and there wereshortages of rail cars in Russia and long queues at Aus-tralian ports. Some of the problems were unexpected,one-time events. For supply bottlenecks that are ongo-ing, infrastructure improvements are already beingundertaken.
In any case, temporary supply problems did raise theperception of ongoing limited global supplies, and as aresult the price of coal rose steeply. In 2008, the limitedamount of coal that typically flowed from suppliers inthe Pacific region to Europe was redirected to import-ers in the Pacific region, causing a ripple effect into theAtlantic region, where the United States was able tohelp fill the void by increasing its exports to consumersin the Atlantic region. The circumstances contributingto increased U.S. exports in 2008 are anomalies, how-ever, and not expected to be sustained in the long term.In fact, recently published data indicate that U.S. coalexports contracted by 27 percent in 2009—with Euro-pean imports from the United States declining byapproximately 25 percent.a
(continued on page 73)
aU.S. Energy Information Administration, Quarterly Coal Report, DOE/EIA-0121(2009/4Q), Table 7. U.S. Coal Exports, web site www.eia.gov/cneaf/coal/quarterly/html/t7p01p1.html.

U.S. Energy Information Administration / International Energy Outlook 2010 73
Future role of the United States in world coal trade (continued)
In the past decade, several new coal suppliers haveemerged to compete with the United States in supply-ing coal to the global marketplace. Colombia is the keyU.S. rival in the Atlantic market and is typically a lowercost producer than the United States. Colombia’sdomestic coal consumption is low, and so its invest-ments in the coal industry are dedicated to increasingcoal exports. Russia also has increased its market shareof coal supplied to European countries, the primarymarket for U.S. coal exports. Russia has substantialreserves of metallurgical coal, used in the steelmakingprocess, which is a market where the United States hasbeen more competitive internationally. Moreover, inthe long term Europe as a region is expected to rely lesson coal to meet its energy needs, so that the UnitedStates will face increasing competition from lower costColombian and Russian supplies to satisfy a decliningEuropean market for coal.
In the Asian markets, Australia has been systematicallyexpanding its export capability. In the next few yearsalone, Australian mining companies are planning toexpand their mining capacity by approximately 100million tons. Even in 2008, a year of high U.S. coalexports, Australia’s coal export volume was more than2.5 times the U.S. volume. Russia is also investing ininfrastructure, including ports to serve the Asian mar-ket. Its proximity to Asian importers could allow Rus-sia to become a key Asian supplier. Mongolia may also
be an important overland source of coal imports forChina, and Mozambique will soon be entering the coaltrade arena with its planned exports of both metallur-gical and thermal coal.
The United States is not a major supplier of coal toChina, but China has an indirect impact on the Atlanticmarket, and there could be years through 2035 inwhich events trigger temporary increases in U.S. coalexports to China. China’s demand for foreign coal isdriven by its growing coal consumption and how itsdomestic coal production costs compare with interna-tional coal prices. Given the limits on its own domesticcoal production, any unexpected capacity problemcould induce short-run bursts in China’s importdemand and, less directly, increases in global coalprices.
The higher the global prices, the more likely it is thatthe United States, as a high-cost supplier, will increaseits coal exports. China also has the option, if it decidesthat international coal prices are too high, of allowingits less efficient domestic coal mines to operate.Because the United States is a relatively high-costsupply source when its coal is shipped to Asian mar-kets, other suppliers—and not the United States—areexpected to meet most of China’s demand for coalimports from 2007 to 2035.
Table 10. World recoverable coal reserves as of January 1, 2008 (billion short tons)
Region/Country
Recoverable reserves by coal rank
2007production
Reserves-to-productionratio (years)
Bituminousand
anthraciteSubbitumi-
nous Lignite Total
World Total . . . . . . . . . . . . . . . . . . . . . . 452.9 291.4 165.1 909.4 7.0 129United Statesa. . . . . . . . . . . . . . . . . . . . . 119.6 108.7 33.3 261.6 1.1 228Russia. . . . . . . . . . . . . . . . . . . . . . . . . . . 54.1 107.4 11.5 173.1 0.3 543China . . . . . . . . . . . . . . . . . . . . . . . . . . . 68.6 37.1 20.5 126.2 2.7 46Other Non-OECD Europe and Eurasia. . 49.1 19.0 27.3 95.3 0.3 290Australia and New Zealand . . . . . . . . . . 40.6 2.5 41.5 84.6 0.4 195India . . . . . . . . . . . . . . . . . . . . . . . . . . . . 59.5 0.0 5.1 64.6 0.5 122Africa . . . . . . . . . . . . . . . . . . . . . . . . . . . 35.1 0.2 0.0 35.3 0.3 127OECD Europe. . . . . . . . . . . . . . . . . . . . . 9.3 3.4 19.0 31.7 0.7 48Other Central and South America . . . . . 7.7 1.1 0.0 8.8 0.1 102Other Non-OECD Asia . . . . . . . . . . . . . . 2.5 2.8 4.5 9.8 0.4 24Brazil. . . . . . . . . . . . . . . . . . . . . . . . . . . . 0.0 7.8 0.0 7.8 0.0 1,182Canada . . . . . . . . . . . . . . . . . . . . . . . . . . 3.8 1.0 2.5 7.3 0.1 96Otherb . . . . . . . . . . . . . . . . . . . . . . . . . . . 3.0 0.3 0.1 3.4 0.0 181aData for the United States represent recoverable coal estimates as of January 1, 2009.bIncludes Mexico, Middle East, Japan, and South Korea.Sources: World Energy Council and EIA.

Although coal deposits are widely distributed, 82 per-cent of the world’s recoverable reserves are located infive regions: the United States (29 percent), Russia (19percent), China (14 percent), other non-OECD Europeand Eurasia (10 percent), and Australia/New Zealand (9percent). In 2007 those five regions, taken together, pro-duced 4.9 billion tons (95.8 quadrillion Btu) of coal, rep-resenting 71 percent (74 percent on a Btu basis) of totalworld coal production [46]. By rank, anthracite and bitu-minous coal account for 50 percent of the world’s esti-mated recoverable coal reserves on a tonnage basis,subbituminous coal accounts for 32 percent, and ligniteaccounts for 18 percent.
Quality and geological characteristics of coal depositsare important parameters for coal reserves. Coal is a het-erogeneous source of energy, with quality (for example,characteristics such as heat, sulfur, and ash content)varying significantly by region and even within individ-ual coal seams. At the top end of the quality spectrumare premium-grade bituminous coals, or coking coals,used to manufacture coke for the steelmaking process.Coking coals produced in the United States have an esti-mated heat content of 26.3 million Btu per ton and rela-tively low sulfur content of approximately 0.8 percent byweight [47]. At the other end of the spectrum arereserves of low-Btu lignite. On a Btu basis, lignitereserves show considerable variation. Estimates pub-lished by the International Energy Agency for 2007 indi-cate that the average heat content of lignite in majorproducing countries varies from a low of 5.9 million Btuper ton in Greece to a high of 13.1 million Btu per ton inCanada [48].
References
74 U.S. Energy Information Administration / International Energy Outlook 2010
1. Ontario Power Generation, web site www.opg.com/power/fossil/index.asp; and B. Cassell,“Ontario Power Generation to Shut 4 of ItsRemaining Coal-Fired Units in 2010,” SNL Interac-tive (September 3, 2009), web site www.snl.com(subscription site).
2. Comision Federal de Electricidad (CFE), AnnualReport 2008 (September 2009), web site http://app.cfe.gob.mx/informe2008; and “Mexico’s CFETo Import 3 Million mt/year for Petacalco Plant,”Platts Coal Trader International, Vol. 9, No. 52 (March16, 2009), pp. 1and 3, web site www.platts.com(subscription site).
3. “PiE’s New Plant Tracker—January 2010,” Power inEurope, No. 568 (January 25, 2010); “PiE’s New PlantTracker—January 2010, Feeble Demand Kills OrderActivity,” Power in Europe, No. 568 (January 25,2010); “EIEE Power Plant Tracker; October 2009,”Platts Energy in Eastern Europe, No. 174 (October 9,2009); and “EIEE Power Plant Tracker; October2009: Country-by-Country Breakdown on NewCapacity Under Construction,” Platts Energy inEastern Europe, No. 174 (October 9, 2009).
4. Ministry of Knowledge, Korea Power Exchange,The 4th Basic Plan of Long-Term Electricity Supply andDemand (2008-2022) (December 2008), web sitewww.kepco.co.kr/kepco_new/invest/down/annual/pdf/2008_eng.pdf.
5. International Energy Agency, “Databases for CoalInformation: 2009 Edition: World Coal Supply andConsumption,” web site http://data.iea.org (sub-scription site).
6. World Steel Association, Steel Statistical Yearbook2009 (March 3, 2010), web site www.worldsteel.org/?action=publicationdetail&id=97.
7. “EIEE Power Plant Tracker; October 2009,” PlattsEnergy in Eastern Europe, No. 174 (October 9, 2009);and “EIEE Power Plant Tracker; October 2009:Country-by-Country Breakdown on New CapacityUnder Construction,” Platts Energy in EasternEurope, No. 174 (October 9, 2009).
8. Eskom, Annual Report 2009 (July 2009), web sitewww.eskom.co.za/annreport09; and Eskom, NewBuild News, No. 9 (September/October 2009), website www.eskom.co.za/live/content.php?Item_ID=5981.
9. World Bank, “South Africa: Eskom Investment Sup-port Project;” web site http://go.worldbank.org/VZRNV0H6G0.
10. G. York, “South Africa Drags Heels on CanadianBid To Build Power Plant” (March 16, 2010), website www.theglobeandmail.com/globe-investor/south-africa-drags-heels-on-canadian-power-plant-bid/article1501368/; S. Sikuka, “SouthernAfrica: SADC Takes Investment Drive to Europe forEnergy Sector” (March 4, 2010), web sitehttp://allafrica.com/stories/201003040417.html;B. Benza, “Construction of 600 MW Morupule BPower Station Begins” (February 22, 2010), web sitehttp://allafrica.com/stories/201002221996.html;and “Mozambique: Coal Fired Power StationApproved” (January 25, 2010), web site http://allafrica.com/stories/201001251531.html.

U.S. Energy Information Administration / International Energy Outlook 2010 75
11. Sasol, Sasol Facts 2009: Your Blueprint to the Worldof Sasol (May 2009), web site http://sasol.investoreports.com/sasol_sf_2009; and U.S. EnergyInformation Administration, International EnergyStatistics database (as of November 2009), web sitewww.eia.gov/emeu/international.
12. Republic of South Africa, Department: Mineralsand Energy, South Africa’s Mineral Industry 2007/2008 (December 2008), p. 46.
13. World Steel Association (worldsteel), Download2009 graphs and figures.pdf (January 22, 2010),web site www.worldsteel.org/pictures/newsfiles/2009%20graphs%20and%20figures.pdf; and U.S.Energy Information Administration, InternationalEnergy Statistics database (as of November 2009),web site www.eia.gov/emeu/international.
14. “Steel Industry to Receive US$39.8bn InvestmentsThrough 2016,” Business News Americas (February 5,2010); and B. Cassell, “Consultant: US Met CoalSales to Brazil Could Double by 2016,” SNL DailyCoal Report, Vol. 4, Issue 21 (February 2, 2010), p. 3,web site www.snl.com (subscription site).
15. World Steel Association (worldsteel), Steel Statisti-cal Yearbook 2009 (March 3, 2010), web site www.worldsteel.org/?action=publicationdetail&id=97.
16. U.S. Energy Information Administration, Interna-tional Energy Annual 2006 (June-December 2008),Table 2.5, web site www.eia.gov/emeu/iea.
17. Y. Inoue and H. Lawson, “Japan’s Sumitomo CorpEyes Russia’s Elga Coal Mine,” Reuters (November21, 2007), web site http://uk.reuters.com/article/oilRpt/idUKT26814420071121; and B. Cassell,“Japan’s Mitsui Takes Bigger Stake in Canada’sCline Mining,” SNL Interactive (July, 9, 2008), website www.snl.com (subscription site).
18. World Steel Organization, “World Crude Steel Pro-duction Decreases by 1.2% in 2008,” web site www.worldsteel.org/?action=newsdetail&id=257.
19. “Plants Shift Coal Import From Haldia,” The HinduBusiness Line (January 11, 2010), web site www.blonnet.com/2009/11/09/stories/2009110950230500.htm.
20. “Paradip Port Invites Financial Bids for 2 Deep-Draught Berths,” Business Line (January 6, 2009),web site www.mjunction.in/market_news/logistics_1/paradip_port_invites_financial.php;and “Govt Clears Three Port Projects Worth Rs2,000 cr,” The Economic Times (January 9, 2009), website http://mjunction.in/market_news/logistics_1/paradip_port_invites_financial.php.
21. “We Have Achieved Growth Without AdditionalCapacity,” The Hindu Business Line (March 30, 2009),web site www.blonnet.com/2009/03/30/ stories/2009033050591200.htm.
22. “Mormugao To Boost Coal Handling,” The HinduBusiness Line (February 8, 2010), web site www.blonnet.com/2010/02/08/stories/2010020850620500.htm.
23. B. Mukherji, “Reforms Seen Failing To RemoveIndian Mine Shackles,” Reuters (October 7,2007), web site www.reuters.com/article/companyNewsAndPR/idUSSP7159720071009; andWorld Steel Organization, “World Crude SteelProduction Decreases by 1.2% in 2008,” web sitewww.worldsteel.org/?action=newsdetail&id=257.
24. C. Dougherty, “Germany Finds Solution to ItsWithering Coal Mines,” International Herald Tribune(June 14, 2007), web site www.iht.com.
25. W. Browning and K. Morgan, “Coal Markets in2009: Let the Games Begin Anew,” Presentation tothe 7th Annual Coal Trading Conference, December11-12, New York, NY, World Coal Trading Associa-tion, Events, web site www.coaltrade.org/events/documents/Browning.pdf.
26. “Jim Walters Links Mine and Port Expansions,”Argus Coal Transportation Report, Vol. 26, No. 23(November 6, 2007), p. 5.
27. I. Kirkwood, “Deciphering the Coal Industry,” TheNewcastle Herald (January 3, 2009), web site www.nswtrains.com.au/nsw-trains-articles/2009/1/3/deciphering-the-coal-industry.
28. T. Grant-Taylor, “Australia’s Dalrymple Bay CoalTerminal Expansion Delayed,” Herald Sun (May 29,2008), web site www.news.com.au/heraldsun/story/0,21985,23774661-664,00.html.
29. Adaro Energy, “Production & Sales Volume,” website www.adaro.com/operation/86.
30. “Government Aims To Have Coal Production ofChile, Peru by 2019: Colombia,” BN Mining News(June 9, 2009).
31. T. Muse, “Drummond Shifts First Exports From ElDescanso,” Platts International Coal Report, Vol. 16,Issue 924 (June 15, 2009).
32. “Activities & Prospects In Coal Exporting &Importing Countries,” Tex Energy Report (Septem-ber 7, 2009); and “Colombia Moves Ahead on PortExpansions,” Argus Coal Transportation Report, Vol.28, No. 4 (January 29, 2009), pp. 6-7.
33. “Colombia Suspends Coal Rail Project,” Argus CoalTransportation Report, Vol. 98, No. 8 (February 23,2010), p. 6.

76 U.S. Energy Information Administration / International Energy Outlook 2010
34. “Colombia: Ausenco Gets Engineering Contract forPuerto Nuevo,” South American Business Information(December 31, 2009).
35. “MPX Secures Logistics Solution to IntegratedMining System in Colombia Through Acquisitionof Strategic Site to Build Port,” Marketwire (January21, 2010).
36. “Colombia Moves Ahead on Port Expansions,”Argus Coal Transportation Report, Vol. 28, No. 4 (Jan-uary 29, 2008), pp. 6-7.
37. Richards Bay Coal Terminal Company, “Phase VExpansion,” web site www.rbct.co.za/default.asp?id=1087 (not dated).
38. “FACTBOX- South Africa’s Rail And Port Bottle-necks,” Reuters (December 10, 2009), web sitereuters.com.
39. CNN News, “Mechel Announces Progress inDeveloping Elga Coking Coal Deposit” (February17, 2010), web site www.money.cnn.com/news/newsfeeds/articles/globenewswire/184481.htm.
40. “SUEK of Russia Started Coal Shipments to JapanThrough Muchka; Two Cargoes of 20,000 MT EachAfter Turn of the Year,” Tex Energy Report (February3, 2009), web site www.texreport.co.jp/xenglish(subscription site); and I. Zhitomirsky, Mechel,News, “Mechel OAO Commences Construction ofCoal Transshipment Complex at Vanino Port” (Sep-tember 9, 2008), web site www.mechel.com/news/article.wbp?article-id=96E8D4FA-6F89-42F6-A6ED-E0664ABC37CD.
41. “Moatize Basin Shaping Up As a Coal Province—Riversdale,” Steel Guru (September 11, 2008), website http://steelguru.com/news/index/2008/09/11/NjI2NDA%3D/Moatize_Basin_shaping_up_as_ a_coal_province_-_Riversdale.html.
42. “Coal Production at Moatize Concession Signifi-cantly Expanded; Hard Coking Coal Production ToBe Raised to 12.7 Million MT From 8.5 Million MT,”Tex Energy Report (September 9, 2009); and “ValeRaising Its Coal Production to 40 mil mt by 2016;Pursuing Projects in Mozambique, Australia and SoOn,” Tex Energy Report (October 21, 2009).
43. C. Mangwiro, “Mozambique in Talks To Fund $180Mln Coal Terminal,” Reuters (September 29, 2007),web site www.reuters.com/article/bondsNews/idUSL2920474220070929.
44. U.S. Energy Information Administration, Interna-tional Energy Annual 1991, DOE/EIA-0219(91)(Washington, DC, December 1992), Table 33; andInternational Energy Annual 2001, DOE/EIA-0219(2001) (Washington, DC, March 2003), Table 8.2.
45. World Energy Council, Survey of Energy Resources:Interim Update 2009 (London, UK, June 2009).
46. U.S. Energy Information Administration, Interna-tional Energy Statistics database (as of November2009), “Total Primary Coal Production,” web sitewww.eia.gov/emeu/international.
47. U.S. Energy Information Administration, FormEIA-5, “Quarterly Coal Consumption and QualityReport, Coke Plants.”
48. International Energy Agency, Coal Information 2009(Paris, France, July 2009), “2007 Country SpecificAverage Net Calorific Values,” pp. xi and xxvii.Note: The International Energy Agency’s “net calo-rific” conversion factors were increased by 5 per-cent to better match conversion factors publishedby EIA, which are reported on an “as received”basis.

Chapter 5
ElectricityWorld electricity generation increases by 87 percent from 2007 to 2035
in the IEO2010 Reference case. Non-OECD countries account for
61 percent of world electricity use in 2035.
OverviewWorld net electricity generation increases by an averageof 2.3 percent per year from 2007 to 2035 in the IEO2010Reference case. Electricity supplies an increasing shareof the world’s total energy demand and grows fasterthan liquid fuels, natural gas, and coal in all end-use sec-tors except transportation. From 1990 to 2007, growth innet electricity generation outpaced the growth in totalenergy consumption (1.9 percent per year and 1.3 per-cent per year, respectively), and the growth in demandfor electricity continues to outpace growth in totalenergy use throughout the projection period (Figure 67).
World net electricity generation increases by 87 percentin the Reference case, from 18.8 trillion kilowatthours in2007 to 25.0 trillion kilowatthours in 2020 and 35.2 tril-lion kilowatthours in 2035 (Table 11). Although therecent economic downturn slowed the rate of growth inelectricity use in 2008 and resulted in no change in elec-tricity use in 2009, the Reference case projection expectsgrowth in electricity use to return to pre-recession trendrates by 2015.
The impact of the recession on electricity consumptionhas been felt most keenly in the industrial sector.Demand in the building sector (the residential and com-mercial sectors) is less sensitive to changing economicconditions than it is in the industrial sector, because
people generally continue to consume electricity forspace heating and cooling, cooking, refrigeration, light-ing, and water heating, even in a recession.
In general, projected growth in OECD countries, whereelectricity markets are well established and consump-tion patterns are mature, is slower than in non-OECDcountries, where a large amount of demand goes unmetat present. The electrification of historically off-gridareas plays a strong role in projected growth trends. TheInternational Energy Agency estimates that 22 percentof the world’s population did not have access to electric-ity in 2008—a total of about 1.5 billion people [1].Regionally, sub-Saharan Africa is worst off: more than71 percent of the population currently remains withoutaccess to power. With strong economic growth and tar-geted government programs, however, electrificationcan occur quickly. In Vietnam, for example, the govern-ment’s rural electrification program increased access topower from 51 percent of rural households in 1996 to 95percent by the end of 2008 [2].
Non-OECD nations consumed 46 percent of the world’stotal electricity supply in 2007, and their share of worldconsumption is poised to increase over the projectionperiod. In 2035, non-OECD nations account for 61 per-cent of world electricity use, while the OECD sharedeclines to 39 percent (Figure 68). Total net electricity
U.S. Energy Information Administration / International Energy Outlook 2010 77
1990 2000 2007 2015 2025 20350
1
2
3
4History Projections
Totalenergy
consumption
Netelectricitygeneration
Figure 67. Growth in world electric powergeneration and total energy consumption,1990-2035 (index, 1990 = 1)
1990 2000 2007 2015 2025 20350
5
10
15
20
25History Projections
OECD
Non-OECD
Figure 68. World net electricity generationby region, 1990-2035 (trillion kilowatthours)

generation in non-OECD countries increases by an aver-age of 3.3 percent per year in the Reference case, led bynon-OECD Asia (including China and India), withannual increases averaging 4.1 percent from 2007 to 2035(Figure 69). In contrast, net generation among OECDnations grows by an average of only 1.1 percent per yearfrom 2007 to 2035.
The Reference case does not include any carbon emis-sions caps or prices. However, the IEO2010 Referencecase does incorporate national energy policies that arecurrently active, such as the European Union’s“20-20-20” plan and its member states’ nuclear policies;China’s wind capacity targets; and India’s NationalSolar Mission.
The projection for total electricity generation in 2030 is0.3 percent lower in the IEO2010 Reference case than itwas in last year’s outlook, largely because the impact ofthe recession in the near term was more severe thananticipated in last year’s projection. Compared withIEO2009, the generation mix in 2030 in IEO2010 alsochanges. For example, liquids-fired generation is 11 per-cent lower than in IEO2009, both natural gas andcoal-fired generation are about 5 percent higher, nuclearpower generation is 9 percent higher, and generationfrom renewable sources is 10 percent higher.
Electricity supply by energy sourceThe mix of primary fuels used to generate electricityhas changed a great deal over the past four decades ona worldwide basis. Coal continues to be the fuelmost widely used for electricity generation, although
78 U.S. Energy Information Administration / International Energy Outlook 2010
Table 11. OECD and Non-OECD net electricity generation by energy source, 2007-2035(trillion kilowatthours)
Region 2007 2015 2020 2025 2030 2035
Average annualpercent change,
2007-2035
OECDLiquids . . . . . . . . . . . . . . . . . . . . 0.3 0.3 0.3 0.3 0.3 0.2 -1.0Natural gas . . . . . . . . . . . . . . . . 2.2 1.9 2.2 2.5 2.9 3.1 1.4Coal . . . . . . . . . . . . . . . . . . . . . . 3.9 3.8 3.8 3.8 4.0 4.2 0.3Nuclear . . . . . . . . . . . . . . . . . . . 2.2 2.4 2.5 2.6 2.7 2.8 1.0Renewables . . . . . . . . . . . . . . . . 1.6 2.3 2.6 2.9 3.1 3.2 2.5
Total OECD. . . . . . . . . . . . . . . 10.1 10.7 11.4 12.2 12.9 13.6 1.1Non-OECDLiquids . . . . . . . . . . . . . . . . . . . . 0.6 0.6 0.5 0.5 0.5 0.6 -0.2Natural gas . . . . . . . . . . . . . . . . 1.7 2.2 2.8 3.2 3.6 3.7 2.8Coal . . . . . . . . . . . . . . . . . . . . . . 4.1 5.1 6.0 7.3 9.0 10.8 3.6Nuclear . . . . . . . . . . . . . . . . . . . 0.4 0.7 1.0 1.3 1.5 1.7 5.0Renewables . . . . . . . . . . . . . . . . 1.8 2.7 3.2 3.7 4.3 4.8 3.5
Total Non-OECD. . . . . . . . . . . 8.6 11.2 13.6 16.1 18.8 21.6 3.3WorldLiquids . . . . . . . . . . . . . . . . . . . . 0.9 0.9 0.8 0.8 0.8 0.8 -0.4Natural gas . . . . . . . . . . . . . . . . 3.9 4.2 5.0 5.8 6.4 6.8 2.1Coal . . . . . . . . . . . . . . . . . . . . . . 7.9 8.8 9.8 11.2 12.9 15.0 2.3Nuclear . . . . . . . . . . . . . . . . . . . 2.6 3.1 3.6 3.9 4.2 4.5 2.0Renewables . . . . . . . . . . . . . . . . 3.5 5.0 5.8 6.6 7.3 8.0 3.0
Total World . . . . . . . . . . . . . . . 18.8 21.9 25.0 28.3 31.6 35.2 2.3
Note: Totals may not equal sum of components due to independent rounding.
1990 2000 2007 2015 2025 20350
4
8
12
Central and South America
Europe and Eurasia
Middle East and Africa
India and Other Asia
China
History Projections
Figure 69. Non-OECD net electricity generationby region, 1990-2035 (trillion kilowatthours)

generation from nuclear power increased rapidly fromthe 1970s through the 1980s, and natural-gas-fired gen-eration grew rapidly in the 1980s and 1990s. The use ofoil for electricity generation has been declining since themid-1970s, when oil prices rose sharply.
High fossil fuel prices recorded between 2003 and 2008,combined with concerns about the environmental con-sequences of greenhouse gas emissions, have renewedinterest in the development of alternatives to fossilfuels—specifically, nuclear power and renewableenergy sources. In the IEO2010 Reference case, long-term prospects continue to improve for generation fromboth nuclear and renewable energy sources—supportedby government incentives and by high fossil fuel prices.Coal and natural gas are the second and third fastest-growing sources of energy for electricity generation inthe projection (Table 11), but the outlook for coal, in par-ticular, could be altered substantially by any futurenational policies or international agreements that aim toreduce or limit the growth of greenhouse gas emissions.
Coal
In the IEO2010 Reference case, coal continues to fuel thelargest share of worldwide electric power production bya wide margin (Figure 70). In 2007, coal-fired generationaccounted for 42 percent of world electricity supply; in2035, its share increases slightly to 43 percent. Sustainedhigh prices for oil and natural gas make coal-fired gener-ation more attractive economically, particularly innations that are rich in coal resources, including Chinaand India. World net coal-fired generation nearly dou-bles over the projection period, from 7.9 trillionkilowatthours in 2007 to 15.0 trillion kilowatthours in2035.
The outlook for coal-fired generation could be alteredsubstantially by national policies or international agree-ments to reduce greenhouse gas emissions. The electric
power sector offers some of the most cost-effectiveopportunities for reducing carbon dioxide emissions inmany countries. Coal is both the world’s most widelyused source of energy for power generation and also themost carbon-intensive energy source. If a cost, eitherimplicit or explicit, were applied to carbon dioxide emis-sions, there are several alternative no- or low-emissiontechnologies that currently are commercially proven orunder development, which could be used to replacesome coal-fired generation. Implementing the technolo-gies would not require expensive, large-scale changes inthe power distribution infrastructure or in electricity-using equipment.
Natural gas
Over the 2007 to 2035 projection period, natural-gas-fired electricity generation increases by 2.1 percent peryear. Generation from natural gas worldwide increasesfrom 3.9 trillion kilowatthours in 2007 to 6.8 trillionkilowatthours in 2035, but the total amount of electricitygenerated from natural gas continues to be less thanone-half the total for coal, even in 2035. Natural-gas-fired combined-cycle technology is an attractive choicefor new power plants because of its fuel efficiency, oper-ating flexibility (it can be brought online in minutesrather than the hours it takes for coal-fired and someother generating capacity), relatively short planning andconstruction times, relatively low emissions, and rela-tively low capital costs.
Liquid fuels and other petroleum
With world oil prices projected to return to relativelyhigh levels, reaching $133 per barrel (in real 2008 dollars)in 2035, liquid fuels are the only energy source for powergeneration that does not grow on a worldwide basis.Most nations are expected to respond to higher oil pricesby reducing or eliminating their use of oil for genera-tion—opting instead for more economical sources ofelectricity, including coal and nuclear. Generation fromliquid fuels decreases by 0.4 percent per year, from 0.9trillion kilowatthours in 2007 to 0.8 trillion kilowatt-hours in 2035. Modest growth in liquid fuels generationin the later years of the projection, particularly in theMiddle East, is more than offset by decline in all otherregions.
Nuclear power
Electricity generation from nuclear power increasesfrom about 2.6 trillion kilowatthours in 2007 to 4.5 tril-lion kilowatthours in 2035, as concerns about rising fos-sil fuel prices, energy security, and greenhouse gasemissions support the development of new nuclear gen-eration capacity. High prices for fossil fuels allownuclear power to become economically competitivewith generation from coal, natural gas, and liquid fuelsdespite the relatively high capital costs associated with
U.S. Energy Information Administration / International Energy Outlook 2010 79
2007 2015 2020 2025 2030 20350
5
10
15
20
LiquidsNuclear
RenewablesNatural gas
Coal
Figure 70. World net electricity generation by fuel,2006-2030 (trillion kilowatthours)
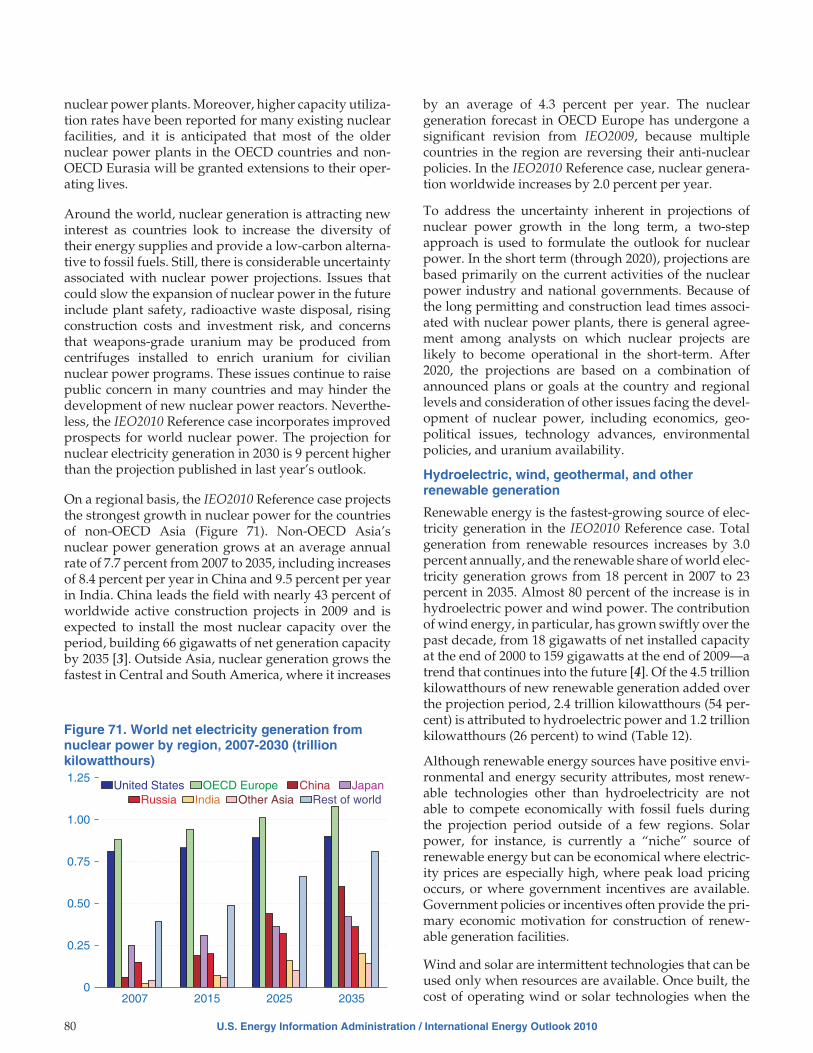
nuclear power plants. Moreover, higher capacity utiliza-tion rates have been reported for many existing nuclearfacilities, and it is anticipated that most of the oldernuclear power plants in the OECD countries and non-OECD Eurasia will be granted extensions to their oper-ating lives.
Around the world, nuclear generation is attracting newinterest as countries look to increase the diversity oftheir energy supplies and provide a low-carbon alterna-tive to fossil fuels. Still, there is considerable uncertaintyassociated with nuclear power projections. Issues thatcould slow the expansion of nuclear power in the futureinclude plant safety, radioactive waste disposal, risingconstruction costs and investment risk, and concernsthat weapons-grade uranium may be produced fromcentrifuges installed to enrich uranium for civiliannuclear power programs. These issues continue to raisepublic concern in many countries and may hinder thedevelopment of new nuclear power reactors. Neverthe-less, the IEO2010 Reference case incorporates improvedprospects for world nuclear power. The projection fornuclear electricity generation in 2030 is 9 percent higherthan the projection published in last year’s outlook.
On a regional basis, the IEO2010 Reference case projectsthe strongest growth in nuclear power for the countriesof non-OECD Asia (Figure 71). Non-OECD Asia’snuclear power generation grows at an average annualrate of 7.7 percent from 2007 to 2035, including increasesof 8.4 percent per year in China and 9.5 percent per yearin India. China leads the field with nearly 43 percent ofworldwide active construction projects in 2009 and isexpected to install the most nuclear capacity over theperiod, building 66 gigawatts of net generation capacityby 2035 [3]. Outside Asia, nuclear generation grows thefastest in Central and South America, where it increases
by an average of 4.3 percent per year. The nucleargeneration forecast in OECD Europe has undergone asignificant revision from IEO2009, because multiplecountries in the region are reversing their anti-nuclearpolicies. In the IEO2010 Reference case, nuclear genera-tion worldwide increases by 2.0 percent per year.
To address the uncertainty inherent in projections ofnuclear power growth in the long term, a two-stepapproach is used to formulate the outlook for nuclearpower. In the short term (through 2020), projections arebased primarily on the current activities of the nuclearpower industry and national governments. Because ofthe long permitting and construction lead times associ-ated with nuclear power plants, there is general agree-ment among analysts on which nuclear projects arelikely to become operational in the short-term. After2020, the projections are based on a combination ofannounced plans or goals at the country and regionallevels and consideration of other issues facing the devel-opment of nuclear power, including economics, geo-political issues, technology advances, environmentalpolicies, and uranium availability.
Hydroelectric, wind, geothermal, and otherrenewable generation
Renewable energy is the fastest-growing source of elec-tricity generation in the IEO2010 Reference case. Totalgeneration from renewable resources increases by 3.0percent annually, and the renewable share of world elec-tricity generation grows from 18 percent in 2007 to 23percent in 2035. Almost 80 percent of the increase is inhydroelectric power and wind power. The contributionof wind energy, in particular, has grown swiftly over thepast decade, from 18 gigawatts of net installed capacityat the end of 2000 to 159 gigawatts at the end of 2009—atrend that continues into the future [4]. Of the 4.5 trillionkilowatthours of new renewable generation added overthe projection period, 2.4 trillion kilowatthours (54 per-cent) is attributed to hydroelectric power and 1.2 trillionkilowatthours (26 percent) to wind (Table 12).
Although renewable energy sources have positive envi-ronmental and energy security attributes, most renew-able technologies other than hydroelectricity are notable to compete economically with fossil fuels duringthe projection period outside of a few regions. Solarpower, for instance, is currently a “niche” source ofrenewable energy but can be economical where electric-ity prices are especially high, where peak load pricingoccurs, or where government incentives are available.Government policies or incentives often provide the pri-mary economic motivation for construction of renew-able generation facilities.
Wind and solar are intermittent technologies that can beused only when resources are available. Once built, thecost of operating wind or solar technologies when the
80 U.S. Energy Information Administration / International Energy Outlook 2010
2007 2015 2025 20350.00
0.25
0.50
0.75
1.00
1.25United States OECD Europe China Japan
Russia India Other Asia Rest of world
Figure 71. World net electricity generation fromnuclear power by region, 2007-2030 (trillionkilowatthours)

resource is available is generally much less than the costof operating conventional renewable generation. How-ever, high construction costs can make the total cost tobuild and operate renewable generators higher thanthose for conventional power plants. The intermittenceof wind and solar can further hinder the economic com-petitiveness of those resources, as they are not operator-controlled and are not necessarily available when theywould be of greatest value to the system. The use ofenergy storage (such as hydroelectric pumped storage,compressed air storage, and batteries) and a wide geo-graphic dispersal of wind and solar generating facilitiescould mitigate many of the problems associated withintermittence in the future.
Changes in the mix of renewable fuels used for electric-ity generation differ between the OECD and non-OECDregions in the IEO2010 Reference case. In OECD nations,the majority of economically exploitable hydroelectricresources already have been captured; with the excep-tions of Canada and Turkey, there are few large-scalehydroelectric projects planned for the future. As a result,most renewable energy growth in OECD countries
comes from nonhydroelectric sources, especially windand biomass. Many OECD countries, particularly thosein Europe, have government policies, including feed-intariffs,21 tax incentives, and market share quotas, thatencourage the construction of renewable electricityfacilities.
In non-OECD countries, hydroelectric power isexpected to be the predominant source of renewableelectricity growth. Strong growth in hydroelectric gen-eration, primarily from mid- to large-scale power plants,is expected in China, India, Brazil, and a number ofnations in Southeast Asia, including Malaysia and Viet-nam. Growth rates for wind-powered generation arealso high in non-OECD countries. The most substantialadditions of electricity supply generated from windpower are centered in China.
The IEO2010 projections for renewable energy sourcesinclude only marketed renewables. Non-marketed (non-commercial) biomass from plant and animal resources,while an important source of energy, particularly in thedeveloping non-OECD economies, is not included in the
U.S. Energy Information Administration / International Energy Outlook 2010 81
Table 12. OECD and Non-OECD net renewable electricity generation by energy source, 2007-2035(billion kilowatthours)
Region 2007 2015 2020 2025 2030 2035
Average annualpercent change,
2007-2035
OECDHydropower . . . . . . . . . . . . . . . . 1,246 1,384 1,460 1,530 1,585 1,624 0.9Wind. . . . . . . . . . . . . . . . . . . . . . 144 525 671 803 846 898 6.8Geothermal . . . . . . . . . . . . . . . . 37 57 61 66 73 80 2.8Solar . . . . . . . . . . . . . . . . . . . . . 6 85 104 107 114 122 11.6Other . . . . . . . . . . . . . . . . . . . . . 195 253 318 398 456 485 3.3
Total OECD. . . . . . . . . . . . . . . 1,628 2,303 2,614 2,904 3,074 3,208 2.5Non-OECDHydropower . . . . . . . . . . . . . . . . 1,753 2,305 2,706 3,061 3,449 3,795 2.8Wind. . . . . . . . . . . . . . . . . . . . . . 21 157 231 312 388 457 11.7Geothermal . . . . . . . . . . . . . . . . 21 41 47 52 68 80 5.0Solar . . . . . . . . . . . . . . . . . . . . . 0 10 23 33 39 44 21.7Other . . . . . . . . . . . . . . . . . . . . . 40 141 196 255 317 389 8.4
Total Non-OECD. . . . . . . . . . . 1,834 2,654 3,203 3,714 4,263 4,764 3.5WorldHydropower . . . . . . . . . . . . . . . . 2,999 3,689 4,166 4,591 5,034 5,418 2.1Wind. . . . . . . . . . . . . . . . . . . . . . 165 682 902 1,115 1,234 1,355 7.8Geothermal . . . . . . . . . . . . . . . . 57 98 108 119 142 160 3.7Solar . . . . . . . . . . . . . . . . . . . . . 6 95 126 140 153 165 12.7Other . . . . . . . . . . . . . . . . . . . . . 235 394 515 653 773 874 4.8
Total World . . . . . . . . . . . . . . . 3,462 4,958 5,817 6,618 7,336 7,972 3.0
Note: Totals may not equal sum of components due to independent rounding.
21 A feed-in tariff is a financial incentive that encourages the adoption of renewable electricity. Under a feed-in tariff, government legisla-tion requires electric utilities to purchase renewable electricity at a higher price than the wholesale price. This allows the renewable genera-tor to achieve a positive return on its investment despite the higher costs associated with these resources.

projections because comprehensive data on its use arenot available. Off-grid distributed renewables (renew-able energy consumed at the site of production, such asoff-grid photovoltaic panels) are not included in the pro-jections for the same reason.
Regional electricity outlooksIn the IEO2010 Reference case, the highest growth ratesfor electricity generation are in non-OECD nations,where strong economic growth and rising personalincomes drive the growth in demand for electric power.In OECD countries—where electric power infrastruc-tures are relatively mature, national populations gener-ally are expected to grow slowly or decline, and GDPgrowth is slower than in the developing nations—demand for electricity grows much more slowly. In theReference case, electricity generation in non-OECDnations increases by 3.3 percent per year, as comparedwith 1.1 percent per year in OECD nations.
OECD electricity
North America
North America currently accounts for the largestregional share of world electricity generation, with 27percent of the total in 2007. That share declines as non-OECD nations experience fast-paced growth in demandfor electric power. In 2035, North America accounts foronly 19 percent of the world’s net electric powergeneration.
The United States is by far the largest consumer of elec-tricity in North America (Figure 72). U.S. electricity gen-eration—including both generation by electric powerproducers and on-site generation—increases slowly, atan average annual rate of 0.8 percent from 2007 to 2035.Canada, like the United States, has a mature electricitymarket, and its generation increases by 1.2 percentper year over the same period. Mexico’s electricity
generation grows at a faster rate—averaging 3.2 percentper year through 2035—reflecting the present less-developed state of the country’s electric power infra-structure (and thus the greater potential for expansion)relative to Canada and the United States.
There are large differences in the mix of energy sourcesused to generate electricity in the three countries thatmake up OECD North America, and those differencesare likely to become more pronounced in the future(Figure 73). In the United States, coal is the leadingsource of energy for power generation, accounting for 49percent of the 2007 total. In Canada, hydroelectricityprovided 59 percent of the nation’s electricity generationin 2007. Most of Mexico’s electricity generation is cur-rently fueled by petroleum-based liquid fuels and natu-ral gas, which together accounted for 63 percent of itstotal electricity generation in 2007. In the Reference case,U.S. reliance on coal decreases to 44 percent in 2035;Canada’s hydropower continues to be the predominantenergy source for electricity generation, although itsshare of the total falls to 54 percent in 2035; and the natu-ral gas share of Mexico’s total electricity generationincreases from 37 percent in 2007 to 63 percent in 2035.
Generation from renewable energy sources in theUnited States increases in response to requirements inmore than half of the 50 States for minimum renewablegeneration or capacity shares. Renewable generation inthe IEO2010 Reference case is substantially higher thanin recent IEO projections, as the share of generation com-ing from renewable energy sources grows from 8.5 per-cent in 2007 to 17.0 percent in 2035. Net installedcapacity of wind power increased by 39 percent, equal tonearly 10 gigawatts, in 2009 alone [5]. The AmericanRecovery and Reinvestment Act of 2009 directed $16.8billion into energy efficiency and renewable energy andanother $4.0 billion into loan guarantees for renewableenergy [6]. U.S. federal subsidies for renewable genera-tion are assumed to expire as enacted. If those subsidies
82 U.S. Energy Information Administration / International Energy Outlook 2010
1990 1995 2000 2007 2015 2020 2025 2030 20350
2
4
6
8
United States
Canada
MexicoHistory Projections
Figure 72. Net electricity generation inNorth America, 1990-2035 (trillion kilowatthours)
United States
2007
2035
Canada
2007
2035
Mexico
2007
2035
0 20 40 60 80 100
Other renewables Nuclear
Coal Liquids Natural gas Hydropower
Figure 73. Net electricity generation in NorthAmerica by fuel, 2007 and 2035 (percent of total)

were extended, however, a larger increase in renewablegeneration would be expected.
Electricity generation from nuclear power plantsaccounts for 17.1 percent of total U.S. generation in 2035in the IEO2010 Reference case. From 2007 to 2035, theUnited States adds 8.4 gigawatts of new capacity and 4.0gigawatts from expansions at existing plants. No U.S.nuclear plants are retired in the Reference case. Despitethe increasing estimated costs of new nuclear plants,growth in nuclear power is expected to be spurred bythe rising costs of natural-gas-fired generation, concernsabout greenhouse gas emissions (which limit additionsof coal-fired plants in the projection), and favorable U.S.policies.
In Canada, generation from natural gas increases by 4.0percent per year from 2007 to 2035, nuclear by 2.1 per-cent per year, hydroelectricity by 0.9 percent per year,and wind by 10.7 percent per year. Oil-fired generationand coal-fired generation, on the other hand, declineby 1.0 percent per year and 0.6 percent per year,respectively.
In Ontario—Canada’s largest provincial electricity con-sumer—the government plans to close its four coal-firedplants (Atikokan, Lambton, Nanticoke, and ThunderBay) by December 31, 2014, citing environmental andhealth concerns [7]. Units 1 and 2 of Lambton and units 3and 4 of Nanticoke are scheduled to be decommissionedby the end of 2010 [8]. The government plans to replacecoal-fired generation with natural gas, nuclear, hydro-power, and wind. It also plans to increase conservationmeasures. At present, coal provides about 19 percent ofOntario’s electric power. With the planned retirementsin Ontario, Canada’s coal-fired generation declines fromabout 115 billion kilowatthours in 2007 to 97 billionkilowatthours in 2035.
The renewable share of Canada’s overall generationremains roughly constant throughout the projection.Hydroelectric power is, and is expected to remain, theprimary source of electricity in Canada. In 2007, hydro-electric generation provided 59 percent of the country’stotal generation; it falls to 54 percent in 2035. Wind-powered generation, in contrast, is the fastest growingsource of new energy in Canada; its share increases from1 percent to 6 percent over the projection period.
As one of the few OECD countries with large untappedhydroelectric potential, Canada currently has severallarge- and small-scale hydroelectric facilities eitherplanned or under construction. Hydro-Québec is contin-uing the construction of a 768-megawatt facility nearEastmain and a smaller 150-megawatt facility at Sarcellein Québec, both of which are expected to be fullycommissioned by 2012 [9]. Other hydroelectric projects
are under construction, including the 1,550-megawattRomaine River project in Québec and the 200-megawattWuskwatim project in Manitoba [10]. The IEO2010 Ref-erence case does not anticipate that all planned projectswill be constructed, but given Canada’s past experiencewith hydropower and the commitments for construc-tion, new hydroelectric capacity accounts for 22,910megawatts of additional renewable capacity added inCanada between 2007 and 2035.
Canada also has plans to continue expanding its windpower capacity. From 3.1 gigawatts of installed capacityat the end of 2009 [11], the total increases to nearly17.5 gigawatts in 2035 in the Reference case. Growth inwind capacity has been so rapid that Canada’s federalwind incentive program, “ecoENERGY for RenewablePower,” which targeted the deployment of 4 gigawattsof renewable energy by 2011, allocated all of its fundingand met its target by the end of 2009 [12].
In addition to the incentive programs of Canada’s fed-eral government, several provincial governments haveinstituted their own incentives to support the construc-tion of new wind capacity. Ontario’s Renewable EnergyStandard Offer Program has helped support robustgrowth in wind installations over the past several years,and installed wind capacity in the province has risenfrom 0.6 megawatts in 1995 to 1,168 megawatts in Janu-ary 2010 [13]. The Standard Offer Program pays all smallrenewable energy generators (those with installedcapacity less than 10 megawatts) 11 cents (Canadian) perkilowatthour of electricity delivered to local electricitydistributors [14]. Continued support from Canada’s fed-eral and provincial governments—along with the sus-tained higher fossil fuel prices in the IEO2010 Referencecase—is expected to provide momentum for the pro-jected increase in the country’s use of wind power forelectricity generation.
Mexico’s electricity generation increases by an averageof 3.2 percent annually from 2007 to 2035—more thandouble the rate for Canada and almost quadruple therate for the United States. The Mexican governmenthas recognized the need for the country’s electricityinfrastructure to keep pace with the fast-paced growthanticipated for electricity demand. In July 2007, the gov-ernment unveiled its 2007-2012 National InfrastructureProgram, which included plans to invest $25.3 billion toimprove and expand electricity infrastructure [15]. Aspart of the program, the government has set a goal toincrease installed generating capacity by 8.6 gigawattsfrom 2006 to 2012. The country is well on its way tomeeting the government target. The 1,135-megawattTamazunchale combined-cycle plant became opera-tional in June 2007, and several other plants under con-struction will bring on line another 1,304 megawatts in2010 and 750 megawatts in 2012 [16].
U.S. Energy Information Administration / International Energy Outlook 2010 83

Most of the increase in Mexico’s electricity generation inthe IEO2010 Reference case is fueled by natural gas, asthe Mexican government implements plans to reducethe country’s use of diesel and fuel oil in the power sec-tor [17]. Natural-gas-fired generation is more than qua-drupled in the projection, from 90 billion kilowatthoursin 2007 to 369 billion kilowatthours in 2035. The result-ing growth in Mexico’s demand for natural gas stronglyoutpaces its growth in production, leaving the countrydependent on pipeline imports from the United Statesand LNG from other countries. Currently, Mexico hasone LNG import terminal, Altamira, operating on theGulf Coast and another, Costa Azul, on the Pacific Coast.A contract tender for a third terminal at Manzanillo, alsoon the Pacific Coast, was awarded in March 2008, andthe project is scheduled for completion by 2011 [18].
Although much of the growth in Mexico’s electric powersector is expected to be in the form of natural-gas-firedgeneration, renewable energy resources are the secondfastest-growing source of generation in the projection.Mexico’s renewable generation increases by 2.9 percentper year from 2007 to 2035, compared with 5.2 percentper year for natural-gas-fired generation. The country’scurrent renewable generation energy mix is split largelybetween hydroelectricity (73 percent) and geothermalenergy (19 percent). Two major hydroelectric projectsare underway: the 750-megawatt La Yesca facility,scheduled for completion by 2012, and the planned900-megawatt La Parota project, which has beendelayed and may not be completed until 2018[19]). In theIEO2010 Reference case, hydroelectric power increasesby 2.3 percent per year and accounts for more than 60percent of Mexico’s total net generation from renewableenergy sources in 2035.
Although there is virtually no wind or solar generationin Mexico at present, the Mexican government’s goal ofinstalling 2.5 gigawatts of wind capacity on theTehuantepec Isthmus by 2012 is expected to encouragewind development in the short term [20]. Furthermore,Mexico’s goal of reducing national greenhouse gas emis-sions to 50 percent of the 2002 levels by 2050 will spurwind and solar installations, and those two forms ofrenewable electricity account for double-digit growthover the projection period [21]. Their combined share oftotal renewable electricity generation rises from lessthan 1 percent in 2007 to 10 percent in 2035.
OECD Europe
Electricity generation in the nations of OECD Europeincreases by an average of 1.1 percent per year in theIEO2010 Reference case, from 3.4 trillion kilowatthoursin 2007 to 4.4 trillion kilowatthours in 2030 and 4.6 tril-lion kilowatthours in 2035. Because most of the countriesin OECD Europe have relatively stable populations andmature electricity markets, most growth in electricity
demand is expected to come from those nations withmore robust population growth (including Turkey,Ireland, and Spain) and from the newest OECD mem-bers (including the Czech Republic, Hungary, andPoland), whose economic growth rates exceed theOECD average through the projection period. In addi-tion, as environmental concerns remain prominent inthe region, there is a concerted effort in the industrialsector to switch from coal and liquid fuels to electricity.
Renewable energy is OECD Europe’s fastest-growingsource of electricity generation in the Reference case(Figure 74), growing by 2.6 percent per year through2035. The increase is almost entirely from nonhydro-power sources. OECD Europe’s leading position world-wide in wind power capacity is maintained through2035, with growth in generation from wind sourcesaveraging 6.5 percent per year, even though the Refer-ence case assumes no enactment of additional legislationto limit greenhouse gas emissions. Strong growth in off-shore wind capacity is currently underway, with 577megawatts added to the grid in 2009, representing anincrease of 54 percent over capacity added in 2008 [22].
The growth of nonhydropower renewable energysources in OECD Europe is encouraged by some of theworld’s most favorable renewable energy policies. TheEuropean Union has set a binding target to produce 21percent of electricity generation from renewable sourcesby 2010 [23] and has reaffirmed the goal of increasingrenewable energy use with its December 2008 “climateand energy policy,” which mandates that 20 percent oftotal energy production must come from renewables by2020 [24]. Approximately 21 percent of the EuropeanUnion’s electricity came from renewable sources in 2007.
The IEO2010 Reference case does not anticipate that allfuture renewable energy targets in the European Unionwill be met on time. Nevertheless, current laws are
84 U.S. Energy Information Administration / International Energy Outlook 2010
2007 2015 2020 2025 2030 20350.0
0.5
1.0
1.5
2.0
Liquids
Nuclear
RenewablesNatural gas
Coal
Figure 74. Net electricity generation in OECDEurope by fuel, 2007-2035 (trillion kilowatthours)

expected to lead to the construction of more renewablecapacity than would have occurred in their absence. Inaddition, some individual countries provide economicincentives to promote the expansion of renewable elec-tricity. Germany, Spain, and Denmark—the leaders inOECD Europe’s installed wind capacity—have enactedfeed-in tariffs (FITs) that guarantee above-market ratesfor electricity generated from renewable sources and,typically, last for 20 years after a project’s completion. Aslong as European governments support such pricepremiums for renewable electricity, robust growth inrenewable generation is likely to continue.
There have been drawbacks, however, to relying onFITs. Spain’s generous solar subsidy led to an overabun-dance of solar photovoltaic (PV) projects in the countryin 2008, overheating the global PV market and commit-ting Spanish taxpayers to an estimated $26.5 billion tocover the total FIT costs over the lifetime of the projects.When the Spanish FIT was lowered after September2008, a PV supply glut resulted, driving down the priceof solar panels and lowering profits throughout theindustry [25]. Germany has been considering a reduc-tion of its solar FIT to avoid the same outcome.
Natural gas is the second fastest-growing source ofpower generation after renewables in the outlook forOECD Europe, increasing at an average rate of 1.3 per-cent per year from 2007 to 2035. Although growth still isstrong, considering that total electricity demandincreases by only 1.1 percent per year, it is slower thanthe 2.3-percent annual increase projected for natural-gas-fired generation in last year’s outlook. The differ-ence results primarily from revised growth projectionsfor the region’s nuclear and, to a lesser extent, renewablegeneration.
Nuclear power has gained renewed interest in Europe asconcerns about greenhouse gas emissions and secureelectricity supplies have increased. Electricity genera-tion from nuclear power increases slightly over the pro-jection period, as compared with a slight decrease inIEO2009. Many European nations that were previouslyopposed to nuclear power have revisited their stances,and Sweden and Italy reversed their nuclear policies inthe first half of 2009. Further, Belgium has postponed itsnuclear phaseout by 10 years [26], and the German gov-ernment elected in September 2009 has announced itsplans to rescind Germany’s phaseout policy [27].
Renewed interest and moves to reverse legislative banson nuclear power have led to more license extensionsand fewer retirements of operating nuclear power plantsthan were expected in previous outlooks. In addition,the IEO2010 Reference case anticipates some new buildsin France, Finland, Poland, Turkey, and possibly othercountries of OECD Europe. As a result, OECD Europe’s
total nuclear capacity increases from 131 gigawatts in2007 to 144 gigawatts in 2035.
The new assessment of the potential for nuclear powerin OECD Europe results in a substantial change in theprojected fuel mix compared to last year’s outlook. Inthe IEO2009 Reference case, natural gas generation inOECD Europe was expected to exceed nuclear genera-tion in 2015, and in 2030 natural gas generation exceedednuclear generation by nearly 40 percent. The IEO2010Reference case instead projects that regional nucleargeneration will remain greater than natural-gas-firedgeneration until 2035, when electricity generation totalsfrom the two sources are expected to be approximatelyequal.
Coal accounted for nearly 30 percent of OECD Europe’snet electricity generation in 2007, but concerns about thecontribution of carbon dioxide emissions to climatechange could reduce that share in the future. In the IEO-2010 Reference case, electricity from coal slowly loses itsprominence in OECD Europe, decreasing by 0.3 percentper year from 2007 to 2035 and ultimately falling behindrenewables, natural gas, and nuclear energy as a sourceof electricity.
OECD Asia
Total electricity generation in OECD Asia increases byan average of 1.0 percent per year in the Reference case,from 1.7 trillion kilowatthours in 2007 to 2.3 trillionkilowatthours in 2035. Japan accounts for the largestshare of electricity generation in the region today andcontinues to do so in the mid-term projection, despitehaving the slowest-growing electricity market in theregion and the slowest among all OECD countries, aver-aging 0.5 percent per year, as compared with 1.0 percentper year for Australia/New Zealand and 2.1 percent peryear for South Korea (Figure 75). Japan’s electricity mar-kets are well established, and its aging population and
U.S. Energy Information Administration / International Energy Outlook 2010 85
2007 2015 2020 2025 2030 20350.0
0.5
1.0
1.5Japan South Korea Australia/New Zealand
Figure 75. Net electricity generation in OECD Asia,2007-2035 (trillion kilowatthours)

relatively slow projected economic growth in the mid-term translate into slow growth in demand for electricpower. In contrast, both Australia/ New Zealand andSouth Korea are expected to have more robust economicand population growth, leading to more rapid growth indemand for electricity.
The fuel mix for electricity generation varies widelyamong the three economies that make up the OECDAsia region. In Japan, natural gas, coal, and nuclearpower make up the bulk of the current electric powermix, with natural gas and nuclear accounting for about51 percent of total generation and coal another 31 per-cent. The remaining portion is split between renewablesand petroleum-based liquid fuels. Japan’s reliance onnuclear power increases over the projection period, from24 percent of total generation in 2007 to 34 percent in2035. The natural gas share of generation declinesslightly over the same period, from 28 percent to 27 per-cent, and coal’s share declines to 23 percent, beingdisplaced by nuclear and—to a much smaller extent—renewable energy sources.
Solar power, increasing by 27.2 percent per year from2007 to 2035, is Japan’s fastest growing source of renew-able electricity, although it starts from a negligibleamount in 2007. A recipient of favorable governmentpolicies, the growth in solar power outpaces windpower, which increases by 3.8 percent per year. Bothsolar and wind power, however, remain minor sourcesof electricity, each supplying less than 1 percent of totalgeneration in 2035, as compared with hydropower’s8-percent share.
Australia and New Zealand, as a region, rely on coal forabout 70 percent of electricity generation, based largelyon Australia’s rich coal resource base (9 percent of theworld’s total coal reserves). The remaining regional gen-eration is supplied by natural gas and renewable energysources—mostly hydropower, wind, and, in New Zea-land, geothermal. The Australia/New Zealand regionuses negligible amounts of oil for electricity generationand no nuclear power, and that is not expected to changeover the projection period. Natural-gas-fired generationis expected to grow strongly in the region, at 2.4 percentper year from 2007 to 2035, reducing the coal share to 58percent in 2035.
In South Korea, coal and nuclear power currently pro-vide 43 percent and 34 percent of total electricity genera-tion, respectively. Natural-gas-fired generation growsquickly in the Reference case, but despite a near dou-bling of electricity generation from natural gas, its shareof total generation increases only slightly, from 17 per-cent in 2007 to 18 percent in 2035. Coal and nuclearpower continue to provide most of South Korea’s elec-tricity generation, with a combined 78 percent of totalelectricity in 2035.
Non-OECD electricity
Non-OECD Europe and Eurasia
Total electricity generation in non-OECD Europe andEurasia grows at an average rate of 1.6 percent per yearin the IEO2010 Reference case, from 1.6 trillion kilowatt-hours in 2007 to 2.2 trillion kilowatthours in 2030 and 2.5trillion kilowatthours in 2035. Russia, with the largesteconomy in non-OECD Europe and Eurasia, accountedfor around 60 percent of the region’s total generation in2007 and is expected to retain approximately that sharethroughout the period (Figure 76).
Natural gas and nuclear power supply much of thegrowth in electricity generation in the region. Althoughnon-OECD Europe and Eurasia has nearly one-third ofthe world’s total proved natural gas reserves, somecountries, notably Russia, plan to export natural gasinstead of burning it for electricity. As a result, natural-gas-fired generation grows modestly in the outlook, atan average annual rate of 1.2 percent from 2007 to 2035.
Generation from nuclear power grows strongly in theregion, averaging 2.8 percent per year. Much of theincrease is expected in Russia, which continues to shiftgeneration from natural gas to nuclear because naturalgas exports are more profitable than the domestic use ofnatural gas for electricity generation.
In 2006, the Russian government released Resolution605, which set a federal target program for nuclearpower development. Although the federal target pro-gram was updated and scaled back in July 2009 due tothe recession, eight nuclear power reactors still areslated for completion by 2015 [28]. According to the Rus-sian plan, an additional 40 reactors are to be constructedby 2030, raising Russia’s nuclear generating capacity by2 gigawatts per year from 2012 to 2014 and by 3 giga-watts per year from 2014 to 2020 [29]. This plan would
86 U.S. Energy Information Administration / International Energy Outlook 2010
2007 2015 2020 2025 2030 20350.0
0.4
0.8
1.2
1.6Russia Other
Figure 76. Net electricity generation in Non-OECDEurope and Eurasia, 2007-2035(trillion kilowatthours)

bring total capacity to 40 gigawatts and increase nucleargeneration to 25 or 30 percent of total generation in 2030[30]. The IEO2010 Reference case takes a more conserva-tive view of the rate at which new nuclear power plantswill come online in Russia and assumes some delay inmeeting the current construction schedule. In the Refer-ence case, Russia’s existing 23 gigawatts of nuclear gen-erating capacity is supplemented by a net total of 5gigawatts by 2015 and another 20 gigawatts by 2035.
Renewable generation in non-OECD Europe and Eur-asia, almost entirely from hydropower facilities, in-creases relatively slowly, by an average of 1.3 percentper year, largely as a result of repairs and expansionsat existing sites. The repairs include reconstruction ofturbines in the 6.4-gigawatt Sayano-Shushenskayahydroelectric plant, which was damaged in an August2009 accident that killed 75 people. Repairs are expectedto be completed no earlier than 2012 [31]. Notable newprojects include the 3-gigawatt Boguchanskaya Hydro-electric Power Station in Russia and the 3.6-gigawattRogun Dam in Tajikistan. Construction began onBoguchanskaya in 1980 and on Rogun in 1976, but workceased when the former Soviet Union experienced eco-nomic difficulties in the 1980s. Despite the recent reces-sion, construction continues on Boguchanskaya, whichis on track for completion by 2012 [32]. In May 2008,Tajikistan’s president announced that construction hadresumed on Rogun Dam, although it is still uncertainhow the large project will be financed [33]. Growth ofnonhydropower renewable generation is projected to besmall.
Non-OECD Asia
Non-OECD Asia—led by China and India—has the fast-est projected regional growth in electric power genera-tion worldwide, averaging 4.1 percent per year from2007 to 2035 in the Reference case. Although the globaleconomic recession has an impact on the region’s short-term economic growth, in the long term the economiesof non-OECD Asia are expected to expand strongly,with corresponding increases in demand for electricityin both the building and industrial sectors. Total electric-ity generation in non-OECD Asia rises by 42 percentfrom 2007 to 2015, from 4.8 trillion kilowatthours to 6.8trillion kilowatthours. Electricity demand increases by56 percent between 2015 and 2025, and by another 40percent between 2025 and 2035. In 2035, net generationin non-OECD Asia totals 14.8 trillion kilowatthours inthe Reference case.
Coal accounts for more than two-thirds of electricitygeneration in non-OECD Asia (Figure 77), dominated bygeneration in China and India. Both countries alreadyrely heavily on coal to produce electric power. In 2007,coal’s share of generation was an estimated 80 percent inChina and 71 percent in India. Under existing policies, it
is likely that coal will remain the predominant source ofpower generation in both countries. In the IEO2010Reference case, coal’s share of electricity generationdeclines to 74 percent in China and 51 percent in India in2035.
Non-OECD Asia leads the world in installing newnuclear capacity in the IEO2010 Reference case, account-ing for 48 percent of the net increment in nuclear capac-ity worldwide (or 102 gigawatts of the total 211-gigawattincrease). China, in particular, has aggressive plans fornuclear power, with 21 nuclear power plants currentlyunder construction and a total of 66 gigawatts of newcapacity expected to be installed by 2035 [34]. Thenuclear share of total generation in China increases from2 percent in 2007 to 6 percent in 2035.
India also has plans to boost its nuclear power genera-tion. From 4 gigawatts of installed nuclear power capac-ity in operation today, India has set an ambitious goal ofincreasing its nuclear generating capacity to 20 giga-watts by 2020 and to as much as 63 gigawatts by 2032[35]. Five nuclear reactors are currently under construc-tion, three of which are scheduled for completion by theend of 2010 [36]. The IEO2010 Reference case assumes asomewhat slower increase in nuclear capacity than whatis anticipated by India’s government. The outlook pro-jects that an additional 23 gigawatts of net installedcapacity will become operational by 2035.
In addition to China and India, several other countries innon-OECD Asia are expected to begin or expand nuclearpower programs. In the Reference case, new nuclearpower capacity is installed in Vietnam, Indonesia, andPakistan by 2020. The impact of high fossil fuel prices,combined with concerns about security of energy sup-plies and greenhouse gas emissions, leads many nationsin the region to consider diversifying the fuel mix fortheir power generation by adding a nuclear component.
U.S. Energy Information Administration / International Energy Outlook 2010 87
2007 2015 2020 2025 2030 20350
2
4
6
8
10
Nuclear
Renewables
LiquidsNatural gas
Coal
Figure 77. Net electricity generation in Non-OECDAsia by fuel, 2007-2035 (trillion kilowatthours)

Electricity generation from renewable energy sources innon-OECD Asia grows at an average annual rate of 5.0percent, increasing the renewable share of the region’stotal generation from 15 percent in 2007 to 20 percent in2035. Small-, mid-, and large-scale hydroelectric facili-ties all contribute to the projected growth. Several coun-tries in non-OECD Asia have hydropower facilitieseither planned or under construction, including Viet-nam, Malaysia, Pakistan, and Myanmar (the formerBurma). Almost 50 hydropower facilities, with acombined 3,398 megawatts of capacity, are under con-struction in Vietnam’s Son La province, including the2,400-megawatt Son La and 520-megawatt Houi Quangprojects, both of which are scheduled for completionbefore 2015 [37]. Malaysia expects to complete its 2,400-megawatt Bakun Dam by 2011, although the project hasexperienced delays and setbacks in the past [38]. Paki-stan and Myanmar also have substantial hydropowerdevelopment plans, but those plans have been dis-counted in the IEO2010 Reference case to reflect the twocountries’ historical difficulties in acquiring foreigndirect investment for infrastructure projects.
India has plans to more than double its installedhydropower capacity by 2030. In its Eleventh andTwelfth Five-Year Plans, which span 2007 through 2017,India’s Central Electricity Authority has identified 40.9gigawatts of hydroelectric capacity that it intends tobuild. Although the IEO2010 Reference case does notassume that all the planned capacity will be completed,more than one-third of the announced projects are underconstruction already and are expected to be completedby 2020 [39].
India’s federal government is attempting to provideincentives for the development of hydropower acrossthe nation. Legislation has been proposed to allow pri-vate hydroelectric power developers to be eligible over a5-year period for a tariff that would guarantee a fixedreturn on investment and allow generators to improvetheir returns by selling up to 40 percent of their electric-ity on the spot market. In addition, India’s federalhydropower intentions are being supported by stateauthorities. The state government in Himachal Pradeshhas plans to commercialize a substantial portion of thestate’s reported 21 gigawatts of hydroelectric powerpotential, adding 5.7 gigawatts of hydroelectric capacitybefore 2015, which would nearly double the existingcapacity [40]. At the end of 2009, 11 projects with a com-bined installed capacity of 4.4 gigawatts were in devel-opment in Himachal Pradesh [41].
Similar to India, China also has many large-scale hydro-electric projects under construction. The 18.2-gigawattThree Gorges Dam project’s final generator went on linein October 2008, and the Three Gorges Project Develop-ment Corporation plans to further increase the project’stotal installed capacity to 22.4 gigawatts by 2012 [42]. In
addition, work continues on the 12.6-gigawatt Xiluoduproject on the Jinsha River, which is scheduled for com-pletion in 2015 as part of a 14-facility hydropower devel-opment plan [43]. China also has the world’s secondtallest dam (at nearly 985 feet) currently under construc-tion, as part of the 3.6-gigawatt Jinping I project on theYalong River. It is scheduled for completion in 2014 aspart of a plan by the Ertan Hydropower DevelopmentCompany to construct 21 facilities with 34.6 gigawatts ofhydroelectric capacity on the Yalong [44].
The Chinese government has set a 300-gigawatt targetfor hydroelectric capacity in 2020. Including those men-tioned above, the country has a sufficient number of pro-jects under construction or in development to meet thetarget. China’s aggressive hydropower developmentplan is expected to increase hydroelectricity generationby 3.9 percent per year, almost tripling the country’stotal hydroelectricity generation by 2035.
Although hydroelectric projects dominate the renew-able energy mix in non-OECD Asia, generation fromnonhydroelectric renewable energy sources, especiallywind, is also expected to grow significantly. At the endof 2008, China completed installation of its 10th gigawattof wind capacity, achieving its 2010 target a full yearahead of the schedule set out by the National Develop-ment and Reform Commission [45]. In May 2009, Chinaincreased its 2020 wind capacity target from 30gigawatts to 100 gigawatts [46]. Although that goal hasbeen discounted in the IEO2010 Reference case becauseof indications that up to one-third of Chinese installedwind capacity is not grid-connected [47], the new targetis expected to significantly increase the rate of windfarm construction. In the IEO2010 Reference case, elec-tricity generation from wind plants in China grows by15.6 percent per year, from 6 billion kilowatthours in2007 to 374 billion kilowatthours in 2035.
New government policies in China and India are alsoencouraging the growth of solar generation. Under its“Golden Sun” program, announced in July 2009, theChinese Ministry of Finance plans to subsidize 50 per-cent of the construction costs of grid-connected solarplants [48]. India’s National Solar Mission, launched inNovember 2009, aims to have 20 gigawatts of installedsolar capacity (both PV and solar thermal) by 2020, 100gigawatts by 2030, and 200 gigawatts by 2050 [49].India’s targets have been discounted in the IEO2010 Ref-erence case because of the substantial uncertainty aboutthe future of government-provided financial incentives[50]. However, the policies support robust growth ratesin solar generation for China and India, at 19 percent peryear and 27 percent per year, respectively, in the IEO-2010 Reference case.
Geothermal energy, while a small contributor to non-OECD Asia’s total electricity generation, plays an
88 U.S. Energy Information Administration / International Energy Outlook 2010

important role in the Philippines and Indonesia. Withthe second largest amount of installed geothermalcapacity in the world, the Philippines generated almost18 percent of its total electricity from geothermal sourcesin 2008 [51]. Indonesia, with the fifth largest installedgeothermal capacity, generated 5 percent of its electric-ity from geothermal energy in 2007 and has more than 20gigawatts of geothermal potential available [52]. Boththe Philippines and Indonesia have announced plans toincrease their installed geothermal capacities in the com-ing years. Indonesia’s plans include 3.9 gigawatts of netinstalled capacity that it intends to build by 2014 [53].
Middle East
Electricity generation in the Middle East region growsby 2.5 percent per year in the Reference case, from 0.7trillion kilowatthours in 2007 to 1.3 trillion kilowatt-hours in 2035. The region’s young and rapidly growingpopulation, along with a strong increase in nationalincome, is expected to result in rapid growth in demandfor electric power. Iran, Saudi Arabia, and the UnitedArab Emirates (UAE) account for two-thirds of theregional demand for electricity, and demand hasincreased sharply over the past several years in each ofthe countries. From 2000 to 2007, Iran’s net generationincreased by an average of 7.9 percent per year; SaudiArabia’s by 6.1 percent per year; and the UAE’s by 9.6percent per year.
The Middle East depends on natural gas and petroleumliquid fuels to generate most of its electricity and is pro-jected to continue that reliance through 2035 (Figure 78).In 2007, natural gas supplied 57 percent of electricitygeneration in the Middle East and liquid fuels 35 per-cent. In 2035, the natural gas share is projected to be 68percent and the liquid fuels share 21 percent. There hasbeen a concerted effort by many of the petroleum
exporters in the region to develop their natural gasresources for use in domestic power generation. Petro-leum is a valuable export commodity for many nationsin the Middle East, and there is increasing interest in theuse of domestic natural gas for electricity generation inorder to make more oil assets available for export.
Other energy sources make only minor contributions toelectricity supply in the Middle East. Israel is the onlycountry in the region that uses significant amounts ofcoal to generate electric power [54], and Iran and theUAE are the only ones projected to add nuclear capacity.Other Middle Eastern countries recently have expressedsome interest in increasing both coal-fired and nucleargeneration, however, in response to concerns aboutdiversifying the electricity fuel mix and meeting theregion’s fast-paced growth in electricity demand. Forexample, Oman announced in 2008 that it would con-struct the Persian Gulf’s first coal-fired power plant atDuqm [55]. According to the plan, the 1-gigawatt plantwill power a water desalinization facility and will befully operational by 2016 [56]. The UAE, Saudi Arabia,and Bahrain also have considered adding coal-firedcapacity [57].
In addition to Iran, several other Middle Eastern nationshave announced intentions to pursue nuclear powerprograms in recent years. In 2007, the six-nation GulfCooperation Council22 completed a feasibility study, incooperation with the International Atomic EnergyAgency, of the potential for a regional nuclear powerand desalinization program, while also announcingtheir intention to pursue a peaceful nuclear program[58].
The UAE government in 2008 announced plans to havethree 1.5-gigawatt nuclear power plants completed by2020 and has since signed nuclear cooperation agree-ments with France, Japan, the United Kingdom, and theUnited States [59]. In December 2009, the EmiratesNuclear Energy Corporation in the UAE selected aSouth Korean consortium to build four nuclear reactors,with construction planned to begin in 2012 [60]. Jordanalso has announced its intention to add nuclear capacity[61], and in 2009 the Kuwaiti cabinet announced that itwould form a national committee on nuclear energy usefor peaceful purposes [62]. Even given the considerableinterest in nuclear power that has arisen in the region,however, IEO2010 expects that economic and politicalissues, in concert with the long lead times usually associ-ated with beginning a nuclear program, will mean thatany reactors built in the Middle East over the course ofthe projection will be located in Iran or the UAE.
Although there is little economic incentive for countriesin the Middle East to increase their use of renewableenergy sources (the renewable share of the region’s total
U.S. Energy Information Administration / International Energy Outlook 2010 89
2007 2015 2020 2025 2030 20350.0
0.2
0.4
0.6
0.8
1.0
Liquids
NuclearRenewables
Natural gas
Coal
Figure 78. Net electricity generation in theMiddle East by fuel, 2007-2035(trillion kilowatthours)
22 Gulf Cooperation Council members are Saudi Arabia, Kuwait, Bahrain, the United Arab Emirates, Qatar, and Oman.

electricity generation increases from only 3 percent in2007 to 5 percent in 2035 in the Reference case), therehave been some recent developments in renewableenergy use in the region. Iran, which generated 10 per-cent of its electricity from hydropower in 2009, is devel-oping 94 new hydroelectric power plants, 5 of which areexpected to come on line before March 2010 [63]. Con-struction also continues on Masdar City in Abu Dhabi, a“zero carbon” city that will be powered by 190 mega-watts of PV cells and 20 megawatts of wind power [64].The city, which was chosen as the interim headquartersof the International Renewable Energy Agency and cur-rently has a 10-megawatt PV array, is on track to be com-pleted in 2016 [65].
Africa
Demand for electricity in Africa grows at an averageannual rate of 2.6 percent in the IEO2010 Reference case.Fossil-fuel-fired generation supplied 81 percent of theregion’s total electricity in 2007, and reliance on fossilfuels is expected to continue through 2035. Coal-firedpower plants, which were the region’s largest source ofelectricity in 2007, accounting for 45 percent of total gen-eration, provide a 39-percent share in 2035; and natural-gas-fired generation expands strongly, from 25 percentof the total in 2007 to 39 percent in 2035 (Figure 79).
At present, South Africa’s two nuclear reactors arethe only commercial reactors operating in the region,accounting for about 2 percent of Africa’s total electricitygeneration. Reports suggest that, due to Eskom’s financeproblems and the termination of government funding,the construction of a new Pebble Bed Modular Reactor inSouth Africa will be delayed indefinitely [66]. The SouthAfrican government plans to have another 4 gigawattsof nuclear capacity on line by mid-2018. In addition,Egypt’s government has plans to construct a nuclearreactor, having signed a nuclear power cooperationagreement with Russia in 2008 and awarded a contract
to U.S.-based Bechtel to design the new power plant,with tentative plans for a location at Dabaa, about 100miles west of Alexandria [67]. In the Reference case, 2.3gigawatts of net nuclear capacity becomes operational inAfrica over the 2007-2035 period, although only SouthAfrica is expected to complete construction of any reac-tors. The nuclear share of the region’s total generationincreases to 3 percent in 2035.
Generation from hydropower and other marketedrenewable energy sources is expected to grow relativelyslowly in Africa. As they have in the past, non-marketedrenewables are expected to continue providing energyto Africa’s rural areas; however, it is often difficult forAfrican nations to find funding or international supportfor larger commercial projects. Plans for several hydro-electric projects in the region have been advancedrecently, and they may help boost supplies of marketedrenewable energy in the mid-term. Several (althoughnot all) of the announced projects are expected to becompleted by 2035, allowing the region’s consumptionof marketed renewable energy to grow by 2.2 percentper year from 2007 to 2035. For example, Ethiopiafinished work on two hydroelectric facilities in 2009:the 300-megawatt Takeze power station and the 420-megawatt Gilgel Gibe II. A third plant, the 460-mega-watt Tana Beles, is expected to be operational in the firsthalf of 2010 [68].
Central and South America
Electricity generation in Central and South Americaincreases by 2.1 percent per year in the IEO2010 Refer-ence case, from 1.0 trillion kilowatthours in 2007 to 1.7trillion kilowatthours in 2030 and 1.8 trillion kilowatt-hours in 2035. The recent global economic crisis slowedthe region’s economies and lowered demand for elec-tricity, especially in the industrial sector. In the longerterm, however, the region’s electricity markets areexpected to return to trend growth as the economic diffi-culties recede.
The fuel mix for electricity generation in Central andSouth America is dominated by hydroelectric power,which accounted for nearly two-thirds of the region’stotal net electricity generation in 2007. Of the top sevenelectricity-generating countries in the region, five—Brazil, Venezuela, Paraguay, Colombia, and Peru—gen-erate more than 65 percent of their total electricity fromhydropower.
In Brazil, the region’s largest economy, hydropowerprovided almost 85 percent of electricity generation in2007 (Figure 80). The country has been trying to diver-sify its electricity generation fuel mix away from hydro-electric power because of the risk of power shortagesduring times of severe drought. In the Brazilian NationalEnergy Plan for 2008-2017, the government set agoal to build 54 gigawatts of installed capacity, with
90 U.S. Energy Information Administration / International Energy Outlook 2010
2007 2015 2020 2025 2030 20350.0
0.2
0.4
0.6
Natural gas
NuclearLiquids
Coal
Renewables
Figure 79. Net electricity generation in Africaby fuel, 2007-2035 (trillion kilowatthours)

nonhydroelectric capacity making up the majority ofadditions [69]. To achieve that target, the governmenthas announced plans to increase nuclear power capac-ity, beginning with the completion of the long-idled1.3-gigawatt Angra-3 project [70]. Construction wasdelayed in 2009 but is now scheduled to begin in Febru-ary 2010. According to the plan, the reactor is slated tobegin coming on line in mid-2015 [71]. Brazil also hasplans to construct four additional 1-gigawatt nuclearplants beginning in 2015. In the IEO2010 Reference case,the Angra-3 project is completed by 2015, and threemore planned nuclear projects are completed by 2035.
In the past, the Brazilian government has tried relativelyunsuccessfully to attract substantial investment innatural-gas-fired power plants. Its lack of success hasbeen due mostly to the higher costs of natural-gas-firedgeneration relative to hydroelectric power, and to con-cerns about the security of natural gas supplies. Brazilhas relied on imported Bolivian natural gas for much ofits supply, but concerns about the impact of Bolivia’snationalization of its energy sector on foreign invest-ment in the country’s natural gas production has ledBrazil to look toward LNG imports for secure supplies.Brazil has invested strongly in its LNG infrastructure,and its third LNG regasification plant is scheduled forcompletion in 2013 [72]. With Brazil diversifying itsnatural gas supplies, substantially increasing domesticproduction, and resolving to reduce the hydroelectricshare of generation, natural gas is projected to be its fast-est-growing source of electricity, increasing by 7.2 per-cent per year on average from 2007 to 2035.
Brazil still has plans to continue expanding its hydro-electric generation over the projection period, includingthe construction of two plants on the Rio Madeira inRondonia—the 3.2-gigawatt Santo Antonio and the3.3-gigawatt Jirau hydroelectric facilities. The twoplants, with completion dates scheduled for 2012-2015,are expected to help Brazil meet electricity demand inthe mid-term [73]. In the long term, electricity demandcould be met in part by the proposed 11.2-gigawatt BeloMonte dam; its tender has been delayed until April 2010[74]. Each of these three projects could, however, be sub-ject to further delay as a result of legal challenges.
Brazil is also interested in increasing the use of other,nonhydroelectric renewable resources in the future—notably, wind. In December 2009, Brazil held its firstsupply tender exclusively for wind farms. At the event,1.8 gigawatts of capacity were purchased, for develop-ment by mid-2012 [75]. In a signal that wind power maybecome more economically competitive in Brazil, theaverage price of the power sold was 21 percent lowerthan the ceiling price set by the government. In theIEO2010 Reference case, wind power generation inBrazil grows by 9.0 percent per year, from 530 millionkilowatthours in 2007 to 5,990 million kilowatthours in2035. Despite that robust growth, however, windremains a modest component of Brazil’s renewableenergy mix in the Reference case, as compared with theprojected growth in hydroelectric generation to 723 bil-lion kilowatthours in 2035.
Several other nations in Central and South America havebeen trying to increase the amounts of natural gas usedin their generation fuel mixes by increasing both pipe-line and LNG supplies. Chile, for instance, relies onArgentina for its natural gas supplies, but beginning in2004, Argentina began to restrict its exports after it wasunable to meet its own domestic supply. As a result,Chile has been forced to use diesel-fueled electric gener-ating capacity periodically to avoid power outages dur-ing the winter months [76]. In response to the lack of asecure source of natural gas from Argentina, Chilebegan construction on two LNG regasification projects.The Quintero facility became operational in June 2009,and the second facility, Mejillones, is scheduled for com-pletion by the end of 2010. In the IEO2010 Referencecase, natural-gas-fired generation in Central and SouthAmerica (excluding Brazil) increases by an average 2.2percent per year, and the natural gas share of total elec-tricity generation rises from 22 percent in 2007 to 29 per-cent in 2035 (Figure 81).
U.S. Energy Information Administration / International Energy Outlook 2010 91
2007 2015 2020 2025 2030 20350.0
0.2
0.4
0.6
0.8
LiquidsCoal
NuclearOther renewables
Natural gasHydropower
Figure 80. Net electricity generation in Brazilby fuel, 2007-2035 (trillion kilowatthours)

References
92 U.S. Energy Information Administration / International Energy Outlook 2010
1. International Energy Agency, World Energy Outlook2009 (Paris, France, November 2009), p. 128.
2. The World Bank, “Vietnam: Reliable Electricity inRural Vietnam” (July 2009), web site www.worldbank.org/vn.
3. “China Becomes Dominant Market for NewNuclear Plants,” World Gas Intelligence, Vol. 21, No.1 (January 6, 2010), p. 7.
4. World Wind Energy Association, World WindEnergy Report 2009 (March 2010), web site www.wwindea.org/home/index.php?option=com_content&task=blogcategory&id=21&Itemid=43.
5. “U.S. Wind Energy Industry Breaks All Records,Installs Nearly 10,000 MW in 2009,” AmericanWind Energy Association (January 26, 2010), website www.awea.org/newsroom/releases/01-26-10_AWEA_Q4_and_Year-End_Report_Release.html.
6. U.S. Department of Energy, “Recover and Reinvest-ment” (January 29, 2010), web site www.energy.gov/recovery.
7. Ontario Ministry of Energy and Infrastructure,“Frequently Asked Questions” (as of February 23,2009), web site www.mei.gov.on.ca/en/energy/electricity/?page=electricity-faqs.
8. Newsroom, “Ontario’s Coal Phase Out Plan” (Sep-tember 3, 2009), web site www.news.ontario.ca/mei/en/2009/09/ontarios-coal-phase-out-plan.html.
9. Hydro Québec, “Eastmain-1-A/Sarcelle/RupertProject,” web site www.hydroquebec.com/rupert/en/index.html.
2007 2015 2020 2025 2030 20350.0
0.2
0.4
0.6
Other renewablesNuclear
CoalLiquids
Natural gasHydropower
Figure 81. Net electricity generation inOther Central and South America by fuel,2007-2035 (trillion kilowatthours)
10. Hydro Québec, “Projet de la Romaine, En bref”(January 21, 2010), web site www.hydroquebec.com/romaine/projet/index.html; and ManitobaHydro, “Wuskwatim Generation Project” (January21, 2010), web site www.hydro.mb.ca/projects/wuskwatim/overview.shtml?WT.mc_id=2625.
11. Canadian Wind Energy Association, “CanadaReaches Milestone as Wind Energy Now Producedin Every Province” (press release, December 2,2009), web site www.canwea.ca/media/release/release_e.php?newsId=70.
12. Canadian Wind Energy Association, “CanadaReaches Milestone as Wind Energy Now Producedin Every Province” (press release, December 2,2009), web site www.canwea.ca/media/release/release_e.php?newsId=70.
13. Canadian Wind Energy Association, “CanadianWind Farms” (January 2010), web site www.canwea.ca/farms/index_e.php.
14. Ontario Power Authority, Standard Offer Program—Renewable Energy for Small Electricity Generators: AnIntroductory Guide (Toronto, Ontario, Canada), website http://powerauthority.on.ca/SOP/Storage/44/3985_SOPInformationBrochure.pdf.
15. IHS Global Insight, Inc., “Mexico: Country Reports:Utilities: Electricity and Gas” (January 27, 2009),web site www.globalinsight.com (subscriptionsite).
16. “Tamazunchale I CCGT Plant, Mexico,” power-technology.com web site: Industry Projects(undated), web site www.power-technology.com/projects/tamazunchale.
17. J. Roeder, “Natural Gas Replacing Fuel Oil and Die-sel in Mexico’s Power Plants,” The Oil Daily, Vol. 59,No. 19 (January 29, 2009), p. 5.
18. IHS Global Insight, Inc., “Mexico: Country Reports,Oil & Gas Downstream” (October 28, 2009), website www.globalinsight.com (subscription site).
19. International Water Power and Dam Construction,“Power Machines Pushes Ahead WithBoguchanskaya, La Yesca Units” (July 30, 2009),web site www.waterpowermagazine.com/story.asp?sectioncode=130&storyCode=2053738; andIHS Global Insight, Inc., “Mexico: Country Reports:Utilities: Electricity and Gas” (October 27, 2009),web site www.globalinsight.com (subscriptionsite).
20. IHS Global Insight, Inc., “Mexico: Mexico Com-pletes Latin America’s Largest Wind Farm”(November 25, 2009), web site www.globalinsight.com (subscription site).
U.S. Energy Information Administration / International Energy Outlook 2010 93
21. IHS Global Insight, Inc., “Mexico: Spanish Com-pany Award Wind Projects in Mexico” (March 10,2010), web site www.globalinsight.com (subscrip-tion site).
22. European Wind Energy Association, “EuropeanOffshore Wind Power Market Grew 54% in 2009”(January 18, 2010), web site www.ewea.org/index.php?id=60&no_cache=1&tx_ttnews[tt_news]=1784&tx_ttnews[backPid]=1&cHash=3abdb42e1e.
23. European Parliament, Directive 2001/77/EC,“Renewable Energy: The Promotion of ElectricityFrom Renewable Energy Sources” (2001), web sitehttp://europa.eu/scadplus/leg/en/lvb/l27035.htm.
24. European Parliament, “EU Climate and Energy Pol-icy” (December 2008), web site http://ec.europa.eu/climateaction/docs/climate-energy_summary_en.pdf.
25. Greenwire, “Renewable Energy: A Cautionary TaleAbout Feed-In-Tariffs” (August 18, 2009), web sitewww.eenews.net/public/Greenwire/2009/08/18/1.
26. World Nuclear News, “Belgium Postpones NuclearPhase-out” (October 13, 2009), web site www.world-nuclear-news.org/NP-Belgium_postpones_nuclear_phaseout-1310097.html.
27. World Nuclear Association, “Nuclear Power inGermany” (January 22, 2010), web site www.world-nuclear.org/info/inf43.html.
28. World Nuclear Association, “Nuclear Power inRussia” (January 23, 2010), web site www.world-nuclear.org/info/inf45.html.
29. Rosenergoatom Concern OJSC, Virtual Museum,“Nuclear Power Engineering in Russia” (2000-2009), web site http://museum.rosenergoatom.ru/eng/modern/russia/index.wbp.
30. World Nuclear Association, “Nuclear Power inRussia” (January 23, 2010), web site www.world-nuclear.org/info/inf45.html.
31. International Water Power and Dam Construction,“Sayano-Shushenskaya Findings Delayed to LateSept; First Unit Could Be in Service in Q1-‘10”(September 18, 2009), web site www.waterpowermagazine.com/story.asp?sectioncode=130&storyCode=2054160.
32. HydroWorld, “Russian Aluminum Firm ResumesSupport of 3,000 MW Boguchanskaya” (June 23,2009), web site www.hydroworld.com/index/display/article-display/0514605386/articles/hrhrw/hydroindustrynews/general/russian-aluminum_firm.html.
33. International Water Power and Dam Construction,“Central Asia: Long-Term Challenges and Short-Term Crises” (March 17, 2009), web site www.waterpowermagazine.com/story.asp?storyCode=2052456.
34. “China Becomes Dominant Market for NewNuclear Plants,” World Gas Intelligence, Vol. 21, No.1 (January 6, 2010), p. 7.
35. World Nuclear Association, “Nuclear Power inIndia” (January 28, 2010), web site www.world-nuclear.org/info/inf53.html.
36. World Nuclear Association, “Nuclear Power inIndia” (January 28, 2010), web site www.world-nuclear.org/info/inf53.html.
37. “Son La Pushes Hydro Program,” Power in Asia, No.509 (August 14, 2008), p. 17.
38. A. Netto, “New Doubts Over Malaysia’s BakunDam,” Asia Times Online (July 10, 2007), web sitewww.atimes.com.
39. Central Energy Authority, Hydro Development Planfor 12th Five Year Plan (2012-2017) (New Delhi,India, September 2008), pp. i and iv, web site www.cea.nic.in/hydro/Hydro%20Development%20Plan%20for%2012th%20Five%20Year%20Plan.pdf.
40. “Himachal Pradesh Pushes Hydro Generation Pro-jects,” Power in Asia, No. 488 (October 11, 2007), p.14.
41. Central Electricity Authority, “List of Hydro Pro-jects Under Execution” (December 31, 2009), website www.cea.nic.in/hydro/project_monitoring/Hydroelectric%20Projects%20under%20Execution.pdf.
42. IHS Global Insight, Inc., “China: Installation ofUnderground Power Station Begins at ThreeGorges Project in China” (May 29, 2009), web sitewww. globalinsight.com (subscription site).
43. International Water Power and Dam Construction,“Voith contract at Xiluodu, early ’09 orderprogress” (April 3, 2009), web site www.waterpowermagazine.com/story.asp?sectioncode=130&storyCode=2052638.
44. “Asian Experiences,” International Water PowerMagazine (October 1, 2007), web site www.waterpowermagazine.com.
45. United Press International, “China Increases ItsWind Power” (Beijing, January 19, 2009), web sitewww.upi.com/Energy_Resources/2009/01/19/China_increases_its_wind_power/UPI-58981232388248.
46. Recharge, “China Boosts Wind Power Target to100GW by 2020” (May 5, 2009), web site www.rechargenews.com/regions/asia_pacific/article177459.ece.

94 U.S. Energy Information Administration / International Energy Outlook 2010
47. V. Wai-yin Kwok, “Weakness in Chinese WindPower,” Forbes.com (July 20, 2009).
48. “Chinese Solar Projects in New Surge,” Platts Powerin Asia, No. 536 (September 17, 2009), p. 4.
49. “India Plans Solar Power Boost,” Platts Power inAsia, No. 536 (September 17, 2009), p. 7.
50. IHS Global Insight, Inc., “Clouds Gather OverIndia’s Solar Power Plans” (November 12, 2009),web site www.globalinsight.com (subscriptionsite).
51. Philippine Department of Energy, Power Statistics,“Gross Power Generation by Source,” p. 1, web sitewww.gov.ph/EP/Powerstat.htm (accessed Janu-ary 29, 2010).
52. World Energy Council, 2007 Survey of EnergyResources (London, United Kingdom: October2007), p. 458.
53. “Indonesia Cuts Capacity of Planned GeothermalPlants,” Reuters (January 26, 2010), web site www.reuters.com/article/idUSTRE60P2FP20100126.
54. International Energy Agency, Energy Balances ofNon-OECD Countries, 2006-2007, 2009 Edition(Paris, France, 2009), web site www.iea.org/w/bookshop/add.aspx?id=31.
55. K. Maree, “Gulf’s First Coal-Fired Power Plant ToBe Built at Duqm: Muscat Approves Project As Con-cerns Grow Over Future Energy Sources,” MEEDMiddle East Economic Digest (April 25, 2008), website www.meed.com/power (subscription site).
56. Zawya, “Duqm IWPP’s Coal RequirementsProjected at 3mt per Year” (January 25, 2010), website www.zawya.com/Story.cfm/sidZAWYA20100125040559/Duqm IWPP’s coalrequirements projected at 3mt per year.
57. D. Candappa and T. Austin, “Oman Eyes Gulf’sFirst Coal Power Plant—Report,” Reuters UK NewsRelease (January 26, 2008), web site http://uk.reuters.com.
58. “Keeping Up With the (Nuclear) Joneses” (March26, 2008), web site www.forbes.com.
59. World Nuclear Association, “Nuclear Power in theUnited Arab Emirates” (February 2010), web sitewww.world-nuclear.org/info/UAE_nuclear_power_inf123.html; E. Lake, “U.S.-UAE Nuclear Deal ToTest Obama,” Washington Times (January 6, 2009),web site www.washingtontimes.com; and“Resources on the United Arab Emirates NuclearEnergy Program and 123 Agreement,” web sitewww.usuae123.com.
60. World Nuclear Association, “Nuclear Power in theUnited Arab Emirates” (February 2010), web sitewww.world-nuclear.org/info/UAE_nuclear_power_inf123.html.
61. “Keeping Up With the (Nuclear) Joneses” (March26, 2008), web site forbes.com.
62. “Kuwait To Form Nuclear Energy Commission,”World Nuclear News: Nuclear Policies (March 3, 2009),web site www.world-nuclear-news.org.
63. IHS Global Insight, Inc., “Iran: Investment inHydropower to Continue as Iran Pushes 94 DamProjects Forward” (January 13, 2009), web sitewww.globalinsight.com (subscription site).
64. D. Dilworth, “Zero Carbon; Zero Waste in AbuDhabi,” Business Week (August 1, 2007), web sitewww.businessweek.com/innovate/content/aug2007/id2007081_901739.htm.
65. Cleantech, “$50M solar plant comes online to powerMasdar City construction” (June 16, 2009), web sitecleantech.com/news/4599/10m-solar-plant-comes-online-power.
66. World Nuclear News, “PBMR Chief Steps Down”(March 9, 2010); and “PBMR Postponed” (Septem-ber 11, 2009), web site www.world-nuclear-news.org.
67. T. Carlisle, “Egypt Awards Nuclear Power Con-tract,” The National Newspaper (December 22, 2008),web site www.thenational.ae/article/20081222/BUSINESS/705880082/-1/SPORT.
68. IHS Global Insight, Inc., “Sub-Saharan Africa:Emerging from the Dark: Ethiopia’s Region-WideElectricity Ambitions” (November 23, 2009), website www.globalinsight.com (subscription site).
69. IHS Global Insight, Inc., “Brazil: Utilities: Electric-ity” (July 7, 2009), web site myinsight.ihsglobalinsight.com/servlet/cats?filterID=1009&serviceID=1787&typeID=15505&pageContent=report (subscription site).
70. World Nuclear Association, “Nuclear Power inBrazil” (October 2009), web site www.world-nuclear.org/info/inf95.html.
71. Xinhua News Agency, “Brazil To Renew Construc-tion of Third Nuclear Power Plant” (January 18,2010), web site www.istockanalyst.com/arti-cle/viewiStockNews/articleid/3790086.
72. L. Viscidi, “Brazil Plans To Have Third LNG Termi-nal Up and Running by 2013,” The Oil Daily, Vol. 59,No. 30 (February 13, 2009), p. 2.
73. IHS Global Insight, Inc., “Brazil: Date Set for Brazil-ian Hydroelectric Power Plant Tender” (January 28,2008), web site www.ihsglobalinsight.com (sub-scription site).
74. IHS Global Insight, Inc., “World-Industry Analysis:Week of 1 February 2010” (February 8, 2010), website www.globalinsight.com (subscription site).

U.S. Energy Information Administration / International Energy Outlook 2010 95
75. IHS Global Insight, Inc., “Brazil: Brazil Holds FirstEver Dedicated Wind Power Auction” (December15, 2009), web site www.globalinsight.com (sub-scription site).
76. L. Viscidi, “Argentina Ups Gas Exports to Chile,Region Appears Well Supplied,” The Oil Daily, Vol.59, No. 41 (March 3, 2009), p. 5.

This page intentionally left blank.

Chapter 6
Industrial Sector Energy ConsumptionWorldwide industrial energy consumption increases by 42 percent, or an average
of 1.3 percent per year, from 2007 to 2035 in the IEO2010 Reference case.
Ninety-five percent of the growth occurs in non-OECD nations.
OverviewThe world’s industries make up a diverse sector thatincludes manufacturing, agriculture, mining, and con-struction. Industrial energy demand varies acrossregions and countries, depending on the level and mixof economic activity and technological development,among other factors. Energy is consumed in the indus-trial sector for a wide range of activities, such as process-ing and assembly, space conditioning, and lighting.Industrial energy use also includes natural gas andpetroleum products used as feedstocks to producenon-energy products, such as plastics. In aggregate, theindustrial sector uses more energy than any otherend-use sector, consuming about one-half of the world’stotal delivered energy.
Over the 28-year projection, worldwide industrialenergy consumption grows from 184 quadrillion Btu in
2007 to 262 quadrillion Btu in 2035 (Table 13). In theIEO2010 Reference case, world industrial energydemand increases at an average annual rate of 1.3 per-cent through 2035. In the short term, the industrial sectoraccounts for a majority of the reduction in energy use in2009 caused by the recent economic downturn (Figure82), primarily because the impact of substantial cutbacksin manufacturing is more pronounced than the impactof marginal reductions in energy use in other sectors. Inthe long term, national economic growth rates andenergy consumption patterns return to historical trends(Figure 83).
Most of the long-term growth in industrial sector energydemand occurs in non-OECD nations. Currently, non-OECD economies consume 60 percent of global deliv-ered energy in the industrial sector. From 2007 to 2035,industrial energy use in non-OECD countries grows by
U.S. Energy Information Administration / International Energy Outlook 2010 97
Table 13. World industrial delivered energy consumption by region and energy source, 2007-2035(quadrillion Btu)
Region 2007 2015 2020 2025 2030 2035
Average annualpercent change,
2007-2035
OECDLiquids and other petroleum . . . 29.1 24.8 24.7 25.1 25.9 26.5 -0.3Natural gas . . . . . . . . . . . . . . . . 19.3 20.7 21.4 21.9 21.7 22.1 0.5Coal . . . . . . . . . . . . . . . . . . . . . . 8.7 6.9 7.1 7.2 7.2 7.1 -0.8Electricity . . . . . . . . . . . . . . . . . . 11.4 10.9 11.6 12.3 12.9 13.7 0.6Renewables . . . . . . . . . . . . . . . . 4.7 4.9 5.3 6.1 6.7 7.6 1.7
Total OECD. . . . . . . . . . . . . . . 73.4 68.2 70.2 72.5 74.4 76.9 0.2Non-OECDLiquids and other petroleum . . . 27.8 26.9 28.6 31.7 35.2 38.4 1.2Natural gas . . . . . . . . . . . . . . . . 23.9 33.6 37.6 39.1 39.7 41.7 2.0Coal . . . . . . . . . . . . . . . . . . . . . . 34.4 36.2 41.0 45.0 48.3 50.9 1.4Electricity . . . . . . . . . . . . . . . . . . 16.2 20.2 24.6 29.4 34.3 39.7 3.2Renewables . . . . . . . . . . . . . . . . 8.7 9.3 10.4 11.6 12.8 14.2 1.8
Total Non-OECD. . . . . . . . . . . 111.1 126.1 142.2 156.8 170.4 184.9 1.8WorldLiquids and other petroleum . . . 57.1 51.7 53.3 56.8 61.0 64.9 0.5Natural gas . . . . . . . . . . . . . . . . 43.2 54.3 59.0 61.1 61.4 63.8 1.4Coal . . . . . . . . . . . . . . . . . . . . . . 43.1 43.1 48.2 52.1 55.5 58.0 1.1Electricity . . . . . . . . . . . . . . . . . . 27.6 31.1 36.3 41.6 47.3 53.3 2.4Renewables . . . . . . . . . . . . . . . . 13.4 14.1 15.7 17.6 19.5 21.8 1.8
Total World . . . . . . . . . . . . . . . 184.4 194.3 212.5 229.3 244.7 261.8 1.3
Note: Totals may not equal sum of components due to independent rounding.

an average of 1.8 percent per year, compared with 0.2percent per year in OECD countries (Figure 84). Thus, 95percent of the growth in industrial energy use from 2007to 2035 in the IEO2010 Reference case occurs innon-OECD countries, and non-OECD nations consume71 percent of total delivered energy in the world’s indus-trial sector in 2035.
Fuel prices shape the mix of fuel consumption in theindustrial sector, as industrial enterprises choose thecheapest fuels available to them, subject to process con-straints. Because liquids are more expensive than otherprimary fuels, the world industrial sector’s use of liquidsincreases at an average annual rate of only 0.5 percent(Figure 85), and the share of liquid fuels in the industrialfuel mix declines. Industrial electricity use grows by anaverage of 2.4 percent per year from 2007 to 2035.
Electricity can be generated from a wide variety ofsources and used in a wide variety of industrialactivities.
At present, the overall industrial fuel mix differsbetween OECD and non-OECD countries. In 2007,liquids made up 40 percent of industrial energy use inOECD countries, compared with 25 percent in non-OECD countries. In that same year, coal represented 12percent of OECD industrial energy use and 31 percent ofnon-OECD industrial energy use.
Over the projection horizon, there are large shifts inindustrial energy use. From 2007 to 2035, industrialliquids use in OECD countries declines by 0.3 percentper year, while in non-OECD countries it increases by1.2 percent per year. In 2035, non-OECD countries
98 U.S. Energy Information Administration / International Energy Outlook 2010
64
1
-15
77
10
6
35
2006 2007 2008 2009 2010
0
5
10
15
-5
-10
-15
-20
Industrial Other
Figure 82. Annual changes in world industrial andall other end-use energy consumption fromprevious year, 2006-2010 (quadrillion Btu)
2005 2010 2015 2020 2025 2030 20350
50
100
150
200
250
300
Industrial
Other
Figure 83. World delivered energy consumptionin the industrial and all other end-use sectors,2005-2035 (quadrillion Btu)
73 68 70 72 74 77
111126
157170
185
2007 2015 2020 2025 2030 20350
50
100
150
200OECD Non-OECD
142
Figure 84. OECD and Non-OECD industrial sectorenergy consumption, 2007-2035 (quadrillion Btu)
57
43
43
28
13
184
65
64
58
53
22
262
Liquids
Natural gas
Coal
Electricity
Renewables
Total
0 50 100 150 200 250 300
2007
2035
43
43
184
Figure 85. World industrial sector energyconsumption by fuel, 2007 and 2035(quadrillion Btu)
consume 38 quadrillion Btu of energy from liquids forindustrial uses, compared with 26 quadrillion Btu forOECD countries. From 2007 to 2035, OECD coal use forindustry declines by an average of 0.8 percent per year,while non-OECD industrial coal use increases by anaverage of 1.4 percent per year.
A new feature in IEO2010 is the inclusion of worldwideconsumption of marketed (commercial) industrialrenewable energy in historical time series and projec-tions.23 Industrial use of renewables for purposes otherthan electricity generation constitutes a fairly substan-tial portion of industrial sector energy consumption. In2007, the industrial sector worldwide consumed 13quadrillion Btu of energy from renewables for non-electricity uses, or about 7 percent of the sector’s totaldelivered energy use [1]. From 2007 to 2035, renewableenergy use in the industrial sector grows by an averageof 1.8 percent per year, and its share of total deliveredenergy consumption in the industrial sector grows to 8percent. Biomass—which currently provides the vastmajority of renewable energy consumed in the indus-trial sector (90 percent), followed by waste (7 percent)and other renewables (3 percent)—remains the largestcomponent of the industrial sector renewable energymix through 2035.
Industrial energy consumption in each region is a func-tion of total industrial output and the energy intensity ofthe industrial sector, measured as energy consumed perunit of output. Energy-intensive industries consumeabout half of the energy used in the industrial sector. Foryears, those industries have focused on reducing energyconsumption, which represents a large portion of theircosts [2]. Enterprises can reduce energy use in a numberof ways. Industrial processes can be improved to reduceenergy waste and recover energy, often process heat,which would otherwise be lost. Recycling of materialsand fuel inputs also improves efficiency.
Countries’ development trajectories also play a majorrole in industrial energy consumption.. When econo-mies initially begin to develop, industrial energy userises as manufacturing output begins to take up a largerportion of GDP, as has occurred already in manynon-OECD economies, most notably in China. Whendeveloping countries achieve higher levels of economicdevelopment, their economies tend to become more ser-vice-oriented, and their industrial energy use begins tolevel off, as can be seen currently in most OECDcountries.
The following section describes patterns of energy use inthe world’s most energy-intensive industries. Subse-quent sections examine specific patterns of industrialenergy use in the major OECD and non-OECD regions.
Energy-intensive industriesFive industries account for one-half of all energy used inthe industrial sector (Figure 86): chemicals (22 percent),iron and steel (15 percent), nonmetallic minerals (6 per-cent), pulp and paper (4 percent), and nonferrous metals(3 percent).24 The quantity and fuel mix of future indus-trial energy consumption will be determined largely byenergy use in those five industries. In addition, the sameindustries emit large quantities of carbon dioxide,related to both their energy use and their productionprocesses.
The largest industrial consumer of energy is the chemi-cal sector, which made up 22 percent of total worldindustrial energy consumption in 2007. Energy repre-sents 60 percent of the industry’s operating costs and aneven higher percentage in the petrochemical subsector,which uses energy products as feedstocks. Petrochemi-cal feedstocks account for 60 percent of the energyconsumed in the chemicals sector. Intermediate petro-chemical products, or “building blocks,” which go intoproducts such as plastics, require a fixed amount ofhydrocarbon feedstock as input. In other words, for anygiven amount of chemical output, depending on the
U.S. Energy Information Administration / International Energy Outlook 2010 99
Chemicals
Iron and steel
Nonmetallic minerals
Pulp and paper
Nonferrous metals
0 5 10 15 20 25
15%
6%
4%
3%
22%
Figure 86. World industrial sector energyconsumption by major energy-intensive industryshares, 2007 (percent of total)
Source: International Energy Agency.
23 U.S. marketed industrial renewable energy, both historical and projections from the Annual Energy Outlook, has always been reported inthe IEO. As a result, incorporating the data series of industrial sector renewable energy use outside the United States means that all dataseries are now presented in the IEO on a consistent basis worldwide.
24 These shares differ from those reported in IEO2009, where the numbers were based on shares reported in an International EnergyAgency database. The shares now come from an internal database that conforms to EIA’s definition of the industrial sector, which includesenergy used in construction, mining, and agriculture. Smaller relative shares for energy-intensive industries are a reflection of this account-ing change.
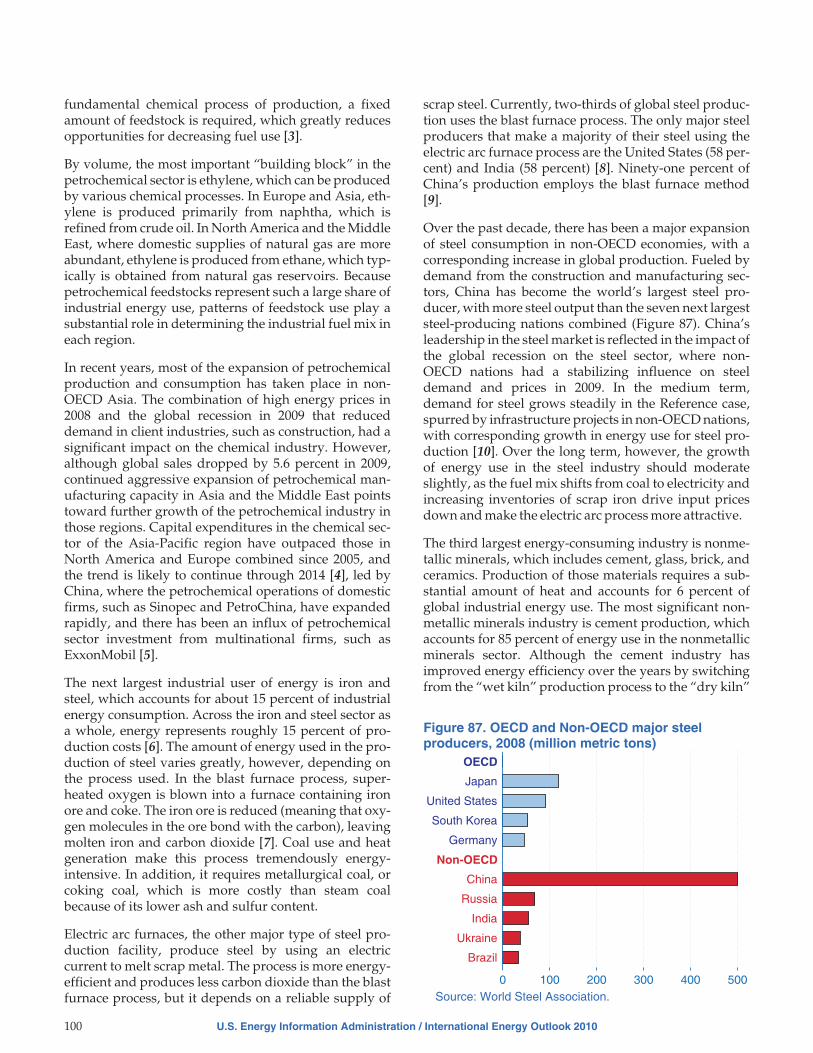
fundamental chemical process of production, a fixedamount of feedstock is required, which greatly reducesopportunities for decreasing fuel use [3].
By volume, the most important “building block” in thepetrochemical sector is ethylene, which can be producedby various chemical processes. In Europe and Asia, eth-ylene is produced primarily from naphtha, which isrefined from crude oil. In North America and the MiddleEast, where domestic supplies of natural gas are moreabundant, ethylene is produced from ethane, which typ-ically is obtained from natural gas reservoirs. Becausepetrochemical feedstocks represent such a large share ofindustrial energy use, patterns of feedstock use play asubstantial role in determining the industrial fuel mix ineach region.
In recent years, most of the expansion of petrochemicalproduction and consumption has taken place in non-OECD Asia. The combination of high energy prices in2008 and the global recession in 2009 that reduceddemand in client industries, such as construction, had asignificant impact on the chemical industry. However,although global sales dropped by 5.6 percent in 2009,continued aggressive expansion of petrochemical man-ufacturing capacity in Asia and the Middle East pointstoward further growth of the petrochemical industry inthose regions. Capital expenditures in the chemical sec-tor of the Asia-Pacific region have outpaced those inNorth America and Europe combined since 2005, andthe trend is likely to continue through 2014 [4], led byChina, where the petrochemical operations of domesticfirms, such as Sinopec and PetroChina, have expandedrapidly, and there has been an influx of petrochemicalsector investment from multinational firms, such asExxonMobil [5].
The next largest industrial user of energy is iron andsteel, which accounts for about 15 percent of industrialenergy consumption. Across the iron and steel sector asa whole, energy represents roughly 15 percent of pro-duction costs [6]. The amount of energy used in the pro-duction of steel varies greatly, however, depending onthe process used. In the blast furnace process, super-heated oxygen is blown into a furnace containing ironore and coke. The iron ore is reduced (meaning that oxy-gen molecules in the ore bond with the carbon), leavingmolten iron and carbon dioxide [7]. Coal use and heatgeneration make this process tremendously energy-intensive. In addition, it requires metallurgical coal, orcoking coal, which is more costly than steam coalbecause of its lower ash and sulfur content.
Electric arc furnaces, the other major type of steel pro-duction facility, produce steel by using an electriccurrent to melt scrap metal. The process is more energy-efficient and produces less carbon dioxide than the blastfurnace process, but it depends on a reliable supply of
scrap steel. Currently, two-thirds of global steel produc-tion uses the blast furnace process. The only major steelproducers that make a majority of their steel using theelectric arc furnace process are the United States (58 per-cent) and India (58 percent) [8]. Ninety-one percent ofChina’s production employs the blast furnace method[9].
Over the past decade, there has been a major expansionof steel consumption in non-OECD economies, with acorresponding increase in global production. Fueled bydemand from the construction and manufacturing sec-tors, China has become the world’s largest steel pro-ducer, with more steel output than the seven next largeststeel-producing nations combined (Figure 87). China’sleadership in the steel market is reflected in the impact ofthe global recession on the steel sector, where non-OECD nations had a stabilizing influence on steeldemand and prices in 2009. In the medium term,demand for steel grows steadily in the Reference case,spurred by infrastructure projects in non-OECD nations,with corresponding growth in energy use for steel pro-duction [10]. Over the long term, however, the growthof energy use in the steel industry should moderateslightly, as the fuel mix shifts from coal to electricity andincreasing inventories of scrap iron drive input pricesdown and make the electric arc process more attractive.
The third largest energy-consuming industry is nonme-tallic minerals, which includes cement, glass, brick, andceramics. Production of those materials requires a sub-stantial amount of heat and accounts for 6 percent ofglobal industrial energy use. The most significant non-metallic minerals industry is cement production, whichaccounts for 85 percent of energy use in the nonmetallicminerals sector. Although the cement industry hasimproved energy efficiency over the years by switchingfrom the “wet kiln” production process to the “dry kiln”
100 U.S. Energy Information Administration / International Energy Outlook 2010
OECD
Japan
United States
South Korea
Germany
Non-OECD
China
Russia
India
Ukraine
Brazil
0 100 200 300 400 500
Figure 87. OECD and Non-OECD major steelproducers, 2008 (million metric tons)
Source: World Steel Association.

process, which requires less heat, energy costs still con-stitute between 20 and 40 percent of the total cost ofcement production [11].
The demand base for cement—the vast majority ofwhich is used for construction—is less diversified thanthat for steel sector. Consequently, the impact of therecent economic downturn on the cement industry hasbeen severe [12]. The primary growth in cement produc-tion over the next few years is expected to occur innon-OECD countries. Because the production of cementdirectly generates carbon dioxide, the industry hasresponded to pressure to address climate change byfocusing considerable attention on reducing fossil fueluse and improving energy efficiency. In the future, theenergy efficiency of cement production is likely toimprove as a result of continued improvements in kilntechnology, the use of recycled material and waste asheating fuels (known as “co-processing”), and increaseduse of additives to reduce the amount of clinker (the pri-mary ingredient in marketed cement) needed to pro-duce a given amount of cement [13].
Pulp and paper production accounts for 4 percent ofglobal industrial energy use. Paper manufacturing is anenergy-intensive process, but paper mills typically gen-erate about one-half of the energy they use throughcogeneration, primarily with black liquor and biomassfrom wood waste. In some cases, integrated paper millsgenerate more electricity than they need and are able tosell their excess power back to the grid. As is the case inother industries, recycling significantly reduces theenergy intensity of production in the paper sector. Recy-cled paper production produces more carbon dioxide,however, because the process energy used in recycledpaper production comes from fossil fuels rather thanbiomass [14] (although this conclusion could change ifassumptions about the life-cycle carbon dioxide outputfrom biomass change).
Many observers have suggested that electronic mediaand digital file storage would cause global demand forpaper to contract over time. Such a trend is observableonly in North America, however, where reduceddemand for newsprint and an aging capital stock haveled the industry to reduce capacity [15]. In the rest of theworld, output is expected to expand steadily. Supportfor renewable energy in OECD countries could alter thecost structure of the paper sector in the future, however,if mandates for biomass use cause wood prices to esca-late, affecting the competitive position of the paperindustry[16].
Production of nonferrous metals, which include alumi-num, copper, lead, and zinc, consumed 3 percent ofindustrial delivered energy in 2007, mostly for alumi-num production. Although aluminum is one of the mostwidely recycled materials on the planet, two-thirds of
aluminum still comes from primary production [17].Energy accounts for about 30 percent of the total cost ofprimary aluminum manufacturing and is the secondmost expensive input after alumina ore. The recentrecession’s impact on client sectors, such as automobileproduction and construction, has curtailed aluminumdemand globally, but the trend has been far less severein non-OECD countries. Although some analysts expecta greater portion of OECD aluminum production to beexported to non-OECD countries in the future [18], non-OECD countries still are expected to increase their mar-ket share of global aluminum production.
To guard against electricity outages and fluctuations inelectric power prices, many aluminum producers haveturned to hydropower, going so far as to locate plants inareas where they can operate captive hydroelectric facil-ities. For example, Norway, which has considerablehydroelectric resources, hosts seven aluminum smelt-ers. Today, more than half of the electricity used in pri-mary aluminum production comes from hydropower[19].
Aluminum production from recycled materials usesonly one-twentieth of the energy of primary production[20]. Although both the aluminum industry and manygovernments encourage aluminum recycling, it isunlikely that the share of aluminum made from recycledproduct will increase much in the future, because mostaluminum (which is consumed in the construction andmanufacturing sectors) is used for long periods of time.Indeed, with three-fourths of the aluminum ever pro-duced still in use [21], it is likely that the aluminumindustry will continue to consume large amounts ofelectricity.
Regional industrial energy outlooksOECD countries
OECD countries have been transitioning in recentdecades from manufacturing to more service-orientedeconomies. As a result, in the IEO2010 Reference case,industrial energy use in OECD countries grows at anaverage annual rate of only 0.2 percent from 2007 to2035, as compared with a rate of 0.9 percent per year forenergy use in the commercial sector. In addition to theshift away from industry, slow growth in OECD indus-trial energy consumption can be attributed to relativelyslow growth in overall economic output. OECD econo-mies grow by 2.0 percent per year on average from 2007to 2035 in the IEO2010 Reference case, compared with2.1 percent per year in the IEO2009 Reference case.Whereas OECD economies accounted for 58 percent ofglobal economic output in 2007 (as measured in pur-chasing power parity terms), their share falls to about 41percent in 2035.
U.S. Energy Information Administration / International Energy Outlook 2010 101

Rising oil prices in the Reference case lead to changes inthe industrial fuel mix of OECD nations (Figure 88).OECD liquids use in the industrial sector contracts by0.3 percent per year, reducing the share of liquids inindustrial energy use from 40 percent in 2007 to 34 per-cent in 2035. Coal use in the industrial sector alsodeclines, and coal’s share of OECD delivered industrialenergy use falls from 12 percent to 9 percent, as indus-trial uses of natural gas, electricity, and renewablesexpand. Industrial consumption of renewables in OECDcountries grows faster than the use of any other fuel,from 4.7 quadrillion Btu in 2007 to 7.6 quadrillion Btu in2035. In the coming decades, patterns of industrial fueluse and trends in energy intensity in OECD countriesare expected to be determined as much by policies regu-lating energy use as by economic and technologicaldevelopments.
North America
Currently, the U.S. industrial sector consumes moreenergy than the industrial sector of any other OECDcountry, and that continues to be true in the IEO2010Reference case through 2035. The overall increases inU.S. industrial energy use is minimal, however, from 25quadrillion Btu in 2007 to 27 quadrillion Btu in 2035, oran average of 0.2 percent per year. The industrial shareof total U.S. delivered energy consumption remains atapproximately one-third through 2035. (In contrast, U.S.commercial energy use increases at more than four timesthat rate, reflecting the continued U.S. transition to a ser-vice economy.) With oil prices rising steadily in the Ref-erence case, liquids consumption in the U.S. industrialsector contracts on average by 0.4 percent per year, forthe steepest decline among OECD nations.
The use of renewable fuels, such as waste and biomass,in the U.S. industrial sector grows faster than the use of
any other energy source in the Reference case, and itsshare of the industrial fuel mix rises from 8 percent in2007 to 16 percent in 2035. Growth in U.S. industrialenergy use will also be moderated by legislation aimedat reducing the energy intensity of industrial processes.For example, the U.S. Department of Energy supportsreductions in energy use through its Industrial Technol-ogies Program, guided by the Energy Policy Act of 2005,which is working toward a 25-percent reduction in theenergy intensity of U.S. industrial production by 2017[22]. The Energy Independence and Security Act of 2007(EISA2007) also addresses energy-intensive industries,providing incentive programs for industries to recoveradditional waste heat and supporting research, develop-ment, and demonstration for efficiency-increasing tech-nologies [23].
Industrial energy use in Canada grows by an average of0.6 percent per year in the Reference case, continuing toconstitute just under one-half of Canada’s total deliv-ered energy use. With world oil prices returning to sus-tained high levels, liquids use in Canada’s industrialsector does not increase from current levels, while natu-ral gas use increases by 1.5 percent per year. As a result,the share of liquids in the industrial fuel mix falls from36 percent in 2007 to 27 percent in 2035, and the naturalgas share increases from 35 percent to 44 percent.Increased production of unconventional liquids (oilsands) in western Canada, which requires largeamounts of natural gas, contributes to the projectedincrease in industrial natural gas use.
Industrial energy efficiency in Canada has been increas-ing at an average rate of about 1.5 percent per year inrecent decades, largely reflecting provisions in Canada’sEnergy Efficiency Act of 1992 [24]. The governmentincreased those efforts in 2007, releasing its RegulatoryFramework for Industrial Greenhouse Gas Emissions,which calls for a 20-percent reduction in greenhouse gasemissions by 2020. The plan stipulates that industrialenterprises must reduce their emissions intensity of pro-duction by 18 percent between 2006 and 2010 and by 2percent per year thereafter. The proposal exempts “fixedprocess emissions” from industrial processes in whichcarbon dioxide is a basic chemical byproduct of produc-tion. Therefore, most of the abatement will have to comefrom increased energy efficiency and fuel switching [25].
Mexico’s GDP grows by 3.5 percent per year from 2007to 2035 in the Reference case, which is the highest eco-nomic growth rate among all OECD nations. Mexicoalso has the highest average annual rate of growth inindustrial energy use, at 1.9 percent per year, to 5quadrillion Btu in 2035 from 3 quadrillion Btu in 2007.The country’s industrial sector continues to use oil andnatural gas for most of its energy needs, and the com-bined share of liquids and natural gas in the industrial
102 U.S. Energy Information Administration / International Energy Outlook 2010
29
19
9
11
5
73
26
22
7
14
8
77
Liquids
Natural gas
Coal
Electricity
Renewables
Total
0 20 40 60 80 100
2007
2035
7773
14
Figure 88. OECD industrial sector energyconsumption by fuel, 2007 and 2035(quadrillion Btu)

fuel mix remains close to 80 percent throughout the pro-jection. In December 2009, the Mexican governmentintroduced its “Special Climate Change Program2009-2012.” The plan entails many industrial sector ini-tiatives, such as increasing the use of cogeneration andimproving the operational efficiency of PEMEX (thestate-owned oil company) and other Mexican industrialenterprises [26].
OECD Europe
In the IEO2010 Reference case, OECD Europe continuesits transition to a service economy, as its commercialsector energy use grows by 0.8 percent per year whileindustrial energy use contracts by 0.3 percent per year.Climate change policy is expected to affect the mix offuels consumed in OECD Europe’s industrial sector,with coal use contracting at an average rate of 1.6 per-cent per year, while the use of renewables increases. Theuse of electric power in OECD Europe’s industrial sec-tor, increasingly generated from low-carbon sources,also rises.
Energy and environmental policies are significant fac-tors behind the trends in industrial energy use in OECDEurope. In December 2008, the European Parliamentpassed the “20-20-20” plan, which stipulated a20-percent reduction in greenhouse gas emissions, a20-percent improvement in energy efficiency, and a20-percent share for renewables in the fuel mix of Euro-pean Union member countries by 2020 [27]. In debateson the plan, representatives of energy-intensive indus-tries voiced concern about the price of carbon alloca-tions. They argued that fully auctioning carbon dioxidepermits to heavy industrial enterprises exposed toglobal competition would simply drive industrial pro-duction from Europe and slow carbon abatement effortsat the global level [28]. The resulting compromise was anagreement that 100 percent of carbon allowances wouldbe given free of charge to industries that are exposed tosuch “carbon leakage,” provided that they adhere to effi-ciency benchmarks [29].
OECD Asia/Pacific
Japan has the slowest GDP growth among OECDregions in the Reference case, at 0.5 percent per year.Consequently, its industrial consumption of deliveredenergy falls by 0.7 percent per year. Along with sloweconomic growth, a major factor behind Japan’s slowingindustrial energy use is increasing efficiency. Already,the energy intensity of Japan’s industrial production isamong the lowest in the world. Since 1970, Japan hasreduced the energy intensity of its manufacturing sectorby 50 percent, mostly through efficiency improvements,along with a structural shift toward lighter manufactur-ing [30]. An amended version of Japan’s Energy Conser-vation Law went into effect in April 2009, introducing
sectoral efficiency benchmarks for energy-intensive sec-tors, including cement and steel [31].
South Korea, which experienced rapid industrial devel-opment during the later decades of the 20th century, isalso beginning to make a transition to a service-orientedeconomy. In the IEO2010 Reference case, South Korea’sGDP grows at an average annual rate of 2.9 percent. Itsindustrial energy use grows by 1.3 percent per year,while its commercial energy use grows by nearly 2 per-cent per year. South Korea is currently the sixth-largeststeel producer in the world. A large portion of its steel isalready produced by electric arc furnaces [32], and thatportion is projected to grow as inventories of discardedsteel build up. As a result, coal consumption in SouthKorea’s industrial sector increases slowly in the Refer-ence case, and electricity is the fastest-growing source ofenergy for industrial uses. The largest consumer ofindustrial energy in South Korea is the chemical sector,and it is expected to remain in that position through2035. Liquid fuel consumption, primarily for feedstockuse, maintains a majority share of South Korea’s fuel mixthrough 2035.
In Australia and New Zealand, industrial deliveredenergy consumption grows by 0.9 percent per year in theReference case, from 2.3 quadrillion Btu in 2007 to 3.0quadrillion Btu in 2035. Industry’s share of deliveredenergy consumption in the region remains steady atabout 50 percent. With liquids consumption in theindustrial sector falling from 0.6 quadrillion Btu in 2007to 0.5 quadrillion Btu in 2035, natural gas fuels much ofthe growth in industrial sector energy use, and its shareof the industrial fuel mix expands from 36 percent in2007 to 43 percent in 2035.
Non-OECD countries
Non-OECD industrial energy consumption grows at anaverage annual rate of 1.8 percent in the IEO2010 Refer-ence case—almost 10 times the average for OECD coun-tries (Figure 89). The industrial sector accounted forabout 62 percent of total non-OECD delivered energyuse in 2007, and it continues to consume close to thatshare through 2035. With non-OECD economiesexpanding at an average annual rate of 4.4 percent in theReference case, their share of global output increasesfrom 42 percent in 2007 to 59 percent in 2035.
The key engines of non-OECD growth are the “BRIC”countries (Brazil, Russia, India, and China). The fournations have accounted for 45 percent of global eco-nomic growth since 2007, doubling their share in theperiod from 2000 to 2006 [33]. Given the predominantrole that heavy industry and manufacturing play in theirdynamic economies, the BRIC countries account formore than two-thirds of the growth in non-OECD indus-trial energy use from 2007 to 2035.
U.S. Energy Information Administration / International Energy Outlook 2010 103

Non-OECD Asia
Non-OECD Asia is expected to be a major center ofglobal economic growth in the coming decades. In theReference case, the economies of non-OECD Asia, led byChina, expand by an average of 5.2 percent per year,and industrial energy consumption increases across theregion. China’s industrial energy use nearly doublesfrom 2007 to 2035, averaging 2.4-percent annual growthover the period, and its growth rate is higher than therate for any other major economy.
The industrial sector accounted for 75 percent of China’stotal delivered energy consumption in 2007, and itsshare remains above two-thirds through 2035. Since thebeginning of economic reform in 1979, China’s GDPgrowth has averaged 9.8 percent per year through 2007[34]. The IEO2010 Reference case projects slower butsubstantial growth, averaging 5.8 percent per yearthrough 2035. Although 2006-2010 growth in China inIEO2010 is somewhat lower than was projected inIEO2009 because of the global economic slowdown, areturn to strong growth is anticipated from 2011 to 2015,and China still is expected to account for more thanone-fourth of total global GDP growth from 2007 to2035.
In addition to the impact of strong economic growth onindustrial energy demand in China, continued rapidincreases in industrial demand can be explained in partby the structure of the Chinese economy. Although theenergy intensity of production in individual industrieshas improved over time, heavy industry still constitutesa major portion of China’s total output. Patterns ofenergy use in China reflect its economy: iron and steel,nonmetallic minerals, and chemicals together accountfor about 60 percent of the country’s industrial energyconsumption. These sectors provide inputs to China’smassive export and construction sectors, which
continue to flourish in the IEO2010 projection. China isexpected to construct an additional 65 billion square feetof building space by 2020—an amount equal to Europe’scurrent total building stock [35].
Government policy contributes as much to theenergy-intensive structure of the Chinese economy asdoes demand growth. A considerable share of heavyindustrial production in China is carried out by largestate-owned enterprises (SOEs), which are favored byChinese economic policy. SOEs enjoy relatively easyaccess to capital through state-owned banks and otherforms of government support, such as subsidizedenergy supplies [36]. The Chinese government’s strat-egy in response to the recent global economic slowdowninvolved expansion of credit, and SOEs benefitedgreatly from the policy [37]. The government also intro-duced support plans for 10 key industries. Steel, petro-chemicals, and nonferrous metals are among theindustries identified in the plan, which includes mea-sures to stimulate domestic demand and exports, alongwith 210 billion yuan ($31 billion) in research and devel-opment funding [38].
China’s industrial fuel mix changes somewhat over theprojection period. Despite its abundant coal reserves,direct use of coal in China’s industrial sector grows byan average of only 1.6 percent per year in the Referencecase, while industrial use of electricity (most of which iscoal-fired) grows by 4.2 percent per year. As a result,coal’s share in the industrial fuel mix falls from 60 per-cent in 2007 to 47 percent in 2035, while electricity’sshare increases from 19 percent to 32 percent. At 4.5 per-cent per year, natural gas use is projected to grow fasterthan the use of any other fuel; however, it representsonly 6 percent of China’s industrial fuel mix in 2035.
In addition to its primary focus on economic develop-ment, the Chinese government also has introduced pol-icy initiatives aimed at improving industrial energyefficiency. Its 11th Five Year Economic Plan, released in2005, included a goal of reducing energy intensity by 20percent between 2005 and 2010 [39]. In the IEO2010 Ref-erence case, China surpasses its goal, achieving a 23-percent reduction in energy intensity of GDP between2005 and 2010. In the coming years, China is expected tofocus more attention on industrial energy intensity. InDecember 2009, the Chinese Ministry of Industry andInformation Technology announced that it will soonrelease plans to restructure traditional industries,including the implementation of energy efficiencystandards [40]. In the Reference case, the energy inten-sity of GDP in China declines by an average of 2.5 per-cent per year from 2007 to 2035.
India has the world’s second highest rate of GDP growthin the IEO2010 Reference case, averaging 5.0 percent peryear from 2007 to 2035, with a 1.9-percent average
104 U.S. Energy Information Administration / International Energy Outlook 2010
28
24
34
16
9
111
38
42
51
40
14
185
Liquids
Natural gas
Coal
Electricity
Renewables
Total
0 50 100 150 200
2007
2035
185
40
38
42
Figure 89. Non-OECD industrial sector energyconsumption by fuel, 2007 and 2035(quadrillion Btu)

annual increase in delivered energy to the industrial sec-tor. Although India’s 2007-2035 economic growth rate isonly slightly slower than China’s, its levels of GDP andenergy consumption continue to be dwarfed by those inChina throughout the projection. India’s economicgrowth over the next 27 years is expected to derive morefrom light manufacturing and services than from heavyindustry. As a result, the industrial share of total energyconsumption in India falls from 72 percent in 2007 to 64percent in 2035, and its commercial energy use growsmore than twice as fast as its industrial energy use. Thechanges are accompanied by shifts in India’s industrialfuel mix: electricity use grows more rapidly than coaluse, and natural gas use triples.
India has been successful in reducing the energy inten-sity of its industrial production over the past 20 years. Amajority of its steel production is from electric arc fur-naces, and most of its cement production uses dry kilntechnology [41]. A major reason for the intensity reduc-tions is Indian public policy, which provides subsidizedfuel to citizens and farmers but requires industry to payhigher prices for fuel. In part because the market inter-ventions have spurred industry to reduce energy costs,India is now one of the world’s lowest cost producers ofboth aluminum and steel [42]. India is also the world’slargest producer of pig iron, which can be used in placeof scrap metal in the electric arc process [43].
The quality of India’s indigenous coal supplies also hascontributed to the steel industry’s efforts to reduce itsenergy use. India’s metallurgical coal (which is neededfor steel production in blast furnaces) is low in quality,forcing steel producers to import metallurgical coal [44].As a result, producers have invested heavily in improv-ing the efficiency of their capital stock to lower theamount of relatively expensive imported coal used inthe production process.
The Indian government has facilitated further reduc-tions in industrial energy use over the past decade bymandating industrial energy audits in the Energy Con-servation Act of 2001 and by mandating specific con-sumption decreases for heavy industry as part of the2008 National Action Plan on Climate Change. The newplan also calls for fiscal and tax incentives to promoteefficiency, an energy-efficiency financing platform, anda trading market for energy savings certificates, whereinfirms that have exceeded their required savings levelswill be able to sell the certificates to firms that have not[45]. Those measures contribute to a reduction in theenergy intensity of India’s GDP, which declines by anaverage of 2.6 percent per year from 2007 to 2035 in theReference case.
GDP growth in the other nations of non-OECD Asia isslightly less rapid than in China and India, averaging 4.3percent per year, and their industrial energy demand as
a group grows from 12 quadrillion Btu in 2007 to 22 qua-drillion Btu in 2035. The largest single energy-consuming industry in the rest of non-OECD Asia is thechemical sector, which accounts for more than 20 per-cent of industrial delivered energy use for the group.Malaysia, Taiwan, Singapore, and Indonesia account forthe vast majority of the countries’ chemical sector out-put. The most significant steel producer in the group isTaiwan, which produced about 20 million metric tons in2008 [46].
Patterns of industrial energy use in the individual coun-tries of the other non-OECD Asia grouping followdiverse trajectories in the Reference case projection.Mature economies, such as Taiwan, Hong Kong, andSingapore, will follow patterns similar to those in OECDcountries—transitioning away from energy-intensiveindustries to activities with higher added value. Much ofthe growth in commercial energy use occurs in thosecountries. Other regional economies, notably Vietnam,can be expected to expand manufacturing and increaseindustrial sector energy use.
Non-OECD Europe and Eurasia
In Russia, industrial energy consumption patterns areshaped largely by its role as a major energy producer.Russia’s economy grows by 2.7 percent per year on aver-age from 2007 to 2035, with industrial energy demandincreasing by 0.2 percent per year and accounting forabout one-half of the nation’s total delivered energy usethroughout the period. The energy intensity of Russia’sGDP is the highest in the world, and although its energyintensity declines in the Reference case, Russia remainsamong the least energy-efficient economies in the worldthrough 2035. The relative inefficiency of Russian indus-try can be attributed to Soviet-era capital stock andabundant and inexpensive domestic energy supplies. Inthe Reference case, natural gas—Russia’s most abun-dant domestic fuel—accounts for almost half of all Rus-sian industrial energy use. The share of electricity, mostof which is provided by nuclear and natural-gas-firedgeneration, increases through 2035.
Industrial sector energy use in other parts of non-OECDEurope and Eurasia grows by an average of 0.2 percentper year through 2035. The iron and steel sector consti-tutes the largest single energy-consuming industry inthis region, which consists primarily of states that wereonce part of the Soviet Union. Ukraine is the region’slargest—and the world’s eighth largest—steel producer.Almost half of Ukraine’s steel production uses openhearth furnaces, the least energy-efficient steelmakingprocess [47]. Energy intensity of economic output in therest of non-OECD Europe and Eurasia is almost as highas Russia’s, and despite average intensity reductions of2.1 percent per year, the region remains one of theworld’s least energy-efficient through 2035.
U.S. Energy Information Administration / International Energy Outlook 2010 105

Central and South America
Brazil’s industrial energy use grows by an average of 2.1percent per year in the Reference case, as its GDPexpands by 4.1 percent per year. Industrial energy useaccounted for about 60 percent of delivered energy usein Brazil in 2007 and maintains that share through 2035.The inclusion of renewables in the IEO2010 industrialsector baseline and projection constitutes more of a revi-sion in Brazil than in any other region (Figure 90). Morethan 40 percent of delivered energy consumption inBrazil’s industrial sector comes in the form of renewableenergy. Biomass is often the fuel of choice for heat gener-ation in industrial processes. Additionally, many Brazil-ian steel firms use charcoal (which is a wood-basedrenewable) instead of coking coal in the production ofsteel. The Brazilian government plans to support thispractice as part of its National Plan on Climate Change[48]. Even with those efforts, however, coal use in theindustrial sector—primarily for steelmaking—growsfaster than the use of any other fuel.
Economic output in the other countries of Central andSouth America grows more slowly than in Brazil, aver-aging 2.8 percent per year, and their industrial energyconsumption increases from 6.1 quadrillion Btu in 2007to 7.7 quadrillion Btu in 2035. Chemicals and refiningaccount for the largest shares of industrial energy use inthis hydrocarbon-producing region. In the Referencecase, natural gas displaces a large portion of liquids usein the industrial energy mix, fueled by growth in theregion’s domestic natural gas production. In 2007,liquids and natural gas each accounted for 40 percent ofindustrial energy use. From 2007 to 2035, natural gasconsumption increases by an average of 1.5 percent peryear, while liquids consumption decreases by 0.4 per-cent per year. As a result, the natural gas share of the
region’s industrial energy use increases to 47 percent,while the liquids share falls to 27 percent, in 2035.
Other Non-OECD regions
Industrial energy use in the Middle East grows on aver-age by 2.2 percent per year from 2007 to 2035 in theIEO2010 Reference case. In terms of energy consump-tion, the largest industry in the Middle East is the chemi-cal sector. Higher world prices for oil and natural gashave spurred new investment in the region’s petro-chemical sector, where companies can rely on low-costfeedstocks, and the trend is expected to continue despitethe current global slump in demand for chemicals.Numerous “mega” petrochemical projects currently areunder construction in Saudi Arabia, Qatar, Kuwait, theUAE, and Iran [49]. The Middle East is becoming a majormanufacturer of the olefin building blocks that consti-tute a large share of global petrochemical output, andthe region’s ethylene production capacity is expected todouble between 2008 and 2012 [50]. Liquids and naturalgas combined maintain a 94-percent share of the MiddleEast’s industrial fuel mix through 2035 in the Referencecase.
Although 14.1 percent of the world’s total populationlives in Africa, the continent consumes only 4.2 percentof world delivered energy for industrial uses, and itsshare does not change in the Reference case. Africa’stotal industrial energy use grows at an average annualrate of 1.4 percent in the Reference case from 2007 to2035. Although GDP for the sub-Saharan Africa regiongrows by an average of 3.6 percent per year, a substan-tial portion of the increase comes from primary com-modities. Commodity extraction is an energy-intensiveprocess, but it does not support the expansion of indus-trial energy use on the same scale as development of awidespread manufacturing base. Without a substantialdeparture from historical patterns of governance andeconomic activity, low levels of industrial energy use inAfrica can be expected to persist.
References
106 U.S. Energy Information Administration / International Energy Outlook 2010
2006
IEO2009
IEO2010
2020
IEO2009
IEO2010
2030
IEO2009
IEO2010
0 2 4 6 8 10
Coal Liquids Natural gas Electricity Renewables
Figure 90. Industrial sector energy consumption inBrazil by energy source, IEO2009 and IEO2010Reference cases, 2006, 2020, and 2030(quadrillion Btu)
1. International Energy Agency Data Services, EnergyBalances of OECD and Non-OECD Countries (2007),web site http://data.iea.org (subscription site).
2. International Energy Agency, Energy TechnologyPerspectives: Scenarios and Strategies to 2050 (Paris,France, June 2008), pp. 471-473.
3. International Energy Agency, Tracking IndustrialEnergy Efficiency and CO2 Emissions (Paris, France,June 2007), pp. 59-75.
4. IHS Global Insight, Inc., “IHS Global InsightReport: Chemicals (World Industry)” (December10, 2009), web site www.globalinsight.com (sub-scription site).

U.S. Energy Information Administration / International Energy Outlook 2010 107
5. FACTS Global Energy, Energy Insights: Asian Petro-chemical Industry—Fundamental Changes on the Way,No. 139 (December 2009), pp. 1-2.
6. IHS Global Insight, Inc., “IHS Global InsightReport: Steel (World Industry)” (January 4, 2010),web site www.globalinsight.com (subscriptionsite).
7. American Iron and Steel Institute, “How a BlastFurnace Works,” web site www.steel.org/AM/Template.cfm?Section=Articles3&TEMPLATE=/CM/ContentDisplay.cfm&CONTENTID=25317.
8. World Steel Association, “World Steel in Figures2009” (June 2009), web site www.worldsteel.org/pictures/publicationfiles/WSIF09.pdf.
9. World Steel Association, “World Steel in Figures2009” (June 2009), web site www.worldsteel.org/pictures/publicationfiles/WSIF09.pdf.
10. IHS Global Insight, Inc., “IHS Global InsightReport: Steel (World Industry)” (January 4, 2010),web site www.globalinsight.com (subscriptionsite).
11. International Energy Agency, Energy TechnologyTransitions for Industry (Paris, France, September2009), p. 77.
12. IHS Global Insight, Inc., “IHS Global InsightReport: Cement (U.S.) (World Industry)” (Decem-ber 22, 2009), web site www.ihsglobalinsight.com(subscription site).
13. Cembureau, “Sustainable Cement Production,”(June 2009), web site www.cembureau.be/Documents/Press%20Release/Sustainable%20cement%20production%20Brochure.pdf.
14. International Energy Agency, Energy TechnologyTransitions for Industry (Paris, France, September2009), pp. 137-138.
15. HIS Global Insight, Inc., “IHS Global InsightReport: Paper (U.S) (World Industry)” (December23, 2009), web site www.globalinsight.com (sub-scription site).
16. International Energy Agency, Energy TechnologyTransitions for Industry (Paris, France, September2009), p. 137.
17. International Aluminum Institute, “Aluminum forFuture Generations/2009 Update” (2009), web sitewww.world-aluminium.org/cache/fl0000303.pdf.
18. IHS Global Insight, Inc., “IHS Global InsightReport: Nonferrous Metals (World Industry)”(November 30, 2009), web site www.globalinsight.com (subscription site).
19. A. Simon, “Aluminum East of Suez: The Search forCheap Electricity Supplies,” Power in Asia, No. 516(November 20, 2008), pp. 4-8.
20. The Aluminum Association, “Industry Overview”(2008), web site www.aluminum.org/AM/Tem-plate.cfm?Section=Overview&Template=/CM/HTMLDisplay.cfm&ContentID=27135.
21. International Aluminum Institute, “Aluminum forFuture Generations/2009 Update” (2009), web sitewww.world-aluminium.org/cache/fl0000303.pdf.
22. U.S. Department of Energy, “Industrial Technol-ogies Program Fact Sheet,” web site www1.eere.energy.gov/industry/about/pdfs/itp_program_fact_sheet.pdf.
23. 110th Congress, “Energy Independence and Secu-rity Act of 2007,” Public Law 110-140, web sitehttp://frwebgate.access.gpo.gov/cgi-bin/getdoc.cgi?dbname=110_cong_public_laws&docid=f:publ140.110.
24. National Energy Board of Canada, “Energy BriefingNote: Codes, Standards, and Regulations Influ-encing Energy Demand” (Calgary, Alberta,November 2008), p. 13, web site www.neb.gc.ca/clf-nsi/rnrgynfmtn/nrgyrprt/nrgdmnd/cdstndrdrgltn2008/cdstndrdrgltn-eng.html.
25. Government of Canada, Turning the Corner: Regula-tory Framework for Industrial Greenhouse Gas Emis-sions (Ottawa, Ontario, March 2008), pp. 7-9, website www.ec.gc.ca/doc/virage-corner/2008-03/pdf/COM-541_Framework.pdf.
26. Comisión Intersecreterial de Cambio Climático,Programa Especial de Cambio Climático 2009-2012(Mexico, December 2009), web site www.semarnat.gob.mx/queessemarnat/politica_ambiental/cambioclimatico/Documents/pecc/090828_PECC.Capitulos_DOF.pdf.
27. European Commission, “Climate Change: Com-mission Welcomes Final Adoption of Europe’s Cli-mate and Energy Package” (Press Release,December 17, 2008), web site http://europa.eu/rapid/pressReleasesAction.do?reference=IP/08/1998&format=HTML&aged=0&language=EN&guiLanguage=en.
28. International Federation of Industrial Energy Con-sumers, “IFIEC Europe’s Initial Response to the EUClimate Package: Challenging Climate Change Tar-gets Require Cost Efficient Solutions” (PressRelease, January 29, 2008), web site www.ifieceurope.org/docs/climate%20package%20resp%20press%20rel%2029%2001%2008.pdf.
29. “Keeping It Clean,” The Economist (December 12,2008), web site www.economist.com (subscriptionsite).

108 U.S. Energy Information Administration / International Energy Outlook 2010
30. K. Kanekiyo, “Japanese Experience Toward EnergyEfficient Economy,” presentation at The ChinaInternational Energy Forum (Beijing, November1-2, 2007), web site http://eneken.ieej.or.jp/en/data/pdf/408.pdf.
31. Y. Yamashita, “Key Points of Outlook 2009: Devel-opments Involving Energy Conservation” (March2009), web site http://eneken.ieej.or.jp/data/en/data/pdf/476.pdf.
32. World Steel Association, “World Steel in Figures2009” (June 2009), web site www.worldsteel.org/pictures/publicationfiles/WSIF09.pdf.
33. “Counting Their Blessings,” The Economist (Decem-ber 30, 2009), web site www.economist.com (sub-scription site).
34. W.M. Morrison, CRS Report for Congress: China’sEconomic Conditions (Washington, DC: Congressio-nal Research Service, November 20, 2009), p. 1, website http://opencrs.com/document/RL33534/2008-11-20.
35. The Climate Group, China’s Clean Revolution (Lon-don, UK, 2008), pp. 15-17, web site www.theclimategroup.org/assets/resources/Chinas_Clean_Revolution.pdf.
36. J.L. Yifu, speech at “China and the Faltering GlobalEconomy: A Brookings-Caijing Symposium,”(Washington, DC, January 13, 2009), web site www.brookings.edu/~/media/Files/events/2009/0113_caijing/20090113_caijing.pdf.
37. The Economist Intelligence Unit Newswire, “ChinaIs Spending To Recover” (June 1, 2009), web sitewww.economist.com (subscription site).
38. IHS Global Insight, Inc., “The 4-tril.-Yuan Bailout;Zooming Into China’s Fiscal Stimulus Plan” (March25, 2009), web site www.ihsglobalinsight.com (sub-scription site).
39. L. Price and W. Xuejun, Constraining Energy Con-sumption of China’s Largest Industrial EnterprisesThrough the Top-1000 Energy-Consuming EnterpriseProgram, LBNL-00000 (Berkeley, CA: LawrenceBerkeley National Laboratory, June 2007), p. 1, website http://ies.lbl.gov/iespubs/2007aceee.pdf.
40. IHS Global Insight, Inc., “China’s IndustrialAuthority Names Priority Industries for Develop-ment, Announces Steps to Consolidate TraditionalIndustries” (December 22, 2009), web site www.globalinsight.com (subscription site).
41. J.A. Sathaye, “India: Energy Demand and Supplyand Climate Opportunities,” presentation at theWorkshop on Asia-Pacific Partnership on CleanDevelopment and Climate Opportunities in Chinaand India (Washington, DC, March 22, 2006), website http://ies.lbl.gov/ppt/indiasupplydemand.pdf.
42. “Melting Asia,” The Economist (June 5, 2008), website www.economist.com (subscription site).
43. World Steel Association, “World Steel in Figures2009” (June 2009), web site www.worldsteel.org/pictures/publicationfiles/WSIF09.pdf.
44. U.S. Energy Information Administration, Interna-tional Energy Outlook 2008, DOE/EIA-0484(2008)(Washington, DC, September 2008), web site www.eia.gov/oiaf/ieo/index.html.
45. Government of India—Prime Minister’s Council onClimate Change, National Action Plan on ClimateChange (June 2008), pp. 22-24, web site www.pmindia.nic.in/Pg01-52.pdf.
46. World Steel Association, “World Steel in Figures2009” (June 2009), web site www.worldsteel.org/pictures/publicationfiles/WSIF09.pdf.
47. World Steel Association, “World Steel in Figures2009” (June 2009), web site www.worldsteel.org/pictures/publicationfiles/WSIF09.pdf.
48. Government of Brazil—Interministerial Committeeon Climate Change, Executive Summary: NationalPlan Climate Change (December 2008), web sitewww.mma.gov.br/estruturas/208/_arquivos/national_plan_208.pdf.
49. FACTS Global Energy, Energy Advisory: Middle EastOlefin Production Prospects: Oversupply in the Mar-ket?, No. 342 (December 2008), pp. 2-3.
50. “Special Report: CMAI: Wave of New MideastOlefins Capacity Coming On Line,” Oil and GasJournal, Vol. 106, No. 32 (August 25, 2008), web sitewww.ogj.com (subscription site).

Chapter 7
Transportation Sector Energy ConsumptionIn the IEO2010 Reference case, transportation energy use in non-OECD countries
increases by an average of 2.6 percent per year from 2007 to 2035, as compared
with an average of 0.3 percent per year for OECD countries.
OverviewEnergy use in the transportation sector includes theenergy consumed in moving people and goods by road,rail, air, water, and pipeline. The road transport compo-nent includes light-duty vehicles, such as automobiles,sport utility vehicles, minivans, small trucks, and motor-bikes, as well as heavy-duty vehicles, such as largetrucks used for moving freight and buses used forpassenger travel. Consequently, transportation sectorenergy demand hinges on growth rates for both eco-nomic activity and the driving-age population. Eco-nomic growth spurs increases in industrial output,which requires the movement of raw materials to manu-facturing sites, as well as the movement of manufac-tured goods to end users.
Almost 20 percent of the world’s total delivered energyis used in the transportation sector, where liquid fuelsare the dominant source. Transportation alone accountsfor more than 50 percent of world consumption of liquidfuels, and its share increases over the projection period(Figure 91). The transportation share of total liquid fuelsconsumption rises to 61 percent in 2035, as their sharedeclines in the other end-use sectors. Because liquidsplay a key role in the world transportation sector,understanding how the sector is likely to evolve couldbe the most important factor in assessing the future ofliquid fuel markets. From 2007 to 2035, growth in
transportation energy use accounts for 87 percent of thetotal increase in world liquids consumption.
World oil prices reached historic high levels in 2008, inpart because of a strong increase in demand for trans-portation fuels, particularly in the emerging non-OECDeconomies. Non-OECD energy use for transportationincreased by 4.5 percent in 2007 and 7.3 percent in 2008.Even in 2009, non-OECD transportation energy usegrew by an estimated 3.2 percent, in part because manycountries—especially oil-rich nations, but others aswell—continued to provide fuel subsidies to their citi-zens. With robust economic recovery expected to con-tinue in China, India, and other non-OECD nations,growing demand for raw materials, manufacturedgoods, and business and personal travel supportsfast-paced growth in energy use for transportation bothin the short term and over the long term. In the IEO2010Reference case, non-OECD transportation energy usegrows by 2.6 percent per year on average from 2007 to2035 (Figure 92 and Table 14).
The impact of high oil prices and the economic recessionhas been more profound in OECD economies than innon-OECD economies. Transportation energy use inOECD nations declined by an estimated 1.3 percent in2008, followed by a further decrease estimated at 2.0 per-cent in 2009. Indications are that a return to growth in
U.S. Energy Information Administration / International Energy Outlook 2010 109
2007 2015 2020 2025 2030 20350
50
100
150Transportation Other
Figure 91. World liquids consumption by end-usesector, 2007-2035 (quadrillion Btu)
2007 2015 2020 2025 2030 20350
20
40
60
80OECD Non-OECD
Figure 92. OECD and Non-OECD transportationsector liquids consumption, 2007-2035(quadrillion Btu)

transportation energy use in OECD nations will notbegin before mid-2010, because a relatively slow recov-ery from the global recession is anticipated for many ofthe key OECD nations. Moreover, the United States andsome of the other OECD countries have instituted anumber of new policy measures to increase the fuel effi-ciency of their vehicle fleets, as well as fuel taxationregimes to encourage fuel conservation. Thus, OECDtransportation energy use grows by only 0.3 percent peryear over the entire projection period and is notexpected to return to its 2007 level until after 2020.
In the long term, for both non-OECD and OECD econo-mies, steadily increasing demand for personal traveland freight transportation is the primary factor underly-ing increases in transportation energy demand. Passen-ger transportation energy use includes fuels used inlight-duty vehicles, buses, aircraft, and passenger trains.Freight transportation energy use includes fuels used bylarge trucks, freight trains, and both domestic and inter-national marine vessels.25
In 2007, about two-thirds of transportation energy use inOECD countries was for passenger travel; that sharedeclines slightly from 2007 to 2035. For non-OECDnations, passenger travel accounted for 56 percent oftotal transportation energy use in 2007, and the sharefalls to 51 percent in 2035. In the Reference case, pro-jected efficiency gains worldwide are much more robustfor light-duty passenger vehicles than for freight modesof transport, because many of the potential freight-related transport efficiencies have been realized alreadyin the existing fleet. As a result, although both passengertravel and freight travel increase in the Reference case,world energy consumption for freight-related travelincreases at about twice the rate of energy use for pas-senger transportation (Tables 15 and 16).
The IEO2010 Reference case assumes that, as personalincome grows in the developing non-OECD nations,demand for personal motor vehicles will grow. Theexpectation is that major urban areas will address theaccompanying congestion and strains on infrastructurewith the development of mass transit (bus and/or rail)and urban design that reduces vehicle miles traveled,among other improvements to transportation networks.The Reference case projects robust growth in energy useboth for personal motor vehicles (light-duty cars andtrucks and two- and three-wheel vehicles) and for publicpassenger travel (rail and bus) in many developingregions.
For many of the rapidly developing and urbanizingnon-OECD economies, it may be a future challenge tokeep transportation infrastructure development on paceto meet growing demand for mobility services. Trans-portation equipment cannot provide service withoutroads, rail lines, ports, and airports. Such infrastructureis expensive to build and maintain, and infrastructuredecisions made in the near term will affect energy use inthe future. Decisions on where to build urban rail sys-tems will influence travel modes to and from the work-place for many years to come. In the developingnon-OECD regions where urbanization is still in earlystages and much of the urban transportation infrastruc-ture has not yet been built, transportation energy needsover the long-term future will be affected substantiallyby policy decisions made in the coming decades.
Regional transportation energyoutlooksOECD countries
In OECD economies, established transportation sectors,relatively slow rates of GDP growth and population
110 U.S. Energy Information Administration / International Energy Outlook 2010
Table 14. World energy consumption for transportation by country grouping, 2007-2035 (quadrillion Btu)
Region 2007 2015 2020 2025 2030 2035
Average annualpercent change,
2007-2035
OECD . . . . . . . . . . . . . . . . . . . . . 59.9 59.2 59.7 61.2 62.8 64.6 0.3North America . . . . . . . . . . . . . . 33.7 33.3 34.2 35.7 37.1 38.8 0.5Europe . . . . . . . . . . . . . . . . . . . . 18.8 18.6 17.9 17.8 17.9 17.9 -0.2Asia . . . . . . . . . . . . . . . . . . . . . . 7.4 7.4 7.6 7.7 7.8 7.9 0.2
Non-OECD . . . . . . . . . . . . . . . . . 38.1 49.7 55.4 62.2 69.6 77.5 2.6Europe and Eurasia . . . . . . . . . . 6.9 7.4 7.6 7.9 8.1 8.6 0.8Asia . . . . . . . . . . . . . . . . . . . . . . 15.4 22.3 26.4 31.0 35.7 40.3 3.5Middle East . . . . . . . . . . . . . . . . 5.8 7.8 8.7 9.7 10.9 12.5 2.8Africa . . . . . . . . . . . . . . . . . . . . . 3.5 4.4 4.6 5.1 5.7 6.3 2.2Central and South America . . . . 6.5 7.8 8.1 8.5 9.2 9.8 1.5
Total World . . . . . . . . . . . . . . . . . 97.9 109.0 115.1 123.4 132.5 142.1 1.3
Note: Totals may not equal sum of components due to independent rounding.25 In the IEO2010 projections, fuel use in dedicated freight aircraft is included with fuel use in passenger aircraft.

growth, and sustained high world oil prices lead to theexpectation that transportation energy demand willincrease only modestly, by a total of 8 percent, in theIEO2010 Reference case, from 59.9 quadrillion Btu in2007 to 64.6 quadrillion Btu in 2035 (Figure 93). Trans-portation infrastructure and driving patterns in OECDcountries are generally well established. Roads andhighways connect most population centers. Motoriza-tion levels (vehicles per 1,000 people), which already arehigh (for example, there were 765 vehicles per thousandpeople in the United States in 2009), are likely to reachsaturation by 2035. In addition, as OECD economies
have become more service-oriented, the link betweenincome and the transportation of goods has weakened.
Other factors also slow the growth in transportation fueldemand in the OECD region, particularly with respect tothe energy used for personal motor vehicle travel. ManyOECD member countries, including European membersand Japan, have imposed comparatively high sales taxeson motor fuels, leading many consumers to drive lessand choose smaller, more energy-efficient personalmotor vehicles. In France, for example, the sales tax lev-ied on motor gasoline accounts for 70 percent of the cost
U.S. Energy Information Administration / International Energy Outlook 2010 111
Table 15. World energy consumption for passenger transportation by country grouping, 2007-2035(quadrillion Btu)
Region 2007 2015 2020 2025 2030 2035
Average annualpercent change,
2007-2035
OECD . . . . . . . . . . . . . . . . . . . . . 36.6 35.6 35.1 35.4 35.6 35.8 -0.1North America . . . . . . . . . . . . . . 21.2 21.0 21.2 21.7 22.3 22.9 0.3Europe . . . . . . . . . . . . . . . . . . . . 11.1 10.6 9.9 9.6 9.4 9.1 -0.7Asia . . . . . . . . . . . . . . . . . . . . . . 4.3 4.0 4.1 4.0 3.9 3.9 -0.4
Non-OECD . . . . . . . . . . . . . . . . . 17.9 23.0 25.5 28.4 31.5 34.7 2.4Europe and Eurasia . . . . . . . . . . 2.9 3.0 2.9 2.9 3.0 3.1 0.3Asia . . . . . . . . . . . . . . . . . . . . . . 7.4 10.5 12.4 14.5 16.6 18.7 3.4Middle East . . . . . . . . . . . . . . . . 2.9 3.9 4.3 4.7 5.3 6.0 2.6Africa . . . . . . . . . . . . . . . . . . . . . 1.8 2.1 2.2 2.4 2.6 2.8 1.6Central and South America . . . . 3.0 3.5 3.7 3.8 4.0 4.1 1.2
Total World . . . . . . . . . . . . . . . . . 54.5 58.7 60.6 63.7 67.1 70.6 0.9
Notes: Passenger transportation includes travel by light-duty vehicles, two- and three-wheel vehicles, buses, passenger rail, andpassenger air. Military travel is not included. Totals may not equal sum of components due to independent rounding.
Table 16. World energy consumption for freight transportation by country grouping, 2007-2035(quadrillion Btu)
Region 2007 2015 2020 2025 2030 2035
Average annualpercent change,
2007-2035
OECD . . . . . . . . . . . . . . . . . . . . . 19.4 19.7 20.4 21.3 22.3 23.4 0.7North America . . . . . . . . . . . . . . 8.6 8.5 9.0 9.4 10.0 10.7 0.8Europe . . . . . . . . . . . . . . . . . . . . 7.6 8.0 7.9 8.2 8.5 8.8 0.5Asia . . . . . . . . . . . . . . . . . . . . . . 3.1 3.3 3.5 3.7 3.8 4.0 0.9
Non-OECD . . . . . . . . . . . . . . . . . 18.1 24.5 27.6 31.3 35.5 40.0 2.9Europe and Eurasia . . . . . . . . . . 2.1 2.4 2.5 2.6 2.6 2.9 1.1Asia . . . . . . . . . . . . . . . . . . . . . . 8.0 11.8 14.0 16.5 19.1 21.6 3.6Middle East . . . . . . . . . . . . . . . . 2.9 4.0 4.4 4.9 5.6 6.5 2.9Africa . . . . . . . . . . . . . . . . . . . . . 1.6 2.2 2.3 2.6 3.0 3.4 2.7Central and South America . . . . 3.5 4.3 4.4 4.7 5.2 5.6 1.7
Total World . . . . . . . . . . . . . . . . . 37.5 44.2 48.0 52.6 57.9 63.4 1.9
Notes: Freight transportation includes travel by heavy and other trucks, coal and freight rail, domestic and international water, andair freight. Lubricants and pipeline transportation are not included. Totals may not equal sum of components due to independentrounding.

of a gallon of fuel, so that French drivers pay about 120percent more for their fuel than do U.S. consumers [1]. Inaddition, a number of OECD governments have policiesin place to improve fuel economy standards and encour-age the replacement of old inefficient stock, and as theaverage energy efficiency of motor vehicles continues toimprove, increases in demand for motor fuels areslowed.
North America
North America accounted for 56 percent of total OECDtransportation energy use in 2007, and its share grows to57 percent in 2020 and 60 percent in 2035 in the Refer-ence case. The United States is the largest transportationenergy consumer in North America, accounting forabout 86 percent of the regional total (Figure 94). U.S.delivered energy consumption in the transportation sec-tor grows from 29.0 quadrillion Btu in 2007 to 32.5 qua-drillion Btu in 2035.
The Reference case assumes the adoption of corporateaverage fuel economy (CAFE) standards proposedjointly by the U.S. Environmental Protection Agency(EPA) and the U.S. Department of Transportation’sNational Highway Traffic Safety Administration(NHTSA) for light-duty vehicles (both cars and lighttrucks) in model years 2012 through 2016. Accordingly,the average fuel economy of new light-duty vehiclesrises from 29 miles per gallon in 2011 to 34 miles pergallon in 2016. After 2016, fuel economy standardsare assumed to increase modestly through the 2020model year, to 35.6 miles per gallon, in order to meetthe requirements of the Energy Independence andSecurity Act of 2007 (EISA2007). To meet the mandatedfuel economy levels, sales of unconventional vehicletechnologies26—such as flex-fuel, hybrid, and dieselvehicles—increase over the projection period, and thegrowth of new light truck sales slows.
In addition to road transportation energy use, U.S.energy demand for aircraft increases by a total of 19 per-cent in the Reference case, from 2.7 quadrillion Btu in2007 to 3.3 quadrillion Btu in 2035 [2]. Although thegrowth in personal air travel is based on increases inincome per capita, it slows over the long term as demandfor air travel reaches saturation. Furthermore, expectedincreases in aircraft fuel efficiency and slow growth inair freight movement due to slow growth in importscombine to dampen the growth in U.S. air transportationenergy consumption in the long term. Marine and railenergy consumption increases by a combined 7 percentin the projection, as a result of growth in industrial out-put and increasing demand for coal transport.
Canada’s current mix of transportation energy use issimilar to that in the United States (personal motor vehi-cles are fueled largely by motor gasoline rather than die-sel or alternative fuels), and it remains so in theReference case. The markets of the two countries arelargely interconnected, not only because of their proxim-ity but also because of similar geography and demo-graphics. Canada’s Fuel Consumption Program hasestablished targets for new-vehicle fuel efficiencies thatare largely in line with the U.S. CAFE standards(although the Canadian program is voluntary ratherthan mandated) [3]. Canada’s total transportationenergy use increases in the Reference case by an averageof 0.5 percent per year from 2007 to 2035, compared with0.4 percent per year in the United States.
In Mexico, relatively strong GDP growth (3.5 percent peryear) increases energy consumption in the transporta-tion sector at an average rate of 1.6 percent per year,from 2.2 quadrillion Btu in 2007 to 3.4 quadrillion Btu in2035. The increase in transportation fuel use is based onexpected growth in trade with the United States and theeconomies of Central and South America. Given the
112 U.S. Energy Information Administration / International Energy Outlook 2010
2007 2025 2035 2007 2025 2035 2007 2025 20350
10
20
30
40
Freight
Passenger
North America Europe Asia
Figure 93. OECD transportation energy useby region, 2007, 2025, and 2035 (quadrillion Btu)
3
2
33
3
3
United States
Canada
Mexico
0 10 20 30 40
2007
2035
29
Figure 94. North America transportation energy useby country, 2007 and 2035 (quadrillion Btu)
26 Vehicles that use alternative fuels, electric motors and advanced electricity storage, advanced engine controls, or other newtechnologies.

relatively underdeveloped nature of Mexico’s transpor-tation infrastructure, overall improvement in the coun-try’s standard of living supports growth in demand atmore than twice the growth rate for transportationenergy demand in the United States.
Energy use for bus and passenger rail transportation inMexico nearly keeps pace with the rate of growth in fueluse for light-duty vehicles, expanding by 1.1 percent peryear, compared with 1.4 percent per year for light-dutyvehicle energy consumption. Although mass transit isnot widespread in Mexico, there have been efforts toexpand rapid transit as a way to improve air quality,notably in the large and congested Mexico City area.
In June 2005, Mexico City’s Bus Rapid Transit (BRT),Metrobús, began operating along a 12-mile length of theAvenida de los Insurgentes—often cited as the longesturban avenue in the world [4]. Today, Metrobús consistsof two lines with a total length of nearly 30 miles, andthere are plans to extend the system with two additionallines that will nearly double the current length of thesystem [5]. Metrobús is the longest operating BRT inLatin America, transporting an average of 265,000 pas-sengers each day, and it has been credited with dramati-cally improving the city’s air quality [6]. Its successdemonstrates how important mass transit may be inshaping transportation consumption trends, particu-larly in fast-growing urban areas with underdevelopedtransportation infrastructures.
OECD Europe
In OECD Europe, slow population growth, high trans-portation fuel costs, and environmental policies contrib-ute to a decline in demand for transportation energyin the Reference case. OECD Europe’s populationincreases by only 0.2 percent per year; the countries of
the region already have mature transportation systems;and improvements in energy efficiency over the courseof the projection result in passenger transportationenergy use that declines by an average of 0.7 percent peryear from 2007 to 2035 (Figure 95). Despite slow popula-tion growth in OECD Europe, economic growth contin-ues at an average rate of 1.7 percent per year, and energyuse for freight transportation grows by an average of 0.5percent per year. The growth in fuel use to move freightpartially offsets the decline in fuel use for passengertransport over the projection period, and total transpor-tation energy use declines by 0.2 percent per year.
OECD Europe’s transportation energy consumptiondeclined by an estimated 1.1 percent in 2009, as theglobal economic recession lowered demand for bothfreight and passenger travel. Many countries in theregion introduced “fleet renewal schemes” to encourageconsumer purchases of new, energy-efficient vehiclesand support economic growth as the recession deep-ened. The terms of the schemes varied widely, withincentives to scrap older vehicles altogether and/orreplace them with new efficient vehicles. Eleven coun-tries in OECD Europe offered the schemes in the2008-2010 period (Table 17). The United Kingdom’sscheme expired in late March 2010, and the schemes inSpain and Luxembourg are scheduled to expire in late2010 [7].
Although the fleet renewal schemes did boost car salesstrongly, and they provided a short-term economic ben-efit by increasing automobile production, sales are pro-jected to be depressed as the stimulus packages areremoved [8]. In the long term, OECD Europe’s transpor-tation energy use continues to decline slowly, to 17.9quadrillion Btu in 2020, and remains at that levelthrough 2035. The transportation share of total deliveredenergy use in OECD Europe falls slightly, from 31 per-cent in 2007 to 30 percent in 2020, and remainsunchanged through 2035.
The infrastructure for mass transit to interconnect thecountries of OECD Europe, particularly rail infrastruc-ture, is well established. The 10 separate high-speed railsystems currently operating in Europe can compete suc-cessfully with air travel [9]. Examples include the TGVrail system, which operates in France, Switzerland, Ger-many, and Belgium, and the Eurostar system, whichoperates in England, France, and Belgium. High popula-tion densities, the convenience of relatively short traveltimes offered by high-speed rail, and high motor fueltaxes that encourage consumers to use mass transit haveallowed rail to succeed in OECD Europe, and it shouldcontinue to be a major transportation mode in the regionfor the foreseeable future.
U.S. Energy Information Administration / International Energy Outlook 2010 113
2007 2015 2020 2025 2030 20350
5
10
15
20
25
Freight
Passenger
Figure 95. OECD Europe transportation energy use,2007-2035 (quadrillion Btu)

OECD Asia
OECD Asia, like OECD Europe, generally has well-established transportation infrastructures; however,with population in the region as a whole expected tocontract (averaging -0.1 percent per year from 2007 to2035), passenger transport demand declines. Theregion’s passenger transportation energy use falls byabout 0.4 percent per year from 2007 to 2035 in theIEO2010 Reference case.
In 2008 and 2009, the global economic recession slowedthe growth in demand for transportation fuels in OECDAsia, as manufacturing and consumer demand forgoods and services slowed substantially. In the shortterm, total demand for transportation fuels in theregion declines from 7.4 quadrillion Btu in 2007 to 7.0
quadrillion Btu in 2010, followed by a gradual increaseto 7.9 quadrillion Btu in 2035. The largest increase isexpected in South Korea, where transportation fuel userises by 1.3 percent per year from 2007 to 2035 (Figure96). In comparison, fuel use in Australia and NewZealand combined increases at only half that rate.
Among the economies of OECD Asia, Japan was thehardest hit by the 2008-2009 recession, with GDP con-tracting by 0.7 percent in 2008 and by an estimated 5.3percent in 2009. Transportation fuel use in the countryalso declined strongly, from 4.0 quadrillion Btu in 2007to 3.7 quadrillion Btu in 2009, and is expected to declineagain in 2010 to 3.4 quadrillion Btu. Like other OECDeconomies that were severely hit by the recession, Japanannounced a vehicle scrappage program in 2009, the
114 U.S. Energy Information Administration / International Energy Outlook 2010
Table 17. Fleet renewal schemes in OECD Europe, 2009 and 2010Country Incentive Vehicle age Estimated value Duration
Austria . . . . . . . . .. . . . . . . . . . . . . . $2,000 >13 years $60 million 4/1/2009–12/12/2009
France . . . . . . . . . $1,300 >10 years $293 million 12/4/2008–12/31/2009
Germany . . . . . . . $3,330 >9 years $2.0 billion(600,000 cars)
1/14/2009–12/31/2009
Italy . . . . . . . . . . . $2,000-$6,660 (cars)$3,330-$8,660 (LCVs)
>9 years — 2/7/2009–12/31/2009
Portugal
Plan I . . . . . . . . . $1,300-$1,660 >10 years ($1,300)>15 years ($1,660)
— 1/1/2009–8/7/2009
Plan II . . . . . . . . $1,660-$2,000 >10 years ($1,660)>13 years ($2,000)
— 8/8/2009–12/31/2009
Spain
Plan VIVE . . . . . Interest-free loan up to $13,300 >10 years or>155,000 miles
— 12/1/2008–10/1/2010
Plan 2000E . . . . $2,660 >10 years (with purchase of new car)>12 years (with purchase of used car)
$745 million(280,000 vehicles)
5/18/2009–5/18/2010
Luxembourg . . . . $2,000-$2,330 >10 years — 1/22/2009–10/1/2010
Slovakia
Plan I . . . . . . . . . $1,330-$2,260 >10 years — 3/9/2009–3/25/2009
Plan II . . . . . . . . $1,330 >10 years — 4/6/2009–12/31/2009
Netherlands . . . . . $1,000-$1,330(motor gasoline cars and LCVs)
$1,330-$2,330(diesel cars and LCVs)
Various, >13 years — 2009–2010
United Kingdom. . $3,000 >10 years $595 million 5/1/2009–3/31/2010
Greece. . . . . . . . . $670-$4,300 (passenger cars)$670-$4,900 (LCVs)$4,000-$17,320 (trucks,about 1.5-ton payload)
First registered before January 1, 2005 — 9/23/2009–11/2/2009
Notes: Assumed exchange rates are $1.00 = 0.75 Euro and $1.00 = 0.67 British pound. LCV = light commercial vehicle.Source: European Automobile Manufacturers’ Association.
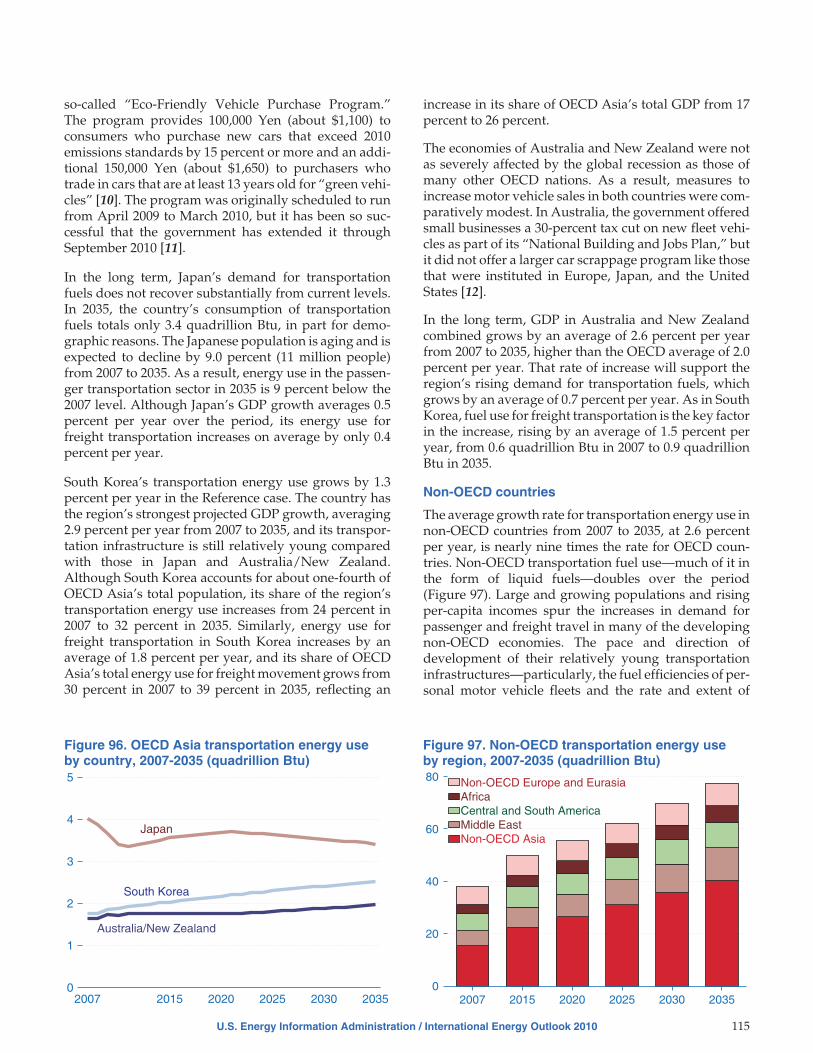
so-called “Eco-Friendly Vehicle Purchase Program.”The program provides 100,000 Yen (about $1,100) toconsumers who purchase new cars that exceed 2010emissions standards by 15 percent or more and an addi-tional 150,000 Yen (about $1,650) to purchasers whotrade in cars that are at least 13 years old for “green vehi-cles” [10]. The program was originally scheduled to runfrom April 2009 to March 2010, but it has been so suc-cessful that the government has extended it throughSeptember 2010 [11].
In the long term, Japan’s demand for transportationfuels does not recover substantially from current levels.In 2035, the country’s consumption of transportationfuels totals only 3.4 quadrillion Btu, in part for demo-graphic reasons. The Japanese population is aging and isexpected to decline by 9.0 percent (11 million people)from 2007 to 2035. As a result, energy use in the passen-ger transportation sector in 2035 is 9 percent below the2007 level. Although Japan’s GDP growth averages 0.5percent per year over the period, its energy use forfreight transportation increases on average by only 0.4percent per year.
South Korea’s transportation energy use grows by 1.3percent per year in the Reference case. The country hasthe region’s strongest projected GDP growth, averaging2.9 percent per year from 2007 to 2035, and its transpor-tation infrastructure is still relatively young comparedwith those in Japan and Australia/New Zealand.Although South Korea accounts for about one-fourth ofOECD Asia’s total population, its share of the region’stransportation energy use increases from 24 percent in2007 to 32 percent in 2035. Similarly, energy use forfreight transportation in South Korea increases by anaverage of 1.8 percent per year, and its share of OECDAsia’s total energy use for freight movement grows from30 percent in 2007 to 39 percent in 2035, reflecting an
increase in its share of OECD Asia’s total GDP from 17percent to 26 percent.
The economies of Australia and New Zealand were notas severely affected by the global recession as those ofmany other OECD nations. As a result, measures toincrease motor vehicle sales in both countries were com-paratively modest. In Australia, the government offeredsmall businesses a 30-percent tax cut on new fleet vehi-cles as part of its “National Building and Jobs Plan,” butit did not offer a larger car scrappage program like thosethat were instituted in Europe, Japan, and the UnitedStates [12].
In the long term, GDP in Australia and New Zealandcombined grows by an average of 2.6 percent per yearfrom 2007 to 2035, higher than the OECD average of 2.0percent per year. That rate of increase will support theregion’s rising demand for transportation fuels, whichgrows by an average of 0.7 percent per year. As in SouthKorea, fuel use for freight transportation is the key factorin the increase, rising by an average of 1.5 percent peryear, from 0.6 quadrillion Btu in 2007 to 0.9 quadrillionBtu in 2035.
Non-OECD countries
The average growth rate for transportation energy use innon-OECD countries from 2007 to 2035, at 2.6 percentper year, is nearly nine times the rate for OECD coun-tries. Non-OECD transportation fuel use—much of it inthe form of liquid fuels—doubles over the period(Figure 97). Large and growing populations and risingper-capita incomes spur the increases in demand forpassenger and freight travel in many of the developingnon-OECD economies. The pace and direction ofdevelopment of their relatively young transportationinfrastructures—particularly, the fuel efficiencies of per-sonal motor vehicle fleets and the rate and extent of
U.S. Energy Information Administration / International Energy Outlook 2010 115
2007 2015 2020 2025 2030 20350
1
2
3
4
5
South Korea
Japan
Australia/New Zealand
Figure 96. OECD Asia transportation energy useby country, 2007-2035 (quadrillion Btu)
2007 2015 2020 2025 2030 20350
20
40
60
80
Non-OECD AsiaMiddle EastCentral and South AmericaAfricaNon-OECD Europe and Eurasia
Figure 97. Non-OECD transportation energy useby region, 2007-2035 (quadrillion Btu)

market penetration by mass transit systems—will shapethe future demand for transportation fuels in the non-OECD nations.
Non-OECD Asia
The nations of non-OECD Asia are among the fastest-growing consumers of transportation energy in theIEO2010 Reference case. In non-OECD Asia, transporta-tion energy consumption for both passenger and freighttransportation increases rapidly, supported by sus-tained high rates of economic growth over the 2007-2035period. In total, China, India, and the other developingcountries of non-OECD Asia account for almost one-halfof the world increase in GDP in the Reference case,growing from 23 percent of the world economy in 2007to 38 percent in 2035. Over the same period, non-OECDAsia’s share of world transportation liquids consump-tion increases from 16 percent to 28 percent.
China has been, and is projected to continue to be, thefastest-growing economy among non-OECD countriesand the fastest-growing consumer of transportationfuels (Figure 98). From 2007 to 2035, China’s GDPincreases by an average of 5.8 percent per year in the Ref-erence case, its use of passenger transportation fuelsincreases by 4.3 percent per year, and its use of freighttransportation fuels increases by 4.6 percent per year.From 1997 to 2007, growth in the combined length ofChina’s highways averaged 11.3 percent per year, andits GDP expanded by an annual average of 9.6 percent[13]. Over the same period, passenger-miles traveledand ton-miles of highway freight travel increased atannual rates of 7.9 and 8.0 percent, respectively.Although China’s passenger transportation energy useper capita triples in the Reference case, in 2035 it still isonly about one-third of South Korea’s (Figure 99).
Motorization (motor vehicles per 1,000 persons27) iscomparatively low in China, estimated at 32 motor vehi-cles per 1,000 persons in 2007 [14], as compared with anestimated 338 vehicles per 1,000 persons in South Korea.China’s motorization is likely to increase stronglythrough 2035, but it is not expected to reach the levels ofmany OECD nations, including South Korea. AlthoughChina’s passenger transportation energy use per capitatriples in the Reference case, in 2035 it still is only aboutone-third of South Korea’s (Figure 99).
In part, the disparities between passenger transporta-tion energy use in China and South Korea are explainedby the more significant role of nonmotorized trans-port—including handcarts and bicycles—in China anddifferences between rural and urban population sharesin the two countries. In 2007, according to the UnitedNations, 42 percent of China’s population was consid-ered urban [15]. In contrast, 81 percent of South Korea’stotal population is urban. The urban share of total popu-lation is expected to increase in China over time, buteven in 2025 the United Nations expects China’s urbanshare of population to be only 57 percent.
China became the world’s largest car market in 2009,when light-duty vehicle sales reached 13.6 million—sur-passing sales in the United States, which fell to 10.3 mil-lion vehicles as the economic recession and risingunemployment reduced U.S. demand for automobiles toits lowest level in 27 years [16]. Car sales in China surgedby nearly 50 percent in 2009, supported by some $15 bil-lion in government-sponsored incentives, includingsales tax rebates for the purchase of small cars and subsi-dies for buyers in rural areas [17]. Although sales areexpected to slow as the government tightens lendingterms to keep the economy from growing too quickly,analysts still project a 7- to 10-percent increase in vehicle
116 U.S. Energy Information Administration / International Energy Outlook 2010
2007 2015 2020 2025 2030 20350
10
20
30
40
50
China
India
Other Non-OECD Asia
Figure 98. Non-OECD Asia transportation energyuse by country, 2007-2035 (quadrillion Btu)
2007 2015 2020 2025 2030 20350
5
10
15
20
25China South Korea
Figure 99. Transportation energy use per capita inChina and South Korea, 2007-2035 (quadrillion Btu)
27 Motor vehicles include cars, buses, and freight vehicles but do not include two-wheelers.

sales for 2010. As per-capita incomes rise, Chinese con-sumers purchase motor vehicles as status symbols, aswell as for ease of mobility. This development has beenobserved particularly among younger Chinese who can-not afford to buy a home but, with the various incentiveprograms, can afford to purchase an automobile [18]. Asa result, the market for light-duty vehicles in Chinashould continue to expand strongly in the mid-term.
In addition to its rapidly expanding highway system,passenger railways are an important part of China’stransportation network development. In 2008 alone,around 1.4 billion passenger trips were taken on China’srailways [19]. The Chinese government has recognizedthe importance of expanding the system, making largeinvestments in its high-speed passenger railways. Thoseinvestments will be key to improving travel timesbetween major cities, and they will allow more freight tomove along the existing slower rail lines, improving eco-nomic prospects in the rural parts of the country wheregrowth has often lagged behind that of the industrialcoast. China began construction on a national passengerrail system in 2005, with plans to provide access to railthroughout the country by 2020.
China accelerated investment in passenger rail construc-tion as part of the economic stimulus package valued atabout $585 billion (U.S. dollars) that was instituted in thewake of the global economic downturn of 2008. In 2009,the government doubled investment in high-speed railto $50 billion in order to boost economic growth andemployment levels, which had faltered as globaldemand for Chinese goods declined. There are addi-tional plans to invest some $17.6 billion in a passengerrail line across the northwestern Chinese desert and$24.0 billion in a line from Beijing to Guangzhou insoutheastern China. A $23.5 billion line from Beijing toShanghai should become operational in 2011 [20]. Thegovernment expects to have some 8,100 miles of high-speed rail installed by 2012 and 16,000 miles by 2020[21]. The high-speed rail lines are proving to be enor-mously popular, and they are competing successfullywith air travel. Within 48 days of its opening in 2010, the314-mile Zhengzhou-to-Xian line reduced travel time sodramatically, and proved so popular, that airline servicebetween the two cities was discontinued.
The large-scale plans to expand high-speed passengerrail in China emphasize the importance that mass transitcan have in the development of a country’s transporta-tion energy use. In the IEO2010 Reference case, China’spassenger rail system is expected to temper the growthin demand for personal motor vehicles. At top speed,China’s high-speed passenger trains can reach 217 milesper hour, and trips that once took more than 6 hours canbe reduced to less than 2 hours, making rail more
convenient for travelers than the often congested Chi-nese roadways.
In India, the demand for personal transportation isadvancing strongly, much of it in the form of small auto-mobiles and vehicles with two or three wheels.Although the country’s motor vehicle sales slowed as aresult of the global economic downturn in 2008, govern-ment stimulus incentives for consumers helped increasemotor vehicle sales in 2009. In December 2008, the gov-ernment introduced a $60 billion stimulus package tohelp cushion the impact of the global recession, includ-ing a 4-percent cut in the nation’s value-added tax [22].As a result of the stimulus and improved economic pros-pects, Indian automobile sales grew by more than 1.4million units in 2009, an increase in annual sales ofnearly 19 percent [23]. The government began the pro-cess of removing the stimulus measures in February byraising the excise duty on automobiles by 2 percentagepoints, but analysts still expect growth in income to sup-port 10- to 15-percent increases in Indian motor vehiclesales over the next several years [24].
The Reference case projection assumes robust growth intravel for both personal (cars and 2- and 3-wheel vehi-cles) and public (bus and rail) land transport modes inIndia. The personal transportation provided by motorvehicles, along with an expanding road infrastructure,will greatly increase the mobility of the labor force, help-ing to support continued high rates of economic growth.In the Reference case, India’s total transportation energyuse increases by 3.4 percent per year from 2007 to 2035,giving the country the second fastest growing transpor-tation sector after China. Strong growth is anticipatedfor both passenger and freight transportation in India,with energy use for both modes of transport more thandoubling over the period.
There are aspects of India’s development that will act toslow the potential growth in demand for road transpor-tation fuels. India has ambitious plans to increase theconstruction of transportation infrastructure, notably byexpanding the country’s highway network; but in thepast, delays in meeting construction schedules havebeen typical—notably, with the National HighwayDevelopment Plan implementation. That tendency islikely to have some impact on the pace of growth indemand for road transportation fuels. For example,India’s 3,683-mile Golden Quadrilateral highway pro-ject, first funded by the government in 2000, was sched-uled for completion by 2009. Construction is behindschedule, however, and as IEO2010 was being preparedfor publication the project was still unfinished [25]. Alsotempering future growth in fuel demand is the expecta-tion that new vehicles will achieve higher levels of fuelefficiency per mile.
U.S. Energy Information Administration / International Energy Outlook 2010 117

Middle East
Energy consumption for transportation in the MiddleEast grows by an average of 2.8 percent per year from2007 to 2035 in the Reference case, to a total of 12.5 qua-drillion Btu in 2035 (Figure 100). The Middle East has arelatively small population and is an exporter ratherthan a major energy-consuming region. Rapid popula-tion growth in the region, however, is expected toincrease demand for transportation fuels. Transporta-tion energy use has been expanding quickly in theMiddle East, at a rate greatly exceeding the world aver-age. From 2000 to 2007, the Middle East’s total transpor-tation energy use increased by an annual average of 5.2percent, compared with a worldwide increase of 2.4 per-cent per year [26].
The region’s oil and natural gas producing countrieshave had some of the fastest growth in transportationenergy demand in the world. From 2000 to 2007, trans-portation energy use increased by 5.5 percent per year inIran; 5.9 percent per year in Saudi Arabia; 7.5 percent peryear in the United Arab Emirates (UAE); and 13.4 per-cent per year in Qatar. One explanation for thefast-paced growth in demand for personal transporta-tion fuels in the region is the fact that many economiesoffer consumers fuel at prices that are well below marketprices. Saudi Arabia, the UAE, and Iran, among otherMiddle Eastern nations, have maintained transportationsubsidies for their citizens despite the persistent highworld oil prices of the past few years, and the subsidieshave discouraged conservation or efficiency of use [27].For example, in 2008, one gallon of gasoline cost con-sumers as little as 38 cents in Iran and about 61 cents inSaudi Arabia [28].
The Reference case assumes that, in the long term, somesubsidies are reduced to slow consumer demand forfuels, although it might take some time for governmentsto impose such changes effectively. Given its difficult
economic circumstances, Iran has been trying for severalyears to find ways to reduce the subsidies it offers con-sumers on energy and food. At present, subsidizedmotor gasoline is rationed in Iran, with consumersallowed only 16 gallons per month at 38 cents per gallon.Any additional amounts have to be purchased at $1.50per gallon [29]. Removing subsidies is usually veryunpopular with consumers, and that makes it a chal-lenge to exact such changes, particularly in countrieswith difficult sociopolitical circumstances.
Through 2008, high world oil prices increased revenuesfrom oil trade in many of the exporting nations, and sub-stantial plans to invest in transportation infrastructurewere announced as revenues became available for pub-lic spending. With the decline of oil prices and the recenteconomic downturn, some of the plans for infrastructureimprovements in the Middle East were delayed orscaled back, and some of the more expensive projectsthat will need international support have had difficultyfinding banks willing to provide financing [30]. Still,given the importance of improving transportationacross countries in the region, it is likely that the projectswill resume when economic growth recovers andfinancing opportunities improve.
Saudi Arabia has some of the most ambitious plans toimprove its transportation systems. Similar in geo-graphic size to OECD Europe, Saudi Arabia currentlyhas a rail network consisting of only one 283-mile pas-senger line, between Riyadh and the port of Dammam,and one 350-mile freight line between the two cities.Three major railway projects are either planned or underconstruction in Saudi Arabia. One of them is the 600-mile “Saudi Land Bridge” rail that will link the capitalRiyadh to the Red Sea port of Jeddah and a 75-mile linefrom Dammam north along the Gulf coast to Jubail. Thesecond project is the 315-mile Haramain high-speed pas-senger railway between Mecca and Medina. The thirdproject is the 1,400-mile North-South Railway freightrail, which will connect mines in northern Saudi Arabiawith industrial facilities at Ras al-Zour on the PersianGulf coast and Riyadh [31]. Construction on theNorth-South Railway is scheduled to be completed bythe end of 2010 [32]. Construction on the Haramainhigh-speed rail began in July 2009 and is scheduled forcompletion by the end of 2012 [33].
Other Middle East countries are also planning extensiverail investment. The UAE completed one line of itsDubai metro system in September 2009, but plans tocomplete a second line were delayed because of thefinancial crisis that the emirate experienced in late 2009[34]. The emirate of Abu Dhabi plans to invest $23 billionthrough 2017 to construct a 211-mile light rapid transitrail line that will connect the central business district tothe airport and another 80-mile subway system that willserve a wider area. Another $45 billion will be used to
118 U.S. Energy Information Administration / International Energy Outlook 2010
2007 2015 2020 2025 2030 20350
5
10
15
Freight
Passenger
Figure 100. Middle East transportation energy use,2007-2035 (quadrillion Btu)

improve Abu Dhabi’s road infrastructure, upgrade theemirate’s airport, and construct the new Khalifa Port atTaweelah. Bahrain has invested $1.8 billion in theQatar-Bahrain Friendship causeway (elevated rail) that,upon completion, will link the two countries [35]. InApril 2009, Jordan announced that it would begin imple-mentation of a proposed 995-mile railway network tolink major cities within the country, with the ultimategoal of linking the rail system with the GCC counties[36]. Qatar Railway has a $25 billion developmentinvestment plan that includes funds to upgrade thecountry’s transportation infrastructure by 2014, in partto support its bid for the 2020 Olympic Games and the2022 FIFA World Cup.
Air travel infrastructure is also being expanded in sev-eral Middle Eastern countries. As countries in the regionbecome increasingly prosperous, the demand for busi-ness and leisure air travel is expected to rise. In theUnited Arab Emirates, construction of the Dubai WorldCentral International Airport is currently under way. Itis set to become the world’s largest airport, able to han-dle between 120 and 150 million passengers and 12 mil-lion metric tons of cargo annually. Construction of thefirst of six runways was completed in 2007, and theentire project is expected to be operational by 2015 [37].In Qatar, the New Doha International Airport has beenunder construction since 2004, with completion of thefirst phase scheduled for July 2011, when it will be ableto accommodate 24 million passengers annually [38].
Central and South America
Transportation energy use in Central and South Amer-ica increases by 1.5 percent per year in the Reference casefrom 2007 to 2035 (Figure 101). Brazil, the region’s larg-est economy, is experiencing particularly strong growthin its transportation sector following its success in
achieving economic stability, which has bolsteredconsumer confidence and improved access to credit,allowing vehicle sales to increase strongly [39]. Thecountry suffered only a modest impact from the globaleconomic downturn, and it appears that strong growthhas already returned. In fact, total vehicle sales in Brazil(including light-duty vehicles, heavy-duty trucks, andbuses) rose by 13 percent in 2009 [40]. Indications arethat robust domestic sales will continue.
In 1975, the Brazilian government launched its NationalAlcohol Program to increase the use of ethanol in thetransportation fuel mix [41]. Subsequently, ethanol con-sumption in Brazil rose from 0.1 billion gallons in 1975 to4.4 billion gallons in 2007 [42]. Its reliance on biofuels(and ethanol in particular) to fuel its transportation sec-tor has focused attention on Brazil, as other nations ofthe world have begun to increase alternative fuel use inthe face of sustained high world oil prices over recentyears. Ethanol production is expected to continue toexpand in Brazil, along with the country’s biofuel-consuming automobile fleet, which may account for asmuch as one-half of the total fleet by 2013 [43].
Flexible-fuel vehicles (FFVs)28 have become increasinglypopular in Brazil. According to Brazil’s vehicle manu-facturers’ association, Associação Nacional dos Fabri-cantes de Veículos Automotores (Anfavea), the numberof FFVs sold each year in Brazil has increased stronglysince their introduction in March 2003, from 49,000 in2003 to 3 million in 2009 [44]. FFVs accounted for 92 per-cent of new vehicle sales in Brazil in 2009 [45].
Non-OECD Europe and Eurasia
Transportation sector energy use in non-OECD Europeand Eurasia increases by 0.8 percent per year on averagefrom 2007 to 2035 (Figure 102). Flat or declining
U.S. Energy Information Administration / International Energy Outlook 2010 119
3
4
7
5
5
10
Brazil
OtherCentral and
South America
Total
0 5 10 15
2007
2035
5
Figure 101. Central and South Americatransportation energy use by country,2007 and 2035 (quadrillion Btu)
2007 2015 2020 2025 2030 20350
1
2
3
4
5
6Russia Other
Figure 102. Non-OECD Europe and Eurasiatransportation energy use by country, 2007-2035(quadrillion Btu)
28 Flexible-fuel vehicles can operate using 100 percent ethanol, 100 percent motor gasoline, or any combination of the two fuels.

population growth and increasing efficiency of trans-port infrastructure are expected to dampen growth inthe region’s transportation fuel use over the period. InRussia—the region’s largest economy—energy con-sumption for passenger transportation declines at anaverage rate of 0.8 percent per year from 2007 to 2035,while the Russian population declines by an average of0.4 percent per year (for a total population reduction of17 million).
As revenues from energy exports increased substan-tially from 2003 to 2008, Russia’s economic growthspurred strong growth in motor vehicle sales, with salesof light-duty vehicles increasing by 29 percent from 2006to 2007 and total vehicle sales reaching $3.2 billion in2008 [46]. Not surprisingly, because of the collapse ofcommodity prices in late 2008 and the global economicdownturn coupled with rising unemployment andplunging consumer confidence, light-duty vehicle salesfell by 49 percent in 2009. Sales plummeted despite anumber of government stimulus programs aimed atsupporting the domestic automobile industry, includingsubsidized interest rates on domestically producedvehicles and direct subsidies and guarantees to helprestructure Russian automobile manufacturers [47].Although the Russian economy is expected to improvesomewhat in 2010, the government announced a $19.6billion car scrappage program in March 2010 that willoffer rebates toward the purchase of a new Russian-builtmotor vehicle when accompanied by a trade-in vehicleat least 10 years old [48].
In addition to Russia, some of the other large economiesof non-OECD Europe and Eurasia—notably, Kazakh-stan and Ukraine—also experienced severe contractionsin light-duty vehicle sales as a result of the global reces-sion. In 2009, vehicle sales declined by 23 percent inKazakhstan and by 77 percent in Ukraine. With little orno population growth expected from 2007 to 2035 in theeconomies of non-OECD Europe and Eurasia (excludingRussia), energy consumption for passenger transporta-tion increases by an average of just 0.7 percent per yearfrom 2007 to 2035 in the IEO2010 Reference case. Theregion’s economy grows on average by 2.8 percentper year, and its energy use for freight transportationgrows by an average of 1.7 percent per year, reflectingimprovements in standards of living among countriesthat have continued to prosper since the fall of the SovietUnion. Rising standards of living fuel the demand formerchandise and appliances and the need to ship thosegoods to market.
References
120 U.S. Energy Information Administration / International Energy Outlook 2010
1. J.C. Taylor, “Fuel Taxes,” Mackinac Center for Pub-lic Policy web release (April 16, 2007), web sitewww.mackinac.org/8428.
2. U.S. Energy Information Administration, AnnualEnergy Outlook 2010, DOE/EIA-0383(2010) (Wash-ington, DC, April 2010), p. 63, web site www.eia.gov/oiaf/aeo.
3. Transport Canada, “Agreements with the Automo-tive Industry” (February 3, 2010), web site www.tc.gc.ca/eng/programs/environment-fcp-agreements-518.htm.
4. J.F. Smith, “Harvard Honors Mexico City Bus Sys-tem,” The Boston Globe (November 13, 2009), website www.boston.com/news/world/latinamerica/articles/2009/11/13/harvard_honors_mexico_city_bus_system.
5. A. Maciel, “Mexico City’s Metrobus System Perfectfor Cash-Strapped Cities,” City Mayors: WorldMetros (December 17, 2009), web site www.citymayors.com/transport/mexico-metrobus.html.
6. M. Delgado Peralta, Secretary of Environment,Mexico City Government, “Megacities and ClimateChange,” Mexico City Climate Action Program2008-2012, Lead Mexico 2008, web site www.lead.colmex.mx.
7. European Automobile Manufacturers’ Association,“Fleet Renewal Schemes Can Soften the Impact ofthe Recession: Overview of Vehicle ScrappageSchemes in the EU 2009” (updated February 12,2010), web site www.acea.be.
8. European Automobile Manufacturers’ Association,“Fleet Renewal Schemes Can Soften the Impact ofthe Recession” (updated March 4, 2010), web sitewww.acea.be.
9. L. Scherzer, “Is the U.S. Becoming More LikeEurope?” SmartMoney (July 27, 2009), web sitewww.smartmoney.com/personal-finance/taxes/is-the-u-s-becoming-more-like-europe.
10. J. Soble, “US Protests at Japan Clunkers Scheme,”Financial Times (December 14, 2009), web site www.ft.com.
11. Y. Kubota, “Japan Dismisses U.S. Concerns on CarScrappage Scheme,” Reuters news Service (January13, 2010), web site www.reuters.com.
12. L. Greengarten, “Critics Say Australia Forgot AboutEfficiency,” The New York Times: Green Inc.: Energy,the Environment and the Bottom Line (September 16,2009), web site www.greeninc.blocs.nytimes.com/2009/09/16/critics-say-australia-forgot-about-efficiency; and “Tax Rebate To Drive New TruckSales,” Australasian Transport News (March 19,2009), web site www.fullyloaded.com.au/industry-news/articleid/55194.aspx.

U.S. Energy Information Administration / International Energy Outlook 2010 121
13. National Bureau of Statistics of China, China Statis-tical Yearbook 2008, “Transport, Postal and Telecom-munication Services,” web site www.stats.gov.cn/tjsj/ndsj/2008/indexeh.htm.
14. The World Bank, World Development Indicators:Urban Development (2010), web site http://data.worldbank.org/indicator/IS.VEH.NVEH.P3?display=default.
15. United Nations, Department of Economic andSocial Affairs, Poulation Division, “Urban andRural Areas 2007,” web site www.un.org/esa/population/publications/wup2007/2007_urban_rural_chart.xls.
16. “China Overtakes US as World’s Largest Car Mar-ket,” France 24 International News (January 11, 2010),web site www.france24.com/en/20100111-china-overtakes-united-states-worlds-largest-car-market-automobile-industry-sales-detroit; and G.Guillaume, “China Car Sales Top U.S.,” ThomsonReuters 2010 (January 11, 2010), web site www.reuters.com/article/idUSTRE60A1BQ20100111.
17. K. Chu and C. MacLeod, “Car Sales Rocket AsChina Tries To Boost Consumer Spending,” USAToday (March 4, 2010), web site www.usatoday.com/money/autos/2010-03-04-chinaconsumption04_CV_N.htm?loc=interstitialskip; and “ChineseCar Market Slows in Feb Due to Long Holidays,”China Car Times (March 8, 2010), web site www.chinacartimes.com/2010/03/08/chinese-car-market-slows-in-feb-due-to-long-holidays.
18. K. Chu and C. MacLeod, “Car Sales Rocket AsChina Tries To Boost Consumer Spending,” USAToday (March 4, 2010), web site www.usatoday.com/money/autos/2010-03-04-chinaconsumption04_CV_N.htm?loc=interstitialskip.
19. B. Powell, “China’s Amazing New Bullet Train,”CNNMoney.com (August 6, 2009), web site http://money.cnn.com/2009/08/03/news/international/china_high_speed_bullet_train.fortune/index.htm.
20. K. Bradsher, “China’s Route Forward,” The NewYork Times (January 23, 2009), web site www.nytimes.com; and “Beijing Shanghai High-SpeedLine” (undated), web site www.railway-technology.com/projects/beijing.
21. “China Express Train Forces Airlines to StopFlights,” Reuters News Release (March 26,2010), web site hwww.reuters.com/article/industrialsSector/idUSTOE62P04E20100326.
22. “Car Prices To Go Down, Companies Cheer TaxCut,” Inside Kerala (December 8, 2008), web sitehttp://insidekerala.com/n/index.php?mod=article&cat=Buzz&article=28632.
23. V.V. Nair, “India 2009 Car Sales Rise Most in ThreeYears on Economy, Rates,” Bloomberg NewsAgency (January 8, 2010), web site www.bloomberg.com.
24. N. Gulati, “Indian Car Sales Surge on Easy Loans,”The Wall Street Journal (March 8, 2010), web sitehttp://online.wsj.com; and “India, China To LeadGlobal Auto Sales Recovery in 2010: Study,” TheTimes of India (February 16, 2010), web site http://timesofindia.indiatimes.com.
25. “Golden Quadrilateral Project Faces FurtherDelay,” rediff India Abroad (March 5, 2009),web site www.rediff.com///money/2009/mar/05golden-quadrilateral-project-faces-further-delay;and National Highways Authority of India,“Golden Quadrilateral: Overall Progress CorridorWise Including Completed Length as of February28, 2010” (February 28, 2010), web site www.nhai.org/goldenquadrilateral.asp.
26. International Energy Agency Data Services, WorldEnergy Balances (2009), web site http://data.iea.org(subscription site).
27. M. Markey, “Topic Report: Oil ConsumptionGrowth in the Middle East” (December 17, 2007),Apache Corporation, web site www.apachecorp.com/explore/explore_features/browse_archives/View_Article/?docdoc=662.
28. GTZ Transport Policy Advisory Services on Behalfof the Federal Ministry for Economic Cooperationand Development, International Fuel Prices 2009: 6thEdition (Eschborn, Germany, December 2009), p. 34.
29. “Iran Tightens Petrol Rations,” BBC News (March17, 2010), web site http://news.bbc.co.uk/2/hi/business/8573087.stm.
30. W. Hadfield, “Transport 2010: Railway BuildingEnjoys a Revival in the Middle East,” MEED: MiddleEast Business Intelligence (December 21, 2009), website www.meed.com (subscription site).
31. W. Hadfield, “Transport 2010: Railway BuildingEnjoys a Revival in the Middle East,” MEED: MiddleEast Business Intelligence (December 21, 2009), website www.meed.com (subscription site).
32. “North – South Railway,” Construction WeekOnline (October 1, 2009), web site www.constructionweekonline.com/projects-169-north_south_railway.
33. “Haramain High Speed Rail Project, Saudi Arabia,”Railway-Technology.com: Industry Projects (undated),web site www.railway-technology.com/projects/haramain-high-speed; and “MEED Middle EastRail Projects, 2007 Conferences in Dubai, Ameinfo”(November 7, 2007), web site www.ameinfo.com/137462.html.

122 U.S. Energy Information Administration / International Energy Outlook 2010
34. B. Redfern, “State Support Drives Projects Marketin Abu Dhabi and Saudi Arabia,” MEED: MiddleEast Business Intelligence (March 16, 2010), web sitewww.meed.com (subscription site).
35. J. Boley, “Middle East Transport Investment TopsUS $147 Billion,” Construction Week Online(December 1, 2009), web site www.constructionweekonline.com.
36. “United Arab Emirates: Runaway Train? MiddleEast Rail Infrastructure To See Spending Boom”(November 5, 2009), web site www.mondaq.com.
37. “Dubai World Central Awards Air Traffic Manage-ment System” (July 30, 2007), web site www.asiatraveltips.com.
38. New Doha International Airport Steering Commit-tee, “Main” (no date), web site www.ndiaproject.com/main.html.
39. T. Rideg, “Brazil Auto Boom: Can Supply KeepPace?” Latin Business Chronicle (August 13, 2007),web site www.latinbusinesschronicle.com/app/article.aspx?id=1537.
40. “Brazil’s Vehicle Sales Reach Record High in 2000,”China View News (January 6, 2010), web site http://news.xinhuanet.com/english/2010-01/06/content_12763941.htm.
41. P. Nastari, “The Brazilian Fuel Ethanol Experience,”in Ethanol in the 21st Century: New Sources, New Uses(Sacramento, CA, April 1998).
42. I. Riveras, “Brazil Local Demand To Drive EthanolProduction,” Reuters News Release (January 14,2008), web site www.reuters.com.
43. AFX News Limited, “Brazil Registers Over 2 mlnBiofuel Cars in 2007, 86.5 pct of Cars Sold” (January8, 2008), web site www.forbes.com.
44. W. Lemos, “Flex-Fuels Pump Up Ethanol,” ICISNews (November 12, 2007); and “Brazil Flexi-ble-Fuel Vehicles Surpass 5m Units,” ICIS News(April 8, 2008), web site www.icis.com (subscrip-tion site).
45. “Flex-Fuel Bikes and Cars Show Robust BrazilianSales,” Brazilian Bioethanol Science and TechnologyLaboratory (February 22, 2010), web site www.bioetanol.org.br/english/noticias/detalhe.php?ID=MTQ4.
46. P. Negyesi, “Moscow Auto Show Raises Its CurtainAgainst Tense Backdrop,” Auto Observer (August22, 2008), web site www.autoobserver.com; and T.Vorobyova, “Russia Jan Car Sales at 100,000—Avtovaz Head,” Thomson Reuters News Release(February 4, 2009) web site www.reuters.com.
47. Ernst & Young’s Global Automotive Center, Auto-motive Market in Russia and the CIS: Industry Over-view (February 2010), pp. 6-7.
48. E. Niedermeyer, “Russia To Spend $20b on AutoIndustry Stimulus,” The Truth About Cars Web Site(March 8, 2010), web site www.thetruthaboutcars.com.

Chapter 8
Energy-Related Carbon Dioxide EmissionsIn 2007, non-OECD energy-related emissions of carbon dioxide exceeded OECD emissions
by 17 percent. In the IEO2010 Reference case, energy-related carbon dioxide emissions
from non-OECD countries in 2035 are about double those from OECD countries.
OverviewBecause anthropogenic emissions of carbon dioxideresult primarily from the combustion of fossil fuels,world energy use continues to be at the center of the cli-mate change debate. In the IEO2010 Reference case,world energy-related carbon dioxide emissions29 growfrom 29.7 billion metric tons in 2007 to 33.8 billion metrictons in 2020 and 42.4 billion metric tons in 2035 (Table18).30
From 2006 to 2007, total energy-related carbon dioxideemissions from non-OECD countries grew by 4.9 per-cent, while emissions from OECD countries increasedby 1.0 percent. The increase in OECD countries’ carbondioxide emissions is estimated to have been reversed in2008 and 2009, as fossil fuel demand contracted duringthe global recession that began in 2008 and continuedthrough 2009. In 2015, annual emissions from non-OECD countries exceed those from OECD countries by43 percent in the Reference case (Figure 103). Over the28-year projection period from 2007 to 2035, total carbondioxide emissions from non-OECD countries increaseby an average of 2.0 percent per year—20 times the rateof increase for OECD countries (0.1 percent per year). By
2035, energy-related carbon dioxide emissions innon-OECD countries (28.2 billion metric tons) are almosttwice the level of those in OECD countries (14.2 billionmetric tons).
The IEO2010 Reference case projections are, to the extentpossible, based on existing laws and policies. Projections
U.S. Energy Information Administration / International Energy Outlook 2010 123
14 13 13 13 14 1416
1921
23
25
28
2007 2015 2020 2025 2030 20350
10
20
30OECD Non-OECD
Figure 103. World energy-related carbon dioxideemissions, 2007-2035 (billion metric tons)
Table 18. World energy-related carbon dioxide emissions by region, 1990-2035 (billion metric tons)
Region
History ProjectionsAverage annualpercent change
1990 2007 2015 2020 2025 2030 2035 1990-2007 2007-2035
OECD . . . . . . . . . . . . . . . . . . . 11.5 13.7 13.0 13.1 13.5 13.8 14.2 1.0 0.1North America . . . . . . . . . . . . 5.8 7.0 6.7 6.9 7.2 7.4 7.7 1.1 0.3Europe . . . . . . . . . . . . . . . . . 4.2 4.4 4.1 4.0 4.0 4.1 4.1 0.3 -0.2Asia . . . . . . . . . . . . . . . . . . . . 1.6 2.3 2.1 2.2 2.3 2.3 2.4 2.1 0.2
Non-OECD . . . . . . . . . . . . . . . 10.0 16.0 18.5 20.7 23.0 25.5 28.2 2.8 2.0Europe and Eurasia . . . . . . . 4.2 2.9 2.9 2.9 3.0 3.0 3.2 -2.2 0.3Asia . . . . . . . . . . . . . . . . . . . . 3.7 9.4 11.2 13.0 14.9 16.9 19.0 5.7 2.5Middle East . . . . . . . . . . . . . . 0.7 1.5 1.9 2.1 2.3 2.5 2.7 4.6 2.1Africa. . . . . . . . . . . . . . . . . . . 0.7 1.0 1.2 1.2 1.3 1.5 1.6 2.6 1.7Central and South America. . 0.7 1.2 1.3 1.4 1.5 1.6 1.7 3.1 1.4
Total World . . . . . . . . . . . . . . 21.5 29.7 31.5 33.8 36.5 39.3 42.4 1.9 1.3
29 In IEO2010, energy-related carbon dioxide emissions are defined as emissions related to the combustion of fossil fuels (liquid fuels,natural gas, and coal) and those associated with petroleum feedstocks. Emissions from the flaring of natural gas are not included.
30 In keeping with current international practice, IEO2010 presents data on greenhouse gas emissions in billion metric tons carbon diox-ide equivalent. The data can be converted to carbon equivalent units by multiplying by 12/44.

for carbon dioxide emissions may change significantly iflaws and policies aimed at reducing greenhouse gasemissions are changed or new ones are introduced. Inaddition, beyond energy-related carbon dioxide thereare other gases and sources that contribute to green-house gas emissions.
The relative contributions of different fossil fuels to totalenergy-related carbon dioxide emissions have changedover time. In 1990, carbon dioxide emissions associatedwith liquid fuels made up an estimated 42 percent of theworld total; in 2007, their share was 38 percent; and in2035 it is 34 percent in the Reference case (Figure 104).Carbon dioxide emissions from natural gas, whichaccounted for less than 19 percent of the total in 1990,increased to 20 percent of the 2007 total. From 2007 to2035 their share of the total is relatively stable, in a rangeof 20 to 22 percent.
Coal’s share of world carbon dioxide emissions, whichgrew from 39 percent in 1990 to 42 percent in 2007,increases to almost 46 percent by 2035. Coal is the mostcarbon-intensive of the fossil fuels, and it is the fastest-growing carbon-emitting energy source in the Referencecase, reflecting its important role in the energy mix ofnon-OECD countries—especially, China and India. In1990, China and India together accounted for 13 percentof world carbon dioxide emissions; by 2007 their com-bined share had risen to 26 percent, largely because oftheir strong economic growth and increasing use of coalto provide energy for that growth. In 2035, carbon diox-ide emissions from China and India combined accountfor 37 percent of the world total, with China aloneresponsible for 31 percent. The projected emissions fromcoal would be much lower if carbon capture and storagebecame economical (see box on page 126).
In December 2009, the fifteenth session of the Confer-ence of Parties to the United Nations Framework Con-vention on Climate Change (COP-15) was held inCopenhagen, Denmark. Although COP-15 did not pro-duce a legally binding agreement to cut emissions, keydeveloped and developing countries negotiated aCopenhagen Accord that was noted by the COP in itsfinal session. Under the accord, a process was estab-lished for countries to enter specific mitigation pledgesby January 31, 2010. Table 19 includes a list of thepledges that were submitted.
The emissions mitigation pledges submitted by coun-tries pursuant to the Copenhagen Accord fall into twogeneral categories: absolute reductions and intensityreductions. Absolute reductions reduce greenhouse gasemissions independent of economic or material output.Japan, Russia, the European Union, the United States,and Brazil have announced absolute reduction goals,which are expressed as percentage reductions belowhistorical base-year amounts. (For example, Japan hasannounced its goal to reduce carbon dioxide emissionsto 25 percent below 1990 levels by 2020.) China and Indiahave announced intensity reduction goals, which typi-cally are expressed as reductions in emissions per unit ofoutput as measured by GDP. (For example, China hasannounced its intention to reduce its carbon emissionsintensity by 2020 to a level that is 40 to 45 percent belowits emissions intensity in 2005.)
In addition to voluntary reduction goals, there was apledge from developed countries at COP-15 for $30 bil-lion in added resources in the 2010-2012 time frame tohelp developing countries reduce emissions, preserveand enhance forests, and adapt to climate change [1].There was a further goal of mobilizing $100 billion peryear in public and private finance by 2020 to address theneeds of developing countries [2].
Emissions by regionIn the IEO2010 Reference case, world energy-related car-bon dioxide emissions increase by an average of 1.3 per-cent per year from 2007 to 2035 (see Table 18). For OECDcountries, annual increases in carbon dioxide emissionsaverage 0.1 percent over the 28-year period. The annualincreases are not uniform, however. OECD carbon diox-ide emissions in the Reference case decline from 13.7 bil-lion metric tons in 2007 to 12.8 billion metric tons in 2010,then rise to 13.5 billion metric tons in 2025 and 14.2 bil-lion metric tons in 2035.31
The average annual rate of increase in carbon dioxideemissions from OECD countries from 2007 to 2035 is 0.1percent, which is one-tenth of the actual rate of increasefrom 1990 to 2007 (1.0 percent per year). Projections of
124 U.S. Energy Information Administration / International Energy Outlook 2010
1990 2000 2007 2015 2025 20350
5
10
15
20
History Projections
Liquids
Natural gas
Coal
Figure 104. World energy-related carbon dioxideemissions by fuel type, 1990-2035(billion metric tons)
31 For factors underlying the trends, see discussion below on carbon and energy intensity and the Kaya Identity.

U.S. emissions have been declining in recent IEOs. In theIEO2009 Reference case, the projection for U.S. emis-sions growth was 9 percent from 2006 to 2030. In theIEO2010 Reference case, U.S. energy-related carbondioxide emissions grow by 5 percent from 2006 to 2030.As a result, the projection for U.S. emissions in 2030 is 3.7percent lower in IEO2010 than it was in IEO2009 (Figure105).
The highest rate of increase in annual emissions of car-bon dioxide among OECD countries in the IEO2010 Ref-erence case is for Mexico, at 1.8 percent per year (Figure106). Mexico is among the least industrialized of theOECD economies. South Korea (1.4 percent per year) isthe only OECD country other than Mexico for whichaverage emissions growth exceeds 1 percent per year.The GDP growth rate for Mexico in IEO2010 (3.5 percentper year) is the highest among OECD countries, and it ismore than a percentage point higher than South Korea’sannual GDP growth rate of 2.4 percent.
Japan’s energy-related carbon dioxide emissions declinein the Reference case by an average of 0.6 percent peryear from 2007 to 2035, and OECD Europe’s emissionsdecline by 0.2 percent per year. They are the only regionswith declining emissions over the period, and becausetheir combined 2007 emissions are 41 percent of the
OECD total, they have a mitigating effect on emissionsgrowth for the OECD region as a whole.
For non-OECD countries, total energy-related carbondioxide emissions increase by an average of 2.0 percentper year from 2007 to 2035 (Figure 107). The highest rateamong non-OECD countries is for China, at 2.7 percentannually from 2007 to 2035, reflecting the country’sstrong economic growth and heavy reliance on fossilfuels, especially coal. The lowest rate among non-OECDcountries is for Russia, at 0.3 percent per year. Russia isexpected to expand its reliance on nuclear power to fuelelectricity generation, and a decline in its population islikely to slow its overall rate of increase in energydemand. Additionally, retirement of old, inefficientSoviet-era equipment is expected to continue.
Emissions by fuelWhen 2007 carbon dioxide emissions are analyzed byfossil fuel, coal is the largest source (12.5 billion metrictons), followed by liquid fuels (11.3 billion metric tons)and natural gas (5.9 billion metric tons). World carbondioxide emissions from the consumption of liquid fuelsincrease by 27.5 percent, or an average of 0.9 percent peryear, from 2007 to 2035, with all the increase comingfrom non-OECD countries. Total carbon dioxide emis-sions from liquid fuel use in OECD countries decline
U.S. Energy Information Administration / International Energy Outlook 2010 125
Table 19. Emissions mitigation goals announced by selected countries (million metric tons carbon dioxide)
Country Reduction goal
Carbondioxide
emissionsgoal for
goal yeara
IEO2010Reference
caseprojection
for goal year2007
emissions
Emissionsreductionneeded toachieve
goal
Average annualpercent change
from 2007emissions needed
to achieve goal
Countries with goals for total emissions reductionsUnited States . . . . To 17 percent
below 2005 level by 20204,959 5,851 5,986 893 -1.4%
European Union. . To 20 percentbelow 1990 level by 2020b
3,323 4,042 4,386 719 -2.1%
To 30 percentbelow 1990 level by 2020c
2,907 4,042 4,386 1,135 -3.1%
Japan . . . . . . . . . . To 25 percentbelow 1990 level by 2020
788 1,114 1,262 325 -3.6%
Brazil . . . . . . . . . . By 36 to 39 percent relative toprojected level in 2020
347 534 394 187 -1.0%
Russia . . . . . . . . . To between 15 and 25 percentbelow 1990 level by 2020
1,780 1,648 1,664 — —
Countries with goals for carbon dioxide intensity reductionsChina . . . . . . . . . . To between 40 and 45 percent
below 2005 level by 20209,810 9,057 6,284 — —
India . . . . . . . . . . . To between 20 and 25 percentbelow 2005 level by 2020
2,314 1,751 1,399 — —
aIt is assumed that country goals are applied proportionally to energy-related carbon dioxide emissions and other greenhousegases.
bUnilateral goal.cRequires other countries to achieve similar reductions.Source: United Nations Framework Convention on Climate Change, web site http://unfccc.int/meetings/items/5276.php.

126 U.S. Energy Information Administration / International Energy Outlook 2010
Will carbon capture and storage reduce the world’s carbon dioxide emissions?
The pursuit of greenhouse gas reductions has thepotential to reduce global coal use significantly.Because coal is the most carbon-intensive of all fossilfuels, limitations on carbon dioxide emissions willraise the cost of coal relative to the costs of other fuels.Under such circumstances, the degree to which energyuse shifts away from coal to other fuels will dependlargely on the costs of reducing carbon dioxide emis-sions from coal-fired plants relative to the costs ofusing other, low-carbon or carbon-free energy sources.The continued widespread use of coal could rely on thecost and availability of carbon capture and storage(CCS) technologies that capture carbon dioxide andstore it in geologic formations.
Widespread deployment of CCS would facilitate theuse of coal in the presence of greenhouse gas policiesaimed at reducing carbon dioxide emissions. WithoutCCS, reducing carbon dioxide emissions probablywould require a significant curtailment of global coaluse. The primary use of CCS is thought to be incoal-fired electricity generation, where most of theworld’s coal is consumed. In addition, there could beCCS applications for specific types of industrial facili-ties and natural-gas-fired power plants.
The CCS technology has three components:•Capture, defined as the physical removal of carbon
dioxide that would otherwise be emitted into theatmosphere. In the case of coal-fired power plants,capture could be accomplished by removing carbondioxide from the waste stream after combustion(post-combustion capture) or by gasifying the coaland removing carbon dioxide before combustion(pre-combustion capture). In another process (oxy-combustion), combustion occurs in a high-oxygenenvironment, producing a higher concentration ofcarbon dioxide in the waste stream, which makescarbon capture easier.
•Transportation, which will be needed to move car-bon dioxide from power plant sites to suitable stor-age sites. Given the quantities of carbon dioxidethat are likely to be captured from coal-fired powerplants, pipelines appear to be the most likely modefor transporting the captured gas to geologicsequestration sites.
•Long-term storage, which requires permanentsequestration of carbon dioxide to prevent cap-tured emissions from entering the atmosphere. Theability to handle large amounts of carbon dioxideinjections varies, depending on the geologic charac-teristics of a particular site, such as the depth, thick-ness, and permeability of a given formation.Currently, deep saline aquifers and depleted oiland gas fields are seen as the most likely candidatesfor long-term storage. Other types of formationsalso are being examined.
Different technical pieces of the CCS process havealready been shown to operate successfully. For exam-ple, carbon dioxide emissions have been captured fromsome industrial sources for decades by the food andbeverage industry, oil producers, and other industries.Approximately 3,000 miles of carbon dioxide pipelinesalready are in service in North America.b There arefour sequestration sites operating on a commercialscale in the world today,c although they capture only afraction of the amount of carbon dioxide that will beneeded for a significant reduction in emissions fromcoal-fired power plants. These four sites are also usedfor enhanced oil recovery, a process where carbondioxide is used to improve oil recovery from wells.
Despite the fact that examples of individual segmentsof the CCS process have been successful, no project onthe scale needed to capture and sequester significantamounts of carbon dioxide from a typical commercialcoal-fired power plant has been demonstrated to date.Therefore, there is significant uncertainty about theultimate cost and feasibility of CCS. Recent cost esti-mates for integrated gasification combined-cycle(IGCC) coal-fired power plants with capture—apre-combustion technology that is being considered inseveral countries—have been in the range of $120 to$180 per ton of carbon dioxide for first-of-a-kind facili-ties, although costs are likely to decline significantlyover time.d Post-combustion capture technology costs,especially those applied to existing units, are evenmore uncertain, and information will not be availableuntil demonstration projects are further along in theprocess.e Costs for sequestration and storage have been
(continued on page 127)
aInternational Energy Agency, Near-Term Opportunities for Carbon Dioxide Capture and Storage (Paris, France, 2007), p. 3.bCongressional Research Service, Carbon Dioxide (CO2) Pipelines for Carbon Sequestration: Emerging Policy Issues (Washington, DC, 2007),
p. 4, web site www.ncseonline.org/nle/crsreports/07may/rl33971.pdf.cThe four sites are Sleipner Gas Field in the North Sea (Norway), Snøhvit Gas Field in the Barents Sea (Norway), Weyburn Enhanced
Oil Recovery Project (North Dakota, USA), and In Salah Gas Field (Algeria).dM. Al-Juaied and A. Whitmore, “Realistic Costs of Carbon Capture & Storage” (Cambridge, MA: Harvard University Energy Technol-
ogy Innovation Policy), Discussion Paper 2009-08 (July 2009), web site http://belfercenter.ksg.harvard.edu/files/2009_AlJuaied_Whitmore_Realistic_Costs_of_Carbon_Capture_web.pdf. This study indicates that costs could potentially be reduced to a range of the$35 to $70 per ton as the technology matures.
ePost-combustion capture demonstration projects at existing plants are being conducted currently at Mountaineer Power Plant in NewHaven, West Virginia, and scheduled at Antelope Valley Plant in Beulah, North Dakota.
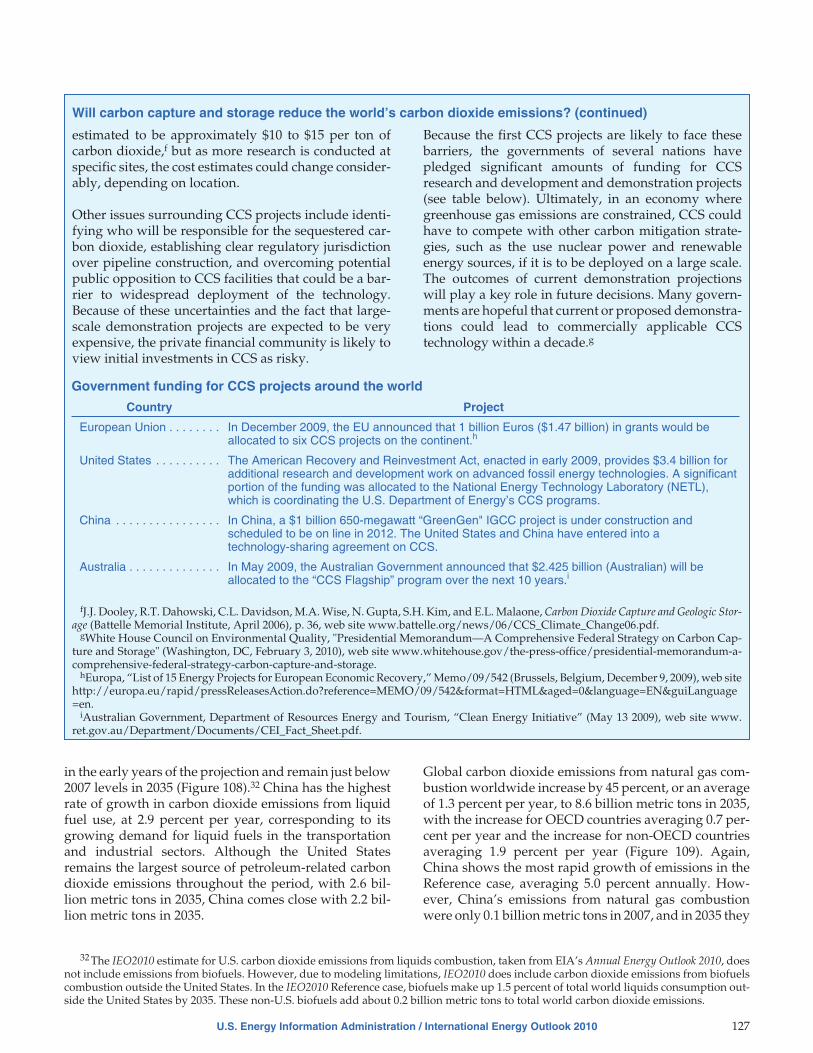
in the early years of the projection and remain just below2007 levels in 2035 (Figure 108).32 China has the highestrate of growth in carbon dioxide emissions from liquidfuel use, at 2.9 percent per year, corresponding to itsgrowing demand for liquid fuels in the transportationand industrial sectors. Although the United Statesremains the largest source of petroleum-related carbondioxide emissions throughout the period, with 2.6 bil-lion metric tons in 2035, China comes close with 2.2 bil-lion metric tons in 2035.
Global carbon dioxide emissions from natural gas com-bustion worldwide increase by 45 percent, or an averageof 1.3 percent per year, to 8.6 billion metric tons in 2035,with the increase for OECD countries averaging 0.7 per-cent per year and the increase for non-OECD countriesaveraging 1.9 percent per year (Figure 109). Again,China shows the most rapid growth of emissions in theReference case, averaging 5.0 percent annually. How-ever, China’s emissions from natural gas combustionwere only 0.1 billion metric tons in 2007, and in 2035 they
U.S. Energy Information Administration / International Energy Outlook 2010 127
Will carbon capture and storage reduce the world’s carbon dioxide emissions? (continued)
estimated to be approximately $10 to $15 per ton ofcarbon dioxide,f but as more research is conducted atspecific sites, the cost estimates could change consider-ably, depending on location.
Other issues surrounding CCS projects include identi-fying who will be responsible for the sequestered car-bon dioxide, establishing clear regulatory jurisdictionover pipeline construction, and overcoming potentialpublic opposition to CCS facilities that could be a bar-rier to widespread deployment of the technology.Because of these uncertainties and the fact that large-scale demonstration projects are expected to be veryexpensive, the private financial community is likely toview initial investments in CCS as risky.
Because the first CCS projects are likely to face thesebarriers, the governments of several nations havepledged significant amounts of funding for CCSresearch and development and demonstration projects(see table below). Ultimately, in an economy wheregreenhouse gas emissions are constrained, CCS couldhave to compete with other carbon mitigation strate-gies, such as the use nuclear power and renewableenergy sources, if it is to be deployed on a large scale.The outcomes of current demonstration projectionswill play a key role in future decisions. Many govern-ments are hopeful that current or proposed demonstra-tions could lead to commercially applicable CCStechnology within a decade.g
fJ.J. Dooley, R.T. Dahowski, C.L. Davidson, M.A. Wise, N. Gupta, S.H. Kim, and E.L. Malaone, Carbon Dioxide Capture and Geologic Stor-age (Battelle Memorial Institute, April 2006), p. 36, web site www.battelle.org/news/06/CCS_Climate_Change06.pdf.
gWhite House Council on Environmental Quality, "Presidential Memorandum—A Comprehensive Federal Strategy on Carbon Cap-ture and Storage" (Washington, DC, February 3, 2010), web site www.whitehouse.gov/the-press-office/presidential-memorandum-a-comprehensive-federal-strategy-carbon-capture-and-storage.
hEuropa, “List of 15 Energy Projects for European Economic Recovery,” Memo/09/542 (Brussels, Belgium, December 9, 2009), web sitehttp://europa.eu/rapid/pressReleasesAction.do?reference=MEMO/09/542&format=HTML&aged=0&language=EN&guiLanguage=en.
iAustralian Government, Department of Resources Energy and Tourism, “Clean Energy Initiative” (May 13 2009), web site www.ret.gov.au/Department/Documents/CEI_Fact_Sheet.pdf.
Government funding for CCS projects around the world
Country Project
European Union . . . . . . . . In December 2009, the EU announced that 1 billion Euros ($1.47 billion) in grants would beallocated to six CCS projects on the continent.h
United States . . . . . . . . . . The American Recovery and Reinvestment Act, enacted in early 2009, provides $3.4 billion foradditional research and development work on advanced fossil energy technologies. A significantportion of the funding was allocated to the National Energy Technology Laboratory (NETL),which is coordinating the U.S. Department of Energy’s CCS programs.
China . . . . . . . . . . . . . . . . In China, a $1 billion 650-megawatt “GreenGen" IGCC project is under construction andscheduled to be on line in 2012. The United States and China have entered into atechnology-sharing agreement on CCS.
Australia . . . . . . . . . . . . . . In May 2009, the Australian Government announced that $2.425 billion (Australian) will beallocated to the “CCS Flagship” program over the next 10 years.i
32 The IEO2010 estimate for U.S. carbon dioxide emissions from liquids combustion, taken from EIA’s Annual Energy Outlook 2010, doesnot include emissions from biofuels. However, due to modeling limitations, IEO2010 does include carbon dioxide emissions from biofuelscombustion outside the United States. In the IEO2010 Reference case, biofuels make up 1.5 percent of total world liquids consumption out-side the United States by 2035. These non-U.S. biofuels add about 0.2 billion metric tons to total world carbon dioxide emissions.

total only 0.5 billion metric tons—equivalent to 4 percentof China’s total energy-related emissions and 6 percentof the world’s total emissions from natural gas combus-tion. The much lower growth rate in U.S. emissions fromnatural gas use, averaging 0.3 percent per year, stillresults in 1.3 billion metric tons of emissions in 2035,which is almost triple the amount from China in 2035.
World carbon dioxide emissions from coal combustionincrease by 56 percent, or 1.6 percent per year on aver-age, from 12.5 billion metric tons in 2007 to 19.4 billionmetric tons in 2035. Total coal-related emissions fromnon-OECD countries were already greater than thosefrom OECD countries in 1990, and in 2035 they aremore than 3 times the OECD total (Figure 110), in largepart as a result of increases in coal use by China andIndia.
China accounts for 78 percent of the total increase in theworld’s coal-related carbon dioxide emissions from 2007to 2035, and India accounts for 7 percent. For Chinaalone, coal-related emissions grow by an average of 2.6percent annually, from 5.2 billion metric tons in 2007 to10.6 billion metric tons (or 55 percent of the world total)in 2035. India’s carbon dioxide emissions from coal com-bustion total 1.4 billion metric tons in 2035, accountingfor more than 7 percent of the world total. In the UnitedStates—the world’s other major coal consumer—coal-related carbon dioxide emissions rise more slowly, by0.3 percent per year, to 2.4 billion metric tons (12 percentof the world total) in 2035.
Factors influencing trends inenergy-related carbon dioxideemissionsTwo key measures provide useful indications of trendsin energy-related emissions:
•The carbon intensity of energy supply is a measure ofthe amount of carbon dioxide associated with eachunit of energy used. It directly links changes in car-bon dioxide emissions levels with changes in energyusage. Carbon emissions vary by energy source, withcoal being the most carbon-intensive fuel, followedby oil and natural gas. Nuclear power and somerenewable energy sources (i.e., solar and wind) donot generate carbon dioxide emissions. As changesin the fuel mix alter the share of total energy demandmet by more carbon-intensive fuels relative to lesscarbon-intensive or “carbon-free” energy sources,overall carbon intensity changes. Over time, declin-ing carbon intensity can offset increasing energy con-sumption to some extent. If energy consumptionincreased and carbon intensity declined at the same
128 U.S. Energy Information Administration / International Energy Outlook 2010
2007IEO2009 IEO2010 IEO2009 IEO2010
0
2
4
6
8
10
Oil
Natural gas
Coal
2015 2030
6.46.25.75.96.0
Figure 105. U.S. energy-related carbon dioxideemissions by fuel in IEO2009 and IEO2010,2007, 2015, and 2030 (billion metric tons)
1.4
0.5
0.3
0.2
-0.2
0.1
Mexico
South Korea
Australia/
Canada
United States
OECD Europe
Japan
Total OECD
0.0 1.0 2.0 3.0 4.0-1.0
New Zealand
1.8
-0.6
Figure 106. Average annual growth in energy-related carbon dioxide emissions in OECDeconomies, 2007-2035 (percent per year)
2.7
2.4
2.4
2.1
1.7
0.4
0.3
2.0
China
Other Asia
Brazil
Middle East
India
AfricaOther Central and
Other Europe
Russia
Total Non-OECD
0.0 1.0 2.0 3.0
South America
and Eurasia
1.8
0.8
Figure 107. Average annual growth in energy-related carbon dioxide emissions in Non-OECDeconomies, 2007-2035 (percent per year)

rate, carbon dioxide emissions would remainconstant.
•The energy intensity of economic activity is a measure ofenergy consumption per unit of economic activity asmeasured by GDP. It relates changes in energy con-sumption to changes in economic activity. As a coun-try’s energy intensity changes, so does the influenceof a given level of economic activity on carbon diox-ide emissions. Increased energy use and economicgrowth generally occur together, although thedegree to which they are linked varies across regionsand stages of economic development.
As with carbon intensity, regional energy intensities donot necessarily remain constant over time. The rate atwhich the energy efficiency of an economy’s capitalstock (vehicles, appliances, manufacturing equipment,etc.) increases affects trends in energy intensity. New
stock is often more energy efficient than the older equip-ment it replaces. In addition to the availability of moreenergy-efficient technologies, the rate of efficiencyimprovement is also determined by changes in the priceof energy relative to prices for other goods and services,and by investment in research and development. Thesefactors in combination can produce changes in regionalenergy intensities, with corresponding effects on expec-tations for future levels of energy consumption, fuelmix, and carbon dioxide emissions.
Structural shifts in national economies also can lead tochanges in energy intensity when the shares of economicoutput attributable to energy-intensive and non-energy-intensive industries change. For example, iron, steel,and cement are among the most energy-intensive indus-tries, and countries whose economies rely heavily onproduction from those industries tend to have highenergy intensities. When their economies shift towardless energy-intensive activities, their national energyintensities may decline. Other influences on regionalenergy intensity trends include changes in consumertastes and preferences, climate, taxation, the availabilityof energy supply, government regulations, and thestructure of energy markets themselves.
The Kaya decompositionof emissions trendsThe Kaya Identity provides an intuitive approach to theinterpretation of historical trends and future projectionsof energy-related carbon dioxide emissions. It is used todescribe the relationship among the factors that influ-ence trends in energy-related carbon dioxide emissions:
CO2 = (CO2 / E) × (E / GDP) × (GDP / POP) × POP .
U.S. Energy Information Administration / International Energy Outlook 2010 129
1990 2000 2007 2015 2025 20350
2
4
6
8
10History Projections
OECD
Non-OECD
Figure 108. World carbon dioxide emissionsfrom liquids combustion, 1990-2035(billion metric tons)
1990 2000 2007 2015 2025 20350
1
2
3
4
5History Projections
OECD
Non-OECD
Figure 109. World carbon dioxide emissionsfrom natural gas combustion, 1990-2035(billion metric tons)
1990 2000 2007 2015 2025 20350
5
10
15History Projections
OECD
Non-OECD
Figure 110. World carbon dioxide emissionsfrom coal combustion, 1990-2035(billion metric tons)

The identity links total energy-related carbon dioxideemissions (CO2) to energy (E), the level of economicactivity as measured by gross domestic product (GDP),and population size (POP). Conveniently, the percent-age rate of change in carbon emission levels over timeapproximates the sum of the percentage rate of changeacross the four components. The first two componentson the right-hand side of the equation represent thecarbon dioxide intensity of energy supply (CO2/E) andthe energy intensity of economic activity (E/GDP).When they are multiplied together, the resultingmeasure is carbon dioxide emissions per dollar of GDP(CO2/GDP)—i.e., the carbon intensity of the economy,which is another common measure used in analysis.Economic output (GDP) is decomposed into output percapita (GDP/POP) and population (POP). At any pointin time, the level of energy-related carbon dioxide emis-sions can be seen as the product of the four Kaya Identitycomponents—energy intensity, carbon dioxide intensityof energy supply, output per capita, and population.33
Using 2007 data as examples, world energy-related car-bon dioxide emissions totaled 29.7 billion metric tons inthat year, world energy consumption totaled 495 qua-drillion Btu, world GDP totaled $63.1 trillion, and thetotal world population was 6,665 million. Using thosefigures in the Kaya equation yields the following: 60.1metric tons of carbon dioxide per billion Btu of energy(CO2/E), 7.8 thousand Btu of energy per dollar of GDP(E/GDP), and $9,552 of income per person (GDP/POP).
Of the four Kaya components, policymakers are mostactively concerned with energy intensity of economicoutput (E/GDP) and carbon dioxide intensity of theenergy supply (CO2/E), because they correspond to thepolicy levers most available to them. Reducing growthin per-capita output would also have a mitigating influ-ence on emissions, but governments generally pursuepolicies to increase rather than reduce output per capitato advance objectives other than greenhouse gas mitiga-tion. Some countries, such as China, have policiesrelated directly to limiting population growth, but mostcountries pursue policies that only indirectly influencepopulation growth.
Table 20 shows absolute regional Kaya Identity valuesfor selected years and average annual rates of change forthree 15-year periods: (1) an historical period from 1990
to 2005, (2) a period from 2005 to 2020, and (3) the finalperiod of the IEO2010 projection from 2020 to 2035.34
The three periods show distinctive patterns of emissionsgrowth and underlying Kaya factors.
Both OECD and non-OECD economies have experi-enced or are expected to experience declines in energyintensity. These are the only values that are consistentlynegative across all time periods at the aggregate level. Inthe historical period, only OECD Asia showed a rise inenergy intensity, reflecting an increase in the energyintensity of Japan’s economy. However, Japan has thelowest energy intensity among all the fully industrial-ized OECD economies.
Carbon intensity varies across time and regions, but inno case does it change as much as energy intensity does.Over the 1990-2005 period, the largest annual declineworldwide (0.7 percent) is for non-OECD Europe andEurasia, where much of the old energy infrastructurewas shut down and replaced after the fall of the SovietUnion. The next largest annual decline (0.6 percent)occurred in OECD Europe, where coal consumption fellfrom 17.7 quadrillion Btu in 1990 to 12.9 quadrillion Btuin 2005 and was replaced by natural gas consumption,which increased from 11.2 quadrillion Btu in 1990 to 19.8quadrillion Btu in 2005. In many regions, includingNorth America, the carbon intensity of energy supplyremained largely unchanged from 1990 to 2005. For theentire world, carbon intensity declined by only 0.1 per-cent annually from 1990 to 2005, compared with a 1.5-percent average annual decline in energy intensity.
Over the period from 2005 to 2020, carbon intensitydeclines in the IEO2010 Reference case in every part ofthe world. While explicit carbon policies, such as thecaps in OECD Europe, are not included in the model,analysts’ judgment regarding, for example, nuclearpower have taken those policies into account.35 In otherareas, declining carbon intensity is the result of policiessuch as renewable portfolio standards and otherapproaches to promote alternatives to fossil fuels. From2020 to 2035, there is a slight decrease in carbon intensityof energy supply in OECD economies and a slightincrease in non-OECD economies, so that there is virtu-ally no change on a worldwide basis in the absence ofadditional policies to stem emissions growth, which arenot included in the Reference case.
130 U.S. Energy Information Administration / International Energy Outlook 2010
33 In other analyses, EIA has combined output per capita and population as GDP, simplifying the right side of the equation to three com-ponents: GDP, E/GDP and C/E. However, because rates of output and population growth can differ dramatically across countries and re-gions, this analysis uses the more detailed equation. See U.S. Energy Information Administration, Emissions of Greenhouse Gases in the UnitedStates 2008, DOE/EIA-0573(2008) (Washington, DC, December 2009), p. 3, web site www.eia.gov/oiaf/1605/ggrpt/pdf/0573(2008).pdf.
34 See Appendix J for a complete regional listing of Kaya Identity components.35 Greenhouse gas emissions caps in Europe are not explicitly included in the IEO2010 analysis for the following reasons: (1) greenhouse
gases other than energy-related carbon dioxide are included in the caps, but they are not modeled in IEO2010; (2) the regional compositionof the European Union differs from the OECD Europe region modeled in IEO2010; (3) the European Union Emissions Trading System in-cludes offsets that involve countries outside the European Union; and (4) the IEO2010 Reference case extends to 2035 and therefore wouldrequire further assumptions regarding emissions caps beyond the period covered under the Emissions Trading System.
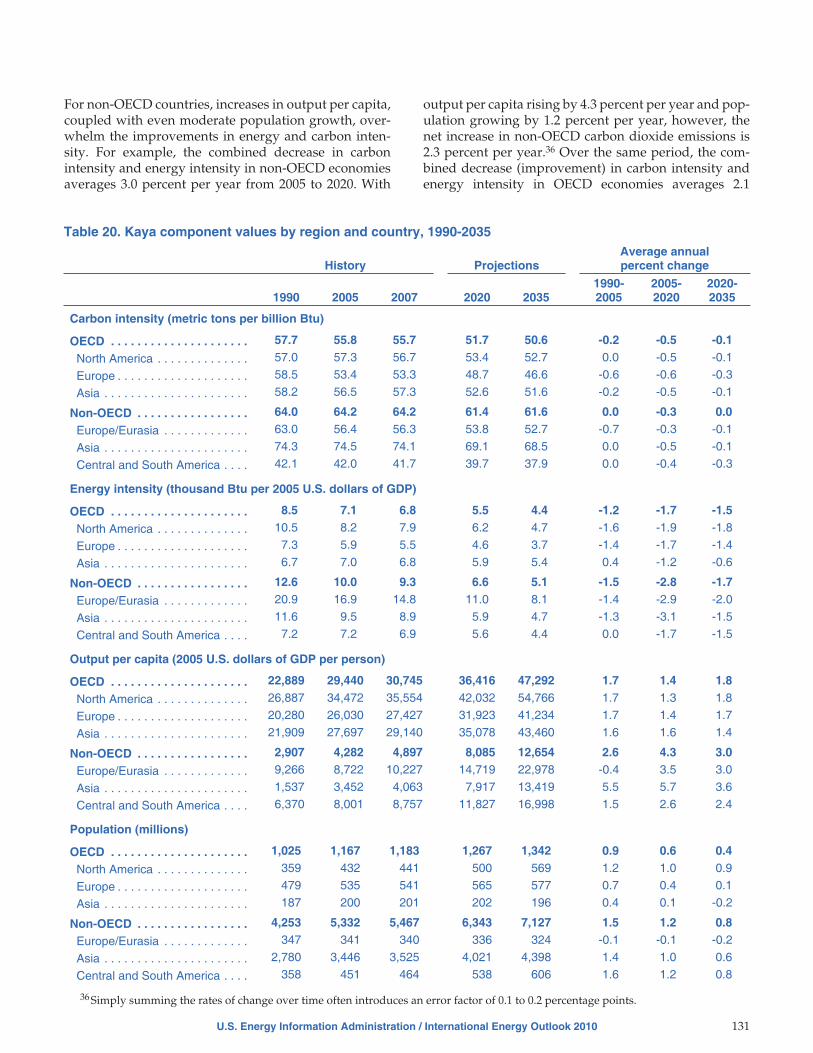
For non-OECD countries, increases in output per capita,coupled with even moderate population growth, over-whelm the improvements in energy and carbon inten-sity. For example, the combined decrease in carbonintensity and energy intensity in non-OECD economiesaverages 3.0 percent per year from 2005 to 2020. With
output per capita rising by 4.3 percent per year and pop-ulation growing by 1.2 percent per year, however, thenet increase in non-OECD carbon dioxide emissions is2.3 percent per year.36 Over the same period, the com-bined decrease (improvement) in carbon intensity andenergy intensity in OECD economies averages 2.1
U.S. Energy Information Administration / International Energy Outlook 2010 131
Table 20. Kaya component values by region and country, 1990-2035
History ProjectionsAverage annualpercent change
1990 2005 2007 2020 20351990-2005
2005-2020
2020-2035
Carbon intensity (metric tons per billion Btu)
OECD . . . . . . . . . . . . . . . . . . . . . 57.7 55.8 55.7 51.7 50.6 -0.2 -0.5 -0.1
North America . . . . . . . . . . . . . . 57.0 57.3 56.7 53.4 52.7 0.0 -0.5 -0.1
Europe . . . . . . . . . . . . . . . . . . . . 58.5 53.4 53.3 48.7 46.6 -0.6 -0.6 -0.3
Asia . . . . . . . . . . . . . . . . . . . . . . 58.2 56.5 57.3 52.6 51.6 -0.2 -0.5 -0.1
Non-OECD . . . . . . . . . . . . . . . . . 64.0 64.2 64.2 61.4 61.6 0.0 -0.3 0.0
Europe/Eurasia . . . . . . . . . . . . . 63.0 56.4 56.3 53.8 52.7 -0.7 -0.3 -0.1
Asia . . . . . . . . . . . . . . . . . . . . . . 74.3 74.5 74.1 69.1 68.5 0.0 -0.5 -0.1
Central and South America . . . . 42.1 42.0 41.7 39.7 37.9 0.0 -0.4 -0.3
Energy intensity (thousand Btu per 2005 U.S. dollars of GDP)
OECD . . . . . . . . . . . . . . . . . . . . . 8.5 7.1 6.8 5.5 4.4 -1.2 -1.7 -1.5
North America . . . . . . . . . . . . . . 10.5 8.2 7.9 6.2 4.7 -1.6 -1.9 -1.8
Europe . . . . . . . . . . . . . . . . . . . . 7.3 5.9 5.5 4.6 3.7 -1.4 -1.7 -1.4
Asia . . . . . . . . . . . . . . . . . . . . . . 6.7 7.0 6.8 5.9 5.4 0.4 -1.2 -0.6
Non-OECD . . . . . . . . . . . . . . . . . 12.6 10.0 9.3 6.6 5.1 -1.5 -2.8 -1.7
Europe/Eurasia . . . . . . . . . . . . . 20.9 16.9 14.8 11.0 8.1 -1.4 -2.9 -2.0
Asia . . . . . . . . . . . . . . . . . . . . . . 11.6 9.5 8.9 5.9 4.7 -1.3 -3.1 -1.5
Central and South America . . . . 7.2 7.2 6.9 5.6 4.4 0.0 -1.7 -1.5
Output per capita (2005 U.S. dollars of GDP per person)
OECD . . . . . . . . . . . . . . . . . . . . . 22,889 29,440 30,745 36,416 47,292 1.7 1.4 1.8
North America . . . . . . . . . . . . . . 26,887 34,472 35,554 42,032 54,766 1.7 1.3 1.8
Europe . . . . . . . . . . . . . . . . . . . . 20,280 26,030 27,427 31,923 41,234 1.7 1.4 1.7
Asia . . . . . . . . . . . . . . . . . . . . . . 21,909 27,697 29,140 35,078 43,460 1.6 1.6 1.4
Non-OECD . . . . . . . . . . . . . . . . . 2,907 4,282 4,897 8,085 12,654 2.6 4.3 3.0
Europe/Eurasia . . . . . . . . . . . . . 9,266 8,722 10,227 14,719 22,978 -0.4 3.5 3.0
Asia . . . . . . . . . . . . . . . . . . . . . . 1,537 3,452 4,063 7,917 13,419 5.5 5.7 3.6
Central and South America . . . . 6,370 8,001 8,757 11,827 16,998 1.5 2.6 2.4
Population (millions)
OECD . . . . . . . . . . . . . . . . . . . . . 1,025 1,167 1,183 1,267 1,342 0.9 0.6 0.4
North America . . . . . . . . . . . . . . 359 432 441 500 569 1.2 1.0 0.9
Europe . . . . . . . . . . . . . . . . . . . . 479 535 541 565 577 0.7 0.4 0.1
Asia . . . . . . . . . . . . . . . . . . . . . . 187 200 201 202 196 0.4 0.1 -0.2
Non-OECD . . . . . . . . . . . . . . . . . 4,253 5,332 5,467 6,343 7,127 1.5 1.2 0.8
Europe/Eurasia . . . . . . . . . . . . . 347 341 340 336 324 -0.1 -0.1 -0.2
Asia . . . . . . . . . . . . . . . . . . . . . . 2,780 3,446 3,525 4,021 4,398 1.4 1.0 0.6
Central and South America . . . . 358 451 464 538 606 1.6 1.2 0.8
36 Simply summing the rates of change over time often introduces an error factor of 0.1 to 0.2 percentage points.

percent per year—lower than in non-OECD econo-mies—but because OECD output per capita increases by1.4 percent per year and population growth averages 0.5percent per year, the net result is that OECD carbondioxide emissions decline by an average of 0.2 percentper year.
Emissions per capitaAnother measure of carbon dioxide intensity is emis-sions per person. Carbon dioxide emissions per capitain OECD economies are significantly higher than innon-OECD economies (Figure 111). Among non-OECDcountries, China has the highest percentage increase incarbon dioxide emissions per capita in the Referencecase, from 4.7 metric tons per person in 2007 to 9.2 metric
tons per person in 2035 (Table 21 and Figure 112)—anaverage annual increase of 2.4 percent. Russia has thehighest level of emissions per capita among non-OECDeconomies in 2035, at 14.4 metric tons per person. Bycountry grouping, the lowest levels of emissions percapita are in India and Africa. India’s emissions percapita increase from 1.2 metric tons in 2007 to 1.5 metrictons in 2035, and Africa’s emissions per capita increasefrom about 1.0 metric ton in 2007 to 1.1 metric tons in2035.37
OECD countries have higher levels of carbon dioxideemissions per capita, in part because of their higher lev-els of income and fossil fuel use per person. In the Refer-ence case, U.S. emissions per capita fall from 19.8 metrictons in 2007 to 16.2 metric tons in 2035 but remain amongthe highest, second only to the Australia/New Zealandregion (Figure 113). Canada’s emissions per capita fallfrom 17.8 metric tons to 14.8 metric tons over the sameperiod. In Mexico, emissions per capita increase fromabout 4 metric tons in 2007 (the lowest level amongOECD countries) to 5.5 metric tons in 2035, which still isthe lowest among the OECD countries reported sepa-rately in IEO2010.38
Income per capita is the most important determinant ofcarbon dioxide emissions per capita, but other factorsalso affect the calculation. For example, climate is impor-tant, because in general more energy is used for heatingper capita in colder climates than in warmer climates.Similarly, population density is important, becausedensely populated countries use less energy for trans-portation per capita than do more sparsely populatedcountries. For example, Canada has both a relativelycold climate and low population density, and its carbon
132 U.S. Energy Information Administration / International Energy Outlook 2010
1990 2000 2007 2015 2025 20350
5
10
15History Projections
OECD
Non-OECD
Figure 111. World carbon dioxide emissionsper capita, 1990-2035 (metric tons per person)
1990 2000 2007 2015 2025 20350
5
10
15
20History Projections
Middle East
BrazilAfrica
Russia
ChinaIndia
Figure 112. Non-OECD carbon dioxide emissionsper capita by country and region, 1990-2035(metric tons per person)
1990 2000 2007 2015 2025 20350
5
10
15
20
25History Projections
Japan
South Korea
OECD Europe
United States
Canada
Mexico
Australia/New Zealand
Figure 113. OECD carbon dioxide emissionsper capita by country and region, 1990-2035(metric tons per person)
37 These values do not include positive carbon flux (emissions) from deforestation.38 Because Turkey is an OECD country with per-capita income lower than Mexico’s, this may mean lower per-capita emissions. EIA does
not project Turkey’s emissions separately.

dioxide emissions in 2007 are estimated at 17.8 metrictons per capita, whereas Japan has a more temperate cli-mate and a much higher population density, and itsemissions in 2007 are estimated at 9.9 metric tons percapita (44 percent lower than in Canada). Japan’s incomeper capita, by comparison, was only 15 percent lowerthan Canada’s in 2007.
Alternative Economic Growth casesIn IEO2010, economic growth is the most significant fac-tor analyzed that underlies the projections for growth inenergy-related carbon dioxide emissions in the mid-term, as the world continues to rely on fossil fuels formost of its energy use. Accordingly, projections of worldcarbon dioxide emissions are lower in the Low Eco-nomic Growth case and higher in the High EconomicGrowth case than in the Reference case.
In 2035, total energy-related carbon dioxide emissionsworldwide (Figure 114) range from a projected 39.3 bil-lion metric tons in the Low Economic Growth case to47.1 billion metric tons in the High Economic Growth
case—19.7 percent higher than projected in the Low Eco-nomic Growth case. The projections for emissions byfuel show similar variations across the cases.
U.S. Energy Information Administration / International Energy Outlook 2010 133
Table 21. Energy-related carbon dioxide emissions per capita by region and country, 1990-2035(metric tons per person)
Region
History ProjectionsAverage annualpercent change
1990 2007 2015 2020 2025 2030 20351990-2007
2007-2035
OECD . . . . . . . . . . . . . . . . . . . . . 11.0 11.6 10.5 10.4 10.4 10.5 10.6 0.3 -0.3
North America . . . . . . . . . . . . . 16.0 15.8 14.1 13.8 13.7 13.6 13.5 -0.1 -0.6
United States . . . . . . . . . . . . . . 20.0 19.8 17.5 17.1 16.8 16.5 16.2 -0.1 -0.7
Canada . . . . . . . . . . . . . . . . . . 17.0 17.8 15.4 14.7 14.6 14.7 14.8 0.3 -0.7
Mexico . . . . . . . . . . . . . . . . . . . 3.6 4.1 3.9 4.2 4.5 4.9 5.5 0.8 1.0
Europe . . . . . . . . . . . . . . . . . . . 8.4 8.1 7.4 7.2 7.1 7.1 7.1 -0.2 -0.5
Asia . . . . . . . . . . . . . . . . . . . . . . 8.5 11.4 10.6 10.9 11.3 11.7 12.2 1.7 0.2
Japan . . . . . . . . . . . . . . . . . . . . 8.5 9.9 8.7 9.0 9.1 9.1 9.1 0.9 -0.3
South Korea. . . . . . . . . . . . . . . 5.7 10.8 10.9 11.5 12.7 14.0 15.6 3.9 1.3
Australia/New Zealand. . . . . . . 14.6 19.8 18.9 18.3 17.9 17.8 18.0 1.8 -0.3
Non-OECD . . . . . . . . . . . . . . . . . 2.4 2.9 3.1 3.3 3.5 3.7 4.0 1.3 1.1
Europe/Eurasia . . . . . . . . . . . . 12.3 8.5 8.5 8.7 8.9 9.3 9.8 -2.1 0.5
Russia . . . . . . . . . . . . . . . . . . . 16.0 11.7 11.9 12.2 12.6 13.3 14.4 -1.8 0.8
Other . . . . . . . . . . . . . . . . . . . . 9.4 6.3 6.2 6.3 6.5 6.6 6.9 -2.4 0.3
Asia . . . . . . . . . . . . . . . . . . . . . . 1.3 2.7 2.9 3.2 3.6 3.9 4.3 4.2 1.7
China . . . . . . . . . . . . . . . . . . . . 2.0 4.7 5.6 6.4 7.3 8.2 9.2 5.2 2.4
India . . . . . . . . . . . . . . . . . . . . . 0.7 1.2 1.2 1.3 1.3 1.4 1.5 3.6 0.8
Other . . . . . . . . . . . . . . . . . . . . 1.1 1.7 1.7 1.8 1.9 2.1 2.4 2.7 1.2
Middle East. . . . . . . . . . . . . . . . 5.2 7.5 8.4 8.5 8.5 8.5 8.8 2.2 0.6
Africa. . . . . . . . . . . . . . . . . . . . . 1.0 1.0 1.1 1.0 1.0 1.0 1.1 0.1 0.1
Central and South America. . . 1.9 2.5 2.6 2.6 2.7 2.8 2.9 1.6 0.4
Brazil . . . . . . . . . . . . . . . . . . . . 1.6 2.1 2.3 2.4 2.6 2.9 3.1 1.7 1.5Other . . . . . . . . . . . . . . . . . . . . 2.2 2.8 2.8 2.7 2.7 2.7 2.7 1.5 -0.2
Total World . . . . . . . . . . . . . . . . . 4.1 4.5 4.3 4.4 4.6 4.8 5.0 0.5 0.4
2007Low
EconomicGrowth
2035Reference High
EconomicGrowth
0
10
20
30
40
50
OECD
Non-OECD
Figure 114. Carbon dioxide emissions in threeEconomic Growth cases, 2007 and 2035(metric tons per person)

In the High Economic Growth case, world carbon diox-ide emissions increase by an average of 1.7 percentannually from 2007 to 2035, as compared with 1.3 per-cent in the Reference case. For OECD countries, the pro-jected average increase in the High Economic Growthcase is 0.5 percent per year; for non-OECD countries, theaverage is 2.4 percent per year. In the Low EconomicGrowth case, world carbon dioxide emissions increaseby 1.0 percent per year from 2007 to 2035, with averagesof -0.1 percent per year for OECD countries and 1.6 per-cent per year for non-OECD countries (compared with0.1 percent and 2.0 percent, respectively, in the Refer-ence case).
References
134 U.S. Energy Information Administration / International Energy Outlook 2010
1. Summary information is taken largely from PewCenter on Global Climate Change, “CopenhagenClimate Conference - COP 15” (December 21, 2009),web site www.pewclimate.org/copenhagen/cop15.
2. United Nations Framework Convention on ClimateChange, Report of the Conference of the Parties onIts Fifteenth Session, FCCC/CP/2009/11/Add.1(March 30, 2010), “Addendum: Decisions Adoptedby the Conference of the Parties,” p. 5, web sitehttp://unfccc.int/resource/docs/2009/cop15/eng/11a01.pdf.

Data SourcesHighlights
Figure 1. World marketed energy consumption, 2007-2035: 2007: U.S. Energy Information Administration(EIA), International Energy Statistics database (as ofNovember 2009), web site www.eia.gov/emeu/international. Projections: EIA, World Energy Projec-tion System Plus (2010).
Figure 2. World marketed energy use by fuel type,1990-2035: History: EIA, International Energy Statisticsdatabase (as of November 2009), web site www.eia.gov/emeu/international. Projections: EIA, WorldEnergy Projection System Plus (2010).
Figure 3. World liquids production, 1990-2035: 1990-2007: EIA, International Energy Statistics database (as ofNovember 2009), web site www.eia.gov/emeu/international. Projections: EIA, Generate World Oil Bal-ance Model (2010).
Figure 4. Net change in world natural gas productionby region, 2007-2035: 2007: EIA, International EnergyStatistics database (as of November 2009), web sitewww.eia.gov/emeu/international. EIA, InternationalNatural Gas Model (2010).
Figure 5. World coal consumption by region, 1990-2035: 1990-2007: EIA, International Energy Statisticsdatabase (as of November 2009), web site www.eia.gov/emeu/international. Projections: EIA, WorldEnergy Projection System Plus (2010).
Figure 6. World net electricity generation by fuel,2007-2035: 2007: EIA, International Energy Statisticsdatabase (as of November 2009), web site www.eia.gov/emeu/international. Projections: EIA, WorldEnergy Projection System Plus (2010).
Figure 7. World renewable electricity generation byenergy source, excluding wind and hydropower, 2007-2035: 2007: EIA, International Energy Statistics database(as of November 2009), web site www.eia.gov/emeu/international. Projections: EIA, World Energy Projec-tion System Plus (2010).
Figure 8. World delivered energy consumption in theindustrial sector, 2007-2035: 2007: Derived from EIA,International Energy Statistics database (as of Novem-ber 2009), web site www.eia.gov/emeu/international.Projections: EIA, World Energy Projection System Plus(2010).
Figure 9. World delivered energy consumption in thetransportation sector, 2005-2035: 2005-2007: Derivedfrom EIA, International Energy Statistics database (as of
November 2009), web site www.eia.gov/emeu/international. Projections: EIA, World Energy Projec-tion System Plus (2010).
Figure 10. World energy-related carbon dioxide emis-sions, 2007-2035: 2007: EIA, International Energy Statis-tics database (as of November 2009), web site www.eia.gov/emeu/international. Projections: EIA, WorldEnergy Projection System Plus (2010).
Figure 11. Impacts of four Kaya factors on world car-bon dioxide emissions, 1990-2035: 1990-2007: Derivedfrom EIA, International Energy Statistics database (as ofNovember 2009), web site www.eia.gov/emeu/international. Projections: EIA, World Energy Projec-tion System Plus (2010).
Chapter 1. World Energy Demand and EconomicOutlook
Figure 12. World marketed energy consumption, 1990-2035: History: EIA, International Energy Statistics data-base (as of November 2009), web site www.eia.gov/emeu/international. Projections: EIA, World EnergyProjection System Plus (2010).
Table 1. World marketed energy consumption bycountry grouping, 2007-2035: 2007: EIA, InternationalEnergy Statistics database (as of November 2009), website www.eia.gov/emeu/international. Projections:EIA, World Energy Projection System Plus (2010).
Figure 13. World marketed energy consumption:OECD and Non-OECD, 1990-2035: History: EIA, Inter-national Energy Statistics database (as of November2009), web site www.eia.gov/emeu/international. Pro-jections: EIA, World Energy Projection System Plus(2010).
Figure 14. Shares of world energy consumption in theUnited States, China, and India, 1990-2035: History:EIA, International Energy Statistics database (as ofNovember 2009), web site www.eia.gov/emeu/international. Projections: EIA, World Energy Projec-tion System Plus (2010).
Figure 15. Marketed energy use in Non-OECD econo-mies by region, 1990-2035: History: EIA, InternationalEnergy Statistics database (as of November 2009), website www.eia.gov/emeu/international. Projections:EIA, World Energy Projection System Plus (2010).
Figure 16. World marketed energy use by fuel type,1990-2035: History: EIA, International Energy Statisticsdatabase (as of November 2009), web site www.eia.gov/emeu/international. Projections: EIA, WorldEnergy Projection System Plus (2010).
U.S. Energy Information Administration / International Energy Outlook 2010 135
Figure 17. Coal consumption in selected world regions,1990-2035: History: EIA, International Energy Statisticsdatabase (as of November 2009), web site www.eia.gov/emeu/international. Projections: EIA, WorldEnergy Projection System Plus (2010).
Figure 18. World electricity generation by fuel, 2007-2035: History: Derived from EIA, International EnergyStatistics database (as of November 2009), web sitewww.eia.gov/emeu/international. Projections: EIA,World Energy Projection System Plus (2010).
Figure 19. Renewable electricity generation in Chinaby energy source, 2007-2035: 2007: EIA, InternationalEnergy Statistics database (as of November 2009), website www.eia.gov/emeu/international. Projections:EIA, World Energy Projection System Plus (2010).
Figure 20. World nuclear generating capacity byregion, 2007 and 2035: 2007: EIA, International EnergyStatistics database (as of November 2009), web sitewww.eia.gov/emeu/international. Projections: EIA,World Energy Projection System Plus (2010).
Figure 21. OECD and Non-OECD total gross domesticproduct, 1990-2035: History: IHS Global Insight, WorldOverview (Lexington, MA, various issues). Projections:Derived from IHS Global Insight, World Overview, ThirdQuarter 2009 (Lexington, MA, November 2009); and EIA,Annual Energy Outlook 2010, DOE/EIA-0383(2010)(Washington, DC, April 2010), AEO2010 NationalEnergy Modeling System, run AEO2010R.D111809A,web site www.eia.gov/oiaf/aeo.
Table 2. World gross domestic product by countrygrouping, 2007-2035: History: IHS Global Insight, WorldOverview (Lexington, MA, various issues). Projections:Derived from IHS Global Insight, World Overview, ThirdQuarter 2009 (Lexington, MA, November 2009); and EIA,Annual Energy Outlook 2010, DOE/EIA-0383(2010)(Washington, DC, April 2010), AEO2010 NationalEnergy Modeling System, run AEO2010R.D111809A,web site www.eia.gov/oiaf/aeo.
Figure 22. World marketed energy consumption inthree Economic Growth cases, 1990-2035: 1990-2007:EIA, International Energy Statistics database (as ofNovember 2009), web site www.eia.gov/emeu/international. Projections: EIA, World Energy Projec-tion System Plus (2010).
Figure 23. World oil prices in three Oil Price cases,1990-2035: EIA, Annual Energy Outlook 2010, DOE/EIA-0383(2010) (Washington, DC, April 2010), web sitewww.eia.gov/oiaf/aeo.
Figure 24. World marketed energy consumption inthree Oil Price cases, 2007-2035: 2007: EIA, InternationalEnergy Statistics database (as of November 2009), web
site www.eia.gov/emeu/international. Projections:EIA, World Energy Projection System Plus (2010).
Figure 25. World marketed energy consumption byfuel in three Oil Price cases, 2035: EIA, World EnergyProjection System Plus (2010).
Figure 26. World liquids consumption by sector inthree Oil Price cases, 2035: EIA, World Energy Projec-tion System Plus (2010).
Chapter 2. Liquid Fuels
Figure 27. World liquids consumption by region andcountry group, 2007 and 2035: 2007: EIA, InternationalEnergy Statistics database (as of November 2009), website www.eia.gov/emeu/international. 2035: EIA,World Energy Projection System Plus (2010).
Figure 28. World liquid fuels production in three cases,2007 and 2035: 2007: EIA, International Energy Statisticsdatabase (as of November 2009), web site www.eia.gov/emeu/international. 2035: EIA, Generate WorldOil Balance Model (2010).
Table 3. World liquid fuels production in the Refer-ence case, 2007-2035: 2007: EIA, Office of Energy Mar-kets and End Use. Projections: EIA, Generate World OilBalance Model (2010).
Figure 29. World total liquids production, 1990-2035:1990-2007: EIA, International Energy Statistics database(as of November 2009), web site www.eia.gov/emeu/international. Projections: EIA, Generate World Oil Bal-ance Model (2010).
Figure 30. World production of unconventional liquidfuels in three cases, 2007 and 2035: 2007: EIA, Office ofEnergy Markets and End Use. 2035: EIA, GenerateWorld Oil Balance Model (2010).
Figure 31. World liquids consumption by sector, 2007-2035: 2007: Derived from EIA, International EnergyStatistics database (as of November 2009), web sitewww.eia.gov/emeu/international. Projections: EIA,World Energy Projection System Plus (2010).
Figure 32. World oil prices in three cases, 1980-2035:EIA, Annual Energy Outlook 2010, DOE/EIA-0383(2010)(Washington, DC, April 2010), web site www.eia.gov/oiaf/aeo.
Table 4. World oil prices in four cases, 2008-2035: EIA,Annual Energy Outlook 2010, DOE/EIA-0383(2010)(Washington, DC, April 2010), web site www.eia.gov/oiaf/aeo.
Figure 33. Non-OPEC conventional liquids productionby region, 2007 and 2035: 2007: EIA, Office of EnergyMarkets and End Use. 2035: EIA, Generate World OilBalance Model (2010).
136 U.S. Energy Information Administration / International Energy Outlook 2010

Figure 34. OPEC conventional liquids production byregion, 2007 and 2035: 2007: EIA, Office of Energy Mar-kets and End Use. 2035: EIA, Generate World Oil Bal-ance Model (2010).
Figure 35. World proved oil reserves by geographicregion as of January 1, 2010: “Worldwide Look atReserves and Production,” Oil & Gas Journal, Vol. 105,No. 48 (December 24, 2009), pp. 22-23.
Table 5. World oil reserves by country as of January 1,2010: “Worldwide Look at Reserves and Production,”Oil & Gas Journal, Vol. 105, No. 48 (December 24, 2009),pp. 22-23.
Chapter 3. Natural Gas
Figure 36. World natural gas consumption, 2007-2035:2007: EIA, International Energy Statistics database (as ofNovember 2009), web site www.eia.gov/emeu/international. Projections: EIA, World Energy Projec-tion System Plus (2010).
Figure 37. Change in world natural gas production byregion, 2007-2035: EIA, International Natural Gas Model(2010).
Figure 38. Natural gas consumption in North Americaby country, 2007-2035: 2007: EIA, International EnergyStatistics database (as of November 2009), web sitewww.eia.gov/emeu/international. Projections: EIA,World Energy Projection System Plus (2010); and AnnualEnergy Outlook 2010, DOE/EIA-0383(2010) (Washing-ton, DC, April 2010), AEO2010 National EnergyModeling System, run AEO2010R.D111809A, web sitewww.eia.gov/oiaf/aeo.
Figure 39. Natural gas consumption in OECD Europeby end-use sector, 2007-2035: 2007: Derived from EIA,International Energy Statistics database (as of Novem-ber 2009), web site www.eia.gov/emeu/international.Projections: EIA, World Energy Projection System Plus(2010).
Figure 40. Natural gas consumption in OECD Asia bycountry and end-use sector, 2007 and 2035: 2007:Derived from EIA, International Energy Statistics data-base (as of November 2009), web site www.eia.gov/emeu/international. 2035: EIA, World Energy Projec-tion System Plus (2010).
Figure 41. Natural gas consumption in Non-OECDEurope and Eurasia, 2007-2035: 2007: EIA, InternationalEnergy Statistics database (as of November 2009), website www.eia.gov/emeu/international. Projections:EIA, World Energy Projection System Plus (2010).
Figure 42. Natural gas consumption in Non-OECDAsia by country, 2007-2035: 2007: EIA, InternationalEnergy Statistics database (as of November 2009), website www.eia.gov/emeu/international. Projections:EIA, World Energy Projection System Plus (2010).
Figure 43. OECD natural gas production by country,1990-2035: 1990-2007: EIA, International Energy Statis-tics database (as of November 2009), web site www.eia.gov/emeu/international. Projections: EIA, Interna-tional Natural Gas Model (2010); and Annual EnergyOutlook 2010, DOE/EIA-0383(2010) (Washington, DC,April 2010), AEO2010 National Energy Modeling Sys-tem, run AEO2010R.D111809A, web site www.eia.gov/oiaf/aeo.
Table 6. World natural gas production by region andcountry in the Reference case, 2007-2035: 2007 and 2008:EIA, International Energy Statistics database (as ofNovember 2009), web site www.eia.gov/emeu/international. Projections: EIA, International NaturalGas Model (2010); and Annual Energy Outlook 2010,DOE/EIA-0383(2010) (Washington, DC, April 2010),AEO2010 National Energy Modeling System, runAEO2010R.D111809A, web site www.eia.gov/oiaf/aeo.
Figure 44. OECD Europe natural gas production,1990-2035: 1990-2007: Derived from EIA, InternationalEnergy Statistics database (as of November 2009), website www.eia.gov/emeu/international. Projections:EIA, International Natural Gas Model (2010).
Figure 45. Middle East natural gas production,1990-2035: 1990-2007: EIA, International Energy Statis-tics database (as of November 2009), web site www.eia.gov/emeu/international. Projections: EIA, Interna-tional Natural Gas Model (2010).
Figure 46. Non-OECD Europe and Eurasia natural gasproduction, 1992-2035: 1992-2007: EIA, InternationalEnergy Statistics database (as of November 2009), website www.eia.gov/emeu/international. Projections:EIA, International Natural Gas Model (2010).
Figure 47. Africa natural gas production, 1990-2035:1990-2007: EIA, International Energy Statistics database(as of November 2009), web site www.eia.gov/emeu/international. Projections: EIA, International NaturalGas Model (2010).
Figure 48. Non-OECD Asia natural gas production,1990-2035: 1990, 2000, and 2007: EIA, InternationalEnergy Statistics database (as of November 2009), website www.eia.gov/emeu/international. Projections:EIA, International Natural Gas Model (2010).
Figure 49. China natural gas production, 1990-2035:1990, 2000, and 2007: Derived from EIA, InternationalEnergy Statistics database (as of November 2009), website www.eia.gov/emeu/international. Projections:EIA, International Natural Gas Model (2010).
Figure 50. Central and South America natural gas pro-duction, 1990-2035: 1990-2007: EIA, InternationalEnergy Statistics database (as of November 2009), website www.eia.gov/emeu/international. Projections:EIA, International Natural Gas Model (2010).
U.S. Energy Information Administration / International Energy Outlook 2010 137
Figure 51. OECD North America net natural gas trade,2007-2035: 2007: EIA, International Energy Statisticsdatabase (as of November 2009), web site www.eia.gov/emeu/international. Projections: EIA, InternationalNatural Gas Model (2010); and Annual Energy Outlook2010, DOE/EIA-0383(2010) (Washington, DC, April2010), AEO2010 National Energy Modeling System, runAEO2010R.D111809A, web site www.eia.gov/oiaf/aeo.
Figure 52. OECD Asia net natural gas trade, 2007-2035:2007: EIA, International Energy Statistics database (as ofNovember 2009), web site www.eia.gov/emeu/international. Projections: EIA, International NaturalGas Model (2010).
Figure 53. Non-OECD Europe and Eurasia net naturalgas trade, 2007-2035: 2007: EIA, International EnergyStatistics database (as of November 2009), web sitewww.eia.gov/emeu/international. Projections: EIA,International Natural Gas Model (2010).
Figure 54. Non-OECD Asia net natural gas trade,2007-2035: 2007: EIA, International Energy Statisticsdatabase (as of November 2009), web site www.eia.gov/emeu/international. Projections: EIA, InternationalNatural Gas Model (2010).
Figure 55. Middle East net natural gas trade, 2007-2035:2007: EIA, International Energy Statistics database (as ofNovember 2009), web site www.eia.gov/emeu/international. Projections: EIA, International NaturalGas Model (2010).
Figure 56. Africa net natural gas trade, 2007-2035: 2007:EIA, International Energy Statistics database (as ofNovember 2009), web site www.eia.gov/emeu/international. Projections: EIA, International NaturalGas Model (2010).
Figure 57. Non-OECD Central and South America netnatural gas trade, 2007-2035: 2007: EIA, InternationalEnergy Statistics database (as of November 2009), website www.eia.gov/emeu/international. Projections:EIA, International Natural Gas Model (2010).
Figure 58. World natural gas reserves by geographicregion as of January 1, 2010: “Worldwide Look atReserves and Production,” Oil & Gas Journal, Vol. 105,No. 48 (December 24, 2009), pp. 22-23.
Figure 59. World natural gas reserves by region,1980-2010: 1980-1993: “Worldwide Oil and Gas at aGlance,” International Petroleum Encyclopedia (Tulsa, OK:PennWell Publishing, various issues). 1994-2010: Oil &Gas Journal (various issues).
Table 7. World natural gas reserves by country as ofJanuary 1, 2010: “Worldwide Look at Reserves and Pro-duction,” Oil & Gas Journal, Vol. 105, No. 48 (December24, 2009), pp. 22-23.
Chapter 4. Coal
Figure 60. World coal consumption by country group-ing, 1980-2035: 1980-2007: EIA, International EnergyStatistics database (as of November 2009), web sitewww.eia.gov/emeu/international. Projections: EIA,World Energy Projection System Plus (2010).
Figure 61. Coal share of world energy consumption bysector, 2007, 2020, and 2035: 2007: Derived from EIA,International Energy Statistics database (as ofNovember 2009), web site www.eia.gov/emeu/international. Projections: EIA, World Energy Projec-tion System Plus (2010).
Figure 62. OECD coal consumption by region, 1980,2007, 2020, and 2035: 1980 and 2007: EIA, InternationalEnergy Statistics database (as of November 2009), website www.eia.gov/emeu/international. Projections:EIA, World Energy Projection System Plus (2010).
Figure 63. Non-OECD coal consumption by region,1980, 2007, 2020, and 2035: 1980 and 2007: EIA, Interna-tional Energy Statistics database (as of November 2009),web site www.eia.gov/emeu/international. Projec-tions: EIA, World Energy Projection System Plus (2010).
Figure 64. Coal consumption in China by sector, 2007,2020, and 2035: 2007: Derived from EIA, InternationalEnergy Statistics database (as of November 2009), website www.eia.gov/emeu/international. Projections:EIA, World Energy Projection System Plus (2010).
Table 8. World coal production by region, 2007-2035:2007: EIA, International Energy Statistics database (as ofNovember 2009), web site www.eia.gov/emeu/international. Projections: EIA, World Energy Projec-tion System Plus (2010) and EIA, IEO2010 NationalEnergy Modeling System run IEO2010.D050710A.
Table 9. World coal flows by importing and exportingregions, Reference case, 2008, 2020, and 2035: 2008: SSYConsultancy and Research, Ltd., SSY’s Coal Trade Fore-cast, Vol. 17, No. 4 (London, United Kingdom, June2009); and EIA, Quarterly Coal Report, October-December2008, DOE/EIA-0121(2008/4Q) (Washington, DC,March 2009). Projections: EIA, IEO2010 NationalEnergy Modeling System run IEO2010.D050710A.
Figure 65. Coal imports by major importing region,1995-2035: History: SSY Consultancy and Research,Ltd., SSY’s Coal Trade Forecast, Vol. 17, No. 4 (London,United Kingdom, June 2009), and previous issues; Inter-national Energy Agency, Coal Information 2009 (Paris,France, August 2009), and previous issues; and EIA,Quarterly Coal Report, October-December 2008, DOE/EIA-0121(2008/4Q) (Washington, DC, March 2009), and pre-vious issues; Btu conversions from short tons are esti-mates by EIA’s Office of Integrated Analysis andForecasting. Projections: EIA, IEO2010 National EnergyModeling System run IEO2010.D050710A.
138 U.S. Energy Information Administration / International Energy Outlook 2010

Figure 66. Coal imports to Asia by major importingregion, 2007 and 2035: 2007: EIA, Quarterly Coal Report,DOE/EIA-0121(2007/4Q) (December 2007); andderived from SSY Consultancy and Research, Ltd., SSY’sCoal Trade Forecast, Vol. 17, No. 1 (London, United King-dom, July 2008). 2035: EIA, IEO2010 National EnergyModeling System run IEO2010.D050710A.
Table 10. World recoverable coal reserves as of January1, 2008: Reserves: United States: EIA, unpublished datafrom Coal Reserves Database (March 2010). All OtherCountries: World Energy Council, Survey of EnergyResources: Interim Update 2009 (London, UK, June 2009).Production: EIA, International Energy Statistics Data-base (as of November 2009), web site www.eia.gov/emeu/international/contents.html.
Chapter 5. Electricity
Figure 67. Growth in world electric power generationand total energy consumption, 1990-2035: 1990-2007:EIA, International Energy Statistics database (as ofNovember 2009), web site www.eia.gov/emeu/international. Projections: EIA, World Energy Projec-tion System Plus (2010).
Figure 68. World net electricity generation by region,1990-2035: 1990-2007: EIA, International Energy Statis-tics database (as of November 2009), web site www.eia.gov/emeu/international. Projections: EIA, WorldEnergy Projection System Plus (2010).
Figure 69. Non-OECD net electricity generation byregion, 1990-2035: 1990-2007: EIA, International EnergyStatistics database (as of November 2009), web sitewww.eia.gov/emeu/international. Projections: EIA,World Energy Projection System Plus (2010).
Table 11. OECD and Non-OECD net electricty genera-tion by energy source, 2007-2035: 2007: Derived fromEIA, International Energy Statistics database (as ofNovember 2009), web site www.eia.gov/emeu/international. Projections: EIA, World Energy Projec-tion System Plus (2010).
Figure 70. World net electricity generation by fuel,2006-2030: 2007: Derived from EIA, International EnergyStatistics database (as of November 2009), web sitewww.eia.gov/emeu/international. Projections: EIA,World Energy Projection System Plus (2010).
Figure 71. World net electricity generation fromnuclear power by region, 2007-2030: 2007: EIA, Interna-tional Energy Statistics database (as of November 2009),web site www.eia.gov/emeu/international. Projec-tions: EIA, World Energy Projection System Plus (2010).
Table 12. OECD and Non-OECD net renewable elec-tricity generation by energy source, 2007-2035: 2007:
EIA, International Energy Statistics database (as ofNovember 2009), web site www.eia.gov/emeu/international. Projections: EIA, World Energy Projec-tion System Plus (2010).
Figure 72. Net electricity generation in North America,1990-2035: 1990-2007: EIA, International Energy Statis-tics database (as of November 2009), web site www.eia.gov/emeu/international. Projections: EIA, WorldEnergy Projection System Plus (2010).
Figure 73. Net electricity generation in North Americaby fuel, 2007 and 2035: 2007: Derived from EIA, Interna-tional Energy Statistics database (as of November 2009),web site www.eia.gov/emeu/international. 2035: EIA,World Energy Projection System Plus (2010).
Figure 74. Net electricity generation in OECD Europeby fuel, 2007-2035: 2007: Derived from EIA, Interna-tional Energy Statistics database (as of November 2009),web site www.eia.gov/emeu/international. Projec-tions: EIA, World Energy Projection System Plus (2010).
Figure 75. Net electricity generation in OECD Asia,2007-2035: 2007: EIA, International Energy Statisticsdatabase (as of November 2009), web site www.eia.gov/emeu/international. Projections: EIA, WorldEnergy Projection System Plus (2010).
Figure 76. Net electricity generation in Non-OECDEurope and Eurasia, 2007-2035: 2007: EIA, InternationalEnergy Statistics database (as of November 2009), website www.eia.gov/emeu/international. Projections:EIA, World Energy Projection System Plus (2010).
Figure 77. Net electricity generation in Non-OECDAsia by fuel, 2007-2035: 2007: Derived from EIA, Inter-national Energy Statistics database (as of November2009), web site www.eia.gov/emeu/international. Pro-jections: EIA, World Energy Projection System Plus(2010).
Figure 78. Net electricity generation in the Middle Eastby fuel, 2007-2035: 2007: Derived from EIA, Interna-tional Energy Statistics database (as of November 2009),web site www.eia.gov/emeu/international. Projec-tions: EIA, World Energy Projection System Plus (2010).
Figure 79. Net electricity generation in Africa by fuel,2007-2035: 2007: Derived from EIA, International EnergyStatistics database (as of November 2009), web sitewww.eia.gov/emeu/international. Projections: EIA,World Energy Projection System Plus (2010).
Figure 80. Net electricity generation in Brazil by fuel,2007-2035: 2007: Derived from EIA, International EnergyStatistics database (as of November 2009), web sitewww.eia.gov/emeu/international. Projections: EIA,World Energy Projection System Plus (2010).
U.S. Energy Information Administration / International Energy Outlook 2010 139

Figure 81. Net electricity generation in Other Centraland South America by fuel, 2007-2035: 2007: Derivedfrom EIA, International Energy Statistics database (as ofNovember 2009), web site www.eia.gov/emeu/international. Projections: EIA, World Energy Projec-tion System Plus (2010).
Chapter 6. Industrial Sector Energy Consumption
Table 13. World industrial energy consumption byregion and energy source, 2007-2035: 2007: EIA, Interna-tional Energy Statistics database (as of November 2009),web site www.eia.gov/emeu/international; and Inter-national Energy Agency, “Balances of OECD and Non-OECD Statistics” (2009), web site www.iea.org (sub-scription site). Projections: EIA, Annual Energy Outlook2010, DOE/EIA-0383(2010) (Washington, DC, April2010); AEO2010 National Energy Modeling System, runAEO2010R.D111809A, web site www.eia.gov/oiaf/aeo;and World Energy Projection System Plus (2010).
Figure 82. Annual changes in world industrial and allother end-use energy consumption from previousyear, 2006-2010: 2006-2007: Derived from EIA, Interna-tional Energy Statistics database (as of November 2009),web site www.eia.gov/emeu/international. 2008-2010:EIA, World Energy Projection System Plus (2010).
Figure 83. World delivered energy consumption in theindustrial and all other end-use sectors, 2005-2035:2005-2007: Derived from EIA, International EnergyStatistics database (as of November 2009), web sitewww.eia.gov/emeu/international. Projections: EIA,World Energy Projection System Plus (2010).
Figure 84. OECD and Non-OECD industrial sectorenergy consumption, 2007-2035: 2007: Derived fromEIA, International Energy Statistics database (as ofNovember 2009), web site www.eia.gov/emeu/international. Projections: EIA, World Energy Projec-tion System Plus (2010).
Figure 85. World industrial sector energy consumptionby fuel, 2007 and 2035: 2007: Derived from EIA, Interna-tional Energy Statistics database (as of November 2009),web site www.eia.gov/emeu/international. 2035: EIA,World Energy Projection System Plus (2010).
Figure 86. World industrial sector energy consumptionby major energy-intensive industry shares, 2007: Inter-national Energy Agency Data Services, World Energy Bal-ances (2009), web site www.iea.org (subscription site).
Figure 87. OECD and Non-OECD major steel produc-ers, 2008: World Steel Association, “World Steel in Fig-ures 2009” (October 2009), web site www.worldsteel.org.
Figure 88. OECD industrial sector energy consumptionby fuel, 2007 and 2035: 2007: Derived from EIA, Interna-tional Energy Statistics database (as of November 2009),
web site www.eia.gov/emeu/international. 2035: EIA,World Energy Projection System Plus (2010).
Figure 89. Non-OECD industrial sector energy con-sumption by fuel, 2007 and 2035: 2007: Derived fromEIA, International Energy Statistics database (as ofNovember 2009), web site www.eia.gov/emeu/international. 2035: EIA, World Energy Projection Sys-tem Plus (2010).
Figure 90. Industrial sector energy consumption inBrazil by energy source, IEO2009 and IEO2010 Refer-ence cases, 2006, 2020, and 2030: 2006: Derived fromEIA, Intenational Energy Statistics database (variousdates). Projections: EIA, International Energy Outlook2009, DOE/EIA-0484 (Washington, DC, May 2009) andEIA, World Energy Projection System Plus (2010).
Chapter 7. Transportation Sector EnergyConsumption
Figure 91. World liquids consumption by end-use sec-tor, 2007-2035: 2007: Derived from EIA, InternationalEnergy Statistics database (as of November 2009), website www.eia.gov/emeu/international. Projections:EIA, World Energy Projection System Plus (2010).
Figure 92. OECD and Non-OECD transportation sectorliquids consumption, 2007-2035: 2007: Derived fromEIA, International Energy Statistics database (as ofNovember 2009), web site www.eia.gov/emeu/international. Projections: EIA, World Energy Projec-tion System Plus (2010).
Table 14. World energy consumption for transporta-tion by country grouping, 2007-2035: 2007: Derivedfrom EIA, International Energy Statistics database (as ofNovember 2009), web site www.eia.gov/emeu/international. Projections: EIA, World Energy Projec-tion System Plus (2010).
Table 15. World energy consumption for passengertransportation by country grouping, 2007-2035: 2007:Derived from EIA, International Energy Statistics data-base (as of November 2009), web site www.eia.gov/emeu/international. Projections: EIA, World EnergyProjection System Plus (2010).
Table 16. World energy consumption for freighttransportation by country grouping, 2007-2035: 2007:Derived from EIA, International Energy Statistics data-base (as of November 2009), web site www.eia.gov/emeu/international. Projections: EIA, World EnergyProjection System Plus (2010).
Figure 93. OECD transportation energy use by region,2007, 2025, and 2035: 2007: Derived from EIA, Interna-tional Energy Statistics database (as of November 2009),web site www.eia.gov/emeu/international. Projec-tions: EIA, World Energy Projection System Plus (2010).
140 U.S. Energy Information Administration / International Energy Outlook 2010

Figure 94. North America transportation energy use bycountry, 2007 and 2035: 2007: Derived from EIA, Inter-national Energy Statistics database (as of November2009), web site www.eia.gov/emeu/international. 2035:EIA, Annual Energy Outlook 2010, DOE/EIA-0383 (2010)(Washington, DC, April 2010); and EIA, World EnergyProjection System Plus (2010).
Figure 95. OECD Europe transportation energy use,2007-2035: 2007: Derived from EIA, International EnergyStatistics database (as of November 2009), web sitewww.eia.gov/emeu/international. Projections: EIA,World Energy Projection System Plus (2010).
Table 17. Fleet renewal schemes in OECD Europe, 2009and 2010: European Automobile Manufacturers’ Associ-ation, “Fleet Renewal Schemes Can Soften the Impact ofthe Recession” (February 2010), web site www.acea.be/index.php/news/news_detail/fleet_renewal_schemes_soften_the_impact_of_the_recession/.
Figure 96. OECD Asia transportation energy use bycountry, 2007-2035: 2007: Derived from EIA, Interna-tional Energy Statistics database (as of November 2009),web site www.eia.gov/emeu/international. Projec-tions: EIA, World Energy Projection System Plus (2010).
Figure 97. Non-OECD transportation energy use byregion, 2007-2035: 2007: Derived from EIA, InternationalEnergy Statistics database (as of November 2009), website www.eia.gov/emeu/international. Projections:EIA, World Energy Projection System Plus (2010).
Figure 98. Non-OECD Asia transportation energy useby country, 2007-2035: 2007: Derived from EIA, Interna-tional Energy Statistics database (as of November 2009),web site www.eia.gov/emeu/international. Projec-tions: EIA, World Energy Projection System Plus (2010).
Figure 99. Transportation energy use per capita inChina and South Korea, 2007-2035: 2007: Derived fromEIA, International Energy Statistics database (as ofNovember 2009), web site www.eia.gov/emeu/international. Projections: EIA, World Energy Projec-tion System Plus (2010).
Figure 100. Middle East transportation energy use,2007-2035: 2007: Derived from EIA, International EnergyStatistics database (as of November 2009), web sitewww.eia.gov/emeu/international. Projections: EIA,World Energy Projection System Plus (2010).
Figure 101. Central and South America transportationenergy use by country, 2007 and 2035: 2007: Derivedfrom EIA, International Energy Statistics database (as ofNovember 2009), web site www.eia.gov/emeu/international. 2035: EIA, World Energy Projection Sys-tem Plus (2010).
Figure 102. Non-OECD Europe and Eurasia transporta-tion energy use by country, 2007-2035: 2007: Derivedfrom EIA, International Energy Statistics database (as ofNovember 2009), web site www.eia.gov/emeu/international. Projections: EIA, World Energy Projec-tion System Plus (2010).
Chapter 8. Energy-Related Carbon DioxideEmissions
Figure 103. World energy-related carbon dioxide emis-sions, 2007-2035: 2007: EIA, International Energy Statis-tics database (as of November 2009), web site www.eia.gov/emeu/international. Projections: EIA, WorldEnergy Projection System Plus (2010).
Figure 104. World energy-related carbon dioxide emis-sions by fuel type, 1990-2035: 1990-2007: EIA, Interna-tional Energy Statistics database (as of November 2009),web site www.eia.gov/emeu/international. Projec-tions: EIA, World Energy Projection System Plus (2010).
Table 18. World energy-related carbon dioxide emis-sions by region, 1990-2035: 1990 and 2007: EIA, Interna-tional Energy Statistics database (as of November 2009),web site www.eia.gov/emeu/international. Projec-tions: EIA, World Energy Projection System Plus (2010).
Table 19. Emissions mitigation goals announced byselected countries: Reduction goals: United NationsFramework Convention on Climate Change, NationalReports, Appendix I—Quantified Economy-Wide Emis-sions Targets for 2020, web site http://unfccc.int/home/items/5264.php, and Appendix II—NationallyAppropriate Mitigation Actions of Developing CountryParties, web site http://unfccc.int/home/items/5265.php. 2007 emissions: EIA, International Energy Statisticsdatabase (as of November 2009), web site www.eia.gov/emeu/international. Goal year projected carbon dioxideemissions: EIA, World Energy Projection System Plus(2010).
Figure 105. U.S. energy-related carbon dioxide emis-sions by fuel in IEO2009 and IEO2010, 2007, 2015, and2030: EIA, Annual Energy Outlook 2009, DOE/EIA-0383(2009) (Washington, DC, June 2009), and EIA, AnnualEnergy Outlook 2010, DOE/EIA-0383(2010) (Washing-ton, DC, April 2010).
Figure 106. Average annual growth in energy-relatedcarbon dioxide emissions in OECD economies, 2007-2035: EIA, World Energy Projection System Plus (2010).
Figure 107. Average annual growth in energy-relatedcarbon dioxide emissions in Non-OECD economies,2007-2035: EIA, World Energy Projection System Plus(2010).
U.S. Energy Information Administration / International Energy Outlook 2010 141
Figure 108. World carbon dioxide emissions fromliquids combustion, 1990-2035: 1990-2007: EIA, Interna-tional Energy Statistics database (as of November 2009),web site www.eia.gov/emeu/international. Projec-tions: EIA, World Energy Projection System Plus (2010).
Figure 109. World carbon dioxide emissions from natu-ral gas combustion, 1990-2035: 1990-2007: EIA, Interna-tional Energy Statistics database (as of November 2009),web site www.eia.gov/emeu/international. Projec-tions: EIA, World Energy Projection System Plus (2010).
Figure 110. World carbon dioxide emissions from coalcombustion, 1990-2035: 1990-2007: EIA, InternationalEnergy Statistics database (as of November 2009), website www.eia.gov/emeu/international. Projections:EIA, World Energy Projection System Plus (2010).
Table 20. Kaya component values by region and coun-try, 1990-2035: History: Derived from EIA, InternationalEnergy Statistics database (as of November 2009), website www.eia.gov/emeu/international. Projections:EIA, World Energy Projection System Plus (2010). Popu-lation (history and projections): United States: EIA,Annual Energy Outlook 2010, DOE/EIA-0383(2010)(Washington, DC, April 2010), AEO2010 NationalEnergy Modeling System, run AEO2010R.D111809A,web site www.eia.gov/oiaf/aeo. Other Countries: IHSGlobal Insight, World Overview (Lexington, MA, variousissues).
Table 21. Energy-related carbon dioxide emissions percapita by region and country, 1990-2035: History:Derived from EIA, International Energy Statistics data-base (as of November 2009), web site www.eia.gov/emeu/international. Projections: EIA, World EnergyProjection System Plus (2010).
Figure 111. World carbon dioxide emissions per capita,1990-2035: 1990-2007: Derived from EIA, InternationalEnergy Statistics database (as of November 2009), website www.eia.gov/emeu/international. Projections:EIA, World Energy Projection System Plus (2010).
Figure 112. Non-OECD carbon dioxide emissions percapita by country and region, 1990-2035: 1990-2007:Derived from EIA, International Energy Statistics data-base (as of November 2009), web site www.eia.gov/emeu/international. Projections: EIA, World EnergyProjection System Plus (2010).
Figure 113. OECD carbon dioxide emissions per capitaby country and region, 1990-2035: 1990-2007: Derivedfrom EIA, International Energy Statistics database (as ofNovember 2009), web site www.eia.gov/emeu/international. Projections: EIA, World Energy Projec-tion System Plus (2010).
Figure 114. Carbon dioxide emissions in three Eco-nomic Growth cases, 2007 and 2035: 2007: EIA, Interna-tional Energy Statistics database (as of November 2009),web site www.eia.gov/emeu/international. 2035: EIA,World Energy Projection System Plus (2010).
142 U.S. Energy Information Administration / International Energy Outlook 2010

Appendix A
Reference Case Projections:• World energy consumption• Gross domestic product• Carbon dioxide emissions• World population

This page intentionally left blank.

Table A1. World total primary energy consumption by region, Reference case, 2005-2035(Quadrillion Btu)
Reference case projections
U.S. Energy Information Administration / International Energy Outlook 2010 145
Region/Country
History Projections Average annualpercent change,
2007-20352005 2006 2007 2015 2020 2025 2030 2035
OECDOECD North America . . . . . . . . . . . 122.4 121.8 123.7 124.3 129.4 134.9 140.2 146.3 0.6United Statesa. . . . . . . . . . . . . . . . . 100.5 99.8 101.7 101.6 105.0 108.3 111.2 114.5 0.4Canada . . . . . . . . . . . . . . . . . . . . . . 14.8 14.5 14.3 14.6 15.4 16.3 17.2 18.2 0.9Mexico. . . . . . . . . . . . . . . . . . . . . . . 7.1 7.4 7.7 8.1 9.0 10.4 11.8 13.5 2.0
OECD Europe . . . . . . . . . . . . . . . . . 82.4 82.9 82.3 82.0 83.0 85.0 86.5 88.2 0.2OECD Asia . . . . . . . . . . . . . . . . . . . . 39.0 39.5 39.7 39.7 41.8 43.3 44.8 46.3 0.5Japan . . . . . . . . . . . . . . . . . . . . . . . 23.1 23.3 22.8 21.1 21.9 22.1 22.1 22.2 -0.1South Korea . . . . . . . . . . . . . . . . . . 9.3 9.4 9.7 10.6 11.7 12.7 13.8 14.9 1.5Australia/New Zealand . . . . . . . . . . 6.6 6.7 7.2 8.0 8.2 8.5 8.9 9.2 0.9Total OECD . . . . . . . . . . . . . . . . . 243.8 244.1 245.7 246.0 254.2 263.2 271.4 280.7 0.5
Non-OECDNon-OECD Europe and Eurasia. . . 50.4 51.0 51.5 52.4 54.2 56.2 57.8 60.2 0.6Russia . . . . . . . . . . . . . . . . . . . . . . . 29.7 30.5 30.5 30.7 31.6 32.8 33.9 35.5 0.5Other . . . . . . . . . . . . . . . . . . . . . . . . 20.7 20.6 21.0 21.7 22.5 23.3 23.9 24.7 0.6
Non-OECD Asia. . . . . . . . . . . . . . . . 112.6 119.6 127.1 159.3 187.8 217.0 246.9 277.3 2.8China. . . . . . . . . . . . . . . . . . . . . . . . 68.4 73.0 78.0 101.4 121.4 142.4 162.7 181.9 3.1India . . . . . . . . . . . . . . . . . . . . . . . . 17.5 18.8 20.3 24.3 28.2 31.1 34.1 37.6 2.2Other Non-OECD Asia . . . . . . . . . . 26.7 27.8 28.8 33.7 38.2 43.5 50.2 57.8 2.5
Middle East . . . . . . . . . . . . . . . . . . . 22.8 23.9 25.1 32.9 36.5 39.1 41.8 45.7 2.2Africa . . . . . . . . . . . . . . . . . . . . . . . . 17.2 17.3 17.8 20.8 22.5 24.6 26.5 29.0 1.8Central and South America . . . . . . 26.0 27.1 28.0 32.1 35.5 38.7 42.2 45.7 1.8Brazil . . . . . . . . . . . . . . . . . . . . . . . . 11.2 11.7 12.3 14.9 16.9 19.3 21.9 24.3 2.4Other Central and South America. . 14.8 15.4 15.7 17.2 18.6 19.3 20.3 21.4 1.1Total Non-OECD . . . . . . . . . . . . . 229.0 239.0 249.5 297.5 336.3 375.5 415.2 458.0 2.2
Total World . . . . . . . . . . . . . . . . . . . . 472.7 483.1 495.2 543.5 590.5 638.7 686.5 738.7 1.4aIncludes the 50 States and the District of Columbia.Notes: Energy totals include net imports of coal coke and electricity generated from biomass in the United States. Totals may not
equal sum of components due to independent rounding. The electricity portion of the national fuel consumption values consists ofgeneration for domestic use plus an adjustment for electricity trade based on a fuel’s share of total generation in the exporting coun-try.
Sources: History: U.S. Energy Information Administration (EIA), International Energy Statistics database (as of November 2009),web site www.eia.gov/emeu/international; and International Energy Agency, “Balances of OECD and Non-OECD Statistics” (2009),web site www.iea.org (subscription site). Projections: EIA, Annual Energy Outlook 2010, DOE/EIA-0383(2010) (Washington, DC,April 2010), AEO2010 National Energy Modeling System, run AEO2010R.D111809A, web site www.eia.gov/oiaf/aeo; and WorldEnergy Projection System Plus (2010).

Table A2. World total energy consumption by region and fuel, Reference case, 2005-2035(Quadrillion Btu)
Appendix A
146 U.S. Energy Information Administration / International Energy Outlook 2010
Region/Country
History Projections Average annualpercent change,
2007-20352005 2006 2007 2015 2020 2025 2030 2035
OECDOECD North AmericaLiquids . . . . . . . . . . . . . . . . . . . . . 49.5 49.0 49.4 47.5 48.1 49.4 50.9 52.5 0.2Natural gas. . . . . . . . . . . . . . . . . . 28.1 28.1 29.2 28.3 30.1 32.2 34.0 35.8 0.7Coal . . . . . . . . . . . . . . . . . . . . . . . 24.7 24.3 24.6 23.8 24.4 25.0 25.8 26.9 0.3Nuclear. . . . . . . . . . . . . . . . . . . . . 9.2 9.4 9.6 10.1 10.8 10.9 11.0 11.3 0.6Other . . . . . . . . . . . . . . . . . . . . . . 10.9 11.1 11.0 14.6 16.0 17.4 18.4 19.8 2.1Total. . . . . . . . . . . . . . . . . . . . . . 122.4 121.8 123.7 124.3 129.4 134.9 140.2 146.3 0.6
OECD EuropeLiquids . . . . . . . . . . . . . . . . . . . . . 32.3 32.4 31.6 29.0 27.7 27.7 28.0 28.3 -0.4Natural gas. . . . . . . . . . . . . . . . . . 19.7 19.7 19.8 20.8 21.7 22.1 22.2 22.6 0.5Coal . . . . . . . . . . . . . . . . . . . . . . . 12.7 13.1 13.2 11.5 11.2 10.9 10.8 11.0 -0.6Nuclear. . . . . . . . . . . . . . . . . . . . . 9.7 9.6 9.1 9.7 10.0 10.5 10.9 11.2 0.8Other . . . . . . . . . . . . . . . . . . . . . . 7.9 8.1 8.7 11.0 12.4 13.8 14.5 15.1 2.0Total. . . . . . . . . . . . . . . . . . . . . . 82.4 82.9 82.3 82.0 83.0 85.0 86.5 88.2 0.2
OECD AsiaLiquids . . . . . . . . . . . . . . . . . . . . . 17.5 17.2 16.9 15.6 16.1 16.5 16.7 17.0 0.0Natural gas. . . . . . . . . . . . . . . . . . 5.9 6.3 6.7 7.4 7.7 8.2 8.3 8.5 0.8Coal . . . . . . . . . . . . . . . . . . . . . . . 9.2 9.3 10.1 9.2 9.2 9.5 9.8 10.4 0.1Nuclear. . . . . . . . . . . . . . . . . . . . . 4.3 4.3 3.9 4.9 5.7 6.0 6.5 7.0 2.1Other . . . . . . . . . . . . . . . . . . . . . . 2.1 2.2 2.1 2.6 3.0 3.2 3.3 3.5 1.7Total. . . . . . . . . . . . . . . . . . . . . . 39.0 39.5 39.7 39.7 41.8 43.3 44.8 46.3 0.5
Total OECDLiquids . . . . . . . . . . . . . . . . . . . . . 99.3 98.6 97.9 92.1 92.0 93.5 95.6 97.7 0.0Natural gas. . . . . . . . . . . . . . . . . . 53.7 54.1 55.6 56.5 59.5 62.6 64.6 66.8 0.7Coal . . . . . . . . . . . . . . . . . . . . . . . 46.7 46.7 47.9 44.5 44.8 45.4 46.4 48.3 0.0Nuclear. . . . . . . . . . . . . . . . . . . . . 23.2 23.3 22.6 24.7 26.5 27.4 28.5 29.5 1.0Other . . . . . . . . . . . . . . . . . . . . . . 20.9 21.4 21.7 28.2 31.4 34.3 36.3 38.3 2.0Total. . . . . . . . . . . . . . . . . . . . . . 243.8 244.1 245.7 246.0 254.2 263.2 271.4 280.7 0.5
Non-OECDNon-OECD Europe and EurasiaLiquids . . . . . . . . . . . . . . . . . . . . . 10.1 10.3 10.4 10.1 10.0 10.2 10.5 11.0 0.2Natural gas. . . . . . . . . . . . . . . . . . 25.8 25.8 26.3 27.3 28.0 28.6 28.7 29.0 0.3Coal . . . . . . . . . . . . . . . . . . . . . . . 8.4 8.8 8.7 8.0 7.9 8.0 8.5 9.4 0.3Nuclear. . . . . . . . . . . . . . . . . . . . . 2.9 2.9 3.0 3.7 4.6 5.5 5.8 6.3 2.7Other . . . . . . . . . . . . . . . . . . . . . . 3.2 3.2 3.1 3.3 3.6 3.8 4.1 4.5 1.4Total. . . . . . . . . . . . . . . . . . . . . . 50.4 51.0 51.5 52.4 54.2 56.2 57.8 60.2 0.6
Non-OECD AsiaLiquids . . . . . . . . . . . . . . . . . . . . . 31.7 33.4 34.6 41.5 46.9 53.4 60.0 66.5 2.4Natural gas. . . . . . . . . . . . . . . . . . 8.6 9.8 10.8 17.2 20.9 24.0 26.2 28.2 3.5Coal . . . . . . . . . . . . . . . . . . . . . . . 61.9 65.4 70.3 81.2 93.9 108.2 123.7 140.3 2.5Nuclear. . . . . . . . . . . . . . . . . . . . . 1.1 1.1 1.2 3.2 5.6 7.2 8.5 9.8 7.7Other . . . . . . . . . . . . . . . . . . . . . . 9.3 9.9 10.2 16.2 20.4 24.2 28.5 32.5 4.2Total. . . . . . . . . . . . . . . . . . . . . . 112.6 119.6 127.1 159.3 187.8 217.0 246.9 277.3 2.8
See notes at end of table.

Table A2. World total energy consumption by region and fuel, Reference case, 2005-2035 (continued)(Quadrillion Btu)
Reference case projections
U.S. Energy Information Administration / International Energy Outlook 2010 147
Region/Country
History Projections Average annualpercent change,
2007-20352005 2006 2007 2015 2020 2025 2030 2035
Non-OECD (continued)Middle EastLiquids . . . . . . . . . . . . . . . . . . . . . 12.0 12.5 13.3 15.0 16.1 17.7 19.7 22.7 1.9Natural gas. . . . . . . . . . . . . . . . . . 10.2 10.8 11.2 17.0 19.3 20.2 20.7 21.5 2.4Coal . . . . . . . . . . . . . . . . . . . . . . . 0.4 0.4 0.4 0.4 0.3 0.3 0.3 0.4 -0.2Nuclear. . . . . . . . . . . . . . . . . . . . . 0.0 0.0 0.0 0.1 0.2 0.3 0.4 0.5 —Other . . . . . . . . . . . . . . . . . . . . . . 0.3 0.3 0.3 0.4 0.5 0.5 0.6 0.6 3.1Total. . . . . . . . . . . . . . . . . . . . . . 22.8 23.9 25.1 32.9 36.5 39.1 41.8 45.7 2.2
AfricaLiquids . . . . . . . . . . . . . . . . . . . . . 6.1 6.2 6.4 7.2 7.4 8.0 8.7 9.4 1.4Natural gas. . . . . . . . . . . . . . . . . . 3.2 3.1 3.3 5.1 6.1 6.9 7.1 7.4 2.9Coal . . . . . . . . . . . . . . . . . . . . . . . 4.2 4.2 4.2 4.2 4.3 4.7 5.3 6.2 1.4Nuclear. . . . . . . . . . . . . . . . . . . . . 0.1 0.1 0.1 0.2 0.2 0.2 0.2 0.3 3.6Other . . . . . . . . . . . . . . . . . . . . . . 3.6 3.6 3.7 4.2 4.5 4.9 5.3 5.8 1.6Total. . . . . . . . . . . . . . . . . . . . . . 17.2 17.3 17.8 20.8 22.5 24.6 26.5 29.0 1.8
Central and South AmericaLiquids . . . . . . . . . . . . . . . . . . . . . 11.3 11.8 12.2 13.4 13.6 14.4 15.4 16.3 1.0Natural gas. . . . . . . . . . . . . . . . . . 4.7 4.8 4.9 6.0 7.4 8.0 8.4 9.1 2.3Coal . . . . . . . . . . . . . . . . . . . . . . . 0.8 0.9 0.9 0.9 1.0 1.2 1.4 1.7 2.1Nuclear. . . . . . . . . . . . . . . . . . . . . 0.2 0.2 0.2 0.3 0.4 0.5 0.5 0.7 4.2Other . . . . . . . . . . . . . . . . . . . . . . 9.0 9.4 9.8 11.4 13.0 14.6 16.5 17.9 2.2Total. . . . . . . . . . . . . . . . . . . . . . 26.0 27.1 28.0 32.1 35.5 38.7 42.2 45.7 1.8
Total Non-OECDLiquids . . . . . . . . . . . . . . . . . . . . . 71.1 74.2 76.8 87.3 94.1 103.7 114.4 125.9 1.8Natural gas. . . . . . . . . . . . . . . . . . 52.5 54.2 56.5 72.6 81.7 87.7 91.2 95.2 1.9Coal . . . . . . . . . . . . . . . . . . . . . . . 75.7 79.7 84.6 94.6 107.6 122.4 139.2 157.9 2.3Nuclear. . . . . . . . . . . . . . . . . . . . . 4.3 4.4 4.5 7.5 10.9 13.7 15.4 17.5 4.9Other . . . . . . . . . . . . . . . . . . . . . . 25.3 26.5 27.1 35.6 42.0 48.1 55.0 61.4 3.0Total. . . . . . . . . . . . . . . . . . . . . . 229.0 239.0 249.5 297.5 336.3 375.5 415.2 458.0 2.2
Total WorldLiquids . . . . . . . . . . . . . . . . . . . . . 170.4 172.8 174.7 179.3 186.0 197.2 210.0 223.6 0.9Natural gas. . . . . . . . . . . . . . . . . . 106.3 108.3 112.1 129.1 141.2 150.2 155.8 162.0 1.3Coal . . . . . . . . . . . . . . . . . . . . . . . 122.3 126.4 132.4 139.1 152.4 167.8 185.6 206.3 1.6Nuclear. . . . . . . . . . . . . . . . . . . . . 27.5 27.8 27.1 32.2 37.4 41.1 43.9 47.1 2.0Other . . . . . . . . . . . . . . . . . . . . . . 46.2 47.9 48.8 63.8 73.4 82.4 91.2 99.8 2.6Total. . . . . . . . . . . . . . . . . . . . . . 472.7 483.1 495.2 543.5 590.5 638.7 686.5 738.7 1.4
Notes: Energy totals include net imports of coal coke and electricity generated from biomass in the United States. Totals may notequal sum of components due to independent rounding. The electricity portion of the national fuel consumption values consists ofgeneration for domestic use plus an adjustment for electricity trade based on a fuel’s share of total generation in the exporting coun-try.
Sources: History: U.S. Energy Information Administration (EIA), International Energy Statistics database (as of November 2009),web site www.eia.gov/emeu/international; and International Energy Agency, “Balances of OECD and Non-OECD Statistics” (2009),web site www.iea.org (subscription site). Projections: EIA, Annual Energy Outlook 2010, DOE/EIA-0383(2010) (Washington, DC,April 2010), AEO2010 National Energy Modeling System, run AEO2010R.D111809A, web site www.eia.gov/oiaf/aeo; and WorldEnergy Projection System Plus (2010).

Table A3. World gross domestic product (GDP) by region expressed in purchasing power parity,Reference case, 2005-2035(Billion 2005 dollars)
Appendix A
148 U.S. Energy Information Administration / International Energy Outlook 2010
Region/Country
History Projections Average annualpercent change,
2007-20352005 2006 2007 2015 2020 2025 2030 2035
OECDOECD North America . . . . . . . . . . . 14,883 15,327 15,662 18,081 21,023 24,072 27,445 31,142 2.5United Statesa. . . . . . . . . . . . . . . . . 12,422 12,768 13,027 15,022 17,427 19,851 22,475 25,278 2.4Canada . . . . . . . . . . . . . . . . . . . . . . 1,167 1,200 1,231 1,436 1,606 1,779 1,975 2,192 2.1Mexico. . . . . . . . . . . . . . . . . . . . . . . 1,293 1,359 1,405 1,624 1,990 2,442 2,994 3,672 3.5
OECD Europe . . . . . . . . . . . . . . . . . 13,928 14,412 14,849 16,208 18,035 19,864 21,771 23,807 1.7OECD Asia . . . . . . . . . . . . . . . . . . . . 5,535 5,681 5,850 6,530 7,089 7,557 8,044 8,531 1.4
Japan . . . . . . . . . . . . . . . . . . . . . . . 3,872 3,951 4,041 4,258 4,437 4,520 4,601 4,665 0.5South Korea . . . . . . . . . . . . . . . . . . 892 938 986 1,263 1,494 1,725 1,958 2,189 2.9Australia/New Zealand . . . . . . . . . . 771 792 823 1,009 1,157 1,311 1,485 1,677 2.6Total OECD . . . . . . . . . . . . . . . . . 34,345 35,420 36,361 40,819 46,146 51,492 57,260 63,480 2.0
Non-OECDNon-OECD Europe and Eurasia. . . 2,977 3,218 3,481 4,193 4,940 5,731 6,557 7,440 2.7Russia . . . . . . . . . . . . . . . . . . . . . . . 1,703 1,834 1,982 2,349 2,751 3,202 3,685 4,222 2.7Other . . . . . . . . . . . . . . . . . . . . . . . . 1,275 1,384 1,499 1,844 2,189 2,529 2,872 3,218 2.8
Non-OECD Asia. . . . . . . . . . . . . . . . 11,897 13,013 14,323 24,055 31,832 40,307 49,366 59,023 5.2China. . . . . . . . . . . . . . . . . . . . . . . . 5,408 6,035 6,820 12,732 17,353 22,446 27,596 32,755 5.8India . . . . . . . . . . . . . . . . . . . . . . . . 2,440 2,676 2,918 4,847 6,342 7,833 9,529 11,454 5.0Other Non-OECD Asia . . . . . . . . . . 4,049 4,302 4,585 6,476 8,137 10,028 12,241 14,814 4.3
Middle East . . . . . . . . . . . . . . . . . . . 1,985 2,145 2,261 3,071 3,742 4,473 5,336 6,328 3.7Africa . . . . . . . . . . . . . . . . . . . . . . . . 2,360 2,494 2,638 3,639 4,406 5,221 6,102 7,094 3.6Central and South America . . . . . . 3,612 3,822 4,066 5,343 6,366 7,516 8,818 10,294 3.4Brazil . . . . . . . . . . . . . . . . . . . . . . . . 1,534 1,595 1,685 2,350 2,877 3,505 4,250 5,126 4.1Other Central and South America. . 2,079 2,227 2,381 2,993 3,489 4,011 4,568 5,168 2.8Total Non-OECD . . . . . . . . . . . . . 22,832 24,692 26,769 40,301 51,286 63,247 76,179 90,179 4.4
Total World . . . . . . . . . . . . . . . . . . . . 57,177 60,112 63,130 81,120 97,433 114,740 133,439 153,658 3.2aIncludes the 50 States and the District of Columbia.Notes: Totals may not equal sum of components due to independent rounding. GDP growth rates for non-OECD Europe and Eur-
asia (excluding Russia), China, India, Africa, and Central and South America (excluding Brazil) were adjusted, based on the ana-lyst’s judgment.
Sources: History: IHS Global Insight, World Overview (Lexington, MA, various issues). Projections: IHS Global Insight, WorldOverview, Third Quarter 2009 (Lexington, MA, November 2009); and U.S. Energy Information Administration (EIA), Annual EnergyOutlook 2010, DOE/EIA-0383(2010) (Washington, DC, April 2010), AEO2010 National Energy Modeling System, run AEO2010R.D111809A, web site www.eia.gov/ oiaf/aeo.

Table A4. World gross domestic product (GDP) by region expressed in market exchange rates,Reference case, 2005-2035(Billion 2005 dollars)
Reference case projections
U.S. Energy Information Administration / International Energy Outlook 2010 149
Region/Country
History Projections Average annualpercent change,
2007-20352005 2006 2007 2015 2020 2025 2030 2035
OECDOECD North America . . . . . . . . . . . 14,406 14,827 15,145 17,483 20,294 23,183 26,361 29,819 2.4United Statesa. . . . . . . . . . . . . . . . . 12,422 12,768 13,027 15,022 17,427 19,851 22,475 25,278 2.4Canada . . . . . . . . . . . . . . . . . . . . . . 1,134 1,166 1,196 1,395 1,561 1,729 1,920 2,130 2.1Mexico. . . . . . . . . . . . . . . . . . . . . . . 849 893 922 1,066 1,307 1,603 1,966 2,411 3.5
OECD Europe . . . . . . . . . . . . . . . . . 14,672 15,157 15,594 16,889 18,665 20,453 22,319 24,306 1.6OECD Asia . . . . . . . . . . . . . . . . . . . . 6,222 6,382 6,567 7,282 7,870 8,351 8,852 9,350 1.3Japan . . . . . . . . . . . . . . . . . . . . . . . 4,557 4,649 4,755 5,011 5,222 5,320 5,415 5,490 0.5South Korea . . . . . . . . . . . . . . . . . . 845 888 934 1,197 1,415 1,634 1,854 2,073 2.9Australia/New Zealand . . . . . . . . . . 821 844 877 1,075 1,233 1,397 1,582 1,787 2.6Total OECD . . . . . . . . . . . . . . . . . 35,301 36,366 37,306 41,655 44,019 49,098 57,532 63,475 1.9
Non-OECDNon-OECD Europe and Eurasia. . . 1,348 1,456 1,573 1,890 2,225 2,578 2,946 3,340 2.7Russia . . . . . . . . . . . . . . . . . . . . . . . 764 823 889 1,053 1,234 1,436 1,653 1,894 2.7Other . . . . . . . . . . . . . . . . . . . . . . . . 584 633 684 837 991 1,142 1,293 1,447 2.7
Non-OECD Asia. . . . . . . . . . . . . . . . 4,751 5,190 5,710 9,526 12,573 15,886 19,402 23,123 5.1China. . . . . . . . . . . . . . . . . . . . . . . . 2,244 2,504 2,830 5,283 7,200 9,313 11,450 13,591 5.8India . . . . . . . . . . . . . . . . . . . . . . . . 813 892 973 1,616 2,114 2,611 3,176 3,818 5.0Other Non-OECD Asia . . . . . . . . . . 1,693 1,794 1,908 2,628 3,259 3,962 4,776 5,714 4.0
Middle East . . . . . . . . . . . . . . . . . . . 1,079 1,162 1,224 1,685 2,054 2,454 2,924 3,463 3.8Africa . . . . . . . . . . . . . . . . . . . . . . . . 983 1,039 1,100 1,493 1,813 2,160 2,541 2,978 3.6Central and South America . . . . . . 1,956 2,067 2,194 2,887 3,457 4,101 4,836 5,678 3.5Brazil . . . . . . . . . . . . . . . . . . . . . . . . 882 917 969 1,351 1,654 2,015 2,443 2,947 4.1Other Central and South America. . 1,075 1,150 1,226 1,537 1,803 2,085 2,393 2,731 2.9Total Non-OECD . . . . . . . . . . . . . 10,117 10,914 11,801 17,482 22,121 27,179 32,650 38,582 4.3
Total World . . . . . . . . . . . . . . . . . . . . 45,417 47,280 49,106 59,136 66,140 76,277 90,181 102,057 2.6aIncludes the 50 States and the District of Columbia.Notes: Totals may not equal sum of components due to independent rounding. GDP growth rates for non-OECD Europe and Eur-
asia (excluding Russia), China, India, Africa, and Central and South America (excluding Brazil) were adjusted, based on the ana-lyst’s judgment.
Sources: History: IHS Global Insight, World Overview (Lexington, MA, various issues). Projections: IHS Global Insight, WorldOverview, Third Quarter 2009 (Lexington, MA, November 2009); and U.S. Energy Information Administration (EIA), Annual EnergyOutlook 2010, DOE/EIA-0383(2010) (Washington, DC, April 2010), Table A19.

Table A5. World liquids consumption by region, Reference case, 2005-2035(Million barrels per day)
Appendix A
150 U.S. Energy Information Administration / International Energy Outlook 2010
Region/Country
History Projections Average annualpercent change,
2007-20352005 2006 2007 2015 2020 2025 2030 2035
OECDOECD North America . . . . . . . . . . . 25.2 25.0 25.1 24.6 25.0 25.7 26.4 27.4 0.3United Statesa. . . . . . . . . . . . . . . . . 20.8 20.7 20.6 20.2 20.6 21.0 21.5 22.1 0.2Canada . . . . . . . . . . . . . . . . . . . . . . 2.3 2.3 2.3 2.2 2.2 2.2 2.3 2.4 0.1Mexico. . . . . . . . . . . . . . . . . . . . . . . 2.1 2.1 2.1 2.2 2.3 2.4 2.7 2.9 1.1
OECD Europe . . . . . . . . . . . . . . . . . 15.7 15.7 15.3 14.0 13.4 13.4 13.6 13.7 -0.4OECD Asia . . . . . . . . . . . . . . . . . . . . 8.6 8.5 8.4 7.7 8.0 8.1 8.3 8.4 0.0Japan . . . . . . . . . . . . . . . . . . . . . . . 5.3 5.2 5.0 4.2 4.3 4.3 4.2 4.1 -0.7South Korea . . . . . . . . . . . . . . . . . . 2.2 2.2 2.2 2.4 2.5 2.7 2.9 3.1 1.1Australia/New Zealand . . . . . . . . . . 1.1 1.1 1.1 1.1 1.1 1.1 1.2 1.2 0.4Total OECD . . . . . . . . . . . . . . . . . 49.5 49.1 48.8 46.3 46.4 47.2 48.3 49.5 0.0
Non-OECDNon-OECD Europe and Eurasia. . . 4.9 5.0 5.1 4.9 4.9 5.0 5.1 5.4 0.2Russia . . . . . . . . . . . . . . . . . . . . . . . 2.8 2.9 2.9 2.8 2.7 2.7 2.7 2.8 0.0Other . . . . . . . . . . . . . . . . . . . . . . . . 2.1 2.2 2.2 2.1 2.2 2.3 2.4 2.5 0.5
Non-OECD Asia. . . . . . . . . . . . . . . . 15.4 16.2 16.8 20.1 22.7 25.9 29.1 32.3 2.4China. . . . . . . . . . . . . . . . . . . . . . . . 6.7 7.3 7.6 10.0 11.6 13.5 15.3 16.9 2.9India . . . . . . . . . . . . . . . . . . . . . . . . 2.5 2.7 2.8 3.2 3.6 3.9 4.3 4.7 1.8Other Non-OECD Asia . . . . . . . . . . 6.2 6.2 6.3 6.9 7.6 8.5 9.5 10.7 1.9
Middle East . . . . . . . . . . . . . . . . . . . 5.8 6.0 6.4 7.2 7.8 8.5 9.5 11.0 1.9Africa . . . . . . . . . . . . . . . . . . . . . . . . 3.0 3.0 3.1 3.5 3.6 3.9 4.2 4.6 1.4Central and South America . . . . . . 5.5 5.8 6.0 6.6 6.7 7.0 7.5 8.0 1.0Brazil . . . . . . . . . . . . . . . . . . . . . . . . 2.2 2.3 2.4 2.8 3.0 3.3 3.6 4.0 1.9Other Central and South America. . 3.3 3.5 3.6 3.7 3.7 3.8 3.9 4.0 0.4Total Non-OECD . . . . . . . . . . . . . 34.6 36.1 37.3 42.4 45.7 50.4 55.6 61.1 1.8
Total World . . . . . . . . . . . . . . . . . . . . 84.0 85.2 86.1 88.7 92.1 97.6 103.9 110.6 0.9aIncludes the 50 States and the District of Columbia.Note: Totals may not equal sum of components due to independent rounding.Sources: History: U.S. Energy Information Administration (EIA), International Energy Statistics database (as of November 2009),
web site www.eia.gov/emeu/international. Projections: EIA, Annual Energy Outlook 2010, DOE/EIA-0383(2010) (Washington, DC,April 2010), AEO2010 National Energy Modeling System, run AEO2010R.D111809A, web site www.eia.gov/oiaf/aeo; and WorldEnergy Projection System Plus (2010).

Table A6. World natural gas consumption by region, Reference case, 2005-2035(Trillion cubic feet)
Reference case projections
U.S. Energy Information Administration / International Energy Outlook 2010 151
Region/Country
History Projections Average annualpercent change,
2007-20352005 2006 2007 2015 2020 2025 2030 2035
OECDOECD North America . . . . . . . . . . . 27.3 27.2 28.3 27.4 29.2 31.2 32.9 34.6 0.7United Statesa. . . . . . . . . . . . . . . . . 22.0 21.7 23.0 21.7 22.6 23.6 24.3 24.9 0.3Canada . . . . . . . . . . . . . . . . . . . . . . 3.4 3.3 2.9 3.2 3.4 3.7 4.0 4.3 1.4Mexico. . . . . . . . . . . . . . . . . . . . . . . 1.9 2.2 2.4 2.5 3.1 3.9 4.6 5.5 3.0
OECD Europe . . . . . . . . . . . . . . . . . 19.2 19.1 19.2 20.2 21.0 21.5 21.5 21.9 0.5OECD Asia . . . . . . . . . . . . . . . . . . . . 5.3 5.8 6.3 6.9 7.3 7.7 7.8 8.0 0.8Japan . . . . . . . . . . . . . . . . . . . . . . . 3.1 3.4 3.7 3.8 3.9 4.0 4.0 4.0 0.2South Korea . . . . . . . . . . . . . . . . . . 1.1 1.1 1.2 1.5 1.6 1.8 1.8 1.8 1.4Australia/New Zealand . . . . . . . . . . 1.1 1.2 1.3 1.7 1.8 1.9 2.0 2.1 1.7Total OECD . . . . . . . . . . . . . . . . . 51.8 52.1 53.7 54.5 57.4 60.3 62.3 64.4 0.6
Non-OECDNon-OECD Europe and Eurasia. . . 25.3 25.3 25.9 26.8 27.5 28.1 28.2 28.5 0.3Russia . . . . . . . . . . . . . . . . . . . . . . . 16.2 16.6 16.7 16.7 16.9 17.2 17.3 17.6 0.2Other . . . . . . . . . . . . . . . . . . . . . . . . 9.1 8.7 9.1 10.1 10.6 10.9 10.9 10.9 0.6
Non-OECD Asia. . . . . . . . . . . . . . . . 8.5 9.6 10.5 16.7 20.4 23.3 25.5 27.5 3.5China. . . . . . . . . . . . . . . . . . . . . . . . 1.7 2.0 2.5 4.9 6.3 7.6 8.7 9.7 5.0India . . . . . . . . . . . . . . . . . . . . . . . . 1.3 1.4 1.5 3.1 3.9 4.3 4.4 4.5 4.1Other Non-OECD Asia . . . . . . . . . . 5.6 6.2 6.6 8.7 10.2 11.4 12.3 13.3 2.6
Middle East . . . . . . . . . . . . . . . . . . . 9.8 10.3 10.7 16.2 18.4 19.3 19.8 20.5 2.4Africa . . . . . . . . . . . . . . . . . . . . . . . . 3.0 2.9 3.1 4.8 5.7 6.4 6.6 6.8 2.9Central and South America . . . . . . 4.4 4.5 4.6 5.6 7.0 7.5 7.9 8.6 2.3Brazil . . . . . . . . . . . . . . . . . . . . . . . . 0.7 0.7 0.7 1.1 1.5 1.7 2.0 2.3 4.3Other Central and South America. . 3.7 3.8 3.9 4.6 5.5 5.7 5.9 6.3 1.7Total Non-OECD . . . . . . . . . . . . . 50.9 52.6 54.7 70.1 78.9 84.6 88.0 91.9 1.9
Total World . . . . . . . . . . . . . . . . . . . . 102.7 104.6 108.5 124.7 136.3 144.9 150.3 156.3 1.3aIncludes the 50 States and the District of Columbia.Note: Totals may not equal sum of components due to independent rounding.Sources: History: U.S. Energy Information Administration (EIA), International Energy Statistics database (as of November 2009),
web site www.eia.gov/emeu/international. Projections: EIA, Annual Energy Outlook 2010, DOE/EIA-0383(2010) (Washington, DC,April 2010), AEO2010 National Energy Modeling System, run AEO2010R.D111809A, web site www.eia.gov/oiaf/aeo; and WorldEnergy Projection System Plus (2010).

Table A7. World coal consumption by region, Reference case, 2005-2035(Quadrillion Btu)
Appendix A
152 U.S. Energy Information Administration / International Energy Outlook 2010
Region/Country
History Projections Average annualpercent change,
2007-20352005 2006 2007 2015 2020 2025 2030 2035
OECDOECD North America . . . . . . . . . . . 24.7 24.3 24.6 23.8 24.4 25.0 25.8 26.9 0.3United Statesa. . . . . . . . . . . . . . . . . 22.8 22.5 22.7 22.3 23.0 23.6 24.3 25.1 0.4Canada . . . . . . . . . . . . . . . . . . . . . . 1.5 1.4 1.5 1.1 1.0 1.1 1.1 1.2 -0.8Mexico. . . . . . . . . . . . . . . . . . . . . . . 0.4 0.4 0.4 0.4 0.4 0.4 0.4 0.6 1.7
OECD Europe . . . . . . . . . . . . . . . . . 12.7 13.1 13.2 11.5 11.2 10.9 10.8 11.0 -0.6OECD Asia . . . . . . . . . . . . . . . . . . . . 9.2 9.3 10.1 9.2 9.2 9.5 9.8 10.4 0.1Japan . . . . . . . . . . . . . . . . . . . . . . . 4.6 4.6 4.9 4.2 4.1 3.9 3.8 3.8 -0.9South Korea . . . . . . . . . . . . . . . . . . 2.1 2.1 2.3 2.2 2.3 2.7 3.1 3.6 1.6Australia/New Zealand . . . . . . . . . . 2.6 2.6 2.9 2.8 2.8 2.9 2.9 3.0 0.2Total OECD . . . . . . . . . . . . . . . . . 46.7 46.7 47.9 44.5 44.8 45.4 46.4 48.3 0.0
Non-OECDNon-OECD Europe and Eurasia. . . 8.4 8.8 8.7 8.0 7.9 8.0 8.5 9.4 0.3Russia . . . . . . . . . . . . . . . . . . . . . . . 4.3 4.4 4.3 4.1 4.1 4.2 4.6 5.3 0.8Other . . . . . . . . . . . . . . . . . . . . . . . . 4.1 4.4 4.4 3.9 3.8 3.8 3.9 4.1 -0.2
Non-OECD Asia. . . . . . . . . . . . . . . . 61.9 65.4 70.3 81.2 93.9 108.2 123.7 140.3 2.5China. . . . . . . . . . . . . . . . . . . . . . . . 48.3 51.0 54.8 65.2 76.4 88.5 100.5 112.4 2.6India . . . . . . . . . . . . . . . . . . . . . . . . 8.6 9.2 10.2 10.5 11.5 12.4 13.7 15.5 1.5Other Non-OECD Asia . . . . . . . . . . 4.9 5.1 5.4 5.5 6.0 7.3 9.6 12.4 3.0
Middle East . . . . . . . . . . . . . . . . . . . 0.4 0.4 0.4 0.4 0.3 0.3 0.3 0.4 -0.2Africa . . . . . . . . . . . . . . . . . . . . . . . . 4.2 4.2 4.2 4.2 4.3 4.7 5.3 6.2 1.4Central and South America . . . . . . 0.8 0.9 0.9 0.9 1.0 1.2 1.4 1.7 2.1Brazil . . . . . . . . . . . . . . . . . . . . . . . . 0.4 0.4 0.5 0.5 0.6 0.8 1.0 1.2 3.4Other Central and South America. . 0.4 0.4 0.5 0.4 0.4 0.4 0.4 0.5 0.1Total Non-OECD . . . . . . . . . . . . . 75.7 79.7 84.6 94.6 107.6 122.4 139.2 157.9 2.3
Total World . . . . . . . . . . . . . . . . . . . . 122.3 126.4 132.4 139.1 152.4 167.8 185.6 206.3 1.6aIncludes the 50 States and the District of Columbia.Note: Totals may not equal sum of components due to independent rounding.Sources: History: U.S. Energy Information Administration (EIA), International Energy Statistics database (as of November 2009),
web site www.eia.gov/emeu/international. Projections: EIA, Annual Energy Outlook 2010, DOE/EIA-0383(2010) (Washington, DC,April 2010), AEO2010 National Energy Modeling System, run AEO2010R.D111809A, web site www.eia.gov/oiaf/aeo; and WorldEnergy Projection System Plus (2010).
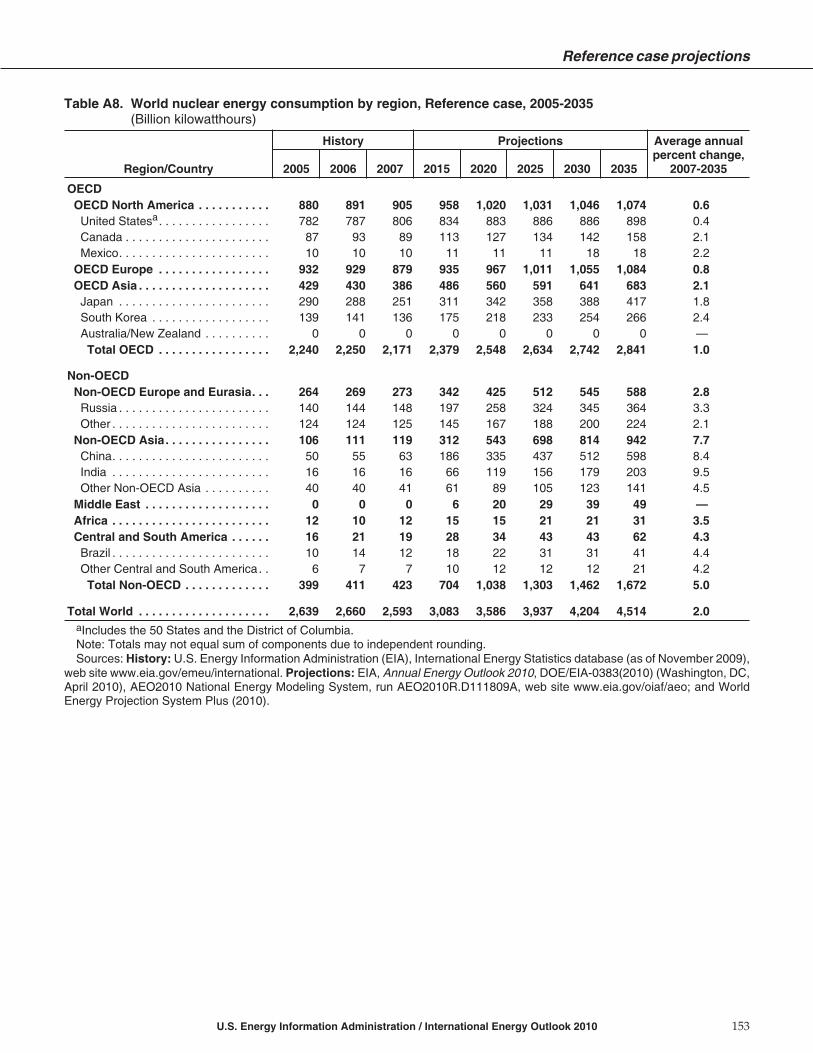
Table A8. World nuclear energy consumption by region, Reference case, 2005-2035(Billion kilowatthours)
Reference case projections
U.S. Energy Information Administration / International Energy Outlook 2010 153
Region/Country
History Projections Average annualpercent change,
2007-20352005 2006 2007 2015 2020 2025 2030 2035
OECDOECD North America . . . . . . . . . . . 880 891 905 958 1,020 1,031 1,046 1,074 0.6United Statesa. . . . . . . . . . . . . . . . . 782 787 806 834 883 886 886 898 0.4Canada . . . . . . . . . . . . . . . . . . . . . . 87 93 89 113 127 134 142 158 2.1Mexico. . . . . . . . . . . . . . . . . . . . . . . 10 10 10 11 11 11 18 18 2.2
OECD Europe . . . . . . . . . . . . . . . . . 932 929 879 935 967 1,011 1,055 1,084 0.8OECD Asia . . . . . . . . . . . . . . . . . . . . 429 430 386 486 560 591 641 683 2.1Japan . . . . . . . . . . . . . . . . . . . . . . . 290 288 251 311 342 358 388 417 1.8South Korea . . . . . . . . . . . . . . . . . . 139 141 136 175 218 233 254 266 2.4Australia/New Zealand . . . . . . . . . . 0 0 0 0 0 0 0 0 —Total OECD . . . . . . . . . . . . . . . . . 2,240 2,250 2,171 2,379 2,548 2,634 2,742 2,841 1.0
Non-OECDNon-OECD Europe and Eurasia. . . 264 269 273 342 425 512 545 588 2.8Russia . . . . . . . . . . . . . . . . . . . . . . . 140 144 148 197 258 324 345 364 3.3Other . . . . . . . . . . . . . . . . . . . . . . . . 124 124 125 145 167 188 200 224 2.1
Non-OECD Asia. . . . . . . . . . . . . . . . 106 111 119 312 543 698 814 942 7.7China. . . . . . . . . . . . . . . . . . . . . . . . 50 55 63 186 335 437 512 598 8.4India . . . . . . . . . . . . . . . . . . . . . . . . 16 16 16 66 119 156 179 203 9.5Other Non-OECD Asia . . . . . . . . . . 40 40 41 61 89 105 123 141 4.5
Middle East . . . . . . . . . . . . . . . . . . . 0 0 0 6 20 29 39 49 —Africa . . . . . . . . . . . . . . . . . . . . . . . . 12 10 12 15 15 21 21 31 3.5Central and South America . . . . . . 16 21 19 28 34 43 43 62 4.3Brazil . . . . . . . . . . . . . . . . . . . . . . . . 10 14 12 18 22 31 31 41 4.4Other Central and South America. . 6 7 7 10 12 12 12 21 4.2Total Non-OECD . . . . . . . . . . . . . 399 411 423 704 1,038 1,303 1,462 1,672 5.0
Total World . . . . . . . . . . . . . . . . . . . . 2,639 2,660 2,593 3,083 3,586 3,937 4,204 4,514 2.0aIncludes the 50 States and the District of Columbia.Note: Totals may not equal sum of components due to independent rounding.Sources: History: U.S. Energy Information Administration (EIA), International Energy Statistics database (as of November 2009),
web site www.eia.gov/emeu/international. Projections: EIA, Annual Energy Outlook 2010, DOE/EIA-0383(2010) (Washington, DC,April 2010), AEO2010 National Energy Modeling System, run AEO2010R.D111809A, web site www.eia.gov/oiaf/aeo; and WorldEnergy Projection System Plus (2010).

Table A9. World consumption of hydroelectricity and other renewable energy by region, Reference case,2005-2035(Quadrillion Btu)
Appendix A
154 U.S. Energy Information Administration / International Energy Outlook 2010
Region/Country
History Projections Average annualpercent change,
2007-20352005 2006 2007 2015 2020 2025 2030 2035
OECDOECD North America . . . . . . . . . . . 10.9 11.1 11.0 14.6 16.0 17.4 18.4 19.8 2.1United Statesa. . . . . . . . . . . . . . . . . 6.1 6.4 6.2 9.3 10.1 11.0 11.5 12.4 2.5Canada . . . . . . . . . . . . . . . . . . . . . . 4.2 4.1 4.2 4.5 5.0 5.4 5.8 6.1 1.4Mexico. . . . . . . . . . . . . . . . . . . . . . . 0.6 0.6 0.5 0.8 0.8 1.0 1.1 1.3 3.1
OECD Europe . . . . . . . . . . . . . . . . . 7.9 8.1 8.7 11.0 12.4 13.8 14.5 15.1 2.0OECD Asia . . . . . . . . . . . . . . . . . . . . 2.1 2.2 2.1 2.6 3.0 3.2 3.3 3.5 1.7Japan . . . . . . . . . . . . . . . . . . . . . . . 1.3 1.4 1.3 1.3 1.5 1.6 1.6 1.7 0.8South Korea . . . . . . . . . . . . . . . . . . 0.1 0.1 0.1 0.2 0.2 0.2 0.3 0.3 3.0Australia/New Zealand . . . . . . . . . . 0.7 0.7 0.7 1.2 1.3 1.4 1.5 1.5 2.8Total OECD . . . . . . . . . . . . . . . . . 20.9 21.4 21.7 28.2 31.4 34.3 36.3 38.3 2.0
Non-OECDNon-OECD Europe and Eurasia. . . 3.2 3.2 3.1 3.3 3.6 3.8 4.1 4.5 1.4Russia . . . . . . . . . . . . . . . . . . . . . . . 1.9 1.9 1.9 2.0 2.2 2.4 2.6 2.8 1.5Other . . . . . . . . . . . . . . . . . . . . . . . . 1.4 1.3 1.2 1.4 1.4 1.5 1.6 1.7 1.3
Non-OECD Asia. . . . . . . . . . . . . . . . 9.3 9.9 10.2 16.2 20.4 24.2 28.5 32.5 4.2China. . . . . . . . . . . . . . . . . . . . . . . . 4.1 4.5 4.5 8.7 11.2 13.8 16.4 18.5 5.2India . . . . . . . . . . . . . . . . . . . . . . . . 2.3 2.4 2.5 3.2 4.0 4.5 5.1 5.8 3.0Other Non-OECD Asia . . . . . . . . . . 2.9 3.0 3.1 4.3 5.2 5.9 7.0 8.2 3.5
Middle East . . . . . . . . . . . . . . . . . . . 0.3 0.3 0.3 0.4 0.5 0.5 0.6 0.6 3.1Africa . . . . . . . . . . . . . . . . . . . . . . . . 3.6 3.6 3.7 4.2 4.5 4.9 5.3 5.8 1.6Central and South America . . . . . . 9.0 9.4 9.8 11.4 13.0 14.6 16.5 17.9 2.2Brazil . . . . . . . . . . . . . . . . . . . . . . . . 5.5 5.7 6.2 7.3 8.4 9.7 11.0 12.2 2.4Other Central and South America. . 3.5 3.7 3.6 4.2 4.6 5.0 5.4 5.8 1.7Total Non-OECD . . . . . . . . . . . . . 25.3 26.5 27.1 35.6 42.0 48.1 55.0 61.4 3.0
Total World . . . . . . . . . . . . . . . . . . . . 46.2 47.9 48.8 63.8 73.4 82.4 91.2 99.8 2.6aIncludes the 50 States and the District of Columbia.Notes: Totals may not equal sum of components due to independent rounding. U.S. totals include net electricity imports, methanol,
and liquid hydrogen.Sources: History: U.S. Energy Information Administration (EIA), International Energy Statistics database (as of November 2009),
web site www.eia.gov/emeu/international; and International Energy Agency, “Balances of OECD and Non-OECD Statistics” (2009),web site www.iea.org (subscription site). Projections: EIA, Annual Energy Outlook 2010, DOE/EIA-0383(2010) (Washington, DC,April 2010), AEO2010 National Energy Modeling System, run AEO2010R.D111809A, web site www.eia.gov/oiaf/aeo; and WorldEnergy Projection System Plus (2010).
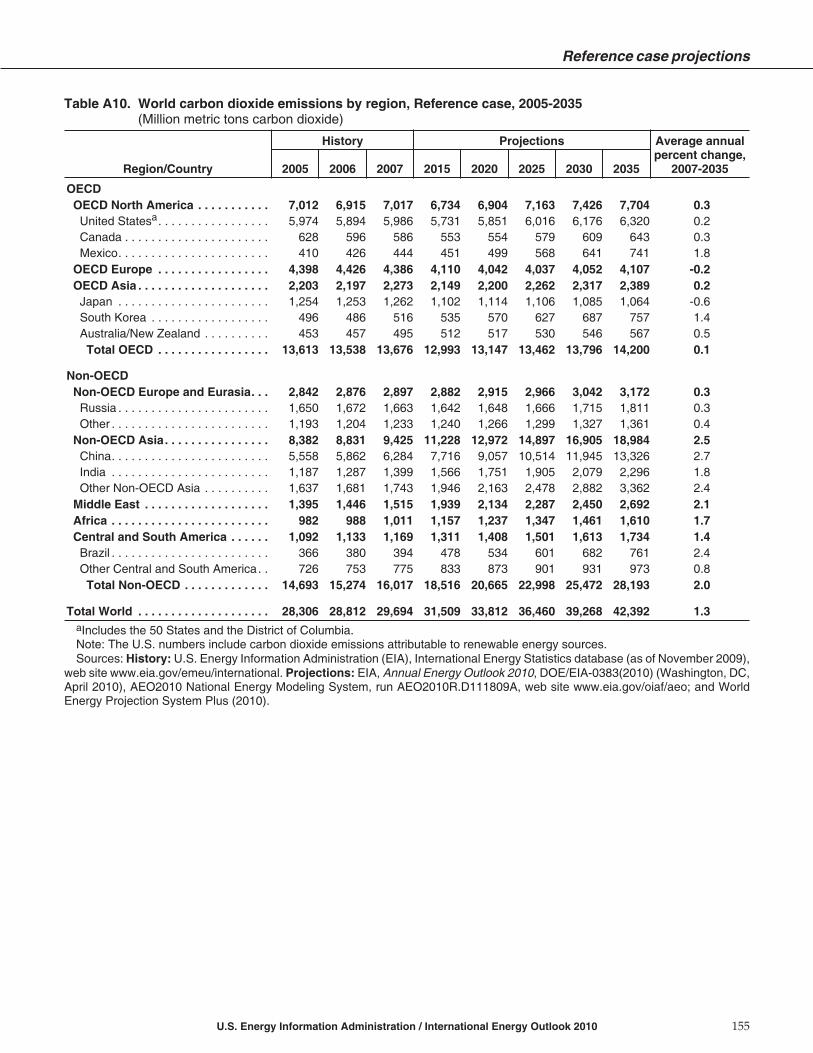
Table A10. World carbon dioxide emissions by region, Reference case, 2005-2035(Million metric tons carbon dioxide)
Reference case projections
U.S. Energy Information Administration / International Energy Outlook 2010 155
Region/Country
History Projections Average annualpercent change,
2007-20352005 2006 2007 2015 2020 2025 2030 2035
OECDOECD North America . . . . . . . . . . . 7,012 6,915 7,017 6,734 6,904 7,163 7,426 7,704 0.3United Statesa. . . . . . . . . . . . . . . . . 5,974 5,894 5,986 5,731 5,851 6,016 6,176 6,320 0.2Canada . . . . . . . . . . . . . . . . . . . . . . 628 596 586 553 554 579 609 643 0.3Mexico. . . . . . . . . . . . . . . . . . . . . . . 410 426 444 451 499 568 641 741 1.8
OECD Europe . . . . . . . . . . . . . . . . . 4,398 4,426 4,386 4,110 4,042 4,037 4,052 4,107 -0.2OECD Asia . . . . . . . . . . . . . . . . . . . . 2,203 2,197 2,273 2,149 2,200 2,262 2,317 2,389 0.2
Japan . . . . . . . . . . . . . . . . . . . . . . . 1,254 1,253 1,262 1,102 1,114 1,106 1,085 1,064 -0.6South Korea . . . . . . . . . . . . . . . . . . 496 486 516 535 570 627 687 757 1.4Australia/New Zealand . . . . . . . . . . 453 457 495 512 517 530 546 567 0.5Total OECD . . . . . . . . . . . . . . . . . 13,613 13,538 13,676 12,993 13,147 13,462 13,796 14,200 0.1
Non-OECDNon-OECD Europe and Eurasia. . . 2,842 2,876 2,897 2,882 2,915 2,966 3,042 3,172 0.3Russia . . . . . . . . . . . . . . . . . . . . . . . 1,650 1,672 1,663 1,642 1,648 1,666 1,715 1,811 0.3Other . . . . . . . . . . . . . . . . . . . . . . . . 1,193 1,204 1,233 1,240 1,266 1,299 1,327 1,361 0.4
Non-OECD Asia. . . . . . . . . . . . . . . . 8,382 8,831 9,425 11,228 12,972 14,897 16,905 18,984 2.5China. . . . . . . . . . . . . . . . . . . . . . . . 5,558 5,862 6,284 7,716 9,057 10,514 11,945 13,326 2.7India . . . . . . . . . . . . . . . . . . . . . . . . 1,187 1,287 1,399 1,566 1,751 1,905 2,079 2,296 1.8Other Non-OECD Asia . . . . . . . . . . 1,637 1,681 1,743 1,946 2,163 2,478 2,882 3,362 2.4
Middle East . . . . . . . . . . . . . . . . . . . 1,395 1,446 1,515 1,939 2,134 2,287 2,450 2,692 2.1Africa . . . . . . . . . . . . . . . . . . . . . . . . 982 988 1,011 1,157 1,237 1,347 1,461 1,610 1.7Central and South America . . . . . . 1,092 1,133 1,169 1,311 1,408 1,501 1,613 1,734 1.4Brazil . . . . . . . . . . . . . . . . . . . . . . . . 366 380 394 478 534 601 682 761 2.4Other Central and South America. . 726 753 775 833 873 901 931 973 0.8Total Non-OECD . . . . . . . . . . . . . 14,693 15,274 16,017 18,516 20,665 22,998 25,472 28,193 2.0
Total World . . . . . . . . . . . . . . . . . . . . 28,306 28,812 29,694 31,509 33,812 36,460 39,268 42,392 1.3aIncludes the 50 States and the District of Columbia.Note: The U.S. numbers include carbon dioxide emissions attributable to renewable energy sources.Sources: History: U.S. Energy Information Administration (EIA), International Energy Statistics database (as of November 2009),
web site www.eia.gov/emeu/international. Projections: EIA, Annual Energy Outlook 2010, DOE/EIA-0383(2010) (Washington, DC,April 2010), AEO2010 National Energy Modeling System, run AEO2010R.D111809A, web site www.eia.gov/oiaf/aeo; and WorldEnergy Projection System Plus (2010).

Table A11. World carbon dioxide emissions from liquids use by region, Reference case, 2005-2035(Million metric tons carbon dioxide)
Appendix A
156 U.S. Energy Information Administration / International Energy Outlook 2010
Region/Country
History Projections Average annualpercent change,
2007-20352005 2006 2007 2015 2020 2025 2030 2035
OECDOECD North America . . . . . . . . . . . 3,194 3,142 3,150 2,977 3,005 3,085 3,182 3,260 0.1United Statesa. . . . . . . . . . . . . . . . . 2,626 2,595 2,589 2,422 2,445 2,496 2,554 2,588 0.0Canada . . . . . . . . . . . . . . . . . . . . . . 301 281 288 279 272 278 287 297 0.1Mexico. . . . . . . . . . . . . . . . . . . . . . . 267 265 273 275 288 312 341 374 1.1
OECD Europe . . . . . . . . . . . . . . . . . 2,133 2,125 2,082 1,907 1,825 1,825 1,846 1,861 -0.4OECD Asia . . . . . . . . . . . . . . . . . . . . 1,031 991 980 902 930 946 958 970 0.0
Japan . . . . . . . . . . . . . . . . . . . . . . . 646 622 603 504 520 515 504 492 -0.7South Korea . . . . . . . . . . . . . . . . . . 239 221 227 242 257 275 294 312 1.1Australia/New Zealand . . . . . . . . . . 147 148 150 156 153 156 161 166 0.4Total OECD . . . . . . . . . . . . . . . . . 6,358 6,258 6,212 5,786 5,760 5,857 5,986 6,091 -0.1
Non-OECDNon-OECD Europe and Eurasia. . . 686 677 682 684 682 695 718 747 0.3Russia . . . . . . . . . . . . . . . . . . . . . . . 383 368 366 372 365 363 367 382 0.2Other . . . . . . . . . . . . . . . . . . . . . . . . 303 310 316 312 317 332 351 366 0.5
Non-OECD Asia. . . . . . . . . . . . . . . . 2,081 2,147 2,225 2,669 3,012 3,430 3,856 4,271 2.4China. . . . . . . . . . . . . . . . . . . . . . . . 889 928 969 1,281 1,487 1,735 1,966 2,171 2.9India . . . . . . . . . . . . . . . . . . . . . . . . 314 349 369 416 465 507 556 606 1.8Other Non-OECD Asia . . . . . . . . . . 878 870 887 971 1,060 1,188 1,334 1,494 1.9
Middle East . . . . . . . . . . . . . . . . . . . 817 839 886 1,004 1,079 1,183 1,319 1,519 1.9Africa . . . . . . . . . . . . . . . . . . . . . . . . 423 428 441 498 510 548 596 645 1.4Central and South America . . . . . . 762 796 823 906 918 969 1,036 1,093 1.0Brazil . . . . . . . . . . . . . . . . . . . . . . . . 288 301 311 373 396 434 480 521 1.9Other Central and South America. . 474 495 512 533 521 535 556 572 0.4Total Non-OECD . . . . . . . . . . . . . 4,768 4,888 5,057 5,761 6,200 6,825 7,524 8,276 1.8
Total World . . . . . . . . . . . . . . . . . . . . 11,126 11,146 11,268 11,547 11,960 12,682 13,510 14,367 0.9aIncludes the 50 States and the District of Columbia.Sources: History: U.S. Energy Information Administration (EIA), International Energy Statistics database (as of November 2009),
web site www.eia.gov/emeu/international. Projections: EIA, Annual Energy Outlook 2010, DOE/EIA-0383(2010) (Washington, DC,April 2010), AEO2010 National Energy Modeling System, run AEO2010R.D111809A, web site www.eia.gov/oiaf/aeo; and WorldEnergy Projection System Plus (2010).

Table A12. World carbon dioxide emissions from natural gas use by region, Reference case, 2005-2035(Million metric tons carbon dioxide)
Reference case projections
U.S. Energy Information Administration / International Energy Outlook 2010 157
Region/Country
History Projections Average annualpercent change,
2007-20352005 2006 2007 2015 2020 2025 2030 2035
OECDOECD North America . . . . . . . . . . . 1,468 1,463 1,524 1,486 1,583 1,697 1,794 1,887 0.8United Statesa. . . . . . . . . . . . . . . . . 1,176 1,157 1,232 1,171 1,220 1,272 1,315 1,345 0.3Canada . . . . . . . . . . . . . . . . . . . . . . 186 181 157 174 186 203 218 233 1.4Mexico. . . . . . . . . . . . . . . . . . . . . . . 106 125 135 141 177 221 262 309 3.0
OECD Europe . . . . . . . . . . . . . . . . . 1,048 1,045 1,049 1,105 1,149 1,175 1,178 1,198 0.5OECD Asia . . . . . . . . . . . . . . . . . . . . 311 336 355 391 410 433 441 449 0.8
Japan . . . . . . . . . . . . . . . . . . . . . . . 183 202 208 212 217 225 225 223 0.2South Korea . . . . . . . . . . . . . . . . . . 64 68 73 87 96 104 107 108 1.4Australia/New Zealand . . . . . . . . . . 65 66 73 91 98 104 110 118 1.7Total OECD . . . . . . . . . . . . . . . . . 2,827 2,843 2,928 2,983 3,142 3,305 3,413 3,534 0.7
Non-OECDNon-OECD Europe and Eurasia. . . 1,367 1,367 1,397 1,453 1,491 1,524 1,530 1,545 0.4Russia . . . . . . . . . . . . . . . . . . . . . . . 865 889 897 892 904 919 926 941 0.2Other . . . . . . . . . . . . . . . . . . . . . . . . 502 478 500 561 587 606 604 604 0.7
Non-OECD Asia. . . . . . . . . . . . . . . . 459 518 572 911 1,111 1,271 1,390 1,498 3.5China. . . . . . . . . . . . . . . . . . . . . . . . 92 111 138 273 348 420 485 537 5.0India . . . . . . . . . . . . . . . . . . . . . . . . 70 75 80 170 216 238 243 245 4.1Other Non-OECD Asia . . . . . . . . . . 297 332 354 468 547 614 663 716 2.6
Middle East . . . . . . . . . . . . . . . . . . . 543 571 594 902 1,023 1,073 1,100 1,140 2.4Africa . . . . . . . . . . . . . . . . . . . . . . . . 169 166 176 271 323 366 375 390 2.9Central and South America . . . . . . 250 256 259 318 393 422 448 484 2.3Brazil . . . . . . . . . . . . . . . . . . . . . . . . 36 38 39 59 81 96 113 127 4.3Other Central and South America. . 214 218 220 260 313 326 335 357 1.7Total Non-OECD . . . . . . . . . . . . . 2,788 2,877 2,997 3,855 4,342 4,656 4,844 5,056 1.9
Total World . . . . . . . . . . . . . . . . . . . . 5,614 5,720 5,925 6,838 7,484 7,961 8,257 8,590 1.3aIncludes the 50 States and the District of Columbia.Sources: History: U.S. Energy Information Administration (EIA), International Energy Statistics database (as of November 2009),
web site www.eia.gov/emeu/international. Projections: EIA, Annual Energy Outlook 2010, DOE/EIA-0383(2010) (Washington, DC,April 2010), AEO2010 National Energy Modeling System, run AEO2010R.D111809A, web site www.eia.gov/oiaf/aeo; and WorldEnergy Projection System Plus (2010).

Table A13. World carbon dioxide emissions from coal use by region, Reference case, 2005-2035(Million metric tons carbon dioxide)
Appendix A
158 U.S. Energy Information Administration / International Energy Outlook 2010
Region/Country
History Projections Average annualpercent change,
2007-20352005 2006 2007 2015 2020 2025 2030 2035
OECDOECD North America . . . . . . . . . . . 2,339 2,299 2,331 2,259 2,305 2,369 2,439 2,546 0.3United Statesa. . . . . . . . . . . . . . . . . 2,161 2,130 2,155 2,125 2,175 2,236 2,296 2,376 0.3Canada . . . . . . . . . . . . . . . . . . . . . . 142 133 141 100 97 99 105 112 -0.8Mexico. . . . . . . . . . . . . . . . . . . . . . . 36 36 36 34 34 35 39 58 1.7
OECD Europe . . . . . . . . . . . . . . . . . 1,217 1,256 1,256 1,098 1,068 1,037 1,028 1,048 -0.6OECD Asia . . . . . . . . . . . . . . . . . . . . 861 870 938 856 860 883 917 970 0.1
Japan . . . . . . . . . . . . . . . . . . . . . . . 425 429 451 386 376 366 355 349 -0.9South Korea . . . . . . . . . . . . . . . . . . 193 197 216 206 217 247 286 337 1.6Australia/New Zealand . . . . . . . . . . 242 244 271 265 267 270 276 284 0.2Total OECD . . . . . . . . . . . . . . . . . 4,417 4,425 4,525 4,213 4,233 4,289 4,384 4,563 0.0
Non-OECDNon-OECD Europe and Eurasia. . . 790 832 819 746 742 746 794 880 0.3Russia . . . . . . . . . . . . . . . . . . . . . . . 402 416 401 378 379 385 422 489 0.7Other . . . . . . . . . . . . . . . . . . . . . . . . 388 417 417 368 363 361 372 391 -0.2
Non-OECD Asia. . . . . . . . . . . . . . . . 5,843 6,165 6,629 7,648 8,849 10,196 11,659 13,216 2.5China. . . . . . . . . . . . . . . . . . . . . . . . 4,578 4,824 5,177 6,162 7,222 8,359 9,494 10,618 2.6India . . . . . . . . . . . . . . . . . . . . . . . . 803 863 950 979 1,070 1,160 1,280 1,445 1.5Other Non-OECD Asia . . . . . . . . . . 461 479 502 507 556 677 885 1,153 3.0
Middle East . . . . . . . . . . . . . . . . . . . 36 36 35 33 32 31 32 33 -0.2Africa . . . . . . . . . . . . . . . . . . . . . . . . 390 394 395 387 404 433 490 575 1.4Central and South America . . . . . . 80 81 87 86 97 110 129 158 2.1Brazil . . . . . . . . . . . . . . . . . . . . . . . . 42 41 44 46 57 71 89 113 3.4Other Central and South America. . 38 40 43 40 39 39 40 44 0.1Total Non-OECD . . . . . . . . . . . . . 7,138 7,509 7,964 8,900 10,124 11,517 13,105 14,861 2.3
Total World . . . . . . . . . . . . . . . . . . . . 11,555 11,934 12,489 13,113 14,357 15,806 17,489 19,424 1.6aIncludes the 50 States and the District of Columbia.Sources: History: U.S. Energy Information Administration (EIA), International Energy Statistics database (as of November 2009),
web site www.eia.gov/emeu/international. Projections: EIA, Annual Energy Outlook 2010, DOE/EIA-0383(2010) (Washington, DC,April 2010), AEO2010 National Energy Modeling System, run AEO2010R.D111809A, web site www.eia.gov/oiaf/aeo; and WorldEnergy Projection System Plus (2010).

Table A14. World population by region, Reference case, 2005-2035(Millions)
Reference case projections
U.S. Energy Information Administration / International Energy Outlook 2010 159
Region/Country
History Projections Average annualpercent change,
2007-20352005 2006 2007 2015 2020 2025 2030 2035
OECDOECD North America . . . . . . . . . . . 432 436 441 477 500 523 546 569 0.9United Statesa. . . . . . . . . . . . . . . . . 297 300 302 327 343 359 375 391 0.9Canada . . . . . . . . . . . . . . . . . . . . . . 32 33 33 36 38 40 42 43 1.0Mexico. . . . . . . . . . . . . . . . . . . . . . . 103 104 105 114 120 125 130 135 0.9
OECD Europe . . . . . . . . . . . . . . . . . 535 538 541 558 565 571 575 577 0.2OECD Asia . . . . . . . . . . . . . . . . . . . . 200 200 201 203 202 201 199 196 -0.1Japan . . . . . . . . . . . . . . . . . . . . . . . 128 128 128 126 124 122 119 116 -0.3South Korea . . . . . . . . . . . . . . . . . . 48 48 48 49 49 49 49 48 0.0Australia/New Zealand . . . . . . . . . . 25 25 25 27 28 30 31 32 0.8Total OECD . . . . . . . . . . . . . . . . . 1,167 1,175 1,183 1,238 1,267 1,294 1,319 1,342 0.5
Non-OECDNon-OECD Europe and Eurasia. . . 341 341 340 338 336 333 329 324 -0.2Russia . . . . . . . . . . . . . . . . . . . . . . . 143 143 142 138 135 132 129 125 -0.4Other . . . . . . . . . . . . . . . . . . . . . . . . 198 198 198 200 200 201 200 198 0.0
Non-OECD Asia. . . . . . . . . . . . . . . . 3,446 3,486 3,525 3,841 4,021 4,175 4,299 4,398 0.8China. . . . . . . . . . . . . . . . . . . . . . . . 1,308 1,314 1,321 1,386 1,421 1,443 1,452 1,452 0.3India . . . . . . . . . . . . . . . . . . . . . . . . 1,131 1,148 1,165 1,294 1,367 1,431 1,485 1,528 1.0Other Non-OECD Asia . . . . . . . . . . 1,008 1,024 1,039 1,160 1,233 1,300 1,363 1,418 1.1
Middle East . . . . . . . . . . . . . . . . . . . 191 195 199 231 251 270 288 305 1.5Africa . . . . . . . . . . . . . . . . . . . . . . . . 902 919 939 1,098 1,197 1,297 1,395 1,494 1.7Central and South America . . . . . . 451 458 464 511 538 563 586 606 1.0Brazil . . . . . . . . . . . . . . . . . . . . . . . . 187 190 192 210 220 229 236 243 0.8Other Central and South America. . 265 268 272 301 318 334 349 363 1.0Total Non-OECD . . . . . . . . . . . . . 5,332 5,398 5,467 6,018 6,343 6,638 6,897 7,127 1.0
Total World . . . . . . . . . . . . . . . . . . . . 6,498 6,573 6,650 7,256 7,610 7,932 8,217 8,469 0.9aIncludes the 50 States and the District of Columbia.Sources: United States: U.S. Energy Information Administration (EIA), Annual Energy Outlook 2010, DOE/EIA-0383(2010)
(Washington, DC, April 2010), AEO2010 National Energy Modeling System, run AEO2010R.D111809A, web site www.eia.gov/oiaf/aeo. Other Countries: IHS Global Insight, World Overview (Lexington, MA, various issues).

This page intentionally left blank.

Appendix B
High Economic Growth Case Projections:• World energy consumption• Gross domestic product• Carbon dioxide emissions

This page intentionally left blank.

Table B1. World Total primary energy consumption by region, High Economic Growth case, 2005-2035(Quadrillion Btu)
High Economic Growth case projections
U.S. Energy Information Administration / International Energy Outlook 2010 163
Region/Country
History Projections Average annualpercent change,
2007-20352005 2006 2007 2015 2020 2025 2030 2035
OECDOECD North America . . . . . . . . . . . 122.4 121.8 123.7 128.1 135.5 143.3 151.8 161.6 1.0United Statesa. . . . . . . . . . . . . . . . . 100.5 99.8 101.7 105.0 110.2 115.3 120.6 126.7 0.8Canada . . . . . . . . . . . . . . . . . . . . . . 14.8 14.5 14.3 14.9 15.9 17.1 18.4 19.9 1.2Mexico. . . . . . . . . . . . . . . . . . . . . . . 7.1 7.4 7.7 8.2 9.3 11.0 12.7 15.0 2.4
OECD Europe . . . . . . . . . . . . . . . . . 82.4 82.9 82.3 83.0 85.1 88.5 91.4 94.8 0.5OECD Asia . . . . . . . . . . . . . . . . . . . . 39.0 39.5 39.7 40.4 43.2 45.5 47.9 50.5 0.9Japan . . . . . . . . . . . . . . . . . . . . . . . 23.1 23.3 22.8 21.4 22.6 23.1 23.6 24.1 0.2South Korea . . . . . . . . . . . . . . . . . . 9.3 9.4 9.7 10.8 12.1 13.4 14.9 16.4 1.9Australia/New Zealand . . . . . . . . . . 6.6 6.7 7.2 8.2 8.5 8.9 9.4 10.0 1.2Total OECD . . . . . . . . . . . . . . . . . 243.8 244.1 245.7 251.5 263.7 277.3 291.1 306.9 0.8
Non-OECDNon-OECD Europe and Eurasia. . . 50.4 51.0 51.5 52.8 55.2 58.0 60.5 64.1 0.8Russia . . . . . . . . . . . . . . . . . . . . . . . 29.7 30.5 30.5 30.9 32.2 33.8 35.4 37.6 0.8Other . . . . . . . . . . . . . . . . . . . . . . . . 20.7 20.6 21.0 21.9 23.0 24.2 25.1 26.5 0.8
Non-OECD Asia. . . . . . . . . . . . . . . . 112.6 119.6 127.1 162.1 194.8 229.7 266.8 306.0 3.2China. . . . . . . . . . . . . . . . . . . . . . . . 68.4 73.0 78.0 103.2 126.0 150.8 175.8 200.5 3.4India . . . . . . . . . . . . . . . . . . . . . . . . 17.5 18.8 20.3 24.6 29.1 32.8 36.7 41.5 2.6Other Non-OECD Asia . . . . . . . . . . 26.7 27.8 28.8 34.3 39.6 46.1 54.3 64.0 2.9
Middle East . . . . . . . . . . . . . . . . . . . 22.8 23.9 25.1 33.4 37.7 41.1 44.8 50.0 2.5Africa . . . . . . . . . . . . . . . . . . . . . . . . 17.2 17.3 17.8 21.2 23.3 26.0 28.6 32.0 2.1Central and South America . . . . . . 26.0 27.1 28.0 32.7 36.9 41.1 45.8 50.7 2.1Brazil . . . . . . . . . . . . . . . . . . . . . . . . 11.2 11.7 12.3 15.1 17.6 20.5 23.8 27.0 2.8Other Central and South America. . 14.8 15.4 15.7 17.6 19.3 20.5 22.0 23.8 1.5Total Non-OECD . . . . . . . . . . . . . 229.0 239.0 249.5 302.2 347.8 395.9 446.4 502.9 2.5
Total World . . . . . . . . . . . . . . . . . . . . 472.7 483.1 495.2 553.6 611.5 673.2 737.5 809.8 1.8aIncludes the 50 States and the District of Columbia.Notes: Energy totals include net imports of coal coke and electricity generated from biomass in the United States. Totals may not
equal sum of components due to independent rounding. The electricity portion of the national fuel consumption values consists ofgeneration for domestic use plus an adjustment for electricity trade based on a fuel’s share of total generation in the exporting coun-try.
Sources: History: U.S. Energy Information Administration (EIA), International Energy Statistics database (as of November 2009),web site www.eia.gov/emeu/international; and International Energy Agency, “Balances of OECD and Non-OECD Statistics” (2009),web site www.iea.org (subscription site). Projections: EIA, Annual Energy Outlook 2010, DOE/EIA-0383(2010) (Washington, DC,April 2010), AEO2010 National Energy Modeling System, run HM2010.D020310A, web site www.eia.gov/oiaf/aeo; and WorldEnergy Projection System Plus (2010).

Table B2. World total energy consumption by region and fuel, High Economic Growth case, 2005-2035(Quadrillion Btu)
Appendix B
164 U.S. Energy Information Administration / International Energy Outlook 2010
Region/Country
History Projections Average annualpercent change,
2007-20352005 2006 2007 2015 2020 2025 2030 2035
OECDOECD North AmericaLiquids . . . . . . . . . . . . . . . . . . . . . 49.5 49.0 49.4 49.1 50.6 53.0 55.9 58.6 0.6Natural gas. . . . . . . . . . . . . . . . . . 28.1 28.1 29.2 28.7 31.0 34.3 36.7 38.6 1.0Coal . . . . . . . . . . . . . . . . . . . . . . . 24.7 24.3 24.6 24.0 25.5 26.0 27.2 29.5 0.6Nuclear. . . . . . . . . . . . . . . . . . . . . 9.2 9.4 9.6 10.1 10.8 10.9 11.1 11.9 0.8Other . . . . . . . . . . . . . . . . . . . . . . 10.9 11.1 11.0 16.1 17.5 19.1 20.9 23.0 2.7Total. . . . . . . . . . . . . . . . . . . . . . 122.4 121.8 123.7 128.1 135.5 143.3 151.8 161.6 1.0
OECD EuropeLiquids . . . . . . . . . . . . . . . . . . . . . 32.3 32.4 31.6 29.4 28.7 29.3 30.2 31.0 -0.1Natural gas. . . . . . . . . . . . . . . . . . 19.7 19.7 19.8 20.9 22.2 23.2 23.5 24.1 0.7Coal . . . . . . . . . . . . . . . . . . . . . . . 12.7 13.1 13.2 11.6 11.4 11.3 11.6 12.6 -0.2Nuclear. . . . . . . . . . . . . . . . . . . . . 9.7 9.6 9.1 9.7 10.1 10.6 11.0 11.3 0.8Other . . . . . . . . . . . . . . . . . . . . . . 7.9 8.1 8.7 11.3 12.6 14.1 15.1 15.7 2.2Total. . . . . . . . . . . . . . . . . . . . . . 82.4 82.9 82.3 83.0 85.1 88.5 91.4 94.8 0.5
OECD AsiaLiquids . . . . . . . . . . . . . . . . . . . . . 17.5 17.2 16.9 15.9 16.8 17.5 18.2 18.9 0.4Natural gas. . . . . . . . . . . . . . . . . . 5.9 6.3 6.7 7.4 8.0 8.6 8.8 9.1 1.1Coal . . . . . . . . . . . . . . . . . . . . . . . 9.2 9.3 10.1 9.3 9.5 10.1 10.8 11.9 0.6Nuclear. . . . . . . . . . . . . . . . . . . . . 4.3 4.3 3.9 5.0 5.7 6.1 6.6 7.1 2.1Other . . . . . . . . . . . . . . . . . . . . . . 2.1 2.2 2.1 2.7 3.0 3.2 3.5 3.7 1.9Total. . . . . . . . . . . . . . . . . . . . . . 39.0 39.5 39.7 40.4 43.2 45.5 47.9 50.5 0.9
Total OECDLiquids . . . . . . . . . . . . . . . . . . . . . 99.3 98.6 97.9 94.4 96.2 99.8 104.2 108.5 0.4Natural gas. . . . . . . . . . . . . . . . . . 53.7 54.1 55.6 57.1 61.3 66.1 69.0 71.8 0.9Coal . . . . . . . . . . . . . . . . . . . . . . . 46.7 46.7 47.9 45.0 46.5 47.4 49.7 53.9 0.4Nuclear. . . . . . . . . . . . . . . . . . . . . 23.2 23.3 22.6 24.8 26.6 27.6 28.8 30.3 1.1Other . . . . . . . . . . . . . . . . . . . . . . 20.9 21.4 21.7 30.1 33.1 36.4 39.5 42.4 2.4Total. . . . . . . . . . . . . . . . . . . . . . 243.8 244.1 245.7 251.5 263.7 277.3 291.1 306.9 0.8
Non-OECDNon-OECD Europe and EurasiaLiquids . . . . . . . . . . . . . . . . . . . . . 10.1 10.3 10.4 10.2 10.4 10.9 11.4 12.1 0.6Natural gas. . . . . . . . . . . . . . . . . . 25.8 25.8 26.3 27.4 28.3 29.1 29.3 29.7 0.4Coal . . . . . . . . . . . . . . . . . . . . . . . 8.4 8.8 8.7 8.1 8.2 8.5 9.6 11.2 0.9Nuclear. . . . . . . . . . . . . . . . . . . . . 2.9 2.9 3.0 3.7 4.6 5.5 5.9 6.3 2.7Other . . . . . . . . . . . . . . . . . . . . . . 3.2 3.2 3.1 3.3 3.6 3.9 4.3 4.8 1.6Total. . . . . . . . . . . . . . . . . . . . . . 50.4 51.0 51.5 52.8 55.2 58.0 60.5 64.1 0.8
Non-OECD AsiaLiquids . . . . . . . . . . . . . . . . . . . . . 31.7 33.4 34.6 42.4 49.2 57.5 66.2 75.1 2.8Natural gas. . . . . . . . . . . . . . . . . . 8.6 9.8 10.8 17.3 21.1 24.1 26.4 28.7 3.6Coal . . . . . . . . . . . . . . . . . . . . . . . 61.9 65.4 70.3 82.9 98.3 116.3 136.5 158.5 2.9Nuclear. . . . . . . . . . . . . . . . . . . . . 1.1 1.1 1.2 3.2 5.7 7.3 8.5 9.8 7.7Other . . . . . . . . . . . . . . . . . . . . . . 9.3 9.9 10.2 16.3 20.6 24.6 29.2 33.9 4.4Total. . . . . . . . . . . . . . . . . . . . . . 112.6 119.6 127.1 162.1 194.8 229.7 266.8 306.0 3.2
See notes at end of table.

Table B2. World total energy consumption by region and fuel, High Economic Growth case, 2005-2035(continued)(Quadrillion Btu)
High Economic Growth case projections
U.S. Energy Information Administration / International Energy Outlook 2010 165
Region/Country
History Projections Average annualpercent change,
2007-20352005 2006 2007 2015 2020 2025 2030 2035
Non-OECD (continued)Middle EastLiquids . . . . . . . . . . . . . . . . . . . . . 12.0 12.5 13.3 15.3 16.9 19.0 22.0 25.3 2.3Natural gas. . . . . . . . . . . . . . . . . . 10.2 10.8 11.2 17.2 19.7 21.0 21.4 23.0 2.6Coal . . . . . . . . . . . . . . . . . . . . . . . 0.4 0.4 0.4 0.4 0.3 0.3 0.3 0.5 0.8Nuclear. . . . . . . . . . . . . . . . . . . . . 0.0 0.0 0.0 0.1 0.2 0.3 0.4 0.5 —Other . . . . . . . . . . . . . . . . . . . . . . 0.3 0.3 0.3 0.4 0.5 0.6 0.6 0.7 3.2Total. . . . . . . . . . . . . . . . . . . . . . 22.8 23.9 25.1 33.4 37.7 41.1 44.8 50.0 2.5
AfricaLiquids . . . . . . . . . . . . . . . . . . . . . 6.1 6.2 6.4 7.4 7.8 8.5 9.5 10.5 1.8Natural gas. . . . . . . . . . . . . . . . . . 3.2 3.1 3.3 5.2 6.2 6.9 7.1 7.4 2.9Coal . . . . . . . . . . . . . . . . . . . . . . . 4.2 4.2 4.2 4.2 4.6 5.1 6.1 7.4 2.0Nuclear. . . . . . . . . . . . . . . . . . . . . 0.1 0.1 0.1 0.2 0.2 0.2 0.2 0.3 3.6Other . . . . . . . . . . . . . . . . . . . . . . 3.6 3.6 3.7 4.2 4.6 5.2 5.7 6.4 1.9Total. . . . . . . . . . . . . . . . . . . . . . 17.2 17.3 17.8 21.2 23.3 26.0 28.6 32.0 2.1
Central and South AmericaLiquids . . . . . . . . . . . . . . . . . . . . . 11.3 11.8 12.2 13.7 14.3 15.5 16.9 18.3 1.5Natural gas. . . . . . . . . . . . . . . . . . 4.7 4.8 4.9 6.3 8.0 8.9 9.6 10.6 2.8Coal . . . . . . . . . . . . . . . . . . . . . . . 0.8 0.9 0.9 0.9 1.1 1.2 1.5 1.9 2.6Nuclear. . . . . . . . . . . . . . . . . . . . . 0.2 0.2 0.2 0.3 0.4 0.5 0.5 0.7 4.2Other . . . . . . . . . . . . . . . . . . . . . . 9.0 9.4 9.8 11.5 13.2 15.0 17.3 19.3 2.4Total. . . . . . . . . . . . . . . . . . . . . . 26.0 27.1 28.0 32.7 36.9 41.1 45.8 50.7 2.1
Total Non-OECDLiquids . . . . . . . . . . . . . . . . . . . . . 71.1 74.2 76.8 89.0 98.5 111.3 126.0 141.4 2.2Natural gas. . . . . . . . . . . . . . . . . . 52.5 54.2 56.5 73.4 83.3 90.0 93.8 99.4 2.0Coal . . . . . . . . . . . . . . . . . . . . . . . 75.7 79.7 84.6 96.4 112.4 131.6 154.1 179.4 2.7Nuclear. . . . . . . . . . . . . . . . . . . . . 4.3 4.4 4.5 7.5 11.0 13.8 15.5 17.6 5.0Other . . . . . . . . . . . . . . . . . . . . . . 25.3 26.5 27.1 35.9 42.5 49.3 57.1 65.0 3.2Total. . . . . . . . . . . . . . . . . . . . . . 229.0 239.0 249.5 302.2 347.8 395.9 446.4 502.9 2.5
Total WorldLiquids . . . . . . . . . . . . . . . . . . . . . 170.4 172.8 174.7 183.4 194.7 211.1 230.3 249.9 1.3Natural gas. . . . . . . . . . . . . . . . . . 106.3 108.3 112.1 130.6 144.6 156.1 162.8 171.3 1.5Coal . . . . . . . . . . . . . . . . . . . . . . . 122.3 126.4 132.4 141.4 158.9 178.9 203.7 233.3 2.0Nuclear. . . . . . . . . . . . . . . . . . . . . 27.5 27.8 27.1 32.3 37.6 41.4 44.2 47.9 2.1Other . . . . . . . . . . . . . . . . . . . . . . 46.2 47.9 48.8 66.0 75.7 85.7 96.6 107.4 2.9Total. . . . . . . . . . . . . . . . . . . . . . 472.7 483.1 495.2 553.6 611.5 673.2 737.5 809.8 1.8
Notes: Energy totals include net imports of coal coke and electricity generated from biomass in the United States. Totals may notequal sum of components due to independent rounding. The electricity portion of the national fuel consumption values consists ofgeneration for domestic use plus an adjustment for electricity trade based on a fuel’s share of total generation in the exporting coun-try.
Sources: History: U.S. Energy Information Administration (EIA), International Energy Statistics database (as of November 2009),web site www.eia.gov/emeu/international; and International Energy Agency, “Balances of OECD and Non-OECD Statistics” (2009),web site www.iea.org (subscription site). Projections: EIA, Annual Energy Outlook 2010, DOE/EIA-0383(2010) (Washington, DC,April 2010), AEO2010 National Energy Modeling System, run HM2010.D020310A, web site www.eia.gov/oiaf/aeo; and WorldEnergy Projection System Plus (2010).

Table B3. World gross domestic product (GDP) by region expressed in purchasing power parity,High Economic Growth case, 2005-2035(Billion 2005 dollars)
Appendix B
166 U.S. Energy Information Administration / International Energy Outlook 2010
Region/Country
History Projections Average annualpercent change,
2007-20352005 2006 2007 2015 2020 2025 2030 2035
OECDOECD North America . . . . . . . . . . . 14,883 15,327 15,662 19,069 22,552 26,519 31,040 35,942 3.0United Statesa. . . . . . . . . . . . . . . . . 12,422 12,768 13,027 15,920 18,760 21,959 25,541 29,295 2.9Canada . . . . . . . . . . . . . . . . . . . . . . 1,167 1,200 1,231 1,478 1,694 1,923 2,188 2,488 2.5Mexico. . . . . . . . . . . . . . . . . . . . . . . 1,293 1,359 1,405 1,671 2,098 2,636 3,311 4,159 4.0
OECD Europe . . . . . . . . . . . . . . . . . 13,928 14,412 14,849 16,691 19,030 21,479 24,126 27,036 2.2OECD Asia . . . . . . . . . . . . . . . . . . . . 5,535 5,681 5,850 6,724 7,480 8,172 8,916 9,691 1.8
Japan . . . . . . . . . . . . . . . . . . . . . . . 3,872 3,951 4,041 4,385 4,684 4,892 5,104 5,305 1.0South Korea . . . . . . . . . . . . . . . . . . 892 938 986 1,300 1,576 1,864 2,167 2,483 3.4Australia/New Zealand . . . . . . . . . . 771 792 823 1,038 1,220 1,417 1,645 1,902 3.0Total OECD . . . . . . . . . . . . . . . . . 34,345 35,420 36,361 42,484 49,062 56,171 64,082 72,669 2.5
Non-OECDNon-OECD Europe and Eurasia. . . 2,977 3,218 3,481 4,316 5,209 6,191 7,258 8,438 3.2Russia . . . . . . . . . . . . . . . . . . . . . . . 1,703 1,834 1,982 2,418 2,901 3,459 4,079 4,788 3.2Other . . . . . . . . . . . . . . . . . . . . . . . . 1,275 1,384 1,499 1,898 2,308 2,732 3,178 3,650 3.2
Non-OECD Asia. . . . . . . . . . . . . . . . 11,897 13,013 14,323 24,738 33,517 43,461 54,520 66,773 5.7China. . . . . . . . . . . . . . . . . . . . . . . . 5,408 6,035 6,820 13,090 18,264 24,191 30,462 37,039 6.2India . . . . . . . . . . . . . . . . . . . . . . . . 2,440 2,676 2,918 4,985 6,678 8,448 10,526 12,961 5.5Other Non-OECD Asia . . . . . . . . . . 4,049 4,302 4,585 6,663 8,574 10,822 13,531 16,773 4.7
Middle East . . . . . . . . . . . . . . . . . . . 1,985 2,145 2,261 3,160 3,945 4,829 5,901 7,169 4.2Africa . . . . . . . . . . . . . . . . . . . . . . . . 2,360 2,494 2,638 3,746 4,644 5,638 6,750 8,040 4.1Central and South America . . . . . . 3,612 3,822 4,066 5,499 6,712 8,118 9,757 11,668 3.8Brazil . . . . . . . . . . . . . . . . . . . . . . . . 1,534 1,595 1,685 2,418 3,033 3,784 4,699 5,806 4.5Other Central and South America. . 2,079 2,227 2,381 3,081 3,680 4,334 5,057 5,862 3.3Total Non-OECD . . . . . . . . . . . . . 22,832 24,692 26,769 41,458 54,026 68,237 84,185 102,087 4.9
Total World . . . . . . . . . . . . . . . . . . . . 57,177 60,112 63,130 83,942 103,089 124,408 148,267 174,756 3.7aIncludes the 50 States and the District of Columbia.Note: Totals may not equal sum of components due to independent rounding.Sources: History: IHS Global Insight, World Overview (Lexington, MA, various issues). Projections: Derived from IHS Global
Insight, World Overview, Third Quarter 2009 (Lexington, MA, September 2009); and U.S. Energy Information Administration, AnnualEnergy Outlook 2010, DOE/EIA-0383(2010) (Washington, DC, April 2010), Table B4.

Table B4. World liquids consumption by region, High Economic Growth case, 2005-2035(Million barrels per day)
High Economic Growth case projections
U.S. Energy Information Administration / International Energy Outlook 2010 167
Region/Country
History Projections Average annualpercent change,
2007-20352005 2006 2007 2015 2020 2025 2030 2035
OECDOECD North America . . . . . . . . . . . 25.2 25.0 25.1 25.4 26.2 27.5 29.1 30.7 0.7United Statesa. . . . . . . . . . . . . . . . . 20.8 20.7 20.6 20.9 21.6 22.5 23.6 24.7 0.6Canada . . . . . . . . . . . . . . . . . . . . . . 2.3 2.3 2.3 2.3 2.3 2.4 2.5 2.7 0.5Mexico. . . . . . . . . . . . . . . . . . . . . . . 2.1 2.1 2.1 2.2 2.4 2.6 2.9 3.3 1.6
OECD Europe . . . . . . . . . . . . . . . . . 15.7 15.7 15.3 14.3 13.9 14.2 14.6 15.0 -0.1OECD Asia . . . . . . . . . . . . . . . . . . . . 8.6 8.5 8.4 7.9 8.3 8.7 9.0 9.3 0.4Japan . . . . . . . . . . . . . . . . . . . . . . . 5.3 5.2 5.0 4.3 4.5 4.6 4.6 4.5 -0.4South Korea . . . . . . . . . . . . . . . . . . 2.2 2.2 2.2 2.4 2.6 2.9 3.1 3.4 1.5Australia/New Zealand . . . . . . . . . . 1.1 1.1 1.1 1.2 1.2 1.2 1.3 1.4 0.8Total OECD . . . . . . . . . . . . . . . . . 49.5 49.1 48.8 47.5 48.5 50.4 52.7 55.1 0.4
Non-OECDNon-OECD Europe and Eurasia. . . 4.9 5.0 5.1 5.0 5.1 5.3 5.6 5.9 0.6Russia . . . . . . . . . . . . . . . . . . . . . . . 2.8 2.9 2.9 2.8 2.8 2.8 2.9 3.1 0.3Other . . . . . . . . . . . . . . . . . . . . . . . . 2.1 2.2 2.2 2.2 2.3 2.5 2.6 2.8 0.9
Non-OECD Asia. . . . . . . . . . . . . . . . 15.4 16.2 16.8 20.5 23.9 27.9 32.1 36.5 2.8China. . . . . . . . . . . . . . . . . . . . . . . . 6.7 7.3 7.6 10.2 12.1 14.5 16.9 19.1 3.4India . . . . . . . . . . . . . . . . . . . . . . . . 2.5 2.7 2.8 3.3 3.8 4.2 4.7 5.3 2.3Other Non-OECD Asia . . . . . . . . . . 6.2 6.2 6.3 7.1 7.9 9.1 10.5 12.0 2.3
Middle East . . . . . . . . . . . . . . . . . . . 5.8 6.0 6.4 7.4 8.1 9.2 10.6 12.2 2.3Africa . . . . . . . . . . . . . . . . . . . . . . . . 3.0 3.0 3.1 3.6 3.8 4.2 4.6 5.1 1.8Central and South America . . . . . . 5.5 5.8 6.0 6.7 7.0 7.6 8.3 9.0 1.5Brazil . . . . . . . . . . . . . . . . . . . . . . . . 2.2 2.3 2.4 2.9 3.2 3.6 4.0 4.5 2.3Other Central and South America. . 3.3 3.5 3.6 3.8 3.8 4.0 4.2 4.5 0.8Total Non-OECD . . . . . . . . . . . . . 34.6 36.1 37.3 43.2 47.9 54.1 61.2 68.7 2.2
Total World . . . . . . . . . . . . . . . . . . . . 84.0 85.2 86.1 90.7 96.4 104.5 114.0 123.7 1.3aIncludes the 50 States and the District of Columbia.Note: Totals may not equal sum of components due to independent rounding.Sources: History: U.S. Energy Information Administration (EIA), International Energy Statistics database (as of November 2009),
web site www.eia.gov/emeu/international. Projections: EIA, Annual Energy Outlook 2010, DOE/EIA-0383(2010) (Washington, DC,April 2010), AEO2010 National Energy Modeling System, run HM2010.D020310A, web site www.eia.gov/oiaf/aeo; and WorldEnergy Projection System Plus (2010).

Table B5. World natural gas consumption by region, High Economic Growth case, 2005-2035(Trillion cubic feet)
Appendix B
168 U.S. Energy Information Administration / International Energy Outlook 2010
Region/Country
History Projections Average annualpercent change,
2007-20352005 2006 2007 2015 2020 2025 2030 2035
OECDOECD North America . . . . . . . . . . . 27.3 27.2 28.3 27.9 30.1 33.3 35.5 37.4 1.0United Statesa. . . . . . . . . . . . . . . . . 22.0 21.7 23.0 22.1 23.3 25.2 26.3 26.9 0.6Canada . . . . . . . . . . . . . . . . . . . . . . 3.4 3.3 2.9 3.2 3.5 4.0 4.3 4.7 1.8Mexico. . . . . . . . . . . . . . . . . . . . . . . 1.9 2.2 2.4 2.5 3.2 4.1 4.8 5.7 3.2
OECD Europe . . . . . . . . . . . . . . . . . 19.2 19.1 19.2 20.3 21.5 22.5 22.7 23.4 0.7OECD Asia . . . . . . . . . . . . . . . . . . . . 5.3 5.8 6.3 7.0 7.5 8.1 8.3 8.5 1.1Japan . . . . . . . . . . . . . . . . . . . . . . . 3.1 3.4 3.7 3.8 4.1 4.3 4.4 4.4 0.6South Korea . . . . . . . . . . . . . . . . . . 1.1 1.1 1.2 1.5 1.7 1.8 1.8 1.9 1.5Australia/New Zealand . . . . . . . . . . 1.1 1.2 1.3 1.7 1.8 1.9 2.1 2.2 1.9Total OECD . . . . . . . . . . . . . . . . . 51.8 52.1 53.7 55.2 59.1 63.8 66.5 69.3 0.9
Non-OECDNon-OECD Europe and Eurasia. . . 25.3 25.3 25.9 26.9 27.8 28.6 28.7 29.2 0.4Russia . . . . . . . . . . . . . . . . . . . . . . . 16.2 16.6 16.7 16.8 17.1 17.5 17.7 18.0 0.3Other . . . . . . . . . . . . . . . . . . . . . . . . 9.1 8.7 9.1 10.1 10.7 11.1 11.1 11.2 0.7
Non-OECD Asia. . . . . . . . . . . . . . . . 8.5 9.6 10.5 16.9 20.5 23.5 25.7 28.0 3.5China. . . . . . . . . . . . . . . . . . . . . . . . 1.7 2.0 2.5 4.9 6.2 7.5 8.8 9.9 5.0India . . . . . . . . . . . . . . . . . . . . . . . . 1.3 1.4 1.5 3.1 3.9 4.3 4.4 4.4 4.0Other Non-OECD Asia . . . . . . . . . . 5.6 6.2 6.6 8.8 10.4 11.6 12.5 13.7 2.6
Middle East . . . . . . . . . . . . . . . . . . . 9.8 10.3 10.7 16.4 18.8 20.0 20.4 22.0 2.6Africa . . . . . . . . . . . . . . . . . . . . . . . . 3.0 2.9 3.1 4.8 5.7 6.4 6.6 6.8 2.9Central and South America . . . . . . 4.4 4.5 4.6 5.9 7.5 8.4 9.0 10.0 2.8Brazil . . . . . . . . . . . . . . . . . . . . . . . . 0.7 0.7 0.7 1.2 1.7 2.1 2.4 2.7 5.0Other Central and South America. . 3.7 3.8 3.9 4.7 5.9 6.3 6.6 7.2 2.3Total Non-OECD . . . . . . . . . . . . . 50.9 52.6 54.7 70.9 80.4 86.8 90.5 95.9 2.0
Total World . . . . . . . . . . . . . . . . . . . . 102.7 104.6 108.5 126.1 139.6 150.6 157.0 165.2 1.5aIncludes the 50 States and the District of Columbia.Note: Totals may not equal sum of components due to independent rounding.Sources: History: U.S. Energy Information Administration (EIA), International Energy Statistics database (as of November 2009),
web site www.eia.gov/emeu/international. Projections: EIA, Annual Energy Outlook 2010, DOE/EIA-0383(2010) (Washington, DC,April 2010), AEO2010 National Energy Modeling System, run HM2010.D020310A, web site www.eia.gov/oiaf/aeo; and WorldEnergy Projection System Plus (2010).

Table B6. World coal consumption by region, High Economic Growth case, 2005-2035(Quadrillion Btu)
High Economic Growth case projections
U.S. Energy Information Administration / International Energy Outlook 2010 169
Region/Country
History Projections Average annualpercent change,
2007-20352005 2006 2007 2015 2020 2025 2030 2035
OECDOECD North America . . . . . . . . . . . 24.7 24.3 24.6 24.0 25.5 26.0 27.2 29.5 0.6United Statesa. . . . . . . . . . . . . . . . . 22.8 22.5 22.7 22.6 24.1 24.4 25.4 27.1 0.6Canada . . . . . . . . . . . . . . . . . . . . . . 1.5 1.4 1.5 1.1 1.1 1.1 1.3 1.5 -0.1Mexico. . . . . . . . . . . . . . . . . . . . . . . 0.4 0.4 0.4 0.4 0.4 0.4 0.5 1.0 3.3
OECD Europe . . . . . . . . . . . . . . . . . 12.7 13.1 13.2 11.6 11.4 11.3 11.6 12.6 -0.2OECD Asia . . . . . . . . . . . . . . . . . . . . 9.2 9.3 10.1 9.3 9.5 10.1 10.8 11.9 0.6Japan . . . . . . . . . . . . . . . . . . . . . . . 4.6 4.6 4.9 4.2 4.2 4.1 4.1 4.2 -0.5South Korea . . . . . . . . . . . . . . . . . . 2.1 2.1 2.3 2.2 2.4 2.9 3.6 4.3 2.3Australia/New Zealand . . . . . . . . . . 2.6 2.6 2.9 2.9 2.9 3.0 3.1 3.3 0.5Total OECD . . . . . . . . . . . . . . . . . 46.7 46.7 47.9 45.0 46.5 47.4 49.7 53.9 0.4
Non-OECDNon-OECD Europe and Eurasia. . . 8.4 8.8 8.7 8.1 8.2 8.5 9.6 11.2 0.9Russia . . . . . . . . . . . . . . . . . . . . . . . 4.3 4.4 4.3 4.1 4.3 4.5 5.2 6.3 1.4Other . . . . . . . . . . . . . . . . . . . . . . . . 4.1 4.4 4.4 3.9 4.0 4.1 4.4 4.9 0.4
Non-OECD Asia. . . . . . . . . . . . . . . . 61.9 65.4 70.3 82.9 98.3 116.3 136.5 158.5 2.9China. . . . . . . . . . . . . . . . . . . . . . . . 48.3 51.0 54.8 66.6 79.9 94.7 110.3 126.0 3.0India . . . . . . . . . . . . . . . . . . . . . . . . 8.6 9.2 10.2 10.6 12.0 13.4 15.2 17.5 2.0Other Non-OECD Asia . . . . . . . . . . 4.9 5.1 5.4 5.6 6.4 8.2 11.1 14.9 3.7
Middle East . . . . . . . . . . . . . . . . . . . 0.4 0.4 0.4 0.4 0.3 0.3 0.3 0.5 0.8Africa . . . . . . . . . . . . . . . . . . . . . . . . 4.2 4.2 4.2 4.2 4.6 5.1 6.1 7.4 2.0Central and South America . . . . . . 0.8 0.9 0.9 0.9 1.1 1.2 1.5 1.9 2.6Brazil . . . . . . . . . . . . . . . . . . . . . . . . 0.4 0.4 0.5 0.5 0.6 0.8 1.0 1.4 3.9Other Central and South America. . 0.4 0.4 0.5 0.4 0.4 0.4 0.4 0.5 0.4Total Non-OECD . . . . . . . . . . . . . 75.7 79.7 84.6 96.4 112.4 131.6 154.1 179.4 2.7
Total World . . . . . . . . . . . . . . . . . . . . 122.3 126.4 132.4 141.4 158.9 178.9 203.7 233.3 2.0aIncludes the 50 States and the District of Columbia.Note: Totals may not equal sum of components due to independent rounding.Sources: History: U.S. Energy Information Administration (EIA), International Energy Statistics database (as of November 2009),
web site www.eia.gov/emeu/international. Projections: EIA, Annual Energy Outlook 2010, DOE/EIA-0383(2010) (Washington, DC,April 2010), AEO2010 National Energy Modeling System, run HM2010.D020310A, web site www.eia.gov/oiaf/aeo; and WorldEnergy Projection System Plus (2010).

Table B7. World nuclear energy consumption by region, High Economic Growth case, 2005-2035(Billion kilowatthours)
Appendix B
170 U.S. Energy Information Administration / International Energy Outlook 2010
Region/Country
History Projections Average annualpercent change,
2007-20352005 2006 2007 2015 2020 2025 2030 2035
OECDOECD North America . . . . . . . . . . . 880 891 905 958 1,025 1,037 1,053 1,128 0.8United Statesa. . . . . . . . . . . . . . . . . 782 787 806 834 887 892 891 951 0.6Canada . . . . . . . . . . . . . . . . . . . . . . 87 93 89 113 127 135 143 159 2.1Mexico. . . . . . . . . . . . . . . . . . . . . . . 10 10 10 11 11 11 18 18 2.2
OECD Europe . . . . . . . . . . . . . . . . . 932 929 879 937 972 1,019 1,066 1,094 0.8OECD Asia . . . . . . . . . . . . . . . . . . . . 429 430 386 495 564 596 647 690 2.1Japan . . . . . . . . . . . . . . . . . . . . . . . 290 288 251 320 345 362 393 423 1.9South Korea . . . . . . . . . . . . . . . . . . 139 141 136 175 219 234 255 267 2.4Australia/New Zealand . . . . . . . . . . 0 0 0 0 0 0 0 0 —Total OECD . . . . . . . . . . . . . . . . . 2,240 2,250 2,171 2,390 2,561 2,653 2,766 2,912 1.1
Non-OECDNon-OECD Europe and Eurasia. . . 264 269 273 343 428 517 551 593 2.8Russia . . . . . . . . . . . . . . . . . . . . . . . 140 144 148 198 260 328 349 368 3.3Other . . . . . . . . . . . . . . . . . . . . . . . . 124 124 125 145 168 189 202 226 2.1
Non-OECD Asia. . . . . . . . . . . . . . . . 106 111 119 313 545 700 817 946 7.7China. . . . . . . . . . . . . . . . . . . . . . . . 50 55 63 186 336 437 513 599 8.4India . . . . . . . . . . . . . . . . . . . . . . . . 16 16 16 66 120 157 180 205 9.6Other Non-OECD Asia . . . . . . . . . . 40 40 41 61 89 105 123 142 4.5
Middle East . . . . . . . . . . . . . . . . . . . 0 0 0 6 21 30 39 50 —Africa . . . . . . . . . . . . . . . . . . . . . . . . 12 10 12 15 16 22 22 31 3.5Central and South America . . . . . . 16 21 19 28 34 43 43 62 4.3Brazil . . . . . . . . . . . . . . . . . . . . . . . . 10 14 12 18 22 31 31 41 4.4Other Central and South America. . 6 7 7 10 12 12 12 21 4.2Total Non-OECD . . . . . . . . . . . . . 399 411 423 705 1,043 1,311 1,472 1,683 5.1
Total World . . . . . . . . . . . . . . . . . . . . 2,639 2,660 2,593 3,096 3,604 3,964 4,238 4,595 2.1aIncludes the 50 States and the District of Columbia.Note: Totals may not equal sum of components due to independent rounding.Sources: History: U.S. Energy Information Administration (EIA), International Energy Statistics database (as of November 2009),
web site www.eia.gov/emeu/international. Projections: EIA, Annual Energy Outlook 2010, DOE/EIA-0383(2010) (Washington, DC,April 2010), AEO2010 National Energy Modeling System, run HM2010.D020310A, web site www.eia.gov/oiaf/aeo; and WorldEnergy Projection System Plus (2010).

Table B8. World consumption of hydroelectricity and other renewable energy by region,High Economic Growth case, 2005-2035(Quadrillion Btu)
High Economic Growth case projections
U.S. Energy Information Administration / International Energy Outlook 2010 171
Region/Country
History Projections Average annualpercent change,
2007-20352005 2006 2007 2015 2020 2025 2030 2035
OECDOECD North America . . . . . . . . . . . 10.9 11.1 11.0 16.1 17.5 19.1 20.9 23.0 2.7United Statesa. . . . . . . . . . . . . . . . . 6.1 6.4 6.2 10.7 11.4 12.4 13.7 15.2 3.3Canada . . . . . . . . . . . . . . . . . . . . . . 4.2 4.1 4.2 4.6 5.2 5.6 6.0 6.5 1.5Mexico. . . . . . . . . . . . . . . . . . . . . . . 0.6 0.6 0.5 0.8 0.9 1.0 1.2 1.3 3.3
OECD Europe . . . . . . . . . . . . . . . . . 7.9 8.1 8.7 11.3 12.6 14.1 15.1 15.7 2.2OECD Asia . . . . . . . . . . . . . . . . . . . . 2.1 2.2 2.1 2.7 3.0 3.2 3.5 3.7 1.9Japan . . . . . . . . . . . . . . . . . . . . . . . 1.3 1.4 1.3 1.3 1.6 1.6 1.7 1.8 1.1South Korea . . . . . . . . . . . . . . . . . . 0.1 0.1 0.1 0.2 0.2 0.2 0.3 0.3 3.3Australia/New Zealand . . . . . . . . . . 0.7 0.7 0.7 1.2 1.3 1.4 1.5 1.6 3.0Total OECD . . . . . . . . . . . . . . . . . 20.9 21.4 21.7 30.1 33.1 36.4 39.5 42.4 2.4
Non-OECDNon-OECD Europe and Eurasia. . . 3.2 3.2 3.1 3.3 3.6 3.9 4.3 4.8 1.6Russia . . . . . . . . . . . . . . . . . . . . . . . 1.9 1.9 1.9 2.0 2.2 2.4 2.7 3.0 1.7Other . . . . . . . . . . . . . . . . . . . . . . . . 1.4 1.3 1.2 1.4 1.4 1.5 1.6 1.8 1.4
Non-OECD Asia. . . . . . . . . . . . . . . . 9.3 9.9 10.2 16.3 20.6 24.6 29.2 33.9 4.4China. . . . . . . . . . . . . . . . . . . . . . . . 4.1 4.5 4.5 8.7 11.2 13.8 16.5 18.9 5.2India . . . . . . . . . . . . . . . . . . . . . . . . 2.3 2.4 2.5 3.3 4.1 4.6 5.4 6.3 3.3Other Non-OECD Asia . . . . . . . . . . 2.9 3.0 3.1 4.4 5.3 6.1 7.3 8.8 3.8
Middle East . . . . . . . . . . . . . . . . . . . 0.3 0.3 0.3 0.4 0.5 0.6 0.6 0.7 3.2Africa . . . . . . . . . . . . . . . . . . . . . . . . 3.6 3.6 3.7 4.2 4.6 5.2 5.7 6.4 1.9Central and South America . . . . . . 9.0 9.4 9.8 11.5 13.2 15.0 17.3 19.3 2.4Brazil . . . . . . . . . . . . . . . . . . . . . . . . 5.5 5.7 6.2 7.3 8.5 10.0 11.7 13.1 2.7Other Central and South America. . 3.5 3.7 3.6 4.2 4.6 5.1 5.6 6.2 1.9Total Non-OECD . . . . . . . . . . . . . 25.3 26.5 27.1 35.9 42.5 49.3 57.1 65.0 3.2
Total World . . . . . . . . . . . . . . . . . . . . 46.2 47.9 48.8 66.0 75.7 85.7 96.6 107.4 2.9aIncludes the 50 States and the District of Columbia.Notes: Totals may not equal sum of components due to independent rounding. U.S. totals include net electricity imports, methanol,
and liquid hydrogen.Sources: History: U.S. Energy Information Administration (EIA), International Energy Statistics database (as of November 2009),
web site www.eia.gov/emeu/international; and International Energy Agency, “Balances of OECD and Non-OECD Statistics” (2009),web site www.iea.org (subscription site). Projections: EIA, Annual Energy Outlook 2010, DOE/EIA-0383(2010) (Washington, DC,April 2010), AEO2010 National Energy Modeling System, run HM2010.D020310A, web site www.eia.gov/oiaf/aeo; and WorldEnergy Projection System Plus (2010).

Table B9. World carbon dioxide emissions by region, High Economic Growth case, 2005-2035(Million metric tons carbon dioxide)
Appendix B
172 U.S. Energy Information Administration / International Energy Outlook 2010
Region/Country
History Projections Average annualpercent change,
2007-20352005 2006 2007 2015 2020 2025 2030 2035
OECDOECD North America . . . . . . . . . . . 7,012 6,915 7,017 6,876 7,212 7,582 7,992 8,434 0.7United Statesa. . . . . . . . . . . . . . . . . 5,974 5,894 5,986 5,857 6,117 6,358 6,622 6,867 0.5Canada . . . . . . . . . . . . . . . . . . . . . . 628 596 586 560 577 619 669 729 0.8Mexico. . . . . . . . . . . . . . . . . . . . . . . 410 426 444 459 519 605 700 838 2.3
OECD Europe . . . . . . . . . . . . . . . . . 4,398 4,426 4,386 4,154 4,162 4,237 4,338 4,519 0.1OECD Asia . . . . . . . . . . . . . . . . . . . . 2,203 2,197 2,273 2,180 2,283 2,401 2,519 2,665 0.6
Japan . . . . . . . . . . . . . . . . . . . . . . . 1,254 1,253 1,262 1,116 1,154 1,169 1,172 1,181 -0.2South Korea . . . . . . . . . . . . . . . . . . 496 486 516 544 594 673 760 862 1.8Australia/New Zealand . . . . . . . . . . 453 457 495 521 535 559 587 622 0.8Total OECD . . . . . . . . . . . . . . . . . 13,613 13,538 13,676 13,210 13,657 14,220 14,849 15,619 0.5
Non-OECDNon-OECD Europe and Eurasia. . . 2,842 2,876 2,897 2,911 2,983 3,086 3,233 3,451 0.6Russia . . . . . . . . . . . . . . . . . . . . . . . 1,650 1,672 1,663 1,657 1,684 1,727 1,816 1,958 0.6Other . . . . . . . . . . . . . . . . . . . . . . . . 1,193 1,204 1,233 1,254 1,299 1,359 1,417 1,493 0.7
Non-OECD Asia. . . . . . . . . . . . . . . . 8,382 8,831 9,425 11,449 13,537 15,931 18,518 21,276 3.0China. . . . . . . . . . . . . . . . . . . . . . . . 5,558 5,862 6,284 7,874 9,454 11,235 13,070 14,907 3.1India . . . . . . . . . . . . . . . . . . . . . . . . 1,187 1,287 1,399 1,592 1,823 2,034 2,272 2,569 2.2Other Non-OECD Asia . . . . . . . . . . 1,637 1,681 1,743 1,984 2,260 2,662 3,176 3,800 2.8
Middle East . . . . . . . . . . . . . . . . . . . 1,395 1,446 1,515 1,970 2,209 2,413 2,639 2,959 2.4Africa . . . . . . . . . . . . . . . . . . . . . . . . 982 988 1,011 1,175 1,285 1,432 1,592 1,798 2.1Central and South America . . . . . . 1,092 1,133 1,169 1,343 1,486 1,625 1,785 1,967 1.9Brazil . . . . . . . . . . . . . . . . . . . . . . . . 366 380 394 494 569 658 763 872 2.9Other Central and South America. . 726 753 775 849 916 967 1,022 1,095 1.2Total Non-OECD . . . . . . . . . . . . . 14,693 15,274 16,017 18,849 21,500 24,488 27,768 31,451 2.4
Total World . . . . . . . . . . . . . . . . . . . . 28,306 28,812 29,694 32,059 35,157 38,707 42,617 47,070 1.7aIncludes the 50 States and the District of Columbia.Note: The U.S. numbers include carbon dioxide emissions attributable to renewable energy sources.Sources: History: U.S. Energy Information Administration (EIA), International Energy Statistics database (as of November 2009),
web site www.eia.gov/emeu/international. Projections: EIA, Annual Energy Outlook 2010, DOE/EIA-0383(2010) (Washington, DC,April 2010), AEO2010 National Energy Modeling System, run HM2010.D020310A, web site www.eia.gov/oiaf/aeo; and WorldEnergy Projection System Plus (2010).

Table B10. World carbon dioxide emissions from liquids use by region, High Economic Growth case,2005-2035(Million metric tons carbon dioxide)
High Economic Growth case projections
U.S. Energy Information Administration / International Energy Outlook 2010 173
Region/Country
History Projections Average annualpercent change,
2007-20352005 2006 2007 2015 2020 2025 2030 2035
OECDOECD North America . . . . . . . . . . . 3,194 3,142 3,150 3,070 3,156 3,306 3,471 3,599 0.5United Statesa. . . . . . . . . . . . . . . . . 2,626 2,595 2,589 2,504 2,569 2,672 2,779 2,840 0.3Canada . . . . . . . . . . . . . . . . . . . . . . 301 281 288 285 285 298 316 335 0.5Mexico. . . . . . . . . . . . . . . . . . . . . . . 267 265 273 281 302 336 377 424 1.6
OECD Europe . . . . . . . . . . . . . . . . . 2,133 2,125 2,082 1,937 1,893 1,928 1,987 2,040 -0.1OECD Asia . . . . . . . . . . . . . . . . . . . . 1,031 991 980 918 969 1,008 1,043 1,079 0.3
Japan . . . . . . . . . . . . . . . . . . . . . . . 646 622 603 514 542 547 546 545 -0.4South Korea . . . . . . . . . . . . . . . . . . 239 221 227 246 267 293 320 348 1.5Australia/New Zealand . . . . . . . . . . 147 148 150 159 160 167 176 186 0.8Total OECD . . . . . . . . . . . . . . . . . 6,358 6,258 6,212 5,926 6,018 6,242 6,501 6,719 0.3
Non-OECDNon-OECD Europe and Eurasia. . . 686 677 682 695 709 738 777 827 0.7Russia . . . . . . . . . . . . . . . . . . . . . . . 383 368 366 377 378 383 393 417 0.5Other . . . . . . . . . . . . . . . . . . . . . . . . 303 310 316 318 331 356 384 410 0.9
Non-OECD Asia. . . . . . . . . . . . . . . . 2,081 2,147 2,225 2,723 3,160 3,690 4,252 4,824 2.8China. . . . . . . . . . . . . . . . . . . . . . . . 889 928 969 1,306 1,558 1,864 2,163 2,450 3.4India . . . . . . . . . . . . . . . . . . . . . . . . 314 349 369 425 489 548 616 689 2.3Other Non-OECD Asia . . . . . . . . . . 878 870 887 992 1,113 1,278 1,473 1,685 2.3
Middle East . . . . . . . . . . . . . . . . . . . 817 839 886 1,023 1,129 1,270 1,470 1,693 2.3Africa . . . . . . . . . . . . . . . . . . . . . . . . 423 428 441 508 534 587 653 724 1.8Central and South America . . . . . . 762 796 823 924 960 1,038 1,136 1,227 1.4Brazil . . . . . . . . . . . . . . . . . . . . . . . . 288 301 311 382 417 468 531 591 2.3Other Central and South America. . 474 495 512 542 543 570 605 637 0.8Total Non-OECD . . . . . . . . . . . . . 4,768 4,888 5,057 5,873 6,493 7,324 8,289 9,295 2.2
Total World . . . . . . . . . . . . . . . . . . . . 11,126 11,146 11,268 11,799 12,511 13,566 14,790 16,014 1.3aIncludes the 50 States and the District of Columbia.Sources: History: U.S. Energy Information Administration (EIA), International Energy Statistics database (as of November 2009),
web site www.eia.gov/emeu/international. Projections: EIA, Annual Energy Outlook 2010, DOE/EIA-0383(2010) (Washington, DC,April 2010), AEO2010 National Energy Modeling System, run HM2010.D020310A, web site www.eia.gov/oiaf/aeo; and WorldEnergy Projection System Plus (2010).

Table B11. World carbon dioxide emissions from natural gas use by region, High Economic Growth case,2005-2035(Million metric tons carbon dioxide)
Appendix B
174 U.S. Energy Information Administration / International Energy Outlook 2010
Region/Country
History Projections Average annualpercent change,
2007-20352005 2006 2007 2015 2020 2025 2030 2035
OECDOECD North America . . . . . . . . . . . 1,468 1,463 1,524 1,510 1,631 1,807 1,932 2,037 1.0United Statesa. . . . . . . . . . . . . . . . . 1,176 1,157 1,232 1,192 1,257 1,361 1,423 1,456 0.6Canada . . . . . . . . . . . . . . . . . . . . . . 186 181 157 175 193 215 234 256 1.8Mexico. . . . . . . . . . . . . . . . . . . . . . . 106 125 135 144 181 231 275 325 3.2
OECD Europe . . . . . . . . . . . . . . . . . 1,048 1,045 1,049 1,111 1,179 1,231 1,245 1,280 0.7OECD Asia . . . . . . . . . . . . . . . . . . . . 311 336 355 395 426 455 468 480 1.1
Japan . . . . . . . . . . . . . . . . . . . . . . . 183 202 208 212 227 241 245 246 0.6South Korea . . . . . . . . . . . . . . . . . . 64 68 73 89 98 106 108 110 1.5Australia/New Zealand . . . . . . . . . . 65 66 73 93 100 107 114 124 1.9Total OECD . . . . . . . . . . . . . . . . . 2,827 2,843 2,928 3,016 3,236 3,493 3,645 3,797 0.9
Non-OECDNon-OECD Europe and Eurasia. . . 1,367 1,367 1,397 1,461 1,506 1,549 1,560 1,583 0.4Russia . . . . . . . . . . . . . . . . . . . . . . . 865 889 897 898 914 933 943 960 0.2Other . . . . . . . . . . . . . . . . . . . . . . . . 502 478 500 563 592 616 616 623 0.8
Non-OECD Asia. . . . . . . . . . . . . . . . 459 518 572 918 1,118 1,278 1,402 1,524 3.6China. . . . . . . . . . . . . . . . . . . . . . . . 92 111 138 272 345 418 489 548 5.0India . . . . . . . . . . . . . . . . . . . . . . . . 70 75 80 173 216 235 239 242 4.0Other Non-OECD Asia . . . . . . . . . . 297 332 354 473 557 625 674 735 2.6
Middle East . . . . . . . . . . . . . . . . . . . 543 571 594 914 1,048 1,112 1,137 1,222 2.6Africa . . . . . . . . . . . . . . . . . . . . . . . . 169 166 176 275 327 368 374 390 2.9Central and South America . . . . . . 250 256 259 332 426 472 510 562 2.8Brazil . . . . . . . . . . . . . . . . . . . . . . . . 36 38 39 65 92 113 133 151 5.0Other Central and South America. . 214 218 220 267 334 358 376 411 2.3Total Non-OECD . . . . . . . . . . . . . 2,788 2,877 2,997 3,900 4,425 4,778 4,982 5,280 2.0
Total World . . . . . . . . . . . . . . . . . . . . 5,614 5,720 5,925 6,916 7,661 8,271 8,626 9,078 1.5aIncludes the 50 States and the District of Columbia.Sources: History: U.S. Energy Information Administration (EIA), International Energy Statistics database (as of November 2009),
web site www.eia.gov/emeu/international. Projections: EIA, Annual Energy Outlook 2010, DOE/EIA-0383(2010) (Washington, DC,April 2010), AEO2010 National Energy Modeling System, run HM2010.D020310A, web site www.eia.gov/oiaf/aeo; and WorldEnergy Projection System Plus (2010).

Table B12. World carbon dioxide emissions from coal use by region, High Economic Growth case,2005-2035(Million metric tons carbon dioxide)
High Economic Growth case projections
U.S. Energy Information Administration / International Energy Outlook 2010 175
Region/Country
History Projections Average annualpercent change,
2007-20352005 2006 2007 2015 2020 2025 2030 2035
OECDOECD North America . . . . . . . . . . . 2,339 2,299 2,331 2,284 2,413 2,457 2,577 2,787 0.6United Statesa. . . . . . . . . . . . . . . . . 2,161 2,130 2,155 2,150 2,278 2,313 2,409 2,560 0.6Canada . . . . . . . . . . . . . . . . . . . . . . 142 133 141 100 100 106 119 137 -0.1Mexico. . . . . . . . . . . . . . . . . . . . . . . 36 36 36 34 35 38 49 90 3.3
OECD Europe . . . . . . . . . . . . . . . . . 1,217 1,256 1,256 1,106 1,090 1,078 1,106 1,199 -0.2OECD Asia . . . . . . . . . . . . . . . . . . . . 861 870 938 867 888 939 1,008 1,106 0.6
Japan . . . . . . . . . . . . . . . . . . . . . . . 425 429 451 390 385 380 381 391 -0.5South Korea . . . . . . . . . . . . . . . . . . 193 197 216 209 228 274 332 404 2.3Australia/New Zealand . . . . . . . . . . 242 244 271 269 275 284 296 311 0.5Total OECD . . . . . . . . . . . . . . . . . 4,417 4,425 4,525 4,257 4,391 4,474 4,692 5,091 0.4
Non-OECDNon-OECD Europe and Eurasia. . . 790 832 819 755 768 798 896 1,041 0.9Russia . . . . . . . . . . . . . . . . . . . . . . . 402 416 401 382 392 411 480 581 1.3Other . . . . . . . . . . . . . . . . . . . . . . . . 388 417 417 373 376 387 416 460 0.4
Non-OECD Asia. . . . . . . . . . . . . . . . 5,843 6,165 6,629 7,808 9,259 10,962 12,864 14,928 2.9China. . . . . . . . . . . . . . . . . . . . . . . . 4,578 4,824 5,177 6,296 7,552 8,953 10,418 11,910 3.0India . . . . . . . . . . . . . . . . . . . . . . . . 803 863 950 994 1,118 1,251 1,418 1,638 2.0Other Non-OECD Asia . . . . . . . . . . 461 479 502 519 590 758 1,029 1,381 3.7
Middle East . . . . . . . . . . . . . . . . . . . 36 36 35 33 32 32 32 43 0.8Africa . . . . . . . . . . . . . . . . . . . . . . . . 390 394 395 392 424 477 565 684 2.0Central and South America . . . . . . 80 81 87 87 100 115 139 179 2.6Brazil . . . . . . . . . . . . . . . . . . . . . . . . 42 41 44 47 60 76 98 131 4.0Other Central and South America. . 38 40 43 40 40 39 41 48 0.4Total Non-OECD . . . . . . . . . . . . . 7,138 7,509 7,964 9,075 10,582 12,385 14,498 16,876 2.7
Total World . . . . . . . . . . . . . . . . . . . . 11,555 11,934 12,489 13,332 14,973 16,859 19,189 21,967 2.0aIncludes the 50 States and the District of Columbia.Sources: History: U.S. Energy Information Administration (EIA), International Energy Statistics database (as of November 2009),
web site www.eia.gov/emeu/international. Projections: EIA, Annual Energy Outlook 2010, DOE/EIA-0383(2010) (Washington, DC,April 2010), AEO2010 National Energy Modeling System, run HM2010.D020310A, web site www.eia.gov/oiaf/aeo; and WorldEnergy Projection System Plus (2010).

This page intentionally left blank.

Appendix C
Low Economic Growth Case Projections:• World energy consumption• Gross domestic product• Carbon dioxide emissions

This page intentionally left blank.

Table C1. World total energy consumption by region, Low Economic Growth case, 2005-2035(Quadrillion Btu)
Low Economic Growth case projections
U.S. Energy Information Administration / International Energy Outlook 2010 179
Region/Country
History Projections Average annualpercent change,
2007-20352005 2006 2007 2015 2020 2025 2030 2035
OECDOECD North America . . . . . . . . . . . 122.4 121.8 123.7 121.2 124.3 126.6 129.5 132.7 0.3United Statesa. . . . . . . . . . . . . . . . . 100.5 99.8 101.7 98.9 100.8 101.4 102.6 103.6 0.1Canada . . . . . . . . . . . . . . . . . . . . . . 14.8 14.5 14.3 14.4 14.8 15.5 16.1 16.8 0.6Mexico. . . . . . . . . . . . . . . . . . . . . . . 7.1 7.4 7.7 7.9 8.7 9.8 10.9 12.3 1.7
OECD Europe . . . . . . . . . . . . . . . . . 82.4 82.9 82.3 80.8 80.9 81.8 82.0 82.3 0.0OECD Asia . . . . . . . . . . . . . . . . . . . . 39.0 39.5 39.7 39.0 40.5 41.3 41.9 42.5 0.2Japan . . . . . . . . . . . . . . . . . . . . . . . 23.1 23.3 22.8 20.6 21.2 21.0 20.7 20.4 -0.4South Korea . . . . . . . . . . . . . . . . . . 9.3 9.4 9.7 10.5 11.3 12.1 12.8 13.6 1.2Australia/New Zealand . . . . . . . . . . 6.6 6.7 7.2 7.9 8.0 8.1 8.3 8.5 0.6Total OECD . . . . . . . . . . . . . . . . . 243.8 244.1 245.7 241.0 245.7 249.7 253.4 257.4 0.2
Non-OECDNon-OECD Europe and Eurasia. . . 50.4 51.0 51.5 51.9 53.2 54.5 55.3 56.7 0.3Russia . . . . . . . . . . . . . . . . . . . . . . . 29.7 30.5 30.5 30.4 31.1 31.9 32.5 33.6 0.4Other . . . . . . . . . . . . . . . . . . . . . . . . 20.7 20.6 21.0 21.5 22.1 22.6 22.7 23.1 0.3
Non-OECD Asia. . . . . . . . . . . . . . . . 112.6 119.6 127.1 156.6 181.1 205.1 228.7 251.7 2.5China. . . . . . . . . . . . . . . . . . . . . . . . 68.4 73.0 78.0 99.6 117.0 134.5 150.7 165.1 2.7India . . . . . . . . . . . . . . . . . . . . . . . . 17.5 18.8 20.3 23.9 27.2 29.5 31.6 34.2 1.9Other Non-OECD Asia . . . . . . . . . . 26.7 27.8 28.8 33.1 36.8 41.1 46.4 52.4 2.2
Middle East . . . . . . . . . . . . . . . . . . . 22.8 23.9 25.1 32.4 35.3 37.1 39.0 41.8 1.8Africa . . . . . . . . . . . . . . . . . . . . . . . . 17.2 17.3 17.8 20.5 21.7 23.3 24.7 26.4 1.4Central and South America . . . . . . 26.0 27.1 28.0 31.5 34.1 36.4 38.9 41.2 1.4Brazil . . . . . . . . . . . . . . . . . . . . . . . . 11.2 11.7 12.3 14.6 16.2 18.2 20.2 21.9 2.0Other Central and South America. . 14.8 15.4 15.7 16.9 17.9 18.2 18.7 19.3 0.8Total Non-OECD . . . . . . . . . . . . . 229.0 239.0 249.5 292.9 325.3 356.5 386.6 417.9 1.9
Total World . . . . . . . . . . . . . . . . . . . . 472.7 483.1 495.2 533.9 571.0 606.2 640.0 675.3 1.1aIncludes the 50 States and the District of Columbia.Notes: Energy totals include net imports of coal coke and electricity generated from biomass in the United States. Totals may not
equal sum of components due to independent rounding. The electricity portion of the national fuel consumption values consists ofgeneration for domestic use plus an adjustment for electricity trade based on a fuel’s share of total generation in the exporting coun-try.
Sources: History: U.S. Energy Information Administration (EIA), International Energy Statistics database (as of November 2009),web site www.eia.gov/emeu/international; and International Energy Agency, “Balances of OECD and Non-OECD Statistics” (2009),web site www.iea.org (subscription site). Projections: EIA, Annual Energy Outlook 2010, DOE/EIA-0383(2010) (Washington, DC,April 2010), AEO2010 National Energy Modeling System, run LM2010.D011110A, web site www.eia.gov/oiaf/aeo; and WorldEnergy Projection System Plus (2010).

Table C2. World total energy consumption by region and fuel, Low Economic Growth case, 2005-2035(Quadrillion Btu)
Appendix C
180 U.S. Energy Information Administration / International Energy Outlook 2010
Region/Country
History Projections Average annualpercent change,
2007-20352005 2006 2007 2015 2020 2025 2030 2035
OECDOECD North AmericaLiquids . . . . . . . . . . . . . . . . . . . . . 49.5 49.0 49.4 46.1 45.9 46.1 46.4 46.8 -0.2Natural gas. . . . . . . . . . . . . . . . . . 28.1 28.1 29.2 28.0 29.0 30.1 31.4 32.8 0.4Coal . . . . . . . . . . . . . . . . . . . . . . . 24.7 24.3 24.6 23.4 23.7 23.6 24.2 24.6 0.0Nuclear. . . . . . . . . . . . . . . . . . . . . 9.2 9.4 9.6 10.1 10.8 10.9 11.0 11.2 0.6Other . . . . . . . . . . . . . . . . . . . . . . 10.9 11.1 11.0 13.6 15.0 15.9 16.5 17.4 1.7Total. . . . . . . . . . . . . . . . . . . . . . 122.4 121.8 123.7 121.2 124.3 126.6 129.5 132.7 0.3
OECD EuropeLiquids . . . . . . . . . . . . . . . . . . . . . 32.3 32.4 31.6 28.5 26.7 26.3 26.1 25.8 -0.7Natural gas. . . . . . . . . . . . . . . . . . 19.7 19.7 19.8 20.7 21.0 21.0 20.7 20.8 0.2Coal . . . . . . . . . . . . . . . . . . . . . . . 12.7 13.1 13.2 11.4 11.0 10.6 10.3 10.1 -1.0Nuclear. . . . . . . . . . . . . . . . . . . . . 9.7 9.6 9.1 9.7 10.0 10.4 10.8 11.1 0.7Other . . . . . . . . . . . . . . . . . . . . . . 7.9 8.1 8.7 10.5 12.2 13.5 14.0 14.4 1.8Total. . . . . . . . . . . . . . . . . . . . . . 82.4 82.9 82.3 80.8 80.9 81.8 82.0 82.3 0.0
OECD AsiaLiquids . . . . . . . . . . . . . . . . . . . . . 17.5 17.2 16.9 15.3 15.5 15.5 15.4 15.3 -0.4Natural gas. . . . . . . . . . . . . . . . . . 5.9 6.3 6.7 7.3 7.4 7.7 7.7 7.8 0.5Coal . . . . . . . . . . . . . . . . . . . . . . . 9.2 9.3 10.1 9.0 9.0 9.0 9.1 9.3 -0.3Nuclear. . . . . . . . . . . . . . . . . . . . . 4.3 4.3 3.9 4.7 5.7 6.0 6.5 6.9 2.1Other . . . . . . . . . . . . . . . . . . . . . . 2.1 2.2 2.1 2.6 2.9 3.1 3.2 3.3 1.5Total. . . . . . . . . . . . . . . . . . . . . . 39.0 39.5 39.7 39.0 40.5 41.3 41.9 42.5 0.2
Total OECDLiquids . . . . . . . . . . . . . . . . . . . . . 99.3 98.6 97.9 89.9 88.1 87.8 87.9 87.9 -0.4Natural gas. . . . . . . . . . . . . . . . . . 53.7 54.1 55.6 56.0 57.5 58.8 59.8 61.3 0.3Coal . . . . . . . . . . . . . . . . . . . . . . . 46.7 46.7 47.9 43.9 43.7 43.2 43.6 44.0 -0.3Nuclear. . . . . . . . . . . . . . . . . . . . . 23.2 23.3 22.6 24.5 26.4 27.3 28.3 29.2 0.9Other . . . . . . . . . . . . . . . . . . . . . . 20.9 21.4 21.7 26.7 30.1 32.5 33.7 35.1 1.7Total. . . . . . . . . . . . . . . . . . . . . . 243.8 244.1 245.7 241.0 245.7 249.7 253.4 257.4 0.2
Non-OECDNon-OECD Europe and EurasiaLiquids . . . . . . . . . . . . . . . . . . . . . 10.1 10.3 10.4 9.9 9.7 9.6 9.8 9.9 -0.1Natural gas. . . . . . . . . . . . . . . . . . 25.8 25.8 26.3 27.1 27.7 28.0 28.0 28.1 0.2Coal . . . . . . . . . . . . . . . . . . . . . . . 8.4 8.8 8.7 7.9 7.7 7.6 7.8 8.1 -0.2Nuclear. . . . . . . . . . . . . . . . . . . . . 2.9 2.9 3.0 3.7 4.5 5.4 5.8 6.2 2.6Other . . . . . . . . . . . . . . . . . . . . . . 3.2 3.2 3.1 3.3 3.6 3.8 4.0 4.3 1.2Total. . . . . . . . . . . . . . . . . . . . . . 50.4 51.0 51.5 51.9 53.2 54.5 55.3 56.7 0.3
Non-OECD AsiaLiquids . . . . . . . . . . . . . . . . . . . . . 31.7 33.4 34.6 40.7 44.7 49.7 54.5 58.9 1.9Natural gas. . . . . . . . . . . . . . . . . . 8.6 9.8 10.8 17.0 20.6 23.5 25.6 27.4 3.4Coal . . . . . . . . . . . . . . . . . . . . . . . 61.9 65.4 70.3 79.6 89.9 100.8 112.3 124.3 2.1Nuclear. . . . . . . . . . . . . . . . . . . . . 1.1 1.1 1.2 3.2 5.6 7.2 8.4 9.8 7.7Other . . . . . . . . . . . . . . . . . . . . . . 9.3 9.9 10.2 16.2 20.2 23.9 27.9 31.3 4.1Total. . . . . . . . . . . . . . . . . . . . . . 112.6 119.6 127.1 156.6 181.1 205.1 228.7 251.7 2.5
See notes at end of table.

Table C2. World total energy consumption by region and fuel, Low Economic Growth case, 2005-2035(continued)(Quadrillion Btu)
Low Economic Growth case projections
U.S. Energy Information Administration / International Energy Outlook 2010 181
Region/Country
History Projections Average annualpercent change,
2007-20352005 2006 2007 2015 2020 2025 2030 2035
Non-OECD (continued)Middle EastLiquids . . . . . . . . . . . . . . . . . . . . . 12.0 12.5 13.3 14.7 15.4 16.5 17.9 19.6 1.4Natural gas. . . . . . . . . . . . . . . . . . 10.2 10.8 11.2 16.8 18.8 19.5 19.8 20.7 2.2Coal . . . . . . . . . . . . . . . . . . . . . . . 0.4 0.4 0.4 0.4 0.3 0.3 0.3 0.3 -0.3Nuclear. . . . . . . . . . . . . . . . . . . . . 0.0 0.0 0.0 0.1 0.2 0.3 0.4 0.5 —Other . . . . . . . . . . . . . . . . . . . . . . 0.3 0.3 0.3 0.4 0.5 0.5 0.6 0.6 2.9Total. . . . . . . . . . . . . . . . . . . . . . 22.8 23.9 25.1 32.4 35.3 37.1 39.0 41.8 1.8
AfricaLiquids . . . . . . . . . . . . . . . . . . . . . 6.1 6.2 6.4 7.1 7.1 7.4 7.9 8.4 1.0Natural gas. . . . . . . . . . . . . . . . . . 3.2 3.1 3.3 5.0 6.0 6.7 7.0 7.3 2.8Coal . . . . . . . . . . . . . . . . . . . . . . . 4.2 4.2 4.2 4.1 4.2 4.3 4.7 5.3 0.8Nuclear. . . . . . . . . . . . . . . . . . . . . 0.1 0.1 0.1 0.2 0.2 0.2 0.2 0.3 3.5Other . . . . . . . . . . . . . . . . . . . . . . 3.6 3.6 3.7 4.1 4.3 4.6 4.9 5.2 1.2Total. . . . . . . . . . . . . . . . . . . . . . 17.2 17.3 17.8 20.5 21.7 23.3 24.7 26.4 1.4
Central and South AmericaLiquids . . . . . . . . . . . . . . . . . . . . . 11.3 11.8 12.2 13.2 13.0 13.5 14.1 14.5 0.6Natural gas. . . . . . . . . . . . . . . . . . 4.7 4.8 4.9 5.8 6.8 7.1 7.4 7.8 1.7Coal . . . . . . . . . . . . . . . . . . . . . . . 0.8 0.9 0.9 0.9 1.0 1.1 1.3 1.5 1.7Nuclear. . . . . . . . . . . . . . . . . . . . . 0.2 0.2 0.2 0.3 0.4 0.5 0.5 0.7 4.2Other . . . . . . . . . . . . . . . . . . . . . . 9.0 9.4 9.8 11.3 12.9 14.3 15.7 16.7 1.9Total. . . . . . . . . . . . . . . . . . . . . . 26.0 27.1 28.0 31.5 34.1 36.4 38.9 41.2 1.4
Total Non-OECDLiquids . . . . . . . . . . . . . . . . . . . . . 71.1 74.2 76.8 85.6 89.9 96.8 104.1 111.4 1.3Natural gas. . . . . . . . . . . . . . . . . . 52.5 54.2 56.5 71.7 79.9 84.9 87.8 91.3 1.7Coal . . . . . . . . . . . . . . . . . . . . . . . 75.7 79.7 84.6 92.8 103.1 114.2 126.3 139.5 1.8Nuclear. . . . . . . . . . . . . . . . . . . . . 4.3 4.4 4.5 7.5 10.9 13.6 15.3 17.5 4.9Other . . . . . . . . . . . . . . . . . . . . . . 25.3 26.5 27.1 35.3 41.5 47.1 53.0 58.2 2.8Total. . . . . . . . . . . . . . . . . . . . . . 229.0 239.0 249.5 292.9 325.3 356.5 386.6 417.9 1.9
Total WorldLiquids . . . . . . . . . . . . . . . . . . . . . 170.4 172.8 174.7 175.6 178.0 184.6 192.1 199.3 0.5Natural gas. . . . . . . . . . . . . . . . . . 106.3 108.3 112.1 127.6 137.4 143.7 147.6 152.6 1.1Coal . . . . . . . . . . . . . . . . . . . . . . . 122.3 126.4 132.4 136.7 146.8 157.4 169.9 183.5 1.2Nuclear. . . . . . . . . . . . . . . . . . . . . 27.5 27.8 27.1 32.0 37.3 40.9 43.6 46.7 2.0Other . . . . . . . . . . . . . . . . . . . . . . 46.2 47.9 48.8 62.0 71.5 79.6 86.7 93.3 2.3Total. . . . . . . . . . . . . . . . . . . . . . 472.7 483.1 495.2 533.9 571.0 606.2 640.0 675.3 1.1
Notes: Energy totals include net imports of coal coke and electricity generated from biomass in the United States. Totals may notequal sum of components due to independent rounding. The electricity portion of the national fuel consumption values consists ofgeneration for domestic use plus an adjustment for electricity trade based on a fuel’s share of total generation in the exporting coun-try.
Sources: History: U.S. Energy Information Administration (EIA), International Energy Statistics database (as of November 2009),web site www.eia.gov/emeu/international; and International Energy Agency, “Balances of OECD and Non-OECD Statistics” (2009),web site www.iea.org (subscription site). Projections: EIA, Annual Energy Outlook 2010, DOE/EIA-0383(2010) (Washington, DC,April 2010), AEO2010 National Energy Modeling System, run LM2010.D011110A, web site www.eia.gov/oiaf/aeo; and WorldEnergy Projection System Plus (2010).

Table C3. World gross domestic product (GDP) by region expressed in purchasing power parity,Low Economic Growth case, 2005-2035(Billion 2005 dollars)
Appendix C
182 U.S. Energy Information Administration / International Energy Outlook 2010
Region/Country
History Projections Average annualpercent change,
2007-20352005 2006 2007 2015 2020 2025 2030 2035
OECDOECD North America . . . . . . . . . . . 14,883 15,327 15,662 17,172 19,570 21,768 24,018 26,444 1.9United Statesa. . . . . . . . . . . . . . . . . 12,422 12,768 13,027 14,201 16,161 17,863 19,530 21,275 1.8Canada . . . . . . . . . . . . . . . . . . . . . . 1,167 1,200 1,231 1,394 1,522 1,645 1,782 1,930 1.6Mexico. . . . . . . . . . . . . . . . . . . . . . . 1,293 1,359 1,405 1,577 1,887 2,260 2,706 3,239 3.0
OECD Europe . . . . . . . . . . . . . . . . . 13,928 14,412 14,849 15,737 17,086 18,362 19,636 20,951 1.2OECD Asia . . . . . . . . . . . . . . . . . . . . 5,535 5,681 5,850 6,341 6,716 6,985 7,254 7,505 0.9
Japan . . . . . . . . . . . . . . . . . . . . . . . 3,872 3,951 4,041 4,134 4,203 4,176 4,145 4,099 0.1South Korea . . . . . . . . . . . . . . . . . . 892 938 986 1,227 1,417 1,597 1,768 1,929 2.4Australia/New Zealand . . . . . . . . . . 771 792 823 980 1,097 1,213 1,341 1,477 2.1Total OECD . . . . . . . . . . . . . . . . . 34,345 35,420 36,361 39,251 43,373 47,115 50,908 54,899 1.5
Non-OECDNon-OECD Europe and Eurasia. . . 2,977 3,218 3,481 4,073 4,684 5,303 5,921 6,556 2.3Russia . . . . . . . . . . . . . . . . . . . . . . . 1,703 1,834 1,982 2,281 2,608 2,962 3,328 3,720 2.3Other . . . . . . . . . . . . . . . . . . . . . . . . 1,275 1,384 1,499 1,791 2,076 2,341 2,593 2,836 2.3
Non-OECD Asia. . . . . . . . . . . . . . . . 11,897 13,013 14,323 23,388 30,225 37,368 44,679 52,143 4.7China. . . . . . . . . . . . . . . . . . . . . . . . 5,408 6,035 6,820 12,382 16,483 20,819 24,989 28,950 5.3India . . . . . . . . . . . . . . . . . . . . . . . . 2,440 2,676 2,918 4,712 6,021 7,260 8,622 10,116 4.5Other Non-OECD Asia . . . . . . . . . . 4,049 4,302 4,585 6,294 7,720 9,289 11,069 13,076 3.8
Middle East . . . . . . . . . . . . . . . . . . . 1,985 2,145 2,261 2,984 3,550 4,141 4,822 5,582 3.3Africa . . . . . . . . . . . . . . . . . . . . . . . . 2,360 2,494 2,638 3,536 4,178 4,833 5,513 6,255 3.1Central and South America . . . . . . 3,612 3,822 4,066 5,190 6,037 6,956 7,966 9,076 2.9Brazil . . . . . . . . . . . . . . . . . . . . . . . . 1,534 1,595 1,685 2,283 2,730 3,246 3,842 4,523 3.6Other Central and South America. . 2,079 2,227 2,381 2,907 3,307 3,710 4,124 4,553 2.3Total Non-OECD . . . . . . . . . . . . . 22,832 24,692 26,769 39,171 48,674 58,602 68,901 79,612 4.0
Total World . . . . . . . . . . . . . . . . . . . . 57,177 60,112 63,130 78,422 92,046 105,717 119,809 134,511 2.7aIncludes the 50 States and the District of Columbia.Note: Totals may not equal sum of components due to independent rounding.Sources: History: IHS Global Insight, World Overview (Lexington, MA, various issues). Projections: Derived from IHS Global
Insight, World Overview, Third Quarter 2009 (Lexington, MA, September 2009); and U.S. Energy Information Administration, AnnualEnergy Outlook 2010, DOE/EIA-0383(2010) (Washington, DC, April 2010), Table B4.

Table C4. World liquids consumption by region, Low Economic Growth case, 2005-2035(Million barrels per day)
Low Economic Growth case projections
U.S. Energy Information Administration / International Energy Outlook 2010 183
Region/Country
History Projections Average annualpercent change,
2007-20352005 2006 2007 2015 2020 2025 2030 2035
OECDOECD North America . . . . . . . . . . . 25.2 25.0 25.1 23.9 23.8 23.9 24.1 24.3 -0.1United Statesa. . . . . . . . . . . . . . . . . 20.8 20.7 20.6 19.6 19.6 19.6 19.6 19.6 -0.2Canada . . . . . . . . . . . . . . . . . . . . . . 2.3 2.3 2.3 2.2 2.1 2.1 2.1 2.1 -0.3Mexico. . . . . . . . . . . . . . . . . . . . . . . 2.1 2.1 2.1 2.1 2.2 2.3 2.4 2.6 0.7
OECD Europe . . . . . . . . . . . . . . . . . 15.7 15.7 15.3 13.8 13.0 12.7 12.7 12.5 -0.7OECD Asia . . . . . . . . . . . . . . . . . . . . 8.6 8.5 8.4 7.6 7.7 7.7 7.6 7.6 -0.4Japan . . . . . . . . . . . . . . . . . . . . . . . 5.3 5.2 5.0 4.1 4.2 4.1 3.9 3.7 -1.1South Korea . . . . . . . . . . . . . . . . . . 2.2 2.2 2.2 2.3 2.4 2.5 2.6 2.8 0.7Australia/New Zealand . . . . . . . . . . 1.1 1.1 1.1 1.1 1.1 1.1 1.1 1.1 -0.1
Total OECD . . . . . . . . . . . . . . . . . 49.5 49.1 48.8 45.3 44.5 44.3 44.4 44.4 -0.3
Non-OECDNon-OECD Europe and Eurasia. . . 4.9 5.0 5.1 4.8 4.7 4.7 4.8 4.9 -0.2Russia . . . . . . . . . . . . . . . . . . . . . . . 2.8 2.9 2.9 2.7 2.6 2.6 2.5 2.6 -0.3Other . . . . . . . . . . . . . . . . . . . . . . . . 2.1 2.2 2.2 2.1 2.1 2.1 2.2 2.3 0.1
Non-OECD Asia. . . . . . . . . . . . . . . . 15.4 16.2 16.8 19.7 21.7 24.1 26.5 28.6 1.9China. . . . . . . . . . . . . . . . . . . . . . . . 6.7 7.3 7.6 9.8 11.1 12.6 13.9 15.0 2.5India . . . . . . . . . . . . . . . . . . . . . . . . 2.5 2.7 2.8 3.1 3.4 3.6 3.9 4.1 1.3Other Non-OECD Asia . . . . . . . . . . 6.2 6.2 6.3 6.8 7.2 7.9 8.7 9.4 1.4
Middle East . . . . . . . . . . . . . . . . . . . 5.8 6.0 6.4 7.1 7.4 8.0 8.6 9.5 1.4Africa . . . . . . . . . . . . . . . . . . . . . . . . 3.0 3.0 3.1 3.5 3.5 3.6 3.9 4.1 1.0Central and South America . . . . . . 5.5 5.8 6.0 6.4 6.4 6.6 6.9 7.1 0.6Brazil . . . . . . . . . . . . . . . . . . . . . . . . 2.2 2.3 2.4 2.8 2.9 3.0 3.3 3.5 1.4Other Central and South America. . 3.3 3.5 3.6 3.7 3.5 3.5 3.6 3.6 0.0Total Non-OECD . . . . . . . . . . . . . 34.6 36.1 37.3 41.6 43.7 47.0 50.6 54.1 1.3
Total World . . . . . . . . . . . . . . . . . . . . 84.0 85.2 86.1 86.9 88.1 91.3 95.0 98.5 0.5aIncludes the 50 States and the District of Columbia.Note: Totals may not equal sum of components due to independent rounding.Sources: History: U.S. Energy Information Administration (EIA), International Energy Statistics database (as of November 2009),
web site www.eia.gov/emeu/international. Projections: EIA, Annual Energy Outlook 2010, DOE/EIA-0383(2010) (Washington, DC,April 2010), AEO2010 National Energy Modeling System, run LM2010.D011110A, web site www.eia.gov/oiaf/aeo; and WorldEnergy Projection System Plus (2010).

Table C5. World natural gas consumption by region, Low Economic Growth case, 2005-2035(Trillion cubic feet)
Appendix C
184 U.S. Energy Information Administration / International Energy Outlook 2010
Region/Country
History Projections Average annualpercent change,
2007-20352005 2006 2007 2015 2020 2025 2030 2035
OECDOECD North America . . . . . . . . . . . 27.3 27.2 28.3 27.1 28.1 29.1 30.3 31.7 0.4United Statesa. . . . . . . . . . . . . . . . . 22.0 21.7 23.0 21.5 21.8 21.9 22.3 22.7 -0.1Canada . . . . . . . . . . . . . . . . . . . . . . 3.4 3.3 2.9 3.2 3.3 3.5 3.7 3.9 1.0Mexico. . . . . . . . . . . . . . . . . . . . . . . 1.9 2.2 2.4 2.5 3.0 3.7 4.3 5.1 2.8
OECD Europe . . . . . . . . . . . . . . . . . 19.2 19.1 19.2 20.1 20.3 20.3 20.1 20.1 0.2OECD Asia . . . . . . . . . . . . . . . . . . . . 5.3 5.8 6.3 6.9 7.0 7.2 7.3 7.3 0.5Japan . . . . . . . . . . . . . . . . . . . . . . . 3.1 3.4 3.7 3.8 3.7 3.7 3.6 3.5 -0.2South Korea . . . . . . . . . . . . . . . . . . 1.1 1.1 1.2 1.4 1.6 1.7 1.7 1.8 1.3Australia/New Zealand . . . . . . . . . . 1.1 1.2 1.3 1.6 1.7 1.8 1.9 2.0 1.5Total OECD . . . . . . . . . . . . . . . . . 51.8 52.1 53.7 54.0 55.5 56.7 57.7 59.1 0.3
Non-OECDNon-OECD Europe and Eurasia. . . 25.3 25.3 25.9 26.6 27.1 27.5 27.5 27.6 0.2Russia . . . . . . . . . . . . . . . . . . . . . . . 16.2 16.6 16.7 16.6 16.7 16.9 16.9 17.1 0.1Other . . . . . . . . . . . . . . . . . . . . . . . . 9.1 8.7 9.1 10.0 10.4 10.7 10.5 10.4 0.5
Non-OECD Asia. . . . . . . . . . . . . . . . 8.5 9.6 10.5 16.5 20.1 22.9 24.9 26.7 3.4China. . . . . . . . . . . . . . . . . . . . . . . . 1.7 2.0 2.5 4.9 6.3 7.5 8.6 9.4 4.9India . . . . . . . . . . . . . . . . . . . . . . . . 1.3 1.4 1.5 3.0 3.9 4.3 4.4 4.4 4.0Other Non-OECD Asia . . . . . . . . . . 5.6 6.2 6.6 8.6 9.9 11.1 11.9 12.8 2.4
Middle East . . . . . . . . . . . . . . . . . . . 9.8 10.3 10.7 16.0 17.9 18.6 18.9 19.7 2.2Africa . . . . . . . . . . . . . . . . . . . . . . . . 3.0 2.9 3.1 4.7 5.6 6.3 6.5 6.7 2.8Central and South America . . . . . . 4.4 4.5 4.6 5.4 6.4 6.7 7.0 7.4 1.7Brazil . . . . . . . . . . . . . . . . . . . . . . . . 0.7 0.7 0.7 1.0 1.3 1.4 1.7 1.9 3.6Other Central and South America. . 3.7 3.8 3.9 4.5 5.2 5.2 5.3 5.5 1.2Total Non-OECD . . . . . . . . . . . . . 50.9 52.6 54.7 69.2 77.1 81.9 84.8 88.1 1.7
Total World . . . . . . . . . . . . . . . . . . . . 102.7 104.6 108.5 123.3 132.6 138.6 142.4 147.2 1.1aIncludes the 50 States and the District of Columbia.Note: Totals may not equal sum of components due to independent rounding.Sources: History: U.S. Energy Information Administration (EIA), International Energy Statistics database (as of November 2009),
web site www.eia.gov/emeu/international. Projections: EIA, Annual Energy Outlook 2010, DOE/EIA-0383(2010) (Washington, DC,April 2010), AEO2010 National Energy Modeling System, run LM2010.D011110A, web site www.eia.gov/oiaf/aeo; and WorldEnergy Projection System Plus (2010).

Table C6. World coal consumption by region, Low Economic Growth case, 2005-2035(Quadrillion Btu)
Low Economic Growth case projections
U.S. Energy Information Administration / International Energy Outlook 2010 185
Region/Country
History Projections Average annualpercent change,
2007-20352005 2006 2007 2015 2020 2025 2030 2035
OECDOECD North America . . . . . . . . . . . 24.7 24.3 24.6 23.4 23.7 23.6 24.2 24.6 0.0United Statesa. . . . . . . . . . . . . . . . . 22.8 22.5 22.7 22.0 22.3 22.3 22.8 23.1 0.1Canada . . . . . . . . . . . . . . . . . . . . . . 1.5 1.4 1.5 1.1 1.0 1.0 1.0 1.0 -1.3Mexico. . . . . . . . . . . . . . . . . . . . . . . 0.4 0.4 0.4 0.4 0.4 0.4 0.4 0.4 0.5
OECD Europe . . . . . . . . . . . . . . . . . 12.7 13.1 13.2 11.4 11.0 10.6 10.3 10.1 -1.0OECD Asia . . . . . . . . . . . . . . . . . . . . 9.2 9.3 10.1 9.0 9.0 9.0 9.1 9.3 -0.3Japan . . . . . . . . . . . . . . . . . . . . . . . 4.6 4.6 4.9 4.1 4.0 3.8 3.7 3.5 -1.2South Korea . . . . . . . . . . . . . . . . . . 2.1 2.1 2.3 2.2 2.2 2.4 2.7 3.0 1.0Australia/New Zealand . . . . . . . . . . 2.6 2.6 2.9 2.8 2.8 2.8 2.8 2.8 -0.1
Total OECD . . . . . . . . . . . . . . . . . 46.7 46.7 47.9 43.9 43.7 43.2 43.6 44.0 -0.3
Non-OECDNon-OECD Europe and Eurasia. . . 8.4 8.8 8.7 7.9 7.7 7.6 7.8 8.1 -0.2Russia . . . . . . . . . . . . . . . . . . . . . . . 4.3 4.4 4.3 4.1 4.0 4.0 4.2 4.5 0.2Other . . . . . . . . . . . . . . . . . . . . . . . . 4.1 4.4 4.4 3.8 3.7 3.6 3.6 3.6 -0.7
Non-OECD Asia. . . . . . . . . . . . . . . . 61.9 65.4 70.3 79.6 89.9 100.8 112.3 124.3 2.1China. . . . . . . . . . . . . . . . . . . . . . . . 48.3 51.0 54.8 63.8 73.1 82.6 91.5 100.1 2.2India . . . . . . . . . . . . . . . . . . . . . . . . 8.6 9.2 10.2 10.3 11.0 11.6 12.5 13.7 1.1Other Non-OECD Asia . . . . . . . . . . 4.9 5.1 5.4 5.4 5.7 6.6 8.3 10.5 2.4
Middle East . . . . . . . . . . . . . . . . . . . 0.4 0.4 0.4 0.4 0.3 0.3 0.3 0.3 -0.3Africa . . . . . . . . . . . . . . . . . . . . . . . . 4.2 4.2 4.2 4.1 4.2 4.3 4.7 5.3 0.8Central and South America . . . . . . 0.8 0.9 0.9 0.9 1.0 1.1 1.3 1.5 1.7Brazil . . . . . . . . . . . . . . . . . . . . . . . . 0.4 0.4 0.5 0.5 0.6 0.7 0.9 1.1 2.9Other Central and South America. . 0.4 0.4 0.5 0.4 0.4 0.4 0.4 0.4 -0.2Total Non-OECD . . . . . . . . . . . . . 75.7 79.7 84.6 92.8 103.1 114.2 126.3 139.5 1.8
Total World . . . . . . . . . . . . . . . . . . . . 122.3 126.4 132.4 136.7 146.8 157.4 169.9 183.5 1.2aIncludes the 50 States and the District of Columbia.Note: Totals may not equal sum of components due to independent rounding.Sources: History: U.S. Energy Information Administration (EIA), International Energy Statistics database (as of November 2009),
web site www.eia.gov/emeu/international. Projections: EIA, Annual Energy Outlook 2010, DOE/EIA-0383(2010) (Washington, DC,April 2010), AEO2010 National Energy Modeling System, run LM2010.D011110A, web site www.eia.gov/oiaf/aeo; and WorldEnergy Projection System Plus (2010).
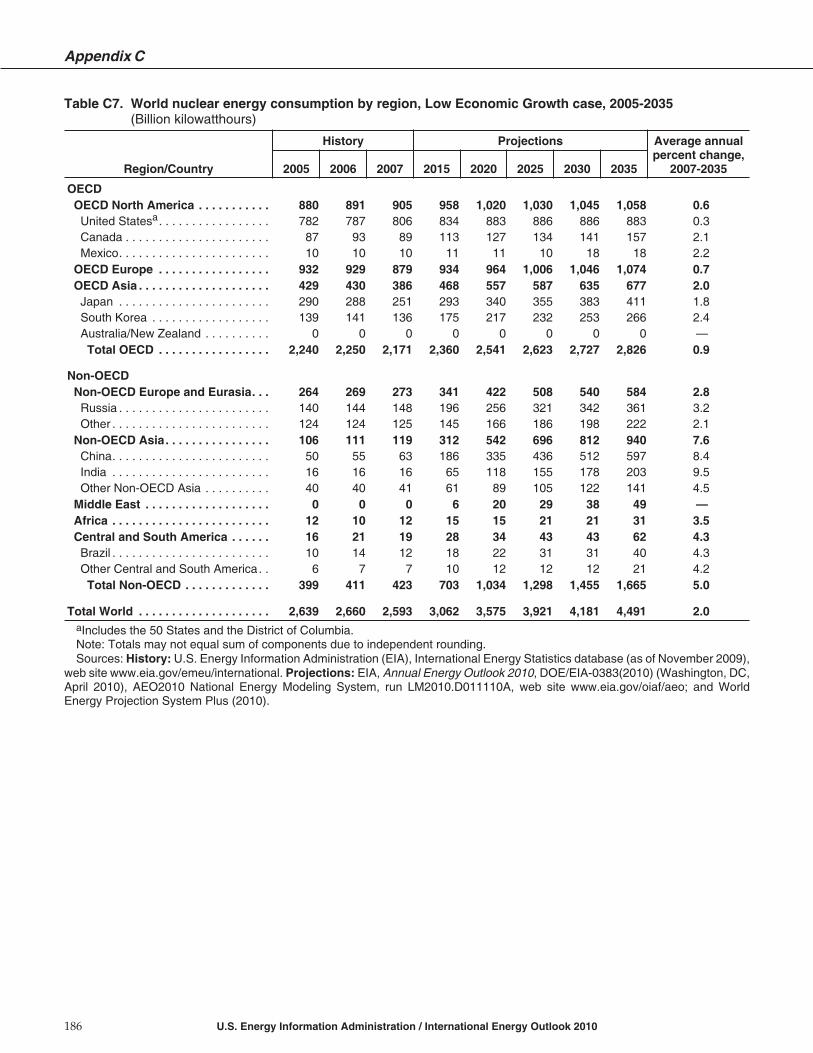
Table C7. World nuclear energy consumption by region, Low Economic Growth case, 2005-2035(Billion kilowatthours)
Appendix C
186 U.S. Energy Information Administration / International Energy Outlook 2010
Region/Country
History Projections Average annualpercent change,
2007-20352005 2006 2007 2015 2020 2025 2030 2035
OECDOECD North America . . . . . . . . . . . 880 891 905 958 1,020 1,030 1,045 1,058 0.6United Statesa. . . . . . . . . . . . . . . . . 782 787 806 834 883 886 886 883 0.3Canada . . . . . . . . . . . . . . . . . . . . . . 87 93 89 113 127 134 141 157 2.1Mexico. . . . . . . . . . . . . . . . . . . . . . . 10 10 10 11 11 10 18 18 2.2
OECD Europe . . . . . . . . . . . . . . . . . 932 929 879 934 964 1,006 1,046 1,074 0.7OECD Asia . . . . . . . . . . . . . . . . . . . . 429 430 386 468 557 587 635 677 2.0Japan . . . . . . . . . . . . . . . . . . . . . . . 290 288 251 293 340 355 383 411 1.8South Korea . . . . . . . . . . . . . . . . . . 139 141 136 175 217 232 253 266 2.4Australia/New Zealand . . . . . . . . . . 0 0 0 0 0 0 0 0 —Total OECD . . . . . . . . . . . . . . . . . 2,240 2,250 2,171 2,360 2,541 2,623 2,727 2,826 0.9
Non-OECDNon-OECD Europe and Eurasia. . . 264 269 273 341 422 508 540 584 2.8Russia . . . . . . . . . . . . . . . . . . . . . . . 140 144 148 196 256 321 342 361 3.2Other . . . . . . . . . . . . . . . . . . . . . . . . 124 124 125 145 166 186 198 222 2.1
Non-OECD Asia. . . . . . . . . . . . . . . . 106 111 119 312 542 696 812 940 7.6China. . . . . . . . . . . . . . . . . . . . . . . . 50 55 63 186 335 436 512 597 8.4India . . . . . . . . . . . . . . . . . . . . . . . . 16 16 16 65 118 155 178 203 9.5Other Non-OECD Asia . . . . . . . . . . 40 40 41 61 89 105 122 141 4.5
Middle East . . . . . . . . . . . . . . . . . . . 0 0 0 6 20 29 38 49 —Africa . . . . . . . . . . . . . . . . . . . . . . . . 12 10 12 15 15 21 21 31 3.5Central and South America . . . . . . 16 21 19 28 34 43 43 62 4.3Brazil . . . . . . . . . . . . . . . . . . . . . . . . 10 14 12 18 22 31 31 40 4.3Other Central and South America. . 6 7 7 10 12 12 12 21 4.2Total Non-OECD . . . . . . . . . . . . . 399 411 423 703 1,034 1,298 1,455 1,665 5.0
Total World . . . . . . . . . . . . . . . . . . . . 2,639 2,660 2,593 3,062 3,575 3,921 4,181 4,491 2.0aIncludes the 50 States and the District of Columbia.Note: Totals may not equal sum of components due to independent rounding.Sources: History: U.S. Energy Information Administration (EIA), International Energy Statistics database (as of November 2009),
web site www.eia.gov/emeu/international. Projections: EIA, Annual Energy Outlook 2010, DOE/EIA-0383(2010) (Washington, DC,April 2010), AEO2010 National Energy Modeling System, run LM2010.D011110A, web site www.eia.gov/oiaf/aeo; and WorldEnergy Projection System Plus (2010).
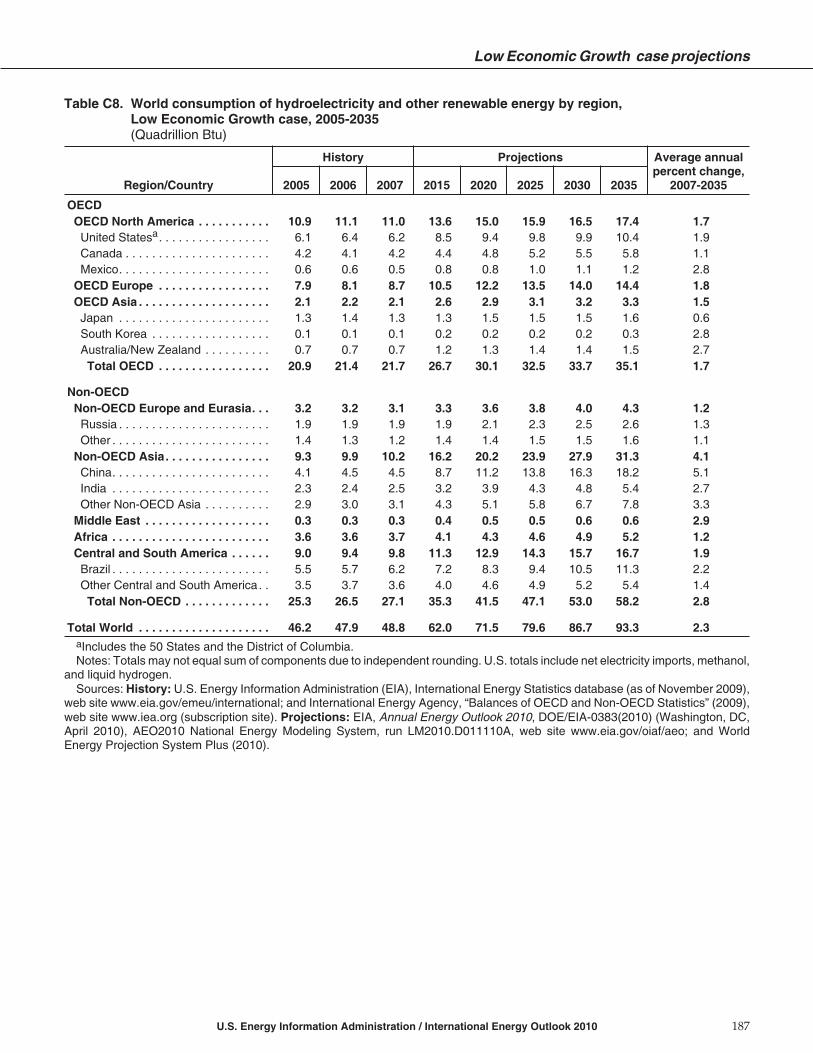
Table C8. World consumption of hydroelectricity and other renewable energy by region,Low Economic Growth case, 2005-2035(Quadrillion Btu)
Low Economic Growth case projections
U.S. Energy Information Administration / International Energy Outlook 2010 187
Region/Country
History Projections Average annualpercent change,
2007-20352005 2006 2007 2015 2020 2025 2030 2035
OECDOECD North America . . . . . . . . . . . 10.9 11.1 11.0 13.6 15.0 15.9 16.5 17.4 1.7United Statesa. . . . . . . . . . . . . . . . . 6.1 6.4 6.2 8.5 9.4 9.8 9.9 10.4 1.9Canada . . . . . . . . . . . . . . . . . . . . . . 4.2 4.1 4.2 4.4 4.8 5.2 5.5 5.8 1.1Mexico. . . . . . . . . . . . . . . . . . . . . . . 0.6 0.6 0.5 0.8 0.8 1.0 1.1 1.2 2.8
OECD Europe . . . . . . . . . . . . . . . . . 7.9 8.1 8.7 10.5 12.2 13.5 14.0 14.4 1.8OECD Asia . . . . . . . . . . . . . . . . . . . . 2.1 2.2 2.1 2.6 2.9 3.1 3.2 3.3 1.5Japan . . . . . . . . . . . . . . . . . . . . . . . 1.3 1.4 1.3 1.3 1.5 1.5 1.5 1.6 0.6South Korea . . . . . . . . . . . . . . . . . . 0.1 0.1 0.1 0.2 0.2 0.2 0.2 0.3 2.8Australia/New Zealand . . . . . . . . . . 0.7 0.7 0.7 1.2 1.3 1.4 1.4 1.5 2.7Total OECD . . . . . . . . . . . . . . . . . 20.9 21.4 21.7 26.7 30.1 32.5 33.7 35.1 1.7
Non-OECDNon-OECD Europe and Eurasia. . . 3.2 3.2 3.1 3.3 3.6 3.8 4.0 4.3 1.2Russia . . . . . . . . . . . . . . . . . . . . . . . 1.9 1.9 1.9 1.9 2.1 2.3 2.5 2.6 1.3Other . . . . . . . . . . . . . . . . . . . . . . . . 1.4 1.3 1.2 1.4 1.4 1.5 1.5 1.6 1.1
Non-OECD Asia. . . . . . . . . . . . . . . . 9.3 9.9 10.2 16.2 20.2 23.9 27.9 31.3 4.1China. . . . . . . . . . . . . . . . . . . . . . . . 4.1 4.5 4.5 8.7 11.2 13.8 16.3 18.2 5.1India . . . . . . . . . . . . . . . . . . . . . . . . 2.3 2.4 2.5 3.2 3.9 4.3 4.8 5.4 2.7Other Non-OECD Asia . . . . . . . . . . 2.9 3.0 3.1 4.3 5.1 5.8 6.7 7.8 3.3
Middle East . . . . . . . . . . . . . . . . . . . 0.3 0.3 0.3 0.4 0.5 0.5 0.6 0.6 2.9Africa . . . . . . . . . . . . . . . . . . . . . . . . 3.6 3.6 3.7 4.1 4.3 4.6 4.9 5.2 1.2Central and South America . . . . . . 9.0 9.4 9.8 11.3 12.9 14.3 15.7 16.7 1.9Brazil . . . . . . . . . . . . . . . . . . . . . . . . 5.5 5.7 6.2 7.2 8.3 9.4 10.5 11.3 2.2Other Central and South America. . 3.5 3.7 3.6 4.0 4.6 4.9 5.2 5.4 1.4Total Non-OECD . . . . . . . . . . . . . 25.3 26.5 27.1 35.3 41.5 47.1 53.0 58.2 2.8
Total World . . . . . . . . . . . . . . . . . . . . 46.2 47.9 48.8 62.0 71.5 79.6 86.7 93.3 2.3aIncludes the 50 States and the District of Columbia.Notes: Totals may not equal sum of components due to independent rounding. U.S. totals include net electricity imports, methanol,
and liquid hydrogen.Sources: History: U.S. Energy Information Administration (EIA), International Energy Statistics database (as of November 2009),
web site www.eia.gov/emeu/international; and International Energy Agency, “Balances of OECD and Non-OECD Statistics” (2009),web site www.iea.org (subscription site). Projections: EIA, Annual Energy Outlook 2010, DOE/EIA-0383(2010) (Washington, DC,April 2010), AEO2010 National Energy Modeling System, run LM2010.D011110A, web site www.eia.gov/oiaf/aeo; and WorldEnergy Projection System Plus (2010).
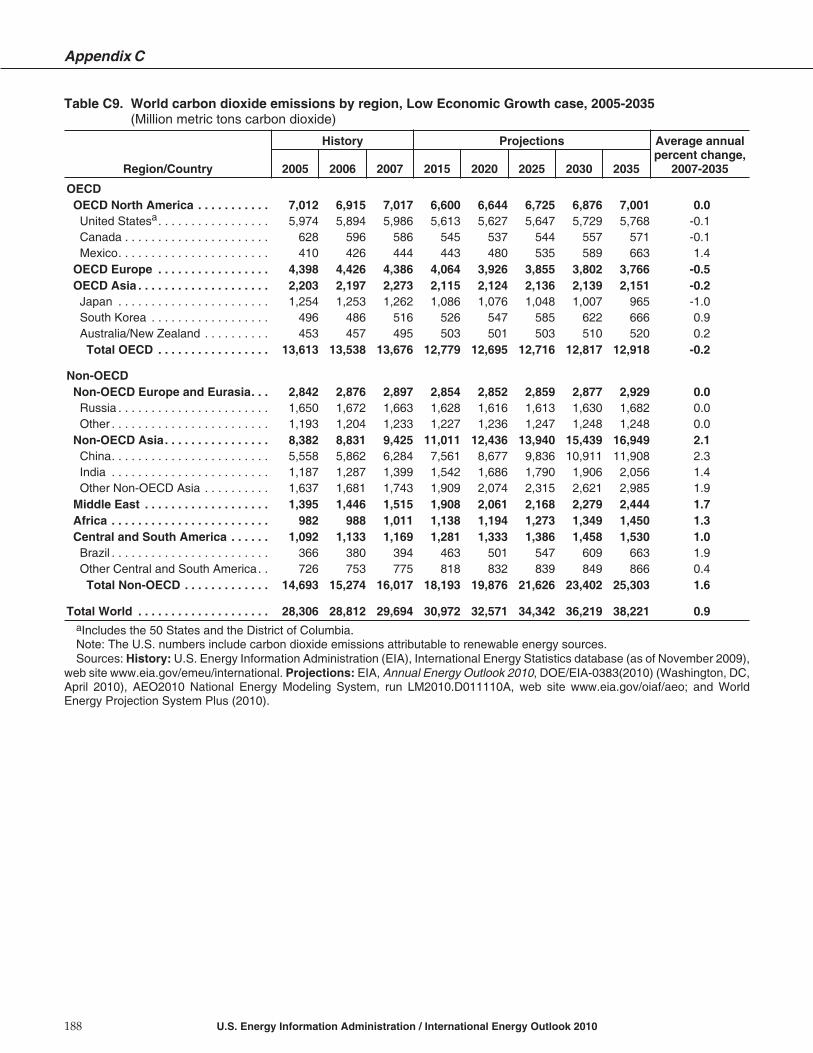
Table C9. World carbon dioxide emissions by region, Low Economic Growth case, 2005-2035(Million metric tons carbon dioxide)
Appendix C
188 U.S. Energy Information Administration / International Energy Outlook 2010
Region/Country
History Projections Average annualpercent change,
2007-20352005 2006 2007 2015 2020 2025 2030 2035
OECDOECD North America . . . . . . . . . . . 7,012 6,915 7,017 6,600 6,644 6,725 6,876 7,001 0.0United Statesa. . . . . . . . . . . . . . . . . 5,974 5,894 5,986 5,613 5,627 5,647 5,729 5,768 -0.1Canada . . . . . . . . . . . . . . . . . . . . . . 628 596 586 545 537 544 557 571 -0.1Mexico. . . . . . . . . . . . . . . . . . . . . . . 410 426 444 443 480 535 589 663 1.4
OECD Europe . . . . . . . . . . . . . . . . . 4,398 4,426 4,386 4,064 3,926 3,855 3,802 3,766 -0.5OECD Asia . . . . . . . . . . . . . . . . . . . . 2,203 2,197 2,273 2,115 2,124 2,136 2,139 2,151 -0.2
Japan . . . . . . . . . . . . . . . . . . . . . . . 1,254 1,253 1,262 1,086 1,076 1,048 1,007 965 -1.0South Korea . . . . . . . . . . . . . . . . . . 496 486 516 526 547 585 622 666 0.9Australia/New Zealand . . . . . . . . . . 453 457 495 503 501 503 510 520 0.2Total OECD . . . . . . . . . . . . . . . . . 13,613 13,538 13,676 12,779 12,695 12,716 12,817 12,918 -0.2
Non-OECDNon-OECD Europe and Eurasia. . . 2,842 2,876 2,897 2,854 2,852 2,859 2,877 2,929 0.0Russia . . . . . . . . . . . . . . . . . . . . . . . 1,650 1,672 1,663 1,628 1,616 1,613 1,630 1,682 0.0Other . . . . . . . . . . . . . . . . . . . . . . . . 1,193 1,204 1,233 1,227 1,236 1,247 1,248 1,248 0.0
Non-OECD Asia. . . . . . . . . . . . . . . . 8,382 8,831 9,425 11,011 12,436 13,940 15,439 16,949 2.1China. . . . . . . . . . . . . . . . . . . . . . . . 5,558 5,862 6,284 7,561 8,677 9,836 10,911 11,908 2.3India . . . . . . . . . . . . . . . . . . . . . . . . 1,187 1,287 1,399 1,542 1,686 1,790 1,906 2,056 1.4Other Non-OECD Asia . . . . . . . . . . 1,637 1,681 1,743 1,909 2,074 2,315 2,621 2,985 1.9
Middle East . . . . . . . . . . . . . . . . . . . 1,395 1,446 1,515 1,908 2,061 2,168 2,279 2,444 1.7Africa . . . . . . . . . . . . . . . . . . . . . . . . 982 988 1,011 1,138 1,194 1,273 1,349 1,450 1.3Central and South America . . . . . . 1,092 1,133 1,169 1,281 1,333 1,386 1,458 1,530 1.0Brazil . . . . . . . . . . . . . . . . . . . . . . . . 366 380 394 463 501 547 609 663 1.9Other Central and South America. . 726 753 775 818 832 839 849 866 0.4Total Non-OECD . . . . . . . . . . . . . 14,693 15,274 16,017 18,193 19,876 21,626 23,402 25,303 1.6
Total World . . . . . . . . . . . . . . . . . . . . 28,306 28,812 29,694 30,972 32,571 34,342 36,219 38,221 0.9aIncludes the 50 States and the District of Columbia.Note: The U.S. numbers include carbon dioxide emissions attributable to renewable energy sources.Sources: History: U.S. Energy Information Administration (EIA), International Energy Statistics database (as of November 2009),
web site www.eia.gov/emeu/international. Projections: EIA, Annual Energy Outlook 2010, DOE/EIA-0383(2010) (Washington, DC,April 2010), AEO2010 National Energy Modeling System, run LM2010.D011110A, web site www.eia.gov/oiaf/aeo; and WorldEnergy Projection System Plus (2010).

Table C10. World carbon dioxide emissions from liquids use by region, Low Economic Growth case,2005-2035(Million metric tons carbon dioxide)
Low Economic Growth case projections
U.S. Energy Information Administration / International Energy Outlook 2010 189
Region/Country
History Projections Average annualpercent change,
2007-20352005 2006 2007 2015 2020 2025 2030 2035
OECDOECD North America . . . . . . . . . . . 3,194 3,142 3,150 2,895 2,871 2,896 2,921 2,935 -0.3United Statesa. . . . . . . . . . . . . . . . . 2,626 2,595 2,589 2,352 2,336 2,347 2,350 2,340 -0.4Canada . . . . . . . . . . . . . . . . . . . . . . 301 281 288 274 259 259 262 265 -0.3Mexico. . . . . . . . . . . . . . . . . . . . . . . 267 265 273 270 275 290 309 330 0.7
OECD Europe . . . . . . . . . . . . . . . . . 2,133 2,125 2,082 1,877 1,761 1,730 1,719 1,702 -0.7OECD Asia . . . . . . . . . . . . . . . . . . . . 1,031 991 980 885 893 890 882 874 -0.4
Japan . . . . . . . . . . . . . . . . . . . . . . . 646 622 603 495 500 486 466 446 -1.1South Korea . . . . . . . . . . . . . . . . . . 239 221 227 238 247 259 270 280 0.8Australia/New Zealand . . . . . . . . . . 147 148 150 152 146 146 147 148 -0.1Total OECD . . . . . . . . . . . . . . . . . 6,358 6,258 6,212 5,658 5,525 5,516 5,522 5,511 -0.4
Non-OECDNon-OECD Europe and Eurasia. . . 686 677 682 673 656 656 663 677 0.0Russia . . . . . . . . . . . . . . . . . . . . . . . 383 368 366 368 353 345 342 349 -0.2Other . . . . . . . . . . . . . . . . . . . . . . . . 303 310 316 306 303 311 322 328 0.1
Non-OECD Asia. . . . . . . . . . . . . . . . 2,081 2,147 2,225 2,616 2,872 3,192 3,502 3,783 1.9China. . . . . . . . . . . . . . . . . . . . . . . . 889 928 969 1,257 1,420 1,616 1,786 1,926 2.5India . . . . . . . . . . . . . . . . . . . . . . . . 314 349 369 408 442 470 502 534 1.3Other Non-OECD Asia . . . . . . . . . . 878 870 887 952 1,011 1,106 1,213 1,323 1.4
Middle East . . . . . . . . . . . . . . . . . . . 817 839 886 986 1,031 1,103 1,196 1,314 1.4Africa . . . . . . . . . . . . . . . . . . . . . . . . 423 428 441 489 487 512 544 576 1.0Central and South America . . . . . . 762 796 823 889 877 905 945 975 0.6Brazil . . . . . . . . . . . . . . . . . . . . . . . . 288 301 311 365 376 402 434 459 1.4Other Central and South America. . 474 495 512 524 501 503 512 515 0.0Total Non-OECD . . . . . . . . . . . . . 4,768 4,888 5,057 5,653 5,924 6,368 6,851 7,324 1.3
Total World . . . . . . . . . . . . . . . . . . . . 11,126 11,146 11,268 11,311 11,449 11,884 12,373 12,835 0.5aIncludes the 50 States and the District of Columbia.Sources: History: U.S. Energy Information Administration (EIA), International Energy Statistics database (as of November 2009),
web site www.eia.gov/emeu/international. Projections: EIA, Annual Energy Outlook 2010, DOE/EIA-0383(2010) (Washington, DC,April 2010), AEO2010 National Energy Modeling System, run LM2010.D011110A, web site www.eia.gov/oiaf/aeo; and WorldEnergy Projection System Plus (2010).

Table C11. World carbon dioxide emissions from natural gas use by region, Low Economic Growth case,2005-2035(Million metric tons carbon dioxide)
Appendix C
190 U.S. Energy Information Administration / International Energy Outlook 2010
Region/Country
History Projections Average annualpercent change,
2007-20352005 2006 2007 2015 2020 2025 2030 2035
OECDOECD North America . . . . . . . . . . . 1,468 1,463 1,524 1,469 1,528 1,585 1,654 1,729 0.5United Statesa. . . . . . . . . . . . . . . . . 1,176 1,157 1,232 1,158 1,174 1,183 1,206 1,228 0.0Canada . . . . . . . . . . . . . . . . . . . . . . 186 181 157 172 182 191 201 210 1.0Mexico. . . . . . . . . . . . . . . . . . . . . . . 106 125 135 139 172 211 247 291 2.8
OECD Europe . . . . . . . . . . . . . . . . . 1,048 1,045 1,049 1,100 1,115 1,114 1,100 1,102 0.2OECD Asia . . . . . . . . . . . . . . . . . . . . 311 336 355 387 394 408 410 411 0.5
Japan . . . . . . . . . . . . . . . . . . . . . . . 183 202 208 212 207 208 203 197 -0.2South Korea . . . . . . . . . . . . . . . . . . 64 68 73 85 92 101 103 104 1.3Australia/New Zealand . . . . . . . . . . 65 66 73 90 95 99 104 110 1.5Total OECD . . . . . . . . . . . . . . . . . 2,827 2,843 2,928 2,956 3,036 3,107 3,163 3,242 0.4
Non-OECDNon-OECD Europe and Eurasia. . . 1,367 1,367 1,397 1,443 1,473 1,493 1,490 1,495 0.2Russia . . . . . . . . . . . . . . . . . . . . . . . 865 889 897 886 893 901 905 915 0.1Other . . . . . . . . . . . . . . . . . . . . . . . . 502 478 500 557 580 592 585 579 0.5
Non-OECD Asia. . . . . . . . . . . . . . . . 459 518 572 900 1,095 1,248 1,360 1,454 3.4China. . . . . . . . . . . . . . . . . . . . . . . . 92 111 138 272 349 418 479 524 4.9India . . . . . . . . . . . . . . . . . . . . . . . . 70 75 80 167 212 235 241 242 4.0Other Non-OECD Asia . . . . . . . . . . 297 332 354 460 533 595 640 688 2.4
Middle East . . . . . . . . . . . . . . . . . . . 543 571 594 890 998 1,034 1,052 1,098 2.2Africa . . . . . . . . . . . . . . . . . . . . . . . . 169 166 176 267 317 358 370 385 2.8Central and South America . . . . . . 250 256 259 307 362 375 392 415 1.7Brazil . . . . . . . . . . . . . . . . . . . . . . . . 36 38 39 53 70 78 94 105 3.6Other Central and South America. . 214 218 220 254 292 297 299 311 1.2Total Non-OECD . . . . . . . . . . . . . 2,788 2,877 2,997 3,806 4,245 4,507 4,664 4,847 1.7
Total World . . . . . . . . . . . . . . . . . . . . 5,614 5,720 5,925 6,762 7,281 7,614 7,827 8,089 1.1aIncludes the 50 States and the District of Columbia.Sources: History: U.S. Energy Information Administration (EIA), International Energy Statistics database (as of November 2009),
web site www.eia.gov/emeu/international. Projections: EIA, Annual Energy Outlook 2010, DOE/EIA-0383(2010) (Washington, DC,April 2010), AEO2010 National Energy Modeling System, run LM2010.D011110A, web site www.eia.gov/oiaf/aeo; and WorldEnergy Projection System Plus (2010).

Table C12. World carbon dioxide emissions from coal use by region, Low Economic Growth case,2005-2035(Million metric tons carbon dioxide)
Low Economic Growth case projections
U.S. Energy Information Administration / International Energy Outlook 2010 191
Region/Country
History Projections Average annualpercent change,
2007-20352005 2006 2007 2015 2020 2025 2030 2035
OECDOECD North America . . . . . . . . . . . 2,339 2,299 2,331 2,224 2,235 2,232 2,291 2,326 0.0United Statesa. . . . . . . . . . . . . . . . . 2,161 2,130 2,155 2,091 2,105 2,105 2,161 2,188 0.1Canada . . . . . . . . . . . . . . . . . . . . . . 142 133 141 99 96 94 95 97 -1.3Mexico. . . . . . . . . . . . . . . . . . . . . . . 36 36 36 34 33 33 34 41 0.5
OECD Europe . . . . . . . . . . . . . . . . . 1,217 1,256 1,256 1,086 1,050 1,011 982 962 -0.9OECD Asia . . . . . . . . . . . . . . . . . . . . 861 870 938 843 837 838 847 866 -0.3
Japan . . . . . . . . . . . . . . . . . . . . . . . 425 429 451 379 369 354 339 323 -1.2South Korea . . . . . . . . . . . . . . . . . . 193 197 216 203 208 226 249 281 0.9Australia/New Zealand . . . . . . . . . . 242 244 271 261 260 259 259 262 -0.1Total OECD . . . . . . . . . . . . . . . . . 4,417 4,425 4,525 4,153 4,122 4,082 4,120 4,154 -0.3
Non-OECDNon-OECD Europe and Eurasia. . . 790 832 819 738 723 711 724 758 -0.3Russia . . . . . . . . . . . . . . . . . . . . . . . 402 416 401 374 369 367 383 417 0.1Other . . . . . . . . . . . . . . . . . . . . . . . . 388 417 417 364 353 344 341 341 -0.7
Non-OECD Asia. . . . . . . . . . . . . . . . 5,843 6,165 6,629 7,496 8,470 9,500 10,578 11,713 2.1China. . . . . . . . . . . . . . . . . . . . . . . . 4,578 4,824 5,177 6,032 6,907 7,802 8,647 9,459 2.2India . . . . . . . . . . . . . . . . . . . . . . . . 803 863 950 967 1,032 1,085 1,163 1,279 1.1Other Non-OECD Asia . . . . . . . . . . 461 479 502 497 531 614 768 974 2.4
Middle East . . . . . . . . . . . . . . . . . . . 36 36 35 33 32 31 31 32 -0.3Africa . . . . . . . . . . . . . . . . . . . . . . . . 390 394 395 382 390 403 435 489 0.8Central and South America . . . . . . 80 81 87 85 94 105 120 139 1.7Brazil . . . . . . . . . . . . . . . . . . . . . . . . 42 41 44 45 55 67 82 99 2.9Other Central and South America. . 38 40 43 40 39 38 39 40 -0.2Total Non-OECD . . . . . . . . . . . . . 7,138 7,509 7,964 8,734 9,708 10,750 11,887 13,131 1.8
Total World . . . . . . . . . . . . . . . . . . . . 11,555 11,934 12,489 12,887 13,830 14,832 16,007 17,285 1.2aIncludes the 50 States and the District of Columbia.Sources: History: U.S. Energy Information Administration (EIA), International Energy Statistics database (as of November 2009),
web site www.eia.gov/emeu/international. Projections: EIA, Annual Energy Outlook 2010, DOE/EIA-0383(2010) (Washington, DC,April 2010), AEO2010 National Energy Modeling System, run LM2010.D011110A, web site www.eia.gov/oiaf/aeo; and WorldEnergy Projection System Plus (2010).

This page intentionally left blank.

Appendix D
High Oil Price Case Projections:• World energy consumption• Gross domestic product• Carbon dioxide emissions

This page intentionally left blank.
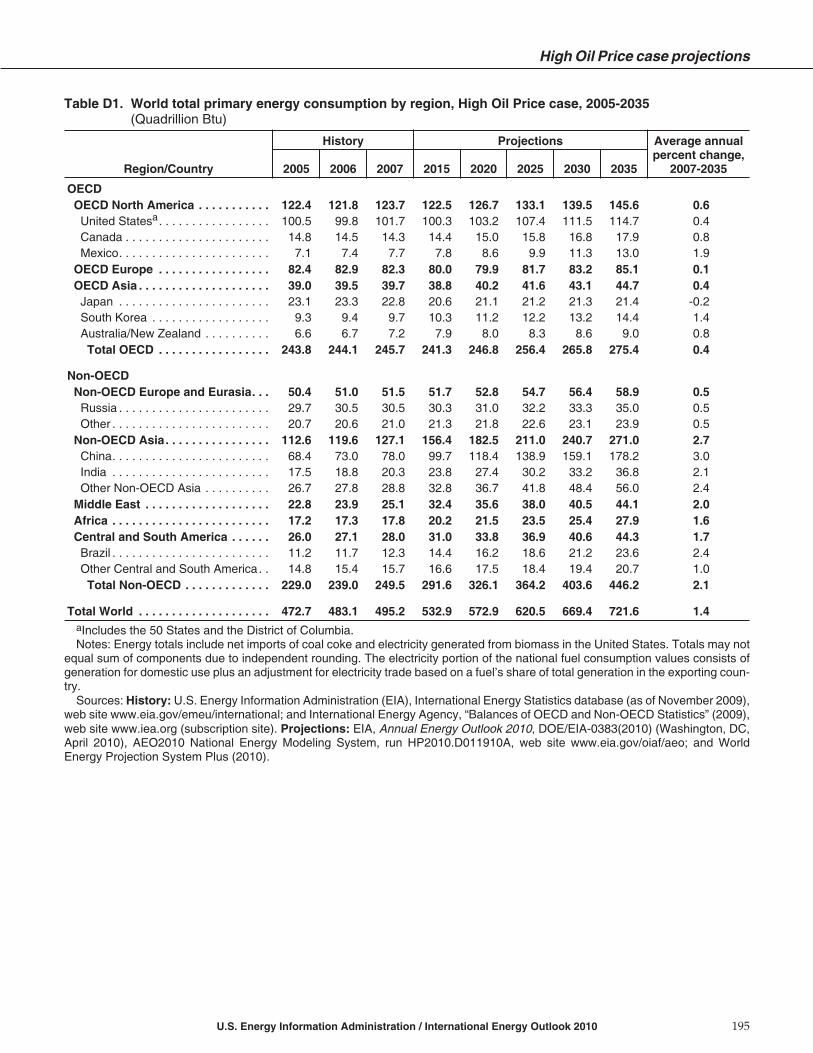
Table D1. World total primary energy consumption by region, High Oil Price case, 2005-2035(Quadrillion Btu)
High Oil Price case projections
U.S. Energy Information Administration / International Energy Outlook 2010 195
Region/Country
History Projections Average annualpercent change,
2007-20352005 2006 2007 2015 2020 2025 2030 2035
OECDOECD North America . . . . . . . . . . . 122.4 121.8 123.7 122.5 126.7 133.1 139.5 145.6 0.6United Statesa. . . . . . . . . . . . . . . . . 100.5 99.8 101.7 100.3 103.2 107.4 111.5 114.7 0.4Canada . . . . . . . . . . . . . . . . . . . . . . 14.8 14.5 14.3 14.4 15.0 15.8 16.8 17.9 0.8Mexico. . . . . . . . . . . . . . . . . . . . . . . 7.1 7.4 7.7 7.8 8.6 9.9 11.3 13.0 1.9
OECD Europe . . . . . . . . . . . . . . . . . 82.4 82.9 82.3 80.0 79.9 81.7 83.2 85.1 0.1OECD Asia . . . . . . . . . . . . . . . . . . . . 39.0 39.5 39.7 38.8 40.2 41.6 43.1 44.7 0.4Japan . . . . . . . . . . . . . . . . . . . . . . . 23.1 23.3 22.8 20.6 21.1 21.2 21.3 21.4 -0.2South Korea . . . . . . . . . . . . . . . . . . 9.3 9.4 9.7 10.3 11.2 12.2 13.2 14.4 1.4Australia/New Zealand . . . . . . . . . . 6.6 6.7 7.2 7.9 8.0 8.3 8.6 9.0 0.8Total OECD . . . . . . . . . . . . . . . . . 243.8 244.1 245.7 241.3 246.8 256.4 265.8 275.4 0.4
Non-OECDNon-OECD Europe and Eurasia. . . 50.4 51.0 51.5 51.7 52.8 54.7 56.4 58.9 0.5Russia . . . . . . . . . . . . . . . . . . . . . . . 29.7 30.5 30.5 30.3 31.0 32.2 33.3 35.0 0.5Other . . . . . . . . . . . . . . . . . . . . . . . . 20.7 20.6 21.0 21.3 21.8 22.6 23.1 23.9 0.5
Non-OECD Asia. . . . . . . . . . . . . . . . 112.6 119.6 127.1 156.4 182.5 211.0 240.7 271.0 2.7China. . . . . . . . . . . . . . . . . . . . . . . . 68.4 73.0 78.0 99.7 118.4 138.9 159.1 178.2 3.0India . . . . . . . . . . . . . . . . . . . . . . . . 17.5 18.8 20.3 23.8 27.4 30.2 33.2 36.8 2.1Other Non-OECD Asia . . . . . . . . . . 26.7 27.8 28.8 32.8 36.7 41.8 48.4 56.0 2.4
Middle East . . . . . . . . . . . . . . . . . . . 22.8 23.9 25.1 32.4 35.6 38.0 40.5 44.1 2.0Africa . . . . . . . . . . . . . . . . . . . . . . . . 17.2 17.3 17.8 20.2 21.5 23.5 25.4 27.9 1.6Central and South America . . . . . . 26.0 27.1 28.0 31.0 33.8 36.9 40.6 44.3 1.7Brazil . . . . . . . . . . . . . . . . . . . . . . . . 11.2 11.7 12.3 14.4 16.2 18.6 21.2 23.6 2.4Other Central and South America. . 14.8 15.4 15.7 16.6 17.5 18.4 19.4 20.7 1.0Total Non-OECD . . . . . . . . . . . . . 229.0 239.0 249.5 291.6 326.1 364.2 403.6 446.2 2.1
Total World . . . . . . . . . . . . . . . . . . . . 472.7 483.1 495.2 532.9 572.9 620.5 669.4 721.6 1.4aIncludes the 50 States and the District of Columbia.Notes: Energy totals include net imports of coal coke and electricity generated from biomass in the United States. Totals may not
equal sum of components due to independent rounding. The electricity portion of the national fuel consumption values consists ofgeneration for domestic use plus an adjustment for electricity trade based on a fuel’s share of total generation in the exporting coun-try.
Sources: History: U.S. Energy Information Administration (EIA), International Energy Statistics database (as of November 2009),web site www.eia.gov/emeu/international; and International Energy Agency, “Balances of OECD and Non-OECD Statistics” (2009),web site www.iea.org (subscription site). Projections: EIA, Annual Energy Outlook 2010, DOE/EIA-0383(2010) (Washington, DC,April 2010), AEO2010 National Energy Modeling System, run HP2010.D011910A, web site www.eia.gov/oiaf/aeo; and WorldEnergy Projection System Plus (2010).

Table D2. World total energy consumption by region and fuel, High Oil Price case, 2005-2035(Quadrillion Btu)
Appendix D
196 U.S. Energy Information Administration / International Energy Outlook 2010
Region/Country
History Projections Average annualpercent change,
2007-20352005 2006 2007 2015 2020 2025 2030 2035
OECDOECD North AmericaLiquids . . . . . . . . . . . . . . . . . . . . . 49.5 49.0 49.4 45.7 44.8 45.1 46.1 47.3 -0.2Natural gas. . . . . . . . . . . . . . . . . . 28.1 28.1 29.2 27.9 30.3 32.8 34.9 36.7 0.8Coal . . . . . . . . . . . . . . . . . . . . . . . 24.7 24.3 24.6 24.0 24.8 26.1 27.3 28.8 0.6Nuclear. . . . . . . . . . . . . . . . . . . . . 9.2 9.4 9.6 10.1 10.8 10.9 11.0 11.4 0.6Other . . . . . . . . . . . . . . . . . . . . . . 10.9 11.1 11.0 14.7 16.2 18.2 20.2 21.5 2.4Total. . . . . . . . . . . . . . . . . . . . . . 122.4 121.8 123.7 122.5 126.7 133.1 139.5 145.6 0.6
OECD EuropeLiquids . . . . . . . . . . . . . . . . . . . . . 32.3 32.4 31.6 26.8 24.0 23.6 23.6 23.7 -1.0Natural gas. . . . . . . . . . . . . . . . . . 19.7 19.7 19.8 21.1 22.1 22.8 22.9 23.4 0.6Coal . . . . . . . . . . . . . . . . . . . . . . . 12.7 13.1 13.2 11.6 11.3 11.0 11.1 11.6 -0.5Nuclear. . . . . . . . . . . . . . . . . . . . . 9.7 9.6 9.1 9.7 10.0 10.5 10.9 11.2 0.8Other . . . . . . . . . . . . . . . . . . . . . . 7.9 8.1 8.7 10.9 12.4 13.8 14.6 15.2 2.0Total. . . . . . . . . . . . . . . . . . . . . . 82.4 82.9 82.3 80.0 79.9 81.7 83.2 85.1 0.1
OECD AsiaLiquids . . . . . . . . . . . . . . . . . . . . . 17.5 17.2 16.9 14.5 14.1 14.2 14.4 14.6 -0.5Natural gas. . . . . . . . . . . . . . . . . . 5.9 6.3 6.7 7.4 8.0 8.5 8.7 8.9 1.0Coal . . . . . . . . . . . . . . . . . . . . . . . 9.2 9.3 10.1 9.2 9.3 9.7 10.2 10.8 0.3Nuclear. . . . . . . . . . . . . . . . . . . . . 4.3 4.3 3.9 5.0 5.7 6.0 6.5 7.0 2.1Other . . . . . . . . . . . . . . . . . . . . . . 2.1 2.2 2.1 2.7 3.0 3.2 3.3 3.5 1.8Total. . . . . . . . . . . . . . . . . . . . . . 39.0 39.5 39.7 38.8 40.2 41.6 43.1 44.7 0.4
Total OECDLiquids . . . . . . . . . . . . . . . . . . . . . 99.3 98.6 97.9 87.0 82.9 82.9 84.1 85.6 -0.5Natural gas. . . . . . . . . . . . . . . . . . 53.7 54.1 55.6 56.4 60.4 64.1 66.5 68.9 0.8Coal . . . . . . . . . . . . . . . . . . . . . . . 46.7 46.7 47.9 44.8 45.4 46.8 48.6 51.2 0.2Nuclear. . . . . . . . . . . . . . . . . . . . . 23.2 23.3 22.6 24.8 26.5 27.4 28.5 29.6 1.0Other . . . . . . . . . . . . . . . . . . . . . . 20.9 21.4 21.7 28.2 31.6 35.2 38.2 40.2 2.2Total. . . . . . . . . . . . . . . . . . . . . . 243.8 244.1 245.7 241.3 246.8 256.4 265.8 275.4 0.4
Non-OECDNon-OECD Europe and EurasiaLiquids . . . . . . . . . . . . . . . . . . . . . 10.1 10.3 10.4 9.4 8.8 8.8 9.0 9.3 -0.4Natural gas. . . . . . . . . . . . . . . . . . 25.8 25.8 26.3 27.3 27.9 28.5 28.6 28.8 0.3Coal . . . . . . . . . . . . . . . . . . . . . . . 8.4 8.8 8.7 8.0 8.0 8.1 8.9 10.0 0.5Nuclear. . . . . . . . . . . . . . . . . . . . . 2.9 2.9 3.0 3.7 4.6 5.5 5.8 6.3 2.7Other . . . . . . . . . . . . . . . . . . . . . . 3.2 3.2 3.1 3.3 3.6 3.8 4.2 4.6 1.4Total. . . . . . . . . . . . . . . . . . . . . . 50.4 51.0 51.5 51.7 52.8 54.7 56.4 58.9 0.5
Non-OECD AsiaLiquids . . . . . . . . . . . . . . . . . . . . . 31.7 33.4 34.6 38.3 40.6 45.7 51.2 56.6 1.8Natural gas. . . . . . . . . . . . . . . . . . 8.6 9.8 10.8 17.4 21.4 24.5 26.8 29.0 3.6Coal . . . . . . . . . . . . . . . . . . . . . . . 61.9 65.4 70.3 81.2 94.4 109.3 125.7 142.9 2.6Nuclear. . . . . . . . . . . . . . . . . . . . . 1.1 1.1 1.2 3.2 5.6 7.2 8.5 9.8 7.7Other . . . . . . . . . . . . . . . . . . . . . . 9.3 9.9 10.2 16.2 20.4 24.2 28.6 32.7 4.2Total. . . . . . . . . . . . . . . . . . . . . . 112.6 119.6 127.1 156.4 182.5 211.0 240.7 271.0 2.7
See notes at end of table.

Table D2. World total energy consumption by region and fuel, High Oil Price case, 2005-2035 (continued)(Quadrillion Btu)
High Oil Price case projections
U.S. Energy Information Administration / International Energy Outlook 2010 197
Region/Country
History Projections Average annualpercent change,
2007-20352005 2006 2007 2015 2020 2025 2030 2035
Non-OECD (continued)Middle EastLiquids . . . . . . . . . . . . . . . . . . . . . 12.0 12.5 13.3 14.3 14.8 15.8 17.3 19.2 1.3Natural gas. . . . . . . . . . . . . . . . . . 10.2 10.8 11.2 17.2 19.7 21.0 21.8 23.2 2.6Coal . . . . . . . . . . . . . . . . . . . . . . . 0.4 0.4 0.4 0.4 0.3 0.3 0.4 0.5 0.9Nuclear. . . . . . . . . . . . . . . . . . . . . 0.0 0.0 0.0 0.1 0.2 0.3 0.4 0.5 —Other . . . . . . . . . . . . . . . . . . . . . . 0.3 0.3 0.3 0.4 0.5 0.6 0.6 0.7 3.2Total. . . . . . . . . . . . . . . . . . . . . . 22.8 23.9 25.1 32.4 35.6 38.0 40.5 44.1 2.0
AfricaLiquids . . . . . . . . . . . . . . . . . . . . . 6.1 6.2 6.4 6.6 6.3 6.6 7.1 7.7 0.7Natural gas. . . . . . . . . . . . . . . . . . 3.2 3.1 3.3 5.1 6.1 6.9 7.1 7.4 2.9Coal . . . . . . . . . . . . . . . . . . . . . . . 4.2 4.2 4.2 4.2 4.4 4.9 5.6 6.7 1.6Nuclear. . . . . . . . . . . . . . . . . . . . . 0.1 0.1 0.1 0.2 0.2 0.2 0.2 0.3 3.6Other . . . . . . . . . . . . . . . . . . . . . . 3.6 3.6 3.7 4.1 4.4 4.9 5.3 5.9 1.6Total. . . . . . . . . . . . . . . . . . . . . . 17.2 17.3 17.8 20.2 21.5 23.5 25.4 27.9 1.6
Central and South AmericaLiquids . . . . . . . . . . . . . . . . . . . . . 11.3 11.8 12.2 12.5 12.0 12.4 13.2 13.8 0.5Natural gas. . . . . . . . . . . . . . . . . . 4.7 4.8 4.9 5.9 7.4 8.2 8.9 9.8 2.5Coal . . . . . . . . . . . . . . . . . . . . . . . 0.8 0.9 0.9 0.9 1.0 1.2 1.4 1.7 2.3Nuclear. . . . . . . . . . . . . . . . . . . . . 0.2 0.2 0.2 0.3 0.4 0.5 0.5 0.7 4.2Other . . . . . . . . . . . . . . . . . . . . . . 9.0 9.4 9.8 11.3 13.0 14.6 16.6 18.3 2.3Total. . . . . . . . . . . . . . . . . . . . . . 26.0 27.1 28.0 31.0 33.8 36.9 40.6 44.3 1.7
Total Non-OECDLiquids . . . . . . . . . . . . . . . . . . . . . 71.1 74.2 76.8 81.2 82.5 89.4 97.8 106.6 1.2Natural gas. . . . . . . . . . . . . . . . . . 52.5 54.2 56.5 72.9 82.6 89.1 93.2 98.1 2.0Coal . . . . . . . . . . . . . . . . . . . . . . . 75.7 79.7 84.6 94.6 108.2 123.8 141.9 161.9 2.3Nuclear. . . . . . . . . . . . . . . . . . . . . 4.3 4.4 4.5 7.5 10.9 13.7 15.4 17.5 4.9Other . . . . . . . . . . . . . . . . . . . . . . 25.3 26.5 27.1 35.5 41.9 48.1 55.3 62.1 3.0Total. . . . . . . . . . . . . . . . . . . . . . 229.0 239.0 249.5 291.6 326.1 364.2 403.6 446.2 2.1
Total WorldLiquids . . . . . . . . . . . . . . . . . . . . . 170.4 172.8 174.7 168.2 165.4 172.3 181.8 192.2 0.3Natural gas. . . . . . . . . . . . . . . . . . 106.3 108.3 112.1 129.3 143.0 153.1 159.7 167.0 1.4Coal . . . . . . . . . . . . . . . . . . . . . . . 122.3 126.4 132.4 139.5 153.6 170.7 190.5 213.0 1.7Nuclear. . . . . . . . . . . . . . . . . . . . . 27.5 27.8 27.1 32.3 37.4 41.1 43.9 47.1 2.0Other . . . . . . . . . . . . . . . . . . . . . . 46.2 47.9 48.8 63.7 73.5 83.4 93.5 102.3 2.7Total. . . . . . . . . . . . . . . . . . . . . . 472.7 483.1 495.2 532.9 572.9 620.5 669.4 721.6 1.4
Notes: Energy totals include net imports of coal coke and electricity generated from biomass in the United States. Totals may notequal sum of components due to independent rounding. The electricity portion of the national fuel consumption values consists ofgeneration for domestic use plus an adjustment for electricity trade based on a fuel’s share of total generation in the exporting coun-try.
Sources: History: U.S. Energy Information Administration (EIA), International Energy Statistics database (as of November 2009),web site www.eia.gov/emeu/international; and International Energy Agency, “Balances of OECD and Non-OECD Statistics” (2009),web site www.iea.org (subscription site). Projections: EIA, Annual Energy Outlook 2010, DOE/EIA-0383(2010) (Washington, DC,April 2010), AEO2010 National Energy Modeling System, run HP2010.D011910A, web site www.eia.gov/oiaf/aeo; and WorldEnergy Projection System Plus (2010).

Table D3. World gross domestic product (GDP) by region expressed in purchasing power parity,High Oil Price case, 2005-2035(Billion 2005 dollars)
Appendix D
198 U.S. Energy Information Administration / International Energy Outlook 2010
Region/Country
History Projections Average annualpercent change,
2007-20352005 2006 2007 2015 2020 2025 2030 2035
OECDOECD North America . . . . . . . . . . . 14,883 15,327 15,662 17,929 21,002 24,205 27,610 31,358 2.5United Statesa. . . . . . . . . . . . . . . . . 12,422 12,768 13,027 14,877 17,417 19,999 22,656 25,513 2.4Canada . . . . . . . . . . . . . . . . . . . . . . 1,167 1,200 1,231 1,436 1,606 1,779 1,975 2,192 2.1Mexico. . . . . . . . . . . . . . . . . . . . . . . 1,293 1,359 1,405 1,617 1,978 2,427 2,978 3,652 3.5
OECD Europe . . . . . . . . . . . . . . . . . 13,928 14,412 14,849 16,115 17,900 19,713 21,620 23,642 1.7OECD Asia . . . . . . . . . . . . . . . . . . . . 5,535 5,681 5,850 6,489 7,031 7,495 7,985 8,469 1.3
Japan . . . . . . . . . . . . . . . . . . . . . . . 3,872 3,951 4,041 4,226 4,394 4,476 4,559 4,623 0.5South Korea . . . . . . . . . . . . . . . . . . 892 938 986 1,254 1,480 1,708 1,940 2,169 2.9Australia/New Zealand . . . . . . . . . . 771 792 823 1,009 1,157 1,311 1,485 1,677 2.6Total OECD . . . . . . . . . . . . . . . . . 34,345 35,420 36,361 40,532 45,933 51,414 57,215 63,468 2.0
Non-OECDNon-OECD Europe and Eurasia. . . 2,977 3,218 3,481 4,193 4,939 5,731 6,557 7,440 2.7Russia . . . . . . . . . . . . . . . . . . . . . . . 1,703 1,834 1,982 2,359 2,767 3,220 3,705 4,244 2.8Other . . . . . . . . . . . . . . . . . . . . . . . . 1,275 1,384 1,499 1,833 2,173 2,510 2,852 3,196 2.7
Non-OECD Asia. . . . . . . . . . . . . . . . 11,897 13,013 14,323 23,905 31,574 39,975 48,993 58,578 5.2China. . . . . . . . . . . . . . . . . . . . . . . . 5,408 6,035 6,820 12,647 17,204 22,250 27,375 32,493 5.7India . . . . . . . . . . . . . . . . . . . . . . . . 2,440 2,676 2,918 4,810 6,280 7,755 9,442 11,350 5.0Other Non-OECD Asia . . . . . . . . . . 4,049 4,302 4,585 6,448 8,090 9,970 12,176 14,735 4.3
Middle East . . . . . . . . . . . . . . . . . . . 1,985 2,145 2,261 3,119 3,818 4,564 5,435 6,446 3.8Africa . . . . . . . . . . . . . . . . . . . . . . . . 2,360 2,494 2,638 3,615 4,368 5,175 6,053 7,037 3.6Central and South America . . . . . . 3,612 3,822 4,066 5,323 6,336 7,481 8,782 10,253 3.4Brazil . . . . . . . . . . . . . . . . . . . . . . . . 1,534 1,595 1,685 2,350 2,877 3,505 4,250 5,126 4.1Other Central and South America. . 2,079 2,227 2,381 2,973 3,459 3,976 4,531 5,126 2.8Total Non-OECD . . . . . . . . . . . . . 22,832 24,692 26,769 40,154 51,035 62,926 75,820 89,753 4.4
Total World . . . . . . . . . . . . . . . . . . . . 57,177 60,112 63,130 80,686 96,968 114,340 133,034 153,221 3.2aIncludes the 50 States and the District of Columbia.Note: Totals may not equal sum of components due to independent rounding.Sources: History: IHS Global Insight, World Overview (Lexington, MA, various issues). Projections: Derived from IHS Global
Insight, World Overview, Third Quarter 2009 (Lexington, MA, September 2009); and U.S. Energy Information Administration, AnnualEnergy Outlook 2010, DOE/EIA-0383(2010) (Washington, DC, April 2010), Table B4.
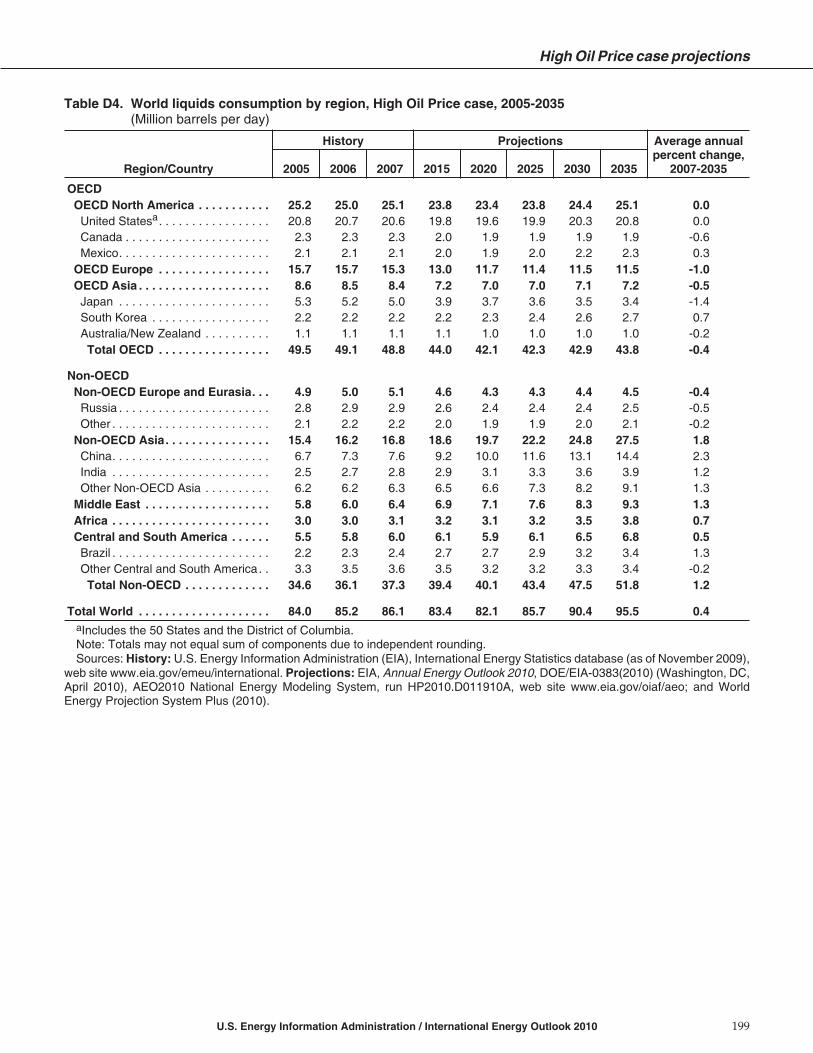
Table D4. World liquids consumption by region, High Oil Price case, 2005-2035(Million barrels per day)
High Oil Price case projections
U.S. Energy Information Administration / International Energy Outlook 2010 199
Region/Country
History Projections Average annualpercent change,
2007-20352005 2006 2007 2015 2020 2025 2030 2035
OECDOECD North America . . . . . . . . . . . 25.2 25.0 25.1 23.8 23.4 23.8 24.4 25.1 0.0United Statesa. . . . . . . . . . . . . . . . . 20.8 20.7 20.6 19.8 19.6 19.9 20.3 20.8 0.0Canada . . . . . . . . . . . . . . . . . . . . . . 2.3 2.3 2.3 2.0 1.9 1.9 1.9 1.9 -0.6Mexico. . . . . . . . . . . . . . . . . . . . . . . 2.1 2.1 2.1 2.0 1.9 2.0 2.2 2.3 0.3
OECD Europe . . . . . . . . . . . . . . . . . 15.7 15.7 15.3 13.0 11.7 11.4 11.5 11.5 -1.0OECD Asia . . . . . . . . . . . . . . . . . . . . 8.6 8.5 8.4 7.2 7.0 7.0 7.1 7.2 -0.5Japan . . . . . . . . . . . . . . . . . . . . . . . 5.3 5.2 5.0 3.9 3.7 3.6 3.5 3.4 -1.4South Korea . . . . . . . . . . . . . . . . . . 2.2 2.2 2.2 2.2 2.3 2.4 2.6 2.7 0.7Australia/New Zealand . . . . . . . . . . 1.1 1.1 1.1 1.1 1.0 1.0 1.0 1.0 -0.2
Total OECD . . . . . . . . . . . . . . . . . 49.5 49.1 48.8 44.0 42.1 42.3 42.9 43.8 -0.4
Non-OECDNon-OECD Europe and Eurasia. . . 4.9 5.0 5.1 4.6 4.3 4.3 4.4 4.5 -0.4Russia . . . . . . . . . . . . . . . . . . . . . . . 2.8 2.9 2.9 2.6 2.4 2.4 2.4 2.5 -0.5Other . . . . . . . . . . . . . . . . . . . . . . . . 2.1 2.2 2.2 2.0 1.9 1.9 2.0 2.1 -0.2
Non-OECD Asia. . . . . . . . . . . . . . . . 15.4 16.2 16.8 18.6 19.7 22.2 24.8 27.5 1.8China. . . . . . . . . . . . . . . . . . . . . . . . 6.7 7.3 7.6 9.2 10.0 11.6 13.1 14.4 2.3India . . . . . . . . . . . . . . . . . . . . . . . . 2.5 2.7 2.8 2.9 3.1 3.3 3.6 3.9 1.2Other Non-OECD Asia . . . . . . . . . . 6.2 6.2 6.3 6.5 6.6 7.3 8.2 9.1 1.3
Middle East . . . . . . . . . . . . . . . . . . . 5.8 6.0 6.4 6.9 7.1 7.6 8.3 9.3 1.3Africa . . . . . . . . . . . . . . . . . . . . . . . . 3.0 3.0 3.1 3.2 3.1 3.2 3.5 3.8 0.7Central and South America . . . . . . 5.5 5.8 6.0 6.1 5.9 6.1 6.5 6.8 0.5Brazil . . . . . . . . . . . . . . . . . . . . . . . . 2.2 2.3 2.4 2.7 2.7 2.9 3.2 3.4 1.3Other Central and South America. . 3.3 3.5 3.6 3.5 3.2 3.2 3.3 3.4 -0.2Total Non-OECD . . . . . . . . . . . . . 34.6 36.1 37.3 39.4 40.1 43.4 47.5 51.8 1.2
Total World . . . . . . . . . . . . . . . . . . . . 84.0 85.2 86.1 83.4 82.1 85.7 90.4 95.5 0.4aIncludes the 50 States and the District of Columbia.Note: Totals may not equal sum of components due to independent rounding.Sources: History: U.S. Energy Information Administration (EIA), International Energy Statistics database (as of November 2009),
web site www.eia.gov/emeu/international. Projections: EIA, Annual Energy Outlook 2010, DOE/EIA-0383(2010) (Washington, DC,April 2010), AEO2010 National Energy Modeling System, run HP2010.D011910A, web site www.eia.gov/oiaf/aeo; and WorldEnergy Projection System Plus (2010).
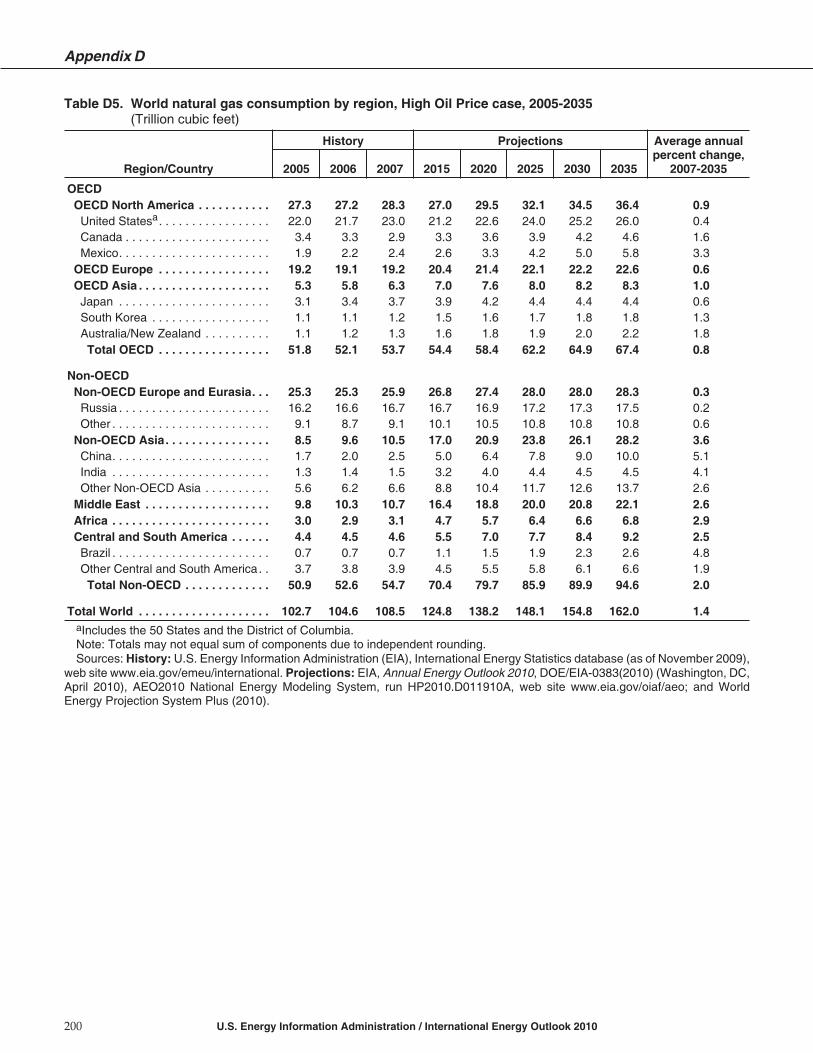
Table D5. World natural gas consumption by region, High Oil Price case, 2005-2035(Trillion cubic feet)
Appendix D
200 U.S. Energy Information Administration / International Energy Outlook 2010
Region/Country
History Projections Average annualpercent change,
2007-20352005 2006 2007 2015 2020 2025 2030 2035
OECDOECD North America . . . . . . . . . . . 27.3 27.2 28.3 27.0 29.5 32.1 34.5 36.4 0.9United Statesa. . . . . . . . . . . . . . . . . 22.0 21.7 23.0 21.2 22.6 24.0 25.2 26.0 0.4Canada . . . . . . . . . . . . . . . . . . . . . . 3.4 3.3 2.9 3.3 3.6 3.9 4.2 4.6 1.6Mexico. . . . . . . . . . . . . . . . . . . . . . . 1.9 2.2 2.4 2.6 3.3 4.2 5.0 5.8 3.3
OECD Europe . . . . . . . . . . . . . . . . . 19.2 19.1 19.2 20.4 21.4 22.1 22.2 22.6 0.6OECD Asia . . . . . . . . . . . . . . . . . . . . 5.3 5.8 6.3 7.0 7.6 8.0 8.2 8.3 1.0Japan . . . . . . . . . . . . . . . . . . . . . . . 3.1 3.4 3.7 3.9 4.2 4.4 4.4 4.4 0.6South Korea . . . . . . . . . . . . . . . . . . 1.1 1.1 1.2 1.5 1.6 1.7 1.8 1.8 1.3Australia/New Zealand . . . . . . . . . . 1.1 1.2 1.3 1.6 1.8 1.9 2.0 2.2 1.8Total OECD . . . . . . . . . . . . . . . . . 51.8 52.1 53.7 54.4 58.4 62.2 64.9 67.4 0.8
Non-OECDNon-OECD Europe and Eurasia. . . 25.3 25.3 25.9 26.8 27.4 28.0 28.0 28.3 0.3Russia . . . . . . . . . . . . . . . . . . . . . . . 16.2 16.6 16.7 16.7 16.9 17.2 17.3 17.5 0.2Other . . . . . . . . . . . . . . . . . . . . . . . . 9.1 8.7 9.1 10.1 10.5 10.8 10.8 10.8 0.6
Non-OECD Asia. . . . . . . . . . . . . . . . 8.5 9.6 10.5 17.0 20.9 23.8 26.1 28.2 3.6China. . . . . . . . . . . . . . . . . . . . . . . . 1.7 2.0 2.5 5.0 6.4 7.8 9.0 10.0 5.1India . . . . . . . . . . . . . . . . . . . . . . . . 1.3 1.4 1.5 3.2 4.0 4.4 4.5 4.5 4.1Other Non-OECD Asia . . . . . . . . . . 5.6 6.2 6.6 8.8 10.4 11.7 12.6 13.7 2.6
Middle East . . . . . . . . . . . . . . . . . . . 9.8 10.3 10.7 16.4 18.8 20.0 20.8 22.1 2.6Africa . . . . . . . . . . . . . . . . . . . . . . . . 3.0 2.9 3.1 4.7 5.7 6.4 6.6 6.8 2.9Central and South America . . . . . . 4.4 4.5 4.6 5.5 7.0 7.7 8.4 9.2 2.5Brazil . . . . . . . . . . . . . . . . . . . . . . . . 0.7 0.7 0.7 1.1 1.5 1.9 2.3 2.6 4.8Other Central and South America. . 3.7 3.8 3.9 4.5 5.5 5.8 6.1 6.6 1.9Total Non-OECD . . . . . . . . . . . . . 50.9 52.6 54.7 70.4 79.7 85.9 89.9 94.6 2.0
Total World . . . . . . . . . . . . . . . . . . . . 102.7 104.6 108.5 124.8 138.2 148.1 154.8 162.0 1.4aIncludes the 50 States and the District of Columbia.Note: Totals may not equal sum of components due to independent rounding.Sources: History: U.S. Energy Information Administration (EIA), International Energy Statistics database (as of November 2009),
web site www.eia.gov/emeu/international. Projections: EIA, Annual Energy Outlook 2010, DOE/EIA-0383(2010) (Washington, DC,April 2010), AEO2010 National Energy Modeling System, run HP2010.D011910A, web site www.eia.gov/oiaf/aeo; and WorldEnergy Projection System Plus (2010).

Table D6. World coal consumption by region, High Oil Price case, 2005-2035(Quadrillion Btu)
High Oil Price case projections
U.S. Energy Information Administration / International Energy Outlook 2010 201
Region/Country
History Projections Average annualpercent change,
2007-20352005 2006 2007 2015 2020 2025 2030 2035
OECDOECD North America . . . . . . . . . . . 24.7 24.3 24.6 24.0 24.8 26.1 27.3 28.8 0.6United Statesa. . . . . . . . . . . . . . . . . 22.8 22.5 22.7 22.6 23.4 24.6 25.7 26.6 0.6Canada . . . . . . . . . . . . . . . . . . . . . . 1.5 1.4 1.5 1.1 1.1 1.1 1.2 1.3 -0.5Mexico. . . . . . . . . . . . . . . . . . . . . . . 0.4 0.4 0.4 0.4 0.4 0.4 0.5 0.9 2.9
OECD Europe . . . . . . . . . . . . . . . . . 12.7 13.1 13.2 11.6 11.3 11.0 11.1 11.6 -0.5OECD Asia . . . . . . . . . . . . . . . . . . . . 9.2 9.3 10.1 9.2 9.3 9.7 10.2 10.8 0.3Japan . . . . . . . . . . . . . . . . . . . . . . . 4.6 4.6 4.9 4.2 4.1 4.0 4.0 3.9 -0.8South Korea . . . . . . . . . . . . . . . . . . 2.1 2.1 2.3 2.2 2.4 2.7 3.2 3.8 1.8Australia/New Zealand . . . . . . . . . . 2.6 2.6 2.9 2.8 2.8 2.9 3.0 3.1 0.3Total OECD . . . . . . . . . . . . . . . . . 46.7 46.7 47.9 44.8 45.4 46.8 48.6 51.2 0.2
Non-OECDNon-OECD Europe and Eurasia. . . 8.4 8.8 8.7 8.0 8.0 8.1 8.9 10.0 0.5Russia . . . . . . . . . . . . . . . . . . . . . . . 4.3 4.4 4.3 4.1 4.1 4.2 4.8 5.6 1.0Other . . . . . . . . . . . . . . . . . . . . . . . . 4.1 4.4 4.4 3.9 3.9 3.9 4.1 4.4 0.0
Non-OECD Asia. . . . . . . . . . . . . . . . 61.9 65.4 70.3 81.2 94.4 109.3 125.7 142.9 2.6China. . . . . . . . . . . . . . . . . . . . . . . . 48.3 51.0 54.8 65.1 76.6 88.9 101.3 113.4 2.6India . . . . . . . . . . . . . . . . . . . . . . . . 8.6 9.2 10.2 10.5 11.7 12.7 14.1 16.0 1.6Other Non-OECD Asia . . . . . . . . . . 4.9 5.1 5.4 5.5 6.2 7.7 10.3 13.5 3.3
Middle East . . . . . . . . . . . . . . . . . . . 0.4 0.4 0.4 0.4 0.3 0.3 0.4 0.5 0.9Africa . . . . . . . . . . . . . . . . . . . . . . . . 4.2 4.2 4.2 4.2 4.4 4.9 5.6 6.7 1.6Central and South America . . . . . . 0.8 0.9 0.9 0.9 1.0 1.2 1.4 1.7 2.3Brazil . . . . . . . . . . . . . . . . . . . . . . . . 0.4 0.4 0.5 0.5 0.6 0.8 1.0 1.2 3.5Other Central and South America. . 0.4 0.4 0.5 0.4 0.4 0.4 0.4 0.5 0.3Total Non-OECD . . . . . . . . . . . . . 75.7 79.7 84.6 94.6 108.2 123.8 141.9 161.9 2.3
Total World . . . . . . . . . . . . . . . . . . . . 122.3 126.4 132.4 139.5 153.6 170.7 190.5 213.0 1.7aIncludes the 50 States and the District of Columbia.Note: Totals may not equal sum of components due to independent rounding.Sources: History: U.S. Energy Information Administration (EIA), International Energy Statistics database (as of November 2009),
web site www.eia.gov/emeu/international. Projections: EIA, Annual Energy Outlook 2010, DOE/EIA-0383(2010) (Washington, DC,April 2010), AEO2010 National Energy Modeling System, run HP2010.D011910A, web site www.eia.gov/oiaf/aeo; and WorldEnergy Projection System Plus (2010).

Table D7. World nuclear energy consumption by region, High Oil Price case, 2005-2035(Billion kilowatthours)
Appendix D
202 U.S. Energy Information Administration / International Energy Outlook 2010
Region/Country
History Projections Average annualpercent change,
2007-20352005 2006 2007 2015 2020 2025 2030 2035
OECDOECD North America . . . . . . . . . . . 880 891 905 958 1,020 1,031 1,046 1,077 0.6United Statesa. . . . . . . . . . . . . . . . . 782 787 806 834 883 886 886 900 0.4Canada . . . . . . . . . . . . . . . . . . . . . . 87 93 89 113 127 134 142 158 2.1Mexico. . . . . . . . . . . . . . . . . . . . . . . 10 10 10 11 11 11 18 18 2.2
OECD Europe . . . . . . . . . . . . . . . . . 932 929 879 935 967 1,011 1,055 1,084 0.8OECD Asia . . . . . . . . . . . . . . . . . . . . 429 430 386 494 560 591 641 683 2.1Japan . . . . . . . . . . . . . . . . . . . . . . . 290 288 251 319 342 358 388 417 1.8South Korea . . . . . . . . . . . . . . . . . . 139 141 136 175 218 233 254 266 2.4Australia/New Zealand . . . . . . . . . . 0 0 0 0 0 0 0 0 —Total OECD . . . . . . . . . . . . . . . . . 2,240 2,250 2,171 2,387 2,548 2,634 2,742 2,844 1.0
Non-OECDNon-OECD Europe and Eurasia. . . 264 269 273 342 425 512 545 588 2.8Russia . . . . . . . . . . . . . . . . . . . . . . . 140 144 148 197 258 324 345 364 3.3Other . . . . . . . . . . . . . . . . . . . . . . . . 124 124 125 145 167 188 200 224 2.1
Non-OECD Asia. . . . . . . . . . . . . . . . 106 111 119 312 543 698 814 942 7.7China. . . . . . . . . . . . . . . . . . . . . . . . 50 55 63 186 335 437 512 598 8.4India . . . . . . . . . . . . . . . . . . . . . . . . 16 16 16 66 119 156 179 203 9.5Other Non-OECD Asia . . . . . . . . . . 40 40 41 61 89 105 123 141 4.5
Middle East . . . . . . . . . . . . . . . . . . . 0 0 0 6 20 29 39 49 —Africa . . . . . . . . . . . . . . . . . . . . . . . . 12 10 12 15 15 21 21 31 3.5Central and South America . . . . . . 16 21 19 28 34 43 43 62 4.3Brazil . . . . . . . . . . . . . . . . . . . . . . . . 10 14 12 18 22 31 31 41 4.4Other Central and South America. . 6 7 7 10 12 12 12 21 4.2Total Non-OECD . . . . . . . . . . . . . 399 411 423 704 1,038 1,303 1,462 1,672 5.0
Total World . . . . . . . . . . . . . . . . . . . . 2,639 2,660 2,593 3,091 3,586 3,937 4,204 4,516 2.0aIncludes the 50 States and the District of Columbia.Note: Totals may not equal sum of components due to independent rounding.Sources: History: U.S. Energy Information Administration (EIA), International Energy Statistics database (as of November 2009),
web site www.eia.gov/emeu/international. Projections: EIA, Annual Energy Outlook 2010, DOE/EIA-0383(2010) (Washington, DC,April 2010), AEO2010 National Energy Modeling System, run HP2010.D011910A, web site www.eia.gov/oiaf/aeo; and WorldEnergy Projection System Plus (2010).

Table D8. World consumption of hydroelectricity and other renewable energy by region,High Oil Price case, 2005-2035(Quadrillion Btu)
High Oil Price case projections
U.S. Energy Information Administration / International Energy Outlook 2010 203
Region/Country
History Projections Average annualpercent change,
2007-20352005 2006 2007 2015 2020 2025 2030 2035
OECDOECD North America . . . . . . . . . . . 10.9 11.1 11.0 14.7 16.2 18.2 20.2 21.5 2.4United Statesa. . . . . . . . . . . . . . . . . 6.1 6.4 6.2 9.4 10.2 11.8 13.3 14.0 2.9Canada . . . . . . . . . . . . . . . . . . . . . . 4.2 4.1 4.2 4.6 5.1 5.5 5.8 6.2 1.4Mexico. . . . . . . . . . . . . . . . . . . . . . . 0.6 0.6 0.5 0.8 0.9 1.0 1.1 1.3 3.1
OECD Europe . . . . . . . . . . . . . . . . . 7.9 8.1 8.7 10.9 12.4 13.8 14.6 15.2 2.0OECD Asia . . . . . . . . . . . . . . . . . . . . 2.1 2.2 2.1 2.7 3.0 3.2 3.3 3.5 1.8Japan . . . . . . . . . . . . . . . . . . . . . . . 1.3 1.4 1.3 1.3 1.5 1.6 1.6 1.7 0.9South Korea . . . . . . . . . . . . . . . . . . 0.1 0.1 0.1 0.2 0.2 0.2 0.3 0.3 3.1Australia/New Zealand . . . . . . . . . . 0.7 0.7 0.7 1.2 1.3 1.4 1.5 1.5 2.9Total OECD . . . . . . . . . . . . . . . . . 20.9 21.4 21.7 28.2 31.6 35.2 38.2 40.2 2.2
Non-OECDNon-OECD Europe and Eurasia. . . 3.2 3.2 3.1 3.3 3.6 3.8 4.2 4.6 1.4Russia . . . . . . . . . . . . . . . . . . . . . . . 1.9 1.9 1.9 2.0 2.2 2.4 2.6 2.8 1.5Other . . . . . . . . . . . . . . . . . . . . . . . . 1.4 1.3 1.2 1.4 1.4 1.5 1.6 1.7 1.3
Non-OECD Asia. . . . . . . . . . . . . . . . 9.3 9.9 10.2 16.2 20.4 24.2 28.6 32.7 4.2China. . . . . . . . . . . . . . . . . . . . . . . . 4.1 4.5 4.5 8.7 11.2 13.8 16.4 18.6 5.2India . . . . . . . . . . . . . . . . . . . . . . . . 2.3 2.4 2.5 3.2 4.0 4.5 5.1 5.8 3.0Other Non-OECD Asia . . . . . . . . . . 2.9 3.0 3.1 4.3 5.2 5.9 7.0 8.3 3.5
Middle East . . . . . . . . . . . . . . . . . . . 0.3 0.3 0.3 0.4 0.5 0.6 0.6 0.7 3.2Africa . . . . . . . . . . . . . . . . . . . . . . . . 3.6 3.6 3.7 4.1 4.4 4.9 5.3 5.9 1.6Central and South America . . . . . . 9.0 9.4 9.8 11.3 13.0 14.6 16.6 18.3 2.3Brazil . . . . . . . . . . . . . . . . . . . . . . . . 5.5 5.7 6.2 7.2 8.4 9.7 11.1 12.3 2.5Other Central and South America. . 3.5 3.7 3.6 4.1 4.6 5.0 5.5 6.0 1.8Total Non-OECD . . . . . . . . . . . . . 25.3 26.5 27.1 35.5 41.9 48.1 55.3 62.1 3.0
Total World . . . . . . . . . . . . . . . . . . . . 46.2 47.9 48.8 63.7 73.5 83.4 93.5 102.3 2.7aIncludes the 50 States and the District of Columbia.Notes: Totals may not equal sum of components due to independent rounding. U.S. totals include net electricity imports, methanol,
and liquid hydrogen.Sources: History: U.S. Energy Information Administration (EIA), International Energy Statistics database (as of November 2009),
web site www.eia.gov/emeu/international; and International Energy Agency, “Balances of OECD and Non-OECD Statistics” (2009),web site www.iea.org (subscription site). Projections: EIA, Annual Energy Outlook 2010, DOE/EIA-0383(2010) (Washington, DC,April 2010), AEO2010 National Energy Modeling System, run HP2010.D011910A, web site www.eia.gov/oiaf/aeo; and WorldEnergy Projection System Plus (2010).

Table D9. World carbon dioxide emissions by region, High Oil Price case, 2005-2035(Million metric tons carbon dioxide)
Appendix D
204 U.S. Energy Information Administration / International Energy Outlook 2010
Region/Country
History Projections Average annualpercent change,
2007-20352005 2006 2007 2015 2020 2025 2030 2035
OECDOECD North America . . . . . . . . . . . 7,012 6,915 7,017 6,609 6,679 6,910 7,161 7,453 0.2United Statesa. . . . . . . . . . . . . . . . . 5,974 5,894 5,986 5,642 5,684 5,829 5,980 6,134 0.1Canada . . . . . . . . . . . . . . . . . . . . . . 628 596 586 533 525 548 579 614 0.2Mexico. . . . . . . . . . . . . . . . . . . . . . . 410 426 444 434 470 533 602 705 1.7
OECD Europe . . . . . . . . . . . . . . . . . 4,398 4,426 4,386 3,985 3,829 3,811 3,829 3,903 -0.4OECD Asia . . . . . . . . . . . . . . . . . . . . 2,203 2,197 2,273 2,093 2,111 2,169 2,231 2,310 0.1
Japan . . . . . . . . . . . . . . . . . . . . . . . 1,254 1,253 1,262 1,070 1,065 1,054 1,036 1,020 -0.8South Korea . . . . . . . . . . . . . . . . . . 496 486 516 520 546 603 665 739 1.3Australia/New Zealand . . . . . . . . . . 453 457 495 503 501 512 529 551 0.4Total OECD . . . . . . . . . . . . . . . . . 13,613 13,538 13,676 12,687 12,619 12,890 13,220 13,666 0.0
Non-OECDNon-OECD Europe and Eurasia. . . 2,842 2,876 2,897 2,834 2,828 2,873 2,957 3,096 0.2Russia . . . . . . . . . . . . . . . . . . . . . . . 1,650 1,672 1,663 1,620 1,607 1,624 1,680 1,783 0.2Other . . . . . . . . . . . . . . . . . . . . . . . . 1,193 1,204 1,233 1,214 1,221 1,249 1,277 1,313 0.2
Non-OECD Asia. . . . . . . . . . . . . . . . 8,382 8,831 9,425 11,035 12,644 14,538 16,552 18,635 2.5China. . . . . . . . . . . . . . . . . . . . . . . . 5,558 5,862 6,284 7,609 8,873 10,309 11,742 13,123 2.7India . . . . . . . . . . . . . . . . . . . . . . . . 1,187 1,287 1,399 1,537 1,708 1,861 2,036 2,254 1.7Other Non-OECD Asia . . . . . . . . . . 1,637 1,681 1,743 1,889 2,062 2,369 2,774 3,257 2.3
Middle East . . . . . . . . . . . . . . . . . . . 1,395 1,446 1,515 1,904 2,066 2,204 2,349 2,563 1.9Africa . . . . . . . . . . . . . . . . . . . . . . . . 982 988 1,011 1,114 1,172 1,276 1,392 1,542 1.5Central and South America . . . . . . 1,092 1,133 1,169 1,244 1,297 1,382 1,489 1,609 1.1Brazil . . . . . . . . . . . . . . . . . . . . . . . . 366 380 394 453 492 553 631 708 2.1Other Central and South America. . 726 753 775 791 805 828 858 901 0.5Total Non-OECD . . . . . . . . . . . . . 14,693 15,274 16,017 18,132 20,007 22,273 24,739 27,444 1.9
Total World . . . . . . . . . . . . . . . . . . . . 28,306 28,812 29,694 30,819 32,626 35,162 37,959 41,111 1.2aIncludes the 50 States and the District of Columbia.Note: The U.S. numbers include carbon dioxide emissions attributable to renewable energy sources.Sources: History: U.S. Energy Information Administration (EIA), International Energy Statistics database (as of November 2009),
web site www.eia.gov/emeu/international. Projections: EIA, Annual Energy Outlook 2010, DOE/EIA-0383(2010) (Washington, DC,April 2010), AEO2010 National Energy Modeling System, run HP2010.D011910A, web site www.eia.gov/oiaf/aeo; and WorldEnergy Projection System Plus (2010).

Table D10. World carbon dioxide emissions from liquids use by region, High Oil Price case, 2005-2035(Million metric tons carbon dioxide)
High Oil Price case projections
U.S. Energy Information Administration / International Energy Outlook 2010 205
Region/Country
History Projections Average annualpercent change,
2007-20352005 2006 2007 2015 2020 2025 2030 2035
OECDOECD North America . . . . . . . . . . . 3,194 3,142 3,150 2,850 2,741 2,721 2,755 2,826 -0.4United Statesa. . . . . . . . . . . . . . . . . 2,626 2,595 2,589 2,340 2,261 2,230 2,244 2,288 -0.4Canada . . . . . . . . . . . . . . . . . . . . . . 301 281 288 256 232 232 237 243 -0.6Mexico. . . . . . . . . . . . . . . . . . . . . . . 267 265 273 254 248 259 275 295 0.3
OECD Europe . . . . . . . . . . . . . . . . . 2,133 2,125 2,082 1,765 1,583 1,552 1,557 1,560 -1.0OECD Asia . . . . . . . . . . . . . . . . . . . . 1,031 991 980 838 813 816 822 830 -0.6
Japan . . . . . . . . . . . . . . . . . . . . . . . 646 622 603 464 448 435 422 410 -1.4South Korea . . . . . . . . . . . . . . . . . . 239 221 227 227 230 245 262 280 0.7Australia/New Zealand . . . . . . . . . . 147 148 150 147 136 136 138 141 -0.2Total OECD . . . . . . . . . . . . . . . . . 6,358 6,258 6,212 5,453 5,137 5,089 5,135 5,217 -0.6
Non-OECDNon-OECD Europe and Eurasia. . . 686 677 682 636 596 597 609 630 -0.3Russia . . . . . . . . . . . . . . . . . . . . . . . 383 368 366 349 324 317 318 331 -0.4Other . . . . . . . . . . . . . . . . . . . . . . . . 303 310 316 287 273 279 290 299 -0.2
Non-OECD Asia. . . . . . . . . . . . . . . . 2,081 2,147 2,225 2,463 2,612 2,936 3,288 3,634 1.8China. . . . . . . . . . . . . . . . . . . . . . . . 889 928 969 1,177 1,283 1,481 1,674 1,849 2.3India . . . . . . . . . . . . . . . . . . . . . . . . 314 349 369 382 400 430 469 509 1.2Other Non-OECD Asia . . . . . . . . . . 878 870 887 903 929 1,025 1,145 1,276 1.3
Middle East . . . . . . . . . . . . . . . . . . . 817 839 886 959 987 1,060 1,156 1,286 1.3Africa . . . . . . . . . . . . . . . . . . . . . . . . 423 428 441 456 434 457 491 529 0.7Central and South America . . . . . . 762 796 823 845 807 836 886 928 0.4Brazil . . . . . . . . . . . . . . . . . . . . . . . . 288 301 311 349 350 378 415 450 1.3Other Central and South America. . 474 495 512 496 456 459 470 478 -0.2Total Non-OECD . . . . . . . . . . . . . 4,768 4,888 5,057 5,358 5,436 5,886 6,430 7,006 1.2
Total World . . . . . . . . . . . . . . . . . . . . 11,126 11,146 11,268 10,811 10,573 10,975 11,565 12,222 0.3aIncludes the 50 States and the District of Columbia.Sources: History: U.S. Energy Information Administration (EIA), International Energy Statistics database (as of November 2009),
web site www.eia.gov/emeu/international. Projections: EIA, Annual Energy Outlook 2010, DOE/EIA-0383(2010) (Washington, DC,April 2010), AEO2010 National Energy Modeling System, run HP2010.D011910A, web site www.eia.gov/oiaf/aeo; and WorldEnergy Projection System Plus (2010).

Table D11. World carbon dioxide emissions from natural gas use by region, High Oil Price case, 2005-2035(Million metric tons carbon dioxide)
Appendix D
206 U.S. Energy Information Administration / International Energy Outlook 2010
Region/Country
History Projections Average annualpercent change,
2007-20352005 2006 2007 2015 2020 2025 2030 2035
OECDOECD North America . . . . . . . . . . . 1,468 1,463 1,524 1,466 1,585 1,711 1,811 1,901 0.8United Statesa. . . . . . . . . . . . . . . . . 1,176 1,157 1,232 1,143 1,203 1,260 1,299 1,323 0.3Canada . . . . . . . . . . . . . . . . . . . . . . 186 181 157 178 195 214 231 248 1.6Mexico. . . . . . . . . . . . . . . . . . . . . . . 106 125 135 146 187 236 281 330 3.3
OECD Europe . . . . . . . . . . . . . . . . . 1,048 1,045 1,049 1,119 1,172 1,208 1,217 1,239 0.6OECD Asia . . . . . . . . . . . . . . . . . . . . 311 336 355 393 426 451 461 470 1.0
Japan . . . . . . . . . . . . . . . . . . . . . . . 183 202 208 215 234 245 247 246 0.6South Korea . . . . . . . . . . . . . . . . . . 64 68 73 87 95 103 104 105 1.3Australia/New Zealand . . . . . . . . . . 65 66 73 91 97 103 110 119 1.8Total OECD . . . . . . . . . . . . . . . . . 2,827 2,843 2,928 2,977 3,183 3,370 3,490 3,610 0.8
Non-OECDNon-OECD Europe and Eurasia. . . 1,367 1,367 1,397 1,451 1,485 1,517 1,521 1,532 0.3Russia . . . . . . . . . . . . . . . . . . . . . . . 865 889 897 893 902 916 922 933 0.1Other . . . . . . . . . . . . . . . . . . . . . . . . 502 478 500 559 583 601 599 599 0.6
Non-OECD Asia. . . . . . . . . . . . . . . . 459 518 572 924 1,137 1,299 1,423 1,537 3.6China. . . . . . . . . . . . . . . . . . . . . . . . 92 111 138 277 356 431 500 555 5.1India . . . . . . . . . . . . . . . . . . . . . . . . 70 75 80 173 220 240 245 248 4.1Other Non-OECD Asia . . . . . . . . . . 297 332 354 473 561 629 678 734 2.6
Middle East . . . . . . . . . . . . . . . . . . . 543 571 594 912 1,047 1,112 1,159 1,232 2.6Africa . . . . . . . . . . . . . . . . . . . . . . . . 169 166 176 270 325 367 376 390 2.9Central and South America . . . . . . 250 256 259 313 394 435 472 518 2.5Brazil . . . . . . . . . . . . . . . . . . . . . . . . 36 38 39 58 84 104 125 142 4.8Other Central and South America. . 214 218 220 255 310 331 347 376 1.9Total Non-OECD . . . . . . . . . . . . . 2,788 2,877 2,997 3,870 4,388 4,730 4,951 5,210 2.0
Total World . . . . . . . . . . . . . . . . . . . . 5,614 5,720 5,925 6,848 7,571 8,101 8,441 8,820 1.4aIncludes the 50 States and the District of Columbia.Sources: History: U.S. Energy Information Administration (EIA), International Energy Statistics database (as of November 2009),
web site www.eia.gov/emeu/international. Projections: EIA, Annual Energy Outlook 2010, DOE/EIA-0383(2010) (Washington, DC,April 2010), AEO2010 National Energy Modeling System, run HP2010.D011910A, web site www.eia.gov/oiaf/aeo; and WorldEnergy Projection System Plus (2010).

Table D12. World carbon dioxide emissions from coal use by region, High Oil Price case, 2005-2035(Million metric tons carbon dioxide)
High Oil Price case projections
U.S. Energy Information Administration / International Energy Outlook 2010 207
Region/Country
History Projections Average annualpercent change,
2007-20352005 2006 2007 2015 2020 2025 2030 2035
OECDOECD North America . . . . . . . . . . . 2,339 2,299 2,331 2,282 2,341 2,467 2,582 2,714 0.5United Statesa. . . . . . . . . . . . . . . . . 2,161 2,130 2,155 2,148 2,208 2,328 2,426 2,511 0.5Canada . . . . . . . . . . . . . . . . . . . . . . 142 133 141 100 99 102 111 123 -0.5Mexico. . . . . . . . . . . . . . . . . . . . . . . 36 36 36 34 35 37 46 81 2.9
OECD Europe . . . . . . . . . . . . . . . . . 1,217 1,256 1,256 1,102 1,075 1,050 1,054 1,103 -0.5OECD Asia . . . . . . . . . . . . . . . . . . . . 861 870 938 862 871 902 947 1,010 0.3
Japan . . . . . . . . . . . . . . . . . . . . . . . 425 429 451 390 383 374 367 365 -0.8South Korea . . . . . . . . . . . . . . . . . . 193 197 216 206 220 255 300 354 1.8Australia/New Zealand . . . . . . . . . . 242 244 271 265 267 273 281 291 0.3Total OECD . . . . . . . . . . . . . . . . . 4,417 4,425 4,525 4,245 4,287 4,419 4,584 4,828 0.2
Non-OECDNon-OECD Europe and Eurasia. . . 790 832 819 747 746 759 827 935 0.5Russia . . . . . . . . . . . . . . . . . . . . . . . 402 416 401 378 381 391 440 519 0.9Other . . . . . . . . . . . . . . . . . . . . . . . . 388 417 417 369 366 368 388 416 0.0
Non-OECD Asia. . . . . . . . . . . . . . . . 5,843 6,165 6,629 7,649 8,895 10,303 11,841 13,463 2.6China. . . . . . . . . . . . . . . . . . . . . . . . 4,578 4,824 5,177 6,155 7,234 8,397 9,569 10,719 2.6India . . . . . . . . . . . . . . . . . . . . . . . . 803 863 950 982 1,089 1,191 1,322 1,497 1.6Other Non-OECD Asia . . . . . . . . . . 461 479 502 512 573 715 950 1,247 3.3
Middle East . . . . . . . . . . . . . . . . . . . 36 36 35 33 32 32 33 45 0.9Africa . . . . . . . . . . . . . . . . . . . . . . . . 390 394 395 389 413 453 525 623 1.6Central and South America . . . . . . 80 81 87 86 97 110 131 163 2.3Brazil . . . . . . . . . . . . . . . . . . . . . . . . 42 41 44 46 57 72 90 116 3.5Other Central and South America. . 38 40 43 40 39 39 41 47 0.3Total Non-OECD . . . . . . . . . . . . . 7,138 7,509 7,964 8,904 10,183 11,656 13,358 15,229 2.3
Total World . . . . . . . . . . . . . . . . . . . . 11,555 11,934 12,489 13,149 14,470 16,075 17,941 20,057 1.7aIncludes the 50 States and the District of Columbia.Sources: History: U.S. Energy Information Administration (EIA), International Energy Statistics database (as of November 2009),
web site www.eia.gov/emeu/international. Projections: EIA, Annual Energy Outlook 2010, DOE/EIA-0383(2010) (Washington, DC,April 2010), AEO2010 National Energy Modeling System, run HP2010.D011910A, web site www.eia.gov/oiaf/aeo; and WorldEnergy Projection System Plus (2010).

This page intentionally left blank.

Appendix E
Low Oil Price Case Projections:• World energy consumption• Gross domestic product• Carbon dioxide emissions

This page intentionally left blank.
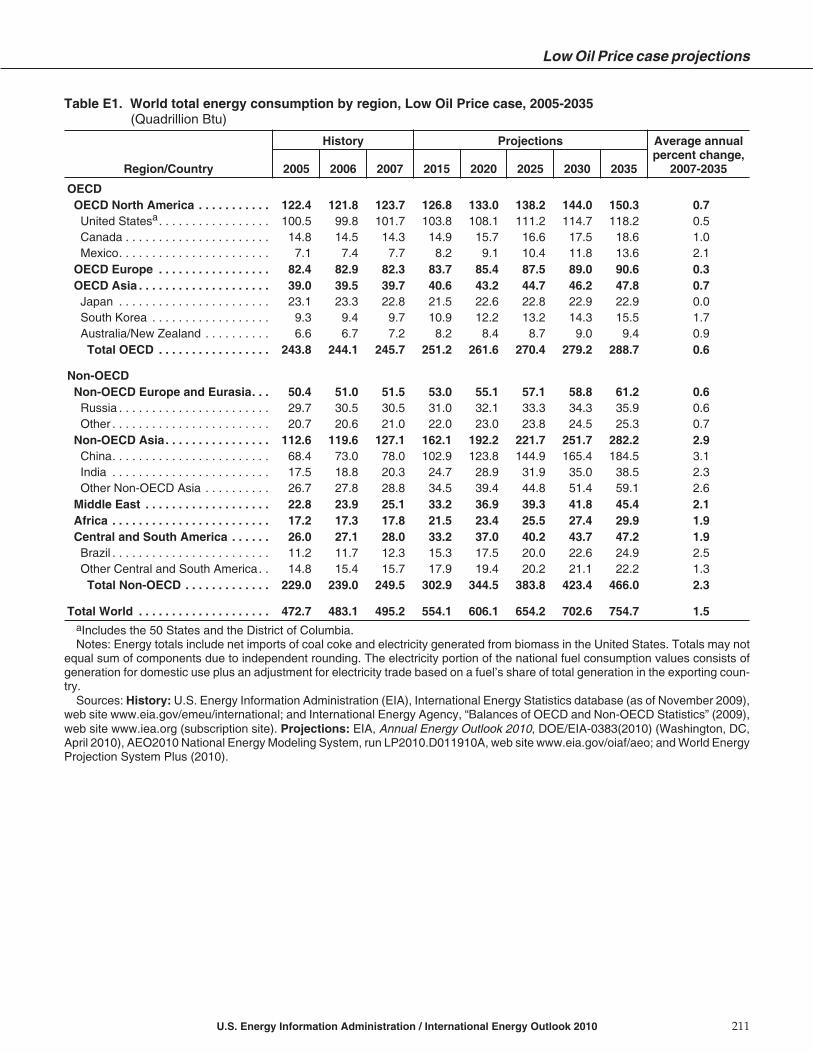
Table E1. World total energy consumption by region, Low Oil Price case, 2005-2035(Quadrillion Btu)
Low Oil Price case projections
U.S. Energy Information Administration / International Energy Outlook 2010 211
Region/Country
History Projections Average annualpercent change,
2007-20352005 2006 2007 2015 2020 2025 2030 2035
OECDOECD North America . . . . . . . . . . . 122.4 121.8 123.7 126.8 133.0 138.2 144.0 150.3 0.7United Statesa. . . . . . . . . . . . . . . . . 100.5 99.8 101.7 103.8 108.1 111.2 114.7 118.2 0.5Canada . . . . . . . . . . . . . . . . . . . . . . 14.8 14.5 14.3 14.9 15.7 16.6 17.5 18.6 1.0Mexico. . . . . . . . . . . . . . . . . . . . . . . 7.1 7.4 7.7 8.2 9.1 10.4 11.8 13.6 2.1
OECD Europe . . . . . . . . . . . . . . . . . 82.4 82.9 82.3 83.7 85.4 87.5 89.0 90.6 0.3OECD Asia . . . . . . . . . . . . . . . . . . . . 39.0 39.5 39.7 40.6 43.2 44.7 46.2 47.8 0.7Japan . . . . . . . . . . . . . . . . . . . . . . . 23.1 23.3 22.8 21.5 22.6 22.8 22.9 22.9 0.0South Korea . . . . . . . . . . . . . . . . . . 9.3 9.4 9.7 10.9 12.2 13.2 14.3 15.5 1.7Australia/New Zealand . . . . . . . . . . 6.6 6.7 7.2 8.2 8.4 8.7 9.0 9.4 0.9Total OECD . . . . . . . . . . . . . . . . . 243.8 244.1 245.7 251.2 261.6 270.4 279.2 288.7 0.6
Non-OECDNon-OECD Europe and Eurasia. . . 50.4 51.0 51.5 53.0 55.1 57.1 58.8 61.2 0.6Russia . . . . . . . . . . . . . . . . . . . . . . . 29.7 30.5 30.5 31.0 32.1 33.3 34.3 35.9 0.6Other . . . . . . . . . . . . . . . . . . . . . . . . 20.7 20.6 21.0 22.0 23.0 23.8 24.5 25.3 0.7
Non-OECD Asia. . . . . . . . . . . . . . . . 112.6 119.6 127.1 162.1 192.2 221.7 251.7 282.2 2.9China. . . . . . . . . . . . . . . . . . . . . . . . 68.4 73.0 78.0 102.9 123.8 144.9 165.4 184.5 3.1India . . . . . . . . . . . . . . . . . . . . . . . . 17.5 18.8 20.3 24.7 28.9 31.9 35.0 38.5 2.3Other Non-OECD Asia . . . . . . . . . . 26.7 27.8 28.8 34.5 39.4 44.8 51.4 59.1 2.6
Middle East . . . . . . . . . . . . . . . . . . . 22.8 23.9 25.1 33.2 36.9 39.3 41.8 45.4 2.1Africa . . . . . . . . . . . . . . . . . . . . . . . . 17.2 17.3 17.8 21.5 23.4 25.5 27.4 29.9 1.9Central and South America . . . . . . 26.0 27.1 28.0 33.2 37.0 40.2 43.7 47.2 1.9Brazil . . . . . . . . . . . . . . . . . . . . . . . . 11.2 11.7 12.3 15.3 17.5 20.0 22.6 24.9 2.5Other Central and South America. . 14.8 15.4 15.7 17.9 19.4 20.2 21.1 22.2 1.3Total Non-OECD . . . . . . . . . . . . . 229.0 239.0 249.5 302.9 344.5 383.8 423.4 466.0 2.3
Total World . . . . . . . . . . . . . . . . . . . . 472.7 483.1 495.2 554.1 606.1 654.2 702.6 754.7 1.5aIncludes the 50 States and the District of Columbia.Notes: Energy totals include net imports of coal coke and electricity generated from biomass in the United States. Totals may not
equal sum of components due to independent rounding. The electricity portion of the national fuel consumption values consists ofgeneration for domestic use plus an adjustment for electricity trade based on a fuel’s share of total generation in the exporting coun-try.
Sources: History: U.S. Energy Information Administration (EIA), International Energy Statistics database (as of November 2009),web site www.eia.gov/emeu/international; and International Energy Agency, “Balances of OECD and Non-OECD Statistics” (2009),web site www.iea.org (subscription site). Projections: EIA, Annual Energy Outlook 2010, DOE/EIA-0383(2010) (Washington, DC,April 2010), AEO2010 National Energy Modeling System, run LP2010.D011910A, web site www.eia.gov/oiaf/aeo; and World EnergyProjection System Plus (2010).

Table E2. World total energy consumption by region and fuel, Low Oil Price case, 2005-2035(Quadrillion Btu)
Appendix E
212 U.S. Energy Information Administration / International Energy Outlook 2010
Region/Country
History Projections Average annualpercent change,
2007-20352005 2006 2007 2015 2020 2025 2030 2035
OECDOECD North AmericaLiquids . . . . . . . . . . . . . . . . . . . . . 49.5 49.0 49.4 50.0 51.8 53.7 56.2 59.0 0.6Natural gas. . . . . . . . . . . . . . . . . . 28.1 28.1 29.2 29.0 30.6 32.1 34.2 36.1 0.8Coal . . . . . . . . . . . . . . . . . . . . . . . 24.7 24.3 24.6 23.5 24.3 24.8 25.1 25.8 0.2Nuclear. . . . . . . . . . . . . . . . . . . . . 9.2 9.4 9.6 10.1 10.8 10.9 11.0 11.2 0.6Other . . . . . . . . . . . . . . . . . . . . . . 10.9 11.1 11.0 14.2 15.6 16.8 17.4 18.3 1.9Total. . . . . . . . . . . . . . . . . . . . . . 122.4 121.8 123.7 126.8 133.0 138.2 144.0 150.3 0.7
OECD EuropeLiquids . . . . . . . . . . . . . . . . . . . . . 32.3 32.4 31.6 31.0 30.4 30.5 31.0 31.5 0.0Natural gas. . . . . . . . . . . . . . . . . . 19.7 19.7 19.8 20.5 21.5 21.9 21.9 22.1 0.4Coal . . . . . . . . . . . . . . . . . . . . . . . 12.7 13.1 13.2 11.5 11.1 10.8 10.6 10.7 -0.7Nuclear. . . . . . . . . . . . . . . . . . . . . 9.7 9.6 9.1 9.7 10.0 10.5 10.9 11.2 0.8Other . . . . . . . . . . . . . . . . . . . . . . 7.9 8.1 8.7 11.2 12.4 13.8 14.5 15.1 2.0Total. . . . . . . . . . . . . . . . . . . . . . 82.4 82.9 82.3 83.7 85.4 87.5 89.0 90.6 0.3
OECD AsiaLiquids . . . . . . . . . . . . . . . . . . . . . 17.5 17.2 16.9 16.6 17.6 18.0 18.4 18.8 0.4Natural gas. . . . . . . . . . . . . . . . . . 5.9 6.3 6.7 7.4 7.8 8.2 8.3 8.4 0.8Coal . . . . . . . . . . . . . . . . . . . . . . . 9.2 9.3 10.1 9.1 9.1 9.3 9.6 10.1 0.0Nuclear. . . . . . . . . . . . . . . . . . . . . 4.3 4.3 3.9 5.0 5.7 6.0 6.5 7.0 2.1Other . . . . . . . . . . . . . . . . . . . . . . 2.1 2.2 2.1 2.6 3.0 3.2 3.3 3.4 1.7Total. . . . . . . . . . . . . . . . . . . . . . 39.0 39.5 39.7 40.6 43.2 44.7 46.2 47.8 0.7
Total OECDLiquids . . . . . . . . . . . . . . . . . . . . . 99.3 98.6 97.9 97.6 99.8 102.2 105.6 109.3 0.4Natural gas. . . . . . . . . . . . . . . . . . 53.7 54.1 55.6 56.9 59.8 62.2 64.5 66.6 0.6Coal . . . . . . . . . . . . . . . . . . . . . . . 46.7 46.7 47.9 44.0 44.6 44.9 45.4 46.6 -0.1Nuclear. . . . . . . . . . . . . . . . . . . . . 23.2 23.3 22.6 24.8 26.5 27.4 28.5 29.4 0.9Other . . . . . . . . . . . . . . . . . . . . . . 20.9 21.4 21.7 27.9 31.0 33.7 35.2 36.8 1.9Total. . . . . . . . . . . . . . . . . . . . . . 243.8 244.1 245.7 251.2 261.6 270.4 279.2 288.7 0.6
Non-OECDNon-OECD Europe and EurasiaLiquids . . . . . . . . . . . . . . . . . . . . . 10.1 10.3 10.4 10.8 11.1 11.5 12.1 12.8 0.7Natural gas. . . . . . . . . . . . . . . . . . 25.8 25.8 26.3 27.2 27.9 28.4 28.5 28.6 0.3Coal . . . . . . . . . . . . . . . . . . . . . . . 8.4 8.8 8.7 7.9 7.9 7.9 8.3 9.0 0.1Nuclear. . . . . . . . . . . . . . . . . . . . . 2.9 2.9 3.0 3.7 4.6 5.5 5.8 6.3 2.7Other . . . . . . . . . . . . . . . . . . . . . . 3.2 3.2 3.1 3.3 3.6 3.8 4.1 4.5 1.4Total. . . . . . . . . . . . . . . . . . . . . . 50.4 51.0 51.5 53.0 55.1 57.1 58.8 61.2 0.6
Non-OECD AsiaLiquids . . . . . . . . . . . . . . . . . . . . . 31.7 33.4 34.6 44.9 52.5 60.1 68.0 75.7 2.8Natural gas. . . . . . . . . . . . . . . . . . 8.6 9.8 10.8 16.9 20.5 23.4 25.5 27.2 3.4Coal . . . . . . . . . . . . . . . . . . . . . . . 61.9 65.4 70.3 80.9 93.2 106.9 121.5 137.2 2.4Nuclear. . . . . . . . . . . . . . . . . . . . . 1.1 1.1 1.2 3.2 5.6 7.2 8.5 9.8 7.7Other . . . . . . . . . . . . . . . . . . . . . . 9.3 9.9 10.2 16.2 20.4 24.1 28.4 32.4 4.2Total. . . . . . . . . . . . . . . . . . . . . . 112.6 119.6 127.1 162.1 192.2 221.7 251.7 282.2 2.9
See notes at end of table.

Table E2. World total energy consumption by region and fuel, Low Oil Price case, 2005-2035 (continued)(Quadrillion Btu)
Low Oil Price case projections
U.S. Energy Information Administration / International Energy Outlook 2010 213
Region/Country
History Projections Average annualpercent change,
2007-20352005 2006 2007 2015 2020 2025 2030 2035
Non-OECD (continued)Middle EastLiquids . . . . . . . . . . . . . . . . . . . . . 12.0 12.5 13.3 15.3 16.6 18.2 20.4 23.2 2.0Natural gas. . . . . . . . . . . . . . . . . . 10.2 10.8 11.2 17.0 19.2 19.9 20.1 20.7 2.2Coal . . . . . . . . . . . . . . . . . . . . . . . 0.4 0.4 0.4 0.4 0.3 0.3 0.3 0.3 -0.3Nuclear. . . . . . . . . . . . . . . . . . . . . 0.0 0.0 0.0 0.1 0.2 0.3 0.4 0.5 —Other . . . . . . . . . . . . . . . . . . . . . . 0.3 0.3 0.3 0.4 0.5 0.5 0.6 0.6 3.1Total. . . . . . . . . . . . . . . . . . . . . . 22.8 23.9 25.1 33.2 36.9 39.3 41.8 45.4 2.1
AfricaLiquids . . . . . . . . . . . . . . . . . . . . . 6.1 6.2 6.4 7.7 8.2 8.8 9.6 10.5 1.8Natural gas. . . . . . . . . . . . . . . . . . 3.2 3.1 3.3 5.2 6.2 7.0 7.2 7.5 2.9Coal . . . . . . . . . . . . . . . . . . . . . . . 4.2 4.2 4.2 4.1 4.3 4.6 5.1 6.0 1.2Nuclear. . . . . . . . . . . . . . . . . . . . . 0.1 0.1 0.1 0.2 0.2 0.2 0.2 0.3 3.6Other . . . . . . . . . . . . . . . . . . . . . . 3.6 3.6 3.7 4.2 4.5 4.9 5.3 5.7 1.5Total. . . . . . . . . . . . . . . . . . . . . . 17.2 17.3 17.8 21.5 23.4 25.5 27.4 29.9 1.9
Central and South AmericaLiquids . . . . . . . . . . . . . . . . . . . . . 11.3 11.8 12.2 14.2 14.7 15.5 16.5 17.5 1.3Natural gas. . . . . . . . . . . . . . . . . . 4.7 4.8 4.9 6.3 7.8 8.4 8.9 9.5 2.4Coal . . . . . . . . . . . . . . . . . . . . . . . 0.8 0.9 0.9 0.9 1.0 1.2 1.4 1.6 2.0Nuclear. . . . . . . . . . . . . . . . . . . . . 0.2 0.2 0.2 0.3 0.4 0.5 0.5 0.7 4.2Other . . . . . . . . . . . . . . . . . . . . . . 9.0 9.4 9.8 11.5 13.1 14.7 16.5 17.9 2.2Total. . . . . . . . . . . . . . . . . . . . . . 26.0 27.1 28.0 33.2 37.0 40.2 43.7 47.2 1.9
Total Non-OECDLiquids . . . . . . . . . . . . . . . . . . . . . 71.1 74.2 76.8 92.9 103.0 114.1 126.6 139.6 2.2Natural gas. . . . . . . . . . . . . . . . . . 52.5 54.2 56.5 72.5 81.6 87.0 90.1 93.6 1.8Coal . . . . . . . . . . . . . . . . . . . . . . . 75.7 79.7 84.6 94.2 106.8 120.8 136.6 154.2 2.2Nuclear. . . . . . . . . . . . . . . . . . . . . 4.3 4.4 4.5 7.5 10.9 13.7 15.4 17.5 4.9Other . . . . . . . . . . . . . . . . . . . . . . 25.3 26.5 27.1 35.7 42.1 48.1 54.8 61.1 2.9Total. . . . . . . . . . . . . . . . . . . . . . 229.0 239.0 249.5 302.9 344.5 383.8 423.4 466.0 2.3
Total WorldLiquids . . . . . . . . . . . . . . . . . . . . . 170.4 172.8 174.7 190.5 202.8 216.3 232.2 248.9 1.3Natural gas. . . . . . . . . . . . . . . . . . 106.3 108.3 112.1 129.4 141.5 149.2 154.5 160.2 1.3Coal . . . . . . . . . . . . . . . . . . . . . . . 122.3 126.4 132.4 138.3 151.4 165.8 181.9 200.8 1.5Nuclear. . . . . . . . . . . . . . . . . . . . . 27.5 27.8 27.1 32.2 37.4 41.1 43.9 46.9 2.0Other . . . . . . . . . . . . . . . . . . . . . . 46.2 47.9 48.8 63.7 73.0 81.8 90.1 98.0 2.5Total. . . . . . . . . . . . . . . . . . . . . . 472.7 483.1 495.2 554.1 606.1 654.2 702.6 754.7 1.5
Notes: Energy totals include net imports of coal coke and electricity generated from biomass in the United States. Totals may notequal sum of components due to independent rounding. The electricity portion of the national fuel consumption values consists ofgeneration for domestic use plus an adjustment for electricity trade based on a fuel’s share of total generation in the exporting coun-try.
Sources: History: U.S. Energy Information Administration (EIA), International Energy Statistics database (as of November 2009),web site www.eia.gov/emeu/international; and International Energy Agency, “Balances of OECD and Non-OECD Statistics” (2009),web site www.iea.org (subscription site). Projections: EIA, Annual Energy Outlook 2010, DOE/EIA-0383(2010) (Washington, DC,April 2010), AEO2010 National Energy Modeling System, run LP2010.D011910A, web site www.eia.gov/oiaf/aeo; and World EnergyProjection System Plus (2010).

Table E3. World gross domestic product (GDP) by region expressed in purchasing power parity,Low Oil Price case, 2005-2035(Billion 2005 dollars)
Appendix E
214 U.S. Energy Information Administration / International Energy Outlook 2010
Region/Country
History Projections Average annualpercent change,
2007-20352005 2006 2007 2015 2020 2025 2030 2035
OECDOECD North America . . . . . . . . . . . 14,883 15,327 15,662 18,247 21,093 24,108 27,492 31,159 2.5United Statesa. . . . . . . . . . . . . . . . . 12,422 12,768 13,027 15,180 17,486 19,873 22,504 25,273 2.4Canada . . . . . . . . . . . . . . . . . . . . . . 1,167 1,200 1,231 1,436 1,606 1,779 1,975 2,192 2.1Mexico. . . . . . . . . . . . . . . . . . . . . . . 1,293 1,359 1,405 1,632 2,001 2,456 3,012 3,694 3.5
OECD Europe . . . . . . . . . . . . . . . . . 13,928 14,412 14,849 16,310 18,166 20,014 21,944 23,996 1.7OECD Asia . . . . . . . . . . . . . . . . . . . . 5,535 5,681 5,850 6,576 7,145 7,619 8,113 8,602 1.4
Japan . . . . . . . . . . . . . . . . . . . . . . . 3,872 3,951 4,041 4,293 4,480 4,565 4,649 4,713 0.6South Korea . . . . . . . . . . . . . . . . . . 892 938 986 1,274 1,509 1,742 1,979 2,212 2.9Australia/New Zealand . . . . . . . . . . 771 792 823 1,009 1,157 1,311 1,485 1,677 2.6Total OECD . . . . . . . . . . . . . . . . . 34,345 35,420 36,361 41,133 46,404 51,740 57,549 63,758 2.0
Non-OECDNon-OECD Europe and Eurasia. . . 2,977 3,218 3,481 4,193 4,940 5,732 6,557 7,440 2.7Russia . . . . . . . . . . . . . . . . . . . . . . . 1,703 1,834 1,982 2,337 2,736 3,183 3,663 4,196 2.7Other . . . . . . . . . . . . . . . . . . . . . . . . 1,275 1,384 1,499 1,856 2,205 2,548 2,895 3,244 2.8
Non-OECD Asia. . . . . . . . . . . . . . . . 11,897 13,013 14,323 24,219 32,084 40,639 49,793 59,533 5.2China. . . . . . . . . . . . . . . . . . . . . . . . 5,408 6,035 6,820 12,824 17,499 22,642 27,850 33,056 5.8India . . . . . . . . . . . . . . . . . . . . . . . . 2,440 2,676 2,918 4,887 6,403 7,910 9,628 11,573 5.0Other Non-OECD Asia . . . . . . . . . . 4,049 4,302 4,585 6,508 8,182 10,087 12,316 14,905 4.3
Middle East . . . . . . . . . . . . . . . . . . . 1,985 2,145 2,261 3,019 3,669 4,381 5,221 6,192 3.7Africa . . . . . . . . . . . . . . . . . . . . . . . . 2,360 2,494 2,638 3,666 4,443 5,266 6,158 7,159 3.6Central and South America . . . . . . 3,612 3,822 4,066 5,365 6,396 7,551 8,860 10,341 3.4Brazil . . . . . . . . . . . . . . . . . . . . . . . . 1,534 1,595 1,685 2,350 2,877 3,505 4,250 5,126 4.1Other Central and South America. . 2,079 2,227 2,381 3,015 3,518 4,046 4,610 5,215 2.8Total Non-OECD . . . . . . . . . . . . . 22,832 24,692 26,769 40,461 51,532 63,570 76,590 90,665 4.5
Total World . . . . . . . . . . . . . . . . . . . . 57,177 60,112 63,130 81,595 97,936 115,310 134,139 154,423 3.2aIncludes the 50 States and the District of Columbia.Note: Totals may not equal sum of components due to independent rounding.Sources: History: IHS Global Insight World Overview (Lexington, MA, various issues). Projections: Derived from IHS Global
Insight, World Overview, Third Quarter 2009 (Lexington, MA, September 2009); and U.S. Energy Information Administration, AnnualEnergy Outlook 2010, DOE/EIA-0383(2010) (Washington, DC, April 2010), Table B4.

Table E4. World liquids consumption by region, Low Oil Price case, 2005-2035(Million barrels per day)
Low Oil Price case projections
U.S. Energy Information Administration / International Energy Outlook 2010 215
Region/Country
History Projections Average annualpercent change,
2007-20352005 2006 2007 2015 2020 2025 2030 2035
OECDOECD North America . . . . . . . . . . . 25.2 25.0 25.1 25.8 26.7 27.7 28.9 30.3 0.7United Statesa. . . . . . . . . . . . . . . . . 20.8 20.7 20.6 21.2 21.9 22.7 23.6 24.5 0.6Canada . . . . . . . . . . . . . . . . . . . . . . 2.3 2.3 2.3 2.4 2.4 2.5 2.6 2.7 0.5Mexico. . . . . . . . . . . . . . . . . . . . . . . 2.1 2.1 2.1 2.2 2.4 2.5 2.8 3.1 1.3
OECD Europe . . . . . . . . . . . . . . . . . 15.7 15.7 15.3 15.0 14.8 14.8 15.0 15.3 0.0OECD Asia . . . . . . . . . . . . . . . . . . . . 8.6 8.5 8.4 8.2 8.7 8.9 9.1 9.3 0.4Japan . . . . . . . . . . . . . . . . . . . . . . . 5.3 5.2 5.0 4.5 4.8 4.7 4.7 4.6 -0.3South Korea . . . . . . . . . . . . . . . . . . 2.2 2.2 2.2 2.5 2.8 3.0 3.2 3.4 1.5Australia/New Zealand . . . . . . . . . . 1.1 1.1 1.1 1.2 1.2 1.2 1.3 1.3 0.6Total OECD . . . . . . . . . . . . . . . . . 49.5 49.1 48.8 49.0 50.1 51.4 53.1 54.9 0.4
Non-OECDNon-OECD Europe and Eurasia. . . 4.9 5.0 5.1 5.3 5.4 5.6 5.9 6.2 0.7Russia . . . . . . . . . . . . . . . . . . . . . . . 2.8 2.9 2.9 2.9 2.9 3.0 3.0 3.2 0.4Other . . . . . . . . . . . . . . . . . . . . . . . . 2.1 2.2 2.2 2.3 2.5 2.7 2.9 3.0 1.2
Non-OECD Asia. . . . . . . . . . . . . . . . 15.4 16.2 16.8 21.8 25.5 29.2 33.0 36.7 2.8China. . . . . . . . . . . . . . . . . . . . . . . . 6.7 7.3 7.6 10.9 13.2 15.5 17.6 19.5 3.4India . . . . . . . . . . . . . . . . . . . . . . . . 2.5 2.7 2.8 3.5 4.0 4.4 4.8 5.2 2.2Other Non-OECD Asia . . . . . . . . . . 6.2 6.2 6.3 7.4 8.3 9.3 10.6 12.0 2.3
Middle East . . . . . . . . . . . . . . . . . . . 5.8 6.0 6.4 7.4 8.0 8.8 9.8 11.2 2.0Africa . . . . . . . . . . . . . . . . . . . . . . . . 3.0 3.0 3.1 3.8 4.0 4.3 4.7 5.1 1.8Central and South America . . . . . . 5.5 5.8 6.0 6.9 7.2 7.6 8.1 8.5 1.3Brazil . . . . . . . . . . . . . . . . . . . . . . . . 2.2 2.3 2.4 3.0 3.2 3.5 3.9 4.3 2.1Other Central and South America. . 3.3 3.5 3.6 3.9 3.9 4.0 4.2 4.3 0.6Total Non-OECD . . . . . . . . . . . . . 34.6 36.1 37.3 45.2 50.1 55.4 61.5 67.8 2.2
Total World . . . . . . . . . . . . . . . . . . . . 84.0 85.2 86.1 94.2 100.2 106.8 114.6 122.7 1.3aIncludes the 50 States and the District of Columbia.Note: Totals may not equal sum of components due to independent rounding.Sources: History: U.S. Energy Information Administration (EIA), International Energy Statistics database (as of November 2009),
web site www.eia.gov/emeu/international. Projections: EIA, Annual Energy Outlook 2010, DOE/EIA-0383(2010) (Washington, DC,April 2010), AEO2010 National Energy Modeling System, run LP2010.D011910A, web site www.eia.gov/oiaf/aeo; and World EnergyProjection System Plus (2010).

Table E5. World natural gas consumption by region, Low Oil Price case, 2005-2035(Trillion cubic feet)
Appendix E
216 U.S. Energy Information Administration / International Energy Outlook 2010
Region/Country
History Projections Average annualpercent change,
2007-20352005 2006 2007 2015 2020 2025 2030 2035
OECDOECD North America . . . . . . . . . . . 27.3 27.2 28.3 28.1 29.6 31.0 33.1 34.9 0.8United Statesa. . . . . . . . . . . . . . . . . 22.0 21.7 23.0 22.6 23.2 23.6 24.8 25.5 0.4Canada . . . . . . . . . . . . . . . . . . . . . . 3.4 3.3 2.9 3.1 3.3 3.6 3.9 4.1 1.3Mexico. . . . . . . . . . . . . . . . . . . . . . . 1.9 2.2 2.4 2.5 3.1 3.8 4.5 5.3 2.9
OECD Europe . . . . . . . . . . . . . . . . . 19.2 19.1 19.2 19.8 20.8 21.2 21.2 21.4 0.4OECD Asia . . . . . . . . . . . . . . . . . . . . 5.3 5.8 6.3 6.9 7.3 7.7 7.8 7.9 0.8Japan . . . . . . . . . . . . . . . . . . . . . . . 3.1 3.4 3.7 3.8 3.9 4.0 4.0 3.9 0.2South Korea . . . . . . . . . . . . . . . . . . 1.1 1.1 1.2 1.5 1.6 1.8 1.8 1.8 1.5Australia/New Zealand . . . . . . . . . . 1.1 1.2 1.3 1.7 1.8 1.9 2.0 2.1 1.7Total OECD . . . . . . . . . . . . . . . . . 51.8 52.1 53.7 54.9 57.7 60.0 62.2 64.2 0.6
Non-OECDNon-OECD Europe and Eurasia. . . 25.3 25.3 25.9 26.7 27.4 27.9 27.9 28.1 0.3Russia . . . . . . . . . . . . . . . . . . . . . . . 16.2 16.6 16.7 16.7 16.9 17.2 17.3 17.5 0.2Other . . . . . . . . . . . . . . . . . . . . . . . . 9.1 8.7 9.1 10.0 10.4 10.7 10.6 10.6 0.5
Non-OECD Asia. . . . . . . . . . . . . . . . 8.5 9.6 10.5 16.4 19.9 22.7 24.8 26.5 3.3China. . . . . . . . . . . . . . . . . . . . . . . . 1.7 2.0 2.5 4.8 6.0 7.2 8.4 9.2 4.8India . . . . . . . . . . . . . . . . . . . . . . . . 1.3 1.4 1.5 3.1 3.9 4.3 4.4 4.5 4.1Other Non-OECD Asia . . . . . . . . . . 5.6 6.2 6.6 8.6 10.0 11.2 12.0 12.8 2.4
Middle East . . . . . . . . . . . . . . . . . . . 9.8 10.3 10.7 16.2 18.3 19.0 19.1 19.8 2.2Africa . . . . . . . . . . . . . . . . . . . . . . . . 3.0 2.9 3.1 4.9 5.8 6.5 6.7 6.9 2.9Central and South America . . . . . . 4.4 4.5 4.6 5.9 7.4 7.9 8.3 9.0 2.4Brazil . . . . . . . . . . . . . . . . . . . . . . . . 0.7 0.7 0.7 1.1 1.6 1.8 2.1 2.4 4.5Other Central and South America. . 3.7 3.8 3.9 4.8 5.8 6.1 6.2 6.6 1.9Total Non-OECD . . . . . . . . . . . . . 50.9 52.6 54.7 70.0 78.8 84.0 86.9 90.3 1.8
Total World . . . . . . . . . . . . . . . . . . . . 102.7 104.6 108.5 125.0 136.5 144.0 149.1 154.5 1.3aIncludes the 50 States and the District of Columbia.Note: Totals may not equal sum of components due to independent rounding.Sources: History: U.S. Energy Information Administration (EIA), International Energy Statistics database (as of November 2009),
web site www.eia.gov/emeu/international. Projections: EIA, Annual Energy Outlook 2010, DOE/EIA-0383(2010) (Washington, DC,April 2010), AEO2010 National Energy Modeling System, run LP2010.D011910A, web site www.eia.gov/oiaf/aeo; and World EnergyProjection System Plus (2010).

Table E6. World coal consumption by region, Low Oil Price case, 2005-2035(Quadrillion Btu)
Low Oil Price case projections
U.S. Energy Information Administration / International Energy Outlook 2010 217
Region/Country
History Projections Average annualpercent change,
2007-20352005 2006 2007 2015 2020 2025 2030 2035
OECDOECD North America . . . . . . . . . . . 24.7 24.3 24.6 23.5 24.3 24.8 25.1 25.8 0.2United Statesa. . . . . . . . . . . . . . . . . 22.8 22.5 22.7 22.1 22.9 23.4 23.6 24.1 0.2Canada . . . . . . . . . . . . . . . . . . . . . . 1.5 1.4 1.5 1.1 1.0 1.0 1.1 1.1 -1.0Mexico. . . . . . . . . . . . . . . . . . . . . . . 0.4 0.4 0.4 0.4 0.4 0.4 0.4 0.6 1.3
OECD Europe . . . . . . . . . . . . . . . . . 12.7 13.1 13.2 11.5 11.1 10.8 10.6 10.7 -0.7OECD Asia . . . . . . . . . . . . . . . . . . . . 9.2 9.3 10.1 9.1 9.1 9.3 9.6 10.1 0.0Japan . . . . . . . . . . . . . . . . . . . . . . . 4.6 4.6 4.9 4.1 4.0 3.8 3.7 3.6 -1.1South Korea . . . . . . . . . . . . . . . . . . 2.1 2.1 2.3 2.2 2.3 2.6 3.0 3.5 1.5Australia/New Zealand . . . . . . . . . . 2.6 2.6 2.9 2.8 2.8 2.9 2.9 3.0 0.1Total OECD . . . . . . . . . . . . . . . . . 46.7 46.7 47.9 44.0 44.6 44.9 45.4 46.6 -0.1
Non-OECDNon-OECD Europe and Eurasia. . . 8.4 8.8 8.7 7.9 7.9 7.9 8.3 9.0 0.1Russia . . . . . . . . . . . . . . . . . . . . . . . 4.3 4.4 4.3 4.1 4.1 4.2 4.5 5.1 0.6Other . . . . . . . . . . . . . . . . . . . . . . . . 4.1 4.4 4.4 3.9 3.8 3.7 3.8 3.9 -0.4
Non-OECD Asia. . . . . . . . . . . . . . . . 61.9 65.4 70.3 80.9 93.2 106.9 121.5 137.2 2.4China. . . . . . . . . . . . . . . . . . . . . . . . 48.3 51.0 54.8 65.0 75.9 87.4 98.9 110.3 2.5India . . . . . . . . . . . . . . . . . . . . . . . . 8.6 9.2 10.2 10.5 11.4 12.3 13.6 15.3 1.5Other Non-OECD Asia . . . . . . . . . . 4.9 5.1 5.4 5.4 5.9 7.1 9.0 11.6 2.8
Middle East . . . . . . . . . . . . . . . . . . . 0.4 0.4 0.4 0.4 0.3 0.3 0.3 0.3 -0.3Africa . . . . . . . . . . . . . . . . . . . . . . . . 4.2 4.2 4.2 4.1 4.3 4.6 5.1 6.0 1.2Central and South America . . . . . . 0.8 0.9 0.9 0.9 1.0 1.2 1.4 1.6 2.0Brazil . . . . . . . . . . . . . . . . . . . . . . . . 0.4 0.4 0.5 0.5 0.6 0.8 0.9 1.2 3.4Other Central and South America. . 0.4 0.4 0.5 0.4 0.4 0.4 0.4 0.4 -0.1Total Non-OECD . . . . . . . . . . . . . 75.7 79.7 84.6 94.2 106.8 120.8 136.6 154.2 2.2
Total World . . . . . . . . . . . . . . . . . . . . 122.3 126.4 132.4 138.3 151.4 165.8 181.9 200.8 1.5aIncludes the 50 States and the District of Columbia.Note: Totals may not equal sum of components due to independent rounding.Sources: History: U.S. Energy Information Administration (EIA), International Energy Statistics database (as of November 2009),
web site www.eia.gov/emeu/international. Projections: EIA, Annual Energy Outlook 2010, DOE/EIA-0383(2010) (Washington, DC,April 2010), AEO2010 National Energy Modeling System, run LP2010.D011910A, web site www.eia.gov/oiaf/aeo; and World EnergyProjection System Plus (2010).

Table E7. World nuclear energy consumption by region, Low Oil Price case, 2005-2035(Billion kilowatthours)
Appendix E
218 U.S. Energy Information Administration / International Energy Outlook 2010
Region/Country
History Projections Average annualpercent change,
2007-20352005 2006 2007 2015 2020 2025 2030 2035
OECDOECD North America . . . . . . . . . . . 880 891 905 958 1,020 1,031 1,046 1,059 0.6United Statesa. . . . . . . . . . . . . . . . . 782 787 806 834 883 886 886 883 0.3Canada . . . . . . . . . . . . . . . . . . . . . . 87 93 89 113 127 134 142 158 2.1Mexico. . . . . . . . . . . . . . . . . . . . . . . 10 10 10 11 11 11 18 18 2.2
OECD Europe . . . . . . . . . . . . . . . . . 932 929 879 935 967 1,011 1,055 1,084 0.8OECD Asia . . . . . . . . . . . . . . . . . . . . 429 430 386 490 560 591 641 683 2.1Japan . . . . . . . . . . . . . . . . . . . . . . . 290 288 251 315 342 358 388 417 1.8South Korea . . . . . . . . . . . . . . . . . . 139 141 136 175 218 233 254 266 2.4Australia/New Zealand . . . . . . . . . . 0 0 0 0 0 0 0 0 —Total OECD . . . . . . . . . . . . . . . . . 2,240 2,250 2,171 2,383 2,548 2,634 2,742 2,827 0.9
Non-OECDNon-OECD Europe and Eurasia. . . 264 269 273 342 425 512 545 588 2.8Russia . . . . . . . . . . . . . . . . . . . . . . . 140 144 148 197 258 324 345 364 3.3Other . . . . . . . . . . . . . . . . . . . . . . . . 124 124 125 145 167 188 200 224 2.1
Non-OECD Asia. . . . . . . . . . . . . . . . 106 111 119 312 543 698 814 942 7.7China. . . . . . . . . . . . . . . . . . . . . . . . 50 55 63 186 335 437 512 598 8.4India . . . . . . . . . . . . . . . . . . . . . . . . 16 16 16 66 119 156 179 203 9.5Other Non-OECD Asia . . . . . . . . . . 40 40 41 61 89 105 123 141 4.5
Middle East . . . . . . . . . . . . . . . . . . . 0 0 0 6 20 29 39 49 —Africa . . . . . . . . . . . . . . . . . . . . . . . . 12 10 12 15 15 21 21 31 3.5Central and South America . . . . . . 16 21 19 28 34 43 43 62 4.3Brazil . . . . . . . . . . . . . . . . . . . . . . . . 10 14 12 18 22 31 31 41 4.4Other Central and South America. . 6 7 7 10 12 12 12 21 4.2Total Non-OECD . . . . . . . . . . . . . 399 411 423 704 1,038 1,303 1,462 1,672 5.0
Total World . . . . . . . . . . . . . . . . . . . . 2,639 2,660 2,593 3,087 3,586 3,937 4,204 4,499 2.0aIncludes the 50 States and the District of Columbia.Note: Totals may not equal sum of components due to independent rounding.Sources: History: U.S. Energy Information Administration (EIA), International Energy Statistics database (as of November 2009),
web site www.eia.gov/emeu/international. Projections: EIA, Annual Energy Outlook 2010, DOE/EIA-0383(2010) (Washington, DC,April 2010), AEO2010 National Energy Modeling System, run LP2010.D011910A, web site www.eia.gov/oiaf/aeo; and World EnergyProjection System Plus (2010).

Table E8. World consumption of hydroelectricity and other renewable energy by region, Low Oil Price case,2005-2035(Quadrillion Btu)
Low Oil Price case projections
U.S. Energy Information Administration / International Energy Outlook 2010 219
Region/Country
History Projections Average annualpercent change,
2007-20352005 2006 2007 2015 2020 2025 2030 2035
OECDOECD North America . . . . . . . . . . . 10.9 11.1 11.0 14.2 15.6 16.8 17.4 18.3 1.9United Statesa. . . . . . . . . . . . . . . . . 6.1 6.4 6.2 8.9 9.7 10.4 10.6 11.0 2.1Canada . . . . . . . . . . . . . . . . . . . . . . 4.2 4.1 4.2 4.5 5.0 5.4 5.7 6.1 1.3Mexico. . . . . . . . . . . . . . . . . . . . . . . 0.6 0.6 0.5 0.8 0.8 1.0 1.1 1.2 3.0
OECD Europe . . . . . . . . . . . . . . . . . 7.9 8.1 8.7 11.2 12.4 13.8 14.5 15.1 2.0OECD Asia . . . . . . . . . . . . . . . . . . . . 2.1 2.2 2.1 2.6 3.0 3.2 3.3 3.4 1.7Japan . . . . . . . . . . . . . . . . . . . . . . . 1.3 1.4 1.3 1.3 1.5 1.6 1.6 1.7 0.8South Korea . . . . . . . . . . . . . . . . . . 0.1 0.1 0.1 0.2 0.2 0.2 0.2 0.3 2.9Australia/New Zealand . . . . . . . . . . 0.7 0.7 0.7 1.2 1.3 1.4 1.5 1.5 2.8Total OECD . . . . . . . . . . . . . . . . . 20.9 21.4 21.7 27.9 31.0 33.7 35.2 36.8 1.9
Non-OECDNon-OECD Europe and Eurasia. . . 3.2 3.2 3.1 3.3 3.6 3.8 4.1 4.5 1.4Russia . . . . . . . . . . . . . . . . . . . . . . . 1.9 1.9 1.9 2.0 2.2 2.4 2.6 2.8 1.5Other . . . . . . . . . . . . . . . . . . . . . . . . 1.4 1.3 1.2 1.4 1.4 1.5 1.6 1.7 1.3
Non-OECD Asia. . . . . . . . . . . . . . . . 9.3 9.9 10.2 16.2 20.4 24.1 28.4 32.4 4.2China. . . . . . . . . . . . . . . . . . . . . . . . 4.1 4.5 4.5 8.7 11.2 13.8 16.4 18.5 5.1India . . . . . . . . . . . . . . . . . . . . . . . . 2.3 2.4 2.5 3.2 4.0 4.4 5.0 5.7 2.9Other Non-OECD Asia . . . . . . . . . . 2.9 3.0 3.1 4.3 5.2 5.9 7.0 8.2 3.5
Middle East . . . . . . . . . . . . . . . . . . . 0.3 0.3 0.3 0.4 0.5 0.5 0.6 0.6 3.1Africa . . . . . . . . . . . . . . . . . . . . . . . . 3.6 3.6 3.7 4.2 4.5 4.9 5.3 5.7 1.5Central and South America . . . . . . 9.0 9.4 9.8 11.5 13.1 14.7 16.5 17.9 2.2Brazil . . . . . . . . . . . . . . . . . . . . . . . . 5.5 5.7 6.2 7.3 8.4 9.7 11.1 12.1 2.4Other Central and South America. . 3.5 3.7 3.6 4.2 4.6 5.0 5.4 5.8 1.7Total Non-OECD . . . . . . . . . . . . . 25.3 26.5 27.1 35.7 42.1 48.1 54.8 61.1 2.9
Total World . . . . . . . . . . . . . . . . . . . . 46.2 47.9 48.8 63.7 73.0 81.8 90.1 98.0 2.5aIncludes the 50 States and the District of Columbia.Notes: Totals may not equal sum of components due to independent rounding. U.S. totals include net electricity imports, methanol,
and liquid hydrogen.Sources: History: U.S. Energy Information Administration (EIA), International Energy Statistics database (as of November 2009),
web site www.eia.gov/emeu/international; and International Energy Agency, “Balances of OECD and Non-OECD Statistics” (2009),web site www.iea.org (subscription site). Projections: EIA, Annual Energy Outlook 2010, DOE/EIA-0383(2010) (Washington, DC,April 2010), AEO2010 National Energy Modeling System, run LP2010.D011910A, web site www.eia.gov/oiaf/aeo; and World EnergyProjection System Plus (2010).

Table E9. World carbon dioxide emissions by region, Low Oil Price case, 2005-2035(Million metric tons carbon dioxide)
Appendix E
220 U.S. Energy Information Administration / International Energy Outlook 2010
Region/Country
History Projections Average annualpercent change,
2007-20352005 2006 2007 2015 2020 2025 2030 2035
OECDOECD North America . . . . . . . . . . . 7,012 6,915 7,017 6,930 7,192 7,454 7,783 8,143 0.5United Statesa. . . . . . . . . . . . . . . . . 5,974 5,894 5,986 5,903 6,106 6,278 6,505 6,732 0.4Canada . . . . . . . . . . . . . . . . . . . . . . 628 596 586 567 577 603 633 666 0.5Mexico. . . . . . . . . . . . . . . . . . . . . . . 410 426 444 460 509 574 646 745 1.9
OECD Europe . . . . . . . . . . . . . . . . . 4,398 4,426 4,386 4,217 4,205 4,201 4,217 4,268 -0.1OECD Asia . . . . . . . . . . . . . . . . . . . . 2,203 2,197 2,273 2,198 2,277 2,340 2,394 2,463 0.3
Japan . . . . . . . . . . . . . . . . . . . . . . . 1,254 1,253 1,262 1,127 1,156 1,149 1,128 1,105 -0.5South Korea . . . . . . . . . . . . . . . . . . 496 486 516 550 593 651 710 781 1.5Australia/New Zealand . . . . . . . . . . 453 457 495 520 528 541 556 577 0.6Total OECD . . . . . . . . . . . . . . . . . 13,613 13,538 13,676 13,344 13,674 13,995 14,395 14,874 0.3
Non-OECDNon-OECD Europe and Eurasia. . . 2,842 2,876 2,897 2,924 2,979 3,033 3,111 3,237 0.4Russia . . . . . . . . . . . . . . . . . . . . . . . 1,650 1,672 1,663 1,662 1,679 1,697 1,744 1,836 0.4Other . . . . . . . . . . . . . . . . . . . . . . . . 1,193 1,204 1,233 1,262 1,300 1,337 1,368 1,401 0.5
Non-OECD Asia. . . . . . . . . . . . . . . . 8,382 8,831 9,425 11,399 13,241 15,165 17,160 19,229 2.6China. . . . . . . . . . . . . . . . . . . . . . . . 5,558 5,862 6,284 7,803 9,196 10,645 12,065 13,436 2.8India . . . . . . . . . . . . . . . . . . . . . . . . 1,187 1,287 1,399 1,597 1,801 1,957 2,133 2,352 1.9Other Non-OECD Asia . . . . . . . . . . 1,637 1,681 1,743 1,999 2,245 2,562 2,961 3,441 2.5
Middle East . . . . . . . . . . . . . . . . . . . 1,395 1,446 1,515 1,959 2,161 2,305 2,460 2,685 2.1Africa . . . . . . . . . . . . . . . . . . . . . . . . 982 988 1,011 1,195 1,293 1,405 1,520 1,670 1.8Central and South America . . . . . . 1,092 1,133 1,169 1,373 1,499 1,595 1,708 1,830 1.6Brazil . . . . . . . . . . . . . . . . . . . . . . . . 366 380 394 502 571 639 723 804 2.6Other Central and South America. . 726 753 775 871 929 956 985 1,025 1.0Total Non-OECD . . . . . . . . . . . . . 14,693 15,274 16,017 18,851 21,173 23,503 25,958 28,650 2.1
Total World . . . . . . . . . . . . . . . . . . . . 28,306 28,812 29,694 32,196 34,847 37,498 40,353 43,524 1.4aIncludes the 50 States and the District of Columbia.Note: The U.S. numbers include carbon dioxide emissions attributable to renewable energy sources.Sources: History: U.S. Energy Information Administration (EIA), International Energy Statistics database (as of November 2009),
web site www.eia.gov/emeu/international. Projections: EIA, Annual Energy Outlook 2010, DOE/EIA-0383(2010) (Washington, DC,April 2010), AEO2010 National Energy Modeling System, run LP2010.D011910A, web site www.eia.gov/oiaf/aeo; and World EnergyProjection System Plus (2010).

Table E10. World carbon dioxide emissions from liquids use by region, Low Oil Price case, 2005-2035(Million metric tons carbon dioxide)
Low Oil Price case projections
U.S. Energy Information Administration / International Energy Outlook 2010 221
Region/Country
History Projections Average annualpercent change,
2007-20352005 2006 2007 2015 2020 2025 2030 2035
OECDOECD North America . . . . . . . . . . . 3,194 3,142 3,150 3,162 3,276 3,408 3,592 3,786 0.7United Statesa. . . . . . . . . . . . . . . . . 2,626 2,595 2,589 2,577 2,676 2,775 2,920 3,059 0.6Canada . . . . . . . . . . . . . . . . . . . . . . 301 281 288 299 299 309 320 335 0.5Mexico. . . . . . . . . . . . . . . . . . . . . . . 267 265 273 287 302 323 352 392 1.3
OECD Europe . . . . . . . . . . . . . . . . . 2,133 2,125 2,082 2,039 2,003 2,009 2,041 2,077 0.0OECD Asia . . . . . . . . . . . . . . . . . . . . 1,031 991 980 959 1,013 1,036 1,056 1,075 0.3
Japan . . . . . . . . . . . . . . . . . . . . . . . 646 622 603 538 570 567 560 552 -0.3South Korea . . . . . . . . . . . . . . . . . . 239 221 227 258 280 302 324 346 1.5Australia/New Zealand . . . . . . . . . . 147 148 150 163 163 166 172 177 0.6Total OECD . . . . . . . . . . . . . . . . . 6,358 6,258 6,212 6,160 6,293 6,452 6,689 6,938 0.4
Non-OECDNon-OECD Europe and Eurasia. . . 686 677 682 734 757 784 822 868 0.9Russia . . . . . . . . . . . . . . . . . . . . . . . 383 368 366 394 397 397 405 426 0.5Other . . . . . . . . . . . . . . . . . . . . . . . . 303 310 316 340 360 387 417 442 1.2
Non-OECD Asia. . . . . . . . . . . . . . . . 2,081 2,147 2,225 2,885 3,371 3,856 4,363 4,858 2.8China. . . . . . . . . . . . . . . . . . . . . . . . 889 928 969 1,397 1,686 1,982 2,257 2,502 3.4India . . . . . . . . . . . . . . . . . . . . . . . . 314 349 369 451 519 568 622 680 2.2Other Non-OECD Asia . . . . . . . . . . 878 870 887 1,037 1,166 1,306 1,484 1,675 2.3
Middle East . . . . . . . . . . . . . . . . . . . 817 839 886 1,026 1,110 1,219 1,364 1,552 2.0Africa . . . . . . . . . . . . . . . . . . . . . . . . 423 428 441 534 561 605 662 721 1.8Central and South America . . . . . . 762 796 823 955 987 1,041 1,111 1,172 1.3Brazil . . . . . . . . . . . . . . . . . . . . . . . . 288 301 311 394 428 468 517 561 2.1Other Central and South America. . 474 495 512 561 559 573 594 611 0.6Total Non-OECD . . . . . . . . . . . . . 4,768 4,888 5,057 6,133 6,786 7,504 8,321 9,171 2.1
Total World . . . . . . . . . . . . . . . . . . . . 11,126 11,146 11,268 12,293 13,079 13,956 15,010 16,109 1.3aIncludes the 50 States and the District of Columbia.Sources: History: U.S. Energy Information Administration (EIA), International Energy Statistics database (as of November 2009),
web site www.eia.gov/emeu/international. Projections: EIA, Annual Energy Outlook 2010, DOE/EIA-0383(2010) (Washington, DC,April 2010), AEO2010 National Energy Modeling System, run LP2010.D011910A, web site www.eia.gov/oiaf/aeo; and World EnergyProjection System Plus (2010).

Table E11. World carbon dioxide emissions from natural gas use by region, Low Oil Price case, 2005-2035(Million metric tons carbon dioxide)
Appendix E
222 U.S. Energy Information Administration / International Energy Outlook 2010
Region/Country
History Projections Average annualpercent change,
2007-20352005 2006 2007 2015 2020 2025 2030 2035
OECDOECD North America . . . . . . . . . . . 1,468 1,463 1,524 1,525 1,607 1,687 1,804 1,903 0.8United Statesa. . . . . . . . . . . . . . . . . 1,176 1,157 1,232 1,217 1,252 1,274 1,338 1,379 0.4Canada . . . . . . . . . . . . . . . . . . . . . . 186 181 157 169 182 196 210 223 1.3Mexico. . . . . . . . . . . . . . . . . . . . . . . 106 125 135 139 173 216 256 301 2.9
OECD Europe . . . . . . . . . . . . . . . . . 1,048 1,045 1,049 1,086 1,140 1,163 1,163 1,172 0.4OECD Asia . . . . . . . . . . . . . . . . . . . . 311 336 355 391 413 435 441 447 0.8
Japan . . . . . . . . . . . . . . . . . . . . . . . 183 202 208 211 217 225 223 220 0.2South Korea . . . . . . . . . . . . . . . . . . 64 68 73 88 97 106 108 109 1.4Australia/New Zealand . . . . . . . . . . 65 66 73 92 99 104 110 118 1.7Total OECD . . . . . . . . . . . . . . . . . 2,827 2,843 2,928 3,002 3,160 3,285 3,408 3,522 0.7
Non-OECDNon-OECD Europe and Eurasia. . . 1,367 1,367 1,397 1,447 1,484 1,512 1,516 1,525 0.3Russia . . . . . . . . . . . . . . . . . . . . . . . 865 889 897 891 904 917 924 937 0.2Other . . . . . . . . . . . . . . . . . . . . . . . . 502 478 500 556 580 595 591 588 0.6
Non-OECD Asia. . . . . . . . . . . . . . . . 459 518 572 894 1,086 1,239 1,351 1,443 3.4China. . . . . . . . . . . . . . . . . . . . . . . . 92 111 138 264 335 401 464 510 4.8India . . . . . . . . . . . . . . . . . . . . . . . . 70 75 80 169 215 237 243 244 4.1Other Non-OECD Asia . . . . . . . . . . 297 332 354 461 536 601 644 689 2.4
Middle East . . . . . . . . . . . . . . . . . . . 543 571 594 901 1,019 1,055 1,065 1,100 2.2Africa . . . . . . . . . . . . . . . . . . . . . . . . 169 166 176 277 330 373 382 395 2.9Central and South America . . . . . . 250 256 259 332 416 444 470 505 2.4Brazil . . . . . . . . . . . . . . . . . . . . . . . . 36 38 39 62 86 101 118 132 4.5Other Central and South America. . 214 218 220 270 330 344 352 373 1.9Total Non-OECD . . . . . . . . . . . . . 2,788 2,877 2,997 3,852 4,335 4,623 4,784 4,969 1.8
Total World . . . . . . . . . . . . . . . . . . . . 5,614 5,720 5,925 6,854 7,495 7,908 8,192 8,491 1.3aIncludes the 50 States and the District of Columbia.Sources: History: U.S. Energy Information Administration (EIA), International Energy Statistics database (as of November 2009),
web site www.eia.gov/emeu/international. Projections: EIA, Annual Energy Outlook 2010, DOE/EIA-0383(2010) (Washington, DC,April 2010), AEO2010 National Energy Modeling System, run LP2010.D011910A, web site www.eia.gov/oiaf/aeo; and World EnergyProjection System Plus (2010).

Table E12. World carbon dioxide emissions from coal use by region, Low Oil Price case, 2005-2035(Million metric tons carbon dioxide)
Low Oil Price case projections
U.S. Energy Information Administration / International Energy Outlook 2010 223
Region/Country
History Projections Average annualpercent change,
2007-20352005 2006 2007 2015 2020 2025 2030 2035
OECDOECD North America . . . . . . . . . . . 2,339 2,299 2,331 2,231 2,297 2,348 2,376 2,442 0.2United Statesa. . . . . . . . . . . . . . . . . 2,161 2,130 2,155 2,097 2,166 2,217 2,236 2,283 0.2Canada . . . . . . . . . . . . . . . . . . . . . . 142 133 141 100 97 97 102 107 -1.0Mexico. . . . . . . . . . . . . . . . . . . . . . . 36 36 36 34 34 34 38 52 1.3
OECD Europe . . . . . . . . . . . . . . . . . 1,217 1,256 1,256 1,091 1,061 1,029 1,013 1,019 -0.7OECD Asia . . . . . . . . . . . . . . . . . . . . 861 870 938 848 851 869 897 942 0.0
Japan . . . . . . . . . . . . . . . . . . . . . . . 425 429 451 379 368 356 344 333 -1.1South Korea . . . . . . . . . . . . . . . . . . 193 197 216 204 216 243 278 326 1.5Australia/New Zealand . . . . . . . . . . 242 244 271 265 267 270 274 282 0.1Total OECD . . . . . . . . . . . . . . . . . 4,417 4,425 4,525 4,170 4,209 4,246 4,287 4,402 -0.1
Non-OECDNon-OECD Europe and Eurasia. . . 790 832 819 742 738 737 774 844 0.1Russia . . . . . . . . . . . . . . . . . . . . . . . 402 416 401 377 378 383 414 474 0.6Other . . . . . . . . . . . . . . . . . . . . . . . . 388 417 417 365 360 355 360 371 -0.4
Non-OECD Asia. . . . . . . . . . . . . . . . 5,843 6,165 6,629 7,620 8,785 10,070 11,445 12,928 2.4China. . . . . . . . . . . . . . . . . . . . . . . . 4,578 4,824 5,177 6,142 7,174 8,263 9,344 10,424 2.5India . . . . . . . . . . . . . . . . . . . . . . . . 803 863 950 978 1,067 1,153 1,268 1,427 1.5Other Non-OECD Asia . . . . . . . . . . 461 479 502 500 543 655 833 1,076 2.8
Middle East . . . . . . . . . . . . . . . . . . . 36 36 35 33 32 31 31 32 -0.3Africa . . . . . . . . . . . . . . . . . . . . . . . . 390 394 395 385 401 427 475 553 1.2Central and South America . . . . . . 80 81 87 86 97 109 127 153 2.0Brazil . . . . . . . . . . . . . . . . . . . . . . . . 42 41 44 46 57 71 88 111 3.4Other Central and South America. . 38 40 43 40 39 39 39 42 -0.1Total Non-OECD . . . . . . . . . . . . . 7,138 7,509 7,964 8,867 10,052 11,375 12,853 14,510 2.2
Total World . . . . . . . . . . . . . . . . . . . . 11,555 11,934 12,489 13,037 14,262 15,622 17,140 18,912 1.5aIncludes the 50 States and the District of Columbia.Sources: History: U.S. Energy Information Administration (EIA), International Energy Statistics database (as of November 2009),
web site www.eia.gov/emeu/international. Projections: EIA, Annual Energy Outlook 2010, DOE/EIA-0383(2010) (Washington, DC,April 2010), AEO2010 National Energy Modeling System, run LP2010.D011910A, web site www.eia.gov/oiaf/aeo; and World EnergyProjection System Plus (2010).

This page intentionally left blank.

Appendix F
Reference Case Projectionsby End-Use Sector and Country Grouping

This page intentionally left blank.

Table F1. Total world delivered energy consumption by end-use sector and fuel, 2007-2035(Quadrillion Btu)
Reference Case projections by end-use sector and country grouping
U.S. Energy Information Administration / International Energy Outlook 2010 227
Sector/Fuel 2007
Projections Average annualpercent change,
2007-20352015 2020 2025 2030 2035ResidentialLiquids . . . . . . . . . . . . . . . . . . . . . . . . . . 9.7 10.0 9.8 9.8 9.9 10.0 0.1Natural gas . . . . . . . . . . . . . . . . . . . . . . 20.3 23.1 24.2 24.9 25.1 25.8 0.8Coal . . . . . . . . . . . . . . . . . . . . . . . . . . . . 3.8 3.9 3.9 3.9 3.8 3.7 -0.1Electricity . . . . . . . . . . . . . . . . . . . . . . . . 15.8 19.2 21.7 24.2 26.7 29.1 2.2Renewables. . . . . . . . . . . . . . . . . . . . . . 0.4 0.4 0.4 0.4 0.4 0.4 0.2
Total . . . . . . . . . . . . . . . . . . . . . . . . . . 50.1 56.6 60.0 63.2 65.9 69.0 1.1CommercialLiquids . . . . . . . . . . . . . . . . . . . . . . . . . . 4.3 4.2 4.1 4.1 4.1 4.1 -0.2Natural gas . . . . . . . . . . . . . . . . . . . . . . 7.8 8.9 9.2 9.5 9.6 9.8 0.8Coal . . . . . . . . . . . . . . . . . . . . . . . . . . . . 0.8 0.9 0.9 1.0 1.0 1.0 0.7Electricity . . . . . . . . . . . . . . . . . . . . . . . . 13.5 16.3 18.3 20.6 23.0 25.4 2.3Renewables. . . . . . . . . . . . . . . . . . . . . . 0.1 0.1 0.1 0.1 0.1 0.1 0.1
Total . . . . . . . . . . . . . . . . . . . . . . . . . . 26.5 30.4 32.7 35.3 37.8 40.4 1.5IndustrialLiquids . . . . . . . . . . . . . . . . . . . . . . . . . . 57.0 51.7 53.3 56.8 61.0 64.9 0.5Natural gas . . . . . . . . . . . . . . . . . . . . . . 43.2 54.3 59.0 61.1 61.4 63.8 1.4Coal . . . . . . . . . . . . . . . . . . . . . . . . . . . . 43.1 43.1 48.2 52.1 55.5 58.0 1.1Electricity . . . . . . . . . . . . . . . . . . . . . . . . 27.6 31.1 36.3 41.6 47.3 53.3 2.4Renewables. . . . . . . . . . . . . . . . . . . . . . 13.4 14.1 15.7 17.6 19.5 21.9 1.8
Total . . . . . . . . . . . . . . . . . . . . . . . . . . 184.4 194.3 212.5 229.3 244.7 261.8 1.3TransportationLiquids . . . . . . . . . . . . . . . . . . . . . . . . . . 93.4 104.1 110.0 117.9 126.7 135.9 1.3Natural gas . . . . . . . . . . . . . . . . . . . . . . 3.5 3.7 4.0 4.3 4.6 4.9 1.3Coal . . . . . . . . . . . . . . . . . . . . . . . . . . . . 0.1 0.2 0.1 0.0 0.0 0.0 —Electricity . . . . . . . . . . . . . . . . . . . . . . . . 0.9 1.0 1.1 1.1 1.2 1.3 1.1Total . . . . . . . . . . . . . . . . . . . . . . . . . . 97.9 109.0 115.1 123.4 132.5 142.1 1.3
All End-Use SectorsLiquids . . . . . . . . . . . . . . . . . . . . . . . . . . 164.4 170.0 177.1 188.7 201.8 214.9 1.0Natural gas . . . . . . . . . . . . . . . . . . . . . . 74.8 90.0 96.4 99.7 100.7 104.3 1.2Coal . . . . . . . . . . . . . . . . . . . . . . . . . . . . 47.9 48.0 53.1 57.0 60.3 62.7 1.0Electricity . . . . . . . . . . . . . . . . . . . . . . . . 57.8 67.6 77.3 87.6 98.1 109.0 2.3Renewables. . . . . . . . . . . . . . . . . . . . . . 13.9 14.6 16.3 18.1 20.1 22.4 1.7
Delivered Energy . . . . . . . . . . . . . . . . 359.0 390.2 420.3 451.2 481.0 513.3 1.3Electricity-Related Losses . . . . . . . . . . . 136.2 153.3 170.2 187.5 205.6 225.4 1.8
Total . . . . . . . . . . . . . . . . . . . . . . . . . . 495.2 543.5 590.5 638.7 686.5 738.7 1.4Electric Powera
Liquids . . . . . . . . . . . . . . . . . . . . . . . . . . 10.2 9.3 8.9 8.5 8.3 8.7 -0.6Natural gas . . . . . . . . . . . . . . . . . . . . . . 37.3 39.1 44.8 50.5 55.1 57.8 1.6Coal . . . . . . . . . . . . . . . . . . . . . . . . . . . . 84.5 91.1 99.3 110.7 125.4 143.6 1.9Nuclear . . . . . . . . . . . . . . . . . . . . . . . . . 27.1 32.2 37.4 41.1 43.9 47.1 2.0Renewables. . . . . . . . . . . . . . . . . . . . . . 34.8 49.0 57.0 64.2 71.0 77.3 2.9
Total . . . . . . . . . . . . . . . . . . . . . . . . . . 194.1 220.8 247.5 275.1 303.7 334.5 2.0Total Energy ConsumptionLiquids . . . . . . . . . . . . . . . . . . . . . . . . . . 174.7 179.3 186.0 197.2 210.0 223.6 0.9Natural gas . . . . . . . . . . . . . . . . . . . . . . 112.1 129.1 141.2 150.2 155.8 162.0 1.3Coal . . . . . . . . . . . . . . . . . . . . . . . . . . . . 132.4 139.1 152.4 167.8 185.6 206.3 1.6Nuclear . . . . . . . . . . . . . . . . . . . . . . . . . 27.1 32.2 37.4 41.1 43.9 47.1 2.0Renewables. . . . . . . . . . . . . . . . . . . . . . 48.8 63.8 73.4 82.4 91.2 99.8 2.6
Total . . . . . . . . . . . . . . . . . . . . . . . . . . 495.2 543.5 590.5 638.7 686.5 738.7 1.4aFuel inputs used in the production of electricity and heat at central-station generators.Sources: 2007: Derived from U.S. Energy Information Administration (EIA), International Energy Statistics database (as of November 2009), web
site www.eia.gov/emeu/international; and International Energy Agency, “Balances of OECD and Non-OECD Statistics” (2009), web site www.iea.org(subscription site). Projections: EIA, Annual Energy Outlook 2010, DOE/EIA-0383(2010) (Washington, DC, April 2010), AEO2010 National EnergyModeling System, run AEO2010R.D111809A, web site www.eia.gov/oiaf/aeo; and World Energy Projection System Plus (2010).
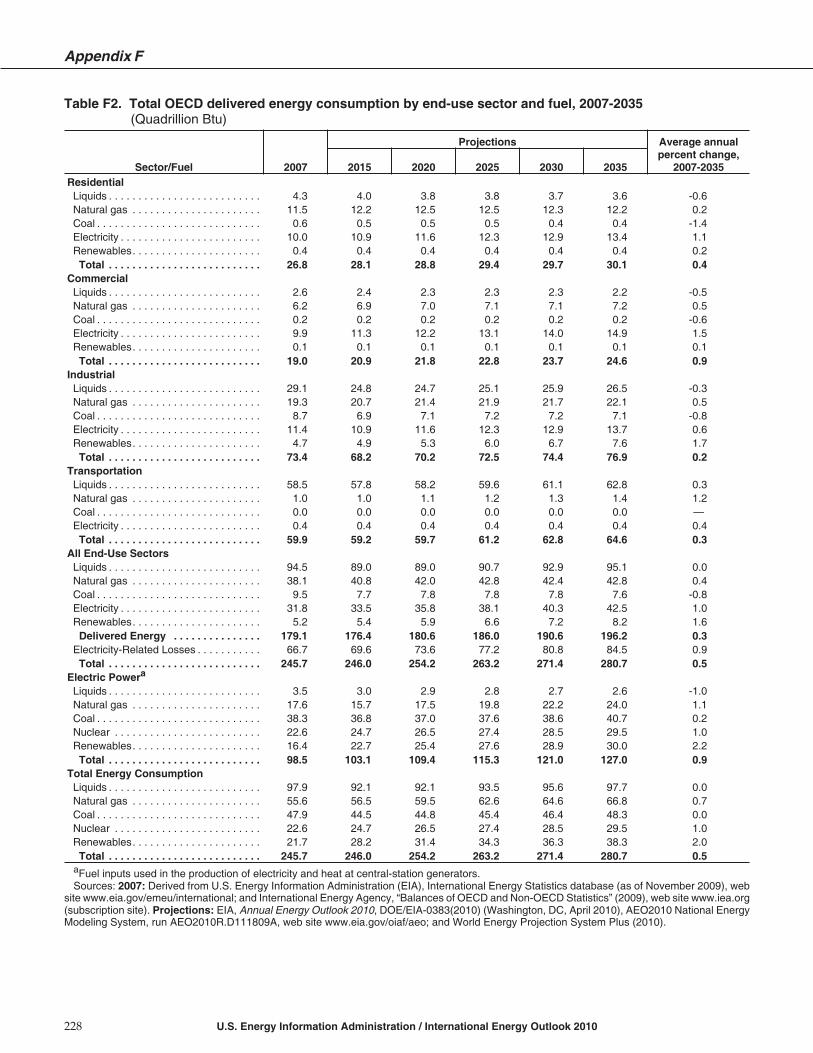
Table F2. Total OECD delivered energy consumption by end-use sector and fuel, 2007-2035(Quadrillion Btu)
Appendix F
228 U.S. Energy Information Administration / International Energy Outlook 2010
Sector/Fuel 2007
Projections Average annualpercent change,
2007-20352015 2020 2025 2030 2035ResidentialLiquids . . . . . . . . . . . . . . . . . . . . . . . . . . 4.3 4.0 3.8 3.8 3.7 3.6 -0.6Natural gas . . . . . . . . . . . . . . . . . . . . . . 11.5 12.2 12.5 12.5 12.3 12.2 0.2Coal . . . . . . . . . . . . . . . . . . . . . . . . . . . . 0.6 0.5 0.5 0.5 0.4 0.4 -1.4Electricity . . . . . . . . . . . . . . . . . . . . . . . . 10.0 10.9 11.6 12.3 12.9 13.4 1.1Renewables. . . . . . . . . . . . . . . . . . . . . . 0.4 0.4 0.4 0.4 0.4 0.4 0.2
Total . . . . . . . . . . . . . . . . . . . . . . . . . . 26.8 28.1 28.8 29.4 29.7 30.1 0.4CommercialLiquids . . . . . . . . . . . . . . . . . . . . . . . . . . 2.6 2.4 2.3 2.3 2.3 2.2 -0.5Natural gas . . . . . . . . . . . . . . . . . . . . . . 6.2 6.9 7.0 7.1 7.1 7.2 0.5Coal . . . . . . . . . . . . . . . . . . . . . . . . . . . . 0.2 0.2 0.2 0.2 0.2 0.2 -0.6Electricity . . . . . . . . . . . . . . . . . . . . . . . . 9.9 11.3 12.2 13.1 14.0 14.9 1.5Renewables. . . . . . . . . . . . . . . . . . . . . . 0.1 0.1 0.1 0.1 0.1 0.1 0.1
Total . . . . . . . . . . . . . . . . . . . . . . . . . . 19.0 20.9 21.8 22.8 23.7 24.6 0.9IndustrialLiquids . . . . . . . . . . . . . . . . . . . . . . . . . . 29.1 24.8 24.7 25.1 25.9 26.5 -0.3Natural gas . . . . . . . . . . . . . . . . . . . . . . 19.3 20.7 21.4 21.9 21.7 22.1 0.5Coal . . . . . . . . . . . . . . . . . . . . . . . . . . . . 8.7 6.9 7.1 7.2 7.2 7.1 -0.8Electricity . . . . . . . . . . . . . . . . . . . . . . . . 11.4 10.9 11.6 12.3 12.9 13.7 0.6Renewables. . . . . . . . . . . . . . . . . . . . . . 4.7 4.9 5.3 6.0 6.7 7.6 1.7
Total . . . . . . . . . . . . . . . . . . . . . . . . . . 73.4 68.2 70.2 72.5 74.4 76.9 0.2TransportationLiquids . . . . . . . . . . . . . . . . . . . . . . . . . . 58.5 57.8 58.2 59.6 61.1 62.8 0.3Natural gas . . . . . . . . . . . . . . . . . . . . . . 1.0 1.0 1.1 1.2 1.3 1.4 1.2Coal . . . . . . . . . . . . . . . . . . . . . . . . . . . . 0.0 0.0 0.0 0.0 0.0 0.0 —Electricity . . . . . . . . . . . . . . . . . . . . . . . . 0.4 0.4 0.4 0.4 0.4 0.4 0.4Total . . . . . . . . . . . . . . . . . . . . . . . . . . 59.9 59.2 59.7 61.2 62.8 64.6 0.3
All End-Use SectorsLiquids . . . . . . . . . . . . . . . . . . . . . . . . . . 94.5 89.0 89.0 90.7 92.9 95.1 0.0Natural gas . . . . . . . . . . . . . . . . . . . . . . 38.1 40.8 42.0 42.8 42.4 42.8 0.4Coal . . . . . . . . . . . . . . . . . . . . . . . . . . . . 9.5 7.7 7.8 7.8 7.8 7.6 -0.8Electricity . . . . . . . . . . . . . . . . . . . . . . . . 31.8 33.5 35.8 38.1 40.3 42.5 1.0Renewables. . . . . . . . . . . . . . . . . . . . . . 5.2 5.4 5.9 6.6 7.2 8.2 1.6
Delivered Energy . . . . . . . . . . . . . . . 179.1 176.4 180.6 186.0 190.6 196.2 0.3Electricity-Related Losses . . . . . . . . . . . 66.7 69.6 73.6 77.2 80.8 84.5 0.9
Total . . . . . . . . . . . . . . . . . . . . . . . . . . 245.7 246.0 254.2 263.2 271.4 280.7 0.5Electric Powera
Liquids . . . . . . . . . . . . . . . . . . . . . . . . . . 3.5 3.0 2.9 2.8 2.7 2.6 -1.0Natural gas . . . . . . . . . . . . . . . . . . . . . . 17.6 15.7 17.5 19.8 22.2 24.0 1.1Coal . . . . . . . . . . . . . . . . . . . . . . . . . . . . 38.3 36.8 37.0 37.6 38.6 40.7 0.2Nuclear . . . . . . . . . . . . . . . . . . . . . . . . . 22.6 24.7 26.5 27.4 28.5 29.5 1.0Renewables. . . . . . . . . . . . . . . . . . . . . . 16.4 22.7 25.4 27.6 28.9 30.0 2.2
Total . . . . . . . . . . . . . . . . . . . . . . . . . . 98.5 103.1 109.4 115.3 121.0 127.0 0.9Total Energy ConsumptionLiquids . . . . . . . . . . . . . . . . . . . . . . . . . . 97.9 92.1 92.1 93.5 95.6 97.7 0.0Natural gas . . . . . . . . . . . . . . . . . . . . . . 55.6 56.5 59.5 62.6 64.6 66.8 0.7Coal . . . . . . . . . . . . . . . . . . . . . . . . . . . . 47.9 44.5 44.8 45.4 46.4 48.3 0.0Nuclear . . . . . . . . . . . . . . . . . . . . . . . . . 22.6 24.7 26.5 27.4 28.5 29.5 1.0Renewables. . . . . . . . . . . . . . . . . . . . . . 21.7 28.2 31.4 34.3 36.3 38.3 2.0
Total . . . . . . . . . . . . . . . . . . . . . . . . . . 245.7 246.0 254.2 263.2 271.4 280.7 0.5aFuel inputs used in the production of electricity and heat at central-station generators.Sources: 2007: Derived from U.S. Energy Information Administration (EIA), International Energy Statistics database (as of November 2009), web
site www.eia.gov/emeu/international; and International Energy Agency, “Balances of OECD and Non-OECD Statistics” (2009), web site www.iea.org(subscription site). Projections: EIA, Annual Energy Outlook 2010, DOE/EIA-0383(2010) (Washington, DC, April 2010), AEO2010 National EnergyModeling System, run AEO2010R.D111809A, web site www.eia.gov/oiaf/aeo; and World Energy Projection System Plus (2010).

Table F3. Delivered energy consumption in the United States by end-use sector and fuel, 2007-2035(Quadrillion Btu)
Reference Case projections by end-use sector and country grouping
U.S. Energy Information Administration / International Energy Outlook 2010 229
Sector/Fuel 2007
Projections Average annualpercent change,
2007-20352015 2020 2025 2030 2035ResidentialLiquids . . . . . . . . . . . . . . . . . . . . . . . . . . 1.3 1.0 1.0 0.9 0.9 0.8 -1.4Natural gas . . . . . . . . . . . . . . . . . . . . . . 4.8 4.8 5.0 5.0 5.0 5.0 0.1Coal . . . . . . . . . . . . . . . . . . . . . . . . . . . . 0.0 0.0 0.0 0.0 0.0 0.0 -1.1Electricity . . . . . . . . . . . . . . . . . . . . . . . . 4.8 4.8 5.0 5.3 5.6 5.8 0.7Renewables. . . . . . . . . . . . . . . . . . . . . . 0.4 0.4 0.4 0.4 0.4 0.4 0.2
Total . . . . . . . . . . . . . . . . . . . . . . . . . . 11.3 11.1 11.4 11.7 11.9 12.1 0.3CommercialLiquids . . . . . . . . . . . . . . . . . . . . . . . . . . 0.6 0.6 0.5 0.5 0.5 0.5 -0.6Natural gas . . . . . . . . . . . . . . . . . . . . . . 3.1 3.3 3.4 3.6 3.7 3.8 0.7Coal . . . . . . . . . . . . . . . . . . . . . . . . . . . . 0.1 0.1 0.1 0.1 0.1 0.1 0.2Electricity . . . . . . . . . . . . . . . . . . . . . . . . 4.6 5.0 5.4 5.8 6.2 6.6 1.3Renewables. . . . . . . . . . . . . . . . . . . . . . 0.1 0.1 0.1 0.1 0.1 0.1 0.1
Total . . . . . . . . . . . . . . . . . . . . . . . . . . 8.4 9.0 9.5 10.0 10.5 11.0 1.0IndustrialLiquids . . . . . . . . . . . . . . . . . . . . . . . . . . 9.8 9.0 9.0 8.9 8.8 8.7 -0.4Natural gas . . . . . . . . . . . . . . . . . . . . . . 8.0 8.2 8.4 8.4 8.2 8.2 0.1Coal . . . . . . . . . . . . . . . . . . . . . . . . . . . . 1.8 1.8 1.9 1.9 2.0 2.0 0.2Electricity . . . . . . . . . . . . . . . . . . . . . . . . 3.5 3.4 3.5 3.5 3.5 3.5 0.0Renewables. . . . . . . . . . . . . . . . . . . . . . 2.0 2.4 2.7 3.2 3.7 4.4 2.8
Total . . . . . . . . . . . . . . . . . . . . . . . . . . 25.2 24.8 25.4 25.9 26.1 26.7 0.2TransportationLiquids . . . . . . . . . . . . . . . . . . . . . . . . . . 28.3 27.7 28.4 29.3 30.4 31.5 0.4Natural gas . . . . . . . . . . . . . . . . . . . . . . 0.7 0.7 0.7 0.8 0.9 0.9 1.2Coal . . . . . . . . . . . . . . . . . . . . . . . . . . . . 0.0 0.0 0.0 0.0 0.0 0.0 —Electricity . . . . . . . . . . . . . . . . . . . . . . . . 0.0 0.0 0.0 0.0 0.0 0.1 3.4Total . . . . . . . . . . . . . . . . . . . . . . . . . . 29.0 28.4 29.1 30.2 31.3 32.5 0.4
All End-Use SectorsLiquids . . . . . . . . . . . . . . . . . . . . . . . . . . 39.9 38.4 38.9 39.7 40.6 41.5 0.1Natural gas . . . . . . . . . . . . . . . . . . . . . . 16.6 17.0 17.5 17.8 17.8 17.9 0.3Coal . . . . . . . . . . . . . . . . . . . . . . . . . . . . 1.9 1.8 1.9 2.0 2.0 2.0 0.2Electricity . . . . . . . . . . . . . . . . . . . . . . . . 12.8 13.2 13.9 14.6 15.3 15.9 0.8Renewables. . . . . . . . . . . . . . . . . . . . . . 2.5 2.9 3.2 3.8 4.2 4.9 2.4
Delivered Energy . . . . . . . . . . . . . . . 73.8 73.3 75.5 77.8 79.9 82.3 0.4Electricity-Related Losses . . . . . . . . . . . 27.8 28.3 29.5 30.5 31.3 32.2 0.5
Total . . . . . . . . . . . . . . . . . . . . . . . . . . 101.7 101.6 105.0 108.3 111.2 114.5 0.4Electric Powera
Liquids . . . . . . . . . . . . . . . . . . . . . . . . . . 0.7 0.5 0.5 0.5 0.5 0.5 -1.1Natural gas . . . . . . . . . . . . . . . . . . . . . . 7.0 5.3 5.8 6.5 7.2 7.6 0.3Coal . . . . . . . . . . . . . . . . . . . . . . . . . . . . 20.8 20.5 21.1 21.6 22.2 23.1 0.4Nuclear . . . . . . . . . . . . . . . . . . . . . . . . . 8.5 8.8 9.3 9.3 9.3 9.4 0.4Renewables. . . . . . . . . . . . . . . . . . . . . . 3.6 6.3 6.8 7.1 7.2 7.3 2.6
Total . . . . . . . . . . . . . . . . . . . . . . . . . . 40.6 41.5 43.5 45.1 46.6 48.1 0.6Total Energy ConsumptionLiquids . . . . . . . . . . . . . . . . . . . . . . . . . . 40.6 38.8 39.4 40.1 41.1 42.0 0.1Natural gas . . . . . . . . . . . . . . . . . . . . . . 23.7 22.4 23.3 24.2 25.0 25.6 0.3Coal . . . . . . . . . . . . . . . . . . . . . . . . . . . . 22.7 22.3 23.0 23.6 24.3 25.1 0.4Nuclear . . . . . . . . . . . . . . . . . . . . . . . . . 8.5 8.8 9.3 9.3 9.3 9.4 0.4Renewables. . . . . . . . . . . . . . . . . . . . . . 6.2 9.3 10.1 11.0 11.5 12.4 2.5Total . . . . . . . . . . . . . . . . . . . . . . . . . . 101.7 101.6 105.0 108.3 111.2 114.5 0.4
aFuel inputs used in the production of electricity and heat at central-station generators.Sources: 2007: Based on U.S. Energy Information Administration (EIA), Annual Energy Review 2008, DOE/EIA-0384(2008) (Washington, DC,
June 2009). Projections: EIA, Annual Energy Outlook 2010, DOE/EIA-0383(2010) (Washington, DC, April 2010), AEO2010 National EnergyModeling System, run AEO2010R.D111809A, web site www.eia.gov/oiaf/aeo.

Table F4. Delivered energy consumption in Canada by end-use sector and fuel, 2007-2035(Quadrillion Btu)
Appendix F
230 U.S. Energy Information Administration / International Energy Outlook 2010
Sector/Fuel 2007
Projections Average annualpercent change,
2007-20352015 2020 2025 2030 2035ResidentialLiquids . . . . . . . . . . . . . . . . . . . . . . . . . . 0.1 0.1 0.1 0.1 0.1 0.1 -0.1Natural gas . . . . . . . . . . . . . . . . . . . . . . 0.5 0.6 0.6 0.6 0.6 0.6 0.5Coal . . . . . . . . . . . . . . . . . . . . . . . . . . . . 0.0 0.0 0.0 0.0 0.0 0.0 -1.3Electricity . . . . . . . . . . . . . . . . . . . . . . . . 0.6 0.6 0.7 0.7 0.8 0.8 1.4Renewables. . . . . . . . . . . . . . . . . . . . . . 0.0 0.0 0.0 0.0 0.0 0.0 —
Total . . . . . . . . . . . . . . . . . . . . . . . . . . 1.2 1.3 1.3 1.4 1.5 1.5 0.9CommercialLiquids . . . . . . . . . . . . . . . . . . . . . . . . . . 0.4 0.4 0.3 0.3 0.4 0.4 0.1Natural gas . . . . . . . . . . . . . . . . . . . . . . 0.4 0.4 0.5 0.5 0.5 0.5 1.3Coal . . . . . . . . . . . . . . . . . . . . . . . . . . . . 0.0 0.0 0.0 0.0 0.0 0.0 —Electricity . . . . . . . . . . . . . . . . . . . . . . . . 0.5 0.6 0.7 0.7 0.8 0.9 2.3Renewables. . . . . . . . . . . . . . . . . . . . . . 0.0 0.0 0.0 0.0 0.0 0.0 —
Total . . . . . . . . . . . . . . . . . . . . . . . . . . 1.2 1.4 1.5 1.6 1.7 1.8 1.4IndustrialLiquids . . . . . . . . . . . . . . . . . . . . . . . . . . 1.7 1.4 1.3 1.4 1.4 1.5 -0.3Natural gas . . . . . . . . . . . . . . . . . . . . . . 1.6 1.9 2.0 2.2 2.3 2.5 1.5Coal . . . . . . . . . . . . . . . . . . . . . . . . . . . . 0.1 0.1 0.1 0.1 0.1 0.1 -0.5Electricity . . . . . . . . . . . . . . . . . . . . . . . . 0.8 0.7 0.8 0.8 0.9 0.9 0.7Renewables. . . . . . . . . . . . . . . . . . . . . . 0.5 0.5 0.5 0.5 0.5 0.5 0.3
Total . . . . . . . . . . . . . . . . . . . . . . . . . . 4.7 4.5 4.7 5.0 5.3 5.6 0.6TransportationLiquids . . . . . . . . . . . . . . . . . . . . . . . . . . 2.3 2.5 2.5 2.5 2.6 2.7 0.5Natural gas . . . . . . . . . . . . . . . . . . . . . . 0.1 0.1 0.1 0.1 0.2 0.2 0.2Coal . . . . . . . . . . . . . . . . . . . . . . . . . . . . 0.0 0.0 0.0 0.0 0.0 0.0 —Electricity . . . . . . . . . . . . . . . . . . . . . . . . 0.0 0.0 0.0 0.0 0.0 0.0 -1.9Total . . . . . . . . . . . . . . . . . . . . . . . . . . 2.5 2.6 2.6 2.7 2.8 2.9 0.5
All End-Use SectorsLiquids . . . . . . . . . . . . . . . . . . . . . . . . . . 4.5 4.3 4.2 4.3 4.5 4.7 0.2Natural gas . . . . . . . . . . . . . . . . . . . . . . 2.7 3.0 3.2 3.4 3.6 3.7 1.2Coal . . . . . . . . . . . . . . . . . . . . . . . . . . . . 0.1 0.1 0.1 0.1 0.1 0.1 -0.5Electricity . . . . . . . . . . . . . . . . . . . . . . . . 1.8 1.9 2.1 2.3 2.5 2.7 1.4Renewables. . . . . . . . . . . . . . . . . . . . . . 0.5 0.5 0.5 0.5 0.5 0.5 0.3
Delivered Energy . . . . . . . . . . . . . . . 9.6 9.8 10.1 10.6 11.2 11.7 0.7Electricity-Related Losses . . . . . . . . . . . 4.8 4.8 5.2 5.6 6.0 6.5 1.1Total . . . . . . . . . . . . . . . . . . . . . . . . . . 14.3 14.6 15.4 16.3 17.2 18.2 0.9
Electric Powera
Liquids . . . . . . . . . . . . . . . . . . . . . . . . . . 0.2 0.2 0.2 0.2 0.2 0.2 -1.0Natural gas . . . . . . . . . . . . . . . . . . . . . . 0.3 0.3 0.3 0.4 0.5 0.6 2.7Coal . . . . . . . . . . . . . . . . . . . . . . . . . . . . 1.4 0.9 0.9 0.9 1.0 1.1 -0.8Nuclear . . . . . . . . . . . . . . . . . . . . . . . . . 1.0 1.3 1.4 1.5 1.6 1.7 1.9Renewables. . . . . . . . . . . . . . . . . . . . . . 3.7 4.1 4.6 4.9 5.3 5.6 1.5
Total . . . . . . . . . . . . . . . . . . . . . . . . . . 6.6 6.7 7.3 7.9 8.5 9.2 1.2Total Energy ConsumptionLiquids . . . . . . . . . . . . . . . . . . . . . . . . . . 4.7 4.5 4.4 4.5 4.7 4.8 0.1Natural gas . . . . . . . . . . . . . . . . . . . . . . 3.0 3.3 3.5 3.8 4.1 4.4 1.4Coal . . . . . . . . . . . . . . . . . . . . . . . . . . . . 1.5 1.1 1.0 1.1 1.1 1.2 -0.8Nuclear . . . . . . . . . . . . . . . . . . . . . . . . . 1.0 1.3 1.4 1.5 1.6 1.7 1.9Renewables. . . . . . . . . . . . . . . . . . . . . . 4.2 4.5 5.0 5.4 5.8 6.1 1.4
Total . . . . . . . . . . . . . . . . . . . . . . . . . . 14.3 14.6 15.4 16.3 17.2 18.2 0.9aFuel inputs used in the production of electricity and heat at central-station generators.Sources: 2007: Derived from U.S. Energy Information Administration (EIA), International Energy Statistics database (as of November 2009), web
site www.eia.gov/emeu/international; and International Energy Agency, “Balances of OECD and Non-OECD Statistics” (2009), web site www.iea.org(subscription site). Projections: EIA, World Energy Projection System Plus (2010).

Table F5. Delivered energy consumption in Mexico by end-use sector and fuel, 2007-2035(Quadrillion Btu)
Reference Case projections by end-use sector and country grouping
U.S. Energy Information Administration / International Energy Outlook 2010 231
Sector/Fuel 2007
Projections Average annualpercent change,
2007-20352015 2020 2025 2030 2035ResidentialLiquids . . . . . . . . . . . . . . . . . . . . . . . . . . 0.3 0.3 0.4 0.4 0.4 0.4 1.3Natural gas . . . . . . . . . . . . . . . . . . . . . . 0.0 0.0 0.1 0.1 0.1 0.1 2.9Coal . . . . . . . . . . . . . . . . . . . . . . . . . . . . 0.0 0.0 0.0 0.0 0.0 0.0 —Electricity . . . . . . . . . . . . . . . . . . . . . . . . 0.2 0.3 0.3 0.4 0.4 0.5 3.8Renewables. . . . . . . . . . . . . . . . . . . . . . 0.0 0.0 0.0 0.0 0.0 0.0 —
Total . . . . . . . . . . . . . . . . . . . . . . . . . . 0.5 0.7 0.7 0.8 0.9 1.0 2.5CommercialLiquids . . . . . . . . . . . . . . . . . . . . . . . . . . 0.1 0.1 0.1 0.1 0.1 0.1 1.6Natural gas . . . . . . . . . . . . . . . . . . . . . . 0.0 0.0 0.0 0.0 0.0 0.0 2.3Coal . . . . . . . . . . . . . . . . . . . . . . . . . . . . 0.0 0.0 0.0 0.0 0.0 0.0 —Electricity . . . . . . . . . . . . . . . . . . . . . . . . 0.1 0.1 0.2 0.2 0.3 0.3 5.1Renewables. . . . . . . . . . . . . . . . . . . . . . 0.0 0.0 0.0 0.0 0.0 0.0 —
Total . . . . . . . . . . . . . . . . . . . . . . . . . . 0.2 0.2 0.3 0.3 0.4 0.4 3.8IndustrialLiquids . . . . . . . . . . . . . . . . . . . . . . . . . . 0.9 0.9 0.9 1.0 1.1 1.3 1.1Natural gas . . . . . . . . . . . . . . . . . . . . . . 1.5 1.4 1.7 2.0 2.3 2.6 2.0Coal . . . . . . . . . . . . . . . . . . . . . . . . . . . . 0.0 0.0 0.0 0.0 0.0 0.0 1.7Electricity . . . . . . . . . . . . . . . . . . . . . . . . 0.4 0.4 0.5 0.6 0.7 0.9 2.7Renewables. . . . . . . . . . . . . . . . . . . . . . 0.1 0.1 0.1 0.1 0.2 0.2 2.3
Total . . . . . . . . . . . . . . . . . . . . . . . . . . 3.0 2.9 3.2 3.8 4.3 5.0 1.9TransportationLiquids . . . . . . . . . . . . . . . . . . . . . . . . . . 2.1 2.2 2.4 2.7 3.0 3.3 1.6Natural gas . . . . . . . . . . . . . . . . . . . . . . 0.1 0.1 0.1 0.1 0.1 0.1 3.3Coal . . . . . . . . . . . . . . . . . . . . . . . . . . . . 0.0 0.0 0.0 0.0 0.0 0.0 —Electricity . . . . . . . . . . . . . . . . . . . . . . . . 0.0 0.0 0.0 0.0 0.0 0.0 2.4Total . . . . . . . . . . . . . . . . . . . . . . . . . . 2.2 2.2 2.5 2.8 3.1 3.4 1.6
All End-Use SectorsLiquids . . . . . . . . . . . . . . . . . . . . . . . . . . 3.5 3.5 3.8 4.1 4.6 5.1 1.4Natural gas . . . . . . . . . . . . . . . . . . . . . . 1.6 1.5 1.8 2.2 2.5 2.9 2.1Coal . . . . . . . . . . . . . . . . . . . . . . . . . . . . 0.0 0.0 0.0 0.0 0.0 0.0 1.7Electricity . . . . . . . . . . . . . . . . . . . . . . . . 0.7 0.8 1.0 1.2 1.5 1.7 3.4Renewables. . . . . . . . . . . . . . . . . . . . . . 0.1 0.1 0.1 0.1 0.2 0.2 2.3
Delivered Energy . . . . . . . . . . . . . . . 5.9 6.0 6.7 7.7 8.7 9.9 1.9Electricity-Related Losses . . . . . . . . . . . 1.8 2.1 2.3 2.7 3.1 3.6 2.4Total . . . . . . . . . . . . . . . . . . . . . . . . . . 7.7 8.1 9.0 10.4 11.8 13.5 2.0
Electric Powera
Liquids . . . . . . . . . . . . . . . . . . . . . . . . . . 0.7 0.6 0.6 0.6 0.5 0.5 -0.9Natural gas . . . . . . . . . . . . . . . . . . . . . . 0.9 1.1 1.5 2.0 2.5 3.0 4.2Coal . . . . . . . . . . . . . . . . . . . . . . . . . . . . 0.4 0.3 0.3 0.4 0.4 0.6 1.7Nuclear . . . . . . . . . . . . . . . . . . . . . . . . . 0.1 0.1 0.1 0.1 0.2 0.2 2.3Renewables. . . . . . . . . . . . . . . . . . . . . . 0.4 0.7 0.7 0.9 1.0 1.1 3.2
Total . . . . . . . . . . . . . . . . . . . . . . . . . . 2.5 2.9 3.3 3.9 4.5 5.3 2.7Total Energy ConsumptionLiquids . . . . . . . . . . . . . . . . . . . . . . . . . . 4.1 4.2 4.4 4.7 5.1 5.6 1.1Natural gas . . . . . . . . . . . . . . . . . . . . . . 2.5 2.7 3.3 4.2 4.9 5.8 3.0Coal . . . . . . . . . . . . . . . . . . . . . . . . . . . . 0.4 0.4 0.4 0.4 0.4 0.6 1.7Nuclear . . . . . . . . . . . . . . . . . . . . . . . . . 0.1 0.1 0.1 0.1 0.2 0.2 2.3Renewables. . . . . . . . . . . . . . . . . . . . . . 0.5 0.8 0.8 1.0 1.1 1.3 3.1
Total . . . . . . . . . . . . . . . . . . . . . . . . . . 7.7 8.1 9.0 10.4 11.8 13.5 2.0aFuel inputs used in the production of electricity and heat at central-station generators.Sources: 2007: Derived from U.S. Energy Information Administration (EIA), International Energy Statistics database (as of November 2009), web
site www.eia.gov/emeu/international; and International Energy Agency, “Balances of OECD and Non-OECD Statistics” (2009), web site www.iea.org(subscription site). Projections: EIA, World Energy Projection System Plus (2010).

Table F6. Delivered energy consumption in OECD Europe by end-use sector and fuel, 2007-2035(Quadrillion Btu)
Appendix F
232 U.S. Energy Information Administration / International Energy Outlook 2010
Sector/Fuel 2007
Projections Average annualpercent change,
2007-20352015 2020 2025 2030 2035ResidentialLiquids . . . . . . . . . . . . . . . . . . . . . . . . . . 1.9 1.9 1.8 1.7 1.7 1.6 -0.5Natural gas . . . . . . . . . . . . . . . . . . . . . . 5.2 5.7 5.8 5.7 5.5 5.4 0.1Coal . . . . . . . . . . . . . . . . . . . . . . . . . . . . 0.5 0.5 0.5 0.4 0.4 0.4 -1.3Electricity . . . . . . . . . . . . . . . . . . . . . . . . 3.0 3.6 3.9 4.1 4.2 4.4 1.3Renewables. . . . . . . . . . . . . . . . . . . . . . 0.0 0.0 0.0 0.0 0.0 0.0 —
Total . . . . . . . . . . . . . . . . . . . . . . . . . . 10.7 11.7 11.9 12.0 11.8 11.8 0.4CommercialLiquids . . . . . . . . . . . . . . . . . . . . . . . . . . 0.7 0.7 0.6 0.6 0.6 0.6 -0.8Natural gas . . . . . . . . . . . . . . . . . . . . . . 1.8 2.1 2.1 2.1 1.9 1.9 0.1Coal . . . . . . . . . . . . . . . . . . . . . . . . . . . . 0.1 0.1 0.1 0.1 0.1 0.1 -1.2Electricity . . . . . . . . . . . . . . . . . . . . . . . . 2.9 3.5 3.7 4.0 4.2 4.4 1.5Renewables. . . . . . . . . . . . . . . . . . . . . . 0.0 0.0 0.0 0.0 0.0 0.0 —
Total . . . . . . . . . . . . . . . . . . . . . . . . . . 5.5 6.3 6.5 6.7 6.8 6.9 0.8IndustrialLiquids . . . . . . . . . . . . . . . . . . . . . . . . . . 9.7 7.4 7.0 7.2 7.5 7.8 -0.8Natural gas . . . . . . . . . . . . . . . . . . . . . . 6.6 7.2 7.3 7.3 6.8 6.6 0.0Coal . . . . . . . . . . . . . . . . . . . . . . . . . . . . 3.6 2.5 2.4 2.4 2.4 2.3 -1.6Electricity . . . . . . . . . . . . . . . . . . . . . . . . 4.6 4.3 4.6 4.9 5.2 5.6 0.7Renewables. . . . . . . . . . . . . . . . . . . . . . 1.5 1.4 1.5 1.6 1.7 1.9 0.7
Total . . . . . . . . . . . . . . . . . . . . . . . . . . 26.1 22.7 22.9 23.4 23.7 24.1 -0.3TransportationLiquids . . . . . . . . . . . . . . . . . . . . . . . . . . 18.4 18.2 17.5 17.5 17.5 17.6 -0.2Natural gas . . . . . . . . . . . . . . . . . . . . . . 0.1 0.1 0.1 0.1 0.1 0.1 0.1Coal . . . . . . . . . . . . . . . . . . . . . . . . . . . . 0.0 0.0 0.0 0.0 0.0 0.0 —Electricity . . . . . . . . . . . . . . . . . . . . . . . . 0.3 0.3 0.3 0.3 0.3 0.3 0.1Total . . . . . . . . . . . . . . . . . . . . . . . . . . 18.8 18.6 17.9 17.8 17.9 17.9 -0.2
All End-Use SectorsLiquids . . . . . . . . . . . . . . . . . . . . . . . . . . 30.8 28.2 27.0 27.0 27.3 27.6 -0.4Natural gas . . . . . . . . . . . . . . . . . . . . . . 13.7 15.1 15.3 15.2 14.4 14.0 0.1Coal . . . . . . . . . . . . . . . . . . . . . . . . . . . . 4.2 3.1 3.0 2.9 2.8 2.7 -1.6Electricity . . . . . . . . . . . . . . . . . . . . . . . . 10.8 11.6 12.4 13.2 13.9 14.6 1.1Renewables. . . . . . . . . . . . . . . . . . . . . . 1.5 1.4 1.5 1.6 1.7 1.9 0.7
Delivered Energy . . . . . . . . . . . . . . . 61.0 59.3 59.1 59.9 60.2 60.8 0.0Electricity-Related Losses . . . . . . . . . . . 21.3 22.7 23.9 25.1 26.3 27.4 0.9
Total . . . . . . . . . . . . . . . . . . . . . . . . . . 82.3 82.0 83.0 85.0 86.5 88.2 0.2Electric Powera
Liquids . . . . . . . . . . . . . . . . . . . . . . . . . . 0.9 0.8 0.8 0.7 0.7 0.7 -1.0Natural gas . . . . . . . . . . . . . . . . . . . . . . 6.1 5.7 6.4 7.0 7.8 8.6 1.2Coal . . . . . . . . . . . . . . . . . . . . . . . . . . . . 9.0 8.5 8.2 8.0 7.9 8.3 -0.3Nuclear . . . . . . . . . . . . . . . . . . . . . . . . . 9.1 9.7 10.0 10.5 10.9 11.2 0.8Renewables. . . . . . . . . . . . . . . . . . . . . . 7.1 9.6 10.9 12.2 12.8 13.2 2.2Total . . . . . . . . . . . . . . . . . . . . . . . . . . 32.1 34.3 36.3 38.3 40.2 42.0 1.0
Total Energy ConsumptionLiquids . . . . . . . . . . . . . . . . . . . . . . . . . . 31.6 29.0 27.7 27.7 28.0 28.3 -0.4Natural gas . . . . . . . . . . . . . . . . . . . . . . 19.8 20.8 21.7 22.1 22.2 22.6 0.5Coal . . . . . . . . . . . . . . . . . . . . . . . . . . . . 13.2 11.5 11.2 10.9 10.8 11.0 -0.6Nuclear . . . . . . . . . . . . . . . . . . . . . . . . . 9.1 9.7 10.0 10.5 10.9 11.2 0.8Renewables. . . . . . . . . . . . . . . . . . . . . . 8.7 11.0 12.4 13.8 14.5 15.1 2.0Total . . . . . . . . . . . . . . . . . . . . . . . . . . 82.3 82.0 83.0 85.0 86.5 88.2 0.2
aFuel inputs used in the production of electricity and heat at central-station generators.Sources: 2007: Derived from U.S. Energy Information Administration (EIA), International Energy Statistics database (as of November 2009), web
site www.eia.gov/emeu/international; and International Energy Agency, “Balances of OECD and Non-OECD Statistics” (2009), web site www.iea.org(subscription site). Projections: EIA, World Energy Projection System Plus (2010).

Table F7. Delivered energy consumption in Japan by end-use sector and fuel, 2007-2035(Quadrillion Btu)
Reference Case projections by end-use sector and country grouping
U.S. Energy Information Administration / International Energy Outlook 2010 233
Sector/Fuel 2007
Projections Average annualpercent change,
2007-20352015 2020 2025 2030 2035ResidentialLiquids . . . . . . . . . . . . . . . . . . . . . . . . . . 0.6 0.5 0.5 0.5 0.5 0.5 -0.9Natural gas . . . . . . . . . . . . . . . . . . . . . . 0.4 0.4 0.4 0.4 0.4 0.4 0.0Coal . . . . . . . . . . . . . . . . . . . . . . . . . . . . 0.0 0.0 0.0 0.0 0.0 0.0 —Electricity . . . . . . . . . . . . . . . . . . . . . . . . 1.1 1.1 1.1 1.2 1.2 1.2 0.5Renewables. . . . . . . . . . . . . . . . . . . . . . 0.0 0.0 0.0 0.0 0.0 0.0 —
Total . . . . . . . . . . . . . . . . . . . . . . . . . . 2.1 2.1 2.1 2.1 2.1 2.1 0.0CommercialLiquids . . . . . . . . . . . . . . . . . . . . . . . . . . 0.6 0.5 0.5 0.5 0.5 0.5 -0.8Natural gas . . . . . . . . . . . . . . . . . . . . . . 0.7 0.8 0.8 0.8 0.7 0.7 -0.1Coal . . . . . . . . . . . . . . . . . . . . . . . . . . . . 0.0 0.0 0.0 0.0 0.0 0.0 -0.9Electricity . . . . . . . . . . . . . . . . . . . . . . . . 1.3 1.4 1.4 1.5 1.6 1.6 0.7Renewables. . . . . . . . . . . . . . . . . . . . . . 0.0 0.0 0.0 0.0 0.0 0.0 —
Total . . . . . . . . . . . . . . . . . . . . . . . . . . 2.7 2.7 2.8 2.8 2.8 2.8 0.2IndustrialLiquids . . . . . . . . . . . . . . . . . . . . . . . . . . 4.1 3.2 3.3 3.4 3.3 3.3 -0.8Natural gas . . . . . . . . . . . . . . . . . . . . . . 0.5 0.6 0.6 0.6 0.6 0.5 0.4Coal . . . . . . . . . . . . . . . . . . . . . . . . . . . . 2.1 1.6 1.6 1.5 1.4 1.4 -1.5Electricity . . . . . . . . . . . . . . . . . . . . . . . . 1.0 0.9 1.0 1.0 1.1 1.1 0.4Renewables. . . . . . . . . . . . . . . . . . . . . . 0.3 0.3 0.3 0.3 0.3 0.3 -0.1
Total . . . . . . . . . . . . . . . . . . . . . . . . . . 8.0 6.5 6.8 6.8 6.7 6.6 -0.7TransportationLiquids . . . . . . . . . . . . . . . . . . . . . . . . . . 4.0 3.5 3.6 3.6 3.5 3.3 -0.6Natural gas . . . . . . . . . . . . . . . . . . . . . . 0.0 0.0 0.0 0.0 0.0 0.0 —Coal . . . . . . . . . . . . . . . . . . . . . . . . . . . . 0.0 0.0 0.0 0.0 0.0 0.0 —Electricity . . . . . . . . . . . . . . . . . . . . . . . . 0.1 0.1 0.1 0.1 0.1 0.1 -0.2Total . . . . . . . . . . . . . . . . . . . . . . . . . . 4.0 3.6 3.7 3.6 3.5 3.4 -0.6
All End-Use SectorsLiquids . . . . . . . . . . . . . . . . . . . . . . . . . . 9.3 7.7 8.0 8.0 7.8 7.6 -0.7Natural gas . . . . . . . . . . . . . . . . . . . . . . 1.6 1.8 1.9 1.8 1.7 1.6 0.1Coal . . . . . . . . . . . . . . . . . . . . . . . . . . . . 2.1 1.6 1.6 1.5 1.5 1.4 -1.5Electricity . . . . . . . . . . . . . . . . . . . . . . . . 3.4 3.5 3.6 3.8 3.9 4.0 0.6Renewables. . . . . . . . . . . . . . . . . . . . . . 0.3 0.3 0.3 0.3 0.3 0.3 -0.1
Delivered Energy . . . . . . . . . . . . . . . 16.7 14.9 15.3 15.3 15.1 14.9 -0.4Electricity-Related Losses . . . . . . . . . . . 6.1 6.2 6.5 6.8 7.0 7.3 0.6Total . . . . . . . . . . . . . . . . . . . . . . . . . . 22.8 21.1 21.9 22.1 22.1 22.2 -0.1
Electric Powera
Liquids . . . . . . . . . . . . . . . . . . . . . . . . . . 0.8 0.8 0.7 0.7 0.6 0.6 -1.0Natural gas . . . . . . . . . . . . . . . . . . . . . . 2.3 2.2 2.2 2.5 2.6 2.6 0.4Coal . . . . . . . . . . . . . . . . . . . . . . . . . . . . 2.8 2.6 2.5 2.4 2.4 2.4 -0.5Nuclear . . . . . . . . . . . . . . . . . . . . . . . . . 2.5 3.2 3.5 3.7 4.0 4.3 1.9Renewables. . . . . . . . . . . . . . . . . . . . . . 1.0 1.0 1.3 1.3 1.3 1.4 1.1
Total . . . . . . . . . . . . . . . . . . . . . . . . . . 9.5 9.7 10.2 10.5 10.9 11.3 0.6Total Energy ConsumptionLiquids . . . . . . . . . . . . . . . . . . . . . . . . . . 10.1 8.4 8.7 8.6 8.4 8.2 -0.7Natural gas . . . . . . . . . . . . . . . . . . . . . . 3.9 4.0 4.1 4.2 4.2 4.2 0.2Coal . . . . . . . . . . . . . . . . . . . . . . . . . . . . 4.9 4.2 4.1 3.9 3.8 3.8 -0.9Nuclear . . . . . . . . . . . . . . . . . . . . . . . . . 2.5 3.2 3.5 3.7 4.0 4.3 1.9Renewables. . . . . . . . . . . . . . . . . . . . . . 1.3 1.3 1.5 1.6 1.6 1.7 0.8
Total . . . . . . . . . . . . . . . . . . . . . . . . . . 22.8 21.1 21.9 22.1 22.1 22.2 -0.1aFuel inputs used in the production of electricity and heat at central-station generators.Sources: 2007: Derived from U.S. Energy Information Administration (EIA), International Energy Statistics database (as of November 2009), web
site www.eia.gov/emeu/international; and International Energy Agency, “Balances of OECD and Non-OECD Statistics” (2009), web site www.iea.org(subscription site). Projections: EIA, World Energy Projection System Plus (2010).

Table F8. Delivered energy consumption in South Korea by end-use sector and fuel, 2007-2035(Quadrillion Btu)
Appendix F
234 U.S. Energy Information Administration / International Energy Outlook 2010
Sector/Fuel 2007
Projections Average annualpercent change,
2007-20352015 2020 2025 2030 2035ResidentialLiquids . . . . . . . . . . . . . . . . . . . . . . . . . . 0.1 0.1 0.1 0.1 0.1 0.1 -0.4Natural gas . . . . . . . . . . . . . . . . . . . . . . 0.4 0.5 0.5 0.5 0.5 0.5 0.5Coal . . . . . . . . . . . . . . . . . . . . . . . . . . . . 0.0 0.0 0.0 0.0 0.0 0.0 -2.2Electricity . . . . . . . . . . . . . . . . . . . . . . . . 0.2 0.2 0.3 0.3 0.3 0.3 2.1Renewables. . . . . . . . . . . . . . . . . . . . . . 0.0 0.0 0.0 0.0 0.0 0.0 —
Total . . . . . . . . . . . . . . . . . . . . . . . . . . 0.8 0.8 0.9 0.9 0.9 0.9 0.8CommercialLiquids . . . . . . . . . . . . . . . . . . . . . . . . . . 0.2 0.2 0.1 0.1 0.1 0.1 -0.2Natural gas . . . . . . . . . . . . . . . . . . . . . . 0.2 0.2 0.2 0.2 0.2 0.2 1.4Coal . . . . . . . . . . . . . . . . . . . . . . . . . . . . 0.0 0.0 0.0 0.0 0.0 0.0 —Electricity . . . . . . . . . . . . . . . . . . . . . . . . 0.4 0.5 0.6 0.7 0.7 0.8 2.4Renewables. . . . . . . . . . . . . . . . . . . . . . 0.0 0.0 0.0 0.0 0.0 0.0 —
Total . . . . . . . . . . . . . . . . . . . . . . . . . . 0.7 0.9 0.9 1.0 1.1 1.2 1.8IndustrialLiquids . . . . . . . . . . . . . . . . . . . . . . . . . . 2.4 2.4 2.6 2.8 3.1 3.3 1.3Natural gas . . . . . . . . . . . . . . . . . . . . . . 0.3 0.4 0.4 0.4 0.3 0.3 1.0Coal . . . . . . . . . . . . . . . . . . . . . . . . . . . . 0.8 0.7 0.8 0.9 0.9 0.9 0.7Electricity . . . . . . . . . . . . . . . . . . . . . . . . 0.7 0.7 0.9 1.0 1.1 1.2 1.9Renewables. . . . . . . . . . . . . . . . . . . . . . 0.1 0.1 0.1 0.1 0.1 0.1 1.7
Total . . . . . . . . . . . . . . . . . . . . . . . . . . 4.2 4.3 4.7 5.1 5.5 5.9 1.3TransportationLiquids . . . . . . . . . . . . . . . . . . . . . . . . . . 1.7 2.0 2.1 2.3 2.4 2.5 1.3Natural gas . . . . . . . . . . . . . . . . . . . . . . 0.0 0.0 0.0 0.0 0.0 0.0 1.0Coal . . . . . . . . . . . . . . . . . . . . . . . . . . . . 0.0 0.0 0.0 0.0 0.0 0.0 —Electricity . . . . . . . . . . . . . . . . . . . . . . . . 0.0 0.0 0.0 0.0 0.0 0.0 1.2Total . . . . . . . . . . . . . . . . . . . . . . . . . . 1.8 2.0 2.2 2.3 2.4 2.5 1.3
All End-Use SectorsLiquids . . . . . . . . . . . . . . . . . . . . . . . . . . 4.4 4.6 5.0 5.3 5.7 6.1 1.2Natural gas . . . . . . . . . . . . . . . . . . . . . . 0.8 1.0 1.1 1.1 1.1 1.1 0.9Coal . . . . . . . . . . . . . . . . . . . . . . . . . . . . 0.8 0.8 0.8 0.9 0.9 1.0 0.6Electricity . . . . . . . . . . . . . . . . . . . . . . . . 1.3 1.5 1.7 1.9 2.1 2.4 2.1Renewables. . . . . . . . . . . . . . . . . . . . . . 0.1 0.1 0.1 0.1 0.1 0.1 1.7
Delivered Energy . . . . . . . . . . . . . . . 7.4 8.0 8.6 9.3 9.9 10.6 1.3Electricity-Related Losses . . . . . . . . . . . 2.3 2.6 3.0 3.4 3.8 4.3 2.2Total . . . . . . . . . . . . . . . . . . . . . . . . . . 9.7 10.6 11.7 12.7 13.8 14.9 1.5
Electric Powera
Liquids . . . . . . . . . . . . . . . . . . . . . . . . . . 0.2 0.2 0.2 0.2 0.2 0.2 -1.0Natural gas . . . . . . . . . . . . . . . . . . . . . . 0.5 0.6 0.7 0.9 1.0 1.0 2.1Coal . . . . . . . . . . . . . . . . . . . . . . . . . . . . 1.5 1.4 1.5 1.8 2.1 2.7 2.0Nuclear . . . . . . . . . . . . . . . . . . . . . . . . . 1.3 1.8 2.2 2.4 2.6 2.7 2.5Renewables. . . . . . . . . . . . . . . . . . . . . . 0.0 0.1 0.1 0.1 0.1 0.2 4.6
Total . . . . . . . . . . . . . . . . . . . . . . . . . . 3.6 4.1 4.7 5.3 6.0 6.7 2.2Total Energy ConsumptionLiquids . . . . . . . . . . . . . . . . . . . . . . . . . . 4.6 4.8 5.1 5.5 5.9 6.2 1.1Natural gas . . . . . . . . . . . . . . . . . . . . . . 1.4 1.6 1.8 2.0 2.0 2.0 1.4Coal . . . . . . . . . . . . . . . . . . . . . . . . . . . . 2.3 2.2 2.3 2.7 3.1 3.6 1.6Nuclear . . . . . . . . . . . . . . . . . . . . . . . . . 1.3 1.8 2.2 2.4 2.6 2.7 2.5Renewables. . . . . . . . . . . . . . . . . . . . . . 0.1 0.2 0.2 0.2 0.3 0.3 3.1
Total . . . . . . . . . . . . . . . . . . . . . . . . . . 9.7 10.6 11.7 12.7 13.8 14.9 1.5aFuel inputs used in the production of electricity and heat at central-station generators.Sources: 2007: Derived from U.S. Energy Information Administration (EIA), International Energy Statistics database (as of November 2009), web
site www.eia.gov/emeu/international; and International Energy Agency, “Balances of OECD and Non-OECD Statistics” (2009), web site www.iea.org(subscription site). Projections: EIA, World Energy Projection System Plus (2010).

Table F9. Delivered energy consumption in Australia/New Zealand by end-use sector and fuel, 2007-2035(Quadrillion Btu)
Reference Case projections by end-use sector and country grouping
U.S. Energy Information Administration / International Energy Outlook 2010 235
Sector/Fuel 2007
Projections Average annualpercent change,
2007-20352015 2020 2025 2030 2035ResidentialLiquids . . . . . . . . . . . . . . . . . . . . . . . . . . 0.0 0.0 0.0 0.0 0.0 0.0 0.5Natural gas . . . . . . . . . . . . . . . . . . . . . . 0.1 0.2 0.2 0.2 0.2 0.2 1.6Coal . . . . . . . . . . . . . . . . . . . . . . . . . . . . 0.0 0.0 0.0 0.0 0.0 0.0 -0.9Electricity . . . . . . . . . . . . . . . . . . . . . . . . 0.3 0.3 0.3 0.3 0.3 0.4 1.1Renewables. . . . . . . . . . . . . . . . . . . . . . 0.0 0.0 0.0 0.0 0.0 0.0 —
Total . . . . . . . . . . . . . . . . . . . . . . . . . . 0.4 0.5 0.5 0.5 0.6 0.6 1.3CommercialLiquids . . . . . . . . . . . . . . . . . . . . . . . . . . 0.0 0.0 0.0 0.0 0.0 0.0 -0.1Natural gas . . . . . . . . . . . . . . . . . . . . . . 0.0 0.1 0.1 0.1 0.1 0.1 0.6Coal . . . . . . . . . . . . . . . . . . . . . . . . . . . . 0.0 0.0 0.0 0.0 0.0 0.0 -0.4Electricity . . . . . . . . . . . . . . . . . . . . . . . . 0.2 0.3 0.3 0.3 0.3 0.3 1.7Renewables. . . . . . . . . . . . . . . . . . . . . . 0.0 0.0 0.0 0.0 0.0 0.0 —
Total . . . . . . . . . . . . . . . . . . . . . . . . . . 0.3 0.3 0.4 0.4 0.4 0.4 1.3IndustrialLiquids . . . . . . . . . . . . . . . . . . . . . . . . . . 0.6 0.5 0.5 0.5 0.5 0.5 -0.3Natural gas . . . . . . . . . . . . . . . . . . . . . . 0.8 1.0 1.0 1.1 1.2 1.3 1.6Coal . . . . . . . . . . . . . . . . . . . . . . . . . . . . 0.3 0.3 0.3 0.3 0.4 0.4 1.1Electricity . . . . . . . . . . . . . . . . . . . . . . . . 0.4 0.4 0.5 0.5 0.5 0.5 0.6Renewables. . . . . . . . . . . . . . . . . . . . . . 0.2 0.2 0.2 0.2 0.2 0.2 0.9
Total . . . . . . . . . . . . . . . . . . . . . . . . . . 2.3 2.5 2.6 2.6 2.8 3.0 0.9TransportationLiquids . . . . . . . . . . . . . . . . . . . . . . . . . . 1.6 1.7 1.7 1.7 1.8 1.9 0.6Natural gas . . . . . . . . . . . . . . . . . . . . . . 0.0 0.0 0.0 0.0 0.1 0.1 4.6Coal . . . . . . . . . . . . . . . . . . . . . . . . . . . . 0.0 0.0 0.0 0.0 0.0 0.0 —Electricity . . . . . . . . . . . . . . . . . . . . . . . . 0.0 0.0 0.0 0.0 0.0 0.0 0.7Total . . . . . . . . . . . . . . . . . . . . . . . . . . 1.6 1.8 1.8 1.8 1.9 2.0 0.7
All End-Use SectorsLiquids . . . . . . . . . . . . . . . . . . . . . . . . . . 2.2 2.3 2.3 2.3 2.4 2.5 0.4Natural gas . . . . . . . . . . . . . . . . . . . . . . 1.0 1.3 1.3 1.4 1.5 1.6 1.6Coal . . . . . . . . . . . . . . . . . . . . . . . . . . . . 0.3 0.3 0.3 0.4 0.4 0.4 1.1Electricity . . . . . . . . . . . . . . . . . . . . . . . . 0.9 1.0 1.1 1.1 1.2 1.2 1.0Renewables. . . . . . . . . . . . . . . . . . . . . . 0.2 0.2 0.2 0.2 0.2 0.2 0.9
Delivered Energy . . . . . . . . . . . . . . . 4.6 5.1 5.2 5.4 5.6 5.9 0.9Electricity-Related Losses . . . . . . . . . . . 2.6 2.9 3.0 3.1 3.2 3.3 0.9Total . . . . . . . . . . . . . . . . . . . . . . . . . . 7.2 8.0 8.2 8.5 8.9 9.2 0.9
Electric Powera
Liquids . . . . . . . . . . . . . . . . . . . . . . . . . . 0.0 0.0 0.0 0.0 0.0 0.0 -1.0Natural gas . . . . . . . . . . . . . . . . . . . . . . 0.4 0.4 0.5 0.6 0.6 0.6 1.9Coal . . . . . . . . . . . . . . . . . . . . . . . . . . . . 2.6 2.5 2.5 2.5 2.6 2.6 0.0Nuclear . . . . . . . . . . . . . . . . . . . . . . . . . 0.0 0.0 0.0 0.0 0.0 0.0 —Renewables. . . . . . . . . . . . . . . . . . . . . . 0.5 1.0 1.1 1.2 1.2 1.3 3.4
Total . . . . . . . . . . . . . . . . . . . . . . . . . . 3.4 3.9 4.1 4.3 4.4 4.5 0.9Total Energy ConsumptionLiquids . . . . . . . . . . . . . . . . . . . . . . . . . . 2.2 2.3 2.3 2.3 2.4 2.5 0.4Natural gas . . . . . . . . . . . . . . . . . . . . . . 1.4 1.7 1.8 2.0 2.1 2.2 1.7Coal . . . . . . . . . . . . . . . . . . . . . . . . . . . . 2.9 2.8 2.8 2.9 2.9 3.0 0.2Nuclear . . . . . . . . . . . . . . . . . . . . . . . . . 0.0 0.0 0.0 0.0 0.0 0.0 —Renewables. . . . . . . . . . . . . . . . . . . . . . 0.7 1.2 1.3 1.4 1.5 1.5 2.8
Total . . . . . . . . . . . . . . . . . . . . . . . . . . 7.2 8.0 8.2 8.5 8.9 9.2 0.9aFuel inputs used in the production of electricity and heat at central-station generators.Sources: 2007: Derived from U.S. Energy Information Administration (EIA), International Energy Statistics database (as of November 2009), web
site www.eia.gov/emeu/international; and International Energy Agency, “Balances of OECD and Non-OECD Statistics” (2009), web site www.iea.org(subscription site). Projections: EIA, World Energy Projection System Plus (2010).
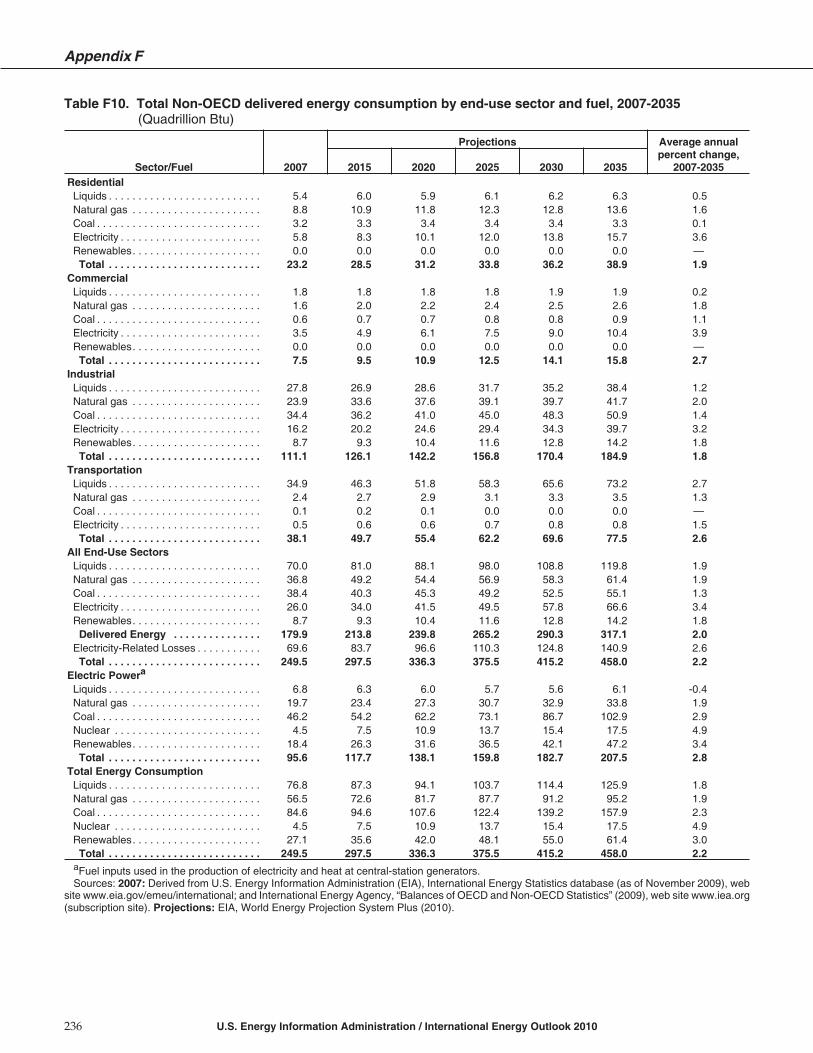
Table F10. Total Non-OECD delivered energy consumption by end-use sector and fuel, 2007-2035(Quadrillion Btu)
Appendix F
236 U.S. Energy Information Administration / International Energy Outlook 2010
Sector/Fuel 2007
Projections Average annualpercent change,
2007-20352015 2020 2025 2030 2035ResidentialLiquids . . . . . . . . . . . . . . . . . . . . . . . . . . 5.4 6.0 5.9 6.1 6.2 6.3 0.5Natural gas . . . . . . . . . . . . . . . . . . . . . . 8.8 10.9 11.8 12.3 12.8 13.6 1.6Coal . . . . . . . . . . . . . . . . . . . . . . . . . . . . 3.2 3.3 3.4 3.4 3.4 3.3 0.1Electricity . . . . . . . . . . . . . . . . . . . . . . . . 5.8 8.3 10.1 12.0 13.8 15.7 3.6Renewables. . . . . . . . . . . . . . . . . . . . . . 0.0 0.0 0.0 0.0 0.0 0.0 —
Total . . . . . . . . . . . . . . . . . . . . . . . . . . 23.2 28.5 31.2 33.8 36.2 38.9 1.9CommercialLiquids . . . . . . . . . . . . . . . . . . . . . . . . . . 1.8 1.8 1.8 1.8 1.9 1.9 0.2Natural gas . . . . . . . . . . . . . . . . . . . . . . 1.6 2.0 2.2 2.4 2.5 2.6 1.8Coal . . . . . . . . . . . . . . . . . . . . . . . . . . . . 0.6 0.7 0.7 0.8 0.8 0.9 1.1Electricity . . . . . . . . . . . . . . . . . . . . . . . . 3.5 4.9 6.1 7.5 9.0 10.4 3.9Renewables. . . . . . . . . . . . . . . . . . . . . . 0.0 0.0 0.0 0.0 0.0 0.0 —
Total . . . . . . . . . . . . . . . . . . . . . . . . . . 7.5 9.5 10.9 12.5 14.1 15.8 2.7IndustrialLiquids . . . . . . . . . . . . . . . . . . . . . . . . . . 27.8 26.9 28.6 31.7 35.2 38.4 1.2Natural gas . . . . . . . . . . . . . . . . . . . . . . 23.9 33.6 37.6 39.1 39.7 41.7 2.0Coal . . . . . . . . . . . . . . . . . . . . . . . . . . . . 34.4 36.2 41.0 45.0 48.3 50.9 1.4Electricity . . . . . . . . . . . . . . . . . . . . . . . . 16.2 20.2 24.6 29.4 34.3 39.7 3.2Renewables. . . . . . . . . . . . . . . . . . . . . . 8.7 9.3 10.4 11.6 12.8 14.2 1.8Total . . . . . . . . . . . . . . . . . . . . . . . . . . 111.1 126.1 142.2 156.8 170.4 184.9 1.8
TransportationLiquids . . . . . . . . . . . . . . . . . . . . . . . . . . 34.9 46.3 51.8 58.3 65.6 73.2 2.7Natural gas . . . . . . . . . . . . . . . . . . . . . . 2.4 2.7 2.9 3.1 3.3 3.5 1.3Coal . . . . . . . . . . . . . . . . . . . . . . . . . . . . 0.1 0.2 0.1 0.0 0.0 0.0 —Electricity . . . . . . . . . . . . . . . . . . . . . . . . 0.5 0.6 0.6 0.7 0.8 0.8 1.5Total . . . . . . . . . . . . . . . . . . . . . . . . . . 38.1 49.7 55.4 62.2 69.6 77.5 2.6
All End-Use SectorsLiquids . . . . . . . . . . . . . . . . . . . . . . . . . . 70.0 81.0 88.1 98.0 108.8 119.8 1.9Natural gas . . . . . . . . . . . . . . . . . . . . . . 36.8 49.2 54.4 56.9 58.3 61.4 1.9Coal . . . . . . . . . . . . . . . . . . . . . . . . . . . . 38.4 40.3 45.3 49.2 52.5 55.1 1.3Electricity . . . . . . . . . . . . . . . . . . . . . . . . 26.0 34.0 41.5 49.5 57.8 66.6 3.4Renewables. . . . . . . . . . . . . . . . . . . . . . 8.7 9.3 10.4 11.6 12.8 14.2 1.8Delivered Energy . . . . . . . . . . . . . . . 179.9 213.8 239.8 265.2 290.3 317.1 2.0
Electricity-Related Losses . . . . . . . . . . . 69.6 83.7 96.6 110.3 124.8 140.9 2.6Total . . . . . . . . . . . . . . . . . . . . . . . . . . 249.5 297.5 336.3 375.5 415.2 458.0 2.2
Electric Powera
Liquids . . . . . . . . . . . . . . . . . . . . . . . . . . 6.8 6.3 6.0 5.7 5.6 6.1 -0.4Natural gas . . . . . . . . . . . . . . . . . . . . . . 19.7 23.4 27.3 30.7 32.9 33.8 1.9Coal . . . . . . . . . . . . . . . . . . . . . . . . . . . . 46.2 54.2 62.2 73.1 86.7 102.9 2.9Nuclear . . . . . . . . . . . . . . . . . . . . . . . . . 4.5 7.5 10.9 13.7 15.4 17.5 4.9Renewables. . . . . . . . . . . . . . . . . . . . . . 18.4 26.3 31.6 36.5 42.1 47.2 3.4
Total . . . . . . . . . . . . . . . . . . . . . . . . . . 95.6 117.7 138.1 159.8 182.7 207.5 2.8Total Energy ConsumptionLiquids . . . . . . . . . . . . . . . . . . . . . . . . . . 76.8 87.3 94.1 103.7 114.4 125.9 1.8Natural gas . . . . . . . . . . . . . . . . . . . . . . 56.5 72.6 81.7 87.7 91.2 95.2 1.9Coal . . . . . . . . . . . . . . . . . . . . . . . . . . . . 84.6 94.6 107.6 122.4 139.2 157.9 2.3Nuclear . . . . . . . . . . . . . . . . . . . . . . . . . 4.5 7.5 10.9 13.7 15.4 17.5 4.9Renewables. . . . . . . . . . . . . . . . . . . . . . 27.1 35.6 42.0 48.1 55.0 61.4 3.0
Total . . . . . . . . . . . . . . . . . . . . . . . . . . 249.5 297.5 336.3 375.5 415.2 458.0 2.2aFuel inputs used in the production of electricity and heat at central-station generators.Sources: 2007: Derived from U.S. Energy Information Administration (EIA), International Energy Statistics database (as of November 2009), web
site www.eia.gov/emeu/international; and International Energy Agency, “Balances of OECD and Non-OECD Statistics” (2009), web site www.iea.org(subscription site). Projections: EIA, World Energy Projection System Plus (2010).

Table F11. Delivered energy consumption in Russia by end-use sector and fuel, 2007-2035(Quadrillion Btu)
Reference Case projections by end-use sector and country grouping
U.S. Energy Information Administration / International Energy Outlook 2010 237
Sector/Fuel 2007
Projections Average annualpercent change,
2007-20352015 2020 2025 2030 2035ResidentialLiquids . . . . . . . . . . . . . . . . . . . . . . . . . . 0.4 0.4 0.4 0.4 0.4 0.4 0.0Natural gas . . . . . . . . . . . . . . . . . . . . . . 3.1 3.1 3.1 3.2 3.3 3.4 0.4Coal . . . . . . . . . . . . . . . . . . . . . . . . . . . . 0.2 0.2 0.2 0.2 0.2 0.2 -1.2Electricity . . . . . . . . . . . . . . . . . . . . . . . . 0.4 0.5 0.6 0.6 0.7 0.8 2.6Renewables. . . . . . . . . . . . . . . . . . . . . . 0.0 0.0 0.0 0.0 0.0 0.0 —
Total . . . . . . . . . . . . . . . . . . . . . . . . . . 4.1 4.2 4.3 4.5 4.6 4.8 0.5CommercialLiquids . . . . . . . . . . . . . . . . . . . . . . . . . . 0.1 0.1 0.1 0.1 0.1 0.1 -1.3Natural gas . . . . . . . . . . . . . . . . . . . . . . 0.7 0.7 0.7 0.8 0.8 0.8 0.6Coal . . . . . . . . . . . . . . . . . . . . . . . . . . . . 0.1 0.1 0.1 0.1 0.1 0.1 -1.0Electricity . . . . . . . . . . . . . . . . . . . . . . . . 0.4 0.5 0.6 0.7 0.8 0.9 2.5Renewables. . . . . . . . . . . . . . . . . . . . . . 0.0 0.0 0.0 0.0 0.0 0.0 —
Total . . . . . . . . . . . . . . . . . . . . . . . . . . 1.4 1.5 1.5 1.7 1.8 1.9 1.2IndustrialLiquids . . . . . . . . . . . . . . . . . . . . . . . . . . 2.6 2.3 2.3 2.4 2.5 2.6 0.1Natural gas . . . . . . . . . . . . . . . . . . . . . . 5.4 5.3 5.4 5.4 5.3 5.3 -0.1Coal . . . . . . . . . . . . . . . . . . . . . . . . . . . . 1.0 0.8 0.9 0.9 1.0 1.0 0.1Electricity . . . . . . . . . . . . . . . . . . . . . . . . 1.7 1.8 1.9 2.1 2.3 2.4 1.2Renewables. . . . . . . . . . . . . . . . . . . . . . 0.1 0.1 0.1 0.1 0.1 0.1 1.7
Total . . . . . . . . . . . . . . . . . . . . . . . . . . 10.8 10.3 10.6 11.0 11.2 11.5 0.2TransportationLiquids . . . . . . . . . . . . . . . . . . . . . . . . . . 2.3 2.4 2.4 2.2 2.2 2.3 0.0Natural gas . . . . . . . . . . . . . . . . . . . . . . 1.7 1.8 1.9 2.0 2.2 2.3 1.1Coal . . . . . . . . . . . . . . . . . . . . . . . . . . . . 0.0 0.0 0.0 0.0 0.0 0.0 —Electricity . . . . . . . . . . . . . . . . . . . . . . . . 0.3 0.3 0.3 0.3 0.3 0.3 0.5Total . . . . . . . . . . . . . . . . . . . . . . . . . . 4.3 4.5 4.6 4.6 4.7 4.9 0.5
All End-Use SectorsLiquids . . . . . . . . . . . . . . . . . . . . . . . . . . 5.4 5.3 5.2 5.2 5.2 5.5 0.0Natural gas . . . . . . . . . . . . . . . . . . . . . . 10.8 10.9 11.1 11.4 11.5 11.8 0.3Coal . . . . . . . . . . . . . . . . . . . . . . . . . . . . 1.4 1.2 1.2 1.2 1.3 1.3 -0.2Electricity . . . . . . . . . . . . . . . . . . . . . . . . 2.9 3.1 3.4 3.7 4.1 4.5 1.6Renewables. . . . . . . . . . . . . . . . . . . . . . 0.1 0.1 0.1 0.1 0.1 0.1 1.7
Delivered Energy . . . . . . . . . . . . . . . 20.5 20.5 21.0 21.7 22.2 23.2 0.4Electricity-Related Losses . . . . . . . . . . . 9.9 10.2 10.6 11.2 11.6 12.3 0.8Total . . . . . . . . . . . . . . . . . . . . . . . . . . 30.5 30.7 31.6 32.8 33.9 35.5 0.5
Electric Powera
Liquids . . . . . . . . . . . . . . . . . . . . . . . . . . 0.4 0.4 0.3 0.3 0.3 0.3 -0.8Natural gas . . . . . . . . . . . . . . . . . . . . . . 6.1 6.0 6.0 5.9 6.0 6.0 -0.1Coal . . . . . . . . . . . . . . . . . . . . . . . . . . . . 2.9 2.9 2.9 2.9 3.3 4.0 1.1Nuclear . . . . . . . . . . . . . . . . . . . . . . . . . 1.6 2.1 2.8 3.5 3.7 3.9 3.1Renewables. . . . . . . . . . . . . . . . . . . . . . 1.8 1.9 2.1 2.2 2.4 2.7 1.5
Total . . . . . . . . . . . . . . . . . . . . . . . . . . 12.8 13.3 14.0 14.9 15.7 16.8 1.0Total Energy ConsumptionLiquids . . . . . . . . . . . . . . . . . . . . . . . . . . 5.8 5.6 5.5 5.5 5.5 5.8 0.0Natural gas . . . . . . . . . . . . . . . . . . . . . . 16.9 16.8 17.1 17.4 17.5 17.8 0.2Coal . . . . . . . . . . . . . . . . . . . . . . . . . . . . 4.3 4.1 4.1 4.2 4.6 5.3 0.8Nuclear . . . . . . . . . . . . . . . . . . . . . . . . . 1.6 2.1 2.8 3.5 3.7 3.9 3.1Renewables. . . . . . . . . . . . . . . . . . . . . . 1.9 2.0 2.2 2.4 2.6 2.8 1.5
Total . . . . . . . . . . . . . . . . . . . . . . . . . . 30.5 30.7 31.6 32.8 33.9 35.5 0.5aFuel inputs used in the production of electricity and heat at central-station generators.Sources: 2007: Derived from U.S. Energy Information Administration (EIA), International Energy Statistics database (as of November 2009), web
site www.eia.gov/emeu/international; and International Energy Agency, “Balances of OECD and Non-OECD Statistics” (2009), web site www.iea.org(subscription site). Projections: EIA, World Energy Projection System Plus (2010).

Table F12. Delivered energy consumption in Other Non-OECD Europe and Eurasia by end-use sector andfuel, 2007-2035(Quadrillion Btu)
Appendix F
238 U.S. Energy Information Administration / International Energy Outlook 2010
Sector/Fuel 2007
Projections Average annualpercent change,
2007-20352015 2020 2025 2030 2035ResidentialLiquids . . . . . . . . . . . . . . . . . . . . . . . . . . 0.2 0.2 0.2 0.2 0.2 0.2 0.1Natural gas . . . . . . . . . . . . . . . . . . . . . . 2.6 2.8 2.8 2.8 2.7 2.7 0.1Coal . . . . . . . . . . . . . . . . . . . . . . . . . . . . 0.1 0.1 0.1 0.1 0.1 0.1 -1.6Electricity . . . . . . . . . . . . . . . . . . . . . . . . 0.4 0.5 0.5 0.6 0.6 0.7 1.5Renewables. . . . . . . . . . . . . . . . . . . . . . 0.0 0.0 0.0 0.0 0.0 0.0 —
Total . . . . . . . . . . . . . . . . . . . . . . . . . . 3.4 3.6 3.7 3.7 3.7 3.7 0.3CommercialLiquids . . . . . . . . . . . . . . . . . . . . . . . . . . 0.1 0.1 0.0 0.0 0.0 0.0 -0.6Natural gas . . . . . . . . . . . . . . . . . . . . . . 0.4 0.4 0.4 0.4 0.4 0.4 0.2Coal . . . . . . . . . . . . . . . . . . . . . . . . . . . . 0.0 0.0 0.0 0.0 0.0 0.0 -0.4Electricity . . . . . . . . . . . . . . . . . . . . . . . . 0.2 0.3 0.3 0.4 0.4 0.5 2.4Renewables. . . . . . . . . . . . . . . . . . . . . . 0.0 0.0 0.0 0.0 0.0 0.0 —
Total . . . . . . . . . . . . . . . . . . . . . . . . . . 0.7 0.8 0.8 0.9 0.9 0.9 1.0IndustrialLiquids . . . . . . . . . . . . . . . . . . . . . . . . . . 1.6 1.3 1.2 1.3 1.4 1.4 -0.5Natural gas . . . . . . . . . . . . . . . . . . . . . . 3.8 4.4 4.6 4.7 4.6 4.6 0.7Coal . . . . . . . . . . . . . . . . . . . . . . . . . . . . 2.1 1.6 1.6 1.5 1.5 1.4 -1.5Electricity . . . . . . . . . . . . . . . . . . . . . . . . 1.1 1.2 1.3 1.4 1.6 1.7 1.6Renewables. . . . . . . . . . . . . . . . . . . . . . 0.1 0.1 0.1 0.1 0.1 0.1 1.4
Total . . . . . . . . . . . . . . . . . . . . . . . . . . 8.7 8.6 8.8 9.0 9.1 9.3 0.2TransportationLiquids . . . . . . . . . . . . . . . . . . . . . . . . . . 2.3 2.5 2.7 2.9 3.1 3.2 1.2Natural gas . . . . . . . . . . . . . . . . . . . . . . 0.3 0.3 0.3 0.3 0.3 0.4 0.6Coal . . . . . . . . . . . . . . . . . . . . . . . . . . . . 0.0 0.0 0.0 0.0 0.0 0.0 —Electricity . . . . . . . . . . . . . . . . . . . . . . . . 0.1 0.1 0.1 0.1 0.1 0.1 -0.3Total . . . . . . . . . . . . . . . . . . . . . . . . . . 2.7 2.9 3.1 3.3 3.5 3.6 1.1
All End-Use SectorsLiquids . . . . . . . . . . . . . . . . . . . . . . . . . . 4.2 4.1 4.2 4.4 4.7 4.9 0.6Natural gas . . . . . . . . . . . . . . . . . . . . . . 7.0 8.0 8.2 8.3 8.1 8.1 0.5Coal . . . . . . . . . . . . . . . . . . . . . . . . . . . . 2.3 1.8 1.7 1.7 1.6 1.5 -1.5Electricity . . . . . . . . . . . . . . . . . . . . . . . . 1.9 2.0 2.2 2.4 2.7 2.9 1.6Renewables. . . . . . . . . . . . . . . . . . . . . . 0.1 0.1 0.1 0.1 0.1 0.1 1.4
Delivered Energy . . . . . . . . . . . . . . . 15.4 15.9 16.4 16.9 17.2 17.5 0.5Electricity-Related Losses . . . . . . . . . . . 5.6 5.8 6.1 6.4 6.7 7.2 0.9Total . . . . . . . . . . . . . . . . . . . . . . . . . . 21.0 21.7 22.5 23.3 23.9 24.7 0.6
Electric Powera
Liquids . . . . . . . . . . . . . . . . . . . . . . . . . . 0.4 0.4 0.3 0.3 0.3 0.3 -0.9Natural gas . . . . . . . . . . . . . . . . . . . . . . 2.4 2.5 2.7 3.0 3.1 3.2 1.0Coal . . . . . . . . . . . . . . . . . . . . . . . . . . . . 2.1 2.1 2.1 2.1 2.3 2.6 0.7Nuclear . . . . . . . . . . . . . . . . . . . . . . . . . 1.4 1.6 1.8 2.0 2.1 2.4 2.0Renewables. . . . . . . . . . . . . . . . . . . . . . 1.1 1.3 1.3 1.4 1.5 1.6 1.3
Total . . . . . . . . . . . . . . . . . . . . . . . . . . 7.4 7.8 8.3 8.8 9.4 10.1 1.1Total Energy ConsumptionLiquids . . . . . . . . . . . . . . . . . . . . . . . . . . 4.6 4.4 4.5 4.7 5.0 5.2 0.5Natural gas . . . . . . . . . . . . . . . . . . . . . . 9.4 10.4 10.9 11.3 11.2 11.3 0.6Coal . . . . . . . . . . . . . . . . . . . . . . . . . . . . 4.4 3.9 3.8 3.8 3.9 4.1 -0.2Nuclear . . . . . . . . . . . . . . . . . . . . . . . . . 1.4 1.6 1.8 2.0 2.1 2.4 2.0Renewables. . . . . . . . . . . . . . . . . . . . . . 1.2 1.4 1.4 1.5 1.6 1.7 1.3
Total . . . . . . . . . . . . . . . . . . . . . . . . . . 21.0 21.7 22.5 23.3 23.9 24.7 0.6aFuel inputs used in the production of electricity and heat at central-station generators.Sources: 2007: Derived from U.S. Energy Information Administration (EIA), International Energy Statistics database (as of November 2009), web
site www.eia.gov/emeu/international; and International Energy Agency, “Balances of OECD and Non-OECD Statistics” (2009), web site www.iea.org(subscription site). Projections: EIA, World Energy Projection System Plus (2010).

Table F13. Delivered energy consumption in China by end-use sector and fuel, 2007-2035(Quadrillion Btu)
Reference Case projections by end-use sector and country grouping
U.S. Energy Information Administration / International Energy Outlook 2010 239
Sector/Fuel 2007
Projections Average annualpercent change,
2007-20352015 2020 2025 2030 2035ResidentialLiquids . . . . . . . . . . . . . . . . . . . . . . . . . . 0.9 1.0 1.0 1.0 0.9 0.9 -0.2Natural gas . . . . . . . . . . . . . . . . . . . . . . 0.6 1.3 1.8 2.3 2.9 3.4 6.4Coal . . . . . . . . . . . . . . . . . . . . . . . . . . . . 2.5 2.6 2.7 2.7 2.6 2.5 0.0Electricity . . . . . . . . . . . . . . . . . . . . . . . . 1.2 2.4 3.1 3.9 4.7 5.4 5.4Renewables. . . . . . . . . . . . . . . . . . . . . . 0.0 0.0 0.0 0.0 0.0 0.0 —
Total . . . . . . . . . . . . . . . . . . . . . . . . . . 5.3 7.3 8.6 9.9 11.1 12.2 3.0CommercialLiquids . . . . . . . . . . . . . . . . . . . . . . . . . . 1.0 1.0 0.9 0.9 0.9 0.8 -0.6Natural gas . . . . . . . . . . . . . . . . . . . . . . 0.2 0.3 0.4 0.6 0.7 0.8 6.0Coal . . . . . . . . . . . . . . . . . . . . . . . . . . . . 0.3 0.3 0.3 0.3 0.3 0.3 0.1Electricity . . . . . . . . . . . . . . . . . . . . . . . . 0.5 0.9 1.2 1.7 2.1 2.6 6.2Renewables. . . . . . . . . . . . . . . . . . . . . . 0.0 0.0 0.0 0.0 0.0 0.0 —
Total . . . . . . . . . . . . . . . . . . . . . . . . . . 1.9 2.5 2.9 3.4 4.0 4.5 3.2IndustrialLiquids . . . . . . . . . . . . . . . . . . . . . . . . . . 7.0 7.5 8.3 9.4 10.3 11.2 1.7Natural gas . . . . . . . . . . . . . . . . . . . . . . 1.4 2.8 3.5 4.0 4.5 4.7 4.5Coal . . . . . . . . . . . . . . . . . . . . . . . . . . . . 24.1 26.5 30.1 33.2 35.6 37.4 1.6Electricity . . . . . . . . . . . . . . . . . . . . . . . . 7.9 11.1 14.3 17.8 21.4 25.1 4.2Renewables. . . . . . . . . . . . . . . . . . . . . . 0.2 0.3 0.3 0.4 0.5 0.6 3.6
Total . . . . . . . . . . . . . . . . . . . . . . . . . . 40.5 48.3 56.6 64.8 72.3 78.9 2.4TransportationLiquids . . . . . . . . . . . . . . . . . . . . . . . . . . 6.1 10.4 13.0 16.0 18.7 21.2 4.5Natural gas . . . . . . . . . . . . . . . . . . . . . . 0.0 0.0 0.0 0.0 0.0 0.0 9.6Coal . . . . . . . . . . . . . . . . . . . . . . . . . . . . 0.1 0.2 0.1 0.0 0.0 0.0 —Electricity . . . . . . . . . . . . . . . . . . . . . . . . 0.1 0.1 0.2 0.2 0.2 0.3 3.6Total . . . . . . . . . . . . . . . . . . . . . . . . . . 6.3 10.7 13.3 16.2 19.0 21.5 4.5
All End-Use SectorsLiquids . . . . . . . . . . . . . . . . . . . . . . . . . . 15.0 19.9 23.2 27.2 30.9 34.2 3.0Natural gas . . . . . . . . . . . . . . . . . . . . . . 2.1 4.4 5.7 6.9 8.1 9.0 5.3Coal . . . . . . . . . . . . . . . . . . . . . . . . . . . . 27.1 29.6 33.2 36.2 38.5 40.2 1.4Electricity . . . . . . . . . . . . . . . . . . . . . . . . 9.7 14.6 18.9 23.6 28.4 33.3 4.5Renewables. . . . . . . . . . . . . . . . . . . . . . 0.2 0.3 0.3 0.4 0.5 0.6 3.6
Delivered Energy . . . . . . . . . . . . . . . 54.0 68.8 81.4 94.3 106.4 117.2 2.8Electricity-Related Losses . . . . . . . . . . . 24.0 32.6 40.0 48.1 56.3 64.7 3.6
Total . . . . . . . . . . . . . . . . . . . . . . . . . . 78.0 101.4 121.4 142.4 162.7 181.9 3.1Electric Powera
Liquids . . . . . . . . . . . . . . . . . . . . . . . . . . 0.5 0.5 0.5 0.5 0.5 0.5 -0.5Natural gas . . . . . . . . . . . . . . . . . . . . . . 0.5 0.7 0.9 1.0 1.1 1.2 3.1Coal . . . . . . . . . . . . . . . . . . . . . . . . . . . . 27.7 35.6 43.2 52.3 62.0 72.2 3.5Nuclear . . . . . . . . . . . . . . . . . . . . . . . . . 0.6 1.9 3.5 4.5 5.3 6.2 8.5Renewables. . . . . . . . . . . . . . . . . . . . . . 4.3 8.4 10.9 13.4 15.9 18.0 5.2Total . . . . . . . . . . . . . . . . . . . . . . . . . . 33.7 47.1 58.9 71.6 84.7 98.0 3.9
Total Energy ConsumptionLiquids . . . . . . . . . . . . . . . . . . . . . . . . . . 15.5 20.4 23.7 27.7 31.4 34.6 2.9Natural gas . . . . . . . . . . . . . . . . . . . . . . 2.6 5.1 6.6 7.9 9.1 10.1 5.0Coal . . . . . . . . . . . . . . . . . . . . . . . . . . . . 54.8 65.2 76.4 88.5 100.5 112.4 2.6Nuclear . . . . . . . . . . . . . . . . . . . . . . . . . 0.6 1.9 3.5 4.5 5.3 6.2 8.5Renewables. . . . . . . . . . . . . . . . . . . . . . 4.5 8.7 11.2 13.8 16.4 18.5 5.2Total . . . . . . . . . . . . . . . . . . . . . . . . . . 78.0 101.4 121.4 142.4 162.7 181.9 3.1
aFuel inputs used in the production of electricity and heat at central-station generators.Sources: 2007: Derived from U.S. Energy Information Administration (EIA), International Energy Statistics database (as of November 2009), web
site www.eia.gov/emeu/international; and International Energy Agency, “Balances of OECD and Non-OECD Statistics” (2009), web site www.iea.org(subscription site). Projections: EIA, World Energy Projection System Plus (2010).

Table F14. Delivered energy consumption in India by end-use sector and fuel, 2007-2035(Quadrillion Btu)
Appendix F
240 U.S. Energy Information Administration / International Energy Outlook 2010
Sector/Fuel 2007
Projections Average annualpercent change,
2007-20352015 2020 2025 2030 2035ResidentialLiquids . . . . . . . . . . . . . . . . . . . . . . . . . . 0.9 1.0 1.0 1.0 1.0 1.0 0.2Natural gas . . . . . . . . . . . . . . . . . . . . . . 0.0 0.0 0.1 0.1 0.1 0.1 3.4Coal . . . . . . . . . . . . . . . . . . . . . . . . . . . . 0.1 0.2 0.2 0.2 0.2 0.3 2.2Electricity . . . . . . . . . . . . . . . . . . . . . . . . 0.5 0.8 1.1 1.3 1.6 1.9 5.1Renewables. . . . . . . . . . . . . . . . . . . . . . 0.0 0.0 0.0 0.0 0.0 0.0 —
Total . . . . . . . . . . . . . . . . . . . . . . . . . . 1.6 2.0 2.3 2.6 2.9 3.2 2.6CommercialLiquids . . . . . . . . . . . . . . . . . . . . . . . . . . 0.0 0.0 0.0 0.0 0.0 0.0 —Natural gas . . . . . . . . . . . . . . . . . . . . . . 0.0 0.0 0.0 0.0 0.0 0.0 —Coal . . . . . . . . . . . . . . . . . . . . . . . . . . . . 0.2 0.2 0.2 0.3 0.3 0.3 2.8Electricity . . . . . . . . . . . . . . . . . . . . . . . . 0.2 0.3 0.4 0.5 0.6 0.8 5.5Renewables. . . . . . . . . . . . . . . . . . . . . . 0.0 0.0 0.0 0.0 0.0 0.0 —
Total . . . . . . . . . . . . . . . . . . . . . . . . . . 0.3 0.5 0.6 0.8 0.9 1.1 4.4IndustrialLiquids . . . . . . . . . . . . . . . . . . . . . . . . . . 3.0 2.8 3.1 3.4 3.6 3.9 1.0Natural gas . . . . . . . . . . . . . . . . . . . . . . 0.9 2.1 2.5 2.6 2.6 2.6 4.0Coal . . . . . . . . . . . . . . . . . . . . . . . . . . . . 3.3 3.5 4.3 4.6 5.0 5.3 1.7Electricity . . . . . . . . . . . . . . . . . . . . . . . . 1.3 1.3 1.6 1.8 2.0 2.3 2.2Renewables. . . . . . . . . . . . . . . . . . . . . . 1.2 1.2 1.5 1.6 1.8 2.0 1.9
Total . . . . . . . . . . . . . . . . . . . . . . . . . . 9.6 11.0 12.9 14.0 15.1 16.2 1.9TransportationLiquids . . . . . . . . . . . . . . . . . . . . . . . . . . 1.8 2.7 3.1 3.6 4.1 4.6 3.5Natural gas . . . . . . . . . . . . . . . . . . . . . . 0.1 0.1 0.1 0.1 0.1 0.1 2.1Coal . . . . . . . . . . . . . . . . . . . . . . . . . . . . 0.0 0.0 0.0 0.0 0.0 0.0 —Electricity . . . . . . . . . . . . . . . . . . . . . . . . 0.0 0.1 0.1 0.1 0.1 0.1 2.7Total . . . . . . . . . . . . . . . . . . . . . . . . . . 1.9 2.8 3.3 3.7 4.2 4.8 3.4
All End-Use SectorsLiquids . . . . . . . . . . . . . . . . . . . . . . . . . . 5.6 6.4 7.2 7.9 8.7 9.5 1.9Natural gas . . . . . . . . . . . . . . . . . . . . . . 0.9 2.2 2.6 2.8 2.8 2.8 3.9Coal . . . . . . . . . . . . . . . . . . . . . . . . . . . . 3.6 3.9 4.7 5.1 5.6 5.9 1.8Electricity . . . . . . . . . . . . . . . . . . . . . . . . 1.9 2.5 3.1 3.7 4.3 5.0 3.5Renewables. . . . . . . . . . . . . . . . . . . . . . 1.2 1.2 1.5 1.6 1.8 2.0 1.9
Delivered Energy . . . . . . . . . . . . . . . 13.3 16.3 19.1 21.1 23.1 25.2 2.3Electricity-Related Losses . . . . . . . . . . . 7.0 8.0 9.0 10.0 11.0 12.4 2.1Total . . . . . . . . . . . . . . . . . . . . . . . . . . 20.3 24.3 28.2 31.1 34.1 37.6 2.2
Electric Powera
Liquids . . . . . . . . . . . . . . . . . . . . . . . . . . 0.2 0.2 0.2 0.2 0.2 0.2 -1.0Natural gas . . . . . . . . . . . . . . . . . . . . . . 0.6 1.0 1.5 1.7 1.8 1.8 4.3Coal . . . . . . . . . . . . . . . . . . . . . . . . . . . . 6.6 6.6 6.8 7.3 8.2 9.5 1.3Nuclear . . . . . . . . . . . . . . . . . . . . . . . . . 0.2 0.7 1.3 1.7 1.9 2.1 9.0Renewables. . . . . . . . . . . . . . . . . . . . . . 1.3 2.0 2.5 2.8 3.3 3.8 3.8
Total . . . . . . . . . . . . . . . . . . . . . . . . . . 8.9 10.5 12.2 13.7 15.3 17.4 2.4Total Energy ConsumptionLiquids . . . . . . . . . . . . . . . . . . . . . . . . . . 5.9 6.6 7.4 8.1 8.8 9.6 1.8Natural gas . . . . . . . . . . . . . . . . . . . . . . 1.5 3.2 4.1 4.5 4.6 4.6 4.1Coal . . . . . . . . . . . . . . . . . . . . . . . . . . . . 10.2 10.5 11.5 12.4 13.7 15.5 1.5Nuclear . . . . . . . . . . . . . . . . . . . . . . . . . 0.2 0.7 1.3 1.7 1.9 2.1 9.0Renewables. . . . . . . . . . . . . . . . . . . . . . 2.5 3.2 4.0 4.5 5.1 5.8 3.0
Total . . . . . . . . . . . . . . . . . . . . . . . . . . 20.3 24.3 28.2 31.1 34.1 37.6 2.2aFuel inputs used in the production of electricity and heat at central-station generators.Sources: 2007: Derived from U.S. Energy Information Administration (EIA), International Energy Statistics database (as of November 2009), web
site www.eia.gov/emeu/international; and International Energy Agency, “Balances of OECD and Non-OECD Statistics” (2009), web site www.iea.org(subscription site). Projections: EIA, World Energy Projection System Plus (2010).

Table F15. Delivered energy consumption in Other Non-OECD Asia by end-use sector and fuel, 2007-2035(Quadrillion Btu)
Reference Case projections by end-use sector and country grouping
U.S. Energy Information Administration / International Energy Outlook 2010 241
Sector/Fuel 2007
Projections Average annualpercent change,
2007-20352015 2020 2025 2030 2035ResidentialLiquids . . . . . . . . . . . . . . . . . . . . . . . . . . 0.7 0.8 0.8 0.8 0.9 0.9 1.0Natural gas . . . . . . . . . . . . . . . . . . . . . . 0.3 0.5 0.6 0.6 0.7 0.8 3.5Coal . . . . . . . . . . . . . . . . . . . . . . . . . . . . 0.0 0.0 0.0 0.0 0.0 0.0 0.5Electricity . . . . . . . . . . . . . . . . . . . . . . . . 0.9 1.2 1.4 1.6 1.9 2.2 3.2Renewables. . . . . . . . . . . . . . . . . . . . . . 0.0 0.0 0.0 0.0 0.0 0.0 —
Total . . . . . . . . . . . . . . . . . . . . . . . . . . 2.0 2.5 2.8 3.2 3.5 4.0 2.6CommercialLiquids . . . . . . . . . . . . . . . . . . . . . . . . . . 0.2 0.2 0.3 0.3 0.3 0.3 1.4Natural gas . . . . . . . . . . . . . . . . . . . . . . 0.1 0.1 0.1 0.1 0.1 0.1 2.2Coal . . . . . . . . . . . . . . . . . . . . . . . . . . . . 0.0 0.0 0.0 0.0 0.0 0.0 2.8Electricity . . . . . . . . . . . . . . . . . . . . . . . . 0.8 1.0 1.2 1.5 1.8 2.2 3.8Renewables. . . . . . . . . . . . . . . . . . . . . . 0.0 0.0 0.0 0.0 0.0 0.0 —
Total . . . . . . . . . . . . . . . . . . . . . . . . . . 1.1 1.3 1.6 1.9 2.2 2.6 3.3IndustrialLiquids . . . . . . . . . . . . . . . . . . . . . . . . . . 4.1 3.7 4.0 4.6 5.3 6.1 1.4Natural gas . . . . . . . . . . . . . . . . . . . . . . 3.1 4.4 4.9 5.3 5.7 6.5 2.7Coal . . . . . . . . . . . . . . . . . . . . . . . . . . . . 2.3 2.1 2.4 2.7 3.0 3.3 1.3Electricity . . . . . . . . . . . . . . . . . . . . . . . . 1.4 1.6 1.9 2.3 2.7 3.3 3.1Renewables. . . . . . . . . . . . . . . . . . . . . . 1.4 1.5 1.7 1.9 2.2 2.6 2.2
Total . . . . . . . . . . . . . . . . . . . . . . . . . . 12.3 13.2 14.9 16.8 19.0 21.8 2.1TransportationLiquids . . . . . . . . . . . . . . . . . . . . . . . . . . 7.1 8.8 9.8 11.1 12.5 14.0 2.5Natural gas . . . . . . . . . . . . . . . . . . . . . . 0.1 0.1 0.0 0.0 0.0 0.0 -5.8Coal . . . . . . . . . . . . . . . . . . . . . . . . . . . . 0.0 0.0 0.0 0.0 0.0 0.0 —Electricity . . . . . . . . . . . . . . . . . . . . . . . . 0.0 0.0 0.0 0.0 0.0 0.0 1.0Total . . . . . . . . . . . . . . . . . . . . . . . . . . 7.2 8.8 9.8 11.1 12.5 14.0 2.4
All End-Use SectorsLiquids . . . . . . . . . . . . . . . . . . . . . . . . . . 12.1 13.5 14.9 16.8 19.0 21.4 2.0Natural gas . . . . . . . . . . . . . . . . . . . . . . 3.5 5.0 5.6 6.0 6.6 7.4 2.7Coal . . . . . . . . . . . . . . . . . . . . . . . . . . . . 2.3 2.2 2.4 2.7 3.1 3.4 1.3Electricity . . . . . . . . . . . . . . . . . . . . . . . . 3.1 3.8 4.5 5.4 6.4 7.6 3.3Renewables. . . . . . . . . . . . . . . . . . . . . . 1.4 1.5 1.7 1.9 2.2 2.6 2.2
Delivered Energy . . . . . . . . . . . . . . . 22.5 25.9 29.1 32.9 37.3 42.4 2.3Electricity-Related Losses . . . . . . . . . . . 6.3 7.8 9.1 10.7 12.9 15.4 3.2Total . . . . . . . . . . . . . . . . . . . . . . . . . . 28.8 33.7 38.2 43.5 50.2 57.8 2.5
Electric Powera
Liquids . . . . . . . . . . . . . . . . . . . . . . . . . . 1.0 1.0 0.9 0.9 0.8 0.9 -0.7Natural gas . . . . . . . . . . . . . . . . . . . . . . 3.1 3.8 4.7 5.5 5.9 6.1 2.4Coal . . . . . . . . . . . . . . . . . . . . . . . . . . . . 3.1 3.3 3.6 4.6 6.5 9.1 3.9Nuclear . . . . . . . . . . . . . . . . . . . . . . . . . 0.4 0.6 0.9 1.1 1.3 1.4 4.7Renewables. . . . . . . . . . . . . . . . . . . . . . 1.7 2.9 3.5 4.0 4.8 5.6 4.3
Total . . . . . . . . . . . . . . . . . . . . . . . . . . 9.4 11.6 13.6 16.0 19.3 23.1 3.3Total Energy ConsumptionLiquids . . . . . . . . . . . . . . . . . . . . . . . . . . 13.2 14.4 15.8 17.7 19.8 22.2 1.9Natural gas . . . . . . . . . . . . . . . . . . . . . . 6.7 8.8 10.3 11.6 12.5 13.5 2.6Coal . . . . . . . . . . . . . . . . . . . . . . . . . . . . 5.4 5.5 6.0 7.3 9.6 12.4 3.0Nuclear . . . . . . . . . . . . . . . . . . . . . . . . . 0.4 0.6 0.9 1.1 1.3 1.4 4.7Renewables. . . . . . . . . . . . . . . . . . . . . . 3.1 4.3 5.2 5.9 7.0 8.2 3.5
Total . . . . . . . . . . . . . . . . . . . . . . . . . . 28.8 33.7 38.2 43.5 50.2 57.8 2.5aFuel inputs used in the production of electricity and heat at central-station generators.Sources: 2007: Derived from U.S. Energy Information Administration (EIA), International Energy Statistics database (as of November 2009), web
site www.eia.gov/emeu/international; and International Energy Agency, “Balances of OECD and Non-OECD Statistics” (2009), web site www.iea.org(subscription site). Projections: EIA, World Energy Projection System Plus (2010).

Table F16. Delivered energy consumption in the Middle East by end-use sector and fuel, 2007-2035(Quadrillion Btu)
Appendix F
242 U.S. Energy Information Administration / International Energy Outlook 2010
Sector/Fuel 2007
Projections Average annualpercent change,
2007-20352015 2020 2025 2030 2035ResidentialLiquids . . . . . . . . . . . . . . . . . . . . . . . . . . 0.8 0.9 0.9 0.9 1.0 1.0 0.7Natural gas . . . . . . . . . . . . . . . . . . . . . . 1.5 2.3 2.3 2.2 2.0 2.0 0.9Coal . . . . . . . . . . . . . . . . . . . . . . . . . . . . 0.0 0.0 0.0 0.0 0.0 0.0 -2.4Electricity . . . . . . . . . . . . . . . . . . . . . . . . 0.9 1.2 1.3 1.5 1.7 1.9 2.5Renewables. . . . . . . . . . . . . . . . . . . . . . 0.0 0.0 0.0 0.0 0.0 0.0 —
Total . . . . . . . . . . . . . . . . . . . . . . . . . . 3.3 4.4 4.6 4.6 4.7 4.9 1.4CommercialLiquids . . . . . . . . . . . . . . . . . . . . . . . . . . 0.2 0.2 0.2 0.3 0.3 0.3 1.9Natural gas . . . . . . . . . . . . . . . . . . . . . . 0.2 0.4 0.4 0.4 0.3 0.3 1.9Coal . . . . . . . . . . . . . . . . . . . . . . . . . . . . 0.0 0.0 0.0 0.0 0.0 0.0 —Electricity . . . . . . . . . . . . . . . . . . . . . . . . 0.5 0.7 0.8 1.0 1.1 1.3 3.2Renewables. . . . . . . . . . . . . . . . . . . . . . 0.0 0.0 0.0 0.0 0.0 0.0 —
Total . . . . . . . . . . . . . . . . . . . . . . . . . . 0.9 1.3 1.4 1.6 1.7 1.9 2.7IndustrialLiquids . . . . . . . . . . . . . . . . . . . . . . . . . . 3.9 3.7 4.1 4.7 5.5 6.2 1.6Natural gas . . . . . . . . . . . . . . . . . . . . . . 5.3 9.0 10.3 10.4 10.4 10.9 2.6Coal . . . . . . . . . . . . . . . . . . . . . . . . . . . . 0.0 0.0 0.0 0.0 0.0 0.0 1.1Electricity . . . . . . . . . . . . . . . . . . . . . . . . 0.6 0.6 0.7 0.8 0.8 0.9 1.7Renewables. . . . . . . . . . . . . . . . . . . . . . 0.0 0.0 0.1 0.1 0.1 0.1 0.6
Total . . . . . . . . . . . . . . . . . . . . . . . . . . 9.9 13.4 15.2 16.0 16.8 18.1 2.2TransportationLiquids . . . . . . . . . . . . . . . . . . . . . . . . . . 5.8 7.8 8.7 9.6 10.8 12.5 2.8Natural gas . . . . . . . . . . . . . . . . . . . . . . 0.0 0.0 0.0 0.0 0.0 0.1 1.0Coal . . . . . . . . . . . . . . . . . . . . . . . . . . . . 0.0 0.0 0.0 0.0 0.0 0.0 —Electricity . . . . . . . . . . . . . . . . . . . . . . . . 0.0 0.0 0.0 0.0 0.0 0.0 —Total . . . . . . . . . . . . . . . . . . . . . . . . . . 5.8 7.8 8.7 9.7 10.9 12.5 2.8
All End-Use SectorsLiquids . . . . . . . . . . . . . . . . . . . . . . . . . . 10.7 12.7 13.9 15.6 17.6 20.0 2.3Natural gas . . . . . . . . . . . . . . . . . . . . . . 7.1 11.7 13.1 13.1 12.8 13.3 2.3Coal . . . . . . . . . . . . . . . . . . . . . . . . . . . . 0.0 0.0 0.0 0.0 0.0 0.0 1.1Electricity . . . . . . . . . . . . . . . . . . . . . . . . 2.0 2.5 2.8 3.2 3.6 4.0 2.5Renewables. . . . . . . . . . . . . . . . . . . . . . 0.0 0.0 0.1 0.1 0.1 0.1 0.6
Delivered Energy . . . . . . . . . . . . . . . 19.9 26.9 29.9 31.9 34.1 37.4 2.3Electricity-Related Losses . . . . . . . . . . . 5.2 0.0 0.0 0.0 0.0 0.0 —Total . . . . . . . . . . . . . . . . . . . . . . . . . . 25.1 32.9 36.5 39.1 41.8 45.7 2.2
Electric Powera
Liquids . . . . . . . . . . . . . . . . . . . . . . . . . . 2.6 2.4 2.2 2.1 2.1 2.7 0.3Natural gas . . . . . . . . . . . . . . . . . . . . . . 4.1 5.3 6.2 7.2 7.9 8.2 2.5Coal . . . . . . . . . . . . . . . . . . . . . . . . . . . . 0.3 0.3 0.3 0.3 0.3 0.3 -0.4Nuclear . . . . . . . . . . . . . . . . . . . . . . . . . 0.0 0.1 0.2 0.3 0.4 0.5 —Renewables. . . . . . . . . . . . . . . . . . . . . . 0.2 0.4 0.4 0.5 0.5 0.6 3.4
Total . . . . . . . . . . . . . . . . . . . . . . . . . . 7.2 8.4 9.4 10.4 11.3 12.3 1.9Total Energy ConsumptionLiquids . . . . . . . . . . . . . . . . . . . . . . . . . . 13.3 15.0 16.1 17.7 19.7 22.7 1.9Natural gas . . . . . . . . . . . . . . . . . . . . . . 11.2 17.0 19.3 20.2 20.7 21.5 2.4Coal . . . . . . . . . . . . . . . . . . . . . . . . . . . . 0.4 0.4 0.3 0.3 0.3 0.4 -0.2Nuclear . . . . . . . . . . . . . . . . . . . . . . . . . 0.0 0.1 0.2 0.3 0.4 0.5 —Renewables. . . . . . . . . . . . . . . . . . . . . . 0.3 0.4 0.5 0.5 0.6 0.6 3.1
Total . . . . . . . . . . . . . . . . . . . . . . . . . . 25.1 32.9 36.5 39.1 41.8 45.7 2.2aFuel inputs used in the production of electricity and heat at central-station generators.Sources: 2007: Derived from U.S. Energy Information Administration (EIA), International Energy Statistics database (as of November 2009), web
site www.eia.gov/emeu/international; and International Energy Agency, “Balances of OECD and Non-OECD Statistics” (2009), web site www.iea.org(subscription site). Projections: EIA, World Energy Projection System Plus (2010).
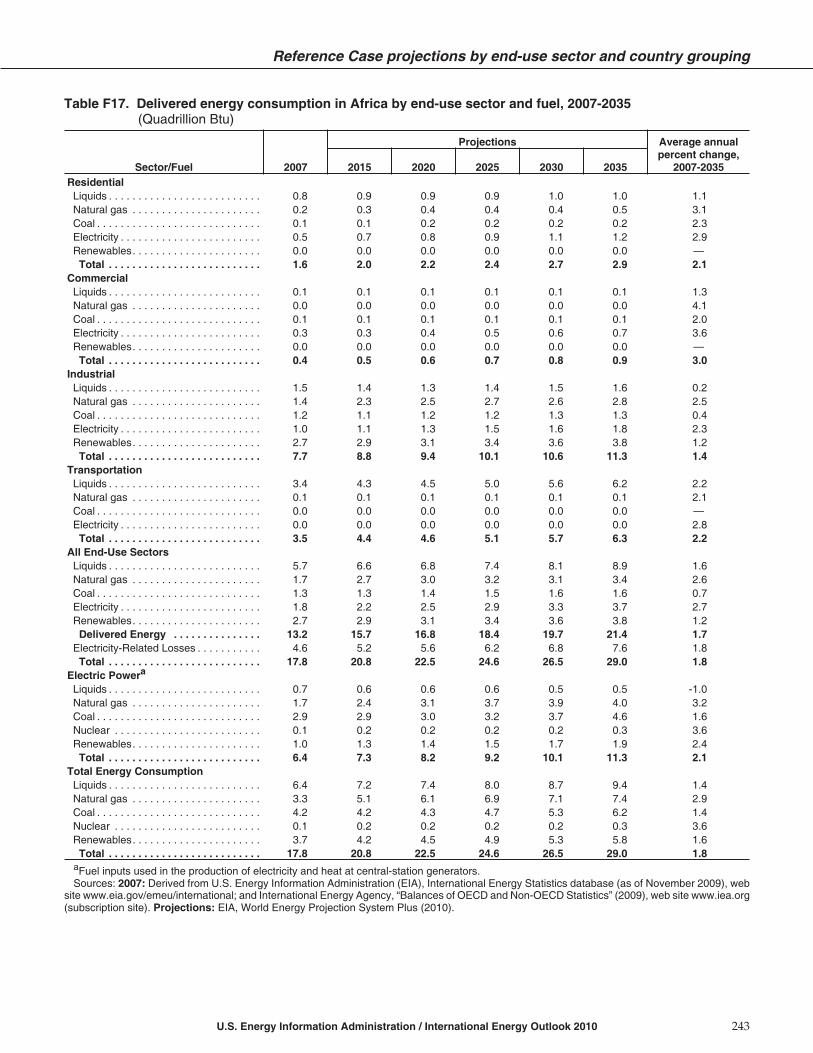
Table F17. Delivered energy consumption in Africa by end-use sector and fuel, 2007-2035(Quadrillion Btu)
Reference Case projections by end-use sector and country grouping
U.S. Energy Information Administration / International Energy Outlook 2010 243
Sector/Fuel 2007
Projections Average annualpercent change,
2007-20352015 2020 2025 2030 2035ResidentialLiquids . . . . . . . . . . . . . . . . . . . . . . . . . . 0.8 0.9 0.9 0.9 1.0 1.0 1.1Natural gas . . . . . . . . . . . . . . . . . . . . . . 0.2 0.3 0.4 0.4 0.4 0.5 3.1Coal . . . . . . . . . . . . . . . . . . . . . . . . . . . . 0.1 0.1 0.2 0.2 0.2 0.2 2.3Electricity . . . . . . . . . . . . . . . . . . . . . . . . 0.5 0.7 0.8 0.9 1.1 1.2 2.9Renewables. . . . . . . . . . . . . . . . . . . . . . 0.0 0.0 0.0 0.0 0.0 0.0 —
Total . . . . . . . . . . . . . . . . . . . . . . . . . . 1.6 2.0 2.2 2.4 2.7 2.9 2.1CommercialLiquids . . . . . . . . . . . . . . . . . . . . . . . . . . 0.1 0.1 0.1 0.1 0.1 0.1 1.3Natural gas . . . . . . . . . . . . . . . . . . . . . . 0.0 0.0 0.0 0.0 0.0 0.0 4.1Coal . . . . . . . . . . . . . . . . . . . . . . . . . . . . 0.1 0.1 0.1 0.1 0.1 0.1 2.0Electricity . . . . . . . . . . . . . . . . . . . . . . . . 0.3 0.3 0.4 0.5 0.6 0.7 3.6Renewables. . . . . . . . . . . . . . . . . . . . . . 0.0 0.0 0.0 0.0 0.0 0.0 —
Total . . . . . . . . . . . . . . . . . . . . . . . . . . 0.4 0.5 0.6 0.7 0.8 0.9 3.0IndustrialLiquids . . . . . . . . . . . . . . . . . . . . . . . . . . 1.5 1.4 1.3 1.4 1.5 1.6 0.2Natural gas . . . . . . . . . . . . . . . . . . . . . . 1.4 2.3 2.5 2.7 2.6 2.8 2.5Coal . . . . . . . . . . . . . . . . . . . . . . . . . . . . 1.2 1.1 1.2 1.2 1.3 1.3 0.4Electricity . . . . . . . . . . . . . . . . . . . . . . . . 1.0 1.1 1.3 1.5 1.6 1.8 2.3Renewables. . . . . . . . . . . . . . . . . . . . . . 2.7 2.9 3.1 3.4 3.6 3.8 1.2
Total . . . . . . . . . . . . . . . . . . . . . . . . . . 7.7 8.8 9.4 10.1 10.6 11.3 1.4TransportationLiquids . . . . . . . . . . . . . . . . . . . . . . . . . . 3.4 4.3 4.5 5.0 5.6 6.2 2.2Natural gas . . . . . . . . . . . . . . . . . . . . . . 0.1 0.1 0.1 0.1 0.1 0.1 2.1Coal . . . . . . . . . . . . . . . . . . . . . . . . . . . . 0.0 0.0 0.0 0.0 0.0 0.0 —Electricity . . . . . . . . . . . . . . . . . . . . . . . . 0.0 0.0 0.0 0.0 0.0 0.0 2.8Total . . . . . . . . . . . . . . . . . . . . . . . . . . 3.5 4.4 4.6 5.1 5.7 6.3 2.2
All End-Use SectorsLiquids . . . . . . . . . . . . . . . . . . . . . . . . . . 5.7 6.6 6.8 7.4 8.1 8.9 1.6Natural gas . . . . . . . . . . . . . . . . . . . . . . 1.7 2.7 3.0 3.2 3.1 3.4 2.6Coal . . . . . . . . . . . . . . . . . . . . . . . . . . . . 1.3 1.3 1.4 1.5 1.6 1.6 0.7Electricity . . . . . . . . . . . . . . . . . . . . . . . . 1.8 2.2 2.5 2.9 3.3 3.7 2.7Renewables. . . . . . . . . . . . . . . . . . . . . . 2.7 2.9 3.1 3.4 3.6 3.8 1.2
Delivered Energy . . . . . . . . . . . . . . . 13.2 15.7 16.8 18.4 19.7 21.4 1.7Electricity-Related Losses . . . . . . . . . . . 4.6 5.2 5.6 6.2 6.8 7.6 1.8Total . . . . . . . . . . . . . . . . . . . . . . . . . . 17.8 20.8 22.5 24.6 26.5 29.0 1.8
Electric Powera
Liquids . . . . . . . . . . . . . . . . . . . . . . . . . . 0.7 0.6 0.6 0.6 0.5 0.5 -1.0Natural gas . . . . . . . . . . . . . . . . . . . . . . 1.7 2.4 3.1 3.7 3.9 4.0 3.2Coal . . . . . . . . . . . . . . . . . . . . . . . . . . . . 2.9 2.9 3.0 3.2 3.7 4.6 1.6Nuclear . . . . . . . . . . . . . . . . . . . . . . . . . 0.1 0.2 0.2 0.2 0.2 0.3 3.6Renewables. . . . . . . . . . . . . . . . . . . . . . 1.0 1.3 1.4 1.5 1.7 1.9 2.4
Total . . . . . . . . . . . . . . . . . . . . . . . . . . 6.4 7.3 8.2 9.2 10.1 11.3 2.1Total Energy ConsumptionLiquids . . . . . . . . . . . . . . . . . . . . . . . . . . 6.4 7.2 7.4 8.0 8.7 9.4 1.4Natural gas . . . . . . . . . . . . . . . . . . . . . . 3.3 5.1 6.1 6.9 7.1 7.4 2.9Coal . . . . . . . . . . . . . . . . . . . . . . . . . . . . 4.2 4.2 4.3 4.7 5.3 6.2 1.4Nuclear . . . . . . . . . . . . . . . . . . . . . . . . . 0.1 0.2 0.2 0.2 0.2 0.3 3.6Renewables. . . . . . . . . . . . . . . . . . . . . . 3.7 4.2 4.5 4.9 5.3 5.8 1.6
Total . . . . . . . . . . . . . . . . . . . . . . . . . . 17.8 20.8 22.5 24.6 26.5 29.0 1.8aFuel inputs used in the production of electricity and heat at central-station generators.Sources: 2007: Derived from U.S. Energy Information Administration (EIA), International Energy Statistics database (as of November 2009), web
site www.eia.gov/emeu/international; and International Energy Agency, “Balances of OECD and Non-OECD Statistics” (2009), web site www.iea.org(subscription site). Projections: EIA, World Energy Projection System Plus (2010).

Table F18. Delivered energy consumption in Brazil by end-use sector and fuel, 2007-2035(Quadrillion Btu)
Appendix F
244 U.S. Energy Information Administration / International Energy Outlook 2010
Sector/Fuel 2007
Projections Average annualpercent change,
2007-20352015 2020 2025 2030 2035ResidentialLiquids . . . . . . . . . . . . . . . . . . . . . . . . . . 0.3 0.3 0.3 0.4 0.4 0.4 1.5Natural gas . . . . . . . . . . . . . . . . . . . . . . 0.0 0.0 0.0 0.0 0.0 0.0 6.4Coal . . . . . . . . . . . . . . . . . . . . . . . . . . . . 0.0 0.0 0.0 0.0 0.0 0.0 —Electricity . . . . . . . . . . . . . . . . . . . . . . . . 0.3 0.5 0.6 0.7 0.8 0.9 3.4Renewables. . . . . . . . . . . . . . . . . . . . . . 0.0 0.0 0.0 0.0 0.0 0.0 —
Total . . . . . . . . . . . . . . . . . . . . . . . . . . 0.6 0.8 0.9 1.1 1.2 1.3 2.8CommercialLiquids . . . . . . . . . . . . . . . . . . . . . . . . . . 0.0 0.1 0.1 0.1 0.1 0.1 1.6Natural gas . . . . . . . . . . . . . . . . . . . . . . 0.0 0.0 0.0 0.0 0.0 0.0 4.1Coal . . . . . . . . . . . . . . . . . . . . . . . . . . . . 0.0 0.0 0.0 0.0 0.0 0.0 —Electricity . . . . . . . . . . . . . . . . . . . . . . . . 0.3 0.5 0.7 0.8 1.0 1.0 3.9Renewables. . . . . . . . . . . . . . . . . . . . . . 0.0 0.0 0.0 0.0 0.0 0.0 —
Total . . . . . . . . . . . . . . . . . . . . . . . . . . 0.4 0.6 0.8 0.9 1.1 1.1 3.7IndustrialLiquids . . . . . . . . . . . . . . . . . . . . . . . . . . 1.8 1.9 2.1 2.4 2.8 3.2 2.1Natural gas . . . . . . . . . . . . . . . . . . . . . . 0.4 0.5 0.6 0.6 0.6 0.7 1.6Coal . . . . . . . . . . . . . . . . . . . . . . . . . . . . 0.4 0.4 0.5 0.7 0.9 1.1 3.6Electricity . . . . . . . . . . . . . . . . . . . . . . . . 0.7 0.7 0.8 1.0 1.1 1.2 2.2Renewables. . . . . . . . . . . . . . . . . . . . . . 2.3 2.5 2.8 3.1 3.5 3.9 1.8
Total . . . . . . . . . . . . . . . . . . . . . . . . . . 5.6 6.1 6.8 7.8 8.8 10.1 2.1TransportationLiquids . . . . . . . . . . . . . . . . . . . . . . . . . . 2.7 3.4 3.6 3.9 4.2 4.4 1.8Natural gas . . . . . . . . . . . . . . . . . . . . . . 0.1 0.1 0.1 0.1 0.2 0.2 3.3Coal . . . . . . . . . . . . . . . . . . . . . . . . . . . . 0.0 0.0 0.0 0.0 0.0 0.0 —Electricity . . . . . . . . . . . . . . . . . . . . . . . . 0.0 0.0 0.0 0.0 0.0 0.0 2.2Total . . . . . . . . . . . . . . . . . . . . . . . . . . 2.8 3.5 3.7 4.0 4.4 4.6 1.8
All End-Use SectorsLiquids . . . . . . . . . . . . . . . . . . . . . . . . . . 4.8 5.7 6.1 6.7 7.4 8.0 1.9Natural gas . . . . . . . . . . . . . . . . . . . . . . 0.5 0.7 0.8 0.8 0.9 1.0 2.1Coal . . . . . . . . . . . . . . . . . . . . . . . . . . . . 0.4 0.4 0.5 0.7 0.9 1.1 3.6Electricity . . . . . . . . . . . . . . . . . . . . . . . . 1.4 1.8 2.1 2.5 2.8 3.1 3.0Renewables. . . . . . . . . . . . . . . . . . . . . . 2.3 2.5 2.8 3.1 3.5 3.9 1.8
Delivered Energy . . . . . . . . . . . . . . . 9.4 11.0 12.3 13.8 15.5 17.1 2.2Electricity-Related Losses . . . . . . . . . . . 2.9 3.8 4.6 5.5 6.4 7.2 3.3Total . . . . . . . . . . . . . . . . . . . . . . . . . . 12.3 14.9 16.9 19.3 21.9 24.3 2.4
Electric Powera
Liquids . . . . . . . . . . . . . . . . . . . . . . . . . . 0.1 0.1 0.1 0.1 0.1 0.1 -1.0Natural gas . . . . . . . . . . . . . . . . . . . . . . 0.2 0.4 0.8 1.0 1.3 1.4 7.4Coal . . . . . . . . . . . . . . . . . . . . . . . . . . . . 0.1 0.1 0.1 0.1 0.1 0.1 2.1Nuclear . . . . . . . . . . . . . . . . . . . . . . . . . 0.1 0.2 0.2 0.3 0.3 0.4 4.4Renewables. . . . . . . . . . . . . . . . . . . . . . 3.8 4.8 5.6 6.6 7.6 8.3 2.8
Total . . . . . . . . . . . . . . . . . . . . . . . . . . 4.3 5.6 6.7 8.0 9.3 10.3 3.2Total Energy ConsumptionLiquids . . . . . . . . . . . . . . . . . . . . . . . . . . 4.8 5.8 6.2 6.7 7.5 8.1 1.9Natural gas . . . . . . . . . . . . . . . . . . . . . . 0.7 1.1 1.5 1.8 2.1 2.4 4.3Coal . . . . . . . . . . . . . . . . . . . . . . . . . . . . 0.5 0.5 0.6 0.8 1.0 1.2 3.4Nuclear . . . . . . . . . . . . . . . . . . . . . . . . . 0.1 0.2 0.2 0.3 0.3 0.4 4.4Renewables. . . . . . . . . . . . . . . . . . . . . . 6.2 7.3 8.4 9.7 11.0 12.2 2.4
Total . . . . . . . . . . . . . . . . . . . . . . . . . . 12.3 14.9 16.9 19.3 21.9 24.3 2.4aFuel inputs used in the production of electricity and heat at central-station generators.Sources: 2007: Derived from U.S. Energy Information Administration (EIA), International Energy Statistics database (as of November 2009), web
site www.eia.gov/emeu/international; and International Energy Agency, “Balances of OECD and Non-OECD Statistics” (2009), web site www.iea.org(subscription site). Projections: EIA, World Energy Projection System Plus (2010).
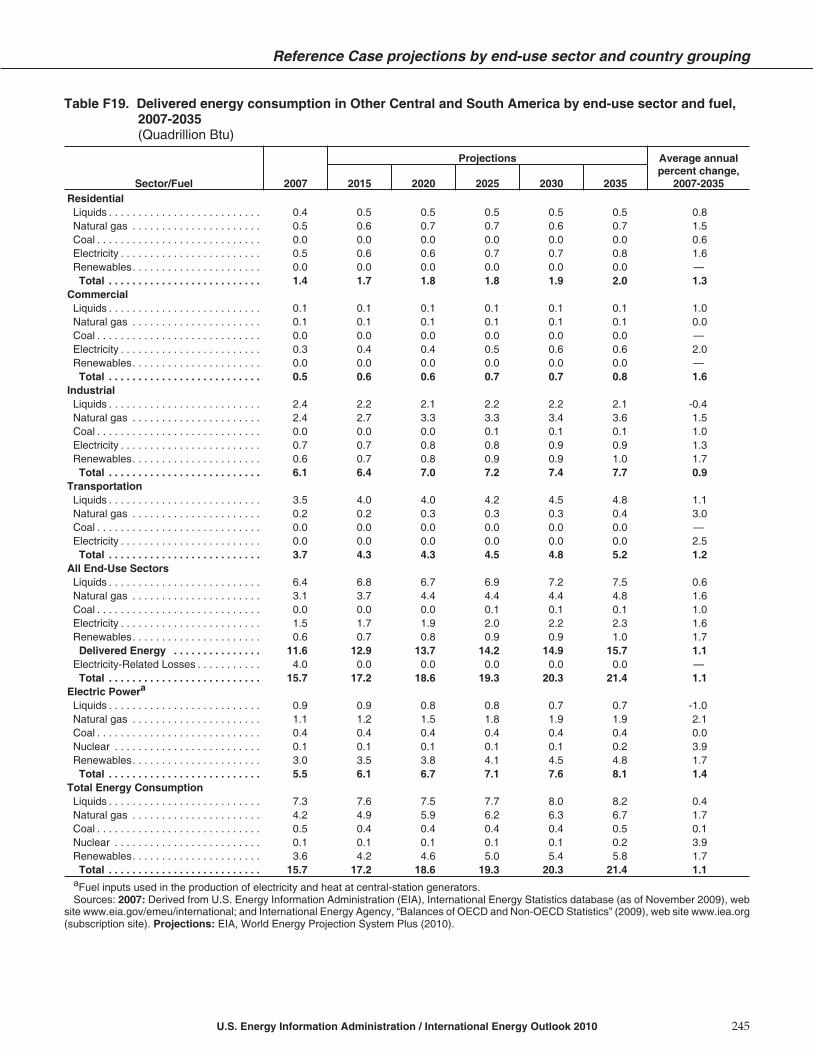
Table F19. Delivered energy consumption in Other Central and South America by end-use sector and fuel,2007-2035(Quadrillion Btu)
Reference Case projections by end-use sector and country grouping
U.S. Energy Information Administration / International Energy Outlook 2010 245
Sector/Fuel 2007
Projections Average annualpercent change,
2007-20352015 2020 2025 2030 2035ResidentialLiquids . . . . . . . . . . . . . . . . . . . . . . . . . . 0.4 0.5 0.5 0.5 0.5 0.5 0.8Natural gas . . . . . . . . . . . . . . . . . . . . . . 0.5 0.6 0.7 0.7 0.6 0.7 1.5Coal . . . . . . . . . . . . . . . . . . . . . . . . . . . . 0.0 0.0 0.0 0.0 0.0 0.0 0.6Electricity . . . . . . . . . . . . . . . . . . . . . . . . 0.5 0.6 0.6 0.7 0.7 0.8 1.6Renewables. . . . . . . . . . . . . . . . . . . . . . 0.0 0.0 0.0 0.0 0.0 0.0 —
Total . . . . . . . . . . . . . . . . . . . . . . . . . . 1.4 1.7 1.8 1.8 1.9 2.0 1.3CommercialLiquids . . . . . . . . . . . . . . . . . . . . . . . . . . 0.1 0.1 0.1 0.1 0.1 0.1 1.0Natural gas . . . . . . . . . . . . . . . . . . . . . . 0.1 0.1 0.1 0.1 0.1 0.1 0.0Coal . . . . . . . . . . . . . . . . . . . . . . . . . . . . 0.0 0.0 0.0 0.0 0.0 0.0 —Electricity . . . . . . . . . . . . . . . . . . . . . . . . 0.3 0.4 0.4 0.5 0.6 0.6 2.0Renewables. . . . . . . . . . . . . . . . . . . . . . 0.0 0.0 0.0 0.0 0.0 0.0 —
Total . . . . . . . . . . . . . . . . . . . . . . . . . . 0.5 0.6 0.6 0.7 0.7 0.8 1.6IndustrialLiquids . . . . . . . . . . . . . . . . . . . . . . . . . . 2.4 2.2 2.1 2.2 2.2 2.1 -0.4Natural gas . . . . . . . . . . . . . . . . . . . . . . 2.4 2.7 3.3 3.3 3.4 3.6 1.5Coal . . . . . . . . . . . . . . . . . . . . . . . . . . . . 0.0 0.0 0.0 0.1 0.1 0.1 1.0Electricity . . . . . . . . . . . . . . . . . . . . . . . . 0.7 0.7 0.8 0.8 0.9 0.9 1.3Renewables. . . . . . . . . . . . . . . . . . . . . . 0.6 0.7 0.8 0.9 0.9 1.0 1.7
Total . . . . . . . . . . . . . . . . . . . . . . . . . . 6.1 6.4 7.0 7.2 7.4 7.7 0.9TransportationLiquids . . . . . . . . . . . . . . . . . . . . . . . . . . 3.5 4.0 4.0 4.2 4.5 4.8 1.1Natural gas . . . . . . . . . . . . . . . . . . . . . . 0.2 0.2 0.3 0.3 0.3 0.4 3.0Coal . . . . . . . . . . . . . . . . . . . . . . . . . . . . 0.0 0.0 0.0 0.0 0.0 0.0 —Electricity . . . . . . . . . . . . . . . . . . . . . . . . 0.0 0.0 0.0 0.0 0.0 0.0 2.5Total . . . . . . . . . . . . . . . . . . . . . . . . . . 3.7 4.3 4.3 4.5 4.8 5.2 1.2
All End-Use SectorsLiquids . . . . . . . . . . . . . . . . . . . . . . . . . . 6.4 6.8 6.7 6.9 7.2 7.5 0.6Natural gas . . . . . . . . . . . . . . . . . . . . . . 3.1 3.7 4.4 4.4 4.4 4.8 1.6Coal . . . . . . . . . . . . . . . . . . . . . . . . . . . . 0.0 0.0 0.0 0.1 0.1 0.1 1.0Electricity . . . . . . . . . . . . . . . . . . . . . . . . 1.5 1.7 1.9 2.0 2.2 2.3 1.6Renewables. . . . . . . . . . . . . . . . . . . . . . 0.6 0.7 0.8 0.9 0.9 1.0 1.7
Delivered Energy . . . . . . . . . . . . . . . 11.6 12.9 13.7 14.2 14.9 15.7 1.1Electricity-Related Losses . . . . . . . . . . . 4.0 0.0 0.0 0.0 0.0 0.0 —Total . . . . . . . . . . . . . . . . . . . . . . . . . . 15.7 17.2 18.6 19.3 20.3 21.4 1.1
Electric Powera
Liquids . . . . . . . . . . . . . . . . . . . . . . . . . . 0.9 0.9 0.8 0.8 0.7 0.7 -1.0Natural gas . . . . . . . . . . . . . . . . . . . . . . 1.1 1.2 1.5 1.8 1.9 1.9 2.1Coal . . . . . . . . . . . . . . . . . . . . . . . . . . . . 0.4 0.4 0.4 0.4 0.4 0.4 0.0Nuclear . . . . . . . . . . . . . . . . . . . . . . . . . 0.1 0.1 0.1 0.1 0.1 0.2 3.9Renewables. . . . . . . . . . . . . . . . . . . . . . 3.0 3.5 3.8 4.1 4.5 4.8 1.7
Total . . . . . . . . . . . . . . . . . . . . . . . . . . 5.5 6.1 6.7 7.1 7.6 8.1 1.4Total Energy ConsumptionLiquids . . . . . . . . . . . . . . . . . . . . . . . . . . 7.3 7.6 7.5 7.7 8.0 8.2 0.4Natural gas . . . . . . . . . . . . . . . . . . . . . . 4.2 4.9 5.9 6.2 6.3 6.7 1.7Coal . . . . . . . . . . . . . . . . . . . . . . . . . . . . 0.5 0.4 0.4 0.4 0.4 0.5 0.1Nuclear . . . . . . . . . . . . . . . . . . . . . . . . . 0.1 0.1 0.1 0.1 0.1 0.2 3.9Renewables. . . . . . . . . . . . . . . . . . . . . . 3.6 4.2 4.6 5.0 5.4 5.8 1.7
Total . . . . . . . . . . . . . . . . . . . . . . . . . . 15.7 17.2 18.6 19.3 20.3 21.4 1.1aFuel inputs used in the production of electricity and heat at central-station generators.Sources: 2007: Derived from U.S. Energy Information Administration (EIA), International Energy Statistics database (as of November 2009), web
site www.eia.gov/emeu/international; and International Energy Agency, “Balances of OECD and Non-OECD Statistics” (2009), web site www.iea.org(subscription site). Projections: EIA, World Energy Projection System Plus (2010).

This page intentionally left blank.
Appendix G
Projections of Liquid Fuels and Other PetroleumProduction in Five Cases:
• Reference• High Oil Price• Low Oil Price• High Economic Growth• Low Economic Growth

This page intentionally left blank.
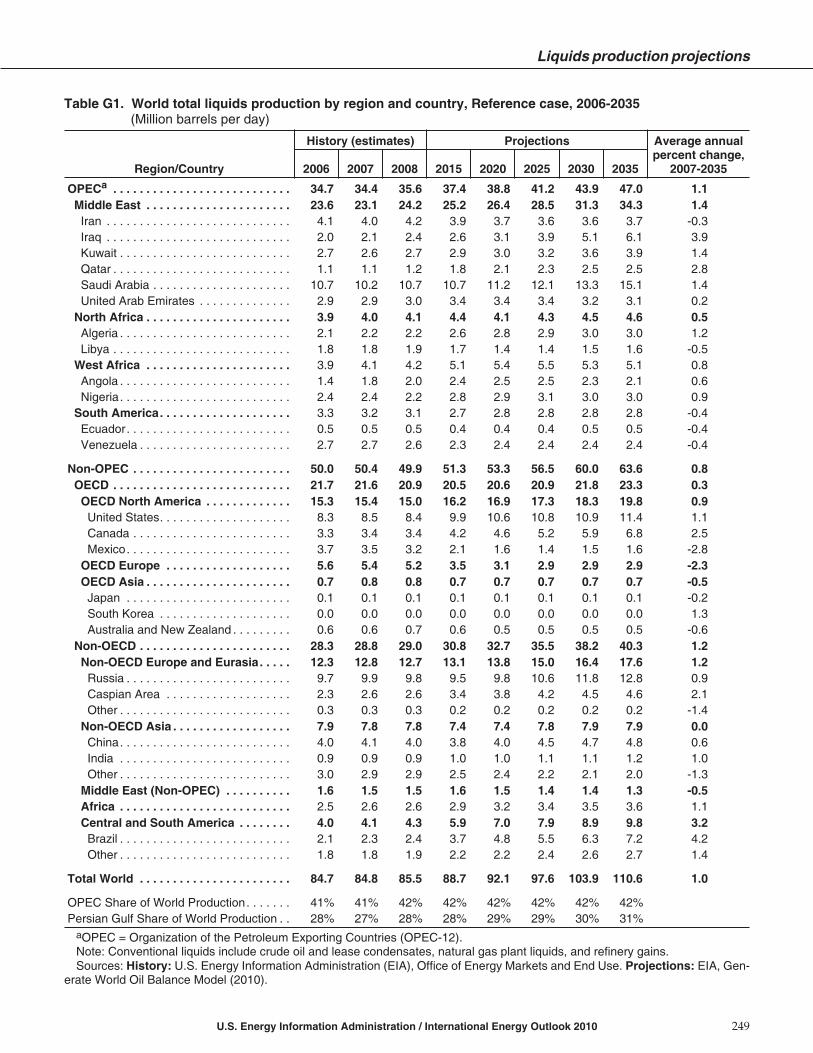
Table G1. World total liquids production by region and country, Reference case, 2006-2035(Million barrels per day)
Liquids production projections
U.S. Energy Information Administration / International Energy Outlook 2010 249
Region/Country
History (estimates) Projections Average annualpercent change,
2007-20352006 2007 2008 2015 2020 2025 2030 2035
OPECa . . . . . . . . . . . . . . . . . . . . . . . . . . . 34.7 34.4 35.6 37.4 38.8 41.2 43.9 47.0 1.1Middle East . . . . . . . . . . . . . . . . . . . . . . 23.6 23.1 24.2 25.2 26.4 28.5 31.3 34.3 1.4Iran . . . . . . . . . . . . . . . . . . . . . . . . . . . . 4.1 4.0 4.2 3.9 3.7 3.6 3.6 3.7 -0.3Iraq . . . . . . . . . . . . . . . . . . . . . . . . . . . . 2.0 2.1 2.4 2.6 3.1 3.9 5.1 6.1 3.9Kuwait . . . . . . . . . . . . . . . . . . . . . . . . . . 2.7 2.6 2.7 2.9 3.0 3.2 3.6 3.9 1.4Qatar . . . . . . . . . . . . . . . . . . . . . . . . . . . 1.1 1.1 1.2 1.8 2.1 2.3 2.5 2.5 2.8Saudi Arabia . . . . . . . . . . . . . . . . . . . . . 10.7 10.2 10.7 10.7 11.2 12.1 13.3 15.1 1.4United Arab Emirates . . . . . . . . . . . . . . 2.9 2.9 3.0 3.4 3.4 3.4 3.2 3.1 0.2
North Africa . . . . . . . . . . . . . . . . . . . . . . 3.9 4.0 4.1 4.4 4.1 4.3 4.5 4.6 0.5Algeria . . . . . . . . . . . . . . . . . . . . . . . . . . 2.1 2.2 2.2 2.6 2.8 2.9 3.0 3.0 1.2Libya . . . . . . . . . . . . . . . . . . . . . . . . . . . 1.8 1.8 1.9 1.7 1.4 1.4 1.5 1.6 -0.5
West Africa . . . . . . . . . . . . . . . . . . . . . . 3.9 4.1 4.2 5.1 5.4 5.5 5.3 5.1 0.8Angola . . . . . . . . . . . . . . . . . . . . . . . . . . 1.4 1.8 2.0 2.4 2.5 2.5 2.3 2.1 0.6Nigeria. . . . . . . . . . . . . . . . . . . . . . . . . . 2.4 2.4 2.2 2.8 2.9 3.1 3.0 3.0 0.9
South America. . . . . . . . . . . . . . . . . . . . 3.3 3.2 3.1 2.7 2.8 2.8 2.8 2.8 -0.4Ecuador. . . . . . . . . . . . . . . . . . . . . . . . . 0.5 0.5 0.5 0.4 0.4 0.4 0.5 0.5 -0.4Venezuela . . . . . . . . . . . . . . . . . . . . . . . 2.7 2.7 2.6 2.3 2.4 2.4 2.4 2.4 -0.4
Non-OPEC . . . . . . . . . . . . . . . . . . . . . . . . 50.0 50.4 49.9 51.3 53.3 56.5 60.0 63.6 0.8OECD . . . . . . . . . . . . . . . . . . . . . . . . . . . 21.7 21.6 20.9 20.5 20.6 20.9 21.8 23.3 0.3OECD North America . . . . . . . . . . . . . 15.3 15.4 15.0 16.2 16.9 17.3 18.3 19.8 0.9United States. . . . . . . . . . . . . . . . . . . . 8.3 8.5 8.4 9.9 10.6 10.8 10.9 11.4 1.1Canada . . . . . . . . . . . . . . . . . . . . . . . . 3.3 3.4 3.4 4.2 4.6 5.2 5.9 6.8 2.5Mexico. . . . . . . . . . . . . . . . . . . . . . . . . 3.7 3.5 3.2 2.1 1.6 1.4 1.5 1.6 -2.8
OECD Europe . . . . . . . . . . . . . . . . . . . 5.6 5.4 5.2 3.5 3.1 2.9 2.9 2.9 -2.3OECD Asia . . . . . . . . . . . . . . . . . . . . . . 0.7 0.8 0.8 0.7 0.7 0.7 0.7 0.7 -0.5Japan . . . . . . . . . . . . . . . . . . . . . . . . . 0.1 0.1 0.1 0.1 0.1 0.1 0.1 0.1 -0.2South Korea . . . . . . . . . . . . . . . . . . . . 0.0 0.0 0.0 0.0 0.0 0.0 0.0 0.0 1.3Australia and New Zealand . . . . . . . . . 0.6 0.6 0.7 0.6 0.5 0.5 0.5 0.5 -0.6
Non-OECD . . . . . . . . . . . . . . . . . . . . . . . 28.3 28.8 29.0 30.8 32.7 35.5 38.2 40.3 1.2Non-OECD Europe and Eurasia. . . . . 12.3 12.8 12.7 13.1 13.8 15.0 16.4 17.6 1.2
Russia . . . . . . . . . . . . . . . . . . . . . . . . . 9.7 9.9 9.8 9.5 9.8 10.6 11.8 12.8 0.9Caspian Area . . . . . . . . . . . . . . . . . . . 2.3 2.6 2.6 3.4 3.8 4.2 4.5 4.6 2.1Other . . . . . . . . . . . . . . . . . . . . . . . . . . 0.3 0.3 0.3 0.2 0.2 0.2 0.2 0.2 -1.4
Non-OECD Asia . . . . . . . . . . . . . . . . . . 7.9 7.8 7.8 7.4 7.4 7.8 7.9 7.9 0.0China. . . . . . . . . . . . . . . . . . . . . . . . . . 4.0 4.1 4.0 3.8 4.0 4.5 4.7 4.8 0.6India . . . . . . . . . . . . . . . . . . . . . . . . . . 0.9 0.9 0.9 1.0 1.0 1.1 1.1 1.2 1.0Other . . . . . . . . . . . . . . . . . . . . . . . . . . 3.0 2.9 2.9 2.5 2.4 2.2 2.1 2.0 -1.3
Middle East (Non-OPEC) . . . . . . . . . . 1.6 1.5 1.5 1.6 1.5 1.4 1.4 1.3 -0.5Africa . . . . . . . . . . . . . . . . . . . . . . . . . . 2.5 2.6 2.6 2.9 3.2 3.4 3.5 3.6 1.1Central and South America . . . . . . . . 4.0 4.1 4.3 5.9 7.0 7.9 8.9 9.8 3.2Brazil . . . . . . . . . . . . . . . . . . . . . . . . . . 2.1 2.3 2.4 3.7 4.8 5.5 6.3 7.2 4.2Other . . . . . . . . . . . . . . . . . . . . . . . . . . 1.8 1.8 1.9 2.2 2.2 2.4 2.6 2.7 1.4
Total World . . . . . . . . . . . . . . . . . . . . . . . 84.7 84.8 85.5 88.7 92.1 97.6 103.9 110.6 1.0
OPEC Share of World Production. . . . . . . 41% 41% 42% 42% 42% 42% 42% 42%Persian Gulf Share of World Production . . 28% 27% 28% 28% 29% 29% 30% 31%
aOPEC = Organization of the Petroleum Exporting Countries (OPEC-12).Note: Conventional liquids include crude oil and lease condensates, natural gas plant liquids, and refinery gains.Sources: History: U.S. Energy Information Administration (EIA), Office of Energy Markets and End Use. Projections: EIA, Gen-
erate World Oil Balance Model (2010).

Table G2. World conventional liquids production by region and country, Reference case, 2006-2035(Million barrels per day)
Appendix G
250 U.S. Energy Information Administration / International Energy Outlook 2010
Region/Country
History (estimates) Projections Average annualpercent change,
2007-20352006 2007 2008 2015 2020 2025 2030 2035
OPECa . . . . . . . . . . . . . . . . . . . . . . . . . . . 34.1 33.8 35.0 36.4 37.5 39.7 42.3 45.3 1.0Middle East . . . . . . . . . . . . . . . . . . . . . . 23.6 23.1 24.2 25.0 26.2 28.2 31.0 34.1 1.4Iran . . . . . . . . . . . . . . . . . . . . . . . . . . . . 4.1 4.0 4.2 3.9 3.7 3.6 3.6 3.7 -0.3Iraq . . . . . . . . . . . . . . . . . . . . . . . . . . . . 2.0 2.1 2.4 2.6 3.1 3.9 5.1 6.1 3.9Kuwait . . . . . . . . . . . . . . . . . . . . . . . . . . 2.7 2.6 2.7 2.9 3.0 3.2 3.6 3.9 1.4Qatar . . . . . . . . . . . . . . . . . . . . . . . . . . . 1.1 1.1 1.2 1.6 1.9 2.0 2.2 2.2 2.5Saudi Arabia . . . . . . . . . . . . . . . . . . . . . 10.7 10.2 10.7 10.7 11.2 12.1 13.3 15.1 1.4United Arab Emirates . . . . . . . . . . . . . . 2.9 2.9 3.0 3.4 3.4 3.4 3.2 3.1 0.2
North Africa . . . . . . . . . . . . . . . . . . . . . . 3.9 4.0 4.1 4.4 4.1 4.3 4.5 4.6 0.5Algeria . . . . . . . . . . . . . . . . . . . . . . . . . . 2.1 2.2 2.2 2.6 2.8 2.9 3.0 3.0 1.2Libya . . . . . . . . . . . . . . . . . . . . . . . . . . . 1.8 1.8 1.9 1.7 1.4 1.4 1.5 1.6 -0.5
West Africa . . . . . . . . . . . . . . . . . . . . . . 3.9 4.1 4.2 5.1 5.4 5.5 5.3 5.1 0.8Angola . . . . . . . . . . . . . . . . . . . . . . . . . . 1.4 1.8 2.0 2.4 2.5 2.5 2.3 2.1 0.6Nigeria. . . . . . . . . . . . . . . . . . . . . . . . . . 2.4 2.4 2.2 2.7 2.9 3.0 3.0 3.0 0.9
South America. . . . . . . . . . . . . . . . . . . . 2.7 2.6 2.5 1.9 1.8 1.7 1.5 1.4 -2.1Ecuador. . . . . . . . . . . . . . . . . . . . . . . . . 0.5 0.5 0.5 0.4 0.4 0.4 0.5 0.5 -0.4Venezuela . . . . . . . . . . . . . . . . . . . . . . . 2.1 2.1 2.0 1.5 1.3 1.2 1.1 1.0 -2.7
Non-OPEC . . . . . . . . . . . . . . . . . . . . . . . . 47.7 47.7 46.6 46.2 47.0 48.8 50.8 52.5 0.3OECD . . . . . . . . . . . . . . . . . . . . . . . . . . . 20.0 19.6 18.5 16.8 16.2 15.7 15.6 15.5 -0.8OECD North America . . . . . . . . . . . . . 13.8 13.6 12.8 12.7 12.7 12.3 12.4 12.3 -0.4United States. . . . . . . . . . . . . . . . . . . . 8.0 8.0 7.8 8.9 9.4 9.3 9.4 9.2 0.5Canada . . . . . . . . . . . . . . . . . . . . . . . . 2.1 2.1 1.8 1.8 1.7 1.7 1.6 1.6 -0.9Mexico. . . . . . . . . . . . . . . . . . . . . . . . . 3.7 3.5 3.2 2.1 1.6 1.3 1.4 1.5 -2.9
OECD Europe . . . . . . . . . . . . . . . . . . . 5.5 5.2 5.0 3.3 2.8 2.7 2.6 2.6 -2.5Denmark . . . . . . . . . . . . . . . . . . . . . . . 0.3 0.3 0.3 0.2 0.1 0.1 0.1 0.1 -3.9Norway . . . . . . . . . . . . . . . . . . . . . . . . 2.8 2.6 2.5 1.8 1.5 1.4 1.3 1.3 -2.3United Kngdom . . . . . . . . . . . . . . . . . . 1.7 1.7 1.6 0.8 0.6 0.6 0.6 0.6 -3.5Other . . . . . . . . . . . . . . . . . . . . . . . . . . 0.7 0.7 0.6 0.5 0.5 0.5 0.5 0.5 -0.8
OECD Asia . . . . . . . . . . . . . . . . . . . . . . 0.7 0.8 0.8 0.7 0.7 0.7 0.7 0.7 -0.5Japan . . . . . . . . . . . . . . . . . . . . . . . . . 0.1 0.1 0.1 0.1 0.1 0.1 0.1 0.1 -0.2South Korea . . . . . . . . . . . . . . . . . . . . 0.0 0.0 0.0 0.0 0.0 0.0 0.0 0.0 0.5Australia and New Zealand . . . . . . . . . 0.6 0.6 0.7 0.6 0.5 0.5 0.5 0.5 -0.6
aOPEC = Organization of the Petroleum Exporting Countries (OPEC-12).

Table G2. World conventional liquids production by region and country, Reference case, 2006-2035(continued)(Million barrels per day)
Liquids production projections
U.S. Energy Information Administration / International Energy Outlook 2010 251
Region/Country
History (estimates) Projections Average annualpercent change,
2007-20352006 2007 2008 2015 2020 2025 2030 2035
Non-OECD . . . . . . . . . . . . . . . . . . . . . . . 27.7 28.1 28.1 29.4 30.9 33.1 35.1 36.9 1.0Non-OECD Europe and Eurasia. . . . . 12.3 12.8 12.7 13.1 13.8 15.0 16.4 17.6 1.2
Russia . . . . . . . . . . . . . . . . . . . . . . . . 9.7 9.9 9.8 9.5 9.8 10.6 11.8 12.8 0.9Caspian Area . . . . . . . . . . . . . . . . . . . 2.3 2.6 2.6 3.4 3.8 4.2 4.5 4.6 2.1
Azerbaijan . . . . . . . . . . . . . . . . . . . . . 0.6 0.8 0.9 1.2 1.3 1.2 1.2 1.1 0.8Kazakhstan . . . . . . . . . . . . . . . . . . . . 1.4 1.4 1.4 1.9 2.3 2.6 2.9 3.1 2.8Turkmenistan . . . . . . . . . . . . . . . . . . 0.2 0.2 0.2 0.2 0.2 0.3 0.4 0.4 2.6Uzbekistan . . . . . . . . . . . . . . . . . . . . 0.1 0.1 0.1 0.0 0.0 0.0 0.0 0.0 -3.3
Other. . . . . . . . . . . . . . . . . . . . . . . . . . 0.3 0.3 0.3 0.2 0.2 0.2 0.2 0.2 -1.6Non-OECD Asia . . . . . . . . . . . . . . . . . . 7.7 7.7 7.7 7.2 7.1 7.2 7.0 6.7 -0.5China. . . . . . . . . . . . . . . . . . . . . . . . . . 3.9 3.9 4.0 3.8 3.8 4.1 4.0 3.8 -0.1India . . . . . . . . . . . . . . . . . . . . . . . . . . 0.9 0.9 0.9 1.0 0.9 1.0 1.0 1.0 0.6Brunei . . . . . . . . . . . . . . . . . . . . . . . . . 0.2 0.2 0.2 0.1 0.1 0.1 0.1 0.1 -2.4Malaysia . . . . . . . . . . . . . . . . . . . . . . . 0.7 0.7 0.7 0.6 0.6 0.6 0.6 0.6 -0.7Thailand . . . . . . . . . . . . . . . . . . . . . . . 0.3 0.3 0.4 0.4 0.4 0.4 0.3 0.3 -0.2Vietnam . . . . . . . . . . . . . . . . . . . . . . . . 0.4 0.4 0.3 0.4 0.3 0.3 0.3 0.2 -1.3Other . . . . . . . . . . . . . . . . . . . . . . . . . . 1.4 1.3 1.3 1.0 0.9 0.8 0.7 0.7 -2.1
Middle East (Non-OPEC) . . . . . . . . . . 1.6 1.5 1.5 1.6 1.5 1.4 1.4 1.3 -0.5Oman . . . . . . . . . . . . . . . . . . . . . . . . . 0.7 0.7 0.8 0.9 0.8 0.8 0.8 0.8 0.2Syria . . . . . . . . . . . . . . . . . . . . . . . . . . 0.4 0.4 0.4 0.4 0.3 0.3 0.3 0.3 -1.8Yemen. . . . . . . . . . . . . . . . . . . . . . . . . 0.4 0.3 0.3 0.2 0.2 0.2 0.1 0.1 -2.9Other . . . . . . . . . . . . . . . . . . . . . . . . . . 0.1 0.1 0.1 0.1 0.1 0.2 0.2 0.2 4.0
Africa . . . . . . . . . . . . . . . . . . . . . . . . . . 2.4 2.4 2.4 2.7 2.8 3.0 3.1 3.2 1.0Chad . . . . . . . . . . . . . . . . . . . . . . . . . . 0.2 0.1 0.1 0.1 0.1 0.1 0.1 0.1 -3.4Congo (Brazzaville) . . . . . . . . . . . . . . . 0.2 0.2 0.2 0.3 0.3 0.2 0.2 0.2 0.0Egypt . . . . . . . . . . . . . . . . . . . . . . . . . . 0.7 0.7 0.6 0.5 0.6 0.7 0.7 0.7 0.1Equatorial Guniea . . . . . . . . . . . . . . . . 0.4 0.4 0.4 0.4 0.4 0.4 0.3 0.3 -0.3Gabon . . . . . . . . . . . . . . . . . . . . . . . . . 0.2 0.2 0.2 0.2 0.2 0.2 0.2 0.2 -1.4Sao Tome and Principe. . . . . . . . . . . . 0.0 0.0 0.0 0.0 0.0 0.0 0.1 0.1 —Sudan . . . . . . . . . . . . . . . . . . . . . . . . . 0.4 0.5 0.5 0.5 0.6 0.7 0.8 0.9 2.4Other . . . . . . . . . . . . . . . . . . . . . . . . . . 0.3 0.3 0.3 0.7 0.7 0.8 0.8 0.8 3.3
Central and South America . . . . . . . . 3.7 3.7 3.8 4.9 5.7 6.4 7.3 8.1 2.8Brazil . . . . . . . . . . . . . . . . . . . . . . . . . . 1.9 1.9 1.9 2.8 3.6 4.1 4.7 5.5 3.8Argentina. . . . . . . . . . . . . . . . . . . . . . . 0.8 0.8 0.8 0.6 0.6 0.6 0.5 0.5 -1.4Colombia . . . . . . . . . . . . . . . . . . . . . . . 0.5 0.5 0.6 0.8 0.7 0.7 0.7 0.6 0.6Peru. . . . . . . . . . . . . . . . . . . . . . . . . . . 0.1 0.1 0.1 0.2 0.3 0.3 0.4 0.4 4.2Trinidad and Tobago . . . . . . . . . . . . . . 0.2 0.2 0.2 0.2 0.2 0.2 0.2 0.2 1.0Other . . . . . . . . . . . . . . . . . . . . . . . . . . 0.2 0.2 0.2 0.2 0.3 0.5 0.8 0.8 5.6
Total World . . . . . . . . . . . . . . . . . . . . . . . 81.8 81.4 81.6 82.6 84.5 88.5 93.1 97.7 0.7
OPEC Share of World Production. . . . . . . 42% 41% 43% 44% 44% 45% 45% 46%Persian Gulf Share of World Production . . 29% 28% 30% 30% 31% 32% 33% 35%
Note: Conventional liquids include crude oil and lease condensate, natural gas plant liquids, and refinery gain.Sources: History: U.S. Energy Information Administration (EIA), Office of Energy Markets and End Use. Projections: EIA, Gen-
erate World Oil Balance Model (2010).

Table G3. World unconventional liquids production by region and country, Reference case, 2006-2035(Million barrels per day)
Appendix G
252 U.S. Energy Information Administration / International Energy Outlook 2010
Region/Country
History (estimates) Projections Average annualpercent change,
2007-20352006 2007 2008 2015 2020 2025 2030 2035
OPECa . . . . . . . . . . . . . . . . . . . . . . . . . . . 0.6 0.6 0.7 1.0 1.3 1.4 1.6 1.7 3.8Biofuels . . . . . . . . . . . . . . . . . . . . . . . . . . 0.0 0.0 0.0 0.0 0.0 0.0 0.0 0.0 —Extra-Heavy Oil (Venezuela). . . . . . . . . . 0.6 0.6 0.7 0.8 1.1 1.2 1.3 1.4 3.1Coal-to-Liquids . . . . . . . . . . . . . . . . . . . . 0.0 0.0 0.0 0.0 0.0 0.0 0.0 0.0 —Gas-to-Liquids (primarily Qatar) . . . . . . . 0.0 0.0 0.0 0.2 0.2 0.3 0.3 0.3 15.4
Non-OPEC . . . . . . . . . . . . . . . . . . . . . . . . 2.3 2.8 3.3 5.1 6.3 7.7 9.2 11.2 5.1OECD . . . . . . . . . . . . . . . . . . . . . . . . . . . 1.7 2.0 2.4 3.7 4.4 5.2 6.2 7.8 4.9Biofuels . . . . . . . . . . . . . . . . . . . . . . . . . 0.5 0.6 0.9 1.3 1.4 1.5 1.6 1.9 4.0Oil Sands/Bitumen (Canada) . . . . . . . . 1.2 1.4 1.5 2.4 2.9 3.5 4.2 5.2 4.8Extra-Heavy Oil (Mexico) . . . . . . . . . . . 0.0 0.0 0.0 0.0 0.0 0.1 0.1 0.1 9.8Coal-to-Liquids . . . . . . . . . . . . . . . . . . . 0.0 0.0 0.0 0.1 0.1 0.2 0.2 0.2 21.3Gas-to-Liquids. . . . . . . . . . . . . . . . . . . . 0.0 0.0 0.0 0.0 0.0 0.0 0.0 0.0 —Shale Oil . . . . . . . . . . . . . . . . . . . . . . . . 0.0 0.0 0.0 0.0 0.0 0.1 0.1 0.4 —
Non-OECD . . . . . . . . . . . . . . . . . . . . . . . 0.6 0.7 0.9 1.4 1.9 2.4 3.0 3.4 5.6Biofuels . . . . . . . . . . . . . . . . . . . . . . . . . 0.4 0.5 0.6 1.1 1.4 1.7 2.0 2.1 5.1Extra-Heavy Oil . . . . . . . . . . . . . . . . . . . 0.0 0.0 0.0 0.0 0.0 0.0 0.0 0.0 —Coal-to-Liquids . . . . . . . . . . . . . . . . . . . 0.1 0.2 0.2 0.2 0.4 0.7 0.9 1.1 7.2Gas-to-Liquids. . . . . . . . . . . . . . . . . . . . 0.0 0.0 0.0 0.1 0.1 0.1 0.1 0.1 2.3Shale Oil . . . . . . . . . . . . . . . . . . . . . . . . 0.0 0.0 0.0 0.0 0.0 0.0 0.0 0.0 0.5
WorldBiofuels . . . . . . . . . . . . . . . . . . . . . . . . . . 0.9 1.2 1.5 2.4 2.8 3.2 3.5 4.1 4.6Oil Sands/Bitumen . . . . . . . . . . . . . . . . . 1.2 1.4 1.5 2.4 2.9 3.5 4.2 5.2 4.8Extra-Heavy Oil . . . . . . . . . . . . . . . . . . . . 0.6 0.6 0.7 0.8 1.1 1.2 1.4 1.5 3.3Coal-to-Liquids . . . . . . . . . . . . . . . . . . . . 0.1 0.2 0.2 0.3 0.5 0.8 1.1 1.4 7.9Gas-to-Liquids. . . . . . . . . . . . . . . . . . . . . 0.0 0.1 0.1 0.3 0.3 0.3 0.4 0.4 7.3Shale Oil . . . . . . . . . . . . . . . . . . . . . . . . . 0.0 0.0 0.0 0.0 0.0 0.1 0.2 0.4 15.6
World Total . . . . . . . . . . . . . . . . . . . . . . . 2.9 3.4 3.9 6.1 7.6 9.1 10.8 12.9 4.9
Selected Country HighlightsBiofuelsBrazil . . . . . . . . . . . . . . . . . . . . . . . . . . . 0.3 0.3 0.5 0.9 1.1 1.4 1.5 1.7 5.9China. . . . . . . . . . . . . . . . . . . . . . . . . . . 0.1 0.2 0.0 0.0 0.1 0.1 0.2 0.3 1.7India . . . . . . . . . . . . . . . . . . . . . . . . . . . 0.0 0.0 0.0 0.0 0.0 0.0 0.0 0.0 8.6United States. . . . . . . . . . . . . . . . . . . . . 0.3 0.5 0.7 1.0 1.1 1.2 1.2 1.6 4.6
Coal-to-LiquidsAustralia and New Zealand . . . . . . . . . . 0.0 0.0 0.0 0.0 0.0 0.0 0.0 0.0 —China. . . . . . . . . . . . . . . . . . . . . . . . . . . 0.0 0.0 0.0 0.0 0.1 0.3 0.5 0.7 —Germany . . . . . . . . . . . . . . . . . . . . . . . . 0.0 0.0 0.0 0.0 0.0 0.0 0.0 0.0 0.3India . . . . . . . . . . . . . . . . . . . . . . . . . . . 0.0 0.0 0.0 0.0 0.0 0.1 0.1 0.1 —South Africa. . . . . . . . . . . . . . . . . . . . . . 0.1 0.2 0.2 0.2 0.3 0.3 0.3 0.3 2.0United States. . . . . . . . . . . . . . . . . . . . . 0.0 0.0 0.0 0.1 0.1 0.2 0.2 0.2 —
Gas-to-LiquidsQatar . . . . . . . . . . . . . . . . . . . . . . . . . . . 0.0 0.0 0.0 0.2 0.2 0.2 0.2 0.2 14.9South Africa. . . . . . . . . . . . . . . . . . . . . . 0.0 0.0 0.0 0.1 0.1 0.1 0.1 0.1 1.0
aOPEC = Organization of the Petroleum Exporting Countries (OPEC-12).Sources: History: U.S. Energy Information Administration (EIA), Office of Energy Markets and End Use. Projections: EIA, Gen-
erate World Oil Balance Model (2010).

Table G4. World total liquids production by region and country, High Oil Price case, 2006-2035(Million barrels per day)
Liquids production projections
U.S. Energy Information Administration / International Energy Outlook 2010 253
Region/Country
History (estimates) Projections Average annualpercent change,
2007-20352006 2007 2008 2015 2020 2025 2030 2035
OPECa . . . . . . . . . . . . . . . . . . . . . . . . . . . 34.7 34.4 35.6 32.0 30.6 31.1 31.7 33.0 -0.1Middle East . . . . . . . . . . . . . . . . . . . . . . 23.6 23.1 24.2 21.8 21.3 22.0 23.0 24.6 0.2Iran . . . . . . . . . . . . . . . . . . . . . . . . . . . . 4.1 4.0 4.2 3.3 2.9 2.7 2.6 2.6 -1.6Iraq . . . . . . . . . . . . . . . . . . . . . . . . . . . . 2.0 2.1 2.4 2.4 2.5 2.8 3.6 4.2 2.5Kuwait . . . . . . . . . . . . . . . . . . . . . . . . . . 2.7 2.6 2.7 2.4 2.3 2.4 2.6 2.7 0.1Qatar . . . . . . . . . . . . . . . . . . . . . . . . . . . 1.1 1.1 1.2 1.6 1.7 1.8 1.9 1.9 1.9Saudi Arabia . . . . . . . . . . . . . . . . . . . . . 10.7 10.2 10.7 9.3 9.2 9.6 10.0 11.0 0.3United Arab Emirates . . . . . . . . . . . . . . 2.9 2.9 3.0 3.0 2.7 2.6 2.3 2.2 -1.0
North Africa . . . . . . . . . . . . . . . . . . . . . . 3.9 4.0 4.1 3.8 3.3 3.3 3.3 3.4 -0.6Algeria . . . . . . . . . . . . . . . . . . . . . . . . . . 2.1 2.2 2.2 2.3 2.3 2.3 2.3 2.2 0.1Libya . . . . . . . . . . . . . . . . . . . . . . . . . . . 1.8 1.8 1.9 1.5 1.1 1.0 1.1 1.1 -1.7
West Africa . . . . . . . . . . . . . . . . . . . . . . 3.9 4.1 4.2 4.3 4.2 4.1 3.7 3.5 -0.5Angola . . . . . . . . . . . . . . . . . . . . . . . . . . 1.4 1.8 2.0 2.0 1.9 1.9 1.6 1.5 -0.6Nigeria. . . . . . . . . . . . . . . . . . . . . . . . . . 2.4 2.4 2.2 2.3 2.2 2.2 2.1 2.1 -0.5
South America. . . . . . . . . . . . . . . . . . . . 3.3 3.2 3.1 2.1 1.8 1.7 1.6 1.5 -2.7Ecuador. . . . . . . . . . . . . . . . . . . . . . . . . 0.5 0.5 0.5 0.3 0.3 0.3 0.3 0.3 -1.7Venezuela . . . . . . . . . . . . . . . . . . . . . . . 2.7 2.7 2.6 1.8 1.5 1.4 1.3 1.2 -2.9
Non-OPEC . . . . . . . . . . . . . . . . . . . . . . . . 50.0 50.4 49.9 51.4 51.5 54.6 58.8 62.5 0.8OECD . . . . . . . . . . . . . . . . . . . . . . . . . . . 21.7 21.6 20.9 22.1 23.4 25.0 26.6 27.8 0.9OECD North America . . . . . . . . . . . . . 15.3 15.4 15.0 17.7 19.7 21.5 23.2 24.3 1.6United States. . . . . . . . . . . . . . . . . . . . 8.3 8.5 8.4 10.3 11.7 13.0 14.1 14.6 1.9Canada . . . . . . . . . . . . . . . . . . . . . . . . 3.3 3.4 3.4 5.5 6.7 7.4 8.0 8.6 3.3Mexico. . . . . . . . . . . . . . . . . . . . . . . . . 3.7 3.5 3.2 1.9 1.3 1.0 1.1 1.2 -3.8
OECD Europe . . . . . . . . . . . . . . . . . . . 5.6 5.4 5.2 3.7 3.0 2.9 2.8 2.8 -2.3OECD Asia . . . . . . . . . . . . . . . . . . . . . . 0.7 0.8 0.8 0.7 0.7 0.6 0.6 0.7 -0.7Japan . . . . . . . . . . . . . . . . . . . . . . . . . 0.1 0.1 0.1 0.1 0.1 0.1 0.1 0.1 -1.0South Korea . . . . . . . . . . . . . . . . . . . . 0.0 0.0 0.0 0.0 0.0 0.0 0.0 0.0 0.8Australia and New Zealand . . . . . . . . . 0.6 0.6 0.7 0.6 0.5 0.5 0.5 0.5 -0.6
Non-OECD . . . . . . . . . . . . . . . . . . . . . . . 28.3 28.8 29.0 29.3 28.2 29.7 32.1 34.7 0.7Non-OECD Europe and Eurasia. . . . . 12.3 12.8 12.7 11.2 10.0 10.2 11.0 12.0 -0.2
Russia . . . . . . . . . . . . . . . . . . . . . . . . . 9.7 9.9 9.8 8.1 7.0 7.2 7.8 8.6 -0.5Caspian Area . . . . . . . . . . . . . . . . . . . 2.3 2.6 2.6 2.9 2.8 2.9 3.0 3.1 0.7Other . . . . . . . . . . . . . . . . . . . . . . . . . . 0.3 0.3 0.3 0.2 0.2 0.2 0.2 0.2 -1.4
Non-OECD Asia . . . . . . . . . . . . . . . . . . 7.9 7.8 7.8 7.8 7.4 7.9 8.6 9.2 0.6China. . . . . . . . . . . . . . . . . . . . . . . . . . 4.0 4.1 4.0 4.1 4.0 4.7 5.4 6.1 1.4India . . . . . . . . . . . . . . . . . . . . . . . . . . 0.9 0.9 0.9 1.1 1.0 1.1 1.1 1.1 0.9Other . . . . . . . . . . . . . . . . . . . . . . . . . . 3.0 2.9 2.9 2.7 2.4 2.2 2.1 2.0 -1.2
Middle East (Non-OPEC) . . . . . . . . . . 1.6 1.5 1.5 1.7 1.5 1.4 1.3 1.4 -0.4Africa . . . . . . . . . . . . . . . . . . . . . . . . . . 2.5 2.6 2.6 3.1 3.2 3.3 3.5 3.7 1.2Central and South America . . . . . . . . 4.0 4.1 4.3 5.6 6.1 6.8 7.6 8.4 2.6Brazil . . . . . . . . . . . . . . . . . . . . . . . . . . 2.1 2.3 2.4 3.3 3.9 4.4 5.0 5.7 3.3Other . . . . . . . . . . . . . . . . . . . . . . . . . . 1.8 1.8 1.9 2.3 2.2 2.3 2.6 2.7 1.5
Total World . . . . . . . . . . . . . . . . . . . . . . . 84.7 84.8 85.5 83.4 82.1 85.7 90.4 95.5 0.4
OPEC Share of World Production. . . . . . . 41% 41% 42% 38% 37% 36% 35% 35%Persian Gulf Share of World Production . . 28% 27% 28% 26% 26% 26% 25% 26%
aOPEC = Organization of the Petroleum Exporting Countries (OPEC-12).Sources: History: U.S. Energy Information Administration (EIA), Office of Energy Markets and End Use. Projections: EIA, Gen-
erate World Oil Balance Model (2010).

Table G5. World conventional liquids production by region and country, High Oil Price case, 2006-2035(Million barrels per day)
Appendix G
254 U.S. Energy Information Administration / International Energy Outlook 2010
Region/Country
History (estimates) Projections Average annualpercent change,
2007-20352006 2007 2008 2015 2020 2025 2030 2035
OPECa . . . . . . . . . . . . . . . . . . . . . . . . . . . 34.1 33.8 35.0 31.4 30.0 30.5 31.0 32.4 -0.2Middle East . . . . . . . . . . . . . . . . . . . . . . 23.6 23.1 24.2 21.7 21.1 21.8 22.8 24.4 0.2Iran . . . . . . . . . . . . . . . . . . . . . . . . . . . . 4.1 4.0 4.2 3.3 2.9 2.7 2.6 2.6 -1.6Iraq . . . . . . . . . . . . . . . . . . . . . . . . . . . . 2.0 2.1 2.4 2.4 2.5 2.8 3.6 4.2 2.5Kuwait . . . . . . . . . . . . . . . . . . . . . . . . . . 2.7 2.6 2.7 2.4 2.3 2.4 2.6 2.7 0.1Qatar . . . . . . . . . . . . . . . . . . . . . . . . . . . 1.1 1.1 1.2 1.4 1.5 1.6 1.7 1.7 1.5Saudi Arabia . . . . . . . . . . . . . . . . . . . . . 10.7 10.2 10.7 9.3 9.2 9.6 10.0 11.0 0.3United Arab Emirates . . . . . . . . . . . . . . 2.9 2.9 3.0 3.0 2.7 2.6 2.3 2.2 -1.0
North Africa . . . . . . . . . . . . . . . . . . . . . . 3.9 4.0 4.1 3.8 3.3 3.3 3.3 3.4 -0.6Algeria . . . . . . . . . . . . . . . . . . . . . . . . . . 2.1 2.2 2.2 2.3 2.3 2.3 2.3 2.2 0.1Libya . . . . . . . . . . . . . . . . . . . . . . . . . . . 1.8 1.8 1.9 1.5 1.1 1.0 1.1 1.1 -1.7
West Africa . . . . . . . . . . . . . . . . . . . . . . 3.9 4.1 4.2 4.3 4.1 4.1 3.7 3.5 -0.6Angola . . . . . . . . . . . . . . . . . . . . . . . . . . 1.4 1.8 2.0 2.0 1.9 1.9 1.6 1.5 -0.6Nigeria. . . . . . . . . . . . . . . . . . . . . . . . . . 2.4 2.4 2.2 2.3 2.2 2.2 2.1 2.0 -0.5
South America. . . . . . . . . . . . . . . . . . . . 2.7 2.6 2.5 1.7 1.4 1.3 1.2 1.1 -3.1Ecuador. . . . . . . . . . . . . . . . . . . . . . . . . 0.5 0.5 0.5 0.3 0.3 0.3 0.3 0.3 -1.7Venezuela . . . . . . . . . . . . . . . . . . . . . . . 2.1 2.1 2.0 1.3 1.1 1.0 0.9 0.8 -3.5
Non-OPEC . . . . . . . . . . . . . . . . . . . . . . . . 47.7 47.7 46.6 45.0 42.3 42.5 43.8 45.2 -0.2OECD . . . . . . . . . . . . . . . . . . . . . . . . . . . 20.0 19.6 18.5 17.0 16.3 15.9 15.7 15.5 -0.8OECD North America . . . . . . . . . . . . . 13.8 13.6 12.8 12.8 12.8 12.7 12.6 12.3 -0.3United States. . . . . . . . . . . . . . . . . . . . 8.0 8.0 7.8 9.1 9.9 10.0 9.9 9.6 0.7Canada . . . . . . . . . . . . . . . . . . . . . . . . 2.1 2.1 1.8 1.9 1.7 1.7 1.6 1.6 -0.9Mexico. . . . . . . . . . . . . . . . . . . . . . . . . 3.7 3.5 3.2 1.8 1.2 1.0 1.0 1.1 -4.1
OECD Europe . . . . . . . . . . . . . . . . . . . 5.5 5.2 5.0 3.5 2.8 2.6 2.5 2.5 -2.6Denmark . . . . . . . . . . . . . . . . . . . . . . . 0.3 0.3 0.3 0.2 0.1 0.1 0.1 0.1 -3.8Norway . . . . . . . . . . . . . . . . . . . . . . . . 2.8 2.6 2.5 1.9 1.5 1.4 1.3 1.3 -2.3United Kngdom . . . . . . . . . . . . . . . . . . 1.7 1.7 1.6 0.9 0.6 0.6 0.6 0.6 -3.5Other . . . . . . . . . . . . . . . . . . . . . . . . . . 0.7 0.7 0.6 0.5 0.5 0.5 0.5 0.5 -1.3
OECD Asia . . . . . . . . . . . . . . . . . . . . . . 0.7 0.8 0.8 0.7 0.7 0.6 0.6 0.6 -0.7Japan . . . . . . . . . . . . . . . . . . . . . . . . . 0.1 0.1 0.1 0.1 0.1 0.1 0.1 0.1 -1.0South Korea . . . . . . . . . . . . . . . . . . . . 0.0 0.0 0.0 0.0 0.0 0.0 0.0 0.0 -0.5Australia and New Zealand . . . . . . . . . 0.6 0.6 0.7 0.6 0.5 0.5 0.5 0.5 -0.7
aOPEC = Organization of the Petroleum Exporting Countries (OPEC-12).

Table G5. World conventional liquids production by region and country, High Oil Price case, 2006-2035(continued)(Million barrels per day)
Liquids production projections
U.S. Energy Information Administration / International Energy Outlook 2010 255
Region/Country
History (estimates) Projections Average annualpercent change,
2007-20352006 2007 2008 2015 2020 2025 2030 2035
Non-OECD . . . . . . . . . . . . . . . . . . . . . . . 27.7 28.1 28.1 28.0 26.1 26.6 28.1 29.7 0.2Non-OECD Europe and Eurasia. . . . . 12.3 12.8 12.7 11.2 10.0 10.2 11.0 12.0 -0.2
Russia . . . . . . . . . . . . . . . . . . . . . . . . 9.7 9.9 9.8 8.1 7.0 7.2 7.8 8.6 -0.5Caspian Area . . . . . . . . . . . . . . . . . . . 2.3 2.6 2.6 2.9 2.8 2.9 3.0 3.1 0.7
Azerbaijan . . . . . . . . . . . . . . . . . . . . . 0.6 0.8 0.9 1.0 0.9 0.8 0.8 0.7 -0.7Kazakhstan . . . . . . . . . . . . . . . . . . . . 1.4 1.4 1.4 1.7 1.7 1.8 2.0 2.2 1.5Turkmenistan . . . . . . . . . . . . . . . . . . 0.2 0.2 0.2 0.2 0.2 0.2 0.2 0.3 1.2Uzbekistan . . . . . . . . . . . . . . . . . . . . 0.1 0.1 0.1 0.0 0.0 0.0 0.0 0.0 -4.5
Other. . . . . . . . . . . . . . . . . . . . . . . . . . 0.3 0.3 0.3 0.2 0.2 0.2 0.2 0.2 -1.6Non-OECD Asia . . . . . . . . . . . . . . . . . . 7.7 7.7 7.7 7.6 7.0 7.0 6.8 6.7 -0.5China. . . . . . . . . . . . . . . . . . . . . . . . . . 3.9 3.9 4.0 4.0 3.8 4.0 3.9 3.8 -0.1India . . . . . . . . . . . . . . . . . . . . . . . . . . 0.9 0.9 0.9 1.0 0.9 0.9 1.0 1.0 0.4Brunei . . . . . . . . . . . . . . . . . . . . . . . . . 0.2 0.2 0.2 0.1 0.1 0.1 0.1 0.1 -2.3Malaysia . . . . . . . . . . . . . . . . . . . . . . . 0.7 0.7 0.7 0.7 0.6 0.6 0.6 0.6 -0.7Thailand . . . . . . . . . . . . . . . . . . . . . . . 0.3 0.3 0.4 0.4 0.4 0.3 0.3 0.3 -0.3Vietnam . . . . . . . . . . . . . . . . . . . . . . . . 0.4 0.4 0.3 0.4 0.3 0.3 0.3 0.2 -1.2Other . . . . . . . . . . . . . . . . . . . . . . . . . . 1.4 1.3 1.3 1.0 0.9 0.8 0.7 0.7 -2.1
Middle East (Non-OPEC) . . . . . . . . . . 1.6 1.5 1.5 1.7 1.5 1.4 1.3 1.4 -0.4Oman . . . . . . . . . . . . . . . . . . . . . . . . . 0.7 0.7 0.8 0.9 0.8 0.8 0.8 0.8 0.3Syria . . . . . . . . . . . . . . . . . . . . . . . . . . 0.4 0.4 0.4 0.4 0.3 0.3 0.3 0.3 -1.7Yemen. . . . . . . . . . . . . . . . . . . . . . . . . 0.4 0.3 0.3 0.2 0.2 0.2 0.1 0.1 -2.8Other . . . . . . . . . . . . . . . . . . . . . . . . . . 0.1 0.1 0.1 0.1 0.1 0.2 0.2 0.2 4.0
Africa . . . . . . . . . . . . . . . . . . . . . . . . . . 2.4 2.4 2.4 2.9 2.8 3.0 3.1 3.3 1.1Chad . . . . . . . . . . . . . . . . . . . . . . . . . . 0.2 0.1 0.1 0.1 0.1 0.1 0.1 0.1 -3.3Congo (Brazzaville) . . . . . . . . . . . . . . . 0.2 0.2 0.2 0.3 0.3 0.2 0.2 0.2 0.0Egypt . . . . . . . . . . . . . . . . . . . . . . . . . . 0.7 0.7 0.6 0.6 0.6 0.7 0.7 0.7 0.2Equatorial Guniea . . . . . . . . . . . . . . . . 0.4 0.4 0.4 0.4 0.4 0.4 0.3 0.4 -0.2Gabon . . . . . . . . . . . . . . . . . . . . . . . . . 0.2 0.2 0.2 0.2 0.2 0.2 0.2 0.2 -1.3Sao Tome and Principe. . . . . . . . . . . . 0.0 0.0 0.0 0.0 0.0 0.0 0.1 0.1 —Sudan . . . . . . . . . . . . . . . . . . . . . . . . . 0.4 0.5 0.5 0.6 0.6 0.6 0.8 0.9 2.5Other . . . . . . . . . . . . . . . . . . . . . . . . . . 0.3 0.3 0.3 0.7 0.7 0.8 0.8 0.8 3.3
Central and South America . . . . . . . . 3.7 3.7 3.8 4.6 4.7 5.1 5.7 6.4 2.0Brazil . . . . . . . . . . . . . . . . . . . . . . . . . . 1.9 1.9 1.9 2.4 2.6 2.8 3.2 3.8 2.4Argentina. . . . . . . . . . . . . . . . . . . . . . . 0.8 0.8 0.8 0.7 0.6 0.5 0.5 0.5 -1.4Colombia . . . . . . . . . . . . . . . . . . . . . . . 0.5 0.5 0.6 0.8 0.7 0.7 0.7 0.7 0.7Peru. . . . . . . . . . . . . . . . . . . . . . . . . . . 0.1 0.1 0.1 0.3 0.3 0.3 0.3 0.4 4.3Trinidad and Tobago . . . . . . . . . . . . . . 0.2 0.2 0.2 0.2 0.2 0.2 0.2 0.2 1.0Other . . . . . . . . . . . . . . . . . . . . . . . . . . 0.2 0.2 0.2 0.2 0.3 0.5 0.7 0.8 5.7
Total World . . . . . . . . . . . . . . . . . . . . . . . 81.8 81.5 81.6 76.4 72.3 73.0 74.8 77.6 -0.2
OPEC Share of World Production. . . . . . . 42% 41% 43% 41% 41% 42% 41% 42%Persian Gulf Share of World Production . . 29% 28% 30% 28% 29% 30% 30% 31%
Note: Conventional liquids include crude oil and lease condensate, natural gas plant liquids, and refinery gain.Sources: History: U.S. Energy Information Administration (EIA), Office of Energy Markets and End Use. Projections: EIA, Gen-
erate World Oil Balance Model (2010).
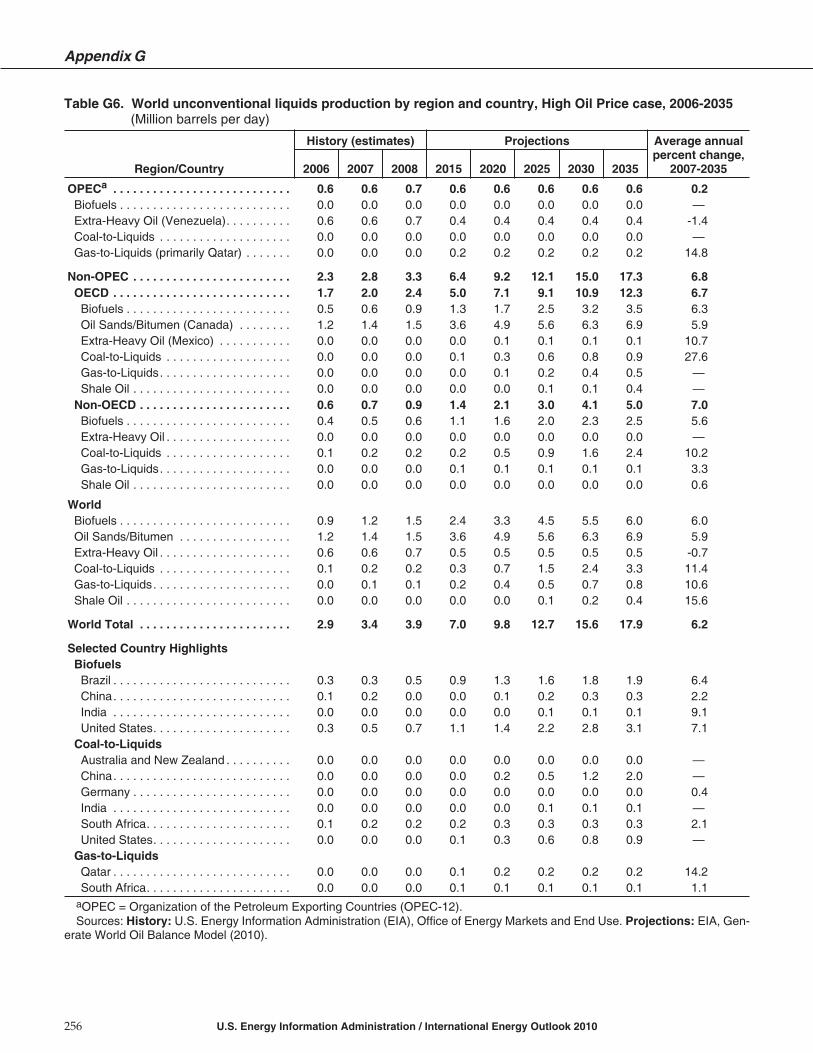
Table G6. World unconventional liquids production by region and country, High Oil Price case, 2006-2035(Million barrels per day)
Appendix G
256 U.S. Energy Information Administration / International Energy Outlook 2010
Region/Country
History (estimates) Projections Average annualpercent change,
2007-20352006 2007 2008 2015 2020 2025 2030 2035
OPECa . . . . . . . . . . . . . . . . . . . . . . . . . . . 0.6 0.6 0.7 0.6 0.6 0.6 0.6 0.6 0.2Biofuels . . . . . . . . . . . . . . . . . . . . . . . . . . 0.0 0.0 0.0 0.0 0.0 0.0 0.0 0.0 —Extra-Heavy Oil (Venezuela). . . . . . . . . . 0.6 0.6 0.7 0.4 0.4 0.4 0.4 0.4 -1.4Coal-to-Liquids . . . . . . . . . . . . . . . . . . . . 0.0 0.0 0.0 0.0 0.0 0.0 0.0 0.0 —Gas-to-Liquids (primarily Qatar) . . . . . . . 0.0 0.0 0.0 0.2 0.2 0.2 0.2 0.2 14.8
Non-OPEC . . . . . . . . . . . . . . . . . . . . . . . . 2.3 2.8 3.3 6.4 9.2 12.1 15.0 17.3 6.8OECD . . . . . . . . . . . . . . . . . . . . . . . . . . . 1.7 2.0 2.4 5.0 7.1 9.1 10.9 12.3 6.7Biofuels . . . . . . . . . . . . . . . . . . . . . . . . . 0.5 0.6 0.9 1.3 1.7 2.5 3.2 3.5 6.3Oil Sands/Bitumen (Canada) . . . . . . . . 1.2 1.4 1.5 3.6 4.9 5.6 6.3 6.9 5.9Extra-Heavy Oil (Mexico) . . . . . . . . . . . 0.0 0.0 0.0 0.0 0.1 0.1 0.1 0.1 10.7Coal-to-Liquids . . . . . . . . . . . . . . . . . . . 0.0 0.0 0.0 0.1 0.3 0.6 0.8 0.9 27.6Gas-to-Liquids. . . . . . . . . . . . . . . . . . . . 0.0 0.0 0.0 0.0 0.1 0.2 0.4 0.5 —Shale Oil . . . . . . . . . . . . . . . . . . . . . . . . 0.0 0.0 0.0 0.0 0.0 0.1 0.1 0.4 —
Non-OECD . . . . . . . . . . . . . . . . . . . . . . . 0.6 0.7 0.9 1.4 2.1 3.0 4.1 5.0 7.0Biofuels . . . . . . . . . . . . . . . . . . . . . . . . . 0.4 0.5 0.6 1.1 1.6 2.0 2.3 2.5 5.6Extra-Heavy Oil . . . . . . . . . . . . . . . . . . . 0.0 0.0 0.0 0.0 0.0 0.0 0.0 0.0 —Coal-to-Liquids . . . . . . . . . . . . . . . . . . . 0.1 0.2 0.2 0.2 0.5 0.9 1.6 2.4 10.2Gas-to-Liquids. . . . . . . . . . . . . . . . . . . . 0.0 0.0 0.0 0.1 0.1 0.1 0.1 0.1 3.3Shale Oil . . . . . . . . . . . . . . . . . . . . . . . . 0.0 0.0 0.0 0.0 0.0 0.0 0.0 0.0 0.6
WorldBiofuels . . . . . . . . . . . . . . . . . . . . . . . . . . 0.9 1.2 1.5 2.4 3.3 4.5 5.5 6.0 6.0Oil Sands/Bitumen . . . . . . . . . . . . . . . . . 1.2 1.4 1.5 3.6 4.9 5.6 6.3 6.9 5.9Extra-Heavy Oil . . . . . . . . . . . . . . . . . . . . 0.6 0.6 0.7 0.5 0.5 0.5 0.5 0.5 -0.7Coal-to-Liquids . . . . . . . . . . . . . . . . . . . . 0.1 0.2 0.2 0.3 0.7 1.5 2.4 3.3 11.4Gas-to-Liquids. . . . . . . . . . . . . . . . . . . . . 0.0 0.1 0.1 0.2 0.4 0.5 0.7 0.8 10.6Shale Oil . . . . . . . . . . . . . . . . . . . . . . . . . 0.0 0.0 0.0 0.0 0.0 0.1 0.2 0.4 15.6
World Total . . . . . . . . . . . . . . . . . . . . . . . 2.9 3.4 3.9 7.0 9.8 12.7 15.6 17.9 6.2
Selected Country HighlightsBiofuelsBrazil . . . . . . . . . . . . . . . . . . . . . . . . . . . 0.3 0.3 0.5 0.9 1.3 1.6 1.8 1.9 6.4China. . . . . . . . . . . . . . . . . . . . . . . . . . . 0.1 0.2 0.0 0.0 0.1 0.2 0.3 0.3 2.2India . . . . . . . . . . . . . . . . . . . . . . . . . . . 0.0 0.0 0.0 0.0 0.0 0.1 0.1 0.1 9.1United States. . . . . . . . . . . . . . . . . . . . . 0.3 0.5 0.7 1.1 1.4 2.2 2.8 3.1 7.1
Coal-to-LiquidsAustralia and New Zealand . . . . . . . . . . 0.0 0.0 0.0 0.0 0.0 0.0 0.0 0.0 —China. . . . . . . . . . . . . . . . . . . . . . . . . . . 0.0 0.0 0.0 0.0 0.2 0.5 1.2 2.0 —Germany . . . . . . . . . . . . . . . . . . . . . . . . 0.0 0.0 0.0 0.0 0.0 0.0 0.0 0.0 0.4India . . . . . . . . . . . . . . . . . . . . . . . . . . . 0.0 0.0 0.0 0.0 0.0 0.1 0.1 0.1 —South Africa. . . . . . . . . . . . . . . . . . . . . . 0.1 0.2 0.2 0.2 0.3 0.3 0.3 0.3 2.1United States. . . . . . . . . . . . . . . . . . . . . 0.0 0.0 0.0 0.1 0.3 0.6 0.8 0.9 —
Gas-to-LiquidsQatar . . . . . . . . . . . . . . . . . . . . . . . . . . . 0.0 0.0 0.0 0.1 0.2 0.2 0.2 0.2 14.2South Africa. . . . . . . . . . . . . . . . . . . . . . 0.0 0.0 0.0 0.1 0.1 0.1 0.1 0.1 1.1
aOPEC = Organization of the Petroleum Exporting Countries (OPEC-12).Sources: History: U.S. Energy Information Administration (EIA), Office of Energy Markets and End Use. Projections: EIA, Gen-
erate World Oil Balance Model (2010).

Table G7. World total liquids production by region and country, Low Oil Price case, 2006-2035(Million barrels per day)
Liquids production projections
U.S. Energy Information Administration / International Energy Outlook 2010 257
Region/Country
History (estimates) Projections Average annualpercent change,
2007-20352006 2007 2008 2015 2020 2025 2030 2035
OPECa . . . . . . . . . . . . . . . . . . . . . . . . . . . 34.7 34.4 35.6 43.2 47.3 51.9 56.6 61.5 2.1Middle East . . . . . . . . . . . . . . . . . . . . . . 23.6 23.1 24.2 28.6 31.5 35.0 39.0 42.9 2.2Iran . . . . . . . . . . . . . . . . . . . . . . . . . . . . 4.1 4.0 4.2 4.7 4.8 5.0 5.1 5.3 1.0Iraq . . . . . . . . . . . . . . . . . . . . . . . . . . . . 2.0 2.1 2.4 2.9 3.7 4.7 6.3 7.6 4.7Kuwait . . . . . . . . . . . . . . . . . . . . . . . . . . 2.7 2.6 2.7 3.5 3.9 4.5 5.2 5.6 2.8Qatar . . . . . . . . . . . . . . . . . . . . . . . . . . . 1.1 1.1 1.2 2.0 2.4 2.7 3.0 3.1 3.7Saudi Arabia . . . . . . . . . . . . . . . . . . . . . 10.7 10.2 10.7 11.5 12.5 13.6 14.9 16.8 1.8United Arab Emirates . . . . . . . . . . . . . . 2.9 2.9 3.0 4.1 4.3 4.5 4.4 4.4 1.4
North Africa . . . . . . . . . . . . . . . . . . . . . . 3.9 4.0 4.1 5.1 5.2 5.6 6.1 6.4 1.7Algeria . . . . . . . . . . . . . . . . . . . . . . . . . . 2.1 2.2 2.2 3.1 3.4 3.8 4.0 4.2 2.3Libya . . . . . . . . . . . . . . . . . . . . . . . . . . . 1.8 1.8 1.9 2.1 1.7 1.8 2.1 2.3 0.8
West Africa . . . . . . . . . . . . . . . . . . . . . . 3.9 4.1 4.2 5.7 6.2 6.6 6.5 6.6 1.7Angola . . . . . . . . . . . . . . . . . . . . . . . . . . 1.4 1.8 2.0 2.7 2.9 3.1 2.8 2.6 1.4Nigeria. . . . . . . . . . . . . . . . . . . . . . . . . . 2.4 2.4 2.2 3.0 3.3 3.5 3.7 4.0 1.9
South America. . . . . . . . . . . . . . . . . . . . 3.3 3.2 3.1 3.8 4.5 4.7 5.1 5.5 2.0Ecuador. . . . . . . . . . . . . . . . . . . . . . . . . 0.5 0.5 0.5 0.5 0.6 0.6 0.7 0.7 1.0Venezuela . . . . . . . . . . . . . . . . . . . . . . . 2.7 2.7 2.6 3.3 3.9 4.1 4.4 4.9 2.2
Non-OPEC . . . . . . . . . . . . . . . . . . . . . . . . 50.0 50.4 49.9 51.0 52.9 54.9 57.9 61.2 0.7OECD . . . . . . . . . . . . . . . . . . . . . . . . . . . 21.7 21.6 20.9 20.1 19.5 18.8 18.7 18.9 -0.5OECD North America . . . . . . . . . . . . . 15.3 15.4 15.0 15.9 15.8 15.4 15.4 15.7 0.1United States. . . . . . . . . . . . . . . . . . . . 8.3 8.5 8.4 9.7 9.9 9.6 9.3 9.1 0.2Canada . . . . . . . . . . . . . . . . . . . . . . . . 3.3 3.4 3.4 4.0 4.1 4.4 4.6 4.8 1.2Mexico. . . . . . . . . . . . . . . . . . . . . . . . . 3.7 3.5 3.2 2.2 1.7 1.5 1.6 1.8 -2.3
OECD Europe . . . . . . . . . . . . . . . . . . . 5.6 5.4 5.2 3.5 3.0 2.7 2.6 2.6 -2.6OECD Asia . . . . . . . . . . . . . . . . . . . . . . 0.7 0.8 0.8 0.7 0.7 0.7 0.7 0.7 -0.6Japan . . . . . . . . . . . . . . . . . . . . . . . . . 0.1 0.1 0.1 0.1 0.1 0.1 0.1 0.1 0.2South Korea . . . . . . . . . . . . . . . . . . . . 0.0 0.0 0.0 0.0 0.0 0.0 0.0 0.0 1.4Australia and New Zealand . . . . . . . . . 0.6 0.6 0.7 0.6 0.5 0.5 0.5 0.5 -0.9
Non-OECD . . . . . . . . . . . . . . . . . . . . . . . 28.3 28.8 29.0 30.9 33.4 36.1 39.2 42.3 1.4Non-OECD Europe and Eurasia. . . . . 12.3 12.8 12.7 13.7 15.2 17.0 19.2 21.4 1.9
Russia . . . . . . . . . . . . . . . . . . . . . . . . . 9.7 9.9 9.8 10.0 10.8 12.1 13.9 15.7 1.7Caspian Area . . . . . . . . . . . . . . . . . . . 2.3 2.6 2.6 3.6 4.2 4.7 5.1 5.5 2.7Other . . . . . . . . . . . . . . . . . . . . . . . . . . 0.3 0.3 0.3 0.2 0.2 0.2 0.2 0.2 -1.8
Non-OECD Asia . . . . . . . . . . . . . . . . . . 7.9 7.8 7.8 7.3 7.2 7.2 6.9 6.6 -0.6China. . . . . . . . . . . . . . . . . . . . . . . . . . 4.0 4.1 4.0 3.8 3.9 4.1 4.0 3.8 -0.2India . . . . . . . . . . . . . . . . . . . . . . . . . . 0.9 0.9 0.9 1.0 1.0 1.0 1.0 1.0 0.6Other . . . . . . . . . . . . . . . . . . . . . . . . . . 3.0 2.9 2.9 2.5 2.3 2.1 1.9 1.8 -1.7
Middle East (Non-OPEC) . . . . . . . . . . 1.6 1.5 1.5 1.6 1.4 1.3 1.2 1.2 -0.9Africa . . . . . . . . . . . . . . . . . . . . . . . . . . 2.5 2.6 2.6 2.8 3.0 3.0 3.0 2.9 0.4Central and South America . . . . . . . . 4.0 4.1 4.3 5.5 6.7 7.5 8.8 10.1 3.3Brazil . . . . . . . . . . . . . . . . . . . . . . . . . . 2.1 2.3 2.4 3.3 4.6 5.3 6.4 7.7 4.5Other . . . . . . . . . . . . . . . . . . . . . . . . . . 1.8 1.8 1.9 2.1 2.1 2.2 2.4 2.4 1.0
Total World . . . . . . . . . . . . . . . . . . . . . . . 84.7 84.8 85.5 94.2 100.2 106.8 114.6 122.7 1.3
OPEC Share of World Production. . . . . . . 41% 41% 42% 46% 47% 49% 49% 50%Persian Gulf Share of World Production . . 28% 27% 28% 30% 31% 33% 34% 35%
aOPEC = Organization of the Petroleum Exporting Countries (OPEC-12).Sources: History: U.S. Energy Information Administration (EIA), Office of Energy Markets and End Use. Projections: EIA, Gen-
erate World Oil Balance Model (2010).

Table G8. World conventional liquids production by region and country, Low Oil Price case, 2006-2035(Million barrels per day)
Appendix G
258 U.S. Energy Information Administration / International Energy Outlook 2010
Region/Country
History (estimates) Projections Average annualpercent change,
2007-20352006 2007 2008 2015 2020 2025 2030 2035
OPECa . . . . . . . . . . . . . . . . . . . . . . . . . . . 34.1 33.8 35.0 41.5 44.9 49.1 53.3 57.6 1.9Middle East . . . . . . . . . . . . . . . . . . . . . . 23.6 23.1 24.2 28.4 31.3 34.8 38.8 42.7 2.2Iran . . . . . . . . . . . . . . . . . . . . . . . . . . . . 4.1 4.0 4.2 4.7 4.8 5.0 5.1 5.3 1.0Iraq . . . . . . . . . . . . . . . . . . . . . . . . . . . . 2.0 2.1 2.4 2.9 3.7 4.7 6.3 7.6 4.7Kuwait . . . . . . . . . . . . . . . . . . . . . . . . . . 2.7 2.6 2.7 3.5 3.9 4.5 5.2 5.6 2.8Qatar . . . . . . . . . . . . . . . . . . . . . . . . . . . 1.1 1.1 1.2 1.9 2.2 2.5 2.8 2.9 3.5Saudi Arabia . . . . . . . . . . . . . . . . . . . . . 10.7 10.2 10.7 11.5 12.5 13.6 14.9 16.8 1.8United Arab Emirates . . . . . . . . . . . . . . 2.9 2.9 3.0 4.1 4.3 4.5 4.4 4.4 1.4
North Africa . . . . . . . . . . . . . . . . . . . . . . 3.9 4.0 4.1 5.1 5.2 5.6 6.1 6.4 1.7Algeria . . . . . . . . . . . . . . . . . . . . . . . . . . 2.1 2.2 2.2 3.1 3.4 3.8 4.0 4.2 2.3Libya . . . . . . . . . . . . . . . . . . . . . . . . . . . 1.8 1.8 1.9 2.1 1.7 1.8 2.1 2.3 0.8
West Africa . . . . . . . . . . . . . . . . . . . . . . 3.9 4.1 4.2 5.6 6.2 6.6 6.5 6.6 1.7Angola . . . . . . . . . . . . . . . . . . . . . . . . . . 1.4 1.8 2.0 2.7 2.9 3.1 2.8 2.6 1.4Nigeria. . . . . . . . . . . . . . . . . . . . . . . . . . 2.4 2.4 2.2 2.9 3.2 3.5 3.7 4.0 1.9
South America. . . . . . . . . . . . . . . . . . . . 2.7 2.6 2.5 2.3 2.2 2.1 2.0 1.9 -1.2Ecuador. . . . . . . . . . . . . . . . . . . . . . . . . 0.5 0.5 0.5 0.5 0.6 0.6 0.7 0.7 1.0Venezuela . . . . . . . . . . . . . . . . . . . . . . . 2.1 2.1 2.0 1.8 1.6 1.5 1.3 1.2 -2.0
Non-OPEC . . . . . . . . . . . . . . . . . . . . . . . . 47.7 47.7 46.6 47.0 48.2 49.7 52.0 54.6 0.5OECD . . . . . . . . . . . . . . . . . . . . . . . . . . . 20.0 19.6 18.5 16.7 15.7 14.6 14.2 14.1 -1.2OECD North America . . . . . . . . . . . . . 13.8 13.6 12.8 12.6 12.2 11.3 11.0 11.0 -0.7United States. . . . . . . . . . . . . . . . . . . . 8.0 8.0 7.8 8.6 8.7 8.2 7.9 7.7 -0.2Canada . . . . . . . . . . . . . . . . . . . . . . . . 2.1 2.1 1.8 1.8 1.7 1.6 1.6 1.5 -1.0Mexico. . . . . . . . . . . . . . . . . . . . . . . . . 3.7 3.5 3.2 2.2 1.7 1.4 1.6 1.8 -2.3
OECD Europe . . . . . . . . . . . . . . . . . . . 5.5 5.2 5.0 3.4 2.8 2.6 2.5 2.4 -2.7Denmark . . . . . . . . . . . . . . . . . . . . . . . 0.3 0.3 0.3 0.2 0.1 0.1 0.1 0.1 -4.3Norway . . . . . . . . . . . . . . . . . . . . . . . . 2.8 2.6 2.5 1.8 1.5 1.4 1.3 1.2 -2.7United Kngdom . . . . . . . . . . . . . . . . . . 1.7 1.7 1.6 0.8 0.6 0.6 0.6 0.6 -3.8Other . . . . . . . . . . . . . . . . . . . . . . . . . . 0.7 0.7 0.6 0.6 0.5 0.5 0.5 0.6 -0.6
OECD Asia . . . . . . . . . . . . . . . . . . . . . . 0.7 0.8 0.8 0.7 0.7 0.7 0.7 0.6 -0.7Japan . . . . . . . . . . . . . . . . . . . . . . . . . 0.1 0.1 0.1 0.1 0.1 0.1 0.1 0.1 0.2South Korea . . . . . . . . . . . . . . . . . . . . 0.0 0.0 0.0 0.0 0.0 0.0 0.0 0.0 1.1Australia and New Zealand . . . . . . . . . 0.6 0.6 0.7 0.6 0.5 0.5 0.5 0.5 -0.9
aOPEC = Organization of the Petroleum Exporting Countries (OPEC-12).

Table G8. World conventional liquids production by region and country, Low Oil Price case, 2006-2035(continued)(Million barrels per day)
Liquids production projections
U.S. Energy Information Administration / International Energy Outlook 2010 259
Region/Country
History (estimates) Projections Average annualpercent change,
2007-20352006 2007 2008 2015 2020 2025 2030 2035
Non-OECD . . . . . . . . . . . . . . . . . . . . . . . 27.7 28.1 28.1 30.3 32.5 35.1 37.8 40.5 1.3Non-OECD Europe and Eurasia. . . . . 12.3 12.8 12.7 13.7 15.2 17.0 19.2 21.4 1.9
Russia . . . . . . . . . . . . . . . . . . . . . . . . 9.7 9.9 9.8 10.0 10.8 12.1 13.9 15.7 1.7Caspian Area . . . . . . . . . . . . . . . . . . . 2.3 2.6 2.6 3.6 4.2 4.7 5.1 5.5 2.7
Azerbaijan . . . . . . . . . . . . . . . . . . . . . 0.6 0.8 0.9 1.3 1.4 1.4 1.4 1.3 1.6Kazakhstan . . . . . . . . . . . . . . . . . . . . 1.4 1.4 1.4 2.0 2.5 3.0 3.4 3.7 3.5Turkmenistan . . . . . . . . . . . . . . . . . . 0.2 0.2 0.2 0.2 0.2 0.3 0.3 0.3 2.2Uzbekistan . . . . . . . . . . . . . . . . . . . . 0.1 0.1 0.1 0.0 0.0 0.0 0.0 0.0 -3.6
Other. . . . . . . . . . . . . . . . . . . . . . . . . . 0.3 0.3 0.3 0.2 0.2 0.2 0.2 0.2 -1.9Non-OECD Asia . . . . . . . . . . . . . . . . . . 7.7 7.7 7.7 7.3 7.0 6.9 6.5 6.2 -0.8China. . . . . . . . . . . . . . . . . . . . . . . . . . 3.9 3.9 4.0 3.8 3.8 3.9 3.7 3.4 -0.5India . . . . . . . . . . . . . . . . . . . . . . . . . . 0.9 0.9 0.9 1.0 0.9 0.9 0.9 1.0 0.4Brunei . . . . . . . . . . . . . . . . . . . . . . . . . 0.2 0.2 0.2 0.1 0.1 0.1 0.1 0.1 -2.8Malaysia . . . . . . . . . . . . . . . . . . . . . . . 0.7 0.7 0.7 0.6 0.6 0.6 0.5 0.5 -1.1Thailand . . . . . . . . . . . . . . . . . . . . . . . 0.3 0.3 0.4 0.4 0.4 0.3 0.3 0.3 -0.5Vietnam . . . . . . . . . . . . . . . . . . . . . . . . 0.4 0.4 0.3 0.4 0.3 0.3 0.3 0.2 -1.6Other . . . . . . . . . . . . . . . . . . . . . . . . . . 1.4 1.3 1.3 1.0 0.9 0.8 0.7 0.6 -2.5
Middle East (Non-OPEC) . . . . . . . . . . 1.6 1.5 1.5 1.6 1.4 1.3 1.2 1.2 -0.9Oman . . . . . . . . . . . . . . . . . . . . . . . . . 0.7 0.7 0.8 0.9 0.8 0.7 0.7 0.7 -0.2Syria . . . . . . . . . . . . . . . . . . . . . . . . . . 0.4 0.4 0.4 0.4 0.3 0.3 0.3 0.2 -2.2Yemen. . . . . . . . . . . . . . . . . . . . . . . . . 0.4 0.3 0.3 0.2 0.2 0.2 0.1 0.1 -3.3Other . . . . . . . . . . . . . . . . . . . . . . . . . . 0.1 0.1 0.1 0.1 0.1 0.2 0.2 0.1 3.6
Africa . . . . . . . . . . . . . . . . . . . . . . . . . . 2.4 2.4 2.4 2.7 2.8 2.9 2.9 2.8 0.6Chad . . . . . . . . . . . . . . . . . . . . . . . . . . 0.2 0.1 0.1 0.1 0.1 0.1 0.1 0.0 -3.9Congo (Brazzaville) . . . . . . . . . . . . . . . 0.2 0.2 0.2 0.3 0.3 0.2 0.2 0.2 -0.5Egypt . . . . . . . . . . . . . . . . . . . . . . . . . . 0.7 0.7 0.6 0.5 0.6 0.7 0.7 0.6 -0.4Equatorial Guniea . . . . . . . . . . . . . . . . 0.4 0.4 0.4 0.4 0.4 0.4 0.3 0.3 -0.7Gabon . . . . . . . . . . . . . . . . . . . . . . . . . 0.2 0.2 0.2 0.2 0.2 0.2 0.2 0.1 -1.9Sao Tome and Principe. . . . . . . . . . . . 0.0 0.0 0.0 0.0 0.0 0.0 0.1 0.1 —Sudan . . . . . . . . . . . . . . . . . . . . . . . . . 0.4 0.5 0.5 0.5 0.6 0.6 0.7 0.8 2.0Other . . . . . . . . . . . . . . . . . . . . . . . . . . 0.3 0.3 0.3 0.7 0.7 0.7 0.7 0.7 2.8
Central and South America . . . . . . . . 3.7 3.7 3.8 5.1 6.1 6.9 7.9 9.0 3.2Brazil . . . . . . . . . . . . . . . . . . . . . . . . . . 1.9 1.9 1.9 3.0 4.0 4.7 5.5 6.7 4.5Argentina. . . . . . . . . . . . . . . . . . . . . . . 0.8 0.8 0.8 0.6 0.6 0.5 0.5 0.5 -1.7Colombia . . . . . . . . . . . . . . . . . . . . . . . 0.5 0.5 0.6 0.8 0.7 0.7 0.6 0.6 0.2Peru. . . . . . . . . . . . . . . . . . . . . . . . . . . 0.1 0.1 0.1 0.2 0.3 0.3 0.3 0.3 3.9Trinidad and Tobago . . . . . . . . . . . . . . 0.2 0.2 0.2 0.2 0.2 0.2 0.2 0.2 0.8Other . . . . . . . . . . . . . . . . . . . . . . . . . . 0.2 0.2 0.2 0.2 0.3 0.5 0.7 0.7 5.2
Total World . . . . . . . . . . . . . . . . . . . . . . . 81.8 81.5 81.6 88.6 93.1 98.8 105.3 112.2 1.2
OPEC Share of World Production. . . . . . . 42% 41% 43% 47% 48% 50% 51% 51%Persian Gulf Share of World Production . . 29% 28% 30% 32% 34% 35% 37% 38%
Note: Conventional liquids include crude oil and lease condensate, natural gas plant liquids, and refinery gain.Sources: History: U.S. Energy Information Administration (EIA), Office of Energy Markets and End Use. Projections: EIA, Gen-
erate World Oil Balance Model (2010).

Table G9. World unconventional liquids production by region and country, Low Oil Price case, 2006-2035(Million barrels per day)
Appendix G
260 U.S. Energy Information Administration / International Energy Outlook 2010
Region/Country
History (estimates) Projections Average annualpercent change,
2007-20352006 2007 2008 2015 2020 2025 2030 2035
OPECa . . . . . . . . . . . . . . . . . . . . . . . . . . . 0.6 0.6 0.7 1.6 2.5 2.8 3.3 3.9 6.9Biofuels . . . . . . . . . . . . . . . . . . . . . . . . . . 0.0 0.0 0.0 0.0 0.0 0.0 0.0 0.0 —Extra-Heavy Oil (Venezuela). . . . . . . . . . 0.6 0.6 0.7 1.5 2.3 2.6 3.1 3.7 6.7Coal-to-Liquids . . . . . . . . . . . . . . . . . . . . 0.0 0.0 0.0 0.0 0.0 0.0 0.0 0.0 —Gas-to-Liquids (primarily Qatar) . . . . . . . 0.0 0.0 0.0 0.2 0.2 0.2 0.2 0.2 14.3
Non-OPEC . . . . . . . . . . . . . . . . . . . . . . . . 2.3 2.8 3.3 4.0 4.7 5.2 6.0 6.6 3.2OECD . . . . . . . . . . . . . . . . . . . . . . . . . . . 1.7 2.0 2.4 3.4 3.8 4.2 4.5 4.9 3.2Biofuels . . . . . . . . . . . . . . . . . . . . . . . . . 0.5 0.6 0.9 1.2 1.3 1.4 1.5 1.6 3.2Oil Sands/Bitumen (Canada) . . . . . . . . 1.2 1.4 1.5 2.2 2.4 2.7 3.0 3.2 3.1Extra-Heavy Oil (Mexico) . . . . . . . . . . . 0.0 0.0 0.0 0.0 0.0 0.0 0.0 0.0 2.0Coal-to-Liquids . . . . . . . . . . . . . . . . . . . 0.0 0.0 0.0 0.0 0.1 0.1 0.1 0.1 15.5Gas-to-Liquids. . . . . . . . . . . . . . . . . . . . 0.0 0.0 0.0 0.0 0.0 0.0 0.0 0.0 —Shale Oil . . . . . . . . . . . . . . . . . . . . . . . . 0.0 0.0 0.0 0.0 0.0 0.0 0.0 0.0 —
Non-OECD . . . . . . . . . . . . . . . . . . . . . . . 0.6 0.7 0.9 0.6 0.9 1.0 1.4 1.7 3.1Biofuels . . . . . . . . . . . . . . . . . . . . . . . . . 0.4 0.5 0.6 0.5 0.7 0.7 1.1 1.4 3.4Extra-Heavy Oil . . . . . . . . . . . . . . . . . . . 0.0 0.0 0.0 0.0 0.0 0.0 0.0 0.0 —Coal-to-Liquids . . . . . . . . . . . . . . . . . . . 0.1 0.2 0.2 0.1 0.2 0.3 0.3 0.3 2.6Gas-to-Liquids. . . . . . . . . . . . . . . . . . . . 0.0 0.0 0.0 0.0 0.0 0.0 0.0 0.0 -1.2Shale Oil . . . . . . . . . . . . . . . . . . . . . . . . 0.0 0.0 0.0 0.0 0.0 0.0 0.0 0.0 -3.8
WorldBiofuels . . . . . . . . . . . . . . . . . . . . . . . . . . 0.9 1.2 1.5 1.6 2.0 2.2 2.6 2.9 3.3Oil Sands/Bitumen . . . . . . . . . . . . . . . . . 1.2 1.4 1.5 2.2 2.4 2.7 3.0 3.2 3.1Extra-Heavy Oil . . . . . . . . . . . . . . . . . . . . 0.6 0.6 0.7 1.5 2.3 2.6 3.1 3.7 6.7Coal-to-Liquids . . . . . . . . . . . . . . . . . . . . 0.1 0.2 0.2 0.2 0.2 0.3 0.4 0.4 3.2Gas-to-Liquids. . . . . . . . . . . . . . . . . . . . . 0.0 0.1 0.1 0.2 0.2 0.2 0.3 0.2 5.8Shale Oil . . . . . . . . . . . . . . . . . . . . . . . . . 0.0 0.0 0.0 0.0 0.0 0.0 0.0 0.0 -3.8
World Total . . . . . . . . . . . . . . . . . . . . . . . 2.9 3.4 3.9 5.6 7.2 8.0 9.3 10.5 4.1
Selected Country HighlightsBiofuelsBrazil . . . . . . . . . . . . . . . . . . . . . . . . . . . 0.3 0.3 0.5 0.4 0.6 0.6 0.8 1.1 4.2China. . . . . . . . . . . . . . . . . . . . . . . . . . . 0.1 0.2 0.0 0.0 0.0 0.1 0.1 0.2 0.1India . . . . . . . . . . . . . . . . . . . . . . . . . . . 0.0 0.0 0.0 0.0 0.0 0.0 0.0 0.0 6.9United States. . . . . . . . . . . . . . . . . . . . . 0.3 0.5 0.7 1.1 1.2 1.3 1.3 1.3 3.9
Coal-to-LiquidsAustralia and New Zealand . . . . . . . . . . 0.0 0.0 0.0 0.0 0.0 0.0 0.0 0.0 —China. . . . . . . . . . . . . . . . . . . . . . . . . . . 0.0 0.0 0.0 0.0 0.0 0.1 0.2 0.2 —Germany . . . . . . . . . . . . . . . . . . . . . . . . 0.0 0.0 0.0 0.0 0.0 0.0 0.0 0.0 -4.0India . . . . . . . . . . . . . . . . . . . . . . . . . . . 0.0 0.0 0.0 0.0 0.0 0.0 0.0 0.0 —South Africa. . . . . . . . . . . . . . . . . . . . . . 0.1 0.2 0.2 0.1 0.1 0.1 0.1 0.1 -2.4United States. . . . . . . . . . . . . . . . . . . . . 0.0 0.0 0.0 0.0 0.1 0.1 0.1 0.1 —
Gas-to-LiquidsQatar . . . . . . . . . . . . . . . . . . . . . . . . . . . 0.0 0.0 0.0 0.1 0.2 0.2 0.2 0.2 13.7South Africa. . . . . . . . . . . . . . . . . . . . . . 0.0 0.0 0.0 0.0 0.0 0.0 0.0 0.0 -3.4
aOPEC = Organization of the Petroleum Exporting Countries (OPEC-12).Sources: History: U.S. Energy Information Administration (EIA), Office of Energy Markets and End Use. Projections: EIA, Gen-
erate World Oil Balance Model (2010).
Table G10. World total liquids production by region and country, High Economic Growth case, 2006-2035(Million barrels per day)
Liquids production projections
U.S. Energy Information Administration / International Energy Outlook 2010 261
Region/Country
History (estimates) Projections Average annualpercent change,
2007-20352006 2007 2008 2015 2020 2025 2030 2035
OPECa . . . . . . . . . . . . . . . . . . . . . . . . . . . 34.7 34.4 35.6 38.2 40.6 44.0 48.0 52.2 1.4Middle East . . . . . . . . . . . . . . . . . . . . . . 23.6 23.1 24.2 25.7 27.6 30.4 34.2 38.1 1.7Iran . . . . . . . . . . . . . . . . . . . . . . . . . . . . 4.1 4.0 4.2 4.0 3.9 3.9 4.0 4.2 0.0Iraq . . . . . . . . . . . . . . . . . . . . . . . . . . . . 2.0 2.1 2.4 2.7 3.2 4.2 5.7 7.1 4.1Kuwait . . . . . . . . . . . . . . . . . . . . . . . . . . 2.7 2.6 2.7 2.9 3.1 3.5 4.1 4.4 1.8Qatar . . . . . . . . . . . . . . . . . . . . . . . . . . . 1.1 1.1 1.2 1.8 2.1 2.4 2.7 2.7 3.1Saudi Arabia . . . . . . . . . . . . . . . . . . . . . 10.7 10.2 10.7 10.8 11.6 12.7 14.2 16.2 1.5United Arab Emirates . . . . . . . . . . . . . . 2.9 2.9 3.0 3.5 3.5 3.6 3.5 3.5 0.5
North Africa . . . . . . . . . . . . . . . . . . . . . . 3.9 4.0 4.1 4.5 4.4 4.6 4.9 5.2 0.9Algeria . . . . . . . . . . . . . . . . . . . . . . . . . . 2.1 2.2 2.2 2.7 2.9 3.1 3.3 3.4 1.7Libya . . . . . . . . . . . . . . . . . . . . . . . . . . . 1.8 1.8 1.9 1.8 1.4 1.5 1.6 1.8 -0.1
West Africa . . . . . . . . . . . . . . . . . . . . . . 3.9 4.1 4.2 5.3 5.7 6.1 6.0 5.9 1.3Angola . . . . . . . . . . . . . . . . . . . . . . . . . . 1.4 1.8 2.0 2.4 2.6 2.7 2.5 2.4 0.7Nigeria. . . . . . . . . . . . . . . . . . . . . . . . . . 2.4 2.4 2.2 2.8 3.1 3.3 3.4 3.5 1.8
South America. . . . . . . . . . . . . . . . . . . . 3.3 3.2 3.1 2.8 2.9 2.9 2.9 2.9 -0.3Ecuador. . . . . . . . . . . . . . . . . . . . . . . . . 0.5 0.5 0.5 0.4 0.4 0.5 0.5 0.5 0.2Venezuela . . . . . . . . . . . . . . . . . . . . . . . 2.7 2.7 2.6 2.4 2.5 2.4 2.4 2.4 -0.3
Non-OPEC . . . . . . . . . . . . . . . . . . . . . . . . 50.0 50.4 49.9 52.5 55.8 60.5 66.0 71.2 1.3OECD . . . . . . . . . . . . . . . . . . . . . . . . . . . 21.7 21.6 20.9 20.8 21.1 21.9 23.4 25.5 0.7OECD North America . . . . . . . . . . . . . 15.3 15.4 15.0 16.4 17.2 18.0 19.6 21.5 1.4United States. . . . . . . . . . . . . . . . . . . . 8.3 8.5 8.4 10.1 10.8 11.3 12.0 12.8 1.6Canada . . . . . . . . . . . . . . . . . . . . . . . . 3.3 3.4 3.4 4.2 4.6 5.3 6.0 6.9 2.7Mexico. . . . . . . . . . . . . . . . . . . . . . . . . 3.7 3.5 3.2 2.2 1.7 1.5 1.6 1.8 -2.1
OECD Europe . . . . . . . . . . . . . . . . . . . 5.6 5.4 5.2 3.6 3.2 3.1 3.1 3.2 -1.8OECD Asia . . . . . . . . . . . . . . . . . . . . . . 0.7 0.8 0.8 0.7 0.7 0.7 0.7 0.8 -0.2Japan . . . . . . . . . . . . . . . . . . . . . . . . . 0.1 0.1 0.1 0.1 0.1 0.1 0.1 0.1 -0.2South Korea . . . . . . . . . . . . . . . . . . . . 0.0 0.0 0.0 0.0 0.0 0.0 0.0 0.0 1.4Australia and New Zealand . . . . . . . . . 0.6 0.6 0.7 0.6 0.6 0.6 0.6 0.6 -0.3
Non-OECD . . . . . . . . . . . . . . . . . . . . . . . 28.3 28.8 29.0 31.7 34.7 38.6 42.5 45.8 1.7Non-OECD Europe and Eurasia. . . . . 12.3 12.8 12.7 13.5 14.6 16.4 18.4 20.1 1.7
Russia . . . . . . . . . . . . . . . . . . . . . . . . . 9.7 9.9 9.8 9.8 10.4 11.6 13.2 14.7 1.5Caspian Area . . . . . . . . . . . . . . . . . . . 2.3 2.6 2.6 3.5 4.1 4.6 5.0 5.2 2.7Other . . . . . . . . . . . . . . . . . . . . . . . . . . 0.3 0.3 0.3 0.2 0.2 0.2 0.2 0.2 -1.0
Non-OECD Asia . . . . . . . . . . . . . . . . . . 7.9 7.8 7.8 7.6 7.8 8.5 8.8 9.0 0.5China. . . . . . . . . . . . . . . . . . . . . . . . . . 4.0 4.1 4.0 4.0 4.3 4.9 5.3 5.4 1.1India . . . . . . . . . . . . . . . . . . . . . . . . . . 0.9 0.9 0.9 1.0 1.0 1.2 1.2 1.3 1.2Other . . . . . . . . . . . . . . . . . . . . . . . . . . 3.0 2.9 2.9 2.6 2.5 2.4 2.3 2.3 -0.9
Middle East (Non-OPEC) . . . . . . . . . . 1.6 1.5 1.5 1.6 1.5 1.6 1.5 1.5 0.0Africa . . . . . . . . . . . . . . . . . . . . . . . . . . 2.5 2.6 2.6 3.0 3.4 3.7 4.0 4.1 1.7Central and South America . . . . . . . . 4.0 4.1 4.3 6.1 7.3 8.5 9.8 11.0 3.5Brazil . . . . . . . . . . . . . . . . . . . . . . . . . . 2.1 2.3 2.4 3.8 5.0 5.9 6.8 7.9 4.5Other . . . . . . . . . . . . . . . . . . . . . . . . . . 1.8 1.8 1.9 2.2 2.3 2.6 3.0 3.0 1.8
Total World . . . . . . . . . . . . . . . . . . . . . . . 84.7 84.8 85.5 90.8 96.4 104.5 113.9 123.4 1.4
OPEC Share of World Production. . . . . . . 41% 41% 42% 42% 42% 42% 42% 42%Persian Gulf Share of World Production . . 28% 27% 28% 28% 29% 29% 30% 31%
aOPEC = Organization of the Petroleum Exporting Countries (OPEC-12).Sources: History: U.S. Energy Information Administration (EIA), Office of Energy Markets and End Use. Projections: EIA, Gen-
erate World Oil Balance Model (2010).

Table G11. World conventional liquids production by region and country, High Economic Growth case,2006-2035(Million barrels per day)
Appendix G
262 U.S. Energy Information Administration / International Energy Outlook 2010
Region/Country
History (estimates) Projections Average annualpercent change,
2007-20352006 2007 2008 2015 2020 2025 2030 2035
OPECa . . . . . . . . . . . . . . . . . . . . . . . . . . . 34.1 33.8 35.0 37.2 39.3 42.6 46.5 50.5 1.4Middle East . . . . . . . . . . . . . . . . . . . . . . 23.6 23.1 24.2 25.6 27.4 30.2 33.9 37.9 1.7Iran . . . . . . . . . . . . . . . . . . . . . . . . . . . . 4.1 4.0 4.2 4.0 3.9 3.9 4.0 4.2 0.0Iraq . . . . . . . . . . . . . . . . . . . . . . . . . . . . 2.0 2.1 2.4 2.7 3.2 4.2 5.7 7.1 4.1Kuwait . . . . . . . . . . . . . . . . . . . . . . . . . . 2.7 2.6 2.7 2.9 3.1 3.5 4.1 4.4 1.8Qatar . . . . . . . . . . . . . . . . . . . . . . . . . . . 1.1 1.1 1.2 1.7 1.9 2.2 2.4 2.5 2.7Saudi Arabia . . . . . . . . . . . . . . . . . . . . . 10.7 10.2 10.7 10.8 11.6 12.7 14.2 16.2 1.5United Arab Emirates . . . . . . . . . . . . . . 2.9 2.9 3.0 3.5 3.5 3.6 3.5 3.5 0.5
North Africa . . . . . . . . . . . . . . . . . . . . . . 3.9 4.0 4.1 4.5 4.4 4.6 4.9 5.2 0.9Algeria . . . . . . . . . . . . . . . . . . . . . . . . . . 2.1 2.2 2.2 2.7 2.9 3.1 3.3 3.4 1.7Libya . . . . . . . . . . . . . . . . . . . . . . . . . . . 1.8 1.8 1.9 1.8 1.4 1.5 1.6 1.8 -0.1
West Africa . . . . . . . . . . . . . . . . . . . . . . 3.9 4.1 4.2 5.2 5.7 6.0 5.9 5.9 1.3Angola . . . . . . . . . . . . . . . . . . . . . . . . . . 1.4 1.8 2.0 2.4 2.6 2.7 2.5 2.4 0.7Nigeria. . . . . . . . . . . . . . . . . . . . . . . . . . 2.4 2.4 2.2 2.8 3.1 3.3 3.4 3.4 1.7
South America. . . . . . . . . . . . . . . . . . . . 2.7 2.6 2.5 2.0 1.9 1.8 1.7 1.6 -1.7Ecuador. . . . . . . . . . . . . . . . . . . . . . . . . 0.5 0.5 0.5 0.4 0.4 0.5 0.5 0.5 0.2Venezuela . . . . . . . . . . . . . . . . . . . . . . . 2.1 2.1 2.0 1.6 1.4 1.3 1.2 1.0 -2.4
Non-OPEC . . . . . . . . . . . . . . . . . . . . . . . . 47.7 47.7 46.6 47.3 49.4 52.4 55.9 58.8 0.9OECD . . . . . . . . . . . . . . . . . . . . . . . . . . . 20.0 19.6 18.5 17.0 16.6 16.3 16.4 16.5 -0.4OECD North America . . . . . . . . . . . . . 13.8 13.6 12.8 12.9 12.9 12.7 12.9 12.9 0.0United States. . . . . . . . . . . . . . . . . . . . 8.0 8.0 7.8 8.9 9.5 9.6 9.7 9.5 0.8Canada . . . . . . . . . . . . . . . . . . . . . . . . 2.1 2.1 1.8 1.8 1.7 1.7 1.7 1.6 -0.4Mexico. . . . . . . . . . . . . . . . . . . . . . . . . 3.7 3.5 3.2 2.2 1.7 1.4 1.5 1.7 -2.3
OECD Europe . . . . . . . . . . . . . . . . . . . 5.5 5.2 5.0 3.4 3.0 2.9 2.9 2.9 -2.0Denmark . . . . . . . . . . . . . . . . . . . . . . . 0.3 0.3 0.3 0.2 0.1 0.1 0.1 0.1 -3.1Norway . . . . . . . . . . . . . . . . . . . . . . . . 2.8 2.6 2.5 1.9 1.6 1.6 1.5 1.5 -1.8United Kngdom . . . . . . . . . . . . . . . . . . 1.7 1.7 1.6 0.9 0.7 0.7 0.7 0.7 -3.0Other . . . . . . . . . . . . . . . . . . . . . . . . . . 0.7 0.7 0.6 0.5 0.5 0.5 0.5 0.6 -0.3
OECD Asia . . . . . . . . . . . . . . . . . . . . . . 0.7 0.8 0.8 0.7 0.7 0.7 0.7 0.7 -0.3Japan . . . . . . . . . . . . . . . . . . . . . . . . . 0.1 0.1 0.1 0.1 0.1 0.1 0.1 0.1 -0.2South Korea . . . . . . . . . . . . . . . . . . . . 0.0 0.0 0.0 0.0 0.0 0.0 0.0 0.0 0.5Australia and New Zealand . . . . . . . . . 0.6 0.6 0.7 0.6 0.6 0.6 0.6 0.6 -0.3
aOPEC = Organization of the Petroleum Exporting Countries (OPEC-12).

Table G11. World conventional liquids production by region and country, High Economic Growth case,2006-2035 (continued)(Million barrels per day)
Liquids production projections
U.S. Energy Information Administration / International Energy Outlook 2010 263
Region/Country
History (estimates) Projections Average annualpercent change,
2007-20352006 2007 2008 2015 2020 2025 2030 2035
Non-OECD . . . . . . . . . . . . . . . . . . . . . . . 27.7 28.1 28.1 30.3 32.8 36.1 39.4 42.3 1.5Non-OECD Europe and Eurasia. . . . . 12.3 12.8 12.7 13.5 14.6 16.4 18.4 20.1 1.7
Russia . . . . . . . . . . . . . . . . . . . . . . . . 9.7 9.9 9.8 9.8 10.4 11.6 13.2 14.7 1.5Caspian Area . . . . . . . . . . . . . . . . . . . 2.3 2.6 2.6 3.5 4.1 4.6 5.0 5.2 2.7
Azerbaijan . . . . . . . . . . . . . . . . . . . . . 0.6 0.8 0.9 1.3 1.4 1.4 1.3 1.2 1.3Kazakhstan . . . . . . . . . . . . . . . . . . . . 1.4 1.4 1.4 2.0 2.4 2.8 3.2 3.5 3.4Turkmenistan . . . . . . . . . . . . . . . . . . 0.2 0.2 0.2 0.2 0.3 0.3 0.4 0.4 3.1Uzbekistan . . . . . . . . . . . . . . . . . . . . 0.1 0.1 0.1 0.0 0.0 0.0 0.0 0.0 -2.3
Other. . . . . . . . . . . . . . . . . . . . . . . . . . 0.3 0.3 0.3 0.2 0.2 0.2 0.2 0.2 -1.1Non-OECD Asia . . . . . . . . . . . . . . . . . . 7.7 7.7 7.7 7.4 7.5 7.9 7.8 7.7 0.0China. . . . . . . . . . . . . . . . . . . . . . . . . . 3.9 3.9 4.0 3.9 4.1 4.5 4.5 4.4 0.3India . . . . . . . . . . . . . . . . . . . . . . . . . . 0.9 0.9 0.9 1.0 1.0 1.0 1.1 1.1 0.9Brunei . . . . . . . . . . . . . . . . . . . . . . . . . 0.2 0.2 0.2 0.1 0.1 0.1 0.1 0.1 -1.5Malaysia . . . . . . . . . . . . . . . . . . . . . . . 0.7 0.7 0.7 0.7 0.7 0.6 0.6 0.6 -0.4Thailand . . . . . . . . . . . . . . . . . . . . . . . 0.3 0.3 0.4 0.4 0.4 0.4 0.4 0.4 0.0Vietnam . . . . . . . . . . . . . . . . . . . . . . . . 0.4 0.4 0.3 0.4 0.4 0.3 0.3 0.3 -0.4Other . . . . . . . . . . . . . . . . . . . . . . . . . . 1.4 1.3 1.3 1.0 0.9 0.9 0.8 0.8 -1.8
Middle East (Non-OPEC) . . . . . . . . . . 1.6 1.5 1.5 1.6 1.5 1.6 1.5 1.5 0.0Oman . . . . . . . . . . . . . . . . . . . . . . . . . 0.7 0.7 0.8 0.9 0.8 0.9 0.9 0.9 0.6Syria . . . . . . . . . . . . . . . . . . . . . . . . . . 0.4 0.4 0.4 0.4 0.4 0.3 0.3 0.3 -1.3Yemen. . . . . . . . . . . . . . . . . . . . . . . . . 0.4 0.3 0.3 0.2 0.2 0.2 0.2 0.2 -2.2Other . . . . . . . . . . . . . . . . . . . . . . . . . . 0.1 0.1 0.1 0.1 0.1 0.2 0.2 0.2 4.7
Africa . . . . . . . . . . . . . . . . . . . . . . . . . . 2.4 2.4 2.4 2.8 3.0 3.3 3.6 3.7 1.7Chad . . . . . . . . . . . . . . . . . . . . . . . . . . 0.2 0.1 0.1 0.1 0.1 0.1 0.1 0.1 -2.5Congo (Brazzaville) . . . . . . . . . . . . . . . 0.2 0.2 0.2 0.3 0.3 0.3 0.3 0.2 0.1Egypt . . . . . . . . . . . . . . . . . . . . . . . . . . 0.7 0.7 0.6 0.5 0.7 0.8 0.8 0.8 0.8Equatorial Guniea . . . . . . . . . . . . . . . . 0.4 0.4 0.4 0.4 0.4 0.4 0.4 0.4 0.4Gabon . . . . . . . . . . . . . . . . . . . . . . . . . 0.2 0.2 0.2 0.2 0.2 0.2 0.2 0.2 -1.0Sao Tome and Principe. . . . . . . . . . . . 0.0 0.0 0.0 0.0 0.0 0.1 0.1 0.1 —Sudan . . . . . . . . . . . . . . . . . . . . . . . . . 0.4 0.5 0.5 0.6 0.6 0.7 0.9 1.1 3.0Other . . . . . . . . . . . . . . . . . . . . . . . . . . 0.3 0.3 0.3 0.7 0.8 0.9 0.9 0.9 4.1
Central and South America . . . . . . . . 3.7 3.7 3.8 5.0 6.1 7.0 8.1 9.2 3.4Brazil . . . . . . . . . . . . . . . . . . . . . . . . . . 1.9 1.9 1.9 2.9 3.8 4.5 5.3 6.2 4.4Argentina. . . . . . . . . . . . . . . . . . . . . . . 0.8 0.8 0.8 0.7 0.6 0.6 0.6 0.6 -0.9Colombia . . . . . . . . . . . . . . . . . . . . . . . 0.5 0.5 0.6 0.8 0.8 0.8 0.8 0.8 0.9Peru. . . . . . . . . . . . . . . . . . . . . . . . . . . 0.1 0.1 0.1 0.2 0.3 0.3 0.4 0.4 4.8Trinidad and Tobago . . . . . . . . . . . . . . 0.2 0.2 0.2 0.2 0.2 0.2 0.2 0.2 1.3Other . . . . . . . . . . . . . . . . . . . . . . . . . . 0.2 0.2 0.2 0.2 0.3 0.5 0.9 1.0 6.6
Total World . . . . . . . . . . . . . . . . . . . . . . . 81.8 81.5 81.6 84.6 88.7 95.0 102.3 109.3 1.1
OPEC Share of World Production. . . . . . . 42% 41% 43% 44% 44% 45% 45% 46%Persian Gulf Share of World Production . . 29% 28% 30% 30% 31% 32% 33% 35%
Note: Conventional liquids include crude oil and lease condensate, natural gas plant liquids, and refinery gain.Sources: History: U.S. Energy Information Administration (EIA), Office of Energy Markets and End Use. Projections: EIA, Gen-
erate World Oil Balance Model (2010).

Table G12. World unconventional liquids production by region and country, High Economic Growth case,2006-2035(Million barrels per day)
Appendix G
264 U.S. Energy Information Administration / International Energy Outlook 2010
Region/Country
History (estimates) Projections Average annualpercent change,
2007-20352006 2007 2008 2015 2020 2025 2030 2035
OPECa . . . . . . . . . . . . . . . . . . . . . . . . . . . 0.6 0.6 0.7 1.0 1.3 1.4 1.5 1.7 3.5Biofuels . . . . . . . . . . . . . . . . . . . . . . . . . . 0.0 0.0 0.0 0.0 0.0 0.0 0.0 0.0 —Extra-Heavy Oil (Venezuela). . . . . . . . . . 0.6 0.6 0.7 0.8 1.1 1.1 1.2 1.4 2.8Coal-to-Liquids . . . . . . . . . . . . . . . . . . . . 0.0 0.0 0.0 0.0 0.0 0.0 0.0 0.0 —Gas-to-Liquids (primarily Qatar) . . . . . . . 0.0 0.0 0.0 0.2 0.2 0.3 0.3 0.3 16.1
Non-OPEC . . . . . . . . . . . . . . . . . . . . . . . . 2.3 2.8 3.3 5.2 6.4 8.1 10.1 12.5 5.1OECD . . . . . . . . . . . . . . . . . . . . . . . . . . . 1.7 2.0 2.4 3.8 4.5 5.6 7.0 9.0 5.0Biofuels . . . . . . . . . . . . . . . . . . . . . . . . . 0.5 0.6 0.9 1.3 1.4 1.8 2.3 3.0 4.7Oil Sands/Bitumen (Canada) . . . . . . . . 1.2 1.4 1.5 2.4 2.9 3.5 4.3 5.3 4.7Extra-Heavy Oil (Mexico) . . . . . . . . . . . 0.0 0.0 0.0 0.0 0.0 0.1 0.1 0.1 8.9Coal-to-Liquids . . . . . . . . . . . . . . . . . . . 0.0 0.0 0.0 0.1 0.1 0.2 0.2 0.3 22.9Gas-to-Liquids. . . . . . . . . . . . . . . . . . . . 0.0 0.0 0.0 0.0 0.0 0.0 0.0 0.0 —Shale Oil . . . . . . . . . . . . . . . . . . . . . . . . 0.0 0.0 0.0 0.0 0.0 0.1 0.1 0.4 —
Non-OECD . . . . . . . . . . . . . . . . . . . . . . . 0.6 0.7 0.9 1.4 1.9 2.5 3.1 3.5 5.3Biofuels . . . . . . . . . . . . . . . . . . . . . . . . . 0.4 0.5 0.6 1.2 1.4 1.8 2.0 2.2 4.6Extra-Heavy Oil . . . . . . . . . . . . . . . . . . . 0.0 0.0 0.0 0.0 0.0 0.0 0.0 0.0 —Coal-to-Liquids . . . . . . . . . . . . . . . . . . . 0.1 0.2 0.2 0.2 0.4 0.7 1.0 1.2 7.7Gas-to-Liquids. . . . . . . . . . . . . . . . . . . . 0.0 0.0 0.0 0.1 0.1 0.1 0.1 0.1 3.5Shale Oil . . . . . . . . . . . . . . . . . . . . . . . . 0.0 0.0 0.0 0.0 0.0 0.0 0.0 0.0 0.8
WorldBiofuels . . . . . . . . . . . . . . . . . . . . . . . . . . 0.9 1.2 1.5 2.5 2.9 3.5 4.3 5.2 4.7Oil Sands/Bitumen . . . . . . . . . . . . . . . . . 1.2 1.4 1.5 2.4 2.9 3.5 4.3 5.3 4.7Extra-Heavy Oil . . . . . . . . . . . . . . . . . . . . 0.6 0.6 0.7 0.8 1.1 1.2 1.3 1.4 3.0Coal-to-Liquids . . . . . . . . . . . . . . . . . . . . 0.1 0.2 0.2 0.3 0.5 0.8 1.2 1.4 8.4Gas-to-Liquids. . . . . . . . . . . . . . . . . . . . . 0.0 0.1 0.1 0.3 0.3 0.4 0.4 0.4 8.0Shale Oil . . . . . . . . . . . . . . . . . . . . . . . . . 0.0 0.0 0.0 0.0 0.0 0.1 0.2 0.4 16.3
World Total . . . . . . . . . . . . . . . . . . . . . . . 2.9 3.4 3.9 6.2 7.7 9.5 11.6 14.1 4.9
Selected Country HighlightsBiofuelsBrazil . . . . . . . . . . . . . . . . . . . . . . . . . . . 0.3 0.3 0.5 0.9 1.2 1.4 1.6 1.7 4.8China. . . . . . . . . . . . . . . . . . . . . . . . . . . 0.1 0.2 0.0 0.0 0.1 0.2 0.2 0.3 7.4India . . . . . . . . . . . . . . . . . . . . . . . . . . . 0.0 0.0 0.0 0.0 0.0 0.0 0.0 0.0 1.4United States. . . . . . . . . . . . . . . . . . . . . 0.3 0.5 0.7 1.0 1.2 1.5 1.9 2.7 5.3
Coal-to-LiquidsAustralia and New Zealand . . . . . . . . . . 0.0 0.0 0.0 0.0 0.0 0.0 0.0 0.0 —China. . . . . . . . . . . . . . . . . . . . . . . . . . . 0.0 0.0 0.0 0.0 0.1 0.3 0.6 0.8 27.9Germany . . . . . . . . . . . . . . . . . . . . . . . . 0.0 0.0 0.0 0.0 0.0 0.0 0.0 0.0 0.5India . . . . . . . . . . . . . . . . . . . . . . . . . . . 0.0 0.0 0.0 0.0 0.0 0.1 0.1 0.1 —South Africa. . . . . . . . . . . . . . . . . . . . . . 0.1 0.2 0.2 0.2 0.3 0.3 0.3 0.3 2.2United States. . . . . . . . . . . . . . . . . . . . . 0.0 0.0 0.0 0.1 0.1 0.2 0.2 0.3 —
Gas-to-LiquidsQatar . . . . . . . . . . . . . . . . . . . . . . . . . . . 0.0 0.0 0.0 0.2 0.2 0.2 0.2 0.2 15.5South Africa. . . . . . . . . . . . . . . . . . . . . . 0.0 0.0 0.0 0.1 0.1 0.1 0.1 0.1 1.2
aOPEC = Organization of the Petroleum Exporting Countries (OPEC-12).Sources: History: U.S. Energy Information Administration (EIA), Office of Energy Markets and End Use. Projections: EIA, Gen-
erate World Oil Balance Model (2010).

Table G13. World total liquids production by region and country, Low Economic Growth case, 2006-2035(Million barrels per day)
Liquids production projections
U.S. Energy Information Administration / International Energy Outlook 2010 265
Region/Country
History (estimates) Projections Average annualpercent change,
2007-20352006 2007 2008 2015 2020 2025 2030 2035
OPECa . . . . . . . . . . . . . . . . . . . . . . . . . . . 34.7 34.4 35.6 36.6 37.0 38.3 39.8 41.7 0.6Middle East . . . . . . . . . . . . . . . . . . . . . . 23.6 23.1 24.2 24.7 25.2 26.6 28.4 30.5 0.9Iran . . . . . . . . . . . . . . . . . . . . . . . . . . . . 4.1 4.0 4.2 3.8 3.5 3.3 3.2 3.1 -1.1Iraq . . . . . . . . . . . . . . . . . . . . . . . . . . . . 2.0 2.1 2.4 2.5 2.9 3.5 4.5 5.2 2.9Kuwait . . . . . . . . . . . . . . . . . . . . . . . . . . 2.7 2.6 2.7 2.8 2.8 3.0 3.2 3.3 0.7Qatar . . . . . . . . . . . . . . . . . . . . . . . . . . . 1.1 1.1 1.2 1.8 2.0 2.2 2.3 2.2 2.3Saudi Arabia . . . . . . . . . . . . . . . . . . . . . 10.7 10.2 10.7 10.5 10.9 11.5 12.5 14.1 1.0United Arab Emirates . . . . . . . . . . . . . . 2.9 2.9 3.0 3.3 3.2 3.1 2.8 2.7 -0.5
North Africa . . . . . . . . . . . . . . . . . . . . . . 3.9 4.0 4.1 4.3 3.9 4.0 4.0 4.0 0.0Algeria . . . . . . . . . . . . . . . . . . . . . . . . . . 2.1 2.2 2.2 2.6 2.6 2.7 2.7 2.6 0.7Libya . . . . . . . . . . . . . . . . . . . . . . . . . . . 1.8 1.8 1.9 1.7 1.3 1.3 1.3 1.4 -1.1
West Africa . . . . . . . . . . . . . . . . . . . . . . 3.9 4.1 4.2 5.0 5.1 5.0 4.6 4.3 0.1Angola . . . . . . . . . . . . . . . . . . . . . . . . . . 1.4 1.8 2.0 2.3 2.3 2.3 2.0 1.8 -0.4Nigeria. . . . . . . . . . . . . . . . . . . . . . . . . . 2.4 2.4 2.2 2.7 2.7 2.8 2.6 2.5 0.6
South America. . . . . . . . . . . . . . . . . . . . 3.3 3.2 3.1 2.7 2.8 2.8 2.8 2.8 -0.4Ecuador. . . . . . . . . . . . . . . . . . . . . . . . . 0.5 0.5 0.5 0.4 0.4 0.4 0.4 0.4 -1.0Venezuela . . . . . . . . . . . . . . . . . . . . . . . 2.7 2.7 2.6 2.3 2.4 2.4 2.4 2.4 -0.3
Non-OPEC . . . . . . . . . . . . . . . . . . . . . . . . 50.0 50.4 49.9 50.2 51.1 53.0 55.2 57.1 0.5OECD . . . . . . . . . . . . . . . . . . . . . . . . . . . 21.7 21.6 20.9 20.2 20.2 20.3 21.2 22.4 0.3OECD North America . . . . . . . . . . . . . 15.3 15.4 15.0 16.0 16.6 16.9 18.0 19.3 0.9United States. . . . . . . . . . . . . . . . . . . . 8.3 8.5 8.4 9.9 10.6 10.6 10.9 11.3 1.1Canada . . . . . . . . . . . . . . . . . . . . . . . . 3.3 3.4 3.4 4.1 4.5 5.1 5.8 6.6 2.5Mexico. . . . . . . . . . . . . . . . . . . . . . . . . 3.7 3.5 3.2 2.1 1.6 1.3 1.3 1.4 -3.0
OECD Europe . . . . . . . . . . . . . . . . . . . 5.6 5.4 5.2 3.5 2.9 2.7 2.6 2.5 -2.6OECD Asia . . . . . . . . . . . . . . . . . . . . . . 0.7 0.8 0.8 0.7 0.7 0.6 0.6 0.6 -1.0Japan . . . . . . . . . . . . . . . . . . . . . . . . . 0.1 0.1 0.1 0.1 0.1 0.1 0.1 0.1 -0.2South Korea . . . . . . . . . . . . . . . . . . . . 0.0 0.0 0.0 0.0 0.0 0.0 0.0 0.0 1.4Australia and New Zealand . . . . . . . . . 0.6 0.6 0.7 0.5 0.5 0.5 0.5 0.5 -1.3
Non-OECD . . . . . . . . . . . . . . . . . . . . . . . 28.3 28.8 29.0 30.0 30.9 32.7 33.9 34.7 0.7Non-OECD Europe and Eurasia. . . . . 12.3 12.8 12.7 12.8 13.0 13.8 14.5 15.1 0.6
Russia . . . . . . . . . . . . . . . . . . . . . . . . . 9.7 9.9 9.8 9.2 9.2 9.7 10.4 10.9 0.4Caspian Area . . . . . . . . . . . . . . . . . . . 2.3 2.6 2.6 3.3 3.6 3.9 4.0 3.9 1.6Other . . . . . . . . . . . . . . . . . . . . . . . . . . 0.3 0.3 0.3 0.2 0.2 0.2 0.2 0.2 -2.0
Non-OECD Asia . . . . . . . . . . . . . . . . . . 7.9 7.8 7.8 7.1 6.9 7.2 7.1 6.9 -0.5China. . . . . . . . . . . . . . . . . . . . . . . . . . 4.0 4.1 4.0 3.7 3.7 4.1 4.2 4.1 0.1India . . . . . . . . . . . . . . . . . . . . . . . . . . 0.9 0.9 0.9 1.0 0.9 1.0 1.0 1.0 0.5Other . . . . . . . . . . . . . . . . . . . . . . . . . . 3.0 2.9 2.9 2.4 2.2 2.1 1.9 1.7 -1.9
Middle East (Non-OPEC) . . . . . . . . . . 1.6 1.5 1.5 1.5 1.4 1.3 1.2 1.1 -1.3Africa . . . . . . . . . . . . . . . . . . . . . . . . . . 2.5 2.6 2.6 2.8 3.0 3.1 3.1 3.0 0.6Central and South America . . . . . . . . 4.0 4.1 4.3 5.8 6.6 7.4 8.1 8.7 2.6Brazil . . . . . . . . . . . . . . . . . . . . . . . . . . 2.1 2.3 2.4 3.7 4.6 5.2 5.7 6.4 3.7Other . . . . . . . . . . . . . . . . . . . . . . . . . . 1.8 1.8 1.9 2.1 2.1 2.2 2.3 2.3 0.7
Total World . . . . . . . . . . . . . . . . . . . . . . . 84.7 84.8 85.5 86.9 88.0 91.3 94.9 98.8 0.5
OPEC Share of World Production. . . . . . . 41% 41% 42% 42% 42% 42% 42% 42%Persian Gulf Share of World Production . . 28% 27% 28% 28% 29% 29% 30% 31%
aOPEC = Organization of the Petroleum Exporting Countries (OPEC-12).Sources: History: U.S. Energy Information Administration (EIA), Office of Energy Markets and End Use. Projections: EIA, Gen-
erate World Oil Balance Model (2010).

Table G14. World conventional liquids production by region and country, Low Economic Growth case,2006-2035(Million barrels per day)
Appendix G
266 U.S. Energy Information Administration / International Energy Outlook 2010
Region/Country
History (estimates) Projections Average annualpercent change,
2007-20352006 2007 2008 2015 2020 2025 2030 2035
OPECa . . . . . . . . . . . . . . . . . . . . . . . . . . . 34.1 33.8 35.0 35.6 35.6 36.8 38.1 39.8 0.5Middle East . . . . . . . . . . . . . . . . . . . . . . 23.6 23.1 24.2 24.5 25.0 26.3 28.1 30.3 0.8Iran . . . . . . . . . . . . . . . . . . . . . . . . . . . . 4.1 4.0 4.2 3.8 3.5 3.3 3.2 3.1 -1.1Iraq . . . . . . . . . . . . . . . . . . . . . . . . . . . . 2.0 2.1 2.4 2.5 2.9 3.5 4.5 5.2 2.9Kuwait . . . . . . . . . . . . . . . . . . . . . . . . . . 2.7 2.6 2.7 2.8 2.8 3.0 3.2 3.3 0.7Qatar . . . . . . . . . . . . . . . . . . . . . . . . . . . 1.1 1.1 1.2 1.6 1.8 1.9 2.0 2.0 1.9Saudi Arabia . . . . . . . . . . . . . . . . . . . . . 10.7 10.2 10.7 10.5 10.9 11.5 12.5 14.1 1.0United Arab Emirates . . . . . . . . . . . . . . 2.9 2.9 3.0 3.3 3.2 3.1 2.8 2.7 -0.5
North Africa . . . . . . . . . . . . . . . . . . . . . . 3.9 4.0 4.1 4.3 3.9 4.0 4.0 4.0 0.0Algeria . . . . . . . . . . . . . . . . . . . . . . . . . . 2.1 2.2 2.2 2.6 2.6 2.7 2.7 2.6 0.7Libya . . . . . . . . . . . . . . . . . . . . . . . . . . . 1.8 1.8 1.9 1.7 1.3 1.3 1.3 1.4 -1.1
West Africa . . . . . . . . . . . . . . . . . . . . . . 3.9 4.1 4.2 4.9 5.0 5.0 4.6 4.3 0.1Angola . . . . . . . . . . . . . . . . . . . . . . . . . . 1.4 1.8 2.0 2.3 2.3 2.3 2.0 1.8 -0.4Nigeria. . . . . . . . . . . . . . . . . . . . . . . . . . 2.4 2.4 2.2 2.7 2.7 2.7 2.6 2.5 0.5
South America. . . . . . . . . . . . . . . . . . . . 2.7 2.6 2.5 1.9 1.7 1.6 1.4 1.3 -2.5Ecuador. . . . . . . . . . . . . . . . . . . . . . . . . 0.5 0.5 0.5 0.4 0.4 0.4 0.4 0.4 -1.0Venezuela . . . . . . . . . . . . . . . . . . . . . . . 2.1 2.1 2.0 1.5 1.3 1.2 1.0 0.9 -3.0
Non-OPEC . . . . . . . . . . . . . . . . . . . . . . . . 47.7 47.7 46.6 45.1 44.7 45.3 45.9 46.0 0.0OECD . . . . . . . . . . . . . . . . . . . . . . . . . . . 20.0 19.6 18.5 16.5 15.7 15.0 14.9 14.6 -0.9OECD North America . . . . . . . . . . . . . 13.8 13.6 12.8 12.6 12.4 11.9 12.0 11.8 -0.3United States. . . . . . . . . . . . . . . . . . . . 8.0 8.0 7.8 8.8 9.2 9.1 9.2 8.9 0.5Canada . . . . . . . . . . . . . . . . . . . . . . . . 2.1 2.1 1.8 1.7 1.6 1.6 1.6 1.5 -0.7Mexico. . . . . . . . . . . . . . . . . . . . . . . . . 3.7 3.5 3.2 2.1 1.5 1.2 1.3 1.3 -3.2
OECD Europe . . . . . . . . . . . . . . . . . . . 5.5 5.2 5.0 3.2 2.7 2.5 2.3 2.3 -2.9Denmark . . . . . . . . . . . . . . . . . . . . . . . 0.3 0.3 0.3 0.2 0.1 0.1 0.1 0.1 -4.4Norway . . . . . . . . . . . . . . . . . . . . . . . . 2.8 2.6 2.5 1.8 1.5 1.3 1.2 1.1 -2.8United Kngdom . . . . . . . . . . . . . . . . . . 1.7 1.7 1.6 0.8 0.6 0.6 0.6 0.5 -4.0Other . . . . . . . . . . . . . . . . . . . . . . . . . . 0.7 0.7 0.6 0.5 0.5 0.5 0.5 0.5 -0.7
OECD Asia . . . . . . . . . . . . . . . . . . . . . . 0.7 0.8 0.8 0.7 0.6 0.6 0.6 0.6 -1.1Japan . . . . . . . . . . . . . . . . . . . . . . . . . 0.1 0.1 0.1 0.1 0.1 0.1 0.1 0.1 -0.2South Korea . . . . . . . . . . . . . . . . . . . . 0.0 0.0 0.0 0.0 0.0 0.0 0.0 0.0 0.7Australia and New Zealand . . . . . . . . . 0.6 0.6 0.7 0.5 0.5 0.5 0.5 0.5 -1.3
aOPEC = Organization of the Petroleum Exporting Countries (OPEC-12).

Table G14. World conventional liquids production by region and country, Low Economic Growth case,2006-2035 (continued)(Million barrels per day)
Liquids production projections
U.S. Energy Information Administration / International Energy Outlook 2010 267
Region/Country
History (estimates) Projections Average annualpercent change,
2007-20352006 2007 2008 2015 2020 2025 2030 2035
Non-OECD . . . . . . . . . . . . . . . . . . . . . . . 27.7 28.1 28.1 28.6 29.0 30.2 31.0 31.4 0.4Non-OECD Europe and Eurasia. . . . . 12.3 12.8 12.7 12.8 13.0 13.8 14.5 15.1 0.6
Russia . . . . . . . . . . . . . . . . . . . . . . . . 9.7 9.9 9.8 9.2 9.2 9.7 10.4 10.9 0.4Caspian Area . . . . . . . . . . . . . . . . . . . 2.3 2.6 2.6 3.3 3.6 3.9 4.0 3.9 1.6
Azerbaijan . . . . . . . . . . . . . . . . . . . . . 0.6 0.8 0.9 1.2 1.2 1.1 1.0 0.9 0.1Kazakhstan . . . . . . . . . . . . . . . . . . . . 1.4 1.4 1.4 1.9 2.2 2.4 2.6 2.7 2.4Turkmenistan . . . . . . . . . . . . . . . . . . 0.2 0.2 0.2 0.2 0.2 0.3 0.3 0.3 1.9Uzbekistan . . . . . . . . . . . . . . . . . . . . 0.1 0.1 0.1 0.0 0.0 0.0 0.0 0.0 -3.3
Other. . . . . . . . . . . . . . . . . . . . . . . . . . 0.3 0.3 0.3 0.2 0.2 0.2 0.2 0.2 -2.2Non-OECD Asia . . . . . . . . . . . . . . . . . . 7.7 7.7 7.7 7.0 6.6 6.6 6.1 5.7 -1.1China. . . . . . . . . . . . . . . . . . . . . . . . . . 3.9 3.9 4.0 3.6 3.6 3.7 3.4 3.1 -0.9India . . . . . . . . . . . . . . . . . . . . . . . . . . 0.9 0.9 0.9 1.0 0.9 0.9 0.9 0.9 0.1Brunei . . . . . . . . . . . . . . . . . . . . . . . . . 0.2 0.2 0.2 0.1 0.1 0.1 0.1 0.1 -2.7Malaysia . . . . . . . . . . . . . . . . . . . . . . . 0.7 0.7 0.7 0.6 0.6 0.5 0.5 0.5 -1.5Thailand . . . . . . . . . . . . . . . . . . . . . . . 0.3 0.3 0.4 0.4 0.4 0.3 0.3 0.3 -0.8Vietnam . . . . . . . . . . . . . . . . . . . . . . . . 0.4 0.4 0.3 0.4 0.3 0.3 0.2 0.2 -1.5Other . . . . . . . . . . . . . . . . . . . . . . . . . . 1.4 1.3 1.3 0.9 0.8 0.7 0.6 0.6 -2.9
Middle East (Non-OPEC) . . . . . . . . . . 1.6 1.5 1.5 1.5 1.4 1.3 1.2 1.1 -1.3Oman . . . . . . . . . . . . . . . . . . . . . . . . . 0.7 0.7 0.8 0.8 0.7 0.7 0.7 0.6 -0.8Syria . . . . . . . . . . . . . . . . . . . . . . . . . . 0.4 0.4 0.4 0.4 0.3 0.3 0.2 0.2 -2.4Yemen. . . . . . . . . . . . . . . . . . . . . . . . . 0.4 0.3 0.3 0.2 0.2 0.1 0.1 0.1 -3.5Other . . . . . . . . . . . . . . . . . . . . . . . . . . 0.1 0.1 0.1 0.1 0.1 0.1 0.1 0.1 3.5
Africa . . . . . . . . . . . . . . . . . . . . . . . . . . 2.4 2.4 2.4 2.6 2.6 2.7 2.7 2.6 0.3Chad . . . . . . . . . . . . . . . . . . . . . . . . . . 0.2 0.1 0.1 0.1 0.1 0.1 0.1 0.0 -3.8Congo (Brazzaville) . . . . . . . . . . . . . . . 0.2 0.2 0.2 0.3 0.2 0.2 0.2 0.2 -1.2Egypt . . . . . . . . . . . . . . . . . . . . . . . . . . 0.7 0.7 0.6 0.5 0.6 0.6 0.6 0.6 -0.5Equatorial Guniea . . . . . . . . . . . . . . . . 0.4 0.4 0.4 0.3 0.3 0.3 0.3 0.3 -0.8Gabon . . . . . . . . . . . . . . . . . . . . . . . . . 0.2 0.2 0.2 0.2 0.2 0.2 0.1 0.1 -2.3Sao Tome and Principe. . . . . . . . . . . . 0.0 0.0 0.0 0.0 0.0 0.0 0.0 0.0 —Sudan . . . . . . . . . . . . . . . . . . . . . . . . . 0.4 0.5 0.5 0.5 0.5 0.6 0.7 0.7 1.6Other . . . . . . . . . . . . . . . . . . . . . . . . . . 0.3 0.3 0.3 0.7 0.7 0.7 0.7 0.6 2.7
Central and South America . . . . . . . . 3.7 3.7 3.8 4.8 5.4 5.9 6.5 6.9 2.3Brazil . . . . . . . . . . . . . . . . . . . . . . . . . . 1.9 1.9 1.9 2.8 3.4 3.8 4.2 4.8 3.4Argentina. . . . . . . . . . . . . . . . . . . . . . . 0.8 0.8 0.8 0.6 0.5 0.5 0.5 0.5 -1.9Colombia . . . . . . . . . . . . . . . . . . . . . . . 0.5 0.5 0.6 0.8 0.7 0.6 0.6 0.5 -0.5Peru. . . . . . . . . . . . . . . . . . . . . . . . . . . 0.1 0.1 0.1 0.2 0.3 0.3 0.3 0.3 3.7Trinidad and Tobago . . . . . . . . . . . . . . 0.2 0.2 0.2 0.2 0.2 0.2 0.2 0.2 0.7Other . . . . . . . . . . . . . . . . . . . . . . . . . . 0.2 0.2 0.2 0.2 0.3 0.4 0.6 0.7 5.2
Total World . . . . . . . . . . . . . . . . . . . . . . . 81.8 81.5 81.6 80.7 80.4 82.1 84.1 85.8 0.2
OPEC Share of World Production. . . . . . . 42% 41% 43% 44% 44% 45% 45% 46%Persian Gulf Share of World Production . . 29% 28% 30% 30% 31% 32% 33% 35%
Note: Conventional liquids include crude oil and lease condensate, natural gas plant liquids, and refinery gain.Sources: History: U.S. Energy Information Administration (EIA), Office of Energy Markets and End Use. Projections: EIA, Gen-
erate World Oil Balance Model (2010).
Table G15. World unconventional liquids production by region and country, Low Economic Growth case,2006-2035(Million barrels per day)
Appendix G
268 U.S. Energy Information Administration / International Energy Outlook 2010
Region/Country
History (estimates) Projections Average annualpercent change,
2007-20352006 2007 2008 2015 2020 2025 2030 2035
OPECa . . . . . . . . . . . . . . . . . . . . . . . . . . . 0.6 0.6 0.7 1.0 1.4 1.5 1.6 1.8 3.9Biofuels . . . . . . . . . . . . . . . . . . . . . . . . . . 0.0 0.0 0.0 0.0 0.0 0.0 0.0 0.0 —Extra-Heavy Oil (Venezuela). . . . . . . . . . 0.6 0.6 0.7 0.8 1.1 1.2 1.4 1.6 3.3Coal-to-Liquids . . . . . . . . . . . . . . . . . . . . 0.0 0.0 0.0 0.0 0.0 0.0 0.0 0.0 —Gas-to-Liquids (primarily Qatar) . . . . . . . 0.0 0.0 0.0 0.2 0.2 0.3 0.3 0.3 16.1
Non-OPEC . . . . . . . . . . . . . . . . . . . . . . . . 2.3 2.8 3.3 5.1 6.3 7.7 9.2 11.1 4.7OECD . . . . . . . . . . . . . . . . . . . . . . . . . . . 1.7 2.0 2.4 3.7 4.4 5.2 6.3 7.8 4.5Biofuels . . . . . . . . . . . . . . . . . . . . . . . . . 0.5 0.6 0.9 1.3 1.5 1.6 1.7 2.1 3.3Oil Sands/Bitumen (Canada) . . . . . . . . 1.2 1.4 1.5 2.3 2.8 3.4 4.2 5.1 4.6Extra-Heavy Oil (Mexico) . . . . . . . . . . . 0.0 0.0 0.0 0.0 0.0 0.1 0.1 0.1 8.5Coal-to-Liquids . . . . . . . . . . . . . . . . . . . 0.0 0.0 0.0 0.1 0.1 0.1 0.2 0.2 22.3Gas-to-Liquids. . . . . . . . . . . . . . . . . . . . 0.0 0.0 0.0 0.0 0.0 0.0 0.0 0.0 —Shale Oil . . . . . . . . . . . . . . . . . . . . . . . . 0.0 0.0 0.0 0.0 0.0 0.1 0.1 0.4 —
Non-OECD . . . . . . . . . . . . . . . . . . . . . . . 0.6 0.7 0.9 1.4 1.9 2.4 3.0 3.3 5.1Biofuels . . . . . . . . . . . . . . . . . . . . . . . . . 0.4 0.5 0.6 1.1 1.4 1.7 2.0 2.1 4.5Extra-Heavy Oil . . . . . . . . . . . . . . . . . . . 0.0 0.0 0.0 0.0 0.0 0.0 0.0 0.0 —Coal-to-Liquids . . . . . . . . . . . . . . . . . . . 0.1 0.2 0.2 0.2 0.4 0.6 0.9 1.1 7.3Gas-to-Liquids. . . . . . . . . . . . . . . . . . . . 0.0 0.0 0.0 0.1 0.1 0.1 0.1 0.1 3.3Shale Oil . . . . . . . . . . . . . . . . . . . . . . . . 0.0 0.0 0.0 0.0 0.0 0.0 0.0 0.0 0.6
WorldBiofuels . . . . . . . . . . . . . . . . . . . . . . . . . . 0.9 1.2 1.5 2.4 2.9 3.3 3.7 4.2 3.8Oil Sands/Bitumen . . . . . . . . . . . . . . . . . 1.2 1.4 1.5 2.3 2.8 3.4 4.2 5.1 4.6Extra-Heavy Oil . . . . . . . . . . . . . . . . . . . . 0.6 0.6 0.7 0.8 1.2 1.3 1.4 1.6 3.4Coal-to-Liquids . . . . . . . . . . . . . . . . . . . . 0.1 0.2 0.2 0.3 0.5 0.8 1.1 1.3 8.0Gas-to-Liquids. . . . . . . . . . . . . . . . . . . . . 0.0 0.1 0.1 0.3 0.3 0.4 0.4 0.4 7.9Shale Oil . . . . . . . . . . . . . . . . . . . . . . . . . 0.0 0.0 0.0 0.0 0.0 0.1 0.2 0.4 16.3
World Total . . . . . . . . . . . . . . . . . . . . . . . 2.9 3.4 3.9 6.1 7.7 9.2 10.9 13.0 4.5
Selected Country HighlightsBiofuelsBrazil . . . . . . . . . . . . . . . . . . . . . . . . . . . 0.3 0.3 0.5 0.9 1.1 1.3 1.5 1.6 4.7China. . . . . . . . . . . . . . . . . . . . . . . . . . . 0.1 0.2 0.0 0.0 0.1 0.1 0.2 0.2 7.3India . . . . . . . . . . . . . . . . . . . . . . . . . . . 0.0 0.0 0.0 0.0 0.0 0.0 0.0 0.0 1.2United States. . . . . . . . . . . . . . . . . . . . . 0.3 0.5 0.7 1.0 1.2 1.3 1.4 1.7 3.7
Coal-to-LiquidsAustralia and New Zealand . . . . . . . . . . 0.0 0.0 0.0 0.0 0.0 0.0 0.0 0.0 —China. . . . . . . . . . . . . . . . . . . . . . . . . . . 0.0 0.0 0.0 0.0 0.1 0.3 0.5 0.7 27.3Germany . . . . . . . . . . . . . . . . . . . . . . . . 0.0 0.0 0.0 0.0 0.0 0.0 0.0 0.0 0.3India . . . . . . . . . . . . . . . . . . . . . . . . . . . 0.0 0.0 0.0 0.0 0.0 0.1 0.1 0.1 —South Africa. . . . . . . . . . . . . . . . . . . . . . 0.1 0.2 0.2 0.2 0.3 0.3 0.3 0.3 2.0United States. . . . . . . . . . . . . . . . . . . . . 0.0 0.0 0.0 0.1 0.1 0.1 0.2 0.2 —
Gas-to-LiquidsQatar . . . . . . . . . . . . . . . . . . . . . . . . . . . 0.0 0.0 0.0 0.2 0.2 0.2 0.2 0.2 15.5South Africa. . . . . . . . . . . . . . . . . . . . . . 0.0 0.0 0.0 0.1 0.1 0.1 0.1 0.1 1.0
aOPEC = Organization of the Petroleum Exporting Countries (OPEC-12).Sources: History: U.S. Energy Information Administration (EIA), Office of Energy Markets and End Use. Projections: EIA, Gen-
erate World Oil Balance Model (2010).

Appendix H
Reference Case Projections forElectricity Capacity and Generation by Fuel

This page intentionally left blank.

Table H1. World total installed generating capacity by region and country, 2007-2035(Gigawatts)
Reference Case electricity capacity and generation projections
U.S. Energy Information Administration / International Energy Outlook 2010 271
Region/Country
History Projections Average annualpercent change,
2007-20352007 2015 2020 2025 2030 2035
OECDOECD North America . . . . . . . . . . . 1,176 1,266 1,290 1,340 1,410 1,491 0.9
United Statesa. . . . . . . . . . . . . . . . . 995 1,069 1,082 1,114 1,162 1,216 0.7Canada . . . . . . . . . . . . . . . . . . . . . . 125 136 138 146 158 171 1.1Mexico. . . . . . . . . . . . . . . . . . . . . . . 56 62 70 80 91 104 2.2
OECD Europe . . . . . . . . . . . . . . . . . 836 874 928 972 1,004 1,034 0.8OECD Asia . . . . . . . . . . . . . . . . . . . . 415 391 401 413 425 437 0.2Japan . . . . . . . . . . . . . . . . . . . . . . . 279 247 247 248 250 250 -0.4South Korea . . . . . . . . . . . . . . . . . . 73 75 83 92 101 111 1.5Australia/New Zealand . . . . . . . . . . 63 69 71 73 74 76 0.7Total OECD . . . . . . . . . . . . . . . . . 2,427 2,532 2,620 2,725 2,840 2,962 0.7
Non-OECDNon-OECD Europe and Eurasia. . . 404 410 429 448 470 498 0.7Russia . . . . . . . . . . . . . . . . . . . . . . . 221 228 239 251 265 282 0.9Other . . . . . . . . . . . . . . . . . . . . . . . . 183 183 190 197 205 215 0.6
Non-OECD Asia. . . . . . . . . . . . . . . . 1,089 1,471 1,766 2,080 2,360 2,700 3.3China. . . . . . . . . . . . . . . . . . . . . . . . 716 1,021 1,242 1,486 1,686 1,924 3.6India . . . . . . . . . . . . . . . . . . . . . . . . 159 198 234 264 297 339 2.7Other Non-OECD Asia . . . . . . . . . . 215 252 290 330 377 437 2.6
Middle East . . . . . . . . . . . . . . . . . . . 153 174 190 206 221 239 1.6Africa . . . . . . . . . . . . . . . . . . . . . . . . 117 139 155 173 191 212 2.1Central and South America . . . . . . 238 279 310 339 372 398 1.9Brazil . . . . . . . . . . . . . . . . . . . . . . . . 100 125 146 168 191 209 2.7Other Central and South America. . 137 154 163 172 180 189 1.1Total Non-OECD . . . . . . . . . . . . . 2,002 2,473 2,850 3,248 3,613 4,047 2.5
Total World . . . . . . . . . . . . . . . . . . . . 4,428 5,005 5,470 5,973 6,453 7,009 1.7aIncludes the 50 States and the District of Columbia.Note: Totals may not equal sum of components due to independent rounding.Sources: History: Derived from U.S. Energy Information Administration (EIA), International Energy Statistics database (as of
November 2009), web site www.eia.gov/emeu/international. Projections: EIA, Annual Energy Outlook 2010, DOE/EIA-0383(2010)(Washington, DC, April 2010), AEO2010 National Energy Modeling System, run AEO2010R.D111809A, web site www.eia.gov/oiaf/aeo; and World Energy Projection System Plus (2010).

Table H2. World installed liquids-fired generating capacity by region and country, 2007-2035(Gigawatts)
Appendix H
272 U.S. Energy Information Administration / International Energy Outlook 2010
Region/Country
History Projections Average annualpercent change,
2007-20352007 2015 2020 2025 2030 2035
OECDOECD North America . . . . . . . . . . . 138 111 106 105 104 103 -1.0
United Statesa. . . . . . . . . . . . . . . . . 117 92 88 88 88 87 -1.1Canada . . . . . . . . . . . . . . . . . . . . . . 5 5 5 4 4 4 -1.0Mexico. . . . . . . . . . . . . . . . . . . . . . . 15 14 13 12 12 11 -0.9
OECD Europe . . . . . . . . . . . . . . . . . 54 50 48 45 43 41 -1.0OECD Asia . . . . . . . . . . . . . . . . . . . . 66 61 58 55 52 50 -1.0Japan . . . . . . . . . . . . . . . . . . . . . . . 58 54 51 48 46 44 -1.0South Korea . . . . . . . . . . . . . . . . . . 7 6 6 5 5 5 -1.0Australia/New Zealand . . . . . . . . . . 1 1 1 1 1 1 -1.0
Total OECD . . . . . . . . . . . . . . . . . 258 222 212 206 200 194 -1.0
Non-OECDNon-OECD Europe and Eurasia. . . 29 27 26 25 24 23 -0.9Russia . . . . . . . . . . . . . . . . . . . . . . . 9 8 8 7 7 7 -0.8Other . . . . . . . . . . . . . . . . . . . . . . . . 20 19 18 17 16 15 -1.0
Non-OECD Asia. . . . . . . . . . . . . . . . 64 59 56 54 52 51 -0.8China. . . . . . . . . . . . . . . . . . . . . . . . 22 21 20 19 19 18 -0.7India . . . . . . . . . . . . . . . . . . . . . . . . 6 6 6 5 5 5 -1.0Other Non-OECD Asia . . . . . . . . . . 35 33 31 30 28 28 -0.8
Middle East . . . . . . . . . . . . . . . . . . . 45 42 40 38 38 49 0.3Africa . . . . . . . . . . . . . . . . . . . . . . . . 11 10 9 9 8 8 -1.0Central and South America . . . . . . 30 28 26 25 24 23 -1.0
Brazil . . . . . . . . . . . . . . . . . . . . . . . . 3 3 3 3 3 3 -1.0Other Central and South America. . 27 25 23 22 21 20 -1.0Total Non-OECD . . . . . . . . . . . . . 179 165 157 150 145 153 -0.6
Total World . . . . . . . . . . . . . . . . . . . . 436 387 369 355 345 346 -0.8aIncludes the 50 States and the District of Columbia.Note: Totals may not equal sum of components due to independent rounding.Sources: History: Derived from U.S. Energy Information Administration (EIA), International Energy Statistics database (as of
November 2009), web site www.eia.gov/emeu/international. Projections: EIA, Annual Energy Outlook 2010, DOE/EIA-0383(2010)(Washington, DC, April 2010), AEO2010 National Energy Modeling System, run AEO2010R.D111809A, web site www.eia.gov/oiaf/aeo; and World Energy Projection System Plus (2010).

Table H3. World installed natural-gas-fired generating capacity by region and country, 2007-2035(Gigawatts)
Reference Case electricity capacity and generation projections
U.S. Energy Information Administration / International Energy Outlook 2010 273
Region/Country
History Projections Average annualpercent change,
2007-20352007 2015 2020 2025 2030 2035
OECDOECD North America . . . . . . . . . . . 358 380 391 424 469 514 1.3United Statesa. . . . . . . . . . . . . . . . . 330 349 354 375 409 443 1.1Canada . . . . . . . . . . . . . . . . . . . . . . 8 8 7 10 12 14 1.9Mexico. . . . . . . . . . . . . . . . . . . . . . . 19 23 30 39 48 57 4.0
OECD Europe . . . . . . . . . . . . . . . . . 175 164 174 181 195 206 0.6OECD Asia . . . . . . . . . . . . . . . . . . . . 107 103 106 112 114 113 0.2Japan . . . . . . . . . . . . . . . . . . . . . . . 74 68 68 71 72 71 -0.1South Korea . . . . . . . . . . . . . . . . . . 20 21 23 25 26 26 0.9Australia/New Zealand . . . . . . . . . . 13 14 15 16 16 16 0.7Total OECD . . . . . . . . . . . . . . . . . 640 647 671 717 777 834 1.0
Non-OECDNon-OECD Europe and Eurasia. . . 145 146 150 155 160 161 0.4Russia . . . . . . . . . . . . . . . . . . . . . . . 98 97 98 98 99 100 0.1Other . . . . . . . . . . . . . . . . . . . . . . . . 47 48 53 57 60 61 1.0
Non-OECD Asia. . . . . . . . . . . . . . . . 135 157 185 206 216 221 1.8China. . . . . . . . . . . . . . . . . . . . . . . . 36 39 42 44 46 50 1.1India . . . . . . . . . . . . . . . . . . . . . . . . 20 28 37 41 42 43 2.8Other Non-OECD Asia . . . . . . . . . . 78 90 106 121 127 129 1.8
Middle East . . . . . . . . . . . . . . . . . . . 94 112 126 142 154 158 1.9Africa . . . . . . . . . . . . . . . . . . . . . . . . 40 54 66 77 81 82 2.6Central and South America . . . . . . 51 58 68 77 84 88 2.0Brazil . . . . . . . . . . . . . . . . . . . . . . . . 9 13 19 23 28 32 4.5Other Central and South America. . 42 44 49 54 56 57 1.1Total Non-OECD . . . . . . . . . . . . . 464 526 596 656 695 711 1.5
Total World . . . . . . . . . . . . . . . . . . . . 1,103 1,172 1,266 1,374 1,472 1,545 1.2aIncludes the 50 States and the District of Columbia.Note: Totals may not equal sum of components due to independent rounding.Sources: History: Derived from U.S. Energy Information Administration (EIA), International Energy Statistics database (as of
November 2009), web site www.eia.gov/emeu/international. Projections: EIA, Annual Energy Outlook 2010, DOE/EIA-0383(2010)(Washington, DC, April 2010), AEO2010 National Energy Modeling System, run AEO2010R.D111809A, web site www.eia.gov/oiaf/aeo; and World Energy Projection System Plus (2010).
Table H4. World installed coal-fired generating capacity by region and country, 2007-2035(Gigawatts)
Appendix H
274 U.S. Energy Information Administration / International Energy Outlook 2010
Region/Country
History Projections Average annualpercent change,
2007-20352007 2015 2020 2025 2030 2035
OECDOECD North America . . . . . . . . . . . 340 345 346 347 352 363 0.2United Statesa. . . . . . . . . . . . . . . . . 313 325 326 327 330 337 0.3Canada . . . . . . . . . . . . . . . . . . . . . . 21 14 14 14 15 16 -0.8Mexico. . . . . . . . . . . . . . . . . . . . . . . 7 6 6 6 7 10 1.4
OECD Europe . . . . . . . . . . . . . . . . . 200 189 182 176 174 177 -0.4OECD Asia . . . . . . . . . . . . . . . . . . . . 99 95 94 98 104 113 0.5Japan . . . . . . . . . . . . . . . . . . . . . . . 45 42 41 40 39 39 -0.5South Korea . . . . . . . . . . . . . . . . . . 23 22 23 27 33 41 2.1Australia/New Zealand . . . . . . . . . . 31 30 31 31 32 33 0.3Total OECD . . . . . . . . . . . . . . . . . 639 629 622 621 630 653 0.1
Non-OECDNon-OECD Europe and Eurasia. . . 98 97 95 96 103 118 0.7Russia . . . . . . . . . . . . . . . . . . . . . . . 44 44 44 44 50 61 1.1Other . . . . . . . . . . . . . . . . . . . . . . . . 54 52 51 51 53 57 0.2
Non-OECD Asia. . . . . . . . . . . . . . . . 630 764 896 1,072 1,277 1,509 3.2China. . . . . . . . . . . . . . . . . . . . . . . . 496 625 750 901 1,062 1,233 3.3India . . . . . . . . . . . . . . . . . . . . . . . . 84 86 89 98 113 135 1.7Other Non-OECD Asia . . . . . . . . . . 50 53 57 72 102 141 3.8
Middle East . . . . . . . . . . . . . . . . . . . 6 5 5 5 5 5 -0.4Africa . . . . . . . . . . . . . . . . . . . . . . . . 41 41 43 47 56 70 1.9Central and South America . . . . . . 10 10 9 9 9 11 0.1Brazil . . . . . . . . . . . . . . . . . . . . . . . . 2 2 2 2 2 3 0.8Other Central and South America. . 8 8 7 7 7 8 -0.1
Total Non-OECD . . . . . . . . . . . . . 786 916 1,049 1,228 1,450 1,713 2.8
Total World . . . . . . . . . . . . . . . . . . . . 1,425 1,545 1,671 1,849 2,080 2,366 1.8aIncludes the 50 States and the District of Columbia.Note: Totals may not equal sum of components due to independent rounding.Sources: History: Derived from U.S. Energy Information Administration (EIA), International Energy Statistics database (as of
November 2009), web site www.eia.gov/emeu/international. Projections: EIA, Annual Energy Outlook 2010, DOE/EIA-0383(2010)(Washington, DC, April 2010), AEO2010 National Energy Modeling System, run AEO2010R.D111809A, web site www.eia.gov/oiaf/aeo; and World Energy Projection System Plus (2010).

Table H5. World installed nuclear generating capacity by region and country, 2007-2035(Gigawatts)
Reference Case electricity capacity and generation projections
U.S. Energy Information Administration / International Energy Outlook 2010 275
Region/Country
History Projections Average annualpercent change,
2007-20352007 2015 2020 2025 2030 2035
OECDOECD North America . . . . . . . . . . . 115 121 129 130 132 136 0.6United Statesa. . . . . . . . . . . . . . . . . 101 105 111 111 111 113 0.4Canada . . . . . . . . . . . . . . . . . . . . . . 13 15 17 18 19 21 1.6Mexico. . . . . . . . . . . . . . . . . . . . . . . 1 1 1 1 2 2 2.0
OECD Europe . . . . . . . . . . . . . . . . . 131 130 133 137 142 144 0.3OECD Asia . . . . . . . . . . . . . . . . . . . . 67 74 82 85 90 94 1.2Japan . . . . . . . . . . . . . . . . . . . . . . . 49 52 55 56 59 61 0.8South Korea . . . . . . . . . . . . . . . . . . 18 22 27 29 31 33 2.2Australia/New Zealand . . . . . . . . . . 0 0 0 0 0 0 —
Total OECD . . . . . . . . . . . . . . . . . 313 325 344 353 364 374 0.6
Non-OECDNon-OECD Europe and Eurasia. . . 43 49 60 70 74 79 2.2Russia . . . . . . . . . . . . . . . . . . . . . . . 23 28 36 44 46 48 2.6Other . . . . . . . . . . . . . . . . . . . . . . . . 19 20 23 26 28 31 1.7
Non-OECD Asia. . . . . . . . . . . . . . . . 19 42 72 91 105 120 6.9China. . . . . . . . . . . . . . . . . . . . . . . . 9 25 44 56 65 75 7.9India . . . . . . . . . . . . . . . . . . . . . . . . 4 9 16 21 24 27 6.9Other Non-OECD Asia . . . . . . . . . . 6 8 12 14 16 18 4.4
Middle East . . . . . . . . . . . . . . . . . . . 0 1 3 4 6 7 —Africa . . . . . . . . . . . . . . . . . . . . . . . . 2 2 2 3 3 4 3.0Central and South America . . . . . . 3 4 5 6 6 8 3.6Brazil . . . . . . . . . . . . . . . . . . . . . . . . 2 3 3 4 4 5 3.6Other Central and South America. . 1 1 2 2 2 3 3.7
Total Non-OECD . . . . . . . . . . . . . 66 98 141 174 194 219 4.4
Total World . . . . . . . . . . . . . . . . . . . . 380 423 485 527 558 593 1.6aIncludes the 50 States and the District of Columbia.Note: Totals may not equal sum of components due to independent rounding.Sources: History: Derived from U.S. Energy Information Administration (EIA), International Energy Statistics database (as of
November 2009), web site www.eia.gov/emeu/international. Projections: EIA, Annual Energy Outlook 2010, DOE/EIA-0383(2010)(Washington, DC, April 2010), AEO2010 National Energy Modeling System, run AEO2010R.D111809A, web site www.eia.gov/oiaf/aeo; and World Energy Projection System Plus (2010).

Table H6. World installed hydroelectric generating capacity by region and country, 2007-2035(Gigawatts)
Appendix H
276 U.S. Energy Information Administration / International Energy Outlook 2010
Region/Country
History Projections Average annualpercent change,
2007-20352007 2015 2020 2025 2030 2035
OECDOECD North America . . . . . . . . . . . 164 169 172 177 184 191 0.5United Statesa. . . . . . . . . . . . . . . . . 78 77 77 77 77 78 0.0Canada . . . . . . . . . . . . . . . . . . . . . . 73 78 79 83 89 96 1.0Mexico. . . . . . . . . . . . . . . . . . . . . . . 13 14 15 17 17 17 0.9
OECD Europe . . . . . . . . . . . . . . . . . 147 155 162 169 177 180 0.7OECD Asia . . . . . . . . . . . . . . . . . . . . 37 38 38 38 39 40 0.3Japan . . . . . . . . . . . . . . . . . . . . . . . 22 23 23 23 24 24 0.4South Korea . . . . . . . . . . . . . . . . . . 2 2 2 2 2 2 0.1Australia/New Zealand . . . . . . . . . . 13 13 13 13 14 14 0.2Total OECD . . . . . . . . . . . . . . . . . 348 362 371 385 399 411 0.6
Non-OECDNon-OECD Europe and Eurasia. . . 87 91 96 101 107 114 1.0Russia . . . . . . . . . . . . . . . . . . . . . . . 46 49 53 57 61 66 1.3Other . . . . . . . . . . . . . . . . . . . . . . . . 41 42 43 44 46 49 0.6
Non-OECD Asia. . . . . . . . . . . . . . . . 220 373 442 498 519 573 3.5China. . . . . . . . . . . . . . . . . . . . . . . . 145 256 298 339 342 368 3.4India . . . . . . . . . . . . . . . . . . . . . . . . 35 54 67 74 85 98 3.7Other Non-OECD Asia . . . . . . . . . . 40 63 77 85 93 107 3.6
Middle East . . . . . . . . . . . . . . . . . . . 9 13 14 15 17 18 2.4Africa . . . . . . . . . . . . . . . . . . . . . . . . 22 29 31 33 37 42 2.4Central and South America . . . . . . 136 169 191 212 237 256 2.3Brazil . . . . . . . . . . . . . . . . . . . . . . . . 77 96 111 127 145 157 2.6Other Central and South America. . 59 74 80 85 92 99 1.9Total Non-OECD . . . . . . . . . . . . . 474 675 774 860 917 1,003 2.7
Total World . . . . . . . . . . . . . . . . . . . . 822 1,037 1,145 1,244 1,316 1,414 2.0aIncludes the 50 States and the District of Columbia.Note: Totals may not equal sum of components due to independent rounding.Sources: History: Derived from U.S. Energy Information Administration (EIA), International Energy Statistics database (as of
November 2009), web site www.eia.gov/emeu/international. Projections: EIA, Annual Energy Outlook 2010, DOE/EIA-0383(2010)(Washington, DC, April 2010), AEO2010 National Energy Modeling System, run AEO2010R.D111809A, web site www.eia.gov/oiaf/aeo; and World Energy Projection System Plus (2010).

Table H7. World installed wind-powered generating capacity by region and country, 2007-2035(Gigawatts)
Reference Case electricity capacity and generation projections
U.S. Energy Information Administration / International Energy Outlook 2010 277
Region/Country
History Projections Average annualpercent change,
2007-20352007 2015 2020 2025 2030 2035
OECDOECD North America . . . . . . . . . . . 18 80 81 83 85 90 5.9United Statesa. . . . . . . . . . . . . . . . . 16 64 64 66 66 69 5.3Canada . . . . . . . . . . . . . . . . . . . . . . 2 14 15 15 16 17 8.3Mexico. . . . . . . . . . . . . . . . . . . . . . . 0 2 2 2 3 3 13.7
OECD Europe . . . . . . . . . . . . . . . . . 57 127 170 200 210 219 4.9OECD Asia . . . . . . . . . . . . . . . . . . . . 3 11 12 12 13 14 5.4Japan . . . . . . . . . . . . . . . . . . . . . . . 2 3 3 3 3 3 2.0South Korea . . . . . . . . . . . . . . . . . . 0 1 2 2 3 4 11.2Australia/New Zealand . . . . . . . . . . 2 7 7 7 8 8 5.9
Total OECD . . . . . . . . . . . . . . . . . 78 218 263 296 308 323 5.2
Non-OECDNon-OECD Europe and Eurasia. . . 0 1 1 1 1 2 5.8Russia . . . . . . . . . . . . . . . . . . . . . . . 0 0 0 0 0 0 0.0Other . . . . . . . . . . . . . . . . . . . . . . . . 0 1 1 1 1 2 6.0
Non-OECD Asia. . . . . . . . . . . . . . . . 14 52 77 105 131 154 8.9China. . . . . . . . . . . . . . . . . . . . . . . . 6 39 63 86 110 130 11.7India . . . . . . . . . . . . . . . . . . . . . . . . 8 11 13 16 18 20 3.5Other Non-OECD Asia . . . . . . . . . . 0 1 2 3 3 4 9.4
Middle East . . . . . . . . . . . . . . . . . . . 0 1 1 1 1 1 8.1Africa . . . . . . . . . . . . . . . . . . . . . . . . 0 2 2 2 3 3 6.6Central and South America . . . . . . 0 3 3 3 4 4 8.2Brazil . . . . . . . . . . . . . . . . . . . . . . . . 0 2 2 2 2 3 8.6Other Central and South America. . 0 1 1 1 1 1 7.4
Total Non-OECD . . . . . . . . . . . . . 15 59 85 113 140 163 8.8
Total World . . . . . . . . . . . . . . . . . . . . 93 277 347 409 448 486 6.1aIncludes the 50 States and the District of Columbia.Note: Totals may not equal sum of components due to independent rounding.Sources: History: Derived from U.S. Energy Information Administration (EIA), International Energy Statistics database (as of
November 2009), web site www.eia.gov/emeu/international. Projections: EIA, Annual Energy Outlook 2010, DOE/EIA-0383(2010)(Washington, DC, April 2010), AEO2010 National Energy Modeling System, run AEO2010R.D111809A, web site www.eia.oiaf/aeo;and World Energy Projection System Plus (2010).

Table H8. World Installed geothermal generating capacity by region and country, 2007-2035(Gigawatts)
Appendix H
278 U.S. Energy Information Administration / International Energy Outlook 2010
Region/Country
History Projections Average annualpercent change,
2007-20352007 2015 2020 2025 2030 2035
OECDOECD North America . . . . . . . . . . . 3 4 5 5 5 6 2.1United Statesa. . . . . . . . . . . . . . . . . 2 3 3 3 4 4 1.8Canada . . . . . . . . . . . . . . . . . . . . . . 0 0 0 0 0 0 —Mexico. . . . . . . . . . . . . . . . . . . . . . . 1 1 1 2 2 2 2.9
OECD Europe . . . . . . . . . . . . . . . . . 1 2 2 2 2 2 1.7OECD Asia . . . . . . . . . . . . . . . . . . . . 1 2 2 2 3 3 3.8Japan . . . . . . . . . . . . . . . . . . . . . . . 1 1 1 1 1 1 0.3South Korea . . . . . . . . . . . . . . . . . . 0 0 0 0 0 0 —Australia/New Zealand . . . . . . . . . . 0 1 2 2 2 2 5.8
Total OECD . . . . . . . . . . . . . . . . . 5 8 8 9 10 11 2.4
Non-OECDNon-OECD Europe and Eurasia. . . 0 0 0 0 0 0 5.3Russia . . . . . . . . . . . . . . . . . . . . . . . 0 0 0 0 0 0 4.8Other . . . . . . . . . . . . . . . . . . . . . . . . 0 0 0 0 0 0 —
Non-OECD Asia. . . . . . . . . . . . . . . . 3 5 6 6 8 9 4.2China. . . . . . . . . . . . . . . . . . . . . . . . 0 0 0 0 0 0 —India . . . . . . . . . . . . . . . . . . . . . . . . 0 0 0 0 0 0 —Other Non-OECD Asia . . . . . . . . . . 3 5 5 6 8 9 4.1
Middle East . . . . . . . . . . . . . . . . . . . 0 0 0 0 0 0 —Africa . . . . . . . . . . . . . . . . . . . . . . . . 0 0 0 0 0 0 4.2Central and South America . . . . . . 0 1 1 1 1 1 2.9Brazil . . . . . . . . . . . . . . . . . . . . . . . . 0 0 0 0 0 0 —Other Central and South America. . 0 1 1 1 1 1 2.9
Total Non-OECD . . . . . . . . . . . . . 4 6 7 8 10 11 4.1
Total World . . . . . . . . . . . . . . . . . . . . 9 14 15 17 20 22 3.2aIncludes the 50 States and the District of Columbia.Note: Totals may not equal sum of components due to independent rounding.Sources: History: Derived from U.S. Energy Information Administration (EIA), International Energy Statistics database (as of
November 2009), web site www.eia.gov/emeu/international. Projections: EIA, Annual Energy Outlook 2010, DOE/EIA-0383(2010)(Washington, DC, April 2010), AEO2010 National Energy Modeling System, run AEO2010R.D111809A, web site www.eia.gov/oiaf/aeo; and World Energy Projection System Plus (2010).

Table H9. World installed solar generating capacity by region and country, 2007-2035(Gigawatts)
Reference Case electricity capacity and generation projections
U.S. Energy Information Administration / International Energy Outlook 2010 279
Region/Country
History Projections Average annualpercent change,
2007-20352007 2015 2020 2025 2030 2035
OECDOECD North America . . . . . . . . . . . 1 1 1 1 1 2 3.5United Statesa. . . . . . . . . . . . . . . . . 1 1 1 1 1 1 3.3Canada . . . . . . . . . . . . . . . . . . . . . . 0 0 0 0 0 0 0.0Mexico. . . . . . . . . . . . . . . . . . . . . . . 0 0 0 0 0 0 7.9
OECD Europe . . . . . . . . . . . . . . . . . 5 31 33 34 35 37 7.6OECD Asia . . . . . . . . . . . . . . . . . . . . 2 6 7 7 7 8 4.8Japan . . . . . . . . . . . . . . . . . . . . . . . 2 4 5 5 5 5 3.7South Korea . . . . . . . . . . . . . . . . . . 0 1 1 1 1 1 10.3Australia/New Zealand . . . . . . . . . . 0 1 1 1 1 1 17.5
Total OECD . . . . . . . . . . . . . . . . . 7 39 41 42 44 46 6.7
Non-OECDNon-OECD Europe and Eurasia. . . 0 0 0 0 0 0 —Russia . . . . . . . . . . . . . . . . . . . . . . . 0 0 0 0 0 0 —Other . . . . . . . . . . . . . . . . . . . . . . . . 0 0 0 0 0 0 —
Non-OECD Asia. . . . . . . . . . . . . . . . 0 5 9 11 12 13 20.0China. . . . . . . . . . . . . . . . . . . . . . . . 0 4 6 6 6 6 16.9India . . . . . . . . . . . . . . . . . . . . . . . . 0 1 3 5 6 7 —Other Non-OECD Asia . . . . . . . . . . 0 0 0 0 0 0 —
Middle East . . . . . . . . . . . . . . . . . . . 0 1 1 2 2 2 —Africa . . . . . . . . . . . . . . . . . . . . . . . . 0 1 1 2 2 3 22.2Central and South America . . . . . . 0 0 0 0 0 0 0.0Brazil . . . . . . . . . . . . . . . . . . . . . . . . 0 0 0 0 0 0 —Other Central and South America. . 0 0 0 0 0 0 0.0
Total Non-OECD . . . . . . . . . . . . . 0 6 12 15 16 18 19.9
Total World . . . . . . . . . . . . . . . . . . . . 8 45 53 57 60 64 7.9aIncludes the 50 States and the District of Columbia.Note: Totals may not equal sum of components due to independent rounding.Sources: History: Derived from U.S. Energy Information Administration (EIA), International Energy Statistics database (as of
November 2009), web site www.eia.gov/emeu/international. Projections: EIA, Annual Energy Outlook 2010, DOE/EIA-0383(2010)(Washington, DC, April 2010), AEO2010 National Energy Modeling System, run AEO2010R.D111809A, web site www.eia.gov/oiaf/aeo; and World Energy Projection System Plus (2010).

Table H10. World installed other renewable generating capacity by region and country, 2007-2035(Gigawatts)
Appendix H
280 U.S. Energy Information Administration / International Energy Outlook 2010
Region/Country
History Projections Average annualpercent change,
2007-20352007 2015 2020 2025 2030 2035
OECDOECD North America . . . . . . . . . . . 7 11 11 12 14 19 3.4United Statesa. . . . . . . . . . . . . . . . . 6 9 9 10 12 17 4.0Canada . . . . . . . . . . . . . . . . . . . . . . 2 2 2 2 2 2 0.5Mexico. . . . . . . . . . . . . . . . . . . . . . . 0 0 0 0 1 1 2.6
OECD Europe . . . . . . . . . . . . . . . . . 25 26 26 27 27 28 0.4OECD Asia . . . . . . . . . . . . . . . . . . . . 3 3 3 3 3 3 0.4Japan . . . . . . . . . . . . . . . . . . . . . . . 2 2 2 2 2 2 0.6South Korea . . . . . . . . . . . . . . . . . . 0 0 0 0 0 0 0.2Australia/New Zealand . . . . . . . . . . 1 1 1 1 1 1 0.3
Total OECD . . . . . . . . . . . . . . . . . 35 40 40 41 44 50 1.3
Non-OECDNon-OECD Europe and Eurasia. . . 0 0 0 0 0 0 —Russia . . . . . . . . . . . . . . . . . . . . . . . 0 0 0 0 0 0 —Other . . . . . . . . . . . . . . . . . . . . . . . . 0 0 0 0 0 0 —
Non-OECD Asia. . . . . . . . . . . . . . . . 2 15 24 38 39 49 11.7China. . . . . . . . . . . . . . . . . . . . . . . . 1 12 21 34 36 45 15.4India . . . . . . . . . . . . . . . . . . . . . . . . 1 3 3 3 4 4 3.8Other Non-OECD Asia . . . . . . . . . . 0 0 0 0 0 0 —
Middle East . . . . . . . . . . . . . . . . . . . 0 0 0 0 0 0 —Africa . . . . . . . . . . . . . . . . . . . . . . . . 0 0 0 0 0 0 —Central and South America . . . . . . 7 7 7 7 7 8 0.5Brazil . . . . . . . . . . . . . . . . . . . . . . . . 6 6 6 7 7 7 0.4Other Central and South America. . 0 0 0 0 0 0 3.5
Total Non-OECD . . . . . . . . . . . . . 9 22 30 45 47 57 6.9
Total World . . . . . . . . . . . . . . . . . . . . 44 62 70 85 91 107 3.2aIncludes the 50 States and the District of Columbia.Notes: In this table, “other renewable” includes biomass, waste, and tidal/wave/ocean. Totals may not equal sum of components
due to independent rounding.Sources: History: Derived from U.S. Energy Information Administration (EIA), International Energy Statistics database (as of
November 2009), web site www.eia.gov/emeu/international. Projections: EIA, Annual Energy Outlook 2010, DOE/EIA-0383(2010)(Washington, DC, April 2010), AEO2010 National Energy Modeling System, run AEO2010R.D111809A, web site www.eia.gov/oiaf/aeo; and World Energy Projection System Plus (2010).

Table H11. World total net electricity generation from central producers by region and country, 2007-2035(Billion kilowatthours)
Reference Case electricity capacity and generation projections
U.S. Energy Information Administration / International Energy Outlook 2010 281
Region/Country
History Projections Average annualpercent change,
2007-20352007 2015 2020 2025 2030 2035
OECDOECD North America . . . . . . . . . . . 5,003 5,179 5,532 5,903 6,303 6,690 1.0
United Statesa. . . . . . . . . . . . . . . . . 4,139 4,257 4,502 4,747 5,010 5,236 0.8Canada . . . . . . . . . . . . . . . . . . . . . . 621 634 686 742 801 868 1.2Mexico. . . . . . . . . . . . . . . . . . . . . . . 244 288 344 415 492 586 3.2
OECD Europe . . . . . . . . . . . . . . . . . 3,399 3,651 3,904 4,156 4,380 4,596 1.1OECD Asia . . . . . . . . . . . . . . . . . . . . 1,747 1,843 1,976 2,097 2,215 2,336 1.0Japan . . . . . . . . . . . . . . . . . . . . . . . 1,063 1,074 1,125 1,164 1,201 1,236 0.5South Korea . . . . . . . . . . . . . . . . . . 402 449 514 580 650 723 2.1Australia/New Zealand . . . . . . . . . . 282 320 337 352 364 377 1.0Total OECD . . . . . . . . . . . . . . . . . 10,149 10,673 11,413 12,156 12,898 13,621 1.1
Non-OECDNon-OECD Europe and Eurasia. . . 1,592 1,727 1,887 2,058 2,233 2,450 1.6Russia . . . . . . . . . . . . . . . . . . . . . . . 959 1,038 1,134 1,236 1,344 1,477 1.6Other . . . . . . . . . . . . . . . . . . . . . . . . 633 689 753 822 889 973 1.5
Non-OECD Asia. . . . . . . . . . . . . . . . 4,779 6,789 8,607 10,554 12,605 14,790 4.1China. . . . . . . . . . . . . . . . . . . . . . . . 3,041 4,611 5,981 7,476 9,014 10,555 4.5India . . . . . . . . . . . . . . . . . . . . . . . . 762 964 1,166 1,343 1,531 1,778 3.1Other Non-OECD Asia . . . . . . . . . . 976 1,215 1,460 1,735 2,060 2,458 3.4
Middle East . . . . . . . . . . . . . . . . . . . 674 826 950 1,074 1,191 1,330 2.5Africa . . . . . . . . . . . . . . . . . . . . . . . . 581 711 821 947 1,061 1,202 2.6Central and South America . . . . . . 1,009 1,174 1,339 1,499 1,660 1,798 2.1
Brazil . . . . . . . . . . . . . . . . . . . . . . . . 439 554 660 776 898 993 3.0Other Central and South America. . 570 620 678 723 762 805 1.2Total Non-OECD . . . . . . . . . . . . . 8,634 11,226 13,604 16,132 18,751 21,570 3.3
Total World . . . . . . . . . . . . . . . . . . . . 18,783 21,899 25,017 28,288 31,649 35,191 2.3aIncludes the 50 States and the District of Columbia.Note: Totals may not equal sum of components due to independent rounding.Sources: History: Derived from U.S. Energy Information Administration (EIA), International Energy Statistics database (as of
November 2009), web site www.eia.gov/emeu/international. Projections: EIA, Annual Energy Outlook 2010, DOE/EIA-0383(2010)(Washington, DC, April 2010), AEO2010 National Energy Modeling System, run AEO2010R.D111809A, web site www.eia.gov/oiaf/aeo; and World Energy Projection System Plus (2010).

Table H12. World net liquids-fired electricity generation from central producers by region and country,2007-2035(Billion kilowatthours)
Appendix H
282 U.S. Energy Information Administration / International Energy Outlook 2010
Region/Country
History Projections Average annualpercent change,
2007-20352007 2015 2020 2025 2030 2035
OECDOECD North America . . . . . . . . . . . 145 119 117 114 112 110 -1.0
United Statesa. . . . . . . . . . . . . . . . . 65 46 47 48 48 49 -1.0Canada . . . . . . . . . . . . . . . . . . . . . . 17 16 15 14 14 13 -1.0Mexico. . . . . . . . . . . . . . . . . . . . . . . 63 58 55 52 50 48 -0.9
OECD Europe . . . . . . . . . . . . . . . . . 70 65 62 59 56 53 -1.0OECD Asia . . . . . . . . . . . . . . . . . . . . 110 102 97 92 87 83 -1.0Japan . . . . . . . . . . . . . . . . . . . . . . . 89 82 78 75 71 67 -1.0South Korea . . . . . . . . . . . . . . . . . . 20 18 17 17 16 15 -1.0Australia/New Zealand . . . . . . . . . . 1 1 1 1 1 1 -1.0
Total OECD . . . . . . . . . . . . . . . . . 326 286 275 265 255 247 -1.0
Non-OECDNon-OECD Europe and Eurasia. . . 57 53 51 48 47 46 -0.8Russia . . . . . . . . . . . . . . . . . . . . . . . 28 26 25 23 24 23 -0.6Other . . . . . . . . . . . . . . . . . . . . . . . . 29 27 26 25 24 22 -0.9
Non-OECD Asia. . . . . . . . . . . . . . . . 171 161 153 146 143 145 -0.6China. . . . . . . . . . . . . . . . . . . . . . . . 52 51 48 46 48 46 -0.4India . . . . . . . . . . . . . . . . . . . . . . . . 21 19 18 17 17 16 -1.0Other Non-OECD Asia . . . . . . . . . . 98 91 86 82 78 83 -0.6
Middle East . . . . . . . . . . . . . . . . . . . 238 220 209 199 201 283 0.6Africa . . . . . . . . . . . . . . . . . . . . . . . . 62 57 54 52 49 47 -1.0Central and South America . . . . . . 90 83 79 75 71 68 -1.0
Brazil . . . . . . . . . . . . . . . . . . . . . . . . 6 5 5 5 5 4 -1.0Other Central and South America. . 84 78 74 70 67 64 -1.0Total Non-OECD . . . . . . . . . . . . . 617 574 546 519 512 588 -0.2
Total World . . . . . . . . . . . . . . . . . . . . 943 860 821 784 767 835 -0.4aIncludes the 50 States and the District of Columbia.Note: Totals may not equal sum of components due to independent rounding.Sources: History: Derived from U.S. Energy Information Administration (EIA), International Energy Statistics database (as of
November 2009), web site www.eia.gov/emeu/international. Projections: EIA, Annual Energy Outlook 2010, DOE/EIA-0383(2010)(Washington, DC, April 2010), AEO2010 National Energy Modeling System, run AEO2010R.D111809A, web site www.eia.gov/oiaf/aeo; and World Energy Projection System Plus (2010).

Table H13. World net natural-gas-fired electricity generation from central producers by region and country,2007-2035(Billion kilowatthours)
Reference Case electricity capacity and generation projections
U.S. Energy Information Administration / International Energy Outlook 2010 283
Region/Country
History Projections Average annualpercent change,
2007-20352007 2015 2020 2025 2030 2035
OECDOECD North America . . . . . . . . . . . 1,010 833 961 1,147 1,371 1,534 1.5
United Statesa. . . . . . . . . . . . . . . . . 897 690 767 871 1,015 1,093 0.7Canada . . . . . . . . . . . . . . . . . . . . . . 24 22 21 40 57 71 4.0Mexico. . . . . . . . . . . . . . . . . . . . . . . 90 121 173 236 300 369 5.2
OECD Europe . . . . . . . . . . . . . . . . . 747 707 794 867 983 1,082 1.3OECD Asia . . . . . . . . . . . . . . . . . . . . 399 398 434 497 520 528 1.0Japan . . . . . . . . . . . . . . . . . . . . . . . 295 272 282 315 327 332 0.4South Korea . . . . . . . . . . . . . . . . . . 69 79 95 116 124 126 2.2Australia/New Zealand . . . . . . . . . . 36 46 58 67 69 70 2.4Total OECD . . . . . . . . . . . . . . . . . 2,156 1,937 2,190 2,511 2,874 3,144 1.4
Non-OECDNon-OECD Europe and Eurasia. . . 568 609 663 714 767 794 1.2Russia . . . . . . . . . . . . . . . . . . . . . . . 385 404 420 433 457 472 0.7Other . . . . . . . . . . . . . . . . . . . . . . . . 183 206 243 282 310 322 2.0
Non-OECD Asia. . . . . . . . . . . . . . . . 458 642 851 1,010 1,085 1,122 3.2China. . . . . . . . . . . . . . . . . . . . . . . . 66 90 110 124 133 143 2.8India . . . . . . . . . . . . . . . . . . . . . . . . 47 111 175 210 222 228 5.8Other Non-OECD Asia . . . . . . . . . . 346 441 566 676 730 751 2.8
Middle East . . . . . . . . . . . . . . . . . . . 382 529 643 764 862 901 3.1Africa . . . . . . . . . . . . . . . . . . . . . . . . 143 253 344 424 460 471 4.4Central and South America . . . . . . 154 202 276 335 386 416 3.6Brazil . . . . . . . . . . . . . . . . . . . . . . . . 26 56 94 123 160 182 7.2Other Central and South America. . 128 146 182 212 226 234 2.2Total Non-OECD . . . . . . . . . . . . . 1,705 2,235 2,777 3,247 3,561 3,705 2.8
Total World . . . . . . . . . . . . . . . . . . . . 3,861 4,172 4,967 5,758 6,434 6,849 2.1aIncludes the 50 States and the District of Columbia.Note: Totals may not equal sum of components due to independent rounding.Sources: History: Derived from U.S. Energy Information Administration (EIA), International Energy Statistics database (as of
November 2009), web site www.eia.gov/emeu/international. Projections: EIA, Annual Energy Outlook 2010, DOE/EIA-0383(2010)(Washington, DC, April 2010), AEO2010 National Energy Modeling System, run AEO2010R.D111809A, web site www.eia.gov/oiaf/aeo; and World Energy Projection System Plus (2010).
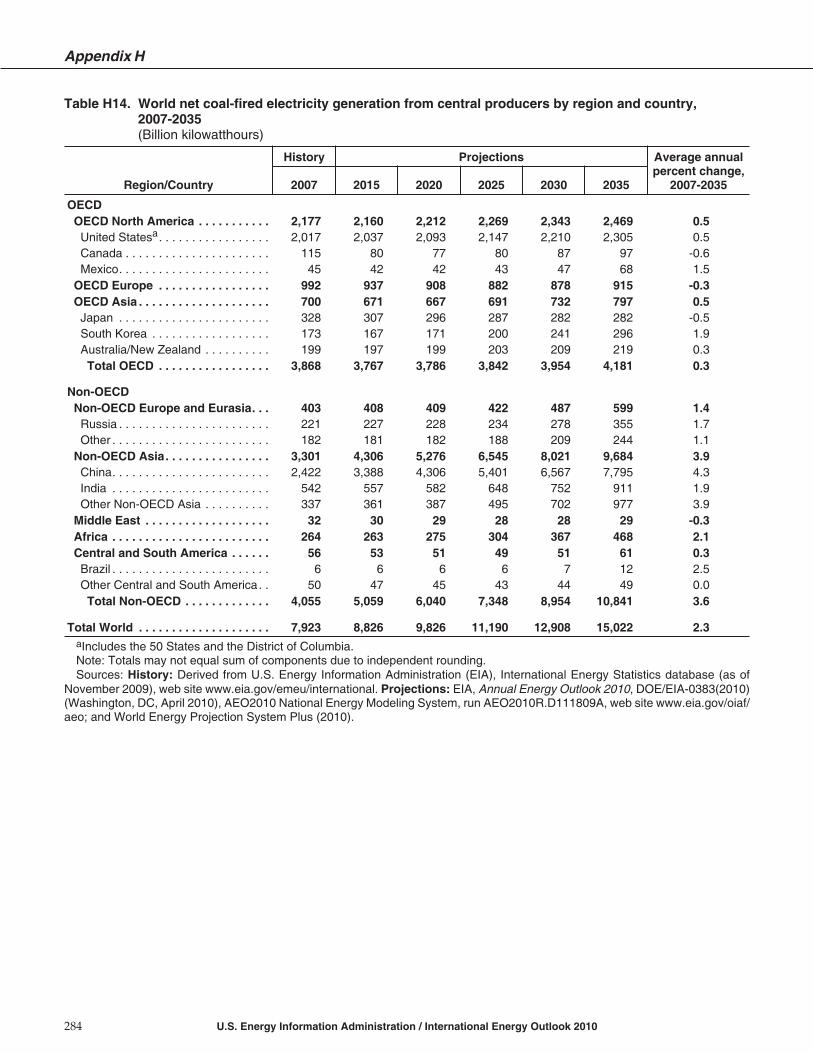
Table H14. World net coal-fired electricity generation from central producers by region and country,2007-2035(Billion kilowatthours)
Appendix H
284 U.S. Energy Information Administration / International Energy Outlook 2010
Region/Country
History Projections Average annualpercent change,
2007-20352007 2015 2020 2025 2030 2035
OECDOECD North America . . . . . . . . . . . 2,177 2,160 2,212 2,269 2,343 2,469 0.5
United Statesa. . . . . . . . . . . . . . . . . 2,017 2,037 2,093 2,147 2,210 2,305 0.5Canada . . . . . . . . . . . . . . . . . . . . . . 115 80 77 80 87 97 -0.6Mexico. . . . . . . . . . . . . . . . . . . . . . . 45 42 42 43 47 68 1.5
OECD Europe . . . . . . . . . . . . . . . . . 992 937 908 882 878 915 -0.3OECD Asia . . . . . . . . . . . . . . . . . . . . 700 671 667 691 732 797 0.5Japan . . . . . . . . . . . . . . . . . . . . . . . 328 307 296 287 282 282 -0.5South Korea . . . . . . . . . . . . . . . . . . 173 167 171 200 241 296 1.9Australia/New Zealand . . . . . . . . . . 199 197 199 203 209 219 0.3Total OECD . . . . . . . . . . . . . . . . . 3,868 3,767 3,786 3,842 3,954 4,181 0.3
Non-OECDNon-OECD Europe and Eurasia. . . 403 408 409 422 487 599 1.4Russia . . . . . . . . . . . . . . . . . . . . . . . 221 227 228 234 278 355 1.7Other . . . . . . . . . . . . . . . . . . . . . . . . 182 181 182 188 209 244 1.1
Non-OECD Asia. . . . . . . . . . . . . . . . 3,301 4,306 5,276 6,545 8,021 9,684 3.9China. . . . . . . . . . . . . . . . . . . . . . . . 2,422 3,388 4,306 5,401 6,567 7,795 4.3India . . . . . . . . . . . . . . . . . . . . . . . . 542 557 582 648 752 911 1.9Other Non-OECD Asia . . . . . . . . . . 337 361 387 495 702 977 3.9
Middle East . . . . . . . . . . . . . . . . . . . 32 30 29 28 28 29 -0.3Africa . . . . . . . . . . . . . . . . . . . . . . . . 264 263 275 304 367 468 2.1Central and South America . . . . . . 56 53 51 49 51 61 0.3Brazil . . . . . . . . . . . . . . . . . . . . . . . . 6 6 6 6 7 12 2.5Other Central and South America. . 50 47 45 43 44 49 0.0Total Non-OECD . . . . . . . . . . . . . 4,055 5,059 6,040 7,348 8,954 10,841 3.6
Total World . . . . . . . . . . . . . . . . . . . . 7,923 8,826 9,826 11,190 12,908 15,022 2.3aIncludes the 50 States and the District of Columbia.Note: Totals may not equal sum of components due to independent rounding.Sources: History: Derived from U.S. Energy Information Administration (EIA), International Energy Statistics database (as of
November 2009), web site www.eia.gov/emeu/international. Projections: EIA, Annual Energy Outlook 2010, DOE/EIA-0383(2010)(Washington, DC, April 2010), AEO2010 National Energy Modeling System, run AEO2010R.D111809A, web site www.eia.gov/oiaf/aeo; and World Energy Projection System Plus (2010).

Table H15. World net nuclear electricity generation from central producers by region and country,2007-2035(Billion kilowatthours)
Reference Case electricity capacity and generation projections
U.S. Energy Information Administration / International Energy Outlook 2010 285
Region/Country
History Projections Average annualpercent change,
2007-20352007 2015 2020 2025 2030 2035
OECDOECD North America . . . . . . . . . . . 905 958 1,020 1,031 1,046 1,074 0.6United Statesa. . . . . . . . . . . . . . . . . 806 834 883 886 886 898 0.4Canada . . . . . . . . . . . . . . . . . . . . . . 89 113 127 134 142 158 2.1Mexico. . . . . . . . . . . . . . . . . . . . . . . 10 11 11 11 18 18 2.2
OECD Europe . . . . . . . . . . . . . . . . . 879 935 967 1,011 1,055 1,084 0.8OECD Asia . . . . . . . . . . . . . . . . . . . . 386 486 560 591 641 683 2.1Japan . . . . . . . . . . . . . . . . . . . . . . . 251 311 342 358 388 417 1.8South Korea . . . . . . . . . . . . . . . . . . 136 175 218 233 254 266 2.4Australia/New Zealand . . . . . . . . . . 0 0 0 0 0 0 —Total OECD . . . . . . . . . . . . . . . . . 2,171 2,379 2,548 2,634 2,742 2,841 1.0
Non-OECDNon-OECD Europe and Eurasia. . . 273 342 425 512 545 588 2.8Russia . . . . . . . . . . . . . . . . . . . . . . . 148 197 258 324 345 364 3.3Other . . . . . . . . . . . . . . . . . . . . . . . . 125 145 167 188 200 224 2.1
Non-OECD Asia. . . . . . . . . . . . . . . . 119 312 543 698 814 942 7.7China. . . . . . . . . . . . . . . . . . . . . . . . 63 186 335 437 512 598 8.4India . . . . . . . . . . . . . . . . . . . . . . . . 16 66 119 156 179 203 9.5Other Non-OECD Asia . . . . . . . . . . 41 61 89 105 123 141 4.5
Middle East . . . . . . . . . . . . . . . . . . . 0 6 20 29 39 49 —Africa . . . . . . . . . . . . . . . . . . . . . . . . 12 15 15 21 21 31 3.5Central and South America . . . . . . 19 28 34 43 43 62 4.3Brazil . . . . . . . . . . . . . . . . . . . . . . . . 12 18 22 31 31 41 4.4Other Central and South America. . 7 10 12 12 12 21 4.2Total Non-OECD . . . . . . . . . . . . . 423 704 1,038 1,303 1,462 1,672 5.0
Total World . . . . . . . . . . . . . . . . . . . . 2,593 3,083 3,586 3,937 4,204 4,514 2.0aIncludes the 50 States and the District of Columbia.Note: Totals may not equal sum of components due to independent rounding.Sources: History: Derived from U.S. Energy Information Administration (EIA), International Energy Statistics database (as of
November 2009), web site www.eia.gov/emeu/international. Projections: EIA, Annual Energy Outlook 2010, DOE/EIA-0383(2010)(Washington, DC, April 2010), AEO2010 National Energy Modeling System, run AEO2010R.D111809A, web site www.eia.gov/oiaf/aeo; and World Energy Projection System Plus (2010).

Table H16. World net hydroelectric generation from central producers by region and country, 2007-2035(Billion kilowatthours)
Appendix H
286 U.S. Energy Information Administration / International Energy Outlook 2010
Region/Country
History Projections Average annualpercent change,
2007-20352007 2015 2020 2025 2030 2035
OECDOECD North America . . . . . . . . . . . 639 723 758 785 804 823 0.9United Statesa. . . . . . . . . . . . . . . . . 248 300 300 302 302 303 0.7Canada . . . . . . . . . . . . . . . . . . . . . . 365 383 413 432 451 469 0.9Mexico. . . . . . . . . . . . . . . . . . . . . . . 27 40 45 51 51 51 2.3
OECD Europe . . . . . . . . . . . . . . . . . 493 540 568 609 641 656 1.0OECD Asia . . . . . . . . . . . . . . . . . . . . 114 121 134 136 140 144 0.8Japan . . . . . . . . . . . . . . . . . . . . . . . 73 76 89 91 94 97 1.0South Korea . . . . . . . . . . . . . . . . . . 4 4 4 4 4 4 0.5Australia/New Zealand . . . . . . . . . . 38 41 41 41 42 43 0.5Total OECD . . . . . . . . . . . . . . . . . 1,246 1,384 1,460 1,530 1,585 1,624 0.9
Non-OECDNon-OECD Europe and Eurasia. . . 289 307 331 353 379 413 1.3Russia . . . . . . . . . . . . . . . . . . . . . . . 175 181 201 218 236 257 1.4Other . . . . . . . . . . . . . . . . . . . . . . . . 113 126 131 135 142 156 1.1
Non-OECD Asia. . . . . . . . . . . . . . . . 684 1,079 1,352 1,574 1,809 2,016 3.9China. . . . . . . . . . . . . . . . . . . . . . . . 430 686 846 1,006 1,167 1,262 3.9India . . . . . . . . . . . . . . . . . . . . . . . . 123 173 223 247 287 333 3.6Other Non-OECD Asia . . . . . . . . . . 131 220 283 321 355 421 4.3
Middle East . . . . . . . . . . . . . . . . . . . 22 37 43 49 54 60 3.6Africa . . . . . . . . . . . . . . . . . . . . . . . . 97 112 120 130 147 166 1.9Central and South America . . . . . . 660 770 860 955 1,061 1,140 2.0
Brazil . . . . . . . . . . . . . . . . . . . . . . . . 370 446 511 588 667 723 2.4Other Central and South America. . 290 323 349 367 394 417 1.3Total Non-OECD . . . . . . . . . . . . . 1,753 2,305 2,706 3,061 3,449 3,795 2.8
Total World . . . . . . . . . . . . . . . . . . . . 2,999 3,689 4,166 4,591 5,034 5,418 2.1aIncludes the 50 States and the District of Columbia.Note: Totals may not equal sum of components due to independent rounding.Sources: History: Derived from U.S. Energy Information Administration (EIA), International Energy Statistics database (as of
November 2009), web site www.eia.gov/emeu/international. Projections: EIA, Annual Energy Outlook 2010, DOE/EIA-0383(2010)(Washington, DC, April 2010), AEO2010 National Energy Modeling System, run AEO2010R.D111809A, web site www.eia.gov/oiaf/aeo; and World Energy Projection System Plus (2010).
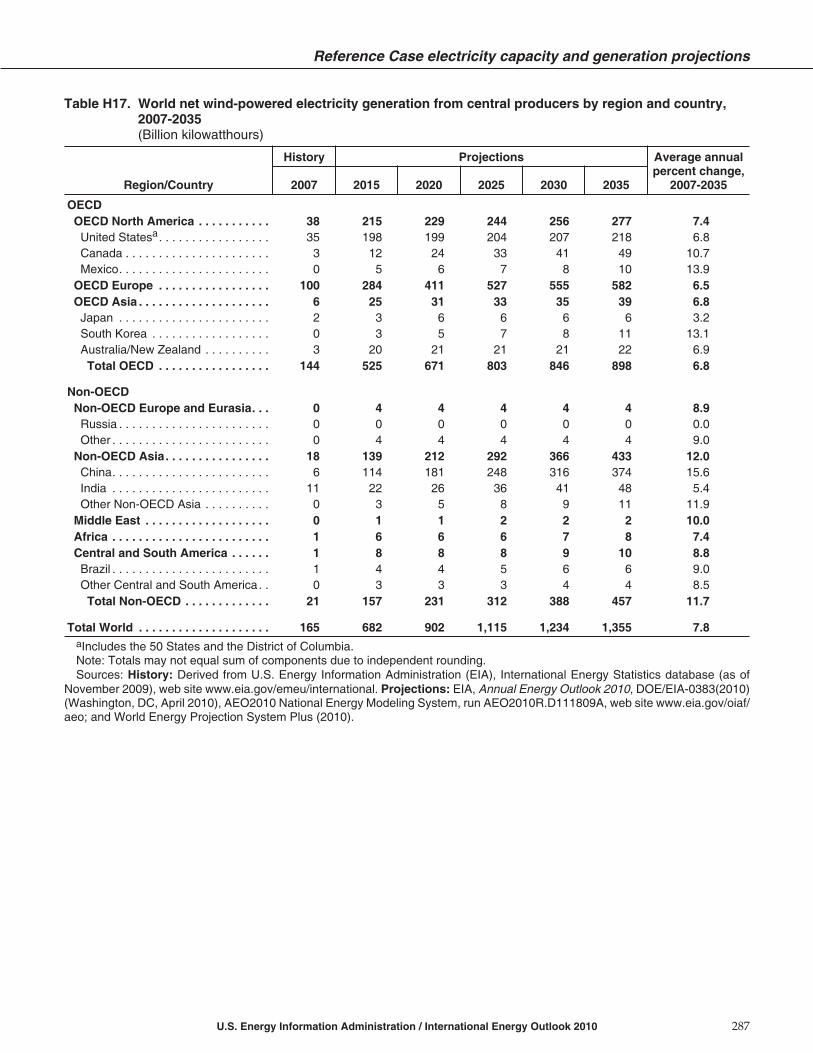
Table H17. World net wind-powered electricity generation from central producers by region and country,2007-2035(Billion kilowatthours)
Reference Case electricity capacity and generation projections
U.S. Energy Information Administration / International Energy Outlook 2010 287
Region/Country
History Projections Average annualpercent change,
2007-20352007 2015 2020 2025 2030 2035
OECDOECD North America . . . . . . . . . . . 38 215 229 244 256 277 7.4United Statesa. . . . . . . . . . . . . . . . . 35 198 199 204 207 218 6.8Canada . . . . . . . . . . . . . . . . . . . . . . 3 12 24 33 41 49 10.7Mexico. . . . . . . . . . . . . . . . . . . . . . . 0 5 6 7 8 10 13.9
OECD Europe . . . . . . . . . . . . . . . . . 100 284 411 527 555 582 6.5OECD Asia . . . . . . . . . . . . . . . . . . . . 6 25 31 33 35 39 6.8Japan . . . . . . . . . . . . . . . . . . . . . . . 2 3 6 6 6 6 3.2South Korea . . . . . . . . . . . . . . . . . . 0 3 5 7 8 11 13.1Australia/New Zealand . . . . . . . . . . 3 20 21 21 21 22 6.9Total OECD . . . . . . . . . . . . . . . . . 144 525 671 803 846 898 6.8
Non-OECDNon-OECD Europe and Eurasia. . . 0 4 4 4 4 4 8.9Russia . . . . . . . . . . . . . . . . . . . . . . . 0 0 0 0 0 0 0.0Other . . . . . . . . . . . . . . . . . . . . . . . . 0 4 4 4 4 4 9.0
Non-OECD Asia. . . . . . . . . . . . . . . . 18 139 212 292 366 433 12.0China. . . . . . . . . . . . . . . . . . . . . . . . 6 114 181 248 316 374 15.6India . . . . . . . . . . . . . . . . . . . . . . . . 11 22 26 36 41 48 5.4Other Non-OECD Asia . . . . . . . . . . 0 3 5 8 9 11 11.9
Middle East . . . . . . . . . . . . . . . . . . . 0 1 1 2 2 2 10.0Africa . . . . . . . . . . . . . . . . . . . . . . . . 1 6 6 6 7 8 7.4Central and South America . . . . . . 1 8 8 8 9 10 8.8Brazil . . . . . . . . . . . . . . . . . . . . . . . . 1 4 4 5 6 6 9.0Other Central and South America. . 0 3 3 3 4 4 8.5
Total Non-OECD . . . . . . . . . . . . . 21 157 231 312 388 457 11.7
Total World . . . . . . . . . . . . . . . . . . . . 165 682 902 1,115 1,234 1,355 7.8aIncludes the 50 States and the District of Columbia.Note: Totals may not equal sum of components due to independent rounding.Sources: History: Derived from U.S. Energy Information Administration (EIA), International Energy Statistics database (as of
November 2009), web site www.eia.gov/emeu/international. Projections: EIA, Annual Energy Outlook 2010, DOE/EIA-0383(2010)(Washington, DC, April 2010), AEO2010 National Energy Modeling System, run AEO2010R.D111809A, web site www.eia.gov/oiaf/aeo; and World Energy Projection System Plus (2010).

Table H18. World net geothermal electricity generation from central producers by region and country,2007-2035(Billion kilowatthours)
Appendix H
288 U.S. Energy Information Administration / International Energy Outlook 2010
Region/Country
History Projections Average annualpercent change,
2007-20352007 2015 2020 2025 2030 2035
OECDOECD North America . . . . . . . . . . . 22 32 33 35 40 45 2.6United Statesa. . . . . . . . . . . . . . . . . 15 24 24 24 26 28 2.4Canada . . . . . . . . . . . . . . . . . . . . . . 0 0 0 0 0 0 —Mexico. . . . . . . . . . . . . . . . . . . . . . . 7 9 9 12 14 16 3.1
OECD Europe . . . . . . . . . . . . . . . . . 9 13 13 14 14 15 1.8OECD Asia . . . . . . . . . . . . . . . . . . . . 6 12 15 18 20 20 4.3Japan . . . . . . . . . . . . . . . . . . . . . . . 3 3 3 3 3 3 0.3South Korea . . . . . . . . . . . . . . . . . . 0 0 0 0 0 0 —Australia/New Zealand . . . . . . . . . . 3 9 12 15 16 17 6.0Total OECD . . . . . . . . . . . . . . . . . 37 57 61 66 73 80 2.8
Non-OECDNon-OECD Europe and Eurasia. . . 0 2 2 2 2 3 6.2Russia . . . . . . . . . . . . . . . . . . . . . . . 0 2 2 2 2 2 5.7Other . . . . . . . . . . . . . . . . . . . . . . . . 0 0 0 0 0 0 —
Non-OECD Asia. . . . . . . . . . . . . . . . 16 32 36 41 56 66 5.1China. . . . . . . . . . . . . . . . . . . . . . . . 0 0 0 0 0 0 —India . . . . . . . . . . . . . . . . . . . . . . . . 0 1 1 1 1 2 —Other Non-OECD Asia . . . . . . . . . . 16 31 35 40 54 65 5.0
Middle East . . . . . . . . . . . . . . . . . . . 0 0 0 0 1 1 —Africa . . . . . . . . . . . . . . . . . . . . . . . . 1 2 2 3 3 3 4.5Central and South America . . . . . . 3 4 6 6 7 7 3.4Brazil . . . . . . . . . . . . . . . . . . . . . . . . 0 0 0 0 0 0 —Other Central and South America. . 3 4 6 6 7 7 3.4
Total Non-OECD . . . . . . . . . . . . . 21 41 47 52 68 80 5.0
Total World . . . . . . . . . . . . . . . . . . . . 57 98 108 119 142 160 3.7aIncludes the 50 States and the District of Columbia.Note: Totals may not equal sum of components due to independent rounding.Sources: History: Derived from U.S. Energy Information Administration (EIA), International Energy Statistics database (as of
November 2009), web site www.eia.gov/emeu/international. Projections: EIA, Annual Energy Outlook 2010, DOE/EIA-0383(2010)(Washington, DC, April 2010), AEO2010 National Energy Modeling System, run AEO2010R.D111809A, web site www.eia.gov/oiaf/aeo; and World Energy Projection System Plus (2010).

Table H19. World net solar electricity generation from central producers by region and country, 2007-2035(Billion kilowatthours)
Reference Case electricity capacity and generation projections
U.S. Energy Information Administration / International Energy Outlook 2010 289
Region/Country
History Projections Average annualpercent change,
2007-20352007 2015 2020 2025 2030 2035
OECDOECD North America . . . . . . . . . . . 1 16 19 20 22 25 10.9
United Statesa. . . . . . . . . . . . . . . . . 1 15 19 19 21 25 11.0Canada . . . . . . . . . . . . . . . . . . . . . . 0 0 0 0 0 0 0.7Mexico. . . . . . . . . . . . . . . . . . . . . . . 0 0 0 0 0 0 13.8
OECD Europe . . . . . . . . . . . . . . . . . 4 64 72 75 79 83 11.3OECD Asia . . . . . . . . . . . . . . . . . . . . 0 5 13 13 13 14 19.2Japan . . . . . . . . . . . . . . . . . . . . . . . 0 0 8 8 8 8 27.2South Korea . . . . . . . . . . . . . . . . . . 0 3 3 3 3 3 13.8Australia/New Zealand . . . . . . . . . . 0 2 2 2 2 2 21.3
Total OECD . . . . . . . . . . . . . . . . . 6 85 104 107 114 122 11.6
Non-OECDNon-OECD Europe and Eurasia. . . 0 0 0 0 0 0 —Russia . . . . . . . . . . . . . . . . . . . . . . . 0 0 0 0 0 0 —Other . . . . . . . . . . . . . . . . . . . . . . . . 0 0 0 0 0 0 —
Non-OECD Asia. . . . . . . . . . . . . . . . 0 7 16 23 29 32 21.1China. . . . . . . . . . . . . . . . . . . . . . . . 0 5 8 11 14 16 19.3India . . . . . . . . . . . . . . . . . . . . . . . . 0 2 7 12 14 16 27.1Other Non-OECD Asia . . . . . . . . . . 0 0 0 0 0 0 1.5
Middle East . . . . . . . . . . . . . . . . . . . 0 2 4 4 5 5 —Africa . . . . . . . . . . . . . . . . . . . . . . . . 0 1 3 5 6 7 21.4Central and South America . . . . . . 0 0 0 0 0 0 —Brazil . . . . . . . . . . . . . . . . . . . . . . . . 0 0 0 0 0 0 —Other Central and South America. . 0 0 0 0 0 0 —
Total Non-OECD . . . . . . . . . . . . . 0 10 23 33 39 44 21.7
Total World . . . . . . . . . . . . . . . . . . . . 6 95 126 140 153 165 12.7aIncludes the 50 States and the District of Columbia.Note: Totals may not equal sum of components due to independent rounding.Sources: History: Derived from U.S. Energy Information Administration (EIA), International Energy Statistics database (as of
November 2009), web site www.eia.gov/emeu/international. Projections: EIA, Annual Energy Outlook 2010, DOE/EIA-0383(2010)(Washington, DC, April 2010), AEO2010 National Energy Modeling System, run AEO2010R.D111809A, web site www.eia.gov/oiaf/aeo; and World Energy Projection System Plus (2010).

Table H20. World net other renewable electricity generation from central producers by region and country,2007-2035(Billion kilowatthours)
Appendix H
290 U.S. Energy Information Administration / International Energy Outlook 2010
Region/Country
History Projections Average annualpercent change,
2007-20352007 2015 2020 2025 2030 2035
OECDOECD North America . . . . . . . . . . . 65 123 183 258 310 332 6.0United Statesa. . . . . . . . . . . . . . . . . 55 112 172 246 296 318 6.5Canada . . . . . . . . . . . . . . . . . . . . . . 8 8 9 9 9 10 0.6Mexico. . . . . . . . . . . . . . . . . . . . . . . 3 3 3 3 4 5 2.4
OECD Europe . . . . . . . . . . . . . . . . . 104 106 109 113 119 125 0.7OECD Asia . . . . . . . . . . . . . . . . . . . . 25 24 26 26 27 28 0.3Japan . . . . . . . . . . . . . . . . . . . . . . . 22 20 22 22 23 24 0.3South Korea . . . . . . . . . . . . . . . . . . 1 1 1 1 1 1 0.3Australia/New Zealand . . . . . . . . . . 3 3 3 3 3 3 0.7
Total OECD . . . . . . . . . . . . . . . . . 195 253 318 398 456 485 3.3
Non-OECDNon-OECD Europe and Eurasia. . . 2 2 2 3 3 3 0.9Russia . . . . . . . . . . . . . . . . . . . . . . . 2 2 2 2 2 3 1.0Other . . . . . . . . . . . . . . . . . . . . . . . . 0 0 0 0 0 0 0.6
Non-OECD Asia. . . . . . . . . . . . . . . . 12 112 167 224 282 351 13.0China. . . . . . . . . . . . . . . . . . . . . . . . 2 91 146 201 256 321 19.5India . . . . . . . . . . . . . . . . . . . . . . . . 2 14 14 15 18 20 8.9Other Non-OECD Asia . . . . . . . . . . 8 8 8 8 9 10 1.1
Middle East . . . . . . . . . . . . . . . . . . . 0 0 0 0 0 0 —Africa . . . . . . . . . . . . . . . . . . . . . . . . 1 1 1 1 1 1 2.6Central and South America . . . . . . 26 26 26 28 31 34 0.9Brazil . . . . . . . . . . . . . . . . . . . . . . . . 18 18 18 19 22 24 1.0Other Central and South America. . 8 8 8 8 9 10 0.6
Total Non-OECD . . . . . . . . . . . . . 40 141 196 255 317 389 8.4
Total World . . . . . . . . . . . . . . . . . . . . 235 394 515 653 773 874 4.8aIncludes the 50 States and the District of Columbia.Notes: In this table, “other renewable” includes biomass, waste, and tidal/wave/ocean. Totals may not equal sum of components
due to independent rounding.Sources: History: Derived from U.S. Energy Information Administration (EIA), International Energy Statistics database (as of
November 2009), web site www.eia.gov/emeu/international. Projections: EIA, Annual Energy Outlook 2010, DOE/EIA-0383(2010)(Washington, DC, April 2010), AEO2010 National Energy Modeling System, run AEO2010R.D111809A, web site www.eia.gov/oiaf/aeo; and World Energy Projection System Plus (2010).

Appendix I
Projections of Natural GasProduction in Five Cases:
• Reference• High Economic Growth• Low Economic Growth• High Oil Price• Low Price

This page intentionally left blank.

Table I1. World total natural gas production by region, Reference case, 2007-2035(Trillion cubic feet)
Natural gas production projections
U.S. Energy Information Administration / International Energy Outlook 2010 293
Region/Country
History Projections Average annualpercent change,
2007-20352007 2008 2015 2020 2025 2030 2035OECDOECD North America . . . . . . . . . . . 27.4 28.2 26.9 27.7 29.3 31.0 32.2 0.6United Statesa. . . . . . . . . . . . . . . . . 19.2 20.3 19.4 20.1 21.4 22.5 23.4 0.7Canada . . . . . . . . . . . . . . . . . . . . . . 6.3 6.0 5.6 5.5 5.8 6.4 6.7 0.2Mexico. . . . . . . . . . . . . . . . . . . . . . . 1.8 1.8 1.9 2.1 2.1 2.1 2.1 0.5
OECD Europe . . . . . . . . . . . . . . . . . 10.2 10.7 9.6 9.0 8.6 8.3 8.0 -0.9North Europe. . . . . . . . . . . . . . . . . . 9.8 10.3 9.1 8.5 8.1 7.8 7.5 -1.0South Europe . . . . . . . . . . . . . . . . . 0.3 0.3 0.4 0.4 0.4 0.4 0.4 1.0Southwest Europe. . . . . . . . . . . . . . 0.0 0.0 0.0 0.0 0.0 0.0 0.0 —Turkey . . . . . . . . . . . . . . . . . . . . . . . 0.0 0.0 0.0 0.0 0.0 0.0 0.0 —
OECD Asia . . . . . . . . . . . . . . . . . . . . 1.9 2.0 3.7 3.9 4.0 4.2 4.6 3.2Japan . . . . . . . . . . . . . . . . . . . . . . . 0.2 0.2 0.1 0.1 0.1 0.1 0.1 -2.4South Korea . . . . . . . . . . . . . . . . . . 0.0 0.0 0.0 0.0 0.0 0.0 0.0 2.2Australia/New Zealand . . . . . . . . . . 1.7 1.7 3.5 3.7 3.9 4.1 4.5 3.5Total OECD . . . . . . . . . . . . . . . . . 39.5 40.8 40.2 40.5 41.9 43.5 44.8 0.4
Non-OECDNon-OECD Europe and Eurasia. . . 30.4 31.2 32.1 33.8 34.9 35.9 36.8 0.7Russia . . . . . . . . . . . . . . . . . . . . . . . 23.1 23.4 23.0 24.3 25.3 26.5 27.3 0.6Central Asia . . . . . . . . . . . . . . . . . . 6.1 6.6 7.8 8.1 8.2 8.1 8.2 1.0Non-OECD Europe . . . . . . . . . . . . . 1.2 1.2 1.4 1.4 1.4 1.4 1.4 0.4
Non-OECD Asia. . . . . . . . . . . . . . . . 12.0 12.6 15.8 17.1 18.4 19.8 20.9 2.0China. . . . . . . . . . . . . . . . . . . . . . . . 2.4 2.7 2.9 3.0 3.4 4.5 5.6 3.0India . . . . . . . . . . . . . . . . . . . . . . . . 1.1 1.1 2.7 3.0 3.2 3.3 3.3 4.0LNG exporters. . . . . . . . . . . . . . . . . 4.9 5.0 6.6 7.3 7.6 7.6 7.5 1.6Developed Asia. . . . . . . . . . . . . . . . 0.0 0.0 0.0 0.0 0.0 0.0 0.0 —Other Southeast Asia . . . . . . . . . . . 2.3 2.4 2.3 2.3 2.4 2.5 2.5 0.4Northwest Asia . . . . . . . . . . . . . . . . 1.3 1.3 1.3 1.5 1.7 1.9 2.0 1.6
Middle East . . . . . . . . . . . . . . . . . . . 12.6 13.5 20.9 24.6 26.6 27.8 28.4 2.9Arabian producers. . . . . . . . . . . . . . 3.5 3.5 3.7 4.0 4.3 4.3 4.1 0.6Iran . . . . . . . . . . . . . . . . . . . . . . . . . 4.0 4.1 6.4 8.0 8.7 9.0 8.7 2.9Iraq . . . . . . . . . . . . . . . . . . . . . . . . . 0.1 0.1 0.2 0.5 0.7 0.8 1.1 11.6Qatar . . . . . . . . . . . . . . . . . . . . . . . . 2.2 2.7 6.4 7.4 8.2 9.2 9.5 5.3Saudi Arabia . . . . . . . . . . . . . . . . . . 2.6 2.8 4.1 4.5 4.5 4.5 4.8 2.2Other Middle East . . . . . . . . . . . . . . 0.3 0.3 0.2 0.2 0.2 0.1 0.1 -2.8
Africa . . . . . . . . . . . . . . . . . . . . . . . . 6.8 7.2 11.3 12.7 13.8 14.1 14.0 2.6North Africa . . . . . . . . . . . . . . . . . . . 5.3 5.4 8.2 9.0 9.7 9.9 9.8 2.2West Africa . . . . . . . . . . . . . . . . . . . 1.3 1.5 2.9 3.5 3.8 4.0 4.0 4.0South Africa . . . . . . . . . . . . . . . . . . 0.1 0.1 0.1 0.1 0.1 0.1 0.1 -0.5Other Africa. . . . . . . . . . . . . . . . . . . 0.1 0.1 0.1 0.1 0.1 0.1 0.1 -0.1
Central and South America . . . . . . 5.2 5.3 6.6 8.7 9.4 10.0 10.5 2.5Brazil . . . . . . . . . . . . . . . . . . . . . . . . 0.3 0.4 1.0 1.5 1.8 2.2 2.5 7.4Northern producers . . . . . . . . . . . . . 2.6 2.6 3.2 4.5 4.8 5.0 4.9 2.3Other South America . . . . . . . . . . . 2.2 2.2 2.3 2.6 2.6 2.7 2.9 0.9Central America and Caribbean . . . 0.0 0.0 0.1 0.1 0.1 0.1 0.1 6.1Total Non-OECD . . . . . . . . . . . . . 67.0 69.7 86.8 97.0 103.0 107.7 110.6 1.8
Total World . . . . . . . . . . . . . . . . . . . . 106.6 110.5 126.9 137.5 144.8 151.1 155.4 1.4Discrepancyb. . . . . . . . . . . . . . . . . . . 1.9 0.7 -2.3 -1.1 0.1 -0.9 0.9aIncludes the 50 States and the District of Columbia. Production includes supplemental production, less any forecast discrepancy.bBalancing item. Differences between global production and consumption totals result from rounding and different conversion
factors derived from heat contents of regionally consumed and produced natural gas.Sources: History: U.S. Energy Information Administration (EIA), International Energy Statistics database (as of November 2009),
web site www.eia.gov/emeu/international. Projections: EIA, Annual Energy Outlook 2010, DOE/EIA-0383(2010) (Washington, DC,April 2010), AEO2010 National Energy Modeling System, run AEO2010R.D111809A, web site www.eia.gov/oiaf/aeo; and Interna-tional Natural Gas Model (2010).
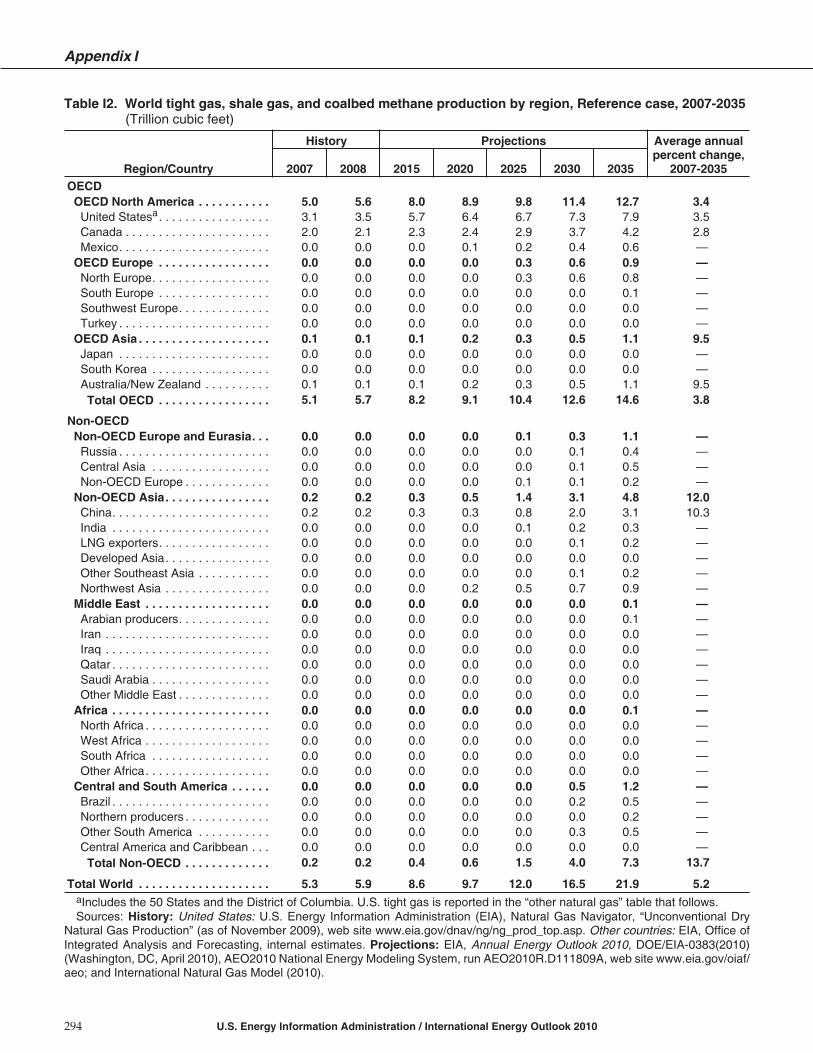
Table I2. World tight gas, shale gas, and coalbed methane production by region, Reference case, 2007-2035(Trillion cubic feet)
Appendix I
294 U.S. Energy Information Administration / International Energy Outlook 2010
Region/Country
History Projections Average annualpercent change,
2007-20352007 2008 2015 2020 2025 2030 2035OECDOECD North America . . . . . . . . . . . 5.0 5.6 8.0 8.9 9.8 11.4 12.7 3.4United Statesa. . . . . . . . . . . . . . . . . 3.1 3.5 5.7 6.4 6.7 7.3 7.9 3.5Canada . . . . . . . . . . . . . . . . . . . . . . 2.0 2.1 2.3 2.4 2.9 3.7 4.2 2.8Mexico. . . . . . . . . . . . . . . . . . . . . . . 0.0 0.0 0.0 0.1 0.2 0.4 0.6 —
OECD Europe . . . . . . . . . . . . . . . . . 0.0 0.0 0.0 0.0 0.3 0.6 0.9 —North Europe. . . . . . . . . . . . . . . . . . 0.0 0.0 0.0 0.0 0.3 0.6 0.8 —South Europe . . . . . . . . . . . . . . . . . 0.0 0.0 0.0 0.0 0.0 0.0 0.1 —Southwest Europe. . . . . . . . . . . . . . 0.0 0.0 0.0 0.0 0.0 0.0 0.0 —Turkey . . . . . . . . . . . . . . . . . . . . . . . 0.0 0.0 0.0 0.0 0.0 0.0 0.0 —
OECD Asia . . . . . . . . . . . . . . . . . . . . 0.1 0.1 0.1 0.2 0.3 0.5 1.1 9.5Japan . . . . . . . . . . . . . . . . . . . . . . . 0.0 0.0 0.0 0.0 0.0 0.0 0.0 —South Korea . . . . . . . . . . . . . . . . . . 0.0 0.0 0.0 0.0 0.0 0.0 0.0 —Australia/New Zealand . . . . . . . . . . 0.1 0.1 0.1 0.2 0.3 0.5 1.1 9.5Total OECD . . . . . . . . . . . . . . . . . 5.1 5.7 8.2 9.1 10.4 12.6 14.6 3.8
Non-OECDNon-OECD Europe and Eurasia. . . 0.0 0.0 0.0 0.0 0.1 0.3 1.1 —Russia . . . . . . . . . . . . . . . . . . . . . . . 0.0 0.0 0.0 0.0 0.0 0.1 0.4 —Central Asia . . . . . . . . . . . . . . . . . . 0.0 0.0 0.0 0.0 0.0 0.1 0.5 —Non-OECD Europe . . . . . . . . . . . . . 0.0 0.0 0.0 0.0 0.1 0.1 0.2 —
Non-OECD Asia. . . . . . . . . . . . . . . . 0.2 0.2 0.3 0.5 1.4 3.1 4.8 12.0China. . . . . . . . . . . . . . . . . . . . . . . . 0.2 0.2 0.3 0.3 0.8 2.0 3.1 10.3India . . . . . . . . . . . . . . . . . . . . . . . . 0.0 0.0 0.0 0.0 0.1 0.2 0.3 —LNG exporters. . . . . . . . . . . . . . . . . 0.0 0.0 0.0 0.0 0.0 0.1 0.2 —Developed Asia. . . . . . . . . . . . . . . . 0.0 0.0 0.0 0.0 0.0 0.0 0.0 —Other Southeast Asia . . . . . . . . . . . 0.0 0.0 0.0 0.0 0.0 0.1 0.2 —Northwest Asia . . . . . . . . . . . . . . . . 0.0 0.0 0.0 0.2 0.5 0.7 0.9 —
Middle East . . . . . . . . . . . . . . . . . . . 0.0 0.0 0.0 0.0 0.0 0.0 0.1 —Arabian producers. . . . . . . . . . . . . . 0.0 0.0 0.0 0.0 0.0 0.0 0.1 —Iran . . . . . . . . . . . . . . . . . . . . . . . . . 0.0 0.0 0.0 0.0 0.0 0.0 0.0 —Iraq . . . . . . . . . . . . . . . . . . . . . . . . . 0.0 0.0 0.0 0.0 0.0 0.0 0.0 —Qatar . . . . . . . . . . . . . . . . . . . . . . . . 0.0 0.0 0.0 0.0 0.0 0.0 0.0 —Saudi Arabia . . . . . . . . . . . . . . . . . . 0.0 0.0 0.0 0.0 0.0 0.0 0.0 —Other Middle East . . . . . . . . . . . . . . 0.0 0.0 0.0 0.0 0.0 0.0 0.0 —
Africa . . . . . . . . . . . . . . . . . . . . . . . . 0.0 0.0 0.0 0.0 0.0 0.0 0.1 —North Africa . . . . . . . . . . . . . . . . . . . 0.0 0.0 0.0 0.0 0.0 0.0 0.0 —West Africa . . . . . . . . . . . . . . . . . . . 0.0 0.0 0.0 0.0 0.0 0.0 0.0 —South Africa . . . . . . . . . . . . . . . . . . 0.0 0.0 0.0 0.0 0.0 0.0 0.0 —Other Africa. . . . . . . . . . . . . . . . . . . 0.0 0.0 0.0 0.0 0.0 0.0 0.0 —
Central and South America . . . . . . 0.0 0.0 0.0 0.0 0.0 0.5 1.2 —Brazil . . . . . . . . . . . . . . . . . . . . . . . . 0.0 0.0 0.0 0.0 0.0 0.2 0.5 —Northern producers . . . . . . . . . . . . . 0.0 0.0 0.0 0.0 0.0 0.0 0.2 —Other South America . . . . . . . . . . . 0.0 0.0 0.0 0.0 0.0 0.3 0.5 —Central America and Caribbean . . . 0.0 0.0 0.0 0.0 0.0 0.0 0.0 —Total Non-OECD . . . . . . . . . . . . . 0.2 0.2 0.4 0.6 1.5 4.0 7.3 13.7
Total World . . . . . . . . . . . . . . . . . . . . 5.3 5.9 8.6 9.7 12.0 16.5 21.9 5.2aIncludes the 50 States and the District of Columbia. U.S. tight gas is reported in the “other natural gas” table that follows.Sources: History: United States: U.S. Energy Information Administration (EIA), Natural Gas Navigator, “Unconventional Dry
Natural Gas Production” (as of November 2009), web site www.eia.gov/dnav/ng/ng_prod_top.asp. Other countries: EIA, Office ofIntegrated Analysis and Forecasting, internal estimates. Projections: EIA, Annual Energy Outlook 2010, DOE/EIA-0383(2010)(Washington, DC, April 2010), AEO2010 National Energy Modeling System, run AEO2010R.D111809A, web site www.eia.gov/oiaf/aeo; and International Natural Gas Model (2010).

Table I3. World other natural gas production by region, Reference case, 2007-2035(Trillion cubic feet)
Natural gas production projections
U.S. Energy Information Administration / International Energy Outlook 2010 295
Region/Country
History Projections Average annualpercent change,
2007-20352007 2008 2015 2020 2025 2030 2035OECDOECD North America . . . . . . . . . . . 22.4 22.6 18.9 18.8 19.4 19.6 19.5 -0.5United Statesa. . . . . . . . . . . . . . . . . 16.2 16.8 13.6 13.7 14.7 15.1 15.5 -0.2Canada . . . . . . . . . . . . . . . . . . . . . . 4.4 3.9 3.3 3.0 2.9 2.7 2.5 -2.0Mexico. . . . . . . . . . . . . . . . . . . . . . . 1.8 1.8 1.9 2.1 1.9 1.7 1.5 -0.6
OECD Europe . . . . . . . . . . . . . . . . . 10.2 10.7 9.5 8.9 8.3 7.7 7.1 -1.3North Europe. . . . . . . . . . . . . . . . . . 9.8 10.3 9.1 8.5 7.9 7.3 6.7 -1.4South Europe . . . . . . . . . . . . . . . . . 0.3 0.3 0.4 0.4 0.4 0.4 0.4 0.4Southwest Europe. . . . . . . . . . . . . . 0.0 0.0 0.0 0.0 0.0 0.0 0.0 —Turkey . . . . . . . . . . . . . . . . . . . . . . . 0.0 0.0 0.0 0.0 0.0 0.0 0.0 —
OECD Asia . . . . . . . . . . . . . . . . . . . . 1.8 1.8 3.5 3.7 3.7 3.7 3.5 2.3Japan . . . . . . . . . . . . . . . . . . . . . . . 0.2 0.2 0.1 0.1 0.1 0.1 0.1 -2.5South Korea . . . . . . . . . . . . . . . . . . 0.0 0.0 0.0 0.0 0.0 0.0 0.0 2.2Australia/New Zealand . . . . . . . . . . 1.6 1.6 3.4 3.6 3.6 3.5 3.4 2.7Total OECD . . . . . . . . . . . . . . . . . 34.4 35.1 32.0 31.4 31.5 30.9 30.2 -0.5
Non-OECDNon-OECD Europe and Eurasia. . . 30.4 31.2 32.1 33.8 34.8 35.6 35.7 0.6Russia . . . . . . . . . . . . . . . . . . . . . . . 23.1 23.4 23.0 24.3 25.3 26.3 26.8 0.5Central Asia . . . . . . . . . . . . . . . . . . 6.1 6.6 7.8 8.1 8.2 8.0 7.7 0.8Non-OECD Europe . . . . . . . . . . . . . 1.2 1.2 1.4 1.4 1.3 1.3 1.2 -0.1
Non-OECD Asia. . . . . . . . . . . . . . . . 11.8 12.4 15.5 16.6 17.0 16.7 16.2 1.1China. . . . . . . . . . . . . . . . . . . . . . . . 2.2 2.5 2.6 2.7 2.7 2.6 2.5 0.3India . . . . . . . . . . . . . . . . . . . . . . . . 1.1 1.1 2.7 3.0 3.1 3.1 2.9 3.6LNG exporters. . . . . . . . . . . . . . . . . 4.9 5.0 6.6 7.3 7.6 7.6 7.4 1.5Developed Asia. . . . . . . . . . . . . . . . 0.0 0.0 0.0 0.0 0.0 0.0 0.0 —Other Southeast Asia . . . . . . . . . . . 2.3 2.4 2.3 2.3 2.4 2.3 2.3 0.0Northwest Asia . . . . . . . . . . . . . . . . 1.3 1.3 1.3 1.3 1.2 1.2 1.1 -0.6
Middle East . . . . . . . . . . . . . . . . . . . 12.6 13.5 20.9 24.6 26.5 27.8 28.2 2.9Arabian producers. . . . . . . . . . . . . . 3.5 3.5 3.7 4.0 4.3 4.2 4.0 0.5Iran . . . . . . . . . . . . . . . . . . . . . . . . . 4.0 4.1 6.4 8.0 8.7 9.0 8.7 2.9Iraq . . . . . . . . . . . . . . . . . . . . . . . . . 0.1 0.1 0.2 0.5 0.7 0.7 1.1 11.6Qatar . . . . . . . . . . . . . . . . . . . . . . . . 2.2 2.7 6.4 7.4 8.2 9.2 9.5 5.3Saudi Arabia . . . . . . . . . . . . . . . . . . 2.6 2.8 4.1 4.5 4.5 4.5 4.8 2.2Other Middle East . . . . . . . . . . . . . . 0.3 0.3 0.2 0.2 0.2 0.1 0.1 -3.2
Africa . . . . . . . . . . . . . . . . . . . . . . . . 6.8 7.2 11.3 12.7 13.8 14.1 13.9 2.6North Africa . . . . . . . . . . . . . . . . . . . 5.3 5.4 8.2 9.0 9.7 9.9 9.8 2.2West Africa . . . . . . . . . . . . . . . . . . . 1.3 1.5 2.9 3.5 3.8 4.0 4.0 3.9South Africa . . . . . . . . . . . . . . . . . . 0.1 0.1 0.1 0.1 0.1 0.1 0.1 -1.1Other Africa. . . . . . . . . . . . . . . . . . . 0.1 0.1 0.1 0.1 0.1 0.1 0.1 -0.1
Central and South America . . . . . . 5.2 5.3 6.6 8.7 9.3 9.5 9.2 2.1Brazil . . . . . . . . . . . . . . . . . . . . . . . . 0.3 0.4 1.0 1.5 1.8 2.0 2.0 6.5Northern producers . . . . . . . . . . . . . 2.6 2.6 3.2 4.5 4.8 5.0 4.8 2.2Other South America . . . . . . . . . . . 2.2 2.2 2.3 2.6 2.5 2.5 2.3 0.2Central America and Caribbean . . . 0.0 0.0 0.1 0.1 0.1 0.1 0.1 5.9Total Non-OECD . . . . . . . . . . . . . 66.8 69.5 86.4 96.4 101.4 103.7 103.3 1.6
Total World . . . . . . . . . . . . . . . . . . . . 101.3 104.6 118.4 127.8 132.9 134.6 133.5 1.0aIncludes the 50 States and the District of Columbia. Production includes supplemental production, less any forecast discrepancy.Sources: History: U.S. Energy Information Administration (EIA), International Energy Statistics database (as of November 2009),
web site www.eia.gov/emeu/international. Projections: EIA, Annual Energy Outlook 2010, DOE/EIA-0383(2010) (Washington, DC,April 2010), AEO2010 National Energy Modeling System, run AEO2010R.D111809A, web site www.eia.gov/oiaf/aeo; and Interna-tional Natural Gas Model (2010).
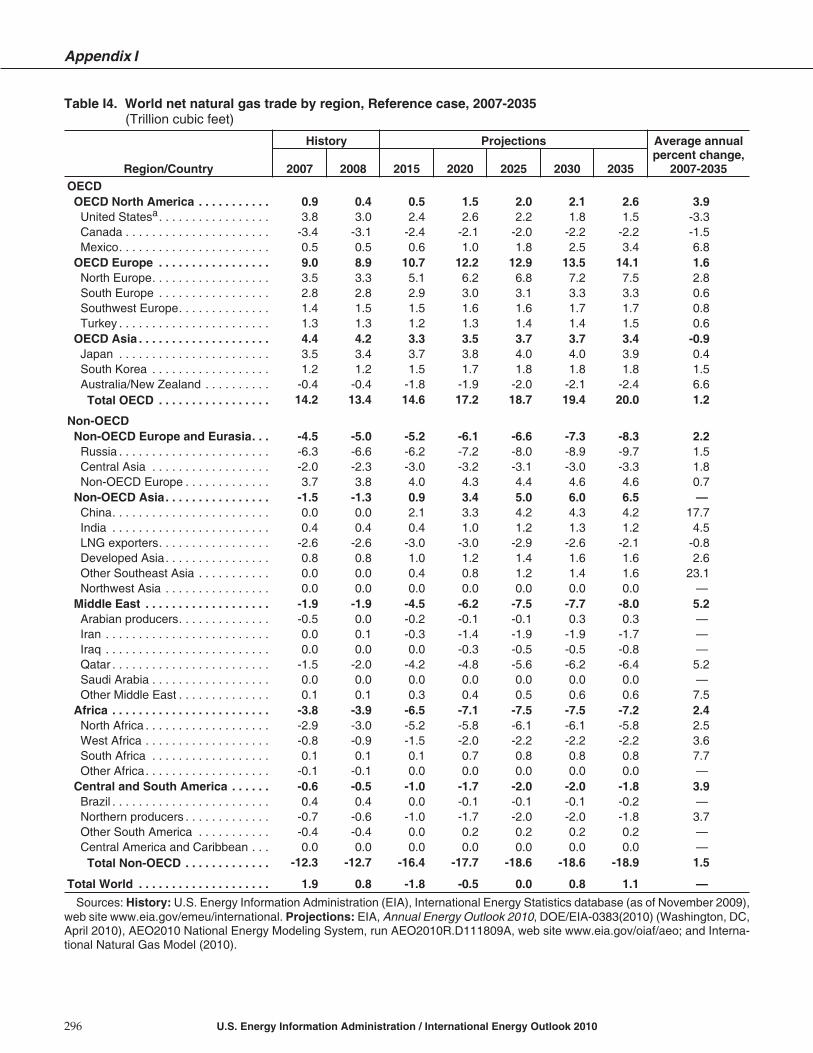
Table I4. World net natural gas trade by region, Reference case, 2007-2035(Trillion cubic feet)
Appendix I
296 U.S. Energy Information Administration / International Energy Outlook 2010
Region/Country
History Projections Average annualpercent change,
2007-20352007 2008 2015 2020 2025 2030 2035OECDOECD North America . . . . . . . . . . . 0.9 0.4 0.5 1.5 2.0 2.1 2.6 3.9United Statesa. . . . . . . . . . . . . . . . . 3.8 3.0 2.4 2.6 2.2 1.8 1.5 -3.3Canada . . . . . . . . . . . . . . . . . . . . . . -3.4 -3.1 -2.4 -2.1 -2.0 -2.2 -2.2 -1.5Mexico. . . . . . . . . . . . . . . . . . . . . . . 0.5 0.5 0.6 1.0 1.8 2.5 3.4 6.8
OECD Europe . . . . . . . . . . . . . . . . . 9.0 8.9 10.7 12.2 12.9 13.5 14.1 1.6North Europe. . . . . . . . . . . . . . . . . . 3.5 3.3 5.1 6.2 6.8 7.2 7.5 2.8South Europe . . . . . . . . . . . . . . . . . 2.8 2.8 2.9 3.0 3.1 3.3 3.3 0.6Southwest Europe. . . . . . . . . . . . . . 1.4 1.5 1.5 1.6 1.6 1.7 1.7 0.8Turkey . . . . . . . . . . . . . . . . . . . . . . . 1.3 1.3 1.2 1.3 1.4 1.4 1.5 0.6
OECD Asia . . . . . . . . . . . . . . . . . . . . 4.4 4.2 3.3 3.5 3.7 3.7 3.4 -0.9Japan . . . . . . . . . . . . . . . . . . . . . . . 3.5 3.4 3.7 3.8 4.0 4.0 3.9 0.4South Korea . . . . . . . . . . . . . . . . . . 1.2 1.2 1.5 1.7 1.8 1.8 1.8 1.5Australia/New Zealand . . . . . . . . . . -0.4 -0.4 -1.8 -1.9 -2.0 -2.1 -2.4 6.6
Total OECD . . . . . . . . . . . . . . . . . 14.2 13.4 14.6 17.2 18.7 19.4 20.0 1.2
Non-OECDNon-OECD Europe and Eurasia. . . -4.5 -5.0 -5.2 -6.1 -6.6 -7.3 -8.3 2.2Russia . . . . . . . . . . . . . . . . . . . . . . . -6.3 -6.6 -6.2 -7.2 -8.0 -8.9 -9.7 1.5Central Asia . . . . . . . . . . . . . . . . . . -2.0 -2.3 -3.0 -3.2 -3.1 -3.0 -3.3 1.8Non-OECD Europe . . . . . . . . . . . . . 3.7 3.8 4.0 4.3 4.4 4.6 4.6 0.7
Non-OECD Asia. . . . . . . . . . . . . . . . -1.5 -1.3 0.9 3.4 5.0 6.0 6.5 —China. . . . . . . . . . . . . . . . . . . . . . . . 0.0 0.0 2.1 3.3 4.2 4.3 4.2 17.7India . . . . . . . . . . . . . . . . . . . . . . . . 0.4 0.4 0.4 1.0 1.2 1.3 1.2 4.5LNG exporters. . . . . . . . . . . . . . . . . -2.6 -2.6 -3.0 -3.0 -2.9 -2.6 -2.1 -0.8Developed Asia. . . . . . . . . . . . . . . . 0.8 0.8 1.0 1.2 1.4 1.6 1.6 2.6Other Southeast Asia . . . . . . . . . . . 0.0 0.0 0.4 0.8 1.2 1.4 1.6 23.1Northwest Asia . . . . . . . . . . . . . . . . 0.0 0.0 0.0 0.0 0.0 0.0 0.0 —
Middle East . . . . . . . . . . . . . . . . . . . -1.9 -1.9 -4.5 -6.2 -7.5 -7.7 -8.0 5.2Arabian producers. . . . . . . . . . . . . . -0.5 0.0 -0.2 -0.1 -0.1 0.3 0.3 —Iran . . . . . . . . . . . . . . . . . . . . . . . . . 0.0 0.1 -0.3 -1.4 -1.9 -1.9 -1.7 —Iraq . . . . . . . . . . . . . . . . . . . . . . . . . 0.0 0.0 0.0 -0.3 -0.5 -0.5 -0.8 —Qatar . . . . . . . . . . . . . . . . . . . . . . . . -1.5 -2.0 -4.2 -4.8 -5.6 -6.2 -6.4 5.2Saudi Arabia . . . . . . . . . . . . . . . . . . 0.0 0.0 0.0 0.0 0.0 0.0 0.0 —Other Middle East . . . . . . . . . . . . . . 0.1 0.1 0.3 0.4 0.5 0.6 0.6 7.5
Africa . . . . . . . . . . . . . . . . . . . . . . . . -3.8 -3.9 -6.5 -7.1 -7.5 -7.5 -7.2 2.4North Africa . . . . . . . . . . . . . . . . . . . -2.9 -3.0 -5.2 -5.8 -6.1 -6.1 -5.8 2.5West Africa . . . . . . . . . . . . . . . . . . . -0.8 -0.9 -1.5 -2.0 -2.2 -2.2 -2.2 3.6South Africa . . . . . . . . . . . . . . . . . . 0.1 0.1 0.1 0.7 0.8 0.8 0.8 7.7Other Africa. . . . . . . . . . . . . . . . . . . -0.1 -0.1 0.0 0.0 0.0 0.0 0.0 —
Central and South America . . . . . . -0.6 -0.5 -1.0 -1.7 -2.0 -2.0 -1.8 3.9Brazil . . . . . . . . . . . . . . . . . . . . . . . . 0.4 0.4 0.0 -0.1 -0.1 -0.1 -0.2 —Northern producers . . . . . . . . . . . . . -0.7 -0.6 -1.0 -1.7 -2.0 -2.0 -1.8 3.7Other South America . . . . . . . . . . . -0.4 -0.4 0.0 0.2 0.2 0.2 0.2 —Central America and Caribbean . . . 0.0 0.0 0.0 0.0 0.0 0.0 0.0 —Total Non-OECD . . . . . . . . . . . . . -12.3 -12.7 -16.4 -17.7 -18.6 -18.6 -18.9 1.5
Total World . . . . . . . . . . . . . . . . . . . . 1.9 0.8 -1.8 -0.5 0.0 0.8 1.1 —
Sources: History: U.S. Energy Information Administration (EIA), International Energy Statistics database (as of November 2009),web site www.eia.gov/emeu/international. Projections: EIA, Annual Energy Outlook 2010, DOE/EIA-0383(2010) (Washington, DC,April 2010), AEO2010 National Energy Modeling System, run AEO2010R.D111809A, web site www.eia.gov/oiaf/aeo; and Interna-tional Natural Gas Model (2010).

Table I5. World total natural gas production by region, High Economic Growth case, 2007-2035(Trillion cubic feet)
Natural gas production projections
U.S. Energy Information Administration / International Energy Outlook 2010 297
Region/Country
History Projections Average annualpercent change,
2007-20352007 2008 2015 2020 2025 2030 2035OECDOECD North America . . . . . . . . . . . 27.4 28.2 27.4 28.4 31.0 32.9 33.9 0.8United Statesa. . . . . . . . . . . . . . . . . 19.2 20.3 19.6 20.5 22.6 24.0 24.7 0.9Canada . . . . . . . . . . . . . . . . . . . . . . 6.3 6.0 5.6 5.7 6.3 6.8 7.1 0.4Mexico. . . . . . . . . . . . . . . . . . . . . . . 1.8 1.8 2.1 2.1 2.1 2.1 2.1 0.5
OECD Europe . . . . . . . . . . . . . . . . . 10.2 10.7 9.7 9.0 8.7 8.4 8.0 -0.9North Europe. . . . . . . . . . . . . . . . . . 9.8 10.3 9.2 8.6 8.2 7.9 7.5 -0.9South Europe . . . . . . . . . . . . . . . . . 0.3 0.3 0.4 0.4 0.4 0.5 0.5 1.0Southwest Europe. . . . . . . . . . . . . . 0.0 0.0 0.0 0.0 0.0 0.0 0.0 —Turkey . . . . . . . . . . . . . . . . . . . . . . . 0.0 0.0 0.0 0.0 0.0 0.0 0.0 —
OECD Asia . . . . . . . . . . . . . . . . . . . . 1.9 2.0 3.7 3.9 4.1 4.4 5.4 3.7Japan . . . . . . . . . . . . . . . . . . . . . . . 0.2 0.2 0.1 0.1 0.1 0.1 0.1 -2.4South Korea . . . . . . . . . . . . . . . . . . 0.0 0.0 0.0 0.0 0.0 0.0 0.0 2.2Australia/New Zealand . . . . . . . . . . 1.7 1.7 3.5 3.8 4.0 4.2 5.3 4.1Total OECD . . . . . . . . . . . . . . . . . 39.5 40.8 40.8 41.3 43.8 45.7 47.3 0.6
Non-OECDNon-OECD Europe and Eurasia. . . 30.4 31.2 32.2 33.9 35.2 36.3 37.4 0.7Russia . . . . . . . . . . . . . . . . . . . . . . . 23.1 23.4 22.9 24.3 25.5 26.7 27.7 0.7Central Asia . . . . . . . . . . . . . . . . . . 6.1 6.6 7.8 8.2 8.2 8.2 8.3 1.1Non-OECD Europe . . . . . . . . . . . . . 1.2 1.2 1.4 1.4 1.4 1.4 1.4 0.4
Non-OECD Asia. . . . . . . . . . . . . . . . 12.0 12.6 15.9 17.3 18.6 20.0 21.3 2.1China. . . . . . . . . . . . . . . . . . . . . . . . 2.4 2.7 2.9 3.0 3.6 4.7 5.8 3.1India . . . . . . . . . . . . . . . . . . . . . . . . 1.1 1.1 2.7 3.0 3.2 3.3 3.3 4.0LNG exporters. . . . . . . . . . . . . . . . . 4.9 5.0 6.6 7.3 7.6 7.6 7.6 1.6Developed Asia. . . . . . . . . . . . . . . . 0.0 0.0 0.0 0.0 0.0 0.0 0.0 —Other Southeast Asia . . . . . . . . . . . 2.3 2.4 2.3 2.4 2.4 2.5 2.5 0.4Northwest Asia . . . . . . . . . . . . . . . . 1.3 1.3 1.4 1.6 1.9 2.0 2.1 1.7
Middle East . . . . . . . . . . . . . . . . . . . 12.6 13.5 20.9 25.0 27.8 28.9 31.1 3.3Arabian producers. . . . . . . . . . . . . . 3.5 3.5 3.8 4.4 4.4 4.2 4.2 0.6Iran . . . . . . . . . . . . . . . . . . . . . . . . . 4.0 4.1 6.3 8.0 9.1 9.7 10.6 3.6Iraq . . . . . . . . . . . . . . . . . . . . . . . . . 0.1 0.1 0.2 0.5 0.7 0.8 1.2 11.7Qatar . . . . . . . . . . . . . . . . . . . . . . . . 2.2 2.7 6.3 7.2 8.3 9.2 9.6 5.3Saudi Arabia . . . . . . . . . . . . . . . . . . 2.6 2.8 4.1 4.7 5.0 4.9 5.4 2.6Other Middle East . . . . . . . . . . . . . . 0.3 0.3 0.2 0.2 0.2 0.1 0.1 -2.5
Africa . . . . . . . . . . . . . . . . . . . . . . . . 6.8 7.2 11.3 12.9 13.9 14.2 14.2 2.6North Africa . . . . . . . . . . . . . . . . . . . 5.3 5.4 8.1 9.1 9.9 10.0 9.9 2.3West Africa . . . . . . . . . . . . . . . . . . . 1.3 1.5 3.0 3.5 3.9 4.0 4.1 4.0South Africa . . . . . . . . . . . . . . . . . . 0.1 0.1 0.1 0.1 0.1 0.1 0.1 -0.4Other Africa. . . . . . . . . . . . . . . . . . . 0.1 0.1 0.1 0.1 0.1 0.1 0.1 0.1
Central and South America . . . . . . 5.2 5.3 6.9 9.3 10.0 10.5 11.3 2.8Brazil . . . . . . . . . . . . . . . . . . . . . . . . 0.3 0.4 1.2 1.7 2.0 2.5 3.0 7.9Northern producers . . . . . . . . . . . . . 2.6 2.6 3.3 4.9 5.1 5.0 5.1 2.5Other South America . . . . . . . . . . . 2.2 2.2 2.4 2.6 2.7 2.9 3.1 1.1Central America and Caribbean . . . 0.0 0.0 0.1 0.1 0.1 0.1 0.1 6.6Total Non-OECD . . . . . . . . . . . . . 67.0 69.7 87.2 98.3 105.5 109.9 115.2 2.0
Total World . . . . . . . . . . . . . . . . . . . . 106.6 110.5 128.0 139.6 149.3 155.6 162.5 1.5Discrepancyb. . . . . . . . . . . . . . . . . . . 1.9 0.7 -1.9 -0.1 1.3 1.5 2.6aIncludes the 50 States and the District of Columbia. Production includes supplemental production, less any forecast discrepancy.bBalancing item. Differences between global production and consumption totals result from rounding and different conversion
factors derived from heat contents of regionally consumed and produced natural gas.Sources: History: U.S. Energy Information Administration (EIA), International Energy Statistics database (as of November 2009),
web site www.eia.gov/emeu/international. Projections: EIA, Annual Energy Outlook 2010, DOE/EIA-0383(2010) (Washington, DC,April 2010), AEO2010 National Energy Modeling System, run HM2010.D020310A, web site www.eia.gov/oiaf/aeo; and InternationalNatural Gas Model (2010).

Table I6. World tight gas, shale gas, and coalbed methane production by region, High Economic Growthcase, 2007-2035(Trillion cubic feet)
Appendix I
298 U.S. Energy Information Administration / International Energy Outlook 2010
Region/Country
History Projections Average annualpercent change,
2007-20352007 2008 2015 2020 2025 2030 2035OECDOECD North America . . . . . . . . . . . 5.0 5.6 8.2 9.3 10.8 12.5 13.6 3.6
United Statesa. . . . . . . . . . . . . . . . . 3.1 3.5 5.8 6.6 7.2 8.0 8.5 3.7Canada . . . . . . . . . . . . . . . . . . . . . . 2.0 2.1 2.3 2.6 3.3 4.0 4.5 3.0Mexico. . . . . . . . . . . . . . . . . . . . . . . 0.0 0.0 0.0 0.1 0.3 0.5 0.6 —
OECD Europe . . . . . . . . . . . . . . . . . 0.0 0.0 0.1 0.1 0.4 0.7 0.9 —North Europe. . . . . . . . . . . . . . . . . . 0.0 0.0 0.1 0.1 0.4 0.6 0.8 —South Europe . . . . . . . . . . . . . . . . . 0.0 0.0 0.0 0.0 0.0 0.0 0.1 —Southwest Europe. . . . . . . . . . . . . . 0.0 0.0 0.0 0.0 0.0 0.0 0.0 —Turkey . . . . . . . . . . . . . . . . . . . . . . . 0.0 0.0 0.0 0.0 0.0 0.0 0.0 —
OECD Asia . . . . . . . . . . . . . . . . . . . . 0.1 0.1 0.1 0.2 0.4 0.7 1.8 11.6Japan . . . . . . . . . . . . . . . . . . . . . . . 0.0 0.0 0.0 0.0 0.0 0.0 0.0 —South Korea . . . . . . . . . . . . . . . . . . 0.0 0.0 0.0 0.0 0.0 0.0 0.0 —Australia/New Zealand . . . . . . . . . . 0.1 0.1 0.1 0.2 0.3 0.7 1.8 11.6
Total OECD . . . . . . . . . . . . . . . . . 5.1 5.7 8.4 9.6 11.5 13.8 16.4 4.2
Non-OECDNon-OECD Europe and Eurasia. . . 0.0 0.0 0.1 0.1 0.2 0.5 1.6 —Russia . . . . . . . . . . . . . . . . . . . . . . . 0.0 0.0 0.0 0.0 0.1 0.2 0.8 —Central Asia . . . . . . . . . . . . . . . . . . 0.0 0.0 0.0 0.0 0.0 0.2 0.6 —Non-OECD Europe . . . . . . . . . . . . . 0.0 0.0 0.0 0.0 0.1 0.1 0.2 —
Non-OECD Asia. . . . . . . . . . . . . . . . 0.2 0.2 0.5 0.7 1.7 3.3 5.1 12.3China. . . . . . . . . . . . . . . . . . . . . . . . 0.2 0.2 0.3 0.3 0.9 2.1 3.3 10.6India . . . . . . . . . . . . . . . . . . . . . . . . 0.0 0.0 0.0 0.0 0.1 0.2 0.3 —LNG exporters. . . . . . . . . . . . . . . . . 0.0 0.0 0.0 0.0 0.0 0.1 0.2 —Developed Asia. . . . . . . . . . . . . . . . 0.0 0.0 0.0 0.0 0.0 0.0 0.0 —Other Southeast Asia . . . . . . . . . . . 0.0 0.0 0.0 0.0 0.1 0.1 0.3 —Northwest Asia . . . . . . . . . . . . . . . . 0.0 0.0 0.1 0.4 0.6 0.8 1.0 —
Middle East . . . . . . . . . . . . . . . . . . . 0.0 0.0 0.0 0.0 0.0 0.0 0.2 —Arabian producers. . . . . . . . . . . . . . 0.0 0.0 0.0 0.0 0.0 0.0 0.1 —Iran . . . . . . . . . . . . . . . . . . . . . . . . . 0.0 0.0 0.0 0.0 0.0 0.0 0.0 —Iraq . . . . . . . . . . . . . . . . . . . . . . . . . 0.0 0.0 0.0 0.0 0.0 0.0 0.0 —Qatar . . . . . . . . . . . . . . . . . . . . . . . . 0.0 0.0 0.0 0.0 0.0 0.0 0.0 —Saudi Arabia . . . . . . . . . . . . . . . . . . 0.0 0.0 0.0 0.0 0.0 0.0 0.0 —Other Middle East . . . . . . . . . . . . . . 0.0 0.0 0.0 0.0 0.0 0.0 0.0 —
Africa . . . . . . . . . . . . . . . . . . . . . . . . 0.0 0.0 0.0 0.0 0.0 0.0 0.2 —North Africa . . . . . . . . . . . . . . . . . . . 0.0 0.0 0.0 0.0 0.0 0.0 0.1 —West Africa . . . . . . . . . . . . . . . . . . . 0.0 0.0 0.0 0.0 0.0 0.0 0.1 —South Africa . . . . . . . . . . . . . . . . . . 0.0 0.0 0.0 0.0 0.0 0.0 0.0 —Other Africa. . . . . . . . . . . . . . . . . . . 0.0 0.0 0.0 0.0 0.0 0.0 0.0 —
Central and South America . . . . . . 0.0 0.0 0.0 0.0 0.3 1.0 2.1 —Brazil . . . . . . . . . . . . . . . . . . . . . . . . 0.0 0.0 0.0 0.0 0.1 0.5 0.9 —Northern producers . . . . . . . . . . . . . 0.0 0.0 0.0 0.0 0.0 0.0 0.4 —Other South America . . . . . . . . . . . 0.0 0.0 0.0 0.0 0.2 0.5 0.7 —Central America and Caribbean . . . 0.0 0.0 0.0 0.0 0.0 0.0 0.0 —Total Non-OECD . . . . . . . . . . . . . 0.2 0.2 0.6 0.8 2.2 4.8 9.1 14.6
Total World . . . . . . . . . . . . . . . . . . . . 5.3 5.9 8.9 10.4 13.8 18.7 25.4 5.8aIncludes the 50 States and the District of Columbia. U.S. tight gas is reported in the “other natural gas” table that follows.Sources: History: United States: U.S. Energy Information Administration (EIA), Natural Gas Navigator, “Unconventional Dry
Natural Gas Production” (as of November 2009), web site www.eia.gov/dnav/ng/ng_prod_top.asp. Other countries: EIA, Office ofIntegrated Analysis and Forecasting, internal estimates. Projections: EIA, Annual Energy Outlook 2010, DOE/EIA-0383(2010)(Washington, DC, April 2010), AEO2010 National Energy Modeling System, run HM2010.D020310A, web site www.eia.gov/oiaf/aeo; and International Natural Gas Model (2010).
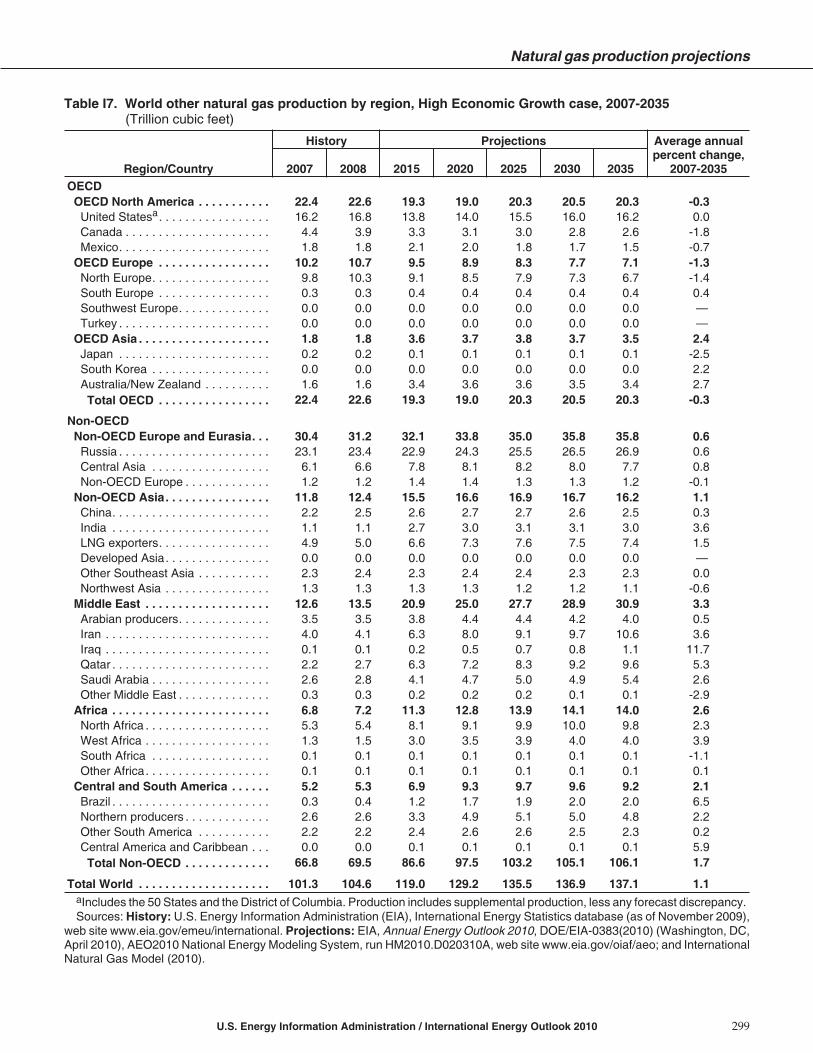
Table I7. World other natural gas production by region, High Economic Growth case, 2007-2035(Trillion cubic feet)
Natural gas production projections
U.S. Energy Information Administration / International Energy Outlook 2010 299
Region/Country
History Projections Average annualpercent change,
2007-20352007 2008 2015 2020 2025 2030 2035OECDOECD North America . . . . . . . . . . . 22.4 22.6 19.3 19.0 20.3 20.5 20.3 -0.3United Statesa. . . . . . . . . . . . . . . . . 16.2 16.8 13.8 14.0 15.5 16.0 16.2 0.0Canada . . . . . . . . . . . . . . . . . . . . . . 4.4 3.9 3.3 3.1 3.0 2.8 2.6 -1.8Mexico. . . . . . . . . . . . . . . . . . . . . . . 1.8 1.8 2.1 2.0 1.8 1.7 1.5 -0.7
OECD Europe . . . . . . . . . . . . . . . . . 10.2 10.7 9.5 8.9 8.3 7.7 7.1 -1.3North Europe. . . . . . . . . . . . . . . . . . 9.8 10.3 9.1 8.5 7.9 7.3 6.7 -1.4South Europe . . . . . . . . . . . . . . . . . 0.3 0.3 0.4 0.4 0.4 0.4 0.4 0.4Southwest Europe. . . . . . . . . . . . . . 0.0 0.0 0.0 0.0 0.0 0.0 0.0 —Turkey . . . . . . . . . . . . . . . . . . . . . . . 0.0 0.0 0.0 0.0 0.0 0.0 0.0 —
OECD Asia . . . . . . . . . . . . . . . . . . . . 1.8 1.8 3.6 3.7 3.8 3.7 3.5 2.4Japan . . . . . . . . . . . . . . . . . . . . . . . 0.2 0.2 0.1 0.1 0.1 0.1 0.1 -2.5South Korea . . . . . . . . . . . . . . . . . . 0.0 0.0 0.0 0.0 0.0 0.0 0.0 2.2Australia/New Zealand . . . . . . . . . . 1.6 1.6 3.4 3.6 3.6 3.5 3.4 2.7Total OECD . . . . . . . . . . . . . . . . . 22.4 22.6 19.3 19.0 20.3 20.5 20.3 -0.3
Non-OECDNon-OECD Europe and Eurasia. . . 30.4 31.2 32.1 33.8 35.0 35.8 35.8 0.6Russia . . . . . . . . . . . . . . . . . . . . . . . 23.1 23.4 22.9 24.3 25.5 26.5 26.9 0.6Central Asia . . . . . . . . . . . . . . . . . . 6.1 6.6 7.8 8.1 8.2 8.0 7.7 0.8Non-OECD Europe . . . . . . . . . . . . . 1.2 1.2 1.4 1.4 1.3 1.3 1.2 -0.1
Non-OECD Asia. . . . . . . . . . . . . . . . 11.8 12.4 15.5 16.6 16.9 16.7 16.2 1.1China. . . . . . . . . . . . . . . . . . . . . . . . 2.2 2.5 2.6 2.7 2.7 2.6 2.5 0.3India . . . . . . . . . . . . . . . . . . . . . . . . 1.1 1.1 2.7 3.0 3.1 3.1 3.0 3.6LNG exporters. . . . . . . . . . . . . . . . . 4.9 5.0 6.6 7.3 7.6 7.5 7.4 1.5Developed Asia. . . . . . . . . . . . . . . . 0.0 0.0 0.0 0.0 0.0 0.0 0.0 —Other Southeast Asia . . . . . . . . . . . 2.3 2.4 2.3 2.4 2.4 2.3 2.3 0.0Northwest Asia . . . . . . . . . . . . . . . . 1.3 1.3 1.3 1.3 1.2 1.2 1.1 -0.6
Middle East . . . . . . . . . . . . . . . . . . . 12.6 13.5 20.9 25.0 27.7 28.9 30.9 3.3Arabian producers. . . . . . . . . . . . . . 3.5 3.5 3.8 4.4 4.4 4.2 4.0 0.5Iran . . . . . . . . . . . . . . . . . . . . . . . . . 4.0 4.1 6.3 8.0 9.1 9.7 10.6 3.6Iraq . . . . . . . . . . . . . . . . . . . . . . . . . 0.1 0.1 0.2 0.5 0.7 0.8 1.1 11.7Qatar . . . . . . . . . . . . . . . . . . . . . . . . 2.2 2.7 6.3 7.2 8.3 9.2 9.6 5.3Saudi Arabia . . . . . . . . . . . . . . . . . . 2.6 2.8 4.1 4.7 5.0 4.9 5.4 2.6Other Middle East . . . . . . . . . . . . . . 0.3 0.3 0.2 0.2 0.2 0.1 0.1 -2.9
Africa . . . . . . . . . . . . . . . . . . . . . . . . 6.8 7.2 11.3 12.8 13.9 14.1 14.0 2.6North Africa . . . . . . . . . . . . . . . . . . . 5.3 5.4 8.1 9.1 9.9 10.0 9.8 2.3West Africa . . . . . . . . . . . . . . . . . . . 1.3 1.5 3.0 3.5 3.9 4.0 4.0 3.9South Africa . . . . . . . . . . . . . . . . . . 0.1 0.1 0.1 0.1 0.1 0.1 0.1 -1.1Other Africa. . . . . . . . . . . . . . . . . . . 0.1 0.1 0.1 0.1 0.1 0.1 0.1 0.1
Central and South America . . . . . . 5.2 5.3 6.9 9.3 9.7 9.6 9.2 2.1Brazil . . . . . . . . . . . . . . . . . . . . . . . . 0.3 0.4 1.2 1.7 1.9 2.0 2.0 6.5Northern producers . . . . . . . . . . . . . 2.6 2.6 3.3 4.9 5.1 5.0 4.8 2.2Other South America . . . . . . . . . . . 2.2 2.2 2.4 2.6 2.6 2.5 2.3 0.2Central America and Caribbean . . . 0.0 0.0 0.1 0.1 0.1 0.1 0.1 5.9Total Non-OECD . . . . . . . . . . . . . 66.8 69.5 86.6 97.5 103.2 105.1 106.1 1.7
Total World . . . . . . . . . . . . . . . . . . . . 101.3 104.6 119.0 129.2 135.5 136.9 137.1 1.1aIncludes the 50 States and the District of Columbia. Production includes supplemental production, less any forecast discrepancy.Sources: History: U.S. Energy Information Administration (EIA), International Energy Statistics database (as of November 2009),
web site www.eia.gov/emeu/international. Projections: EIA, Annual Energy Outlook 2010, DOE/EIA-0383(2010) (Washington, DC,April 2010), AEO2010 National Energy Modeling System, run HM2010.D020310A, web site www.eia.gov/oiaf/aeo; and InternationalNatural Gas Model (2010).

Table I8. World net natural gas trade by region, High Economic Growth case, 2007-2035(Trillion cubic feet)
Appendix I
300 U.S. Energy Information Administration / International Energy Outlook 2010
Region/Country
History Projections Average annualpercent change,
2007-20352007 2008 2015 2020 2025 2030 2035OECDOECD North America . . . . . . . . . . . 0.9 0.4 0.6 1.7 2.2 2.5 3.4 5.0United Statesa. . . . . . . . . . . . . . . . . 3.8 3.0 2.5 2.8 2.6 2.3 2.2 -1.9Canada . . . . . . . . . . . . . . . . . . . . . . -3.4 -3.1 -2.4 -2.2 -2.3 -2.5 -2.4 -1.3Mexico. . . . . . . . . . . . . . . . . . . . . . . 0.5 0.5 0.6 1.1 1.9 2.7 3.6 7.1
OECD Europe . . . . . . . . . . . . . . . . . 9.0 8.9 10.6 12.5 13.6 14.3 15.2 1.9North Europe. . . . . . . . . . . . . . . . . . 3.5 3.3 5.1 6.3 7.1 7.6 8.1 3.1South Europe . . . . . . . . . . . . . . . . . 2.8 2.8 2.9 3.1 3.3 3.5 3.6 0.9Southwest Europe. . . . . . . . . . . . . . 1.4 1.5 1.5 1.6 1.7 1.8 1.8 1.0Turkey . . . . . . . . . . . . . . . . . . . . . . . 1.3 1.3 1.2 1.4 1.5 1.5 1.6 1.0
OECD Asia . . . . . . . . . . . . . . . . . . . . 4.4 4.2 3.3 3.6 3.9 3.9 3.1 -1.2Japan . . . . . . . . . . . . . . . . . . . . . . . 3.5 3.4 3.7 3.9 4.2 4.3 4.3 0.7South Korea . . . . . . . . . . . . . . . . . . 1.2 1.2 1.5 1.6 1.8 1.8 1.8 1.4Australia/New Zealand . . . . . . . . . . -0.4 -0.4 -1.8 -2.0 -2.0 -2.2 -3.0 7.5
Total OECD . . . . . . . . . . . . . . . . . 14.2 13.4 14.6 17.8 19.7 20.8 21.7 1.5
Non-OECDNon-OECD Europe and Eurasia. . . -4.5 -5.0 -5.2 -6.2 -6.8 -7.6 -8.5 2.3Russia . . . . . . . . . . . . . . . . . . . . . . . -6.3 -6.6 -6.1 -7.2 -8.1 -9.1 -9.9 1.6Central Asia . . . . . . . . . . . . . . . . . . -2.0 -2.3 -3.1 -3.2 -3.1 -3.1 -3.1 1.7Non-OECD Europe . . . . . . . . . . . . . 3.7 3.8 4.0 4.2 4.4 4.5 4.5 0.7
Non-OECD Asia. . . . . . . . . . . . . . . . -1.5 -1.3 1.0 3.2 4.7 5.6 6.5 —China. . . . . . . . . . . . . . . . . . . . . . . . 0.0 0.0 2.0 3.2 3.9 4.1 4.1 17.6India . . . . . . . . . . . . . . . . . . . . . . . . 0.4 0.4 0.4 0.9 1.0 1.1 1.1 4.1LNG exporters. . . . . . . . . . . . . . . . . -2.6 -2.6 -2.9 -3.0 -2.9 -2.6 -2.0 -1.0Developed Asia. . . . . . . . . . . . . . . . 0.8 0.8 1.0 1.2 1.4 1.5 1.5 2.5Other Southeast Asia . . . . . . . . . . . 0.0 0.0 0.4 0.9 1.2 1.4 1.6 23.1Northwest Asia . . . . . . . . . . . . . . . . 0.0 0.0 0.0 0.0 0.0 0.1 0.2 —
Middle East . . . . . . . . . . . . . . . . . . . -1.9 -1.9 -4.4 -6.2 -7.8 -8.5 -9.2 5.7Arabian producers. . . . . . . . . . . . . . -0.5 0.0 -0.3 -0.4 0.0 0.3 0.7 —Iran . . . . . . . . . . . . . . . . . . . . . . . . . 0.0 0.1 -0.3 -1.4 -2.3 -2.8 -3.3 —Iraq . . . . . . . . . . . . . . . . . . . . . . . . . 0.0 0.0 0.0 -0.3 -0.5 -0.5 -0.8 —Qatar . . . . . . . . . . . . . . . . . . . . . . . . -1.5 -2.0 -4.1 -4.6 -5.6 -6.1 -6.4 5.2Saudi Arabia . . . . . . . . . . . . . . . . . . 0.0 0.0 0.0 0.0 0.0 0.0 0.0 —Other Middle East . . . . . . . . . . . . . . 0.1 0.1 0.3 0.5 0.6 0.6 0.7 7.8
Africa . . . . . . . . . . . . . . . . . . . . . . . . -3.8 -3.9 -6.5 -7.1 -7.5 -7.6 -7.3 2.4North Africa . . . . . . . . . . . . . . . . . . . -2.9 -3.0 -5.1 -5.8 -6.2 -6.3 -5.9 2.5West Africa . . . . . . . . . . . . . . . . . . . -0.8 -0.9 -1.5 -2.0 -2.1 -2.2 -2.2 3.6South Africa . . . . . . . . . . . . . . . . . . 0.1 0.1 0.1 0.7 0.8 0.8 0.7 7.3Other Africa. . . . . . . . . . . . . . . . . . . -0.1 -0.1 0.0 0.0 0.0 0.0 0.0 —
Central and South America . . . . . . -0.6 -0.5 -1.0 -1.7 -1.7 -1.5 -1.4 3.0Brazil . . . . . . . . . . . . . . . . . . . . . . . . 0.4 0.4 0.0 0.0 0.0 -0.1 -0.2 —Northern producers . . . . . . . . . . . . . -0.7 -0.6 -1.0 -1.9 -2.0 -1.9 -1.7 3.4Other South America . . . . . . . . . . . -0.4 -0.4 0.0 0.3 0.3 0.4 0.5 —Central America and Caribbean . . . 0.0 0.0 0.0 0.0 0.0 0.0 0.0 —Total Non-OECD . . . . . . . . . . . . . -12.3 -12.7 -16.2 -18.0 -19.1 -19.8 -19.9 1.7
Total World . . . . . . . . . . . . . . . . . . . . 1.9 0.8 -1.6 -0.2 0.6 1.0 1.8 —
Sources: History: U.S. Energy Information Administration (EIA), International Energy Statistics database (as of November 2009),web site www.eia.gov/emeu/international. Projections: EIA, Annual Energy Outlook 2010, DOE/EIA-0383(2010) (Washington, DC,April 2010), AEO2010 National Energy Modeling System, run HM2010.D020310A, web site www.eia.gov/oiaf/aeo; and InternationalNatural Gas Model (2010).

Table I9. World total natural gas production by region, Low Economic Growth case, 2007-2035(Trillion cubic feet)
Natural gas production projections
U.S. Energy Information Administration / International Energy Outlook 2010 301
Region/Country
History Projections Average annualpercent change,
2007-20352007 2008 2015 2020 2025 2030 2035OECDOECD North America . . . . . . . . . . . 27.4 28.2 27.0 26.9 27.4 29.0 30.2 0.3United Statesa. . . . . . . . . . . . . . . . . 19.2 20.3 19.2 19.5 19.9 21.0 21.8 0.4Canada . . . . . . . . . . . . . . . . . . . . . . 6.3 6.0 5.6 5.4 5.6 6.0 6.5 0.1Mexico. . . . . . . . . . . . . . . . . . . . . . . 1.8 1.8 2.2 2.0 2.0 2.0 1.9 0.2
OECD Europe . . . . . . . . . . . . . . . . . 10.2 10.7 9.6 9.0 8.4 7.7 7.4 -1.1North Europe. . . . . . . . . . . . . . . . . . 9.8 10.3 9.2 8.6 7.9 7.3 7.0 -1.2South Europe . . . . . . . . . . . . . . . . . 0.3 0.3 0.4 0.4 0.4 0.4 0.4 0.6Southwest Europe. . . . . . . . . . . . . . 0.0 0.0 0.0 0.0 0.0 0.0 0.0 —Turkey . . . . . . . . . . . . . . . . . . . . . . . 0.0 0.0 0.0 0.0 0.0 0.0 0.0 —
OECD Asia . . . . . . . . . . . . . . . . . . . . 1.9 2.0 3.6 3.8 3.9 4.0 4.1 2.7Japan . . . . . . . . . . . . . . . . . . . . . . . 0.2 0.2 0.1 0.1 0.1 0.1 0.1 -2.4South Korea . . . . . . . . . . . . . . . . . . 0.0 0.0 0.0 0.0 0.0 0.0 0.0 2.2Australia/New Zealand . . . . . . . . . . 1.7 1.7 3.5 3.7 3.7 3.8 4.0 3.0Total OECD . . . . . . . . . . . . . . . . . 39.5 40.8 40.2 39.7 39.7 40.7 41.7 0.2
Non-OECDNon-OECD Europe and Eurasia. . . 30.4 31.2 32.1 33.7 34.4 35.2 35.4 0.5Russia . . . . . . . . . . . . . . . . . . . . . . . 23.1 23.4 22.9 24.1 24.9 25.9 26.4 0.5Central Asia . . . . . . . . . . . . . . . . . . 6.1 6.6 7.8 8.2 8.2 8.0 7.7 0.8Non-OECD Europe . . . . . . . . . . . . . 1.2 1.2 1.4 1.4 1.3 1.3 1.2 0.0
Non-OECD Asia. . . . . . . . . . . . . . . . 12.0 12.6 15.6 16.9 17.5 17.8 18.3 1.5China. . . . . . . . . . . . . . . . . . . . . . . . 2.4 2.7 2.9 3.0 2.9 3.0 3.6 1.4India . . . . . . . . . . . . . . . . . . . . . . . . 1.1 1.1 2.7 2.9 3.0 3.1 3.0 3.7LNG exporters. . . . . . . . . . . . . . . . . 4.9 5.0 6.4 7.1 7.5 7.5 7.3 1.5Developed Asia. . . . . . . . . . . . . . . . 0.0 0.0 0.0 0.0 0.0 0.0 0.0 —Other Southeast Asia . . . . . . . . . . . 2.3 2.4 2.3 2.3 2.3 2.3 2.3 0.1Northwest Asia . . . . . . . . . . . . . . . . 1.3 1.3 1.4 1.6 1.8 1.9 2.0 1.6
Middle East . . . . . . . . . . . . . . . . . . . 12.6 13.5 20.4 23.7 26.6 27.8 29.8 3.1Arabian producers. . . . . . . . . . . . . . 3.5 3.5 3.7 4.3 4.4 4.2 4.0 0.5Iran . . . . . . . . . . . . . . . . . . . . . . . . . 4.0 4.1 6.1 7.8 8.9 9.5 10.5 3.6Iraq . . . . . . . . . . . . . . . . . . . . . . . . . 0.1 0.1 0.2 0.5 0.7 0.8 1.1 11.6Qatar . . . . . . . . . . . . . . . . . . . . . . . . 2.2 2.7 6.2 6.5 7.9 8.7 9.4 5.3Saudi Arabia . . . . . . . . . . . . . . . . . . 2.6 2.8 4.1 4.4 4.5 4.5 4.6 2.1Other Middle East . . . . . . . . . . . . . . 0.3 0.3 0.2 0.2 0.2 0.1 0.1 -2.7
Africa . . . . . . . . . . . . . . . . . . . . . . . . 6.8 7.2 11.0 12.3 13.0 13.3 13.5 2.5North Africa . . . . . . . . . . . . . . . . . . . 5.3 5.4 7.9 8.7 9.0 9.2 9.4 2.1West Africa . . . . . . . . . . . . . . . . . . . 1.3 1.5 2.9 3.5 3.8 3.9 3.9 3.9South Africa . . . . . . . . . . . . . . . . . . 0.1 0.1 0.1 0.1 0.1 0.1 0.1 -0.9Other Africa. . . . . . . . . . . . . . . . . . . 0.1 0.1 0.1 0.1 0.1 0.1 0.1 -0.2
Central and South America . . . . . . 5.2 5.3 6.6 8.1 9.1 9.2 9.2 2.0Brazil . . . . . . . . . . . . . . . . . . . . . . . . 0.3 0.4 1.0 1.3 1.6 1.8 2.0 6.4Northern producers . . . . . . . . . . . . . 2.6 2.6 3.1 4.2 4.9 4.9 4.7 2.2Other South America . . . . . . . . . . . 2.2 2.2 2.3 2.5 2.5 2.4 2.4 0.2Central America and Caribbean . . . 0.0 0.0 0.1 0.1 0.1 0.1 0.1 6.1Total Non-OECD . . . . . . . . . . . . . 67.0 69.7 85.7 94.7 100.6 103.4 106.2 1.7
Total World . . . . . . . . . . . . . . . . . . . . 106.6 110.5 126.0 134.4 140.2 144.1 147.9 1.2Discrepancyb. . . . . . . . . . . . . . . . . . . 1.9 0.7 -2.7 -1.8 -1.6 -1.7 -0.7aIncludes the 50 States and the District of Columbia. Production includes supplemental production, less any forecast discrepancy.bBalancing item. Differences between global production and consumption totals result from rounding and different conversion
factors derived from heat contents of regionally consumed and produced natural gas.Sources: History: U.S. Energy Information Administration (EIA), International Energy Statistics database (as of November 2009),
web site www.eia.gov/emeu/international. Projections: EIA, Annual Energy Outlook 2010, DOE/EIA-0383(2010) (Washington, DC,April 2010), AEO2010 National Energy Modeling System, run LM2010.D011110A, web site www.eia.gov/oiaf/aeo; and InternationalNatural Gas Model (2010).

Table I10. World tight gas, shale gas, and coalbed methane production by region, Low Economic Growthcase, 2007-2035(Trillion cubic feet)
Appendix I
302 U.S. Energy Information Administration / International Energy Outlook 2010
Region/Country
History Projections Average annualpercent change,
2007-20352007 2008 2015 2020 2025 2030 2035OECDOECD North America . . . . . . . . . . . 5.0 5.6 8.1 8.8 9.9 10.5 11.8 3.1United Statesa. . . . . . . . . . . . . . . . . 3.1 3.5 5.8 6.4 7.0 6.9 7.4 3.2Canada . . . . . . . . . . . . . . . . . . . . . . 2.0 2.1 2.3 2.4 2.8 3.4 4.0 2.6Mexico. . . . . . . . . . . . . . . . . . . . . . . 0.0 0.0 0.0 0.0 0.1 0.3 0.4 —
OECD Europe . . . . . . . . . . . . . . . . . 0.0 0.0 0.1 0.1 0.1 0.1 0.3 —North Europe. . . . . . . . . . . . . . . . . . 0.0 0.0 0.1 0.1 0.1 0.1 0.3 —South Europe . . . . . . . . . . . . . . . . . 0.0 0.0 0.0 0.0 0.0 0.0 0.0 —Southwest Europe. . . . . . . . . . . . . . 0.0 0.0 0.0 0.0 0.0 0.0 0.0 —Turkey . . . . . . . . . . . . . . . . . . . . . . . 0.0 0.0 0.0 0.0 0.0 0.0 0.0 —
OECD Asia . . . . . . . . . . . . . . . . . . . . 0.1 0.1 0.1 0.1 0.2 0.3 0.6 7.0Japan . . . . . . . . . . . . . . . . . . . . . . . 0.0 0.0 0.0 0.0 0.0 0.0 0.0 —South Korea . . . . . . . . . . . . . . . . . . 0.0 0.0 0.0 0.0 0.0 0.0 0.0 —Australia/New Zealand . . . . . . . . . . 0.1 0.1 0.1 0.1 0.2 0.3 0.6 7.0Total OECD . . . . . . . . . . . . . . . . . 5.1 5.7 8.3 9.0 10.1 10.9 12.6 3.3
Non-OECDNon-OECD Europe and Eurasia. . . 0.0 0.0 0.1 0.0 0.0 0.0 0.0 —Russia . . . . . . . . . . . . . . . . . . . . . . . 0.0 0.0 0.0 0.0 0.0 0.0 0.0 —Central Asia . . . . . . . . . . . . . . . . . . 0.0 0.0 0.0 0.0 0.0 0.0 0.0 —Non-OECD Europe . . . . . . . . . . . . . 0.0 0.0 0.0 0.0 0.0 0.0 0.0 —
Non-OECD Asia. . . . . . . . . . . . . . . . 0.2 0.2 0.4 0.6 0.8 1.2 2.2 9.0China. . . . . . . . . . . . . . . . . . . . . . . . 0.2 0.2 0.3 0.3 0.3 0.4 1.1 6.3India . . . . . . . . . . . . . . . . . . . . . . . . 0.0 0.0 0.0 0.0 0.0 0.1 0.1 —LNG exporters. . . . . . . . . . . . . . . . . 0.0 0.0 0.0 0.0 0.0 0.0 0.0 —Developed Asia. . . . . . . . . . . . . . . . 0.0 0.0 0.0 0.0 0.0 0.0 0.0 —Other Southeast Asia . . . . . . . . . . . 0.0 0.0 0.0 0.0 0.0 0.0 0.1 —Northwest Asia . . . . . . . . . . . . . . . . 0.0 0.0 0.0 0.3 0.5 0.7 0.9 —
Middle East . . . . . . . . . . . . . . . . . . . 0.0 0.0 0.0 0.0 0.0 0.0 0.0 —Arabian producers. . . . . . . . . . . . . . 0.0 0.0 0.0 0.0 0.0 0.0 0.0 —Iran . . . . . . . . . . . . . . . . . . . . . . . . . 0.0 0.0 0.0 0.0 0.0 0.0 0.0 —Iraq . . . . . . . . . . . . . . . . . . . . . . . . . 0.0 0.0 0.0 0.0 0.0 0.0 0.0 —Qatar . . . . . . . . . . . . . . . . . . . . . . . . 0.0 0.0 0.0 0.0 0.0 0.0 0.0 —Saudi Arabia . . . . . . . . . . . . . . . . . . 0.0 0.0 0.0 0.0 0.0 0.0 0.0 —Other Middle East . . . . . . . . . . . . . . 0.0 0.0 0.0 0.0 0.0 0.0 0.0 —
Africa . . . . . . . . . . . . . . . . . . . . . . . . 0.0 0.0 0.0 0.0 0.0 0.0 0.0 —North Africa . . . . . . . . . . . . . . . . . . . 0.0 0.0 0.0 0.0 0.0 0.0 0.0 —West Africa . . . . . . . . . . . . . . . . . . . 0.0 0.0 0.0 0.0 0.0 0.0 0.0 —South Africa . . . . . . . . . . . . . . . . . . 0.0 0.0 0.0 0.0 0.0 0.0 0.0 —Other Africa. . . . . . . . . . . . . . . . . . . 0.0 0.0 0.0 0.0 0.0 0.0 0.0 —
Central and South America . . . . . . 0.0 0.0 0.0 0.0 0.0 0.0 0.1 —Brazil . . . . . . . . . . . . . . . . . . . . . . . . 0.0 0.0 0.0 0.0 0.0 0.0 0.0 —Northern producers . . . . . . . . . . . . . 0.0 0.0 0.0 0.0 0.0 0.0 0.0 —Other South America . . . . . . . . . . . 0.0 0.0 0.0 0.0 0.0 0.0 0.1 —Central America and Caribbean . . . 0.0 0.0 0.0 0.0 0.0 0.0 0.0 —Total Non-OECD . . . . . . . . . . . . . 0.2 0.2 0.5 0.7 0.9 1.3 2.4 9.3
Total World . . . . . . . . . . . . . . . . . . . . 5.3 5.9 8.8 9.7 11.0 12.1 15.0 3.8aIncludes the 50 States and the District of Columbia. U.S. tight gas is reported in the “other natural gas” table that follows.Sources: History: United States: U.S. Energy Information Administration (EIA), Natural Gas Navigator, “Unconventional Dry
Natural Gas Production” (as of November 2009), web site www.eia.gov/dnav/ng/ng_prod_top.asp. Other countries: EIA, Office ofIntegrated Analysis and Forecasting, internal estimates. Projections: EIA, Annual Energy Outlook 2010, DOE/EIA-0383(2010)(Washington, DC, April 2010), AEO2010 National Energy Modeling System, run LM2010.D011110A, web site www.eia.gov/oiaf/aeo; and International Natural Gas Model (2010).

Table I11. World other natural gas production by region, Low Economic Growth case, 2007-2035(Trillion cubic feet)
Natural gas production projections
U.S. Energy Information Administration / International Energy Outlook 2010 303
Region/Country
History Projections Average annualpercent change,
2007-20352007 2008 2015 2020 2025 2030 2035OECDOECD North America . . . . . . . . . . . 22.4 22.6 18.9 18.1 17.6 18.5 18.4 -0.7United Statesa. . . . . . . . . . . . . . . . . 16.2 16.8 13.4 13.1 12.9 14.2 14.4 -0.4Canada . . . . . . . . . . . . . . . . . . . . . . 4.4 3.9 3.3 3.0 2.8 2.6 2.5 -2.0Mexico. . . . . . . . . . . . . . . . . . . . . . . 1.8 1.8 2.2 2.0 1.8 1.7 1.5 -0.7
OECD Europe . . . . . . . . . . . . . . . . . 10.2 10.7 9.5 8.9 8.3 7.7 7.1 -1.3North Europe. . . . . . . . . . . . . . . . . . 9.8 10.3 9.1 8.5 7.9 7.3 6.7 -1.4South Europe . . . . . . . . . . . . . . . . . 0.3 0.3 0.4 0.4 0.4 0.4 0.4 0.4Southwest Europe. . . . . . . . . . . . . . 0.0 0.0 0.0 0.0 0.0 0.0 0.0 —Turkey . . . . . . . . . . . . . . . . . . . . . . . 0.0 0.0 0.0 0.0 0.0 0.0 0.0 —
OECD Asia . . . . . . . . . . . . . . . . . . . . 1.8 1.8 3.5 3.7 3.7 3.7 3.5 2.3Japan . . . . . . . . . . . . . . . . . . . . . . . 0.2 0.2 0.1 0.1 0.1 0.1 0.1 -2.5South Korea . . . . . . . . . . . . . . . . . . 0.0 0.0 0.0 0.0 0.0 0.0 0.0 2.2Australia/New Zealand . . . . . . . . . . 1.6 1.6 3.3 3.5 3.6 3.5 3.4 2.6Total OECD . . . . . . . . . . . . . . . . . 34.4 35.1 31.9 30.8 29.6 29.8 29.1 -0.6
Non-OECDNon-OECD Europe and Eurasia. . . 30.4 31.2 32.1 33.6 34.4 35.2 35.3 0.5Russia . . . . . . . . . . . . . . . . . . . . . . . 23.1 23.4 22.9 24.1 24.9 25.9 26.4 0.5Central Asia . . . . . . . . . . . . . . . . . . 6.1 6.6 7.8 8.1 8.2 8.0 7.7 0.8Non-OECD Europe . . . . . . . . . . . . . 1.2 1.2 1.4 1.4 1.3 1.3 1.2 -0.1
Non-OECD Asia. . . . . . . . . . . . . . . . 11.8 12.4 15.2 16.3 16.7 16.6 16.1 1.1China. . . . . . . . . . . . . . . . . . . . . . . . 2.2 2.5 2.6 2.7 2.7 2.6 2.5 0.3India . . . . . . . . . . . . . . . . . . . . . . . . 1.1 1.1 2.6 2.9 3.0 3.0 2.9 3.5LNG exporters. . . . . . . . . . . . . . . . . 4.9 5.0 6.4 7.1 7.5 7.5 7.3 1.5Developed Asia. . . . . . . . . . . . . . . . 0.0 0.0 0.0 0.0 0.0 0.0 0.0 —Other Southeast Asia . . . . . . . . . . . 2.3 2.4 2.3 2.3 2.3 2.3 2.3 0.0Northwest Asia . . . . . . . . . . . . . . . . 1.3 1.3 1.3 1.3 1.2 1.2 1.1 -0.6
Middle East . . . . . . . . . . . . . . . . . . . 12.6 13.5 20.4 23.7 26.5 27.8 29.7 3.1Arabian producers. . . . . . . . . . . . . . 3.5 3.5 3.7 4.3 4.3 4.2 4.0 0.5Iran . . . . . . . . . . . . . . . . . . . . . . . . . 4.0 4.1 6.1 7.8 8.9 9.5 10.5 3.6Iraq . . . . . . . . . . . . . . . . . . . . . . . . . 0.1 0.1 0.2 0.5 0.7 0.7 1.1 11.5Qatar . . . . . . . . . . . . . . . . . . . . . . . . 2.2 2.7 6.2 6.5 7.9 8.7 9.4 5.3Saudi Arabia . . . . . . . . . . . . . . . . . . 2.6 2.8 4.1 4.4 4.5 4.5 4.6 2.1Other Middle East . . . . . . . . . . . . . . 0.3 0.3 0.2 0.2 0.2 0.1 0.1 -2.8
Africa . . . . . . . . . . . . . . . . . . . . . . . . 6.8 7.2 11.0 12.3 13.0 13.3 13.5 2.5North Africa . . . . . . . . . . . . . . . . . . . 5.3 5.4 7.9 8.7 9.0 9.2 9.4 2.1West Africa . . . . . . . . . . . . . . . . . . . 1.3 1.5 2.9 3.5 3.8 3.9 3.9 3.9South Africa . . . . . . . . . . . . . . . . . . 0.1 0.1 0.1 0.1 0.1 0.1 0.1 -1.1Other Africa. . . . . . . . . . . . . . . . . . . 0.1 0.1 0.1 0.1 0.1 0.1 0.1 -0.2
Central and South America . . . . . . 5.2 5.3 6.6 8.1 9.1 9.2 9.1 2.0Brazil . . . . . . . . . . . . . . . . . . . . . . . . 0.3 0.4 1.0 1.3 1.6 1.8 1.9 6.3Northern producers . . . . . . . . . . . . . 2.6 2.6 3.1 4.2 4.9 4.9 4.7 2.2Other South America . . . . . . . . . . . 2.2 2.2 2.3 2.5 2.5 2.4 2.3 0.1Central America and Caribbean . . . 0.0 0.0 0.1 0.1 0.1 0.1 0.1 5.9Total Non-OECD . . . . . . . . . . . . . 66.8 69.5 85.2 94.0 99.6 102.1 103.8 1.6
Total World . . . . . . . . . . . . . . . . . . . . 101.3 104.6 117.2 124.8 129.2 132.0 132.8 1.0aIncludes the 50 States and the District of Columbia. Production includes supplemental production, less any forecast discrepancy.Sources: History: U.S. Energy Information Administration (EIA), International Energy Statistics database (as of November 2009),
web site www.eia.gov/emeu/international. Projections: EIA, Annual Energy Outlook 2010, DOE/EIA-0383(2010) (Washington, DC,April 2010), AEO2010 National Energy Modeling System, run LM2010.D011110A, web site www.eia.gov/oiaf/aeo; and InternationalNatural Gas Model (2010).

Table I12. World net natural gas trade by region, Low Economic Growth case, 2007-2035(Trillion cubic feet)
Appendix I
304 U.S. Energy Information Administration / International Energy Outlook 2010
Region/Country
History Projections Average annualpercent change,
2007-20352007 2008 2015 2020 2025 2030 2035OECDOECD North America . . . . . . . . . . . 0.9 0.4 0.4 1.2 1.7 1.3 1.4 1.8United Statesa. . . . . . . . . . . . . . . . . 3.8 3.0 2.3 2.3 2.0 1.3 0.9 -5.0Canada . . . . . . . . . . . . . . . . . . . . . . -3.4 -3.1 -2.4 -2.1 -2.1 -2.3 -2.6 -1.0Mexico. . . . . . . . . . . . . . . . . . . . . . . 0.5 0.5 0.5 1.0 1.7 2.4 3.2 6.6
OECD Europe . . . . . . . . . . . . . . . . . 9.0 8.9 10.5 11.3 11.9 12.3 12.7 1.2North Europe. . . . . . . . . . . . . . . . . . 3.5 3.3 4.9 5.7 6.3 6.6 6.9 2.4South Europe . . . . . . . . . . . . . . . . . 2.8 2.8 2.8 2.9 2.9 2.9 3.0 0.2Southwest Europe. . . . . . . . . . . . . . 1.4 1.5 1.5 1.5 1.5 1.5 1.5 0.3Turkey . . . . . . . . . . . . . . . . . . . . . . . 1.3 1.3 1.2 1.2 1.3 1.3 1.3 0.2
OECD Asia . . . . . . . . . . . . . . . . . . . . 4.4 4.2 3.2 3.2 3.3 3.2 3.2 -1.1Japan . . . . . . . . . . . . . . . . . . . . . . . 3.5 3.4 3.7 3.6 3.6 3.5 3.4 -0.1South Korea . . . . . . . . . . . . . . . . . . 1.2 1.2 1.4 1.5 1.7 1.7 1.7 1.3Australia/New Zealand . . . . . . . . . . -0.4 -0.4 -1.8 -2.0 -2.0 -2.0 -2.0 5.9
Total OECD . . . . . . . . . . . . . . . . . 14.2 13.4 14.1 15.7 16.9 16.9 17.3 0.7
Non-OECDNon-OECD Europe and Eurasia. . . -4.5 -5.0 -5.4 -6.6 -7.0 -8.0 -7.9 2.0Russia . . . . . . . . . . . . . . . . . . . . . . . -6.3 -6.6 -6.2 -7.4 -8.1 -9.1 -9.4 1.4Central Asia . . . . . . . . . . . . . . . . . . -2.0 -2.3 -3.1 -3.3 -3.3 -3.2 -2.9 1.4Non-OECD Europe . . . . . . . . . . . . . 3.7 3.8 4.0 4.2 4.3 4.3 4.4 0.5
Non-OECD Asia. . . . . . . . . . . . . . . . -1.5 -1.3 1.0 3.2 5.3 7.1 8.3 —China. . . . . . . . . . . . . . . . . . . . . . . . 0.0 0.0 2.0 3.3 4.6 5.7 5.8 19.1India . . . . . . . . . . . . . . . . . . . . . . . . 0.4 0.4 0.4 0.9 1.3 1.3 1.4 5.0LNG exporters. . . . . . . . . . . . . . . . . -2.6 -2.6 -2.8 -3.0 -3.0 -2.8 -2.2 -0.6Developed Asia. . . . . . . . . . . . . . . . 0.8 0.8 1.0 1.1 1.3 1.4 1.5 2.5Other Southeast Asia . . . . . . . . . . . 0.0 0.0 0.4 0.8 1.1 1.4 1.6 23.2Northwest Asia . . . . . . . . . . . . . . . . 0.0 0.0 0.0 0.0 0.0 0.0 0.1 —
Middle East . . . . . . . . . . . . . . . . . . . -1.9 -1.9 -4.4 -5.7 -8.0 -9.1 -10.2 6.2Arabian producers. . . . . . . . . . . . . . -0.5 0.0 -0.4 -0.7 -0.4 -0.2 0.2 —Iran . . . . . . . . . . . . . . . . . . . . . . . . . 0.0 0.1 -0.3 -1.3 -2.3 -3.1 -3.8 —Iraq . . . . . . . . . . . . . . . . . . . . . . . . . 0.0 0.0 0.0 -0.3 -0.5 -0.5 -0.8 —Qatar . . . . . . . . . . . . . . . . . . . . . . . . -1.5 -2.0 -4.0 -3.9 -5.3 -5.8 -6.4 5.2Saudi Arabia . . . . . . . . . . . . . . . . . . 0.0 0.0 0.0 0.0 0.0 0.0 0.0 —Other Middle East . . . . . . . . . . . . . . 0.1 0.1 0.3 0.4 0.5 0.6 0.6 7.4
Africa . . . . . . . . . . . . . . . . . . . . . . . . -3.8 -3.9 -6.3 -6.8 -6.8 -6.9 -6.8 2.2North Africa . . . . . . . . . . . . . . . . . . . -2.9 -3.0 -5.0 -5.6 -5.5 -5.5 -5.5 2.3West Africa . . . . . . . . . . . . . . . . . . . -0.8 -0.9 -1.5 -1.9 -2.1 -2.2 -2.2 3.5South Africa . . . . . . . . . . . . . . . . . . 0.1 0.1 0.1 0.7 0.8 0.8 0.9 8.0Other Africa. . . . . . . . . . . . . . . . . . . -0.1 -0.1 0.0 0.0 0.0 0.0 0.0 —
Central and South America . . . . . . -0.6 -0.5 -1.2 -1.7 -2.5 -2.5 -2.1 4.5Brazil . . . . . . . . . . . . . . . . . . . . . . . . 0.4 0.4 -0.1 -0.1 -0.2 -0.2 -0.1 —Northern producers . . . . . . . . . . . . . -0.7 -0.6 -1.0 -1.7 -2.4 -2.4 -2.1 4.1Other South America . . . . . . . . . . . -0.4 -0.4 -0.1 0.1 0.1 0.1 0.1 —Central America and Caribbean . . . 0.0 0.0 0.0 0.0 0.0 0.0 0.0 —Total Non-OECD . . . . . . . . . . . . . -12.3 -12.7 -16.3 -17.6 -18.9 -19.3 -18.8 1.5
Total World . . . . . . . . . . . . . . . . . . . . 1.9 0.8 -2.3 -1.9 -2.0 -2.4 -1.4 —
Sources: History: U.S. Energy Information Administration (EIA), International Energy Statistics database (as of November 2009),web site www.eia.gov/emeu/international. Projections: EIA, Annual Energy Outlook 2010, DOE/EIA-0383(2010) (Washington, DC,April 2010), AEO2010 National Energy Modeling System, run LM2010.D011110A, web site www.eia.gov/oiaf/aeo; and InternationalNatural Gas Model (2010).

Table I13. World total natural gas production by region, High Oil Price case, 2007-2035(Trillion cubic feet)
Natural gas production projections
U.S. Energy Information Administration / International Energy Outlook 2010 305
Region/Country
History Projections Average annualpercent change,
2007-20352007 2008 2015 2020 2025 2030 2035OECDOECD North America . . . . . . . . . . . 27.4 28.2 26.8 28.5 30.9 32.9 34.4 0.8United Statesa. . . . . . . . . . . . . . . . . 19.2 20.3 18.9 20.5 22.5 24.0 25.1 1.0Canada . . . . . . . . . . . . . . . . . . . . . . 6.3 6.0 5.7 5.9 6.4 6.9 7.3 0.5Mexico. . . . . . . . . . . . . . . . . . . . . . . 1.8 1.8 2.1 2.0 2.0 2.0 2.1 0.4
OECD Europe . . . . . . . . . . . . . . . . . 10.2 10.7 9.6 9.0 8.4 8.1 7.8 -0.9North Europe. . . . . . . . . . . . . . . . . . 9.8 10.3 9.2 8.6 8.0 7.6 7.4 -1.0South Europe . . . . . . . . . . . . . . . . . 0.3 0.3 0.4 0.4 0.4 0.4 0.4 0.9Southwest Europe. . . . . . . . . . . . . . 0.0 0.0 0.0 0.0 0.0 0.0 0.0 —Turkey . . . . . . . . . . . . . . . . . . . . . . . 0.0 0.0 0.0 0.0 0.0 0.0 0.0 —
OECD Asia . . . . . . . . . . . . . . . . . . . . 1.9 2.0 3.8 4.0 4.1 4.2 4.8 3.3Japan . . . . . . . . . . . . . . . . . . . . . . . 0.2 0.2 0.1 0.1 0.1 0.1 0.1 -2.4South Korea . . . . . . . . . . . . . . . . . . 0.0 0.0 0.0 0.0 0.0 0.0 0.0 2.2Australia/New Zealand . . . . . . . . . . 1.7 1.7 3.6 3.8 3.9 4.1 4.7 3.6Total OECD . . . . . . . . . . . . . . . . . 39.5 40.8 40.3 41.5 43.3 45.2 47.1 0.6
Non-OECDNon-OECD Europe and Eurasia. . . 30.4 31.2 32.2 34.0 35.5 36.3 36.9 0.7Russia . . . . . . . . . . . . . . . . . . . . . . . 23.1 23.4 23.0 24.4 25.9 26.9 27.5 0.6Central Asia . . . . . . . . . . . . . . . . . . 6.1 6.6 7.8 8.2 8.2 8.0 8.0 1.0Non-OECD Europe . . . . . . . . . . . . . 1.2 1.2 1.4 1.4 1.4 1.3 1.3 0.3
Non-OECD Asia. . . . . . . . . . . . . . . . 12.0 12.6 15.9 17.3 18.3 19.5 20.8 2.0China. . . . . . . . . . . . . . . . . . . . . . . . 2.4 2.7 2.9 3.0 3.2 4.2 5.4 2.8India . . . . . . . . . . . . . . . . . . . . . . . . 1.1 1.1 2.6 3.0 3.2 3.2 3.3 3.9LNG exporters. . . . . . . . . . . . . . . . . 4.9 5.0 6.6 7.3 7.6 7.6 7.5 1.6Developed Asia. . . . . . . . . . . . . . . . 0.0 0.0 0.0 0.0 0.0 0.0 0.0 —Other Southeast Asia . . . . . . . . . . . 2.3 2.4 2.3 2.3 2.4 2.4 2.5 0.3Northwest Asia . . . . . . . . . . . . . . . . 1.3 1.3 1.4 1.7 1.9 2.0 2.1 1.7
Middle East . . . . . . . . . . . . . . . . . . . 12.6 13.5 20.9 24.9 27.4 29.0 31.0 3.3Arabian producers. . . . . . . . . . . . . . 3.5 3.5 4.0 4.5 4.5 4.3 4.1 0.6Iran . . . . . . . . . . . . . . . . . . . . . . . . . 4.0 4.1 6.5 8.2 9.4 9.8 10.7 3.6Iraq . . . . . . . . . . . . . . . . . . . . . . . . . 0.1 0.1 0.2 0.5 0.7 0.8 1.1 11.7Qatar . . . . . . . . . . . . . . . . . . . . . . . . 2.2 2.7 6.0 7.0 7.8 8.9 9.5 5.3Saudi Arabia . . . . . . . . . . . . . . . . . . 2.6 2.8 4.0 4.5 4.9 5.1 5.4 2.6Other Middle East . . . . . . . . . . . . . . 0.3 0.3 0.2 0.2 0.2 0.1 0.1 -2.6
Africa . . . . . . . . . . . . . . . . . . . . . . . . 6.8 7.2 11.7 13.7 14.4 14.5 14.2 2.7North Africa . . . . . . . . . . . . . . . . . . . 5.3 5.4 8.5 9.8 10.2 10.2 9.9 2.3West Africa . . . . . . . . . . . . . . . . . . . 1.3 1.5 3.0 3.6 3.9 4.0 4.0 4.0South Africa . . . . . . . . . . . . . . . . . . 0.1 0.1 0.1 0.1 0.1 0.1 0.1 -0.6Other Africa. . . . . . . . . . . . . . . . . . . 0.1 0.1 0.1 0.2 0.2 0.2 0.2 1.7
Central and South America . . . . . . 5.2 5.3 6.8 8.8 9.8 10.3 10.9 2.7Brazil . . . . . . . . . . . . . . . . . . . . . . . . 0.3 0.4 1.1 1.6 1.9 2.2 2.8 7.7Northern producers . . . . . . . . . . . . . 2.6 2.6 3.1 4.4 5.2 5.2 5.1 2.5Other South America . . . . . . . . . . . 2.2 2.2 2.4 2.6 2.6 2.7 2.9 1.0Central America and Caribbean . . . 0.0 0.0 0.1 0.1 0.1 0.1 0.1 6.1Total Non-OECD . . . . . . . . . . . . . 67.0 69.7 87.4 98.6 105.3 109.5 113.8 1.9
Total World . . . . . . . . . . . . . . . . . . . . 106.6 110.5 127.7 140.1 148.6 154.7 160.9 1.5Discrepancyb. . . . . . . . . . . . . . . . . . . 1.9 0.7 -2.9 -1.9 -0.5 0.1 1.1aIncludes the 50 States and the District of Columbia. Production includes supplemental production, less any forecast discrepancy.bBalancing item. Differences between global production and consumption totals result from rounding and different conversion
factors derived from heat contents of regionally consumed and produced natural gas.Sources: History: U.S. Energy Information Administration (EIA), International Energy Statistics database (as of November 2009),
web site www.eia.gov/emeu/international. Projections: EIA, Annual Energy Outlook 2010, DOE/EIA-0383(2010) (Washington, DC,April 2010), AEO2010 National Energy Modeling System, run HP2010.D011910A, web site www.eia.gov/oiaf/aeo; and InternationalNatural Gas Model (2010).

Table I14. World tight gas, shale gas, and coalbed methane production by region, High Oil Price case,2007-2035(Trillion cubic feet)
Appendix I
306 U.S. Energy Information Administration / International Energy Outlook 2010
Region/Country
History Projections Average annualpercent change,
2007-20352007 2008 2015 2020 2025 2030 2035OECDOECD North America . . . . . . . . . . . 5.0 5.6 8.0 9.0 10.1 11.5 12.9 3.4
United Statesa. . . . . . . . . . . . . . . . . 3.1 3.5 5.6 6.1 6.5 7.1 7.8 3.4Canada . . . . . . . . . . . . . . . . . . . . . . 2.0 2.1 2.4 2.8 3.4 4.0 4.6 3.1Mexico. . . . . . . . . . . . . . . . . . . . . . . 0.0 0.0 0.0 0.1 0.2 0.4 0.6 —
OECD Europe . . . . . . . . . . . . . . . . . 0.0 0.0 0.1 0.1 0.1 0.4 0.7 —North Europe. . . . . . . . . . . . . . . . . . 0.0 0.0 0.1 0.1 0.1 0.4 0.7 —South Europe . . . . . . . . . . . . . . . . . 0.0 0.0 0.0 0.0 0.0 0.0 0.1 —Southwest Europe. . . . . . . . . . . . . . 0.0 0.0 0.0 0.0 0.0 0.0 0.0 —Turkey . . . . . . . . . . . . . . . . . . . . . . . 0.0 0.0 0.0 0.0 0.0 0.0 0.0 —
OECD Asia . . . . . . . . . . . . . . . . . . . . 0.1 0.1 0.1 0.1 0.3 0.5 1.2 10.1Japan . . . . . . . . . . . . . . . . . . . . . . . 0.0 0.0 0.0 0.0 0.0 0.0 0.0 —South Korea . . . . . . . . . . . . . . . . . . 0.0 0.0 0.0 0.0 0.0 0.0 0.0 —Australia/New Zealand . . . . . . . . . . 0.1 0.1 0.1 0.1 0.3 0.5 1.2 10.1
Total OECD . . . . . . . . . . . . . . . . . 5.1 5.7 8.2 9.2 10.5 12.4 14.9 3.9
Non-OECDNon-OECD Europe and Eurasia. . . 0.0 0.0 0.1 0.0 0.0 0.1 0.8 —Russia . . . . . . . . . . . . . . . . . . . . . . . 0.0 0.0 0.0 0.0 0.0 0.0 0.3 —Central Asia . . . . . . . . . . . . . . . . . . 0.0 0.0 0.0 0.0 0.0 0.0 0.3 —Non-OECD Europe . . . . . . . . . . . . . 0.0 0.0 0.0 0.0 0.0 0.1 0.1 —
Non-OECD Asia. . . . . . . . . . . . . . . . 0.2 0.2 0.4 0.7 1.3 2.8 4.6 11.8China. . . . . . . . . . . . . . . . . . . . . . . . 0.2 0.2 0.3 0.3 0.6 1.6 2.9 10.0India . . . . . . . . . . . . . . . . . . . . . . . . 0.0 0.0 0.0 0.0 0.1 0.2 0.3 —LNG exporters. . . . . . . . . . . . . . . . . 0.0 0.0 0.0 0.0 0.0 0.1 0.2 —Developed Asia. . . . . . . . . . . . . . . . 0.0 0.0 0.0 0.0 0.0 0.0 0.0 —Other Southeast Asia . . . . . . . . . . . 0.0 0.0 0.0 0.0 0.0 0.1 0.2 —Northwest Asia . . . . . . . . . . . . . . . . 0.0 0.0 0.1 0.4 0.6 0.8 1.0 —
Middle East . . . . . . . . . . . . . . . . . . . 0.0 0.0 0.0 0.0 0.0 0.0 0.1 —Arabian producers. . . . . . . . . . . . . . 0.0 0.0 0.0 0.0 0.0 0.0 0.1 —Iran . . . . . . . . . . . . . . . . . . . . . . . . . 0.0 0.0 0.0 0.0 0.0 0.0 0.0 —Iraq . . . . . . . . . . . . . . . . . . . . . . . . . 0.0 0.0 0.0 0.0 0.0 0.0 0.0 —Qatar . . . . . . . . . . . . . . . . . . . . . . . . 0.0 0.0 0.0 0.0 0.0 0.0 0.0 —Saudi Arabia . . . . . . . . . . . . . . . . . . 0.0 0.0 0.0 0.0 0.0 0.0 0.0 —Other Middle East . . . . . . . . . . . . . . 0.0 0.0 0.0 0.0 0.0 0.0 0.0 —
Africa . . . . . . . . . . . . . . . . . . . . . . . . 0.0 0.0 0.0 0.0 0.0 0.0 0.1 —North Africa . . . . . . . . . . . . . . . . . . . 0.0 0.0 0.0 0.0 0.0 0.0 0.0 —West Africa . . . . . . . . . . . . . . . . . . . 0.0 0.0 0.0 0.0 0.0 0.0 0.1 —South Africa . . . . . . . . . . . . . . . . . . 0.0 0.0 0.0 0.0 0.0 0.0 0.0 —Other Africa. . . . . . . . . . . . . . . . . . . 0.0 0.0 0.0 0.0 0.0 0.0 0.0 —
Central and South America . . . . . . 0.0 0.0 0.0 0.0 0.0 0.5 1.6 —Brazil . . . . . . . . . . . . . . . . . . . . . . . . 0.0 0.0 0.0 0.0 0.0 0.2 0.7 —Northern producers . . . . . . . . . . . . . 0.0 0.0 0.0 0.0 0.0 0.0 0.2 —Other South America . . . . . . . . . . . 0.0 0.0 0.0 0.0 0.0 0.3 0.6 —Central America and Caribbean . . . 0.0 0.0 0.0 0.0 0.0 0.0 0.0 —Total Non-OECD . . . . . . . . . . . . . 0.2 0.2 0.5 0.8 1.4 3.4 7.2 13.6
Total World . . . . . . . . . . . . . . . . . . . . 5.3 5.9 8.7 10.0 11.9 15.8 22.0 5.2aIncludes the 50 States and the District of Columbia. U.S. tight gas is reported in the “other natural gas” table that follows.Sources: History: United States: U.S. Energy Information Administration (EIA), Natural Gas Navigator, “Unconventional Dry
Natural Gas Production” (as of November 2009), web site www.eia.gov/dnav/ng/ng_prod_top.asp. Other countries: EIA, Office ofIntegrated Analysis and Forecasting, internal estimates. Projections: EIA, Annual Energy Outlook 2010, DOE/EIA-0383(2010)(Washington, DC, April 2010), AEO2010 National Energy Modeling System, run HP2010.D011910A, web site www.eia.gov/oiaf/aeo; and International Natural Gas Model (2010).

Table I15. World other natural gas production by region, High Oil Price case, 2007-2035(Trillion cubic feet)
Natural gas production projections
U.S. Energy Information Administration / International Energy Outlook 2010 307
Region/Country
History Projections Average annualpercent change,
2007-20352007 2008 2015 2020 2025 2030 2035OECDOECD North America . . . . . . . . . . . 22.4 22.6 18.8 19.5 20.8 21.4 21.5 -0.1United Statesa. . . . . . . . . . . . . . . . . 16.2 16.8 13.3 14.4 15.9 16.9 17.3 0.2Canada . . . . . . . . . . . . . . . . . . . . . . 4.4 3.9 3.4 3.2 3.0 2.8 2.7 -1.7Mexico. . . . . . . . . . . . . . . . . . . . . . . 1.8 1.8 2.1 2.0 1.8 1.7 1.5 -0.7
OECD Europe . . . . . . . . . . . . . . . . . 10.2 10.7 9.5 8.9 8.3 7.7 7.1 -1.3North Europe. . . . . . . . . . . . . . . . . . 9.8 10.3 9.1 8.5 7.9 7.3 6.7 -1.4South Europe . . . . . . . . . . . . . . . . . 0.3 0.3 0.4 0.4 0.4 0.4 0.4 0.4Southwest Europe. . . . . . . . . . . . . . 0.0 0.0 0.0 0.0 0.0 0.0 0.0 —Turkey . . . . . . . . . . . . . . . . . . . . . . . 0.0 0.0 0.0 0.0 0.0 0.0 0.0 —
OECD Asia . . . . . . . . . . . . . . . . . . . . 1.8 1.8 3.7 3.8 3.8 3.7 3.5 2.4Japan . . . . . . . . . . . . . . . . . . . . . . . 0.2 0.2 0.1 0.1 0.1 0.1 0.1 -2.5South Korea . . . . . . . . . . . . . . . . . . 0.0 0.0 0.0 0.0 0.0 0.0 0.0 2.2Australia/New Zealand . . . . . . . . . . 1.6 1.6 3.5 3.7 3.7 3.6 3.4 2.7Total OECD . . . . . . . . . . . . . . . . . 34.4 35.1 32.0 32.3 32.9 32.8 32.2 -0.2
Non-OECDNon-OECD Europe and Eurasia. . . 30.4 31.2 32.1 33.9 35.4 36.2 36.1 0.6Russia . . . . . . . . . . . . . . . . . . . . . . . 23.1 23.4 23.0 24.4 25.9 26.9 27.2 0.6Central Asia . . . . . . . . . . . . . . . . . . 6.1 6.6 7.8 8.1 8.2 8.0 7.7 0.8Non-OECD Europe . . . . . . . . . . . . . 1.2 1.2 1.4 1.4 1.3 1.3 1.2 -0.1
Non-OECD Asia. . . . . . . . . . . . . . . . 11.8 12.4 15.5 16.6 17.0 16.7 16.2 1.1China. . . . . . . . . . . . . . . . . . . . . . . . 2.2 2.5 2.6 2.7 2.7 2.6 2.5 0.3India . . . . . . . . . . . . . . . . . . . . . . . . 1.1 1.1 2.6 3.0 3.1 3.1 3.0 3.6LNG exporters. . . . . . . . . . . . . . . . . 4.9 5.0 6.6 7.3 7.6 7.6 7.4 1.5Developed Asia. . . . . . . . . . . . . . . . 0.0 0.0 0.0 0.0 0.0 0.0 0.0 —Other Southeast Asia . . . . . . . . . . . 2.3 2.4 2.3 2.3 2.4 2.3 2.3 0.0Northwest Asia . . . . . . . . . . . . . . . . 1.3 1.3 1.3 1.3 1.2 1.2 1.1 -0.6
Middle East . . . . . . . . . . . . . . . . . . . 12.6 13.5 20.9 24.9 27.3 28.9 30.9 3.3Arabian producers. . . . . . . . . . . . . . 3.5 3.5 4.0 4.5 4.4 4.3 4.0 0.5Iran . . . . . . . . . . . . . . . . . . . . . . . . . 4.0 4.1 6.5 8.2 9.4 9.8 10.7 3.6Iraq . . . . . . . . . . . . . . . . . . . . . . . . . 0.1 0.1 0.2 0.5 0.7 0.8 1.1 11.6Qatar . . . . . . . . . . . . . . . . . . . . . . . . 2.2 2.7 6.0 7.0 7.8 8.9 9.5 5.3Saudi Arabia . . . . . . . . . . . . . . . . . . 2.6 2.8 4.0 4.5 4.9 5.1 5.4 2.6Other Middle East . . . . . . . . . . . . . . 0.3 0.3 0.2 0.2 0.2 0.1 0.1 -2.9
Africa . . . . . . . . . . . . . . . . . . . . . . . . 6.8 7.2 11.7 13.6 14.4 14.5 14.1 2.6North Africa . . . . . . . . . . . . . . . . . . . 5.3 5.4 8.5 9.8 10.2 10.2 9.9 2.3West Africa . . . . . . . . . . . . . . . . . . . 1.3 1.5 3.0 3.6 3.9 4.0 4.0 4.0South Africa . . . . . . . . . . . . . . . . . . 0.1 0.1 0.1 0.1 0.1 0.1 0.1 -1.1Other Africa. . . . . . . . . . . . . . . . . . . 0.1 0.1 0.1 0.2 0.2 0.2 0.2 1.7
Central and South America . . . . . . 5.2 5.3 6.8 8.8 9.8 9.8 9.4 2.1Brazil . . . . . . . . . . . . . . . . . . . . . . . . 0.3 0.4 1.1 1.6 1.9 2.0 2.0 6.5Northern producers . . . . . . . . . . . . . 2.6 2.6 3.1 4.4 5.2 5.2 4.9 2.3Other South America . . . . . . . . . . . 2.2 2.2 2.4 2.6 2.6 2.5 2.3 0.2Central America and Caribbean . . . 0.0 0.0 0.1 0.1 0.1 0.1 0.1 5.9Total Non-OECD . . . . . . . . . . . . . 66.8 69.5 86.9 97.8 103.9 106.1 106.6 1.7
Total World . . . . . . . . . . . . . . . . . . . . 101.3 104.6 118.9 130.1 136.8 138.8 138.8 1.1aIncludes the 50 States and the District of Columbia. Production includes supplemental production, less any forecast discrepancy.Sources: History: U.S. Energy Information Administration (EIA), International Energy Statistics database (as of November 2009),
web site www.eia.gov/emeu/international. Projections: EIA, Annual Energy Outlook 2010, DOE/EIA-0383(2010) (Washington, DC,April 2010), AEO2010 National Energy Modeling System, run HP2010.D011910A, web site www.eia.gov/oiaf/aeo; and InternationalNatural Gas Model (2010).

Table I16. World net natural gas trade by region, High Oil Price case, 2007-2035(Trillion cubic feet)
Appendix I
308 U.S. Energy Information Administration / International Energy Outlook 2010
Region/Country
History Projections Average annualpercent change,
2007-20352007 2008 2015 2020 2025 2030 2035OECDOECD North America . . . . . . . . . . . 0.9 0.4 0.4 1.0 1.3 1.6 2.0 3.0United Statesa. . . . . . . . . . . . . . . . . 3.8 3.0 2.3 2.1 1.5 1.3 0.9 -4.8Canada . . . . . . . . . . . . . . . . . . . . . . -3.4 -3.1 -2.4 -2.3 -2.4 -2.6 -2.7 -0.9Mexico. . . . . . . . . . . . . . . . . . . . . . . 0.5 0.5 0.6 1.3 2.2 3.0 3.7 7.2
OECD Europe . . . . . . . . . . . . . . . . . 9.0 8.9 10.9 12.4 13.6 14.1 14.6 1.8North Europe. . . . . . . . . . . . . . . . . . 3.5 3.3 5.3 6.4 7.3 7.5 7.8 2.9South Europe . . . . . . . . . . . . . . . . . 2.8 2.8 2.9 3.1 3.2 3.3 3.4 0.7Southwest Europe. . . . . . . . . . . . . . 1.4 1.5 1.5 1.6 1.7 1.7 1.8 0.8Turkey . . . . . . . . . . . . . . . . . . . . . . . 1.3 1.3 1.2 1.3 1.4 1.5 1.5 0.7
OECD Asia . . . . . . . . . . . . . . . . . . . . 4.4 4.2 3.2 3.6 3.9 3.9 3.5 -0.8Japan . . . . . . . . . . . . . . . . . . . . . . . 3.5 3.4 3.7 4.1 4.3 4.3 4.3 0.7South Korea . . . . . . . . . . . . . . . . . . 1.2 1.2 1.5 1.6 1.7 1.7 1.7 1.3Australia/New Zealand . . . . . . . . . . -0.4 -0.4 -2.0 -2.1 -2.1 -2.1 -2.5 6.8
Total OECD . . . . . . . . . . . . . . . . . 14.2 13.4 14.4 17.0 18.8 19.6 20.1 1.2
Non-OECDNon-OECD Europe and Eurasia. . . -4.5 -5.0 -5.3 -6.7 -7.7 -8.6 -9.0 2.5Russia . . . . . . . . . . . . . . . . . . . . . . . -6.3 -6.6 -6.3 -7.6 -8.9 -9.8 -10.2 1.7Central Asia . . . . . . . . . . . . . . . . . . -2.0 -2.3 -3.1 -3.3 -3.2 -3.1 -3.1 1.7Non-OECD Europe . . . . . . . . . . . . . 3.7 3.8 4.1 4.2 4.4 4.4 4.4 0.6
Non-OECD Asia. . . . . . . . . . . . . . . . -1.5 -1.3 1.1 3.5 5.5 6.6 7.2 —China. . . . . . . . . . . . . . . . . . . . . . . . 0.0 0.0 2.1 3.4 4.5 4.8 4.6 18.1India . . . . . . . . . . . . . . . . . . . . . . . . 0.4 0.4 0.5 1.0 1.2 1.2 1.2 4.5LNG exporters. . . . . . . . . . . . . . . . . -2.6 -2.6 -3.0 -3.0 -2.9 -2.5 -2.0 -1.0Developed Asia. . . . . . . . . . . . . . . . 0.8 0.8 1.0 1.2 1.4 1.5 1.5 2.5Other Southeast Asia . . . . . . . . . . . 0.0 0.0 0.5 0.9 1.3 1.5 1.7 23.3Northwest Asia . . . . . . . . . . . . . . . . 0.0 0.0 0.0 0.0 0.0 0.1 0.2 —
Middle East . . . . . . . . . . . . . . . . . . . -1.9 -1.9 -4.5 -6.1 -7.4 -8.2 -8.9 5.6Arabian producers. . . . . . . . . . . . . . -0.5 0.0 -0.6 -0.5 -0.1 0.3 0.8 —Iran . . . . . . . . . . . . . . . . . . . . . . . . . 0.0 0.1 -0.4 -1.3 -2.3 -2.9 -3.3 —Iraq . . . . . . . . . . . . . . . . . . . . . . . . . 0.0 0.0 0.0 -0.3 -0.5 -0.5 -0.8 —Qatar . . . . . . . . . . . . . . . . . . . . . . . . -1.5 -2.0 -3.9 -4.4 -5.1 -5.8 -6.4 5.2Saudi Arabia . . . . . . . . . . . . . . . . . . 0.0 0.0 0.0 0.0 0.0 0.0 0.0 —Other Middle East . . . . . . . . . . . . . . 0.1 0.1 0.3 0.5 0.6 0.7 0.7 8.0
Africa . . . . . . . . . . . . . . . . . . . . . . . . -3.8 -3.9 -6.9 -8.0 -8.0 -7.9 -7.4 2.4North Africa . . . . . . . . . . . . . . . . . . . -2.9 -3.0 -5.5 -6.5 -6.6 -6.5 -6.0 2.6West Africa . . . . . . . . . . . . . . . . . . . -0.8 -0.9 -1.5 -2.1 -2.2 -2.3 -2.2 3.6South Africa . . . . . . . . . . . . . . . . . . 0.1 0.1 0.1 0.7 0.8 0.8 0.9 8.1Other Africa. . . . . . . . . . . . . . . . . . . -0.1 -0.1 0.0 -0.1 -0.1 -0.1 -0.1 —
Central and South America . . . . . . -0.6 -0.5 -1.2 -1.8 -2.3 -2.0 -1.8 4.0Brazil . . . . . . . . . . . . . . . . . . . . . . . . 0.4 0.4 -0.1 -0.1 -0.1 0.0 -0.2 —Northern producers . . . . . . . . . . . . . -0.7 -0.6 -1.0 -1.8 -2.4 -2.3 -2.0 3.9Other South America . . . . . . . . . . . -0.4 -0.4 -0.1 0.2 0.2 0.2 0.3 —Central America and Caribbean . . . 0.0 0.0 0.0 0.0 0.0 0.0 0.0 —Total Non-OECD . . . . . . . . . . . . . -12.3 -12.7 -16.9 -19.0 -19.9 -20.2 -19.9 1.7
Total World . . . . . . . . . . . . . . . . . . . . 1.9 0.8 -2.5 -2.0 -1.2 -0.6 0.2 —
Sources: History: U.S. Energy Information Administration (EIA), International Energy Statistics database (as of November 2009),web site www.eia.gov/emeu/international. Projections: EIA, Annual Energy Outlook 2010, DOE/EIA-0383(2010) (Washington, DC,April 2010), AEO2010 National Energy Modeling System, run HP2010.D011910A, web site www.eia.gov/oiaf/aeo; and InternationalNatural Gas Model (2010).

Table I17. World total natural gas production by region, Low Oil Price case, 2007-2035(Trillion cubic feet)
Natural gas production projections
U.S. Energy Information Administration / International Energy Outlook 2010 309
Region/Country
History Projections Average annualpercent change,
2007-20352007 2008 2015 2020 2025 2030 2035OECDOECD North America . . . . . . . . . . . 27.4 28.2 27.5 28.0 28.6 30.8 32.5 0.6United Statesa. . . . . . . . . . . . . . . . . 19.2 20.3 19.9 20.6 21.0 22.8 24.0 0.8Canada . . . . . . . . . . . . . . . . . . . . . . 6.3 6.0 5.4 5.3 5.5 5.9 6.4 0.0Mexico. . . . . . . . . . . . . . . . . . . . . . . 1.8 1.8 2.1 2.1 2.1 2.1 2.1 0.4
OECD Europe . . . . . . . . . . . . . . . . . 10.2 10.7 9.7 9.1 8.7 8.3 7.9 -0.9North Europe. . . . . . . . . . . . . . . . . . 9.8 10.3 9.2 8.6 8.2 7.8 7.4 -1.0South Europe . . . . . . . . . . . . . . . . . 0.3 0.3 0.4 0.4 0.4 0.5 0.4 1.0Southwest Europe. . . . . . . . . . . . . . 0.0 0.0 0.0 0.0 0.0 0.0 0.0 —Turkey . . . . . . . . . . . . . . . . . . . . . . . 0.0 0.0 0.0 0.0 0.0 0.0 0.0 —
OECD Asia . . . . . . . . . . . . . . . . . . . . 1.9 2.0 3.6 3.8 4.0 4.1 4.3 2.9Japan . . . . . . . . . . . . . . . . . . . . . . . 0.2 0.2 0.1 0.1 0.1 0.1 0.1 -2.4South Korea . . . . . . . . . . . . . . . . . . 0.0 0.0 0.0 0.0 0.0 0.0 0.0 2.2Australia/New Zealand . . . . . . . . . . 1.7 1.7 3.4 3.7 3.8 4.0 4.2 3.2Total OECD . . . . . . . . . . . . . . . . . 39.5 40.8 40.7 40.9 41.3 43.2 44.7 0.4
Non-OECDNon-OECD Europe and Eurasia. . . 30.4 31.2 32.1 33.7 34.5 35.3 35.6 0.6Russia . . . . . . . . . . . . . . . . . . . . . . . 23.1 23.4 22.9 24.1 24.9 25.9 26.5 0.5Central Asia . . . . . . . . . . . . . . . . . . 6.1 6.6 7.8 8.2 8.2 8.0 7.7 0.9Non-OECD Europe . . . . . . . . . . . . . 1.2 1.2 1.4 1.4 1.4 1.4 1.3 0.3
Non-OECD Asia. . . . . . . . . . . . . . . . 12.0 12.6 15.5 16.9 18.2 19.2 20.1 1.9China. . . . . . . . . . . . . . . . . . . . . . . . 2.4 2.7 2.9 3.0 3.4 4.1 5.0 2.6India . . . . . . . . . . . . . . . . . . . . . . . . 1.1 1.1 2.7 3.0 3.2 3.2 3.2 3.9LNG exporters. . . . . . . . . . . . . . . . . 4.9 5.0 6.3 7.0 7.4 7.4 7.4 1.5Developed Asia. . . . . . . . . . . . . . . . 0.0 0.0 0.0 0.0 0.0 0.0 0.0 —Other Southeast Asia . . . . . . . . . . . 2.3 2.4 2.3 2.3 2.4 2.4 2.5 0.3Northwest Asia . . . . . . . . . . . . . . . . 1.3 1.3 1.4 1.6 1.8 2.0 2.1 1.6
Middle East . . . . . . . . . . . . . . . . . . . 12.6 13.5 20.4 24.5 26.1 27.4 29.5 3.1Arabian producers. . . . . . . . . . . . . . 3.5 3.5 3.4 3.9 4.0 4.0 3.9 0.4Iran . . . . . . . . . . . . . . . . . . . . . . . . . 4.0 4.1 5.6 6.7 7.7 8.7 10.1 3.4Iraq . . . . . . . . . . . . . . . . . . . . . . . . . 0.1 0.1 0.2 0.5 0.7 0.8 1.1 11.6Qatar . . . . . . . . . . . . . . . . . . . . . . . . 2.2 2.7 6.6 8.5 8.7 9.2 9.4 5.3Saudi Arabia . . . . . . . . . . . . . . . . . . 2.6 2.8 4.4 4.7 4.9 4.6 4.8 2.2Other Middle East . . . . . . . . . . . . . . 0.3 0.3 0.2 0.2 0.2 0.1 0.1 -2.8
Africa . . . . . . . . . . . . . . . . . . . . . . . . 6.8 7.2 10.3 11.6 12.5 12.8 13.1 2.4North Africa . . . . . . . . . . . . . . . . . . . 5.3 5.4 7.6 8.3 8.8 8.8 9.1 2.0West Africa . . . . . . . . . . . . . . . . . . . 1.3 1.5 2.5 3.0 3.5 3.7 3.8 3.8South Africa . . . . . . . . . . . . . . . . . . 0.1 0.1 0.1 0.1 0.1 0.1 0.1 -0.7Other Africa. . . . . . . . . . . . . . . . . . . 0.1 0.1 0.1 0.1 0.1 0.1 0.1 0.1
Central and South America . . . . . . 5.2 5.3 6.9 9.0 9.2 9.7 10.2 2.4Brazil . . . . . . . . . . . . . . . . . . . . . . . . 0.3 0.4 1.1 1.6 1.9 2.2 2.6 7.4Northern producers . . . . . . . . . . . . . 2.6 2.6 3.4 4.7 4.6 4.6 4.6 2.1Other South America . . . . . . . . . . . 2.2 2.2 2.3 2.6 2.6 2.8 2.9 1.0Central America and Caribbean . . . 0.0 0.0 0.1 0.1 0.1 0.1 0.1 6.3Total Non-OECD . . . . . . . . . . . . . 67.0 69.7 85.2 95.7 100.4 104.4 108.5 1.7
Total World . . . . . . . . . . . . . . . . . . . . 106.6 110.5 126.0 136.6 141.7 147.6 153.3 1.3Discrepancyb. . . . . . . . . . . . . . . . . . . 1.9 0.7 -1.0 0.0 2.3 1.5 1.2aIncludes the 50 States and the District of Columbia. Production includes supplemental production, less any forecast discrepancy.bBalancing item. Differences between global production and consumption totals result from rounding and different conversion
factors derived from heat contents of regionally consumed and produced natural gas.Sources: History: U.S. Energy Information Administration (EIA), International Energy Statistics database (as of November 2009),
web site www.eia.gov/emeu/international. Projections: EIA, Annual Energy Outlook 2010, DOE/EIA-0383(2010) (Washington, DC,April 2010), AEO2010 National Energy Modeling System, run LP2010.D011910A, web site www.eia.gov/oiaf/aeo; and InternationalNatural Gas Model (2010).

Table I18. World tight gas, shale gas, and coalbed methane production by region, Low Oil Price case,2007-2035(Trillion cubic feet)
Appendix I
310 U.S. Energy Information Administration / International Energy Outlook 2010
Region/Country
History Projections Average annualpercent change,
2007-20352007 2008 2015 2020 2025 2030 2035OECDOECD North America . . . . . . . . . . . 5.0 5.6 8.2 9.3 10.6 11.9 13.4 3.6
United Statesa. . . . . . . . . . . . . . . . . 3.1 3.5 6.0 6.9 7.6 8.2 8.9 3.9Canada . . . . . . . . . . . . . . . . . . . . . . 2.0 2.1 2.2 2.3 2.7 3.3 3.9 2.5Mexico. . . . . . . . . . . . . . . . . . . . . . . 0.0 0.0 0.0 0.1 0.3 0.4 0.6 —
OECD Europe . . . . . . . . . . . . . . . . . 0.0 0.0 0.1 0.2 0.4 0.6 0.8 —North Europe. . . . . . . . . . . . . . . . . . 0.0 0.0 0.1 0.1 0.4 0.5 0.7 —South Europe . . . . . . . . . . . . . . . . . 0.0 0.0 0.0 0.0 0.0 0.0 0.1 —Southwest Europe. . . . . . . . . . . . . . 0.0 0.0 0.0 0.0 0.0 0.0 0.0 —Turkey . . . . . . . . . . . . . . . . . . . . . . . 0.0 0.0 0.0 0.0 0.0 0.0 0.0 —
OECD Asia . . . . . . . . . . . . . . . . . . . . 0.1 0.1 0.1 0.2 0.3 0.5 0.8 8.3Japan . . . . . . . . . . . . . . . . . . . . . . . 0.0 0.0 0.0 0.0 0.0 0.0 0.0 —South Korea . . . . . . . . . . . . . . . . . . 0.0 0.0 0.0 0.0 0.0 0.0 0.0 —Australia/New Zealand . . . . . . . . . . 0.1 0.1 0.1 0.2 0.3 0.5 0.8 8.3Total OECD . . . . . . . . . . . . . . . . . 5.1 5.7 8.5 9.6 11.3 13.0 15.0 3.9
Non-OECDNon-OECD Europe and Eurasia. . . 0.0 0.0 0.1 0.1 0.1 0.1 0.3 —Russia . . . . . . . . . . . . . . . . . . . . . . . 0.0 0.0 0.0 0.0 0.0 0.0 0.1 —Central Asia . . . . . . . . . . . . . . . . . . 0.0 0.0 0.0 0.0 0.0 0.0 0.0 —Non-OECD Europe . . . . . . . . . . . . . 0.0 0.0 0.0 0.0 0.1 0.1 0.1 —
Non-OECD Asia. . . . . . . . . . . . . . . . 0.2 0.2 0.4 0.7 1.4 2.6 4.0 11.3China. . . . . . . . . . . . . . . . . . . . . . . . 0.2 0.2 0.4 0.4 0.7 1.6 2.6 9.5India . . . . . . . . . . . . . . . . . . . . . . . . 0.0 0.0 0.0 0.0 0.1 0.2 0.3 —LNG exporters. . . . . . . . . . . . . . . . . 0.0 0.0 0.0 0.0 0.0 0.0 0.1 —Developed Asia. . . . . . . . . . . . . . . . 0.0 0.0 0.0 0.0 0.0 0.0 0.0 —Other Southeast Asia . . . . . . . . . . . 0.0 0.0 0.0 0.0 0.0 0.1 0.2 —Northwest Asia . . . . . . . . . . . . . . . . 0.0 0.0 0.1 0.3 0.6 0.8 0.9 —
Middle East . . . . . . . . . . . . . . . . . . . 0.0 0.0 0.0 0.0 0.0 0.0 0.0 —Arabian producers. . . . . . . . . . . . . . 0.0 0.0 0.0 0.0 0.0 0.0 0.0 —Iran . . . . . . . . . . . . . . . . . . . . . . . . . 0.0 0.0 0.0 0.0 0.0 0.0 0.0 —Iraq . . . . . . . . . . . . . . . . . . . . . . . . . 0.0 0.0 0.0 0.0 0.0 0.0 0.0 —Qatar . . . . . . . . . . . . . . . . . . . . . . . . 0.0 0.0 0.0 0.0 0.0 0.0 0.0 —Saudi Arabia . . . . . . . . . . . . . . . . . . 0.0 0.0 0.0 0.0 0.0 0.0 0.0 —Other Middle East . . . . . . . . . . . . . . 0.0 0.0 0.0 0.0 0.0 0.0 0.0 —
Africa . . . . . . . . . . . . . . . . . . . . . . . . 0.0 0.0 0.0 0.0 0.0 0.0 0.0 —North Africa . . . . . . . . . . . . . . . . . . . 0.0 0.0 0.0 0.0 0.0 0.0 0.0 —West Africa . . . . . . . . . . . . . . . . . . . 0.0 0.0 0.0 0.0 0.0 0.0 0.0 —South Africa . . . . . . . . . . . . . . . . . . 0.0 0.0 0.0 0.0 0.0 0.0 0.0 —Other Africa. . . . . . . . . . . . . . . . . . . 0.0 0.0 0.0 0.0 0.0 0.0 0.0 —
Central and South America . . . . . . 0.0 0.0 0.0 0.0 0.1 0.6 1.2 —Brazil . . . . . . . . . . . . . . . . . . . . . . . . 0.0 0.0 0.0 0.0 0.0 0.2 0.6 —Northern producers . . . . . . . . . . . . . 0.0 0.0 0.0 0.0 0.0 0.0 0.0 —Other South America . . . . . . . . . . . 0.0 0.0 0.0 0.0 0.1 0.3 0.6 —Central America and Caribbean . . . 0.0 0.0 0.0 0.0 0.0 0.0 0.0 —Total Non-OECD . . . . . . . . . . . . . 0.2 0.2 0.5 0.8 1.7 3.3 5.5 12.6
Total World . . . . . . . . . . . . . . . . . . . . 5.3 5.9 9.0 10.4 13.0 16.3 20.5 4.9aIncludes the 50 States and the District of Columbia. U.S. tight gas is reported in the “other natural gas” table that follows.Sources: History: United States: U.S. Energy Information Administration (EIA), Natural Gas Navigator, “Unconventional Dry
Natural Gas Production” (as of November 2009), web site www.eia.gov/dnav/ng/ng_prod_top.asp. Other countries: EIA, Office ofIntegrated Analysis and Forecasting, internal estimates. Projections: EIA, Annual Energy Outlook 2010, DOE/EIA-0383(2010)(Washington, DC, April 2010), AEO2010 National Energy Modeling System, run LP2010.D011910A, web site www.eia.gov/oiaf/aeo; and International Natural Gas Model (2010).

Table I19. World other natural gas production by region, Low Oil Price case, 2007-2035(Trillion cubic feet)
Natural gas production projections
U.S. Energy Information Administration / International Energy Outlook 2010 311
Region/Country
History Projections Average annualpercent change,
2007-20352007 2008 2015 2020 2025 2030 2035OECDOECD North America . . . . . . . . . . . 22.4 22.6 19.2 18.6 18.0 18.9 19.1 -0.6United Statesa. . . . . . . . . . . . . . . . . 16.2 16.8 13.9 13.7 13.4 14.6 15.2 -0.2Canada . . . . . . . . . . . . . . . . . . . . . . 4.4 3.9 3.2 3.0 2.8 2.6 2.4 -2.1Mexico. . . . . . . . . . . . . . . . . . . . . . . 1.8 1.8 2.1 2.0 1.8 1.7 1.5 -0.7
OECD Europe . . . . . . . . . . . . . . . . . 10.2 10.7 9.5 8.9 8.3 7.7 7.1 -1.3North Europe. . . . . . . . . . . . . . . . . . 9.8 10.3 9.1 8.5 7.9 7.3 6.7 -1.4South Europe . . . . . . . . . . . . . . . . . 0.3 0.3 0.4 0.4 0.4 0.4 0.4 0.4Southwest Europe. . . . . . . . . . . . . . 0.0 0.0 0.0 0.0 0.0 0.0 0.0 —Turkey . . . . . . . . . . . . . . . . . . . . . . . 0.0 0.0 0.0 0.0 0.0 0.0 0.0 —
OECD Asia . . . . . . . . . . . . . . . . . . . . 1.8 1.8 3.4 3.7 3.7 3.7 3.5 2.3Japan . . . . . . . . . . . . . . . . . . . . . . . 0.2 0.2 0.1 0.1 0.1 0.1 0.1 -2.5South Korea . . . . . . . . . . . . . . . . . . 0.0 0.0 0.0 0.0 0.0 0.0 0.0 2.2Australia/New Zealand . . . . . . . . . . 1.6 1.6 3.3 3.5 3.6 3.5 3.4 2.6Total OECD . . . . . . . . . . . . . . . . . 34.4 35.1 32.2 31.2 30.0 30.2 29.8 -0.5
Non-OECDNon-OECD Europe and Eurasia. . . 30.4 31.2 32.0 33.6 34.4 35.2 35.4 0.5Russia . . . . . . . . . . . . . . . . . . . . . . . 23.1 23.4 22.9 24.1 24.8 25.9 26.4 0.5Central Asia . . . . . . . . . . . . . . . . . . 6.1 6.6 7.8 8.1 8.2 8.0 7.7 0.8Non-OECD Europe . . . . . . . . . . . . . 1.2 1.2 1.4 1.4 1.3 1.3 1.2 -0.1
Non-OECD Asia. . . . . . . . . . . . . . . . 11.8 12.4 15.1 16.3 16.7 16.6 16.1 1.1China. . . . . . . . . . . . . . . . . . . . . . . . 2.2 2.5 2.6 2.7 2.7 2.6 2.5 0.3India . . . . . . . . . . . . . . . . . . . . . . . . 1.1 1.1 2.6 3.0 3.1 3.1 3.0 3.6LNG exporters. . . . . . . . . . . . . . . . . 4.9 5.0 6.3 7.0 7.4 7.4 7.3 1.5Developed Asia. . . . . . . . . . . . . . . . 0.0 0.0 0.0 0.0 0.0 0.0 0.0 —Other Southeast Asia . . . . . . . . . . . 2.3 2.4 2.3 2.3 2.3 2.3 2.3 0.0Northwest Asia . . . . . . . . . . . . . . . . 1.3 1.3 1.3 1.3 1.2 1.2 1.1 -0.6
Middle East . . . . . . . . . . . . . . . . . . . 12.6 13.5 20.4 24.5 26.1 27.3 29.4 3.1Arabian producers. . . . . . . . . . . . . . 3.5 3.5 3.4 3.9 4.0 4.0 3.9 0.4Iran . . . . . . . . . . . . . . . . . . . . . . . . . 4.0 4.1 5.6 6.7 7.7 8.7 10.1 3.4Iraq . . . . . . . . . . . . . . . . . . . . . . . . . 0.1 0.1 0.2 0.5 0.7 0.7 1.1 11.6Qatar . . . . . . . . . . . . . . . . . . . . . . . . 2.2 2.7 6.6 8.5 8.7 9.2 9.4 5.3Saudi Arabia . . . . . . . . . . . . . . . . . . 2.6 2.8 4.4 4.7 4.9 4.6 4.8 2.2Other Middle East . . . . . . . . . . . . . . 0.3 0.3 0.2 0.2 0.2 0.1 0.1 -2.9
Africa . . . . . . . . . . . . . . . . . . . . . . . . 6.8 7.2 10.3 11.6 12.5 12.7 13.1 2.4North Africa . . . . . . . . . . . . . . . . . . . 5.3 5.4 7.6 8.3 8.8 8.8 9.1 2.0West Africa . . . . . . . . . . . . . . . . . . . 1.3 1.5 2.5 3.0 3.5 3.7 3.8 3.8South Africa . . . . . . . . . . . . . . . . . . 0.1 0.1 0.1 0.1 0.1 0.1 0.1 -1.1Other Africa. . . . . . . . . . . . . . . . . . . 0.1 0.1 0.1 0.1 0.1 0.1 0.1 0.1
Central and South America . . . . . . 5.2 5.3 6.9 8.9 9.0 9.1 9.0 2.0Brazil . . . . . . . . . . . . . . . . . . . . . . . . 0.3 0.4 1.1 1.6 1.8 2.0 2.0 6.5Northern producers . . . . . . . . . . . . . 2.6 2.6 3.4 4.7 4.6 4.6 4.5 2.0Other South America . . . . . . . . . . . 2.2 2.2 2.3 2.6 2.5 2.5 2.3 0.1Central America and Caribbean . . . 0.0 0.0 0.1 0.1 0.1 0.1 0.1 5.9Total Non-OECD . . . . . . . . . . . . . 66.8 69.5 84.7 94.9 98.7 101.1 103.0 1.6
Total World . . . . . . . . . . . . . . . . . . . . 101.3 104.6 116.9 126.1 128.7 131.3 132.8 1.0aIncludes the 50 States and the District of Columbia. Production includes supplemental production, less any forecast discrepancy.Sources: History: U.S. Energy Information Administration (EIA), International Energy Statistics database (as of November 2009),
web site www.eia.gov/emeu/international. Projections: EIA, Annual Energy Outlook 2010, DOE/EIA-0383(2010) (Washington, DC,April 2010), AEO2010 National Energy Modeling System, run LP2010.D011910A, web site www.eia.gov/oiaf/aeo; and InternationalNatural Gas Model (2010).

Table I20. World net natural gas trade by region, Low Oil Price case, 2007-2035(Trillion cubic feet)
Appendix I
312 U.S. Energy Information Administration / International Energy Outlook 2010
Region/Country
History Projections Average annualpercent change,
2007-20352007 2008 2015 2020 2025 2030 2035OECDOECD North America . . . . . . . . . . . 0.9 0.4 0.9 1.7 2.4 2.3 2.4 3.7United Statesa. . . . . . . . . . . . . . . . . 3.8 3.0 2.6 2.7 2.6 2.0 1.4 -3.4Canada . . . . . . . . . . . . . . . . . . . . . . -3.4 -3.1 -2.3 -2.0 -1.9 -2.1 -2.2 -1.5Mexico. . . . . . . . . . . . . . . . . . . . . . . 0.5 0.5 0.6 1.0 1.7 2.4 3.2 6.7
OECD Europe . . . . . . . . . . . . . . . . . 9.0 8.9 10.2 11.7 12.4 12.9 13.5 1.5North Europe. . . . . . . . . . . . . . . . . . 3.5 3.3 4.7 5.8 6.4 6.7 7.1 2.6South Europe . . . . . . . . . . . . . . . . . 2.8 2.8 2.8 3.0 3.1 3.2 3.2 0.5Southwest Europe. . . . . . . . . . . . . . 1.4 1.5 1.5 1.5 1.6 1.6 1.6 0.5Turkey . . . . . . . . . . . . . . . . . . . . . . . 1.3 1.3 1.2 1.3 1.4 1.4 1.5 0.6
OECD Asia . . . . . . . . . . . . . . . . . . . . 4.4 4.2 3.4 3.5 3.7 3.7 3.6 -0.7Japan . . . . . . . . . . . . . . . . . . . . . . . 3.5 3.4 3.6 3.7 3.9 3.9 3.8 0.3South Korea . . . . . . . . . . . . . . . . . . 1.2 1.2 1.5 1.6 1.7 1.8 1.8 1.4Australia/New Zealand . . . . . . . . . . -0.4 -0.4 -1.7 -1.9 -2.0 -2.0 -2.1 6.1
Total OECD . . . . . . . . . . . . . . . . . 14.2 13.4 14.5 16.8 18.5 18.9 19.5 1.1
Non-OECDNon-OECD Europe and Eurasia. . . -4.5 -5.0 -5.4 -6.4 -6.8 -7.4 -7.5 1.8Russia . . . . . . . . . . . . . . . . . . . . . . . -6.3 -6.6 -6.2 -7.2 -7.8 -8.6 -9.0 1.3Central Asia . . . . . . . . . . . . . . . . . . -2.0 -2.3 -3.1 -3.3 -3.2 -3.1 -2.9 1.4Non-OECD Europe . . . . . . . . . . . . . 3.7 3.8 3.9 4.1 4.2 4.3 4.3 0.5
Non-OECD Asia. . . . . . . . . . . . . . . . -1.5 -1.3 0.9 3.0 4.5 5.5 6.3 —China. . . . . . . . . . . . . . . . . . . . . . . . 0.0 0.0 1.8 3.0 3.8 4.2 4.1 17.7India . . . . . . . . . . . . . . . . . . . . . . . . 0.4 0.4 0.4 0.9 1.1 1.2 1.2 4.6LNG exporters. . . . . . . . . . . . . . . . . -2.6 -2.6 -2.8 -3.0 -3.0 -2.8 -2.4 -0.4Developed Asia. . . . . . . . . . . . . . . . 0.8 0.8 1.0 1.2 1.3 1.5 1.6 2.6Other Southeast Asia . . . . . . . . . . . 0.0 0.0 0.4 0.9 1.2 1.4 1.6 23.1Northwest Asia . . . . . . . . . . . . . . . . 0.0 0.0 0.0 0.0 0.0 0.0 0.1 —
Middle East . . . . . . . . . . . . . . . . . . . -1.9 -1.9 -4.4 -6.1 -7.2 -8.3 -9.7 6.0Arabian producers. . . . . . . . . . . . . . -0.5 0.0 -0.1 0.1 0.1 0.1 0.3 —Iran . . . . . . . . . . . . . . . . . . . . . . . . . 0.0 0.1 -0.3 -0.6 -1.4 -2.2 -3.4 —Iraq . . . . . . . . . . . . . . . . . . . . . . . . . 0.0 0.0 0.0 -0.3 -0.5 -0.5 -0.8 —Qatar . . . . . . . . . . . . . . . . . . . . . . . . -1.5 -2.0 -4.4 -5.8 -6.0 -6.2 -6.4 5.2Saudi Arabia . . . . . . . . . . . . . . . . . . 0.0 0.0 0.0 0.0 0.0 0.0 0.0 —Other Middle East . . . . . . . . . . . . . . 0.1 0.1 0.4 0.4 0.5 0.6 0.6 7.4
Africa . . . . . . . . . . . . . . . . . . . . . . . . -3.8 -3.9 -5.4 -5.8 -6.0 -6.0 -6.2 1.8North Africa . . . . . . . . . . . . . . . . . . . -2.9 -3.0 -4.4 -4.8 -4.8 -4.7 -4.9 1.8West Africa . . . . . . . . . . . . . . . . . . . -0.8 -0.9 -1.2 -1.6 -1.9 -2.1 -2.1 3.4South Africa . . . . . . . . . . . . . . . . . . 0.1 0.1 0.1 0.6 0.7 0.7 0.7 7.3Other Africa. . . . . . . . . . . . . . . . . . . -0.1 -0.1 0.0 0.0 0.0 0.0 0.0 —
Central and South America . . . . . . -0.6 -0.5 -1.0 -1.6 -1.6 -1.5 -1.3 2.6Brazil . . . . . . . . . . . . . . . . . . . . . . . . 0.4 0.4 0.0 0.0 -0.1 -0.1 -0.2 —Northern producers . . . . . . . . . . . . . -0.7 -0.6 -1.0 -1.7 -1.7 -1.7 -1.4 2.8Other South America . . . . . . . . . . . -0.4 -0.4 0.0 0.2 0.3 0.3 0.4 —Central America and Caribbean . . . 0.0 0.0 0.0 0.0 0.0 0.0 0.0 —Total Non-OECD . . . . . . . . . . . . . -12.3 -12.7 -15.3 -16.9 -17.1 -17.8 -18.4 1.4
Total World . . . . . . . . . . . . . . . . . . . . 1.9 0.8 -0.9 0.0 1.4 1.0 1.1 —
Sources: History: U.S. Energy Information Administration (EIA), International Energy Statistics database (as of November 2009),web site www.eia.gov/emeu/international. Projections: EIA, Annual Energy Outlook 2010, DOE/EIA-0383(2010) (Washington, DC,April 2010), AEO2010 National Energy Modeling System, run LP2010.D011910A, web site www.eia.gov/oiaf/aeo; and InternationalNatural Gas Model (2010).

Appendix J
Kaya Identity Factor Projections:• Population• GDP per capita• Energy intensity• Carbon dioxide intensity

This page intentionally left blank.

Table J1. World population by region, Reference case, 2005-2035(Millions)
Kaya Identity factor projections
U.S. Energy Information Administration / International Energy Outlook 2010 315
Region/Country
History Projections Average annualpercent change,
2007-20352005 2006 2007 2015 2020 2025 2030 2035
OECDOECD North America . . . . . . . . . . . 432 436 441 477 500 523 546 569 0.9United Statesa. . . . . . . . . . . . . . . . . 297 300 302 327 343 359 375 391 0.9Canada . . . . . . . . . . . . . . . . . . . . . . 32 33 33 36 38 40 42 43 1.0Mexico. . . . . . . . . . . . . . . . . . . . . . . 103 104 105 114 120 125 130 135 0.9
OECD Europe . . . . . . . . . . . . . . . . . 535 538 541 558 565 571 575 577 0.2OECD Asia . . . . . . . . . . . . . . . . . . . . 200 200 201 203 202 201 199 196 -0.1Japan . . . . . . . . . . . . . . . . . . . . . . . 128 128 128 126 124 122 119 116 -0.3South Korea . . . . . . . . . . . . . . . . . . 48 48 48 49 49 49 49 48 0.0Australia/New Zealand . . . . . . . . . . 25 25 25 27 28 30 31 32 0.8Total OECD . . . . . . . . . . . . . . . . . 1,167 1,175 1,183 1,238 1,267 1,294 1,319 1,342 0.5
Non-OECDNon-OECD Europe and Eurasia. . . 341 341 340 338 336 333 329 324 -0.2Russia . . . . . . . . . . . . . . . . . . . . . . . 143 143 142 138 135 132 129 125 -0.4Other . . . . . . . . . . . . . . . . . . . . . . . . 198 198 198 200 200 201 200 198 0.0
Non-OECD Asia. . . . . . . . . . . . . . . . 3,446 3,486 3,525 3,841 4,021 4,175 4,299 4,398 0.8China. . . . . . . . . . . . . . . . . . . . . . . . 1,308 1,314 1,321 1,386 1,421 1,443 1,452 1,452 0.3India . . . . . . . . . . . . . . . . . . . . . . . . 1,131 1,148 1,165 1,294 1,367 1,431 1,485 1,528 1.0Other Non-OECD Asia . . . . . . . . . . 1,008 1,024 1,039 1,160 1,233 1,300 1,363 1,418 1.1
Middle East . . . . . . . . . . . . . . . . . . . 191 195 199 231 251 270 288 305 1.5Africa . . . . . . . . . . . . . . . . . . . . . . . . 902 919 939 1,098 1,197 1,297 1,395 1,494 1.7Central and South America . . . . . . 451 458 464 511 538 563 586 606 1.0Brazil . . . . . . . . . . . . . . . . . . . . . . . . 187 190 192 210 220 229 236 243 0.8Other Central and South America. . 265 268 272 301 318 334 349 363 1.0Total Non-OECD . . . . . . . . . . . . . 5,332 5,398 5,467 6,018 6,343 6,638 6,897 7,127 1.0
Total World . . . . . . . . . . . . . . . . . . . . 6,498 6,573 6,650 7,256 7,610 7,932 8,217 8,469 0.9aIncludes the 50 States and the District of Columbia.Notes: Totals may not equal sum of components due to independent rounding.Sources: United States: U.S. Energy Information Administration (EIA), Annual Energy Outlook 2010, DOE/EIA-0383(2010)
(Washington, DC, April 2010), AEO2010 National Energy Modeling System, run AEO2010R.D111809A, web site www.eia.gov/oiaf/aeo. Other Countries: IHS Global Insight, World Overview (Lexington, MA, various issues).

Table J2. World gross domestic product (GDP) per capita by region expressed in purchasing power parity,Reference case, 2005-2035(2005 dollars per person)
Appendix J
316 U.S. Energy Information Administration / International Energy Outlook 2010
Region/Country
History Projections Average annualpercent change,
2007-20352005 2006 2007 2015 2020 2025 2030 2035
OECDOECD North America . . . . . . . . . . . 34,472 35,145 35,554 37,910 42,032 46,007 50,260 54,766 1.6United Statesa. . . . . . . . . . . . . . . . . 41,866 42,621 43,076 45,981 50,873 55,354 59,987 64,700 1.5Canada . . . . . . . . . . . . . . . . . . . . . . 36,238 36,895 37,423 40,126 42,581 44,848 47,509 50,529 1.1Mexico. . . . . . . . . . . . . . . . . . . . . . . 12,577 13,069 13,351 14,183 16,598 19,545 23,064 27,289 2.6
OECD Europe . . . . . . . . . . . . . . . . . 26,030 26,779 27,427 29,050 31,923 34,812 37,882 41,234 1.5OECD Asia . . . . . . . . . . . . . . . . . . . . 27,697 28,365 29,140 32,225 35,078 37,667 40,484 43,460 1.4
Japan . . . . . . . . . . . . . . . . . . . . . . . 30,309 30,926 31,629 33,689 35,708 37,174 38,687 40,125 0.9South Korea . . . . . . . . . . . . . . . . . . 18,753 19,641 20,560 25,704 30,206 34,867 39,844 45,211 2.9Australia/New Zealand . . . . . . . . . . 31,447 31,973 32,873 37,224 40,824 44,391 48,491 53,044 1.7
Total OECD . . . . . . . . . . . . . . . . . 29,440 30,156 30,745 32,984 36,416 39,780 43,396 47,292 1.5
Non-OECDNon-OECD Europe and Eurasia. . . 8,722 9,441 10,227 12,418 14,719 17,202 19,943 22,978 2.9Russia . . . . . . . . . . . . . . . . . . . . . . . 11,893 12,867 13,967 17,022 20,317 24,193 28,600 33,671 3.2Other . . . . . . . . . . . . . . . . . . . . . . . . 6,432 6,979 7,552 9,237 10,933 12,595 14,364 16,220 2.8
Non-OECD Asia. . . . . . . . . . . . . . . . 3,452 3,733 4,063 6,263 7,917 9,655 11,482 13,419 4.4China. . . . . . . . . . . . . . . . . . . . . . . . 4,136 4,591 5,162 9,185 12,211 15,556 19,003 22,558 5.4India . . . . . . . . . . . . . . . . . . . . . . . . 2,158 2,331 2,506 3,745 4,639 5,473 6,418 7,497 4.0Other Non-OECD Asia . . . . . . . . . . 4,016 4,203 4,413 5,581 6,602 7,712 8,984 10,443 3.1
Middle East . . . . . . . . . . . . . . . . . . . 10,403 11,013 11,368 13,289 14,904 16,561 18,531 20,763 2.2Africa . . . . . . . . . . . . . . . . . . . . . . . . 2,617 2,715 2,811 3,316 3,679 4,026 4,373 4,748 1.9Central and South America . . . . . . 8,001 8,347 8,757 10,453 11,827 13,342 15,053 16,998 2.4Brazil . . . . . . . . . . . . . . . . . . . . . . . . 8,209 8,413 8,761 11,186 13,080 15,318 17,972 21,117 3.2Other Central and South America. . 7,854 8,300 8,755 9,942 10,961 11,990 13,077 14,242 1.8Total Non-OECD . . . . . . . . . . . . . 4,282 4,574 4,897 6,697 8,085 9,529 11,045 12,654 3.4
Total World . . . . . . . . . . . . . . . . . . . . 8,798 9,146 9,494 11,180 12,802 14,465 16,240 18,144 2.3aIncludes the 50 States and the District of Columbia.Notes: Totals may not equal sum of components due to independent rounding. GDP growth rates for non-OECD Europe and Eur-
asia (excluding Russia), China, India, Africa, and Central and South America (excluding Brazil) were adjusted, based on the ana-lyst’s judgment.
Sources: History: IHS Global Insight, World Overview (Lexington, MA, various issues). Projections: IHS Global Insight, WorldOverview, Third Quarter 2009 (Lexington, MA, November 2009); and U.S. Energy Information Administration (EIA), Annual EnergyOutlook 2010, DOE/EIA-0383(2010) (Washington, DC, April 2010), AEO2010 National Energy Modeling System, run AEO2010R.D111809A, web site www.eia.gov/ oiaf/aeo.

Table J3. World energy intensity by region, Reference case, 2005-2035(Thousand Btu per 2005 dollar of GDP)
Kaya Identity factor projections
U.S. Energy Information Administration / International Energy Outlook 2010 317
Region/Country
History Projections Average annualpercent change,
2007-20352005 2006 2007 2015 2020 2025 2030 2035
OECDOECD North America . . . . . . . . . . . 8.2 7.9 7.9 6.9 6.2 5.6 5.1 4.7 -1.8United Statesa. . . . . . . . . . . . . . . . . 8.1 7.8 7.8 6.8 6.0 5.5 4.9 4.5 -1.9Canada . . . . . . . . . . . . . . . . . . . . . . 12.7 12.1 11.7 10.2 9.6 9.1 8.7 8.3 -1.2Mexico. . . . . . . . . . . . . . . . . . . . . . . 5.5 5.5 5.5 5.0 4.5 4.2 3.9 3.7 -1.4
OECD Europe . . . . . . . . . . . . . . . . . 5.9 5.8 5.5 5.1 4.6 4.3 4.0 3.7 -1.4OECD Asia . . . . . . . . . . . . . . . . . . . . 7.0 6.9 6.8 6.1 5.9 5.7 5.6 5.4 -0.8Japan . . . . . . . . . . . . . . . . . . . . . . . 6.0 5.9 5.6 4.9 4.9 4.9 4.8 4.7 -0.6South Korea . . . . . . . . . . . . . . . . . . 10.4 10.0 9.9 8.4 7.8 7.4 7.0 6.8 -1.3Australia/New Zealand . . . . . . . . . . 8.6 8.5 8.7 8.0 7.1 6.5 6.0 5.5 -1.6
Total OECD . . . . . . . . . . . . . . . . . 7.1 6.9 6.8 6.0 5.5 5.1 4.7 4.4 -1.5
Non-OECDNon-OECD Europe and Eurasia. . . 16.9 15.9 14.8 12.5 11.0 9.8 8.8 8.1 -2.1Russia . . . . . . . . . . . . . . . . . . . . . . . 17.4 16.6 15.4 13.1 11.5 10.3 9.2 8.4 -2.1Other . . . . . . . . . . . . . . . . . . . . . . . . 16.2 14.9 14.0 11.8 10.3 9.2 8.3 7.7 -2.1
Non-OECD Asia. . . . . . . . . . . . . . . . 9.5 9.2 8.9 6.6 5.9 5.4 5.0 4.7 -2.2China. . . . . . . . . . . . . . . . . . . . . . . . 12.7 12.1 11.4 8.0 7.0 6.3 5.9 5.6 -2.5India . . . . . . . . . . . . . . . . . . . . . . . . 7.2 7.0 6.9 5.0 4.4 4.0 3.6 3.3 -2.6Other Non-OECD Asia . . . . . . . . . . 6.6 6.5 6.3 5.2 4.7 4.3 4.1 3.9 -1.7
Middle East . . . . . . . . . . . . . . . . . . . 11.5 11.2 11.1 10.7 9.7 8.7 7.8 7.2 -1.5Africa . . . . . . . . . . . . . . . . . . . . . . . . 7.3 6.9 6.8 5.7 5.1 4.7 4.3 4.1 -1.8Central and South America . . . . . . 7.2 7.1 6.9 6.0 5.6 5.1 4.8 4.4 -1.6Brazil . . . . . . . . . . . . . . . . . . . . . . . . 7.3 7.3 7.3 6.3 5.9 5.5 5.2 4.7 -1.5Other Central and South America. . 7.1 6.9 6.6 5.8 5.3 4.8 4.4 4.1 -1.6Total Non-OECD . . . . . . . . . . . . . 10.0 9.7 9.3 7.4 6.6 5.9 5.4 5.1 -2.1
Total World . . . . . . . . . . . . . . . . . . . . 8.3 8.0 7.8 6.7 6.1 5.6 5.1 4.8 -1.7aIncludes the 50 States and the District of Columbia.Notes: Totals may not equal sum of components due to independent rounding.Sources: History: IHS Global Insight, World Overview (Lexington, MA, various issues). Projections: IHS Global Insight, World
Overview, Third Quarter 2009 (Lexington, MA, November 2009); and U.S. Energy Information Administration, Annual Energy Out-look 2010, DOE/EIA-0383(2010) (Washington, DC, April 2010), AEO2010 National Energy Modeling System, run AEO2010R.D111809A, web site www.eia.gov/oiaf/aeo; and World Energy Projection System Plus (2010).

Table J4. World carbon dioxide intensity of energy use by region, Reference case, 2005-2035(Metric tons per billion Btu)
Appendix J
318 U.S. Energy Information Administration / International Energy Outlook 2010
Region/Country
History Projections Average annualpercent change,
2007-20352005 2006 2007 2015 2020 2025 2030 2035
OECDOECD North America . . . . . . . . . . . 57.3 56.8 56.7 54.2 53.4 53.1 53.0 52.7 -0.3United Statesa. . . . . . . . . . . . . . . . . 59.5 59.0 58.9 56.4 55.7 55.6 55.5 55.2 -0.2Canada . . . . . . . . . . . . . . . . . . . . . . 42.3 41.0 40.9 37.8 36.0 35.6 35.5 35.2 -0.5Mexico. . . . . . . . . . . . . . . . . . . . . . . 57.9 57.3 57.7 56.0 55.5 54.8 54.4 54.8 -0.2
OECD Europe . . . . . . . . . . . . . . . . . 53.4 53.4 53.3 50.1 48.7 47.5 46.9 46.6 -0.5OECD Asia . . . . . . . . . . . . . . . . . . . . 56.5 55.7 57.3 54.1 52.6 52.2 51.8 51.6 -0.4Japan . . . . . . . . . . . . . . . . . . . . . . . 54.3 53.7 55.4 52.3 50.9 50.1 49.0 48.0 -0.5South Korea . . . . . . . . . . . . . . . . . . 53.4 51.6 53.0 50.3 48.8 49.3 49.8 50.8 -0.2Australia/New Zealand . . . . . . . . . . 68.2 68.0 68.8 63.8 62.8 62.1 61.7 61.5 -0.4
Total OECD . . . . . . . . . . . . . . . . . 55.8 55.4 55.7 52.8 51.7 51.2 50.8 50.6 -0.3
Non-OECDNon-OECD Europe and Eurasia. . . 56.4 56.3 56.3 55.0 53.8 52.8 52.7 52.7 -0.2Russia . . . . . . . . . . . . . . . . . . . . . . . 55.6 54.8 54.6 53.5 52.1 50.7 50.6 51.0 -0.2Other . . . . . . . . . . . . . . . . . . . . . . . . 57.7 58.6 58.8 57.1 56.3 55.7 55.6 55.1 -0.2
Non-OECD Asia. . . . . . . . . . . . . . . . 74.5 73.8 74.1 70.5 69.1 68.6 68.5 68.5 -0.3China. . . . . . . . . . . . . . . . . . . . . . . . 81.3 80.3 80.5 76.1 74.6 73.8 73.4 73.3 -0.3India . . . . . . . . . . . . . . . . . . . . . . . . 67.9 68.5 69.0 64.5 62.2 61.3 61.0 61.0 -0.4Other Non-OECD Asia . . . . . . . . . . 61.3 60.5 60.5 57.8 56.6 56.9 57.5 58.1 -0.1
Middle East . . . . . . . . . . . . . . . . . . . 61.1 60.4 60.4 59.0 58.5 58.5 58.7 58.9 -0.1Africa . . . . . . . . . . . . . . . . . . . . . . . . 57.1 57.0 56.8 55.5 55.0 54.7 55.1 55.5 -0.1Central and South America . . . . . . 42.0 41.8 41.7 40.8 39.7 38.8 38.3 37.9 -0.3Brazil . . . . . . . . . . . . . . . . . . . . . . . . 32.6 32.5 31.9 32.1 31.6 31.1 31.1 31.4 -0.1Other Central and South America. . 49.1 48.9 49.5 48.3 47.1 46.6 45.9 45.4 -0.3Total Non-OECD . . . . . . . . . . . . . 64.2 63.9 64.2 62.2 61.4 61.2 61.4 61.6 -0.1
Total World . . . . . . . . . . . . . . . . . . . . 59.9 59.6 60.0 58.0 57.3 57.1 57.2 57.4 -0.2aIncludes the 50 States and the District of Columbia.Notes: Totals may not equal sum of components due to independent rounding.Sources: History: U.S. Energy Information Administration (EIA), derived from International Energy Statistics database (as of
November 2009), web site www.eia.gov/emeu/international. Projections: EIA, Annual Energy Outlook 2010, DOE/EIA-0383(2010)(Washington, DC, April 2010), AEO2010 National Energy Modeling System, run AEO2010R.D111809A, web site www.eia.gov/oiaf/aeo; and World Energy Projection System Plus (2010).

Appendix K
Comparisons With International Energy Agencyand IEO2009 Projections
Comparisons with IEA’sWorld Energy Outlook 2009
The International Energy Agency (IEA) in its WorldEnergy Outlook 2009 provides projections comparablewith those in IEO2010. In both reports, the latest histori-cal year of data upon which the projections are based is2007. Although the IEO2010 projections now extend to2035, IEA projections extend only to 2030. As a result,two time periods were chosen for comparison—2007 to2015 and 2015 to 2030.
Before turning to a discussion of similarities and differ-ences between the IEO2010 and IEA projections, thedivergent aims of the two publications should be recog-nized. The IEO2010 Reference case is most directly com-parable with the Reference Scenario World EnergyOutlook 2009, Part A, “Global Energy Trends to 2030.”EIA believes that a full understanding of energy trendsunder current laws and policies requires considerationof the uncertainties. For example, in the IEO2010 Refer-ence case, projected demand for liquid fuels in 2030 is103.9 million barrels per day (including 3.5 million bar-rels per day of biofuels), compared with 107.9 millionbarrels per day of liquids in 2030 in the IEA ReferenceScenario (including 2.7 million barrels per day ofbiofuels).
The IEA Reference Scenario has a world oil price trajec-tory similar to that in the IEO2010 Reference case, but theIEA oil price projections for 2030 are about 7 percentlower than those in the IEO2010 Reference case. In theIEO2010 Low Oil Price case, in which the world oil priceremains at about $51 per barrel through 2030 (all pricesin 2008 dollars unless otherwise noted), world demandfor liquids in 2030 is significantly higher, at 114.6 millionbarrels per day. In the IEO2010 High Oil Price case, theworld oil price rises steadily to $204 per barrel in 2030,and total world demand for liquids in 2030 is 90.4 mil-lion barrels per day.
EIA encourages users of its projections to consider howkey energy market and economic uncertainties, as wellas policy decisions, can affect future energy demand. Asshown in IEO2010, alternative oil price assumptionsalso have significant impacts on the projected composi-tion of liquids supply, because they affect the mix of
unconventional and conventional oil sources and thecomposition of the unconventional component of sup-ply. The alternative oil price cases included in IEA’sWorld Energy Outlook 2009 are released as sensitivityanalyses that establish bounds on demand, rather thanscenarios that consider the impacts of alternative priceassumptions on the world’s energy supply mix, as theIEO2010 High and Low Oil Price cases do.
Most of the comparisons in this appendix focus on pro-jections of energy demand in the IEO2010 Reference caseand the IEA Reference Scenario. There is one notewor-thy difference between the two cases, regarding thenatural gas market in North America and, in particular,the United States. In both the IEO2010 Reference caseand the World Energy Outlook 2009 Reference Scenario,U.S. natural gas prices decline between 2008 and 2015;however, the decline is much steeper in IEO2010, andthe price recovery thereafter is much slower. In theIEO2010 Reference case, natural gas prices remain rela-tively flat from 2015 through 2025 (at about $6 per mil-lion Btu), before increasing modestly to $7.40 per millionBtu in 2030. In the IEA Reference Scenario, the averageU.S. price for imported natural gas falls to $7.30 per mil-lion Btu in 2015 and then rises steadily to $11.40 per mil-lion Btu in 2030.
Overall, the IEO2010 Reference case and the IEA Refer-ence Scenario provide similar outlooks for the futuregrowth of U.S. demand for natural gas. In IEO2010, U.S.natural gas consumption grows by an average of 0.7 per-cent per year from 2007 to 2030, as compared with 0.5percent per year in the IEA projection. From 2007 to2015, U.S. natural gas consumption drops by an averageof 0.7 percent per year in the IEO2010 projection, as com-pared with 0.4 percent per year in the IEA projection. Inthe long term, the lower prices in IEO2010 result in 0.8-percent average annual increases in U.S. gas consump-tion from 2015 to 2030, compared with increases averag-ing only 0.1 percent per year from 2015 to 2030 withIEA’s higher price trajectory.
For the period from 2007 to 2015, the IEA Reference Sce-nario reflects growth in world energy consumption thatmore closely resembles that in the IEO2010 High Eco-nomic Growth case than that in the Reference case. In theIEA Reference Scenario, world energy consumptionincreases by an average of 1.5 percent per year over the
U.S. Energy Information Administration / International Energy Outlook 2010 319

period, as compared with 1.4 percent per year in theIEO2010 High Economic Growth case. In the IEO2010Reference case, world energy use increases by an aver-age of 1.2 percent per year (Table K1).
The slower near-term growth in the IEO2010 Referencecase may reflect, in part, the different release dates forIEO2010 and IEA’s World Energy Outlook 2009. TheIEO2010 projections were prepared when preliminaryassessments of the global recession were becomingavailable (specifically, as reflected in the near-term GDPestimates in IHS Global Insight’s November 2009release), whereas the World Energy Outlook 2009 wasreleased in November 2009, and its projections were for-mulated several months in advance of the report’srelease date. Thus, the IEA report may not have incorpo-rated the full severity of the global recession and itsimpacts on world energy markets.
On a regional basis, both outlooks project almost nogrowth or a decline in energy demand among OECDnations. In the IEA projections, OECD energy consump-tion declines from 2007 to 2015 except in OECD Asia. ByOECD region, the largest differences between the pro-jections are for Europe and the United States. IEA pro-jects a 0.3-percent average yearly decline in OECDEurope’s energy consumption, compared with averagedeclines of 0.1 percent in the IEO2010 Reference case and0.2 percent in the Low Economic Growth case. For theUnited States, IEA projects a 0.2-percent average yearlydecline, whereas the IEO2010 Reference case projects nodecline (or increase) over the same period.
There is wider variation between the IEA and IEO2010reports in their near-term projections for non-OECDregions. For non-OECD nations as a group, the IEA pro-jections more closely resemble—and sometimesexceed—those in the IEO2010 High Economic Growthcase rather than the IEO2010 Reference case. On aregional basis, IEA projects growth rates that exceed theIEO2010 projections for non-OECD Europe and Eurasia,China, and India. For each of those regions and coun-tries, IEA projects higher growth rates than those in theIEO2010 High Economic Growth case.
For two non-OECD regions—the Middle East andAfrica—IEA projects much slower growth in energydemand from 2007 to 2015 than does the IEO2010 Refer-ence case. For the Middle East, IEA projects 3.2-percentaverage annual growth in energy consumption—thesame as the rate in the IEO2010 Low Economic Growthcase—compared with 3.4 percent per year in the IEO-2010 Reference case. Similarly, IEA projects a 1.6-percentaverage annual increase in Africa’s energy use from2007 to 2015, lower than the IEO2010 projections of 2.0percent per year in the Reference case and 1.8 percentper year in the Low Economic Growth case.
For the period from 2015 to 2030, the overall differencesbetween the IEO2010 and IEA projections narrow sub-stantially, with worldwide energy demand growing by1.6 percent per year in the IEO2010 Reference case and1.5 percent per year in the IEA Reference Scenario (TableK2). At the regional level, however, there are some sub-stantial differences between the outlooks. For the OECD,
320 U.S. Energy Information Administration / International Energy Outlook 2010
Table K1. Comparison of IEO2010 and IEA world energy consumption growth rates by region, 2007-2015(average annual percent growth)
Region
IEO2010 IEA ReferenceScenarioLow Economic Growth Reference High Economic Growth
OECD . . . . . . . . . . . . . . . . . . . -0.2 0.0 0.3 -0.1North America . . . . . . . . . . . . -0.2 0.1 0.4 -0.1
United States . . . . . . . . . . . . -0.3 0.0 0.4 -0.2Europe . . . . . . . . . . . . . . . . . . -0.2 -0.1 0.1 -0.3Asia . . . . . . . . . . . . . . . . . . . . -0.2 0.0 0.2 0.2
Non-OECD . . . . . . . . . . . . . . . 2.0 2.2 2.4 2.7Europe and Eurasia . . . . . . . . 0.1 0.2 0.3 0.5China . . . . . . . . . . . . . . . . . . . 3.1 3.3 3.6 4.4India . . . . . . . . . . . . . . . . . . . . 2.1 2.3 2.5 3.2Other Non-OECD Asia. . . . . . 1.8 2.0 2.2 2.1Middle East . . . . . . . . . . . . . . 3.2 3.4 3.6 3.2Africa . . . . . . . . . . . . . . . . . . . 1.8 2.0 2.2 1.6Central and South America . . 1.5 1.7 2.0 1.7
Total World . . . . . . . . . . . . . . . 0.9 1.2 1.4 1.5
Sources: IEO2010: Energy Information Administration (EIA), World Energy Projection System Plus (2010). IEA: InternationalEnergy Agency, World Energy Outlook 2009 (Paris, France, November 2009), pp. 621-657.

the largest difference between the two projections is forOECD Asia: average annual growth in OECD Asia’senergy consumption from 2015 to 2030 in the IEA out-look (0.4 percent per year) is considerably lower than inthe IEO2010 Reference case (0.8 percent per year) andslightly lower than in the IEO2010 Low EconomicGrowth case (0.5 percent per year).
In the projections for non-OECD energy consumption,the largest differences are for China, non-OECD Europeand Eurasia, the Middle East, and India. For China, IEAshows energy demand growth slowing to 2.1 percentper year from 2015 to 2030 (lower than in the IEO2010Low Economic Growth case), whereas the IEO2010 Ref-erence case shows a steady growth rate of 3.2 percent peryear. In contrast, for non-OECD Europe and Eurasia,and especially for the Middle East and India, the IEAprojections for energy demand growth from 2015 to 2030are much higher than those in the IEO2010 Referencecase, exceeding those in the IEO2010 High EconomicGrowth case. In the IEA Reference Scenario, energydemand growth in non-OECD Europe and Eurasia aver-ages 1.0 percent per year from 2015 to 2030, as comparedwith 0.6 percent per year in the IEO2010 Reference case;demand growth in the Middle East averages 2.6 percentper year, compared with 1.6 percent per year in theIEO2010 Reference case; and demand growth in Indiaaverages 3.5 percent per year, as compared with 2.3 per-cent per year in the IEO2010 Reference case. For each ofthe three, the IEA projections exceed those in theIEO2010 High Economic Growth case.
The projections vary not only with respect to levels ofenergy demand but also with respect to the mix of pri-mary energy inputs. In the 2007-2015 period, IEAexpects much faster growth in the use of coal and slowergrowth in the use of natural gas, nuclear, and renewableenergy sources than does IEO2010 (Table K3). The IEAprojection shows world coal consumption increasing byan annual average of 2.3 percent from 2007 to 2015, com-pared with only 0.6 percent in the IEO2010 Referencecase. IEO2010 incorporates a substantial decline in coaluse in the near term, particularly in the industrial sector,in large part because coal is widely used in the produc-tion of heavy commodities (such as, steel and pig iron),which were particularly hard hit in the recession. Worldcoal use declines in the IEO2010 Reference case by anestimated 3 percent annually from 2007 to 2009, stronglyaffecting the overall growth rate from 2007 through2015. The IEA Reference Scenario, on the other hand,does not appear to incorporate a similar decline inworldwide coal consumption in its near-term outlook.
The IEA renewables projections were adjusted for thiscomparison by removing biofuels from the totals, butdifferences between the projections for consumption ofrenewables still exist, because IEA includes an estimatefor traditional, nonmarketed biomass in its renewableenergy projections, whereas the IEO2010 projections donot attempt to estimate the use of nonmarketed renew-able fuels (which, in fact, is not likely to expand signifi-cantly, because developing countries tend to move awayfrom traditional fuels to commercial fuels as their energy
U.S. Energy Information Administration / International Energy Outlook 2010 321
Table K2. Comparison of IEO2010 and IEA world energy consumption growth rates by region, 2015-2030(average annual percent growth)
Region
IEO2010 IEA ReferenceScenarioLow Economic Growth Reference High Economic Growth
OECD . . . . . . . . . . . . . . . . . . . 0.3 0.7 1.0 0.4North America . . . . . . . . . . . . 0.4 0.8 1.1 0.5
United States . . . . . . . . . . . . 0.2 0.6 0.9 0.3Europe . . . . . . . . . . . . . . . . . . 0.1 0.4 0.6 0.4Asia . . . . . . . . . . . . . . . . . . . . 0.5 0.8 1.1 0.4
Non-OECD . . . . . . . . . . . . . . . 1.9 2.2 2.6 2.1Europe and Eurasia . . . . . . . . 0.4 0.7 0.9 1.0China . . . . . . . . . . . . . . . . . . . 2.8 3.2 3.6 2.1India . . . . . . . . . . . . . . . . . . . . 1.9 2.3 2.7 3.5Other Non-OECD Asia. . . . . . 2.3 2.7 3.1 2.5Middle East . . . . . . . . . . . . . . 1.3 1.6 2.0 2.6Africa . . . . . . . . . . . . . . . . . . . 1.2 1.6 2.0 1.3Central and South America . . 1.4 1.8 2.3 1.7
Total World . . . . . . . . . . . . . . . 1.2 1.6 1.9 1.5
Sources: IEO2010: Energy Information Administration (EIA), World Energy Projection System Plus (2010). IEA: InternationalEnergy Agency, World Energy Outlook 2009 (Paris, France, November 2009), pp. 621-657.

infrastructures and standards of living increase). Still,consumption of traditional fuels in some developingcountries is estimated to be quite large, with effects ontotal renewable energy use that would tend to mask anygrowth in the consumption of energy from marketed,commercial renewable sources—particularly, wind andother nonhydroelectric renewables.
Differences between the IEA and IEO2010 projectionsfor nuclear energy are explained in large part by differ-ent expectations for the OECD region, which accountedfor 83 percent of the world’s total nuclear power use in2007. Although the IEA Reference Scenario projectsmore rapid growth for nuclear power in the OECD Asiaregion than is projected in the IEO2010 Reference case, italso projects a decline in OECD Europe. In contrast, inthe IEO2010 Reference case, nuclear power use in OECDEurope rises by 0.8 percent per year through 2015.Because OECD Europe consumes more than twice asmuch nuclear electricity as OECD Asia, the 0.8-percentdecline projected by IEA for OECD Europe offsets theprojected increases for other OECD and non-OECDregions—including OECD Asia and non-OECD Asia(excluding India)—that are larger than those in theIEO2010 Reference case.
Regional differences also explain the difference in expec-tations for world natural gas demand in the 2007 to 2015period. In the IEO2010 Reference case, natural gas usegrows by 1.8 percent per year over the period, comparedwith 1.4 percent per year in the IEA Reference Scenario,which is below the comparable rate in the IEO2010 LowEconomic Growth case. Although the IEA ReferenceScenario and the IEO2010 Reference case have similarprojections of natural gas demand for many regions ofthe world, IEO2010 expects much stronger growth indemand in the key consuming regions of OECD Europe,non-OECD Europe and Eurasia, the Middle East, andAfrica. Those regions currently account for more thanone-half of the world’s natural gas consumption, and sothe higher increases in IEO2010 result in different projec-tions for natural gas demand growth worldwide.
For the period from 2015 to 2030, the most noticeabledifferences between the IEO2010 Reference case and IEAprojections are for natural gas, nuclear power, andrenewable energy sources. Nuclear power and renew-able energy projections in the IEA Reference Scenariofall significantly below those in the IEO2010 Low Eco-nomic Growth case (Table K4). In the IEA projection, theaverage annual growth rate for world nuclear electricity
322 U.S. Energy Information Administration / International Energy Outlook 2010
Table K4. Comparison of IEO2010 and IEA world energy consumption growth rates by fuel, 2015-2030(average annual percent growth)
Fuel
IEO2010 IEA ReferenceScenarioLow Economic Growth Reference High Economic Growth
Liquids . . . . . . . . . . . . . . . . . . . 0.6 1.1 1.5 1.2Natural gas . . . . . . . . . . . . . . . 1.0 1.3 1.5 1.6Coal . . . . . . . . . . . . . . . . . . . . . 1.5 1.9 2.5 1.6Nuclear . . . . . . . . . . . . . . . . . . 2.1 2.1 2.1 1.1Renewable/Other. . . . . . . . . . . 2.3 2.4 2.6 1.7
Total . . . . . . . . . . . . . . . . . . . 1.2 1.6 1.9 1.5
Note: In the IEA projections, Renewable/Other includes traditional biomass.Sources: IEO2010: Energy Information Administration (EIA), World Energy Projection System Plus (2010). IEA: International
Energy Agency, World Energy Outlook 2009 (Paris, France, November 2009), pp. 621-657.
Table K3. Comparison of IEO2010 and IEA world energy consumption growth rates by fuel, 2007-2015(average annual percent growth)
Fuel
IEO2010 IEA ReferenceScenarioLow Economic Growth Reference High Economic Growth
Liquids . . . . . . . . . . . . . . . . . . . 0.1 0.3 0.6 0.5Natural gas . . . . . . . . . . . . . . . 1.6 1.8 1.9 1.4Coal . . . . . . . . . . . . . . . . . . . . . 0.4 0.6 0.8 2.3Nuclear . . . . . . . . . . . . . . . . . . 2.1 2.2 2.2 1.7Renewable/Other. . . . . . . . . . . 3.0 3.4 3.8 2.0
Total . . . . . . . . . . . . . . . . . . . 0.9 1.2 1.4 1.5
Note: In the IEA projections, Renewable/Other includes traditional biomass.Sources: IEO2010: Energy Information Administration (EIA), World Energy Projection System Plus (2010). IEA: International
Energy Agency, World Energy Outlook 2009 (Paris, France, November 2009), pp. 621-657.

consumption slows from 1.7 percent in the 2007-2015period to 1.1 percent in the 2015-2030 period; IEO2010projects average annual increases of 2.2 percent from2007 to 2015 and 2.1 percent from 2015 to 2030. In the IEAReference Scenario, renewable energy use increases by2.0 percent per year over the 2007-2015 period and by 1.7percent per year from 2015 to 2030; in the IEO2010 Refer-ence case, renewable energy use increases by 3.4 percentper year from 2007 to 2015 and 2.4 percent per year from2015 to 2030.
In contrast to nuclear power and renewable energysources, for world natural gas consumption the IEA Ref-erence Scenario projects growth from 2015 to 2030 that iseven stronger than that from 2007 to 2015 (1.6 percent vs.1.4 percent per year). The 1.6-percent growth rate from2015 to 2030 is higher than the corresponding rate in theIEO2010 High Economic Growth case. In the IEO2010Reference case, natural gas demand is offset by pro-jected increases in nuclear power, renewables, and coalfor power generation. The slower projected growth ratesin the IEA Reference Scenario, especially for nuclear
power and renewables, are offset by increased demandfor natural gas.
Comparisons With IEO2009
The IEO2010 outlook for total energy consumption in2015 is 20 quadrillion Btu (about 4 percent) lower thanthe outlook that was published in IEO2009. Because theglobal economic recession had a strong negative impacton energy demand in the near term, total marketedenergy consumption in 2015 in the IEO2010 Referencecase is 532 quadrillion Btu, as compared with 552 qua-drillion Btu in IEO2009 (Table K5).39
OECD regions account for about one-half of the differ-ence between the 2009 and 2010 outlooks, with IEO2010projections for 2015 about 9 quadrillion Btu lower thanthose in IEO2009. Within the OECD region, differencesbetween the outlooks for 2015 are largest for Europe andAsia. For OECD Asia, the difference is attributable toJapan and South Korea—the nations of the regionthat were most strongly affected by the recession. In
U.S. Energy Information Administration / International Energy Outlook 2010 323
Table K5. Comparison of IEO2010 and IEO2009 total world energy consumption, Reference case,2015 and 2030 (quadrillion Btu)
Region
2015 2030 Change in IEO2010
IEO2010 IEO2009 IEO2010 IEO2009 2015 2030
OECD . . . . . . . . . . . . . . . . . . . . . . . . . . . . 243 252 266 278 -9 -12North America . . . . . . . . . . . . . . . . . . . . . 124 126 139 142 -2 -2United States . . . . . . . . . . . . . . . . . . . . 102 103 111 114 -1 -2
Europe . . . . . . . . . . . . . . . . . . . . . . . . . . 81 85 83 92 -4 -9Asia . . . . . . . . . . . . . . . . . . . . . . . . . . . . . 39 42 44 45 -3 0
Japan . . . . . . . . . . . . . . . . . . . . . . . . . . 21 23 22 23 -2 -1South Korea . . . . . . . . . . . . . . . . . . . . . 11 12 14 13 -1 1Australia/New Zealand . . . . . . . . . . . . . 7 7 8 8 0 0
Non-OECD . . . . . . . . . . . . . . . . . . . . . . . . 288 299 402 400 -11 2Europe and Eurasia . . . . . . . . . . . . . . . . 52 58 58 63 -5 -6Russia . . . . . . . . . . . . . . . . . . . . . . . . . . 31 34 34 38 -4 -4Other Non-OECD Europe and Eurasia . 22 23 24 26 -2 -2
China. . . . . . . . . . . . . . . . . . . . . . . . . . . . 101 106 162 156 -5 6India . . . . . . . . . . . . . . . . . . . . . . . . . . . . 23 23 32 32 0 0Other Non-OECD Asia . . . . . . . . . . . . . . 32 34 48 51 -2 -4Middle East . . . . . . . . . . . . . . . . . . . . . . . 33 30 42 38 3 4Africa. . . . . . . . . . . . . . . . . . . . . . . . . . . . 18 18 23 22 0 1Central and South America. . . . . . . . . . . 29 30 38 38 -1 0
Total World . . . . . . . . . . . . . . . . . . . . . . . 532 552 669 678 -20 -10
Sources: IEO2010: Energy Information Administration (EIA), World Energy Projection System Plus (2010). IEO2009: EIA, Inter-national Energy Outlook 2009, DOE/EIA-0484(2009) (Washington, DC, May 2009), Table A1, p. 121.
39 It is important to note that, for purposes of comparison, the IEO2010 projections for 2015 and 2030 have been adjusted in Table K5 byremoving industrial sector renewable energy use for all countries except the United States, because in IEO reports before 2010 that timeseries did not include renewables. The adjustment removes a total of 12 quadrillion Btu from world total energy consumption in 2015 in theIEO2010 Reference case and a total of 18 quadrillion Btu in 2030. The IEO reports have always included U.S. historical data and projectionsrelated to industrial sector renewable energy consumption, as published in EIA’s Annual Energy Outlook reports.
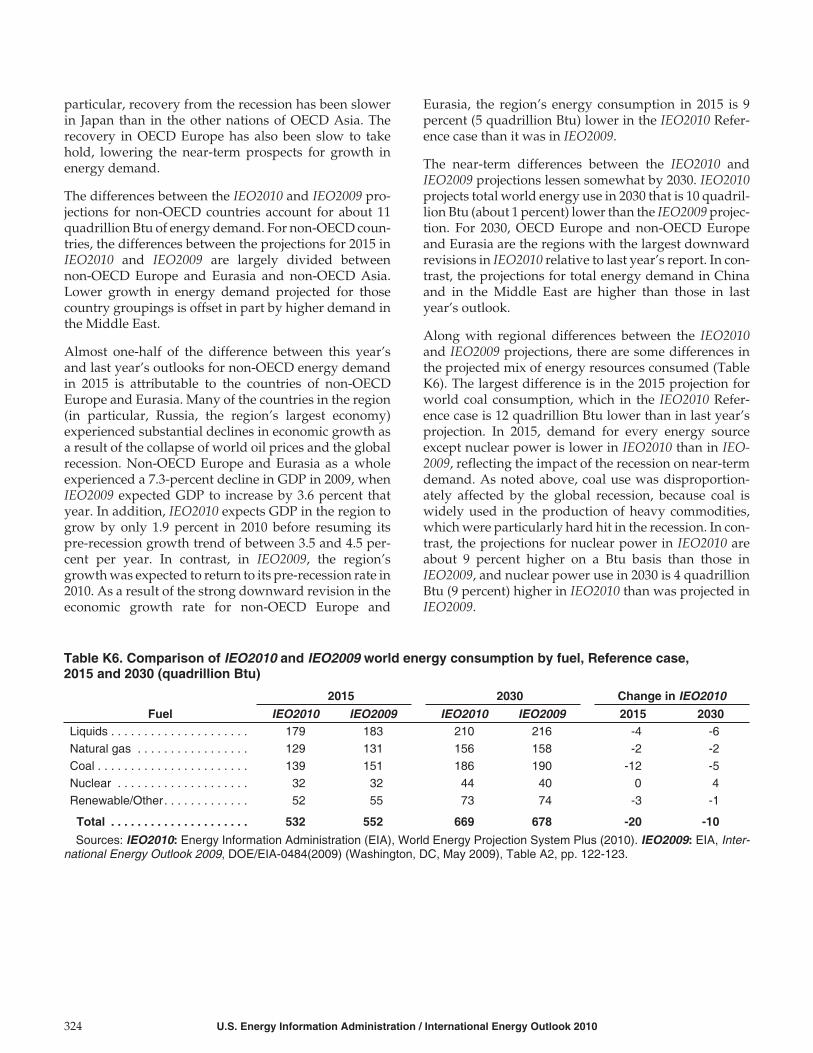
particular, recovery from the recession has been slowerin Japan than in the other nations of OECD Asia. Therecovery in OECD Europe has also been slow to takehold, lowering the near-term prospects for growth inenergy demand.
The differences between the IEO2010 and IEO2009 pro-jections for non-OECD countries account for about 11quadrillion Btu of energy demand. For non-OECD coun-tries, the differences between the projections for 2015 inIEO2010 and IEO2009 are largely divided betweennon-OECD Europe and Eurasia and non-OECD Asia.Lower growth in energy demand projected for thosecountry groupings is offset in part by higher demand inthe Middle East.
Almost one-half of the difference between this year’sand last year’s outlooks for non-OECD energy demandin 2015 is attributable to the countries of non-OECDEurope and Eurasia. Many of the countries in the region(in particular, Russia, the region’s largest economy)experienced substantial declines in economic growth asa result of the collapse of world oil prices and the globalrecession. Non-OECD Europe and Eurasia as a wholeexperienced a 7.3-percent decline in GDP in 2009, whenIEO2009 expected GDP to increase by 3.6 percent thatyear. In addition, IEO2010 expects GDP in the region togrow by only 1.9 percent in 2010 before resuming itspre-recession growth trend of between 3.5 and 4.5 per-cent per year. In contrast, in IEO2009, the region’sgrowth was expected to return to its pre-recession rate in2010. As a result of the strong downward revision in theeconomic growth rate for non-OECD Europe and
Eurasia, the region’s energy consumption in 2015 is 9percent (5 quadrillion Btu) lower in the IEO2010 Refer-ence case than it was in IEO2009.
The near-term differences between the IEO2010 andIEO2009 projections lessen somewhat by 2030. IEO2010projects total world energy use in 2030 that is 10 quadril-lion Btu (about 1 percent) lower than the IEO2009 projec-tion. For 2030, OECD Europe and non-OECD Europeand Eurasia are the regions with the largest downwardrevisions in IEO2010 relative to last year’s report. In con-trast, the projections for total energy demand in Chinaand in the Middle East are higher than those in lastyear’s outlook.
Along with regional differences between the IEO2010and IEO2009 projections, there are some differences inthe projected mix of energy resources consumed (TableK6). The largest difference is in the 2015 projection forworld coal consumption, which in the IEO2010 Refer-ence case is 12 quadrillion Btu lower than in last year’sprojection. In 2015, demand for every energy sourceexcept nuclear power is lower in IEO2010 than in IEO-2009, reflecting the impact of the recession on near-termdemand. As noted above, coal use was disproportion-ately affected by the global recession, because coal iswidely used in the production of heavy commodities,which were particularly hard hit in the recession. In con-trast, the projections for nuclear power in IEO2010 areabout 9 percent higher on a Btu basis than those inIEO2009, and nuclear power use in 2030 is 4 quadrillionBtu (9 percent) higher in IEO2010 than was projected inIEO2009.
324 U.S. Energy Information Administration / International Energy Outlook 2010
Table K6. Comparison of IEO2010 and IEO2009 world energy consumption by fuel, Reference case,2015 and 2030 (quadrillion Btu)
Fuel
2015 2030 Change in IEO2010
IEO2010 IEO2009 IEO2010 IEO2009 2015 2030Liquids . . . . . . . . . . . . . . . . . . . . . 179 183 210 216 -4 -6Natural gas . . . . . . . . . . . . . . . . . 129 131 156 158 -2 -2Coal . . . . . . . . . . . . . . . . . . . . . . . 139 151 186 190 -12 -5Nuclear . . . . . . . . . . . . . . . . . . . . 32 32 44 40 0 4Renewable/Other. . . . . . . . . . . . . 52 55 73 74 -3 -1
Total . . . . . . . . . . . . . . . . . . . . . 532 552 669 678 -20 -10
Sources: IEO2010: Energy Information Administration (EIA), World Energy Projection System Plus (2010). IEO2009: EIA, Inter-national Energy Outlook 2009, DOE/EIA-0484(2009) (Washington, DC, May 2009), Table A2, pp. 122-123.
Appendix L
Models Used To Generate the IEO2010 Projections
The IEO2010 projections of world energy consumptionand supply were generated from EIA’s World EnergyProjections Plus (WEPS+) model. WEPS+ consists of asystem of individual sectoral energy models, using anintegrated iterative solution process that allows for con-vergence of consumption and prices to an equilibriumsolution. It is used to build the Reference case energyprojections, as well as alternative energy projectionsbased on different assumptions for GDP growth andfossil fuel prices. It can also be used to perform otheranalyses.
WEPS+ produces projections for 16 regions or countriesof the world, including North America (United States,Canada, and Mexico), OECD Europe, OECD Asia(Japan, South Korea, and Australia/New Zealand),Russia, other non-OECD Europe and Eurasia, China,India, other non-OECD Asia, Brazil, and other Centraland South America. Currently, the projections extend to2035.
The WEPS+ platform allows the various individualmodels to communicate with each other through a com-mon, shared database and provides a comprehensive,central series of output reports for analysis. In the indi-vidual models, the detail also extends to the subsectorlevel. In WEPS+, the end-use demand models (residen-tial, commercial, industrial, and transportation) projectconsumption of the key primary energy sources: severalpetroleum products, other liquids, natural gas, coal,nuclear power, hydropower, wind, geothermal, andother renewable sources. These models also provideintermediate consumption projections for electricity inthe end-use demand sectors.
The end-use model projections generally depend onretail supply prices, economic activity as represented byGDP (or gross output in the industrial sector), and popu-lation. The transformation models (power generationand district heat) satisfy electricity and heat require-ments and also project consumption of primary energysources at resulting price levels. The supply models(petroleum, natural gas, and coal) generate supply andwholesale price projections for the key supply sourcescorresponding to the primary consumption sources. Therefinery model makes retail price projections for a vari-ety of petroleum products corresponding to the worldoil price. The main model in the WEPS+ system moni-tors the convergence sequence for all the models andprojects energy-related carbon dioxide emissions fromfossil fuels (including emissions from the use of
petrochemical feedstocks but excluding flared naturalgas) at the regional level.
Several model enhancements were implemented in thisyear’s version of the WEPS+ model, including improve-ments to the modeling platform and improvements inthe individual models:
•The residential and commercial demand modelsnow use dynamic simulations with additional prod-uct detail, in which the projections are built up overthe projection horizon based on changes in GDP,retail prices, consumption in the previous year, and atrend.
•There is a distinct district heat model, and the supplymodels now provide improved retail price feedback.
•The industrial model now includes consumption ineight industries using a stock/flow approach.
•The transportation sector model includes an exten-sive level of detail for modes and vehicle types.
•Last year, a new electric power generation modelwas added to WEPS+. It is a technology-basedstock/flow model using a least-cost solution tech-nique. The generation model has been expanded andenhanced for IEO2010.
•A new interface with the International Natural GasModel (INGM) has also been incorporated into theWEPS+ model.
The new detailed regional industrial model incorpo-rated into WEPS+ for IEO2010 looks at industrial energyuse in each of 8 industries in each of the 16 WEPS+regions. The overall energy activity in each of the 8industries is driven by regional forecasts of gross outputfor each industry from the macroeconomic model,which in turn are calibrated to the overall level of GDP ineach region. The new model uses a stock/flowapproach, looking at the energy intensity and fuel mixdistinctions between industrial capacity that is existing(and retired over time) versus capacity that is newlybuilt and added in each year.
WEPS+ now includes a detailed model of the world’stransportation sector, which provides projections by thefour transport modes: road, rail, water, and air. In addi-tion, a variety of submodes are represented, such aslight-duty vehicles and freight trucks. The model sepa-rates service demand (e.g., passenger-miles for cars,ton-miles for trucks) from service intensity (e.g., miles
U.S. Energy Information Administration / International Energy Outlook 2010 325

per gallon) and bases the service demand projections oneconomic and/or population growth and fuel prices.
The detailed regional power generation model thatwas new to WEPS+ last year has been significantlyimproved. It uses a stock/flow approach, keeping trackof electricity generating capacity, generation, and con-sumption within remaining, new, and added vintages.The model is technology-based, with a wide variety oftechnologies for fossil fuels along with their characteris-tics, such as costs and heat rates. The slate of technolo-gies has been updated and regionalized. The modelsolves for new capacity and generation in each year,based on the new generation requirements from theend-use demand models, after accounting for transmis-sion and distribution losses. The solution technique is aleast-cost market share, using levelized costs for eachtechnology within various load segments based on thesystem load shape. The overall system load shape isbuilt from sectoral load shapes fitted to annual loadsfrom each of the demand models.
A new refinery model determines the regional retailprices for a variety of products by sector, based on theworld oil price. The new refinery model uses the conceptof marginal refineries in three international regions. Themarginal refineries determine the refinery-gate (whole-sale) prices for a variety of products, based on the priceof crude oil entering the refinery. Wholesale prices forthe WEPS+ regions are determined on the basis of trans-portation cost, and historical markups are then used todetermine retail prices for each sector in each region.
The Reference case reflects the underlying relationshipsincorporated in the complete set of models interactingwith each other in supply/demand relationships com-municated through macroeconomic variables, prices,and consumption. The system of models is run itera-tively to a point at which prices and consumption haveconverged to a reasonable equilibrium. Accumulatedknowledge from the results of other complex modelsthat focus on specific supply or demand issues and ana-lysts’ expert judgments also are taken into account andincorporated into the final projections. After the Refer-ence case has been established, WEPS+ is used to runalternative cases that reflect different assumptions aboutfuture economic growth and energy prices. WEPS+ alsocan be used for other analyses, such as the effects of car-bon prices.
The Generate World Oil Balance (GWOB) application isused to create a “bottom up” projection of world liquidssupply—based on current production capacity, plannedfuture additions to capacity, resource data, geopoliticalfactors, and oil prices—and to generate conventionalcrude oil production cases. The scenarios (Oil Pricecases) are developed through an iterative process of
examining demand levels at given prices and consider-ing price and income sensitivity on both the demandand supply sides of the equation. Projections of conven-tional liquids production for 2009 through 2015 arebased on analysis of investment and developmenttrends around the globe. Data from EIA’s Short-TermEnergy Outlook are integrated to ensure consistencybetween short- and long-term modeling efforts. Projec-tions of unconventional liquids production are based onexogenous analysis.
Ten major streams of liquids production are tracked on avolume basis: (1) crude oil and lease condensate, (2) nat-ural gas plant liquids, (3) refinery gains, (4) Canadian oilsands, (5) extra-heavy oils, (6) coal-to-liquids, (7) gas-to-liquids, (8) shale oils, (9) ethanol, and (10) biodiesel.Biofuels are tracked on both a volume basis and an oilequivalent basis. All liquid fuels are reported in physicalvolumes, unless otherwise stated.
The IEO2010 projections of global natural gas produc-tion and trade were generated from EIA’s INGM, whichestimates natural gas production, demand, and interna-tional trade for 60 detailed regions globally. It combinesestimates of natural gas reserves, natural gas resourcesand resource extraction costs, energy demand, andtransportation costs and capacity in order to estimatefuture production, consumption, and prices of naturalgas.
INGM incorporates regional by-fuel energy consump-tion projections from the WEPS+ model, as well as moredetailed U.S. projections from EIA’s National EnergyModeling System (NEMS), which is used to generateU.S. energy projections for the Annual Energy Outlook(AEO). An iterative process between INGM and WEPS+is used to balance world natural gas markets, withINGM providing supply curves to WEPS+ and receivingdemand estimates developed by WEPS+. INGM usesregional natural gas demand estimates from NEMS forthe United States rather than those computed as part ofthe WEPS+ output, so that the final output for theUnited States is consistent with projections that appearin the AEO.
INGM uses a linear program to simulate the global natu-ral gas and LNG markets. The linear program combinesmultiple activities at different locations and optimizesthem to determine a market equilibrium for each year ofthe simulation, while maximizing the cumulative dis-counted sum of producer and consumer surplus.Regions that currently show noncompetitive features orhave internal constraints that will affect future marketsare captured by limiting their ability to increase keyasset capacities in the future. Restricting assets provideshard constraints on a region’s ability to produce andexport natural gas.
326 U.S. Energy Information Administration / International Energy Outlook 2010

Appendix M
Regional Definitions
The six basic country groupings used in this report(Figure M1) are defined as follows:
•OECD (18 percent of the 2010 world population):North America—United States, Canada, andMexico; OECD Europe—Austria, Belgium, CzechRepublic, Denmark, Finland, France, Germany,Greece, Hungary, Iceland, Ireland, Italy, Luxem-bourg, the Netherlands, Norway, Poland, Portugal,Slovakia, Spain, Sweden, Switzerland, Turkey, andthe United Kingdom. OECD Asia—Japan, SouthKorea, Australia, and New Zealand.40
•Non-OECD (82 percent of the 2010 world popula-tion):
- Non-OECD Europe and Eurasia (5 percent of the2010 world population)—Albania, Armenia, Azer-baijan, Belarus, Bosnia and Herzegovina, Bulgaria,Croatia, Cyprus, Estonia, Georgia, Kazakhstan,Kyrgyzstan, Latvia, Lithuania, Macedonia, Malta,
Moldova, Montenegro, Romania, Russia, Serbia,Slovenia, Tajikistan, Turkmenistan, Ukraine, andUzbekistan.
- Non-OECD Asia (53 percent of the 2010 worldpopulation)—Afghanistan, American Samoa, Ban-gladesh, Bhutan, Brunei, Cambodia (Kampuchea),China, Cook Islands, Fiji, French Polynesia, Guam,Hong Kong, India, Indonesia, Kiribati, Laos,Macau, Malaysia, Maldives, Mongolia, Myanmar(Burma), Nauru, Nepal, New Caledonia, Niue,North Korea, Pakistan, Papua New Guinea,Philippines, Samoa, Singapore, Solomon Islands,Sri Lanka, Taiwan, Thailand, Timor-Leste (EastTimor), Tonga, U.S. Pacific Islands, Vanuatu, Viet-nam, and Wake Islands.
- Middle East (3 percent of the 2010 world popula-tion)—Bahrain, Iran, Iraq, Israel, Jordan, Kuwait,Lebanon, Oman, Qatar, Saudi Arabia, Syria, theUnited Arab Emirates, and Yemen.
U.S. Energy Information Administration / International Energy Outlook 2010 327
KeyOECD
Non-OECD AsiaMiddle EastAfricaCentral and South America
Non-OECD Europe and Eurasia
Figure M1. Map of the six basic country groupings
Source: Energy Information Administration, Office of Integrated Analysis and Forecasting.
40 For consistency, OECD includes all members of the organization as of March 1, 2010, throughout all the time series included in thisreport. Chile became a member on May 7, 2010, but its membership is not reflected in IEO2010.

- Africa (14 percent of the 2010 world population)—Algeria, Angola, Benin, Botswana, Burkina Faso,Burundi, Cameroon, Cape Verde, Central AfricanRepublic, Chad, Comoros, Congo (Brazzaville),Congo (Kinshasa), Côte d’Ivoire, Djibouti, Egypt,Equatorial Guinea, Eritrea, Ethiopia, Gabon, TheGambia, Ghana, Guinea, Guinea-Bissau, Kenya,Lesotho, Liberia, Libya, Madagascar, Malawi, Mali,Mauritania, Mauritius, Morocco, Mozambique,Namibia, Niger, Nigeria, Reunion, Rwanda, SaoTome and Principe, Senegal, Seychelles, SierraLeone, Somalia, South Africa, St. Helena, Sudan,Swaziland, Tanzania, Togo, Tunisia, Uganda,Western Sahara, Zambia, and Zimbabwe.
- Central and South America (7 percent of the 2010world population)—Antarctica, Antigua and Bar-buda, Argentina, Aruba, The Bahamas, Barbados,Belize, Bolivia, Brazil, British Virgin Islands, Cay-man Islands, Chile, Colombia, Costa Rica, Cuba,Dominica, Dominican Republic, Ecuador, El Salva-dor, Falkland Islands, French Guiana, Grenada,Guadeloupe, Guatemala, Guyana, Haiti, Hondu-ras, Jamaica, Martinique, Montserrat, NetherlandsAntilles, Nicaragua, Panama, Paraguay, Peru,Puerto Rico, St. Kitts-Nevis, St. Lucia, St. Vincent/Grenadines, Suriname, Trinidad and Tobago,Turks and Caicos Islands, Uruguay, U.S. VirginIslands, and Venezuela.
In addition, the following commonly used countrygroupings are referenced in this report:
•European Union (EU): Austria, Belgium, Bulgaria,Cyprus, Czech Republic, Denmark, Estonia, Finland,France, Germany, Greece, Hungary, Ireland, Italy,Latvia, Lithuania, Luxembourg, Malta, the Nether-lands, Poland, Portugal, Romania, Slovakia,Slovenia, Spain, Sweden, and the United Kingdom.
•Organization of the Petroleum Exporting Countries(OPEC): Algeria, Angola, Ecuador, Iran, Iraq,Kuwait, Libya, Nigeria, Qatar, Saudi Arabia, theUnited Arab Emirates, and Venezuela.
•Persian Gulf Countries: Bahrain, Iran, Iraq, Kuwait,Oman, Qatar, Saudi Arabia, and the United ArabEmirates.
•Arabian natural gas producers: Bahrain, Kuwait,Oman, United Arab Emirates, and Yemen.
•Non-OECD Developed Asia: Hong Kong, Macau,Singapore, and Taiwan.
•Non-OECD Asia LNG exporters: Brunei, Indonesia,Malaysia, and Papua New Guinea.
•Central and South America northern producers:Colombia, Ecuador, Trinidad and Tobago, andVenezuela.
328 U.S. Energy Information Administration / International Energy Outlook 2010