international development and early learning … · literacy, emergent numeracy, socio-emotional...
TRANSCRIPT

INTERNATIONAL DEVELOPMENT AND EARLY LEARNING ASSESSMENT (IDELA) BASELINE STUDY REPORT, BINGA - ZIMBABWE
NOVEMBER 14, 2018

i
Contents
Acknowledgements ................................................................................................................................. ii
List of Acronyms ..................................................................................................................................... iii
Executive Summary ................................................................................................................................. v
1.0 Introduction ...................................................................................................................................... 1
1.1 Background ................................................................................................................................... 1
1.2 Context .......................................................................................................................................... 1
1.3 Study Objectives ........................................................................................................................... 2
1.4 Key Research Questions ................................................................................................................ 2
2.0 Study Design & Methodology ........................................................................................................... 3
2.1 Baseline Design ............................................................................................................................. 3
2.2 Methodology ................................................................................................................................. 3
2.2.1 Sampling methods ................................................................................................................. 3
2.2.2 Sample size ............................................................................................................................. 4
2.2.3 Data collection methods and Instruments ............................................................................ 4
2.3.4 Data entry and analysis .......................................................................................................... 4
2.3 Study Procedure ........................................................................................................................ 4
2.4 Limitations ..................................................................................................................................... 5
3.0 Study Results ..................................................................................................................................... 6
3.1 Characteristics of Children sampled ............................................................................................. 6
3.2 Sample by gender and ECCD type ................................................................................................. 6
3.3 IDELA Domains .............................................................................................................................. 7
3.3.1 Gross and Fine Motor Development ...................................................................................... 7
3.3.2 Emergent Numeracy .............................................................................................................. 8
3.3.3 Emergent Literacy and Language ........................................................................................... 8
3.3.4 Socio- Emotional Development ............................................................................................. 9
3.3.5 Executive Function ................................................................................................................. 9
3.3.6 Approaches to learning ........................................................................................................ 10
3.3.7 IDELA Scores by ECCD type .................................................................................................. 10
3.3.7 IDELA Scores by Gender ....................................................................................................... 11
4.0 Conclusion & Recommendations .................................................................................................... 11
4.1 Conclusion ................................................................................................................................... 11
4.2 Recommendations ...................................................................................................................... 11
Annex 1: List of schools covered .............................................................. Error! Bookmark not defined.

ii
Acknowledgements
This study has been made possible with the support of Save the Children Zimbabwe. Special thanks
goes to the study team comprised of the Ministry of Education and Ministry of Health Binga district
staff who led the field work into schools and the various school authorities and children who
participated in this study. The JF Kapnek Trust appreciates the support rendered to the team from
Save the Children staff in particular Abraham Mudefi and Teddy Sigwadi. This report has been a
coordinated effort by Hillary Tanyanyiwa, Albert Pasipanodya, Sipiwe Siakakuwa and Brian Damba
from JF Kapnek Trust.

iii
List of Acronyms
DEO Department of Education
ECCD Early Childhood Education and Development
ELM Early Literacy and Math
IDELA International Development and Early Learning Assessment
MoPSE Ministry of Primary and Secondary Education
SV Save the Children
iv
List of Figures Figure 1: Core IDELA Items ...................................................................................................................... 2
Figure 2: The quasi-experimental design ................................................................................................ 3
Figure 3: Study procedure followed........................................................................................................ 5
Figure 4: Gender characteristic of sampled children .............................................................................. 6
Figure 5: IDELA Literacy and language skills ........................................................................................... 8
Figure 6: IDELA Socio- Emotional skills ................................................................................................... 9
Figure 7: IDELA average baseline scores by ECCD type ........................................................................ 10
Figure 8: IDELA scores by gender .......................................................................................................... 11
List of Tables Table 1: Sample by gender and ECCD type ............................................................................................. 6
Table 2: IDELA Domains analysed ........................................................................................................... 7
Table 3: IDELA motor skills ...................................................................................................................... 7
Table 4: IDELA literacy skills .................................................................................................................... 8
Table 5: IDELA executive functioning skills by group .............................................................................. 9
Table 6 IDELA Approaches to learning skills ......................................................................................... 10

v
Executive Summary The JF Kapnek Trust is implementing a project aimed at enhancing the quality of Early Childhood Care
and Development in Binga District in partnership Save the Children Zimbabwe. This project involves
the piloting of Early Literacy and Math (ELM) model in 20 impact schools in Binga district of Zimbabwe.
A baseline survey was conducted using the International Development and Early Learning Assessment
(IDELA) tool to assess the pre-project conditions for the children enrolled under the ELM domains. A
quasi-experimental study design was adopted with all 20 intervention ECD centres being selected and
corresponding 20 control schools matched for the baseline assessment. A random sampling
methodology was used to select children at each centre form a predetermined estimated sample size
of 394. The results of the study showed that Children in impact centres have stronger skills than
children in control ECCD centres however there is no statistically significant difference between the
two at baseline. In gross motor skills, children in impact schools had greater skills in coping a shape
(62%) as compared to control centres (42%) whilst no statistically significant difference was observed
under the Numeracy domain. Children in impact centres however demonstrated increased skills in
shape identification (44%) than in control centres (31%). Children in intervention centres had higher
scores in Literacy than in control groups demonstrating a statistically significant difference in print
awareness (29% compared to 17%). There was no observed differences in socio-emotional
development and executive function between the intervention and control groups. Significant
differences were however observed under the approaches to learning, with the intervention centres
demonstrating better approaches to learning (71%) compared to the control groups (62%). The results
also showed that there are no significant differences between boys and girls in both control and
intervention centres.

1 | P a g e
1.0 Introduction
1.1 Background Save the Children is implementing a project aimed at enhancing the quality of Early Childhood Care
and Development in Binga District of Zimbabwe in partnership with The J F Kapnek Trust. The project
involves the piloting of model which emphasis Early Literacy and Math (ELM) in 20 impact schools in
Binga district. A baseline survey was conducted using the International Development and Early
Learning Assessment (IDELA) tool to assess the pre-project conditions for the children enrolled at the
20 intervention and 20 control schools. The assessment will measure the children’s early learning,
school readiness and development and provide evidence of the effectiveness of the ELM strategy in
improving results for ECD level children.
1.2 Context Early Childhood Development (ECD) Zimbabwe made enrolment in Early Childhood Development
(ECD) centres government policy in 2004. Over the last few years, there has been a steady increase in
the ECD enrolment. In 2005, the Zimbabwean government introduced a policy (Statutory Instrument
No. 106 of 2005) mandating all government primary schools to introduce two years of ECD education
before entry into primary school. In line with the Commission of Inquiry into Education and Training’s
(CIET, 1999) main recommendation to democratize pre-school education, the Ministry of Primary and
Secondary Education (MoPSE) designed a two-phased, ten-year programme to establish ECD classes
at every primary school in the country. During Phase One (2005/6 to 2010), every primary school was
expected to attach at least one ECD class of 4-5 year olds, referred to as ECD ‘B’, to prepare them for
Grade One the following year. In Phase Two (2011 to 2015), every primary school would attach
another ECD class of 3-4 year olds to prepare them for ECD B.
Zimbabwe has made great strides to achieve Universal Primary Education. Over the years, more and
more marginalised children are getting access to basic education. However, there is very limited
knowledge about the existing status of children’s learning and development within ECD centres in
Zimbabwe. Save the Children (SC) in partnership with JF Kapnek Trust and is implementing the ECD
program in Binga District of Zimbabwe. The project involves the piloting of model which emphasis
Early Literacy and Math (ELM) in 20 impact schools in Binga district. A tool commonly known as
International Development and Early Learning Assessment (IDELA) was developed by SV and this tool
is used to measure ECCD children's developmental outcomes. This tool will be used to form a baseline
of children’s learning and development at beginning of the project and a final assessment of children
at the end of the school year.
IDELA is a direct child assessment which is intended to improve programs, policy and practice and
inspire investments. It comprises of six domains focused on gross and fine motors skills, emergent
literacy, emergent numeracy, socio-emotional development, executive control and approaches to
learning. Figure 1 below shows the core IDELA items which will be included in this study.

2 | P a g e
Figure 1: Core IDELA Items
1.3 Study Objectives The baseline was done to facilitate the systematic monitoring and evaluation of the project by
establishing the pre-ELM intervention conditions against which future changes amongst the target
group can be evaluated.
1.4 Key Research Questions The key questions of the study were as follows;
1. What can the baseline tell us about children’s emergent learning and development skills?
What does this mean for programming?
2. How comparable are children in impact (intervention) ECCD centres versus control centres
in terms of learning and development skills based on ELM criteria?
3. What is the background home learning environment? What does this mean for effectively
targeting our learning and development program?
Motor Development Fine and gross motor skills: Hoping; Copying shape; folding paper; Drawing
Emergent Literacy Print awareness; Expressive vocabulary; Letter identification; Emergent writing; Phonemic awareness Oral comprehension
Emergent Numeracy Size/length identification; Sorting ; Number identification; Shape identification ; One-to-one correspondence; Simple operations ;Puzzle completion
Socio-emotional Development Friends; recognizing emotions in self; Recognizing emotions in others; Conflict resolution; Personal information
Learning Approaches
Execu
tive Fun
ction

3 | P a g e
2.0 Study Design & Methodology
2.1 Baseline Design This is a quasi-experimental study which was used for the baseline study forming a 'control' group for
assessment of 'counterfactual'. Even though this study does not meet all requirements for
experimental design, the design has been made to ensure that there is enough ground to have
indicative comparison between 'project' and 'non-project' sites. The individuals/areas where the
intervention is currently undergoing were selected purposively (without any form of random
assignment) based on their proximity to the intervention centres. Thus half of the centres surveyed
were assigned to intervention (impact schools) and half to the comparison group.
The design used is double differences whereby new enrolled children in ECD are tested at the
beginning of the academic calendar. They will again be tested after end of the academic session for
the endline. The tests will happen at the 'control' as well as 'counterfactual' sites. At the end,
comparison will be made between baseline and endline figures across treatment and control groups
to determine whether ECD related interventions had any influence on the children's learning and
development. The figure below depicts the design
Figure 2: The quasi-experimental design
2.2 Methodology This section outlines sampling methods, size, data collection and analysis methods to be used in the
study. The baseline was based on the IDELA test including children with disability.
2.2.1 Sampling methods
All the (20) intervention centres were included in the study and a corresponding 20 comparisons
schools were purposefully selected based on their proximity to the intervention centres. This was
essential to ensure that the study and the control groups depict almost the same characteristics except
the interventions. At each of the centres were data was collected, 10 children were randomly selected
Control Group (Baseline)
No intervention
Endline Status (Control)
Intervention Group (Baseline)
Intervention
Endline Status (Control)
Improvement = Change
in Intervention – Change
in Control

4 | P a g e
from the ECD A class. At 3 of the centres, the children were not adding up to 10 and all of them were
selected. The method also involved convenience sampling to select caregivers.
2.2.2 Sample size
Based on a population estimate of 3484, a confidence level of 95% and 5% confidence interval, a
sample size of 340 was required. The final sample for this study was 364 children attending ECCD
centres below the age of 6, divided between 20 ECCD centres set to receive the ELM Intervention and
20 in the comparison group. Control ECD centres were identified through consultation with the MoPSE
district schools inspector (DSI), School Development Committees (SDCs) and caregivers. A total of 138
caregivers were interviewed from the intervention and comparison communities and these were
equally shared.
2.2.3 Data collection methods and Instruments
The data collection started with assessor training
and pilot at a school not in the intervention and
control. During the pilot, assessors worked
through all the data collection tools, including the
parent/principal consent and child assent. A
session on ethics was included in the training of
assessors and team leaders were chosen from the
trained assessors. An interview method was used
for both the children and the caregivers by
trained enumerators. In the case of children,
assessors worked in pairs and individually with
caregivers. IDELA child assessment tool was used
with the children whilst the caregiver questionnaire was administered to the caregivers.
2.3.4 Data entry and analysis
Data was collected manually and entered into IDELA Kobo collect mobile application files. Files were
then exported to Excel and SPSS for analysis. Analysis was done using MS Excel IDELA templates and
SPSSv23 to compute summary of variables. Data analysis includes the comparability of children in
the Intervention and comparison samples through the comparison of means through t-tests with
clustered standard errors to account for the grouping of student-level data within schools.
2.3 Study Procedure
The IDELA issues were explained and contextualized by JF Kapnek M&E department. Intensive 3 day
training was conducted by JF Kapnek during the last week of June and it aimed at capacitating 12
enumerators on IDELA data collection methodology resulting in and delivering a comprehensive
question by question analysis of the child and caregiver data collection tools. The training also
provided an opportunity to conduct a pre-data collection exercise as part of on-job training. The data
collection in Binga lasted for 10 working days. The trained local enumerators were then grouped into
4 teams to cover the IDELA data collection in and each team had a team leader for 4 each group. Figure
3 below shows the study procedure followed throughout the study.

5 | P a g e
Figure 3: Study procedure followed
2.4 Limitations There were a number of limitations during the study. There were sensitisation/logistical challenges
due to poor network – one of the schools stalled the data collection process requesting authorisation
letter from the DSI despite the presence of MoPSE, another school was chosen instead for the day’s
deliberations to occur. The targeted children were not all reached due to bad weather (cold) which
resulted in non-attendance of the ECD children at some of the schools. For example only 5 children
were present at the day of the visit in a class of 19 children. Also the 2 targeted schools had cluster
sporting activities so ECD could not attend on that particular day which also affected the sample size.
The other limitation factor is at 3 of the centres, the children were not adding up to 10 thus all of them
were selected to participate.
Review of documents
Pre-test and pre-finalize the
tools
Hire and train local
enumerators
Field
testing
Finalize
tools
Data Collection, Entry and sample
check
Data cleaning and Analysis Reporting
6 | P a g e
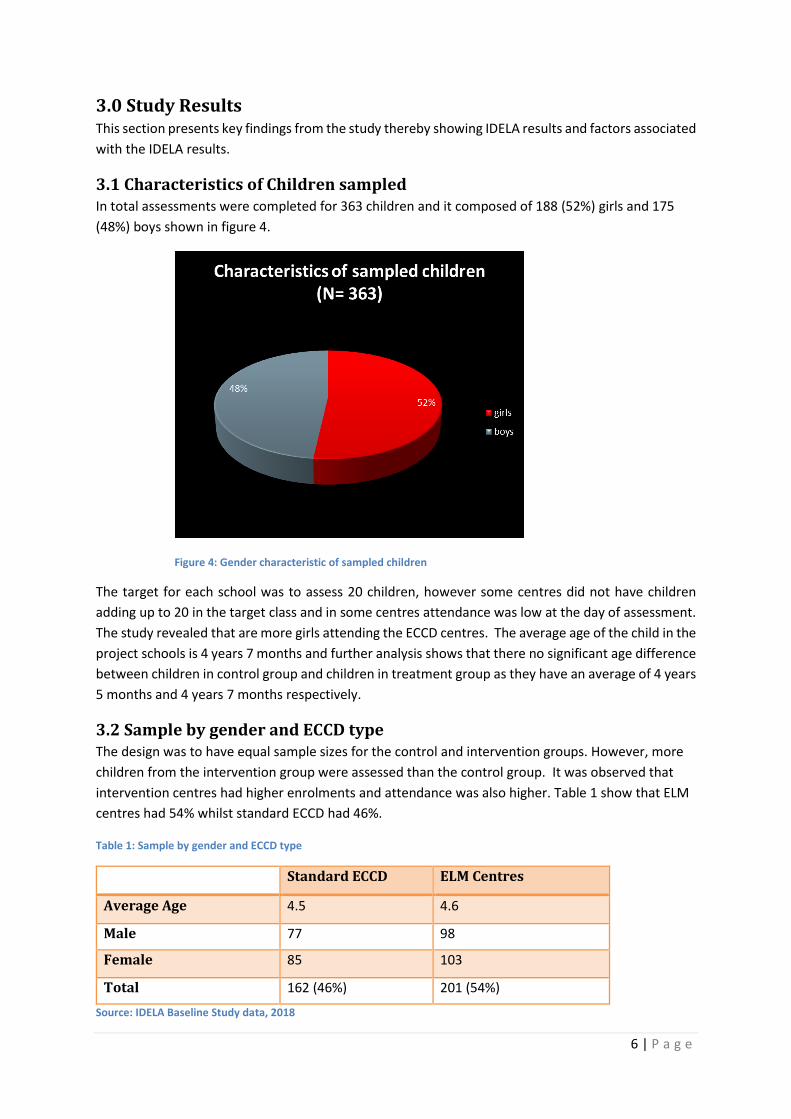
3.0 Study Results This section presents key findings from the study thereby showing IDELA results and factors associated
with the IDELA results.
3.1 Characteristics of Children sampled In total assessments were completed for 363 children and it composed of 188 (52%) girls and 175
(48%) boys shown in figure 4.
Figure 4: Gender characteristic of sampled children
The target for each school was to assess 20 children, however some centres did not have children
adding up to 20 in the target class and in some centres attendance was low at the day of assessment.
The study revealed that are more girls attending the ECCD centres. The average age of the child in the
project schools is 4 years 7 months and further analysis shows that there no significant age difference
between children in control group and children in treatment group as they have an average of 4 years
5 months and 4 years 7 months respectively.
3.2 Sample by gender and ECCD type The design was to have equal sample sizes for the control and intervention groups. However, more
children from the intervention group were assessed than the control group. It was observed that
intervention centres had higher enrolments and attendance was also higher. Table 1 show that ELM
centres had 54% whilst standard ECCD had 46%.
Table 1: Sample by gender and ECCD type
Standard ECCD ELM Centres
Average Age 4.5 4.6
Male 77 98
Female 85 103
Total 162 (46%) 201 (54%)
Source: IDELA Baseline Study data, 2018

7 | P a g e
3.3 IDELA Domains This section will describe children’s performance on the direct child assessment, with a focus on
differences between the skills of children in the two study groups. Total domain scores are calculated
by adding the weighted score of each item in the domain so that all items contribute equally to the
domain score. The total IDELA score is calculated by adding the weighted score of each item and
dividing by the total number of items so that all items contribute equally to the total score. The table
below shows the domains that were analysed.
Table 2: IDELA Domains analysed
Gross and Fine Motor Development
Emergent Numeracy
Emergent Literacy and Language
Social emotional Development
Executive Functioning
Hopping on one foot
Measurement Print Awareness Self-awareness Short-term Memory
Drawing a Person
Sorting Letter ID Social connections
Inhibitory controls
Folding Shape ID Expressive Vocabulary
Emotional awareness
Copying a shape
Number ID Oral Comprehension
Empathy
One-to-one correspondence
Phonemic Awareness
Conflict resolution
Simple operations
Writing
Puzzle
3.3.1 Gross and Fine Motor Development
Generally, motor scores were on the higher side except in task of drawing a person and folding a
paper. For ELM ECCD centres, the motor score was higher with 61% as compared to 53% of Standard
ECCD. Children had better score in hoping on one foot and copying a shape. There was a significant
difference in score related to motor skills for ELM ECCD centres and Standard ECCD centres.
Table 3: IDELA motor skills
Standard ECCD
ELM ECCD Centre
Significant Difference
Average Total
Hopping on one foot
81% 83% 82%
Drawing a person
46% 50% 48%
Folding 44% 51% * 48%
Copying a shape
42% 62% *** 53%
Total Motor Development
53% 61% *** 58%
Source: IDELA Baseline Study Data, 2018 (363 observations)
*p<0.05 **p<0.01 ***p<0.001

8 | P a g e
3.3.2 Emergent Numeracy
There were seven sub-tests contained within the emergent numeracy skills. Generally the scores on
emergent numeracy were also remained on lower side except measurement sub-test. Figure 5 shows
that children scored highest on measurement (84%) and lowest on puzzle (8%). There was no
significant difference between Standard ECCD and ELM ECCD centre.
Figure 5: IDELA Literacy and language skills
3.3.3 Emergent Literacy and Language
There were six sub-tests included within the emergent literacy with the scores generally on the lower
side. There was significant difference between Standard ECCD and ELM ECCD in emergent literacy
score that is 23% and 27% respectively. The children scored highest marks in oral comprehension and
lowest marks in letter ID.
Table 4: IDELA literacy skills
Standard ECCD
ELM ECCD Centre
Significant Difference
Average Total
Print Awareness 17% 29% *** 23%
Letter ID 1% 1% 1%
Expressive Vocabulary
34% 38% 36%
Oral Comprehension
41% 44% 43%
Phonemic Awareness
8% 9% 8%
Writing 38% 44% 41%
Total early Literacy
23% 27% *** 25%
Source: IDELA Baseline Study Data, 2018 (363 observations) *p<0.05 **p<0.01 ***p<0.001

9 | P a g e
3.3.4 Socio- Emotional Development
The social emotional development domain comprised of five sub- tests. Data in figure 6 shows that on
average children scored highest on self-awareness (54%) and lowest on empathy (15%). There was no
significant difference in scores on socio-emotional development by ECCD type that is between
Comparison ECCD and ELM ECCD centre.
Figure 6: IDELA Socio- Emotional skills
3.3.5 Executive Function
The child assessment also included the items related to the executive function. These items draw
emphases on how children process information as opposed to learned skills like letter or number
identification, and underlie children’s ability to learn new information. The test included sub-tests on
short-term memory, and inhibitory control. Table 5 shows that students scored higher on short term
memory (53%) and lower on inhibitory control (28%). There was no significant difference in executive
functioning score by ECCD type (Standard ECCD and ELM ECCD) and gender (girls and boys).
Table 5: IDELA executive functioning skills by group
Standard ECCD
ELM ECCD Centre
Significant Difference
Total
Short-term memory
50% 55% 53%
Inhibitory controls
25% 30% 28%
Total Executive Function
38% 43% 40%

10 | P a g e
3.3.6 Approaches to learning
As a method to measure children’s learning approaches, assessors were asked to rate children on a
number of dimensions immediately after the assessment was completed. The approaches to learning
were excluded calculation of aggregate IDELA score. The children had generally a score slightly a higher
than half that is 67%. There was significant difference between Standard ECCD and ELM ECCD in terms
of approaches to learning.
Table 6 IDELA Approaches to learning skills
Standard ECCD
ELM ECCD Centre
Significant Difference
Total
Persistence during assessment
64% 71% 68%
Observation post assessment
60% 70% 65%
Total Approaches to Learning
62% 71% *** 67%
*p<0.05 **p<0.01 ***p<0.001
3.3.7 IDELA Scores by ECCD type
The total IDELA score was calculated by combining scores on motor skills, early literacy, early
numeracy, socio-emotional development, and executive function. The learning approaches score
were not included in the total IDELA score since it was based on the assessor observation. The total
IDELA score was on a lower side (36%). The aggregate IDELA score for control ECCD centre was 34%
whilst for intervention it was 38%. There was no significant difference by ECCD type (control and
treatment). Generally, intervention centres had better IDELA score than control group.
Figure 7: IDELA average baseline scores by ECCD type

11 | P a g e
3.3.7 IDELA Scores by Gender
The girls in ECCD centres had generally better IDELA score compared to boys that is 47% and 45%
respectively. Further analysis in the sub-skills shows that boys only had better score (31%) than girls
(28%) on socio-emotional. There was no significant difference between on IDELA score by gender
(boys and girls).
Figure 8: IDELA scores by gender
4.0 Conclusion & Recommendations
4.1 Conclusion The baseline study using the IDELA tool indicated that the existing level of child learning and
development is poor especially on the literacy skill. The IDELA score for the children is 36%. Overall,
children’s skills are weakest in the area of literacy (26%), followed by social-emotional development
(30%) and numeracy (32%). Children in ELM (Impact) centres have stronger skills than children in
control ECCD centres however there is no statistically significant difference between the two and also
there is no significant difference with regards to gender.
4.2 Recommendations The study recommends the following based on the conclusion;
Repeat analysis at endline to test whether there is differential learning between boys and
girls over the two years.
Concentrate on the skills with low scores that is literacy, socio-emotional development and
numeracy.

12 | P a g e
Focus on learning gains in these areas at endline to see where both ELM and standard ECCD
programs have strengths and weaknesses in supporting children’s learning.