international data on youth and media 2017 data on youth and... · international data on youth and...
TRANSCRIPT
© International Central Institute for Youth and Educational Television (IZI) © International Central Institute for Youth and Educational Television (IZI)
International Data on Youth and Media
2017
Current surveys and research compiled by
Heike vom Orde (IZI) and Dr. Alexandra Durner
Page 1
© International Central Institute for Youth and Educational Television (IZI)
Overview
Media Use, Media Ownership and Importance of Media 3 Children, Adolescents and Television 22 Reading to Children, Children’s Use of Print Media 40 Internet and Social Media 50 Adolescents and Mobile Media (Mobile Phone, Smartphone, Tablet) 70
Page 2
© International Central Institute for Youth and Educational Television (IZI) © International Central Institute for Youth and Educational Television (IZI)
Media Use, Media Ownership and Importance of Media
Page 3

© International Central Institute for Youth and Educational Television (IZI) Page 4
Media ownership in parents‘ homes in Britain
By age of children, UK, 2015, selection (percentages)
Basis: n=1,379 parents of 5- 15-year-olds; n=688 parents of 3- to 4-year-olds.
Source: Ofcom: Children and Parents 2015, pp. 34/36.
77
56
70
80 75
40
82
73 75 81 81
43
86 83
74 77
81
41
89
80
72
79 80
41
0
10
20
30
40
50
60
70
80
90
100
3-4 years 5-7 years 8-11 years 12-15 years

© International Central Institute for Youth and Educational Television (IZI) Page 5
Media ownership in the homes of 0- to 8-year-olds
0-8 years, USA, 2013 (percentages)
Basis: n=1,463 parents of 0- to 8-year-olds. Source: Common Sense Media: Zero to Eight 2013, pp. 31/33.
9
36
3
22
21
27
28
35
63
69
70
76
78
0 20 40 60 80 100
Kindle/Nook/Ebook Reader
Video iPod/similar device
Digital video recorder (DVR)
Handheld video game player
Video game console
High-Speed internet
Cable/Satellite TV
Computer
DVD/VCR Player
At home In the bedroom

© International Central Institute for Youth and Educational Television (IZI) Page 6
Media ownership and media equipment by family income
13-18 years, USA, by parental income, 2015, selection (percentages)
Basis: n=1,462, 13-18 years. Source: Common Sense Media: Media Use by Tweens and Teens 2015, p. 17.
78
62
92
51
25
54
0 20 40 60 80 100
Ownership of personalsmartphone
Ownership of personal laptop
Laptop at home
Low income (less than 35.000 Dollar per year) High income (100,000 Dollar and more per year)

© International Central Institute for Youth and Educational Television (IZI) Page 7
Media in Australian homes
14-25 years, Australia, 2015, selection (percentages)
Basis: n=2,000, 14-68+ years. Source: Deloitte: Media Consumer Survey 2015, Australien, p. 33.
74
56
67
67
89
92
80
0 20 40 60 80 100
Game console
Blu-ray-Disc-Player/DVD-Player
Tablet-PC
Computer
Smartphone
Laptop
TV (flat screen)

© International Central Institute for Youth and Educational Television (IZI) Page 8
Personal media ownership of British youth
5-16 years, UK, 2016, selection (percentages)
Basis: n=1,936, 5-16 years. Source: CHILDWISE: The monitor report, 2017, Section 1.
83
67
39
0
10
20
30
40
50
60
70
80
90
100
Computer Tablet Laptop/notebook

© International Central Institute for Youth and Educational Television (IZI) Page 9
Media access of young people in Sierra Leone
15-24 years, Sierra Leone, 2015, selection (percentages)
Basis: n=813, 15-24 years. Source: Wittels/Maybanks, 2016, p. 37.
15.2
23
50.6
81.4
82.5
0 20 40 60 80 100
Newspaper
Internet
TV
Radio
Mobile phone
© International Central Institute for Youth and Educational Television (IZI) Page 10
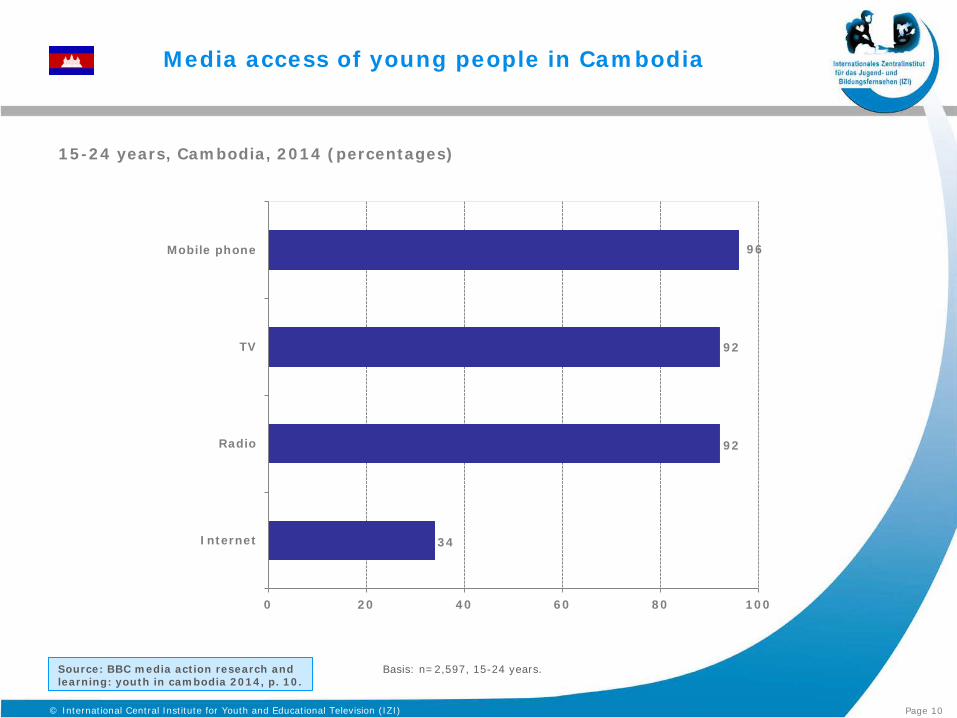
Media access of young people in Cambodia
15-24 years, Cambodia, 2014 (percentages)
Basis: n=2,597, 15-24 years. Source: BBC media action research and learning: youth in cambodia 2014, p. 10.
34
92
92
96
0 20 40 60 80 100
Internet
Radio
TV
Mobile phone

© International Central Institute for Youth and Educational Television (IZI) Page 11
Personal media ownership of adolescents
By age, 12-19 years, Switzerland, 2014, selection (percentages)
Basis: n=1,041, 12-19 years. Source: Swisscom/zhaw: James-Studie 2014, p. 16.
3
10
12
16
24
34
21
44
42
63
55
70
75
99
18
12
19
36
34
42
64
42
52
32
54
64
78
98
0 20 40 60 80 100
Blu-ray-Player
Magazine subscription
DVD-Player
TV
Tablet
(Hifi)Stereo
Video game console
Radio
Handheld video game console
Digital camera
Internet access
MP3-Player/iPod
Computer/Laptop
Mobile phone
Boys Girls

© International Central Institute for Youth and Educational Television (IZI) Page 12
Media ownership of young people in France
By age, 7-19 years, France, 2015, selection (percentages)
Basis: n=4,000, 1-19 years. Source: Ipsos: Junior Connect‘ 2015, p. 17.
29
41
68
73
73
29
17
12
74
20
0 20 40 60 80 100
Tablet-PC
TV
Smartphone
Games console
Computer
7-12 years 13-19 years

© International Central Institute for Youth and Educational Television (IZI) Page 13
How much time do children in the USA spend with media?
According to parents‘ response By age group of children, USA, 2014, selection (minutes/day)
Basis: n=1,577 parents with children between 2 and 10 years old.
Source: The Joan Ganz Cooney Center: Learning at home, 2014, p. 14.
81
17 14 14
80
3 2
10
78
20 15 14
84
27 25
18
0
10
20
30
40
50
60
70
80
90
100
TV Video games Computer Mobile media
In total 2- to 4-year-olds 5- to 7-year-olds 8- to 10-year-olds

© International Central Institute for Youth and Educational Television (IZI) Page 14
How much time do young people in Scandinavia spend with media?
13-29 years, 2015, selection (minutes/day)
Basis: n=4,000 13-29-year-olds.
Source: NRK Analyse: Medienbruk i Norge - Oppsummeringen 2015, p. 16.
82 87
75 71
110
122 115
136 142
124
114
126
0
20
40
60
80
100
120
140
160
Danmark Norway Finland Sweden
TV Smartphone PC

© International Central Institute for Youth and Educational Television (IZI) Page 15
Which media do Canadian children and adolescents use on a daily basis?
9-18 years, Canada und Quebec, 2014, selection (percentages)
Basis: n=1,040, 9-18 years, Quebec and Canada. Source: Shaw Rocket, Fund: Media and Tech-nology Habits of Canadian Youth, 2014, p. 12.
89
34
41
46
39
39
79
63
53
47
40
35
0 10 20 30 40 50 60 70 80 90 100
TV
Smartphone
Laptop
Tablet
Computer
Games console
Canada (without province Quebec) Quebec
© International Central Institute for Youth and Educational Television (IZI) Page 16
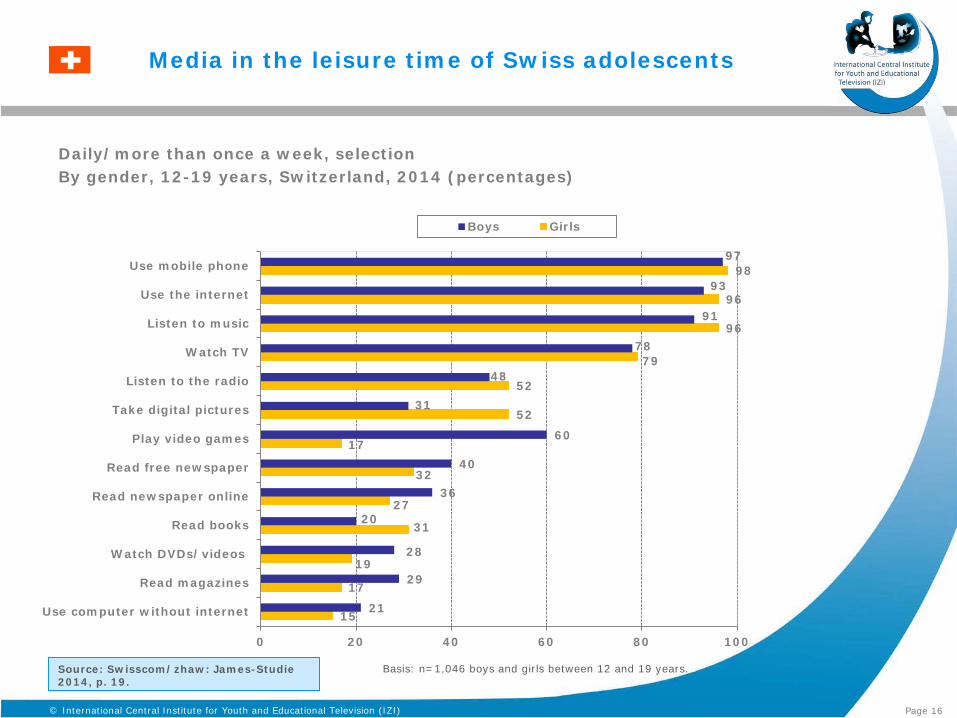
Media in the leisure time of Swiss adolescents
Daily/more than once a week, selection By gender, 12-19 years, Switzerland, 2014 (percentages)
Basis: n=1,046 boys and girls between 12 and 19 years. Source: Swisscom/zhaw: James-Studie 2014, p. 19.
15
17
19
31
27
32
17
52
52
79
96
96
98
21
29
28
20
36
40
60
31
48
78
91
93
97
0 20 40 60 80 100
Use computer without internet
Read magazines
Watch DVDs/videos
Read books
Read newspaper online
Read free newspaper
Play video games
Take digital pictures
Listen to the radio
Watch TV
Listen to music
Use the internet
Use mobile phone
Boys Girls
© International Central Institute for Youth and Educational Television (IZI) Page 17
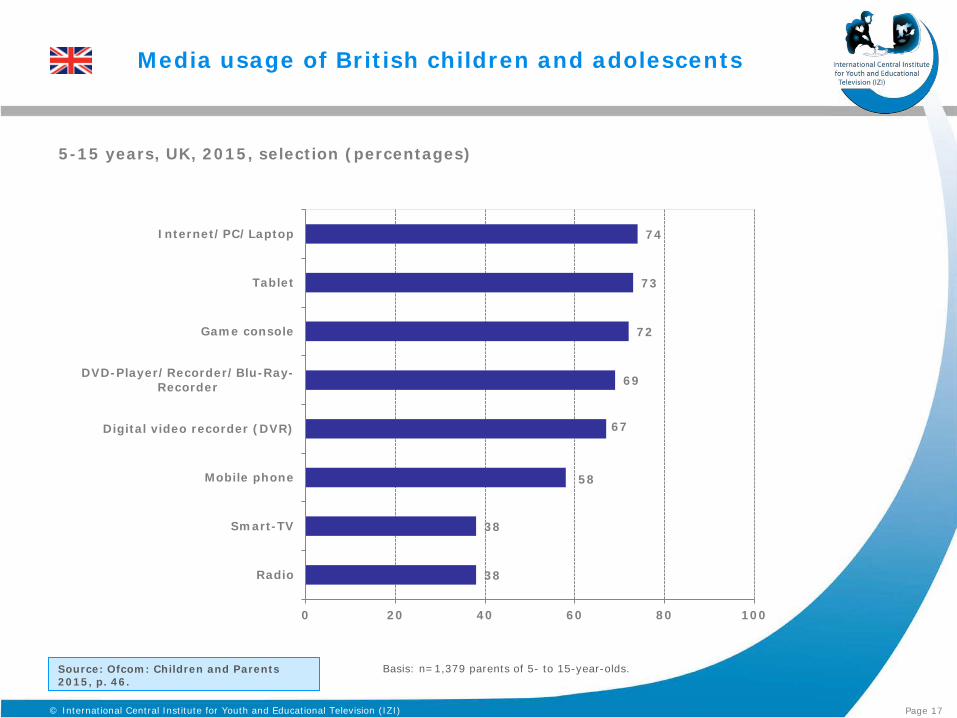
Media usage of British children and adolescents
5-15 years, UK, 2015, selection (percentages)
Basis: n=1,379 parents of 5- to 15-year-olds. Source: Ofcom: Children and Parents 2015, p. 46.
38
38
58
67
69
72
73
74
0 20 40 60 80 100
Radio
Smart-TV
Mobile phone
Digital video recorder (DVR)
DVD-Player/Recorder/Blu-Ray-Recorder
Game console
Tablet
Internet/PC/Laptop

© International Central Institute for Youth and Educational Television (IZI) Page 18
Being attached to media: What are the most important media to young people?
“I could not do without …“ 5-15 years, UK, 2014, selection (percentages)
Basis: n=1,379 children and adolescents, 5-15 years. Source: Ofcom: Children and Parents 2015, p. 71.
6
6
10
17
21
36
0 10 20 30 40 50
… books/magazines/comics
… PC/Laptop
… game console
… tablet
… mobile phone
… TV

© International Central Institute for Youth and Educational Television (IZI) Page 19
Which media do teens in Cambodia use daily?
15-24 years, Cambodia, 2014 (percentages)
Basis: n=2,597, 15-24 years. Source: BBC media action research and learning: youth in cambodia 2014, p. 10.
40
54
66
70
0 20 40 60 80 100
Internet
Radio
Mobile phone
TV

© International Central Institute for Youth and Educational Television (IZI) Page 20
Daily media activities of teens in New Zealand
6-14 years, media usage at home, 2015, selection (percentages)
Basis: n=708, 6-14 years. Source: NZ On Air/BSA/Colmar Brunton: Children‘s Media Use Study 2015, p. 24.
25
51
52
74
0 20 40 60 80 100
Listen to the radio
Internet
Listen to music
Watch TV
© International Central Institute for Youth and Educational Television (IZI) Page 21
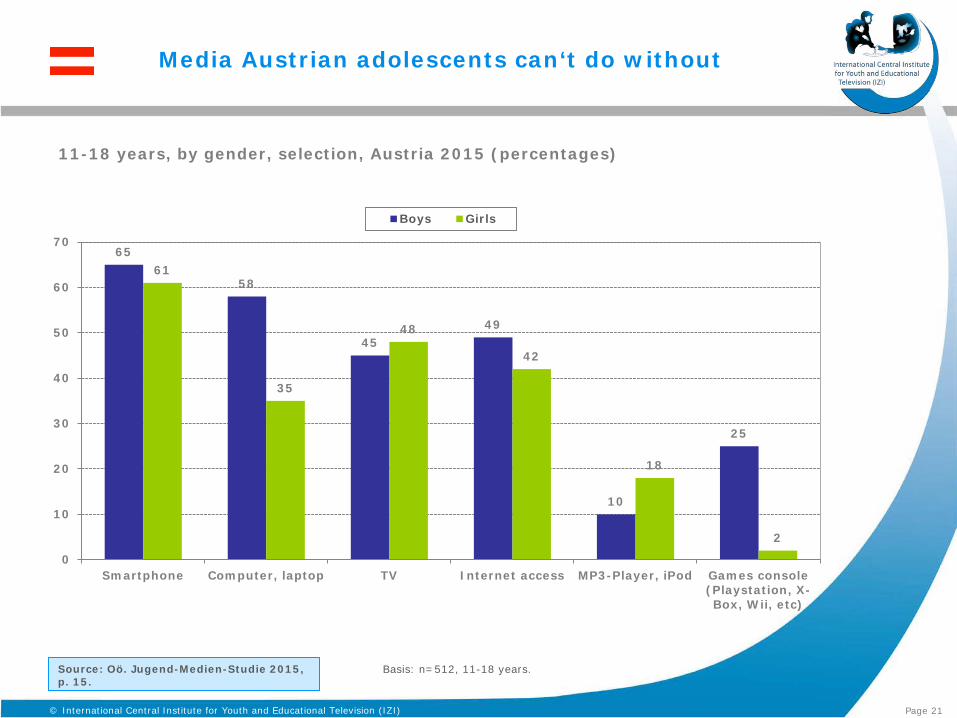
Media Austrian adolescents can‘t do without
11-18 years, by gender, selection, Austria 2015 (percentages)
Basis: n=512, 11-18 years.
Source: Oö. Jugend-Medien-Studie 2015, p. 15.
65
58
45 49
10
25
61
35
48
42
18
2
0
10
20
30
40
50
60
70
Smartphone Computer, laptop TV Internet access MP3-Player, iPod Games console(Playstation, X-Box, Wii, etc)
Boys Girls

© International Central Institute for Youth and Educational Television (IZI) © International Central Institute for Youth and Educational Television (IZI)
Children, Adolescents and
Television
Page 22

© International Central Institute for Youth and Educational Television (IZI) Page 23
International comparison: TV viewing time of children
Daily viewing time, North America, Europe, Australia, 2014 (minutes)
Basis: Eurodata TV Worldwide.
Source: Eurodata TV worldwide: Children´s international hits and TV consumption patterns 2015, p. 4.
200
128 120
0
20
40
60
80
100
120
140
160
180
200
220
North America Europe Australia

© International Central Institute for Youth and Educational Television (IZI) Page 24
Development of TV viewing time of European children
Average viewing time in minutes per day, Germany, France, Spain, Italy, UK, 2008-2012
Basis: Eurodata TV Worldwide/Kids TV Report 2012-2013 issues/Relevant Partners.
Source: Eurodata TV Worldwide: International Kids‘ TV Trends, 2013, p. 5.
129 130 137 138 136
0
20
40
60
80
100
120
140
2008 2009 2010 2011 2012

© International Central Institute for Youth and Educational Television (IZI) Page 25
At what time are most children watching TV?
2013 (percentages)
Basis: Eurodata TV Worldwide/Kids TV Report 2012-2013 issues/Relevant Partners.
Source: Eurodata TV: International Kids‘ TV Trends 2013, p. 7.
0
5
10
15
20
25
30
35UK Italy France

© International Central Institute for Youth and Educational Television (IZI) Page 26
2015 (percentages)
85
77 74
65
59
52
49 41
37 28
18
10
5 2 0 0 0
10
20
30
40
50
60
70
80
90
Before16:00
16:00 16:30 17:00 17:30 18:00 18:30 19:00 19:30 20:00 20:30 21:00 21:30 22:00 22:30 23:00
At what time do children stop watching TV in New Zealand ?
Source: NZ On Air/BSA/Colmar Brunton: Children's Media Use Study 2015, p. 30.
Basis: n=463, 6-14 years; everyone who watched TV the day before the survey.

© International Central Institute for Youth and Educational Television (IZI) Page 27
How much time do young people in Asia spend in front of the TV?
Daily TV viewing time, 6-14 years, Indonesia/Malaysia/Singapore/Thailand/Vietnam, 2016, selection (percentages)
Basis: n=1,824, 6-14 years. Source: SuperAwesome Kids‘ Media Snapshot: ASEAN, 2016.
13
51
29
7
1 0
10
20
30
40
50
60
less than 1 hour 1-2 hours 3-4 hours more than 4 hours Not watching TV

© International Central Institute for Youth and Educational Television (IZI) Page 28
Viewing time by age group in Finland
Daily TV viewing time, by age group, Finland, 2015, selection (in minutes)
Basis: Finnpanel Oy, TAM. Source: Finnpanel: Television viewing in Finland 2015, p. 13.
62 67
141
201
224
280
0
50
100
150
200
250
300
4-14 years 15-24 years 25-44 years 45-54 years 55-64 years over 65 years

© International Central Institute for Youth and Educational Television (IZI) Page 29
How much time do British preschoolers spend in front of the TV?
According to parents, average viewing time 2016 (hours/day)
Basis: 0-4 years, n=1,005. Source: CHILDWISE: Pre-school-Report 2016, p. 16.
2.4
2.6 2.6
0
0,5
1
1,5
2
2,5
3
2014 2015 2016
.
.
.

© International Central Institute for Youth and Educational Television (IZI) Page 30
Watching shows/videos with different types of devices
9-18 years, comparison Canada and Quebec, 2014, selection (percentages)
Basis: n=1,040, 9-18 years, Quebec und Kanada. Source: Shaw Rocket, Fund, Media and Tech-nology Habits of Canadian Youth 2014, p. 20.
17
17
26
24
34
39
80
24
27
33
35
41
55
71
0 20 40 60 80 100
Via smartphone
Via Apple TV or Smart TV
Via games console
Connecting a computer/laptop to the TV
On tablet
On computer/laptop
TV (cable, satellite)
Canada (without province Quebec) Quebec

© International Central Institute for Youth and Educational Television (IZI) Page 31
How do adolescents divide the TV viewing time between the web and stationary TV?
By age group, hours/week, Sweden, 2014, selection
Basis: n=2,801, 16-76+ years; n=250 adolescents, 11-15 years, and 250 parents.
Source: .se: Svenskarna och internet 2014, p. 69.
4.1 3.7
2.9
6.9 7.2
9.5
0
1
2
3
4
5
6
7
8
9
10
12-15 years 16-25 years 26-35 years
Web TV Stationary TV

© International Central Institute for Youth and Educational Television (IZI) Page 32
Multitasking: What do young Australians do while watching TV?
Multitasking, 14-25 years, Australia, 2015, selection (percentages)
Source: Deloitte: Media Consumer Survey 2015, Australien, p. 25.
Basis: n=2,000, 14-68+ years.
21
24
25
27
39
47
49
0 10 20 30 40 50 60
Microblogging (e.g. Twitter, Tumblr)
Playing video games
Reading emails
Searching for products and offers online
SMS
Surfing the internet
Using social networks

© International Central Institute for Youth and Educational Television (IZI) Page 33
Young Canadians like to see relevant, unique, aspirational characters in TV shows
9-18 years, Canada and Quebec, 2014, selection (percentages) “Keeps me interested in a show”
Basis: n=1,040, 9-18 years, Quebec and Canada. Source: Shaw Rocket, Fund, Media and Tech-nology Habits of Canadian Youth 2014, p. 31.
65
65
41
57
59
53
75
64
59
59
57
52
0 20 40 60 80
Characters have a unique, different personality.
Show is based on real life situations that I canrelate to.
Characters' personality is something I aspire to
I learn something every time I watch it.
Have strong moral values that I relate to.
Characters are the same age or in the same grade.
Canada (without province Quebec) Quebec

© International Central Institute for Youth and Educational Television (IZI) Page 34
The most popular TV genres of children
Worldwide, Europe and selected countries (worldwide, Europe, France, Portugal, Sweden), 2014 (percentages)
Basis: Eurodata TV Worldwide.
Source: Eurodata TV Worldwide: Children‘s international hits and TV consumption patterns 2015, p. 9.
66
50
75
35
20 18
25
15
60
25
16
25
10
5
65
0
10
20
30
40
50
60
70
80
Worldwide Europe France Portugal Sweden
Animation Live-Action Factual Entertainment

© International Central Institute for Youth and Educational Television (IZI) Page 35
Popular TV genres of young people in New Zealand
6-14 years, 2015, selection (percentages)
Basis: n=708, 6-14 years. Source: NZ On Air/BSA/Colmar Brunton: Children's Media Use Study 2015, p. 62.
10
13
15
17
25
0 5 10 15 20 25 30
TV shows with animals
TV shows
Drama/comedy (series)
Sports
Cartoons

© International Central Institute for Youth and Educational Television (IZI) Page 36
The most popular TV genres of Austrian adolescents
11-18 years, by gender, selection, Austria, 2015 (percentages)
Basis: n=512, 11-18 years. Source: Source: Oö. Jugend-Medien-Studie 2015, p. 19.
70
43
26
41
21
42
24
47 51
28
43
19
0
10
20
30
40
50
60
70
80
Action movies Comedys Series,Daily Soaps
Cartoons Castingshows Documentaries
Boys Girls

© International Central Institute for Youth and Educational Television (IZI) Page 37
Favourite TV programmes of Swiss adolescents
12-19 years, Switzerland, 2014, number of mentions, selection
Basis: n=1,086, 12-19 years. Source: Swisscom/zhaw: James-Studie 2014, p. 22.
134
91 83
65 62
49 41 39 38 34
0
20
40
60
80
100
120
140
160
How I metyour
mother
The BigBang
Theory
TheSimpsons
Navy CIS Grey'sAnatomy
HawaiiFive-O
Game ofThrones
TheMentalist
TheVampireDiaries
TheWalking
Dead

© International Central Institute for Youth and Educational Television (IZI) Page 38
The most popular TV programmes of preschoolers in New Zealand
2-5 years, parental answers, 2015, selection (percentages)
Basis: n=236, parents of 2- to 5-year-olds. Source: NZ On Air/BSA/Colmar Brunton: Children‘s Media Use Study 2015, p. 80.
3
3
4
10
11
0 5 10 15 20
Spiderman
Sesame Street
Thomas the Tank Engine
Peppa Pig
Dora the Explorer

© International Central Institute for Youth and Educational Television (IZI) Page 39
Disturbing TV content for children in New Zealand
9-14 years, by age, 2015, selection (percentages)
Basis: n=417, 9-14 years, TV user at home. Source: NZ On Air/BSA/Colmar Brunton: Children's Media Use Study 2015, p. 93.
18
13
10 10 9 9
17 16
10 11
12
7
19
9 10
9
7
13
0
2
4
6
8
10
12
14
16
18
20
9-14 years 9-11 years (n=226) 12-14 years (n=191)

© International Central Institute for Youth and Educational Television (IZI) © International Central Institute for Youth and Educational Television (IZI)
Reading to Children, Children‘s Use of Print Media
Page 40

© International Central Institute for Youth and Educational Television (IZI) Page 41
Parents‘ views on the importance of reading
USA, 2014 (percentages)
Reading is …
Basis: n=1,026 parents and 1,026 children between 6 and 17 years.
Source: Scholastic/YouGov: Kids & Family Reading Report 2014, p. 10.
45
41
12
1
15
30
40
14
0
5
10
15
20
25
30
35
40
45
50
… extremly important ... very important … a little important … not important
Parents Children

© International Central Institute for Youth and Educational Television (IZI) Page 42
How often do parents read to their children?
Parent survey, USA, 2014, selection (percentages)
Basis: n=1,532 parents of children between 0 and 17 years.
Source: Scholastic/YouGov: Kids & Family Reading Report 2014, p. 31.
52 55
34
17
2 3
30 20
25
12
8 5
9 15
21
17
7 6
8 8 18
30
18 15
0
10
20
30
40
50
60
70
80
90
100
0-2 years 3-5 years 6-8 years 9-11 years 12-14 years 15-17 years
less than once a week
1-2 days a week
3-4 days a week
5-7 days a week

© International Central Institute for Youth and Educational Television (IZI) Page 43
How many youth in the UK are frequent readers?
Read books for fun 5–7 days a week, by age groups, UK, 2015 (percentages)
Basis: n=703 6- to 17-year-olds.
54
43
24
17
0
10
20
30
40
50
60
6-8 years 9-11 years 12-14 years 15-17 years
Source: Scholastic/YouGov: Kids & Family Reading Report, United Kingdom 2015, p. 8.

© International Central Institute for Youth and Educational Television (IZI) Page 44
Children‘s views on the importance of reading
„How important is it to you to read (or look at) books for fun?“ UK, 2015 (percentages)
29
22
12 13
36 37
30
25
0
5
10
15
20
25
30
35
40
6-8 years 9-11 years 12-14 years 15-17 years
extremely important very important
Source: Scholastic/YouGov: Kids & Family Reading Report, United Kingdom 2015, p. 10.
Basis: n=703 6- to 17-year-olds.

© International Central Institute for Youth and Educational Television (IZI) Page 45
Reading habits of Americans
„I read (at least) one book in the past 12 months“ By age groups, USA, 2011/2012 (percentages)
Basis: n=2,252, 16 years and older. Source: Pew Research Center: Younger Americans‘ library habits and expectations 2013, p. 16.
86 88
76 81
77
68
90
79 81 77
72 67
0
10
20
30
40
50
60
70
80
90
100
16-17 years 18-24 years 25-29 years 30-49 years 50-64 years older than 65years
2011 2012

© International Central Institute for Youth and Educational Television (IZI) Page 46
The very favorite books of Swiss youth
12-19 years, Switzerland, 2014, selection, number of mentions
Basis: n=1,086, 12-19 years. Source: Swisscom/zhaw: James-Studie 2014, p. 21.
144
112
41 41 39 39 37 36
0
20
40
60
80
100
120
140
160
Harry Potter The HungerGames
Diary of awimpy Kid
Twilight Lord of theRings
PercyJackson
Eragon The fault inour stars

© International Central Institute for Youth and Educational Television (IZI) Page 47
Reading habits of Austrian adolescents
I like reading … 11-18 years, by gender, selection, Austria, 2015 (percentages)
Basis: n=512, 11-18 years. Source: Oö. Jugend-Medien-Studie 2015, p. 22.
16
34
22
19
6
33
39
12 11
3
0
5
10
15
20
25
30
35
40
45
… very much … much … not so much … not at all … never
Boys Girls

© International Central Institute for Youth and Educational Television (IZI) Page 48
Print or digital: What do young people prefer?
USA, 2014 (percentages)
Basis: n=641, 6-17 year-olds who have read an ebook.
55
11
34
0
10
20
30
40
50
60
Print book Ebook No preference
Source: Scholastic/YouGov: Kids & Family Reading Report 2014, p. 61.

© International Central Institute for Youth and Educational Television (IZI) Page 49
How many young people have read an ebook?
By age, UK, 2015 (percentages)
Basis: n=703 6- to 17-year-olds. Source: Scholastic/YouGov: Kids & Family Reading Report, United Kingdom 2015, p. 59.
43
40 41
47
44
0
10
20
30
40
50
In total 6-8 years 9-11 years 12-14 years 15-17 years

© International Central Institute for Youth and Educational Television (IZI) © International Central Institute for Youth and Educational Television (IZI)
Internet and Social Media
Page 50

© International Central Institute for Youth and Educational Television (IZI) Page 51
Internet access of children in Europe compared to children in Brazil
9-16 years, 2015, selection (percentages)
Basis: Brazil: n=2,261 children (9-17 years) and their parents; Europa: n=3,500 children (9-16 years).
72
36
52 56
91
79
89
43 43
59
69
61
0
10
20
30
40
50
60
70
80
90
100
Stationary Computer Laptop Mobile phone/smartphone
Brazil Denmark Rumania Italy
Source: EU Kids online: Children and Internet use, 2015, p. 9.

© International Central Institute for Youth and Educational Television (IZI) Page 52
Computer- and Internet access of young Americans by family income
Families with children between 6 and 13 years, USA, by income, 2016 (percentages)
Basis: n=1,191 families with low and middle income and 6- to 13-year-old children.
Source: Rideout/Katz: Opportunity for all? 2016, p. 9.
69
31
91
57
33
9
87
13
97
78
19
3
0
10
20
30
40
50
60
70
80
90
100
Computer in thehome
No computer inthe home
Any internetaccess
Home access Only mobileinternet access
No internetaccess
Income below poverty line Income above poverty line

© International Central Institute for Youth and Educational Television (IZI) Page 53
Internet access in Cambodia by demographic aspects
15-24 years, by gender, age and place of residence, Cambodia, 2014, selection (percentages)
Basis: n=2,597, 15-24 years. Source: BBC media action research and learning: youth in cambodia 2014, p. 21.
34
39
30
65
27
35 34
0
10
20
30
40
50
60
70
In total male female urban rural 15-19years
20-24years

© International Central Institute for Youth and Educational Television (IZI) Page 54
How often do Swedish children and adolescents use the internet?
By age, Sweden, 2014, selection (percentages)
Basis: n=2,801, 16–76+ years; n=250 teens, 11-15 years, and their parents; n=514 parents of children between 2 and 11 years.
Source: .se: Svenskarna och internet 2014, p. 11.
79
91
98 99 94
32
46
77
93 88
0
10
20
30
40
50
60
70
80
90
100
3-5 years 6-8 years 9-11 years 12-15 years 16-25 years
sometimes daily

© International Central Institute for Youth and Educational Television (IZI) Page 55
How much time do French children spend on the web?
1-19 years, by age, France, comparison 2012 and 2015, selection (minutes/week)
Basis: n=4,000, 1-19 years (for 1- to 6-year-olds, parents‘ responses were used).
Source: Ipsos: Junior Connect‘ 2015, p. 13.
220
330
810
130
290
740
0
100
200
300
400
500
600
700
800
900
1-6 years 7-12 years 13-19 years
2015 2012

© International Central Institute for Youth and Educational Television (IZI) Page 56
Europe: Where do young people go online?
9-16 years, 7 countries of the EU, 2015, selection (percentages)
Basis: n=3,500 Internet user (9-16 years) and their parents.
Source: EU Kids Online: Children and Internet Use, 2015, p. 7.
85
70 69 69
60 60
48
88 91
59
70
90 86 84
0
10
20
30
40
50
60
70
80
90
100
Denmark UK Rumania Italy Ireland Portugal Belgium
In my own room or another private room At home, but not in a private room

© International Central Institute for Youth and Educational Television (IZI) Page 57
Where do French children and adolescents go online?
9-16 years, France, 2012 (percentages)
Basis: n=1,000, 9-16 years, Internet user. Source: EU Kids Online, Risks and safety for children on the internet: The FR report 2012, p. 13.
3
7
11
41
43
49
52
79
0 20 40 60 80 100
At a cybercafé
At the library/in a publicspace
On the move
In their own room
At a relative's home
At a friend's home
At school
At home in the living room

© International Central Institute for Youth and Educational Television (IZI) Page 58
What British children and adolescents do while being online
Multitasking of 5- to 16-year-olds while they are online
UK, 2015 (percentages)
Basis: n=1,120, 5-16 years. Source: CHILDWISE: The monitor report, 2015, Section 1.
13
33
36
39
42
54
0 20 40 60 80 100
Reading a book
Playing with a gamesconsole
Using a mobile phone
Using apps
Watching TV
Listening to music

© International Central Institute for Youth and Educational Television (IZI) Page 59
What are Brazilian adolescents often doing on the internet?
Daily activities, 11-16 years, Brazil, 2015 (percentages)
Basis: ICT Kids Online survey, 11- to 16-year-olds who use the internet.
Source: EU Kids online: Children and Internet use 2015, p. 12.
37
26
20 20
29
57
43
36
28 24
57
35 33 32
30
0
10
20
30
40
50
60
Visiting socialnetworks
Searching forinformation/reading
the news
Instant messaging Watching video clips Playing computergames
11-12 years 13-14 years 15-16 years

© International Central Institute for Youth and Educational Television (IZI) Page 60
Internet usage of children and adolescents in New Zealand
6-14 years, Internet activities at home, 2015, selection (percentages)
Basis: n=708, 6-14 years. Source: NZ On Air/BSA/Colmar Brunton: Children's Media Use Study 2015, p. 29.
10
10
11
15
21
31
75
76
0 20 40 60 80 100
Stream music for free
Visit a TV show website
Streaming movies or TV shows forfree
Listen to music on sites like Spotifyor SoundCloud
Use Facebook
Watch TV shows and movies on theinternet
Watch YouTube
Play games

© International Central Institute for Youth and Educational Television (IZI) Page 61
Where to search for information online
12-19 years, Switzerland, 2014, selection (percentages)
Basis: n=854, 12-19 years. Source: Swisscom/zhaw: James-Studie 2014, p. 33.
23
39
53
89
86
80
23
45
45
83
73
83
25
31
35
73
78
74
16
15
18
55
75
77
0 20 40 60 80 100
News platforms of TV channels
Wikipedia
News websites of newspapers
Search engines
Social networks
Video platforms
12-/13-year-olds 14-/15-year-olds 16-/17-year-olds 18-/19-year-olds

© International Central Institute for Youth and Educational Television (IZI) Page 62
How many children and adolescents have a public profile at a social network?
9-16 years, countries of the EU, 2014, selection (percentages)
Basis: n=3,500, 9-16 years. Source: Mascheroni/Cuman: Net Children go mobile 2014, p. 18.
44
35
22 25
28
11 12
57
32
26 24
19 19
15
0
10
20
30
40
50
60
Rumania Italy Denmark Portugal Belgium UK Ireland
2010 2014
© International Central Institute for Youth and Educational Television (IZI) Page 63
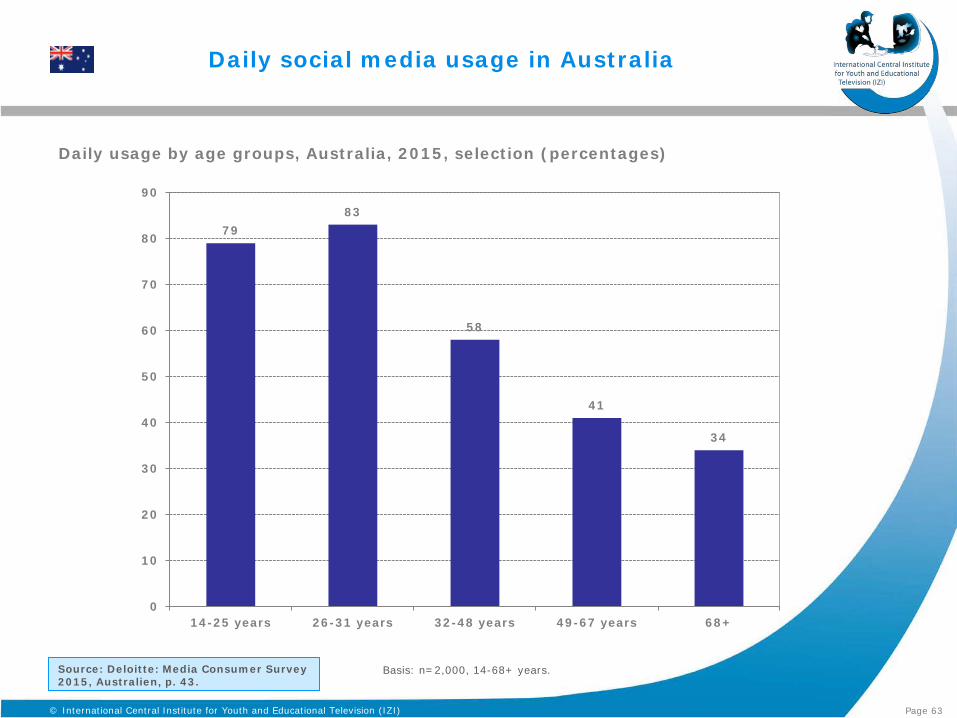
Daily social media usage in Australia
Daily usage by age groups, Australia, 2015, selection (percentages)
Source: Deloitte: Media Consumer Survey 2015, Australien, p. 43.
Basis: n=2,000, 14-68+ years.
79 83
58
41
34
0
10
20
30
40
50
60
70
80
90
14-25 years 26-31 years 32-48 years 49-67 years 68+

© International Central Institute for Youth and Educational Television (IZI) Page 64
What are adolescents doing in social networks?
By gender, Switzerland, 2014, selection (percentages)
Basis: n=950, 12- to 19-year-olds who have a profile in a social network.
Source: Swisscom/zhaw: James-Studie 2014, p. 47.
16
9
12
31
32
22
31
32
66
67
74
80
88
14
23
24
26
27
38
32
31
63
71
64
65
79
0 20 40 60 80 100
Connecting contacts
Playing games
Sharing music
Posting status updates
Posting on the timelines of friends
Posting/sharing videos
Searching for friends
Commenting on posts of contacts
Sending messages
Chatting
Using the "Like"-Button
Looking at friends' profiles
Looking at pictures
Boys Girls

© International Central Institute for Youth and Educational Television (IZI) Page 65
Children‘s and adolescents‘ responses to friends‘ requests on social networks sites
„I accept …“ 9-16 years, 7 European countries, 2014, selection, percentages
Basis: n=3,500, 9-16 years. Source: Mascheroni/Cuman: Net Children go mobile 2014, p. 17.
14
18
6
6
6
9
5
28
26
23
45
19
11
19
36
45
40
35
55
73
55
22
11
31
14
20
7
21
0% 20% 40% 60% 80% 100%
UK
Romania
Portugal
Italy
Ireland
Denmark
Belgium
… all requests … requests only if we have friends in common … requests only if I know the person … requests only if I know the person very well

© International Central Institute for Youth and Educational Television (IZI) Page 66
Which social media are American adolescents using the most?
13-17 years, USA, 2015, selection (percentages)
Basis: n=1,060, 13-17 years. Source: PEW Research Center: Teens, Social Media & Technology Overview 2015, p. 3.
71
52
41
33 33
24
0
10
20
30
40
50
60
70
80
Facebook Instagram Snapchat Twitter Google+ Vine

© International Central Institute for Youth and Educational Television (IZI) Page 67
Popular social media of French adolescents
13-19 years, France, 2015, selection (percentages)
Basis: n=4,000, 13-19 years. Source: Ipsos: Junior Connect‘ 2015, p. 19.
14
25
78
0 20 40 60 80 100

© International Central Institute for Youth and Educational Television (IZI) Page 68
How many children and adolescents have had negative experiences online?
9-16 years, countries of the EU, selection, 2014 (percentages)
Basis: n=3,500 9- to 16-year-olds who use the internet.
Source: European Commission (via www.Statista.com), 2015.
71
61
46
40 38
34 31
46
0
10
20
30
40
50
60
70
80
Denmark Rumania Italy Ireland Belgium UK Portugal In total

© International Central Institute for Youth and Educational Television (IZI) Page 69
Emotional well-being of social network user
“Using social networks makes me feel …“
13-17 years, USA, 2012 (percentages)
Basis: n=1,030, 13-17 years, who have a social networking site profile.
Source: Common Sense Media: Social Media, Social Life: How Teens View Their Digital Lives 2012, p. 10.
15
19
3
19
28
5
20
4
7
29
4
5
10
4
0 20 40 60 80 100
… better about myself
… sympathetic to others
… shy
… popular
… outgoing
… depressed
… confident
Less More

© International Central Institute for Youth and Educational Television (IZI) © International Central Institute for Youth and Educational Television (IZI)
Adolescents and Mobile Media (Mobile Phone, Smartphone,
Tablet)
Page 70

© International Central Institute for Youth and Educational Television (IZI) Page 71
Mobile phone access in Cambodia by demographic aspects
15-24 years, by gender, age and place of residence, Cambodia, 2014, selection (percentages)
Basis: n=2,597, 15-24 years. Source: BBC media action research and learning: youth in cambodia 2014, p. 18.
96 96 97 98
96 96 97
0
10
20
30
40
50
60
70
80
90
100
In total male female urban rural 15-19years
20-24years

© International Central Institute for Youth and Educational Television (IZI) Page 72
Ownership of a mobile phone in Africa: Comparison of two age groups in African countries
2014 (percentages)
Basis: Ghana n=1,000, Kenya n=1,015, Nigeria n=1,014, Senegal n=1,000, South Africa n=1,000, Tanzania n=1,016, Uganda n=1,007.
Source: Spring 2014 Global Attitudes survey, in: Pew Research Center 2015.
41
34
20 18
21
10
7
27
17
9 11
6 5
2
0
5
10
15
20
25
30
35
40
45
South Africa Nigeria Senegal Kenya Ghana Tanzania Uganda
18-34 years 35+ years
© International Central Institute for Youth and Educational Television (IZI) Page 73
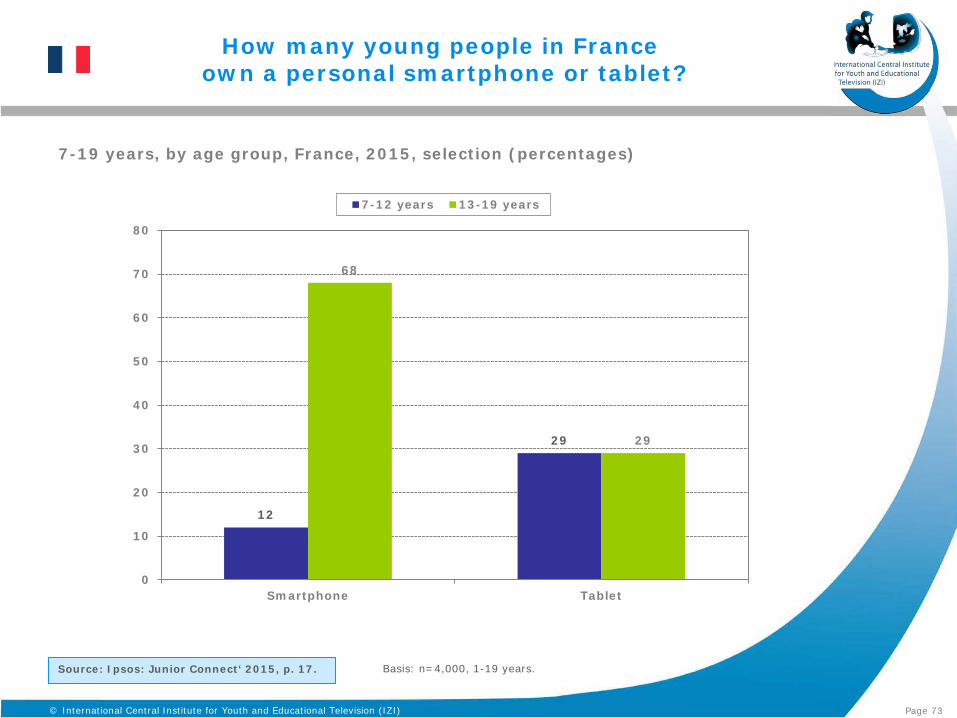
How many young people in France own a personal smartphone or tablet?
7-19 years, by age group, France, 2015, selection (percentages)
Basis: n=4,000, 1-19 years. Source: Ipsos: Junior Connect‘ 2015, p. 17.
12
29
68
29
0
10
20
30
40
50
60
70
80
Smartphone Tablet
7-12 years 13-19 years

© International Central Institute for Youth and Educational Television (IZI) Page 74
Sweden: Usage frequency of tablets
By age, Sweden, 2014, selection (percentages)
Source: .se: Svenskarna och internet 2014, p. 47.
26
39
49 54
46
29
21
14
63
72
81 79 77
70 67
51
0
10
20
30
40
50
60
70
80
90
3-4 years 5-6 years 7-8 years 9-10 years 11-12 years 13-14 years 15-16 years 17-18 years
Daily Sometimes
Basis: n=2,801, 16–76+ years; n=250 adolescents, 11-15 years, and their parents; n=514 parents of children between 2 and 11 years.

© International Central Institute for Youth and Educational Television (IZI) Page 75
International comparison: How many children are using smartphone and tablet daily?
9-16 years, 2014 (percentages)
Source: Mascheroni/Cuman: Net children go mobile 2014, p. 7.
Basis: n=3,500 internet user, 9-16 years.
26
37
27
12
31
4
32 28
72
35
42
35
21
56
0
10
20
30
40
50
60
70
80
Belgium Denmark Ireland Italy Portugal Rumania UK
Tablet Smartphone

© International Central Institute for Youth and Educational Television (IZI) Page 76
How often do Swedish children and adolescents use a smartphone?
By age, Sweden, 2014, selection (percentages)
Source: .se: Svenskarna och internet 2014, p. 17.
35
42
59
82
92 93
5 5
18
49
80 83
0
10
20
30
40
50
60
70
80
90
100
3-5 years 6-7 years 8-9 years 10-11 years 12-15 years 16-25 years
sometimes daily
Basis: n=2,801, 16–76+ years; n=250 adolescents, 11-15 years, and their parents; n=514 parents of children between 2 and 11 years.

© International Central Institute for Youth and Educational Television (IZI) Page 77
International comparison: How many children and adolescents access the internet via smartphone?
9-16 years, 2015 (percentages)
Basis: European countries: n=3,500 9-16 year-olds; Brazil: n=2,261 9-17 year-olds, and their parents; internet user.
Source: EU Kids Online: Children and Internet Use 2015, p. 9.
52
43
79
58 61 61
43
71
0
10
20
30
40
50
60
70
80
90
Brazil Belgium Denmark Ireland Italy Portugal Rumania UK

© International Central Institute for Youth and Educational Television (IZI) Page 78
What do young people in the USA do most often with smartphones?
8-18 years, USA, 2015, selection (percentages)
Basis: n=2,658, 8-18 years. Source: Common Sense Media: Media Use by Tweens and Teens 2015, p. 60.
40
40
23
22
22
0 5 10 15 20 25 30 35 40 45
Use social networks
Listen to music
Gaming
Watch videos online
Visit websites

© International Central Institute for Youth and Educational Television (IZI) Page 79
App-Gap: Parents with higher income download more apps for their child
Income per year in US-Dollar, 0-8 years, USA, 2013 (percentages)
Basis: n=1,463 parents of 0- to 8-year-olds. Source: Common Sense Media: Zero to Eight 2013, p. 29.
79
54
41
75
49
35
0
10
20
30
40
50
60
70
80
90
>75.000 30-75.000 >30.000
Have downloaded an app for their kid Have downloaded an educational app for their kid

© International Central Institute for Youth and Educational Television (IZI) Page 80
• BBC media action research and learning: youth in cambodia: media habits and information sources. 2014. URL: http://downloads.bbc.co.uk/mediaaction/pdf/research/cambodia_media_habits_research_report.pdf (last access: 26.07.2016).
• CHILDWISE: Pre-school-Report 2016. URL: http://www.childwise.co.uk/preschool.html (last access: 02.03.2017). • CHILDWISE: The monitor report 2015, Section 1. URL: http://www.childwise.co.uk/monitor.html (last access: 12.08.2016). • CHILDWISE: The monitor report 2016, Section 1. URL: http://www.childwise.co.uk/monitor.html (last access: 02.03.2017).
• Common Sense Media: Social Media, Social Life: How Teens View Their Digital Lives. 2012. URL: http://cdn2-d7.ec.commonsensemedia.org/sites/default/files/uploads/about_us/socialmediasociallife-final-061812.pdf (last access: 12.08.2016). • Common Sense Media: Zero to Eight. Children‘s Media Use in America 2013. URL: http://cdn2-d7.ec.commonsensemedia.org/sites/default/files/uploads/about_us/zero-to-eight-20131.pdf (last access: 12.08.2016). • Common Sense Media: The Common Sense Census: Media Use by Tweens and Teens. 2015. URL: https://www.commonsensemedia.org/research/the-common-sense-census-media-use-by-tweens-and-teens (last access: 13.04.2016). • Deloitte: Media Consumer Survey 2015. Australian media and digital preferences – 4th edition. URL: https://www.dropbox.com/s/wmi6g9atfz3rua1/Australia1.pdf?dl=0 (last access: 27.07.2016).
• EU Kids Online: Risks and safety for children on the internet: the FR report. 2012. URL: http://eprints.lse.ac.uk/46442/1/FranceReportEnglish.pdf (last access: 12.08.2016). • EU Kids Online: Children and Internet use: A comparative analysis of Brazil and seven European countries. 2015. URL: http://www.lse.ac.uk/media@lse/research/EUKidsOnline/EU%20Kids%20III/Reports/FullReportBrazilNCGM.pdf (last access: 12.04.2016). • Eurodata TV worldwide: Children´s international hits and TV consumption patterns 2015. URL: http://de.slideshare.net/EurodataTVWorldwide/childrens-international-hits-and-tv-consumption-patterns (last access: 12.04.2016).
Sources

© International Central Institute for Youth and Educational Television (IZI) Page 81
• Eurodata TV worldwide: International Kids‘ TV Trends. 2013.
URL: http://www.my-mip.com/en/resource-centre/ (last access: 12.08.2016).
• European Commission (über www.Statista. com). 2015. URL: http://de.statista.com/themen/31/europaeische-union-eu/ (last access: 12.08.2016). • Finnpanel: Television viewing in Finland 2015. URL: http://www.finnpanel.fi/lataukset/tv_year_2016.pdf (last access: 12.04.2016). • Ipsos: La conquete de l´engagement. 2015. URL: http://www.webaction.be/reseaux-sociaux/junior-connect-2015/ (last access: 27.07.2016). • Mascheroni, Giovanna/Cuman, Andrea: Net Children Go Mobile. Final Report November 2014. URL: http://netchildrengomobile.eu/reports/ (last access: 10.08.2015). • NRK Analyse: Mediebruk i Norge – Oppsummeringen 2015. URL: http://fido.nrk.no/3059e4aff03749086d752a93b64cee618921d5c7bc51bd87b2e07bd8703fef69/medier_norge_2015_nrk_analyse.pdf Auszüge zu finden auf : URL: http://www.nordicom.gu.se/en/media-trends/news/young-peoples-media-use-nordic-countries (last access: 13.04.2016). • NZ On Air/BSA/Colmar Brunton: Children´s Media Use Study. How our children engage with media today. 2015. URL: https://bsa.govt.nz/images/assets/Research/Childrens_Media_Report_2015_FINAL_for_publishing_2.pdf (last access: 03.08.2016).
• Ofcom: Children and Parents: Media Use and Attitudes Report 2015. URL: http://stakeholders.ofcom.org.uk/binaries/research/media-literacy/children-parents-nov-15/childrens_parents_nov2015.pdf (last access: 12.04.2016). . Oö. Jugend-Medien-Studie 2015. Charts Jugendliche. URL: https://www.edugroup.at/fileadmin/DAM/Innovation/Forschung/Dateien/Charts_Jugendliche_2015.pdf (last access: 12.08.2016). • Pew Reasearch Center: Younger Americans‘ library habits and expectations. 2013. URL: http://libraries.pewinternet.org/files/2013/06/PIP_Younger_Americans_and_libraries.pdf (last access: 10.08.2015).. • Pew Research Center: Cell Phones in Africa: Communication Lifeline, 2015, URL: http://www.pewglobal.org/2015/04/15/cell-phones-in-africa-communication-lifeline/ (last access: 22.07.2016).
Sources

© International Central Institute for Youth and Educational Television (IZI) Page 82
Sources
• Pew Reasearch Center: Teens, Social Media & Technology Overview 2015. URL: http://www.pewinternet.org/2015/04/09/teens-social-media-technology-2015/ (last access: 12.04.2016). • Rideout, V. J./Katz, V. S.: Opportunity for all? Technology and learning in lower-income families. New York: The Joan Ganz Cooney Center at Sesame Workshop 2016. URL: http://www.joanganzcooneycenter.org/wp-content/uploads/2016/01/jgcc_opportunityforall.pdf (last access: 12.04.2016).
• Scholastic/YouGov: Kids & Family Reading Report. 5th Edition. 2014. URL: http://www.scholastic.com/readingreport/Scholastic-KidsAndFamilyReadingReport-5thEdition.pdf?v=100 (last access: 12.04.2016).
• Scholastic/YouGov: Kids & Family Reading Report. United Kingdom. 2015. URL: http://images.scholastic.co.uk/assets/a/3f/36/kfrr-uk-fnl-11-1423200.pdf (last access: 12.04.2016) • .se Internetstatistik/Findahl: Svenskarna och internet 2014. URL: https://www.iis.se/docs/SOI2014.pdf (last access: 12.04.2016). • Shaw Rocket Fund: Media and Technology Habits of Canadian Youth, 2015. URL: http://www.rocketfund.ca/wp-content/uploads/2013/07/Youth-Media-Tech-ShawRocketFund-Sept19-2014.pdf (last access: 22.07.2016) • SuperAwesome: What you need to know about kids`digital behaviour in ASEAN. 2016. URL: https://blog.superawesome.tv/2016/01/13/infographic-what-you-need-to-know-about-kids-digital-behaviour-in-asean/#more-1496 (last access: 22.07.2016).
• Swisscom/zhaw Angewandte Psychologie: James. Jugend, Aktivitäten, Medien – Erhebung Schweiz. 2014. URL: http://www.jugendundmedien.ch/fileadmin/user_upload/Fachwissen/JAMES/Ergebnisbericht_JAMES_2014.pdf (last access: 12.08.2016). • The Joan Ganz Cooney Center: Learning at home. Families‘ educational media use in America. 2014. URL: http://www.joanganzcooneycenter.org/wp-content/uploads/2014/01/jgcc_learningathome.pdf (last access: 12.08.2016) • Wittels, Annabelle/Maybanks, Nick: Communication in Sierra Leone: An analysis of media and mobile audiences, 2016. URL: http://downloads.bbc.co.uk/rmhttp/mediaaction/pdf/research/mobile-media-landscape-sierra-leone-report.pdf (last access: 22.07.2016).