improving and demonstrating impact for youth using qualitative data
TRANSCRIPT

Using Qualitative DataIMPROVING AND DEMONSTRATING IMPACT FOR YOUTH

Today’s Major Topics What is qualitative data?
How can it be used to improve program
quality and demonstrate impact?
Tips for gathering qualitative data
Tips for analyzing and using qualitative data

What is qualitative data?How is it different from anecdotes? Driven by a learning question(s) Systematic in data collection and analysis Not “cherry-picking” the most compelling stories
Exploratory and explanatory – How? Why? In-depth descriptions and understandings Comparisons – before/after or this group vs. that group

11 ways to gather qualitative data1. Add a few open-ended questions to your
close-ended survey
2. Hold a focus group or “input session” with students, parents or teachers
3. Conduct a structured review of student journaling or work
4. Conduct in-depth interviews with selected participants or partners
5. Follow-up and interview past participants about how the program impacted them
6. Follow-up and talk with youth who dropped out of your program about why they left
7. Have students create maps (ideas: school, body, neighborhood)
8. Observe program activities using a rubric
9. Get feedback and reflections using post-it notes or flip charts
10. Do case studies or site reviews to answer key questions
11. Use a pile sorting technique (http://medanth.wikispaces.com/Pile+Sorting)
12. Other?


How can qualitative data be used to improve program quality and demonstrate impact?

Using the Data for ChangeINTERNALLY
1. Internal learning and program improvement – tighten strategy and program elements
2. Clarify your logic model
3. Engage staff, youth and partners in program quality improvement
4. Better understand your participants’ experiences and your impact on them
5. Narrow down what to measure quantitatively
EXTERNALLY
1. Telling your story to funders – both positive impact and direction for growth
2. Narrative to explain your program model and the story behind the numbers/metrics

1) Raise awareness that there are youth that don’t have it as easy as others because
they have to care for family members
2) Let caregiving youth know they are NOT alone
3) Offer opportunities for caregiving youth to be kids
4) Help caregiving youth learn how to trust others so we can ask for help when we need
it, to be more open about ourselves, to not be close-minded and to deal with stress
and negativity
Critical Moments of Change for as We Participated in CYP
Realizing you can ask for help
Not giving up on family
Actually getting help – both emotional and material
2
For further information or assistance, contact the Evaluation Research Team at [email protected]. You can also contact us via our w ebsite:
http://w w w .cdc.gov/healthyyouth/evaluation/index.htm.
Youth-Defined Logic Model for the Caregiving Youth Project
Goals of CYP
INPUTS
STRATEGIES/
ACTIVITIES
Emotional In School Group (anger
management, feeling understood)
Camp Treasure
Giving back to others Material
Back to School Bash Medical referrals for
family members Bright Smiles
Holiday Party
SHORT-TERM
OUTCOMES (after 6 months in CYP)
- Increased participation in
fun activities (vs. caregiving work)
- Increased participation in extracurricular activities at
school and in the community
- Reduction in stress and
anger
- Decrease in feeling alone and isolated
- Increase in number of
people caregiving youth
can turn to for help
INTERMEDIATE
OUTCOMES (after 1-2 years in CYP)
- Reduced likelihood of juvenile
justice involvement and/or violence/fighting
- Increased school attendance - Decrease in worry about family
needs
- Decrease in family conflict - Improved family
interactions/communication through better problem-solving
OUTPUTS
- Number of caregiving youth participating in: - School-based
support group - Camp Treasure
-Number of families who get material assistance through
- Referrals - Christmas/Holiday gifts
- Back to School Bash
LONG-TERM
OUTCOMES (after 4+ years in CYP)
- Realizing educational and
career goals
- Reduction in high school
dropout
- College attendance
- Able to give back to others, such as other caregivers to show them they are not alone
Data source to document accomplishment

When to bring in an external evaluator?
Need an external perspective and the objectivity an outside learning partner can provide
Have big overarching questions about the program model or effectiveness
Want to triangulate data from multiple sources
Want to go really in-depthWhen not appropriate for staff to
collect sensitive data

Tips for gathering qualitative data
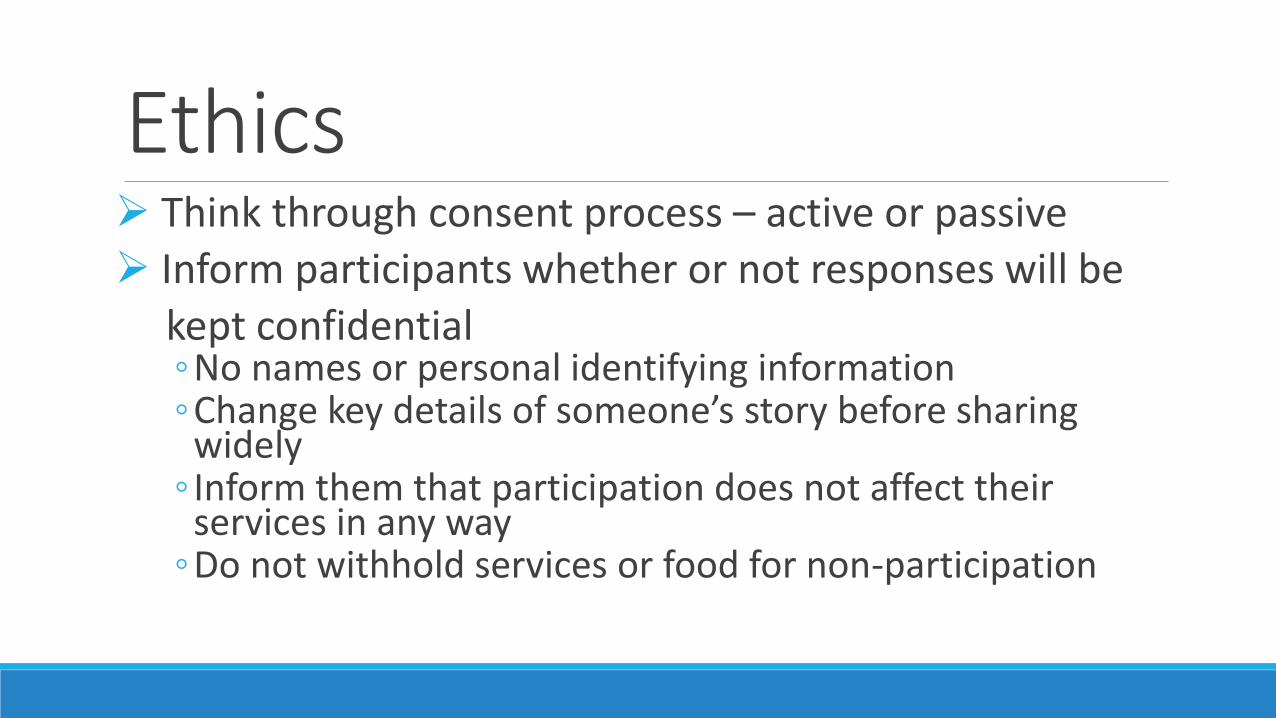
Ethics Think through consent process – active or passive
Inform participants whether or not responses will be
kept confidential◦No names or personal identifying information◦Change key details of someone’s story before sharing
widely◦ Inform them that participation does not affect their
services in any way◦Do not withhold services or food for non-participation

Designing Good Questions
Start with…
A key learning question

Determine Domains/Categories for Questions
1. Initial Experience Entering the Program
2. Program Components
3. Experience with the Staff
4. Experience with Other Youth Participants
5. Facility/Amenities
6. Youth’s Goals and Experiences Finding Opportunities and Resources to Meet Goals
7. Suggestions for Improving the Program

Designing Good Open-Ended Questions1) Evaluative and Balanced – Ask positive and negative
• In your own words, describe one thing that’s been most helpful to you in this program? How was it helpful to you?
• Describe one thing that could have been more helpful? How could it have been more helpful?
2) Get concrete experiences, not generalizations
• Describe one time when you…? In the last month…?
• How did you make that decision? Who influenced your decision and how?
3) Ask participants to describe a process or experience
• When you came into the program, what were your first experiences like?
• Tell me about the people who have helped you with preparing for college?

Opening vs. Closing the InterviewTry How, Avoid Why• Why did you go to college?
Instead…• Tell me about how you decided to go to college?
Neutral Interviewing Probes• Tell me more about X?• I heard you say X. What you mean by that?• What happened next?
Close-Ended Questions• Did you decide to go to college? (Yes/No)
Narrow Open-Ended Questions• If yes, which college did you decide to go to?
• What colleges did you consider?
Leading Questions and Probes• Did you like this aspect of our program?
• Is this program better than your last program?
• So, you think X, right?

95% Listening
5% Asking Questions
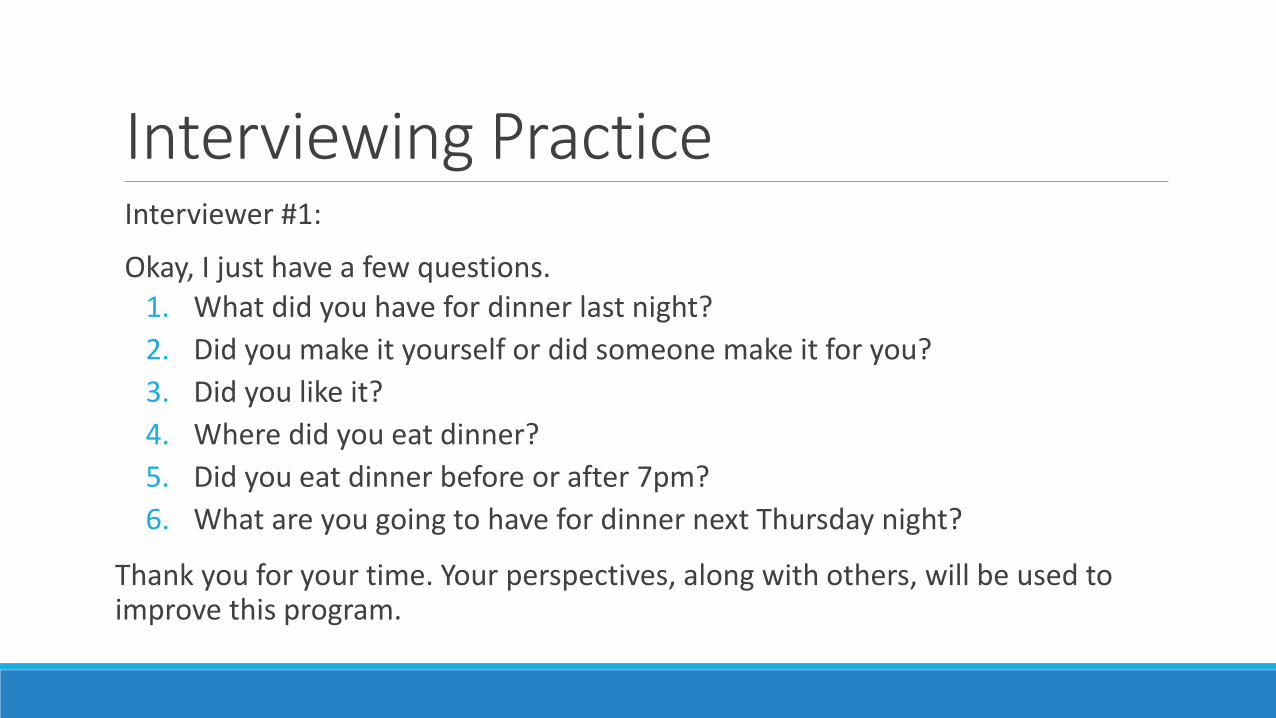
Interviewing PracticeInterviewer #1:
Okay, I just have a few questions.1. What did you have for dinner last night?
2. Did you make it yourself or did someone make it for you?
3. Did you like it?
4. Where did you eat dinner?
5. Did you eat dinner before or after 7pm?
6. What are you going to have for dinner next Thursday night?
Thank you for your time. Your perspectives, along with others, will be used to improve this program.

Interviewing PracticeInterviewer #2:
1. Tell me about how you decided what to have for dinner last night?
Probes:
• Tell me more about X?
• I heard you say X. Can you explain a bit more about what you mean by that?
• What happened next?

Tips for analyzing and using qualitative data

Use Technology to Manage DataOptions:
Survey Monkey
Microsoft Excel
Microsoft Word
Google Forms and Sheets
Mobile phone data collection
Resource:http://betterevaluation.org/blog/analyzing_data_using_common_software

Analysis Activity: Identifying themesDecide on a data analysis approach◦ Open coding
◦ Highs and lows/Positives and negatives/Strengths and areas for growth
◦ Critical moments of change
◦ Participatory analysis◦ Staff team
◦ Youth
◦ Interpretive focus groups to explain quantitative data
One approach to coding quickly is to use highlighters to code:
Blue = Going wellGreen = Need improvement, not going wellOrange = Suggestions for improving the program
Underline good illustrative quotes

Data Coding Steps1) Review data: Read the interview question and all the related data/text
2) Open code: Read the data again, but in the margin or in a matrix, jot down “codes” that identify the main themes. This means that you write down a one word or a short phrase – close to the person’s own words – that summarizes what is being communicated in response to the question. Try not to interpret the person’s words – but stick closely to what they said.
http://www.sage-ereference.com/view/research/n240.xml
3) Develop a coding scheme: Collapse and combine open codes into related themes. Make a coding scheme, which is a set of codes you will apply to all of the text. Example of codes: transportation, influential people, cost/affordability, anxiety/stress
4) Apply the codes to all of the text for your research question
4) Tally the number of responses for each code
5) Choose representative quotes for the themes you will write about in your report

Just because it’s qualitative data, doesn’t mean you get out of counting!

Presenting qualitative dataKey themes
Representative quotes
Photos to illustrate themes
Give the audience an idea of how many people expressed that idea◦“One-third of participants said that…”


Triangulating Qualitative & Quantitative DataCredit: Innovation Network, http://www.visualisingdata.com/index.php/2013/05/conquering-the-dusty-shelf-report-data-visualization-for-evaluation/

Body Map: WHAT IS YOUTH CAREGIVING LIKE? Caregiving can be stressful, as well as
emotionally and physically draining. It can be
hard to concentrate with so much on your mind.
It can also be hard to find opportunities to feel
like a kid and to just have fun.
It is not easy being a caregiver but we feel it is
our obligation to help family members who are ill
or disabled and need care. Despite the
difficulties, caregiving also opens you up and
you can grow as a person. By drawing on
internal strength and getting support from others,
including peers and staff at the Caregiving Youth
Project, we are finding ways to deal with the
stresses we face. We think we will be better
prepared for adulthood than other kids our age
because we’ve already “had a taste of the lows”
that life has to offer. We know how to take care
of others and how to “make something out of
nothing” when money is tight and times are
tough.

Rad Resources1) Better Evaluation
www.BetterEvaluation.Org
Great info sheet overview of quant and qual data terms and approach
http://betterevaluation.org/sites/default/files/Describe%20-%20Compact.pdf
2) FHI 360 - Qualitative Research Methods: Data Collectors Field Guide
http://www.fhi360.org/resource/qualitative-research-methods-data-collectors-field-guide
Quant vs. Qual, Focus Group Preparation, Sampling for Qualitative Data, Participant Observation
3) American Evaluation Association 365 Blog
http://aea365.org/blog/category/qualitative-methods/
Contact information
Sara Plachta Elliott, Executive Director