international capital market association european repo ... · international capital market...
TRANSCRIPT

International Capital Market Association
European repo market surveyNumber 26 - conducted December 2013
Published January 2014

© International CapitalMarket Association (ICMA), Zurich,2014. All rights reserved. No partof this publication may bereproduced or transmitted in anyform or by any means withoutpermission from ICMA.
This Survey has been compiledby Richard Comotto, Senior VisitingFellow, ICMA Centre at ReadingUniversity.
International Capital MarketAssociationTalacker 29P.O. BoxCH-8022 Zurich www.icmagroup.org

CONTENTS
Executive Summary 4
Chapter 1: The Survey 6
Chapter 2: Analysis of Survey Results 8
Chapter 3: Conclusion 30
About The Author 31
Appendix A: Survey Guidance Notes 32
Appendix B: Survey Participants 38
Appendix C: Summary of Survey Results 43
Appendix D: The ICMA European Repo Council 48
ISMA EUROPEAN REPO MARKET SURVEY DECEMBER 2003 I 3

4 I ICMA EUROPEAN REPO MARKET SURVEY DECEMBER 2013
EXECUTIVE SUMMARY
In December 2013, theEuropean Repo Council (ERC) ofthe International Capital MarketAssociation (ICMA) conducted the26th in its series of semi-annualsurveys of the repo market inEurope.
The latest survey asked asample of financial institutions inEurope for the value of their repocontracts that were still outstandingat close of business on December11, 2013. Replies were receivedfrom 68 offices of 64 financialgroups, mainly banks. Returnswere also made directly by theprincipal automatic repo tradingsystems (ATS) and tri-party repoagents in Europe, and by theLondon-based Wholesale MarketBrokers’ Association (WMBA).
Total repo business
The total value of the repocontracts outstanding on the booksof the 68 institutions whoparticipated in the latest surveywas EUR 5,499 billion, comparedwith the EUR 6,079 billion in June2013, the recent trough of EUR4,633 billion in December 2008and the pre-crisis peak of EUR6,775 billion in June 2007. Using aconstant sample of banks, it isestimated that the market shrankover the last six months by 8.2%.The contraction of the marketwould seem to be the result of theusual shrinkage of repo books atyear-end plus the impact of theunlimited liquidity offered by theECB in December. It may also havebeen driven by the anticipation of
future regulatory constraints onshort-term wholesale funding.
Trading analysis
The share of directly-negotiatedrepos continued to recover, apossible sign of sustained marketconfidence, at the expense ofelectronic repo trading, which mayhave been held back by theavailability of funding from the ECB.
Geographical analysis
Domestic business alsoappears to have been hit by ECBlending.
Clearing and settlement analysis
The share of anonymous (ieCCP-cleared) electronic tradingincreased, contrary to anecdotalevidence suggesting that bankswere shifting out of CCP-clearedtrading to take advantage of lowerhaircuts in the uncleared market.Unfortunately, a new question inthe survey may have produced aone-off adjustment to the total foranonymous electronic tradingwhich has obscured the underlyingtrend. But it is also possible thatreports of a net migration out ofCCP-cleared business have beenexaggerated.
The share of tri-party repoimproved slightly to 9.9% from9.6% but the outstanding value oftri-party repo reported directly bythe major tri-party agents inEurope (ie all tri-party business,not just by the institutions in thesurvey sample) surged by 22% toa record EUR 1,344 billion.

ICMA EUROPEAN REPO MARKET SURVEY DECEMBER 2013 I 5
Cash currency analysis
The share of the eurocontinued to recover from itsrecent low of 57.0% in June 2012,to reach 66.3%. This was despiteECB lending, which usually reducesthe need to borrow euro in themarket. The resilience of the euroon this occasion may be a sign ofthe strength of the underlyingtrend back to market funding.
Collateral analysis
The most significant shifts inthe composition of the collateralpool were an increase in Italiancollateral and, to a lesser extent, inSpanish collateral. Unusual volatilityin French repo rates may havediscouraged trading in Frenchcollateral. The share of Germancollateral was unchanged, which isconsistent with reports that thesupply of German governmentspecials remains relatively tight.
In electronic trading directlyreported by the ATS, there wasanother sharp rise in the share ofItalian collateral, to 38.7% from32.6%. This would seem to confirmreports that some Italian bankshave had to fund themselves in theCCP-cleared market, which ismainly electronic. This increase inItalian collateral has taken placedespite the alarm occasioned in thesummer by the announcement ofan updated set of rules byLCH.Clearnet SA for closing outpositions in Italian collateral heldwith the Italian domestic CCP,CC&G, in the event of a default bythe latter.
In directly-reported tri-partybusiness, the biggest change wasin French collateral, perhapsreflecting increased lending by USmoney market mutual funds toFrench banks.
Maturity analysis
Short-dated repos were largelyunchanged. This disguised anincrease in 1-day to 1-week tenors.In addition, contracts with 1 to 3months remaining to maturityrebounded vigorously. The increasein long dates is partly seasonal butmay also represent a lengthening ofduration in order to enhance yieldand the simultaneous increase inshort dates may be the building-upof high level of assets below 1-week in order to balance liquidityrequirements.
Forward-start transactions fellback sharply, perhaps becauseexpectations of further changes inECB policy rates were receded.
The share of floating-rate reporegained ground, possibly respond -ing to the steepening of the euromoney market curve
Concentration analysis
There was very little change inmarket concentration.

CHAPTER 1: THESURVEY
On December 11, 2013, theEuropean Repo Council (ERC) ofthe International Capital MarketAssociation (ICMA) conducted the26th in its series of semi-annualsurveys of the repo market inEurope.
The survey was managed andthe results analysed on behalf ofICMA by the author, at the ICMACentre at Reading University inEngland, under the guidance of theERC Steering Committee (“ERCCommittee”).
1.1 What the survey asked
The survey asked financialinstitutions operating in a numberof European financial centres forthe value of the cash side of repoand reverse repo contracts stilloutstanding at close of business onWednesday, December 11, 2013.
The questionnaire also askedthese institutions to analyse theirbusiness in terms of the currency,the type of counterparty, contractand repo rate, the remaining termto maturity, the method ofsettlement and the origin of thecollateral. In addition, institutionswere asked about securitieslending and borrowing conductedon their repo desks.
The detailed results of thesurvey are set out in Appendix C.An extract of the accompanying
Guidance Notes is reproduced inAppendix A
Separate returns were madedirectly by the principal automaticrepo trading systems (ATS) and tri-party repo agents in Europe, andan aggregate return was madedirectly by the London-basedWholesale Market Brokers’Association (WMBA).
1.2 The response to thesurvey
The latest survey wascompleted by 68 offices of 64financial groups. This is three morethan in June 2013. Two institutionswhich participated in the lastsurvey dropped out of the latestbut four re-joined and there was anew participant (Banco BPI).
55 of the latest participantswere based across 18 Europeancountries, as well as in Australia(1), North America (8) and Japan(4). 53 participants were basedacross 14 of the 28 member statesof the EU (there were noinstitutions in the survey fromFinland and Sweden, and only onefrom a former Accession State). 48participants were based in 12 ofthe 18 countries of the eurozone.However, although someinstitutions were based in onecountry, much of their businesswas conducted in others. Manyinstitutions provided data for theirentire European repo business.Others provided separate returnsfor one or more (but not
6 I ICMA EUROPEAN REPO MARKET SURVEY DECEMBER 2013

ICMA EUROPEAN REPO MARKET SURVEY DECEMBER 2013 I 7
necessarily all) of their Europeanoffices. A list of the institutions thathave participated in the ICMA’srepo surveys is contained inAppendix B.
1.3 The next survey
The next survey is scheduledto take place at close of businesson Wednesday, June 11, 2014.
Any financial institutionwishing to participate in the nextsurvey will be able to downloadcopies of the questionnaire andaccompanying Guidance Notesfrom ICMA’s web site. The latestforms will be published shortlybefore the next survey at thefollowing address:
www.icmagroup.org/surveys/repo/participate.
Questions about the surveyshould be sent by e-mail [email protected].
Institutions who participate ina survey receive, in confidence, alist of their rankings in the variouscategories of the survey.

CHAPTER 2: ANALYSIS OF SURVEY RESULTS
The aggregate results of the latest two surveys and of the surveys ineach December in the four previous years (2009-2012) are set out inAppendix C. The full results of all previous surveys can be found atwww.icmagroup.org.
Total repo business (Q1)
The total value, at close of business on December 11, 2013, of repos andreverse repos outstanding on the books of the 68 institutions whichparticipated in the latest survey was EUR 5,499.3 billion. This is the lowestresult for over four years. It is much higher than the crisis trough of EUR4,633 billion in December 2008 but much lower than the pre-crisis peak ofEUR 6,775 billion in June 2007.
Of the sample of 68 institutions, 31 were net lenders, compared to 31out of 65 in the last survey.
Table 2.1 – Total repo business from 2001 to 2013
survey total repo reverse repo2013 December 5,499 49.2% 50.8%2013 June 6,076 49.8% 50.2%2012 December 5,611 49.1% 51.9%2012 June 5,647 48.7% 51.3%2011 December 6,204 50.3% 49.7%2011 June 6,124 50.7% 49.3%2010 December 5,908 51.0% 49.0%2010 June 6,979 53.5% 46.5%2009 December 5,582 50.0% 50.0%2009 June 4,868 52.2% 47.8%2008 December 4,633 49.9% 50.1%2008 June 6,504 48.8% 51.2%2007 December 6,382 49.4% 50.6%2007 June 6,775 50.8% 49.2%2006 December 6,430 50.7% 49.3%2006 June 6,019 51.7% 48.3%2005 December 5,883 54.6% 45.4%2005 June 5,319 52.4% 47.6%2004 December 5,000 50.1% 49.9%2004 June 4,561 50.6% 49.4%2003 December 3,788 51.3% 48.7%2003 June 4,050 50.0% 50.0%2002 December 3,377 51.0% 49.0%2002 June 3,305 50.0% 50.0%2001 December 2,298 50.4% 49.6%2001 June 1,863 49.6% 50.4%
8 I ICMA EUROPEAN REPO MARKET SURVEY DECEMBER 2013

ICMA EUROPEAN REPO MARKET SURVEY DECEMBER 2013 I 9
It is important to rememberthat the survey measures the valueof outstanding transactions at closeof business on the survey date.Measuring the stock of transactionsat one date, rather than the flowbetween two dates, permits deeperanalysis but is difficult to reconcilewith the flow numbers published byother sources.
As the survey is a ‘snapshot’ ofthe market, it can miss peaks andtroughs in business betweensurvey dates, especially of veryshort-term transactions.
In addition, the valuesmeasured by the survey are grossfigures, which mean that they havenot been adjusted for the doublecounting of the same transactionsbetween pairs of survey par -ticipants. However, a recent study(see the report of the December2012 survey) suggested that theproblem of double-counting wasnot very significant.
Nor does the survey measurethe value of repos transacted withcentral banks as part of officialmonetary policy operations.Central bank intervention has ofcourse been very substantialduring the recent marketdifficulties, not least, through theexceptional liquidity facilitiesprovided by the European CentralBank and Bank of England.
In order to gauge the year-on-year growth of the European repo
market (or at least that segmentrepresented by the institutions whohave participated in the survey), itis not valid to simply compare thetotal value of repos and reverserepos with the same figures inprevious surveys. Some of thechanges represent the entry andexit of institutions into and out ofthe survey, mergers betweenbanks and the reorganization ofrepo books within banks. To over -come the problem caused bychanges in the sample of surveyparticipants, comparisons aremade of the aggregate outstandingcontracts reported only by a sub-sample of institutions which haveparticipated continuously in severalsurveys.
Out of the 68 institutions inthe present survey, 61 haveparticipated in all of the last threesurveys. Overall, the gross repoand reverse repo positions of those61 institutions shrank by 8.2%over the six months from the June2013 survey (smaller than thechange in the headline number of -9.5%), compared to growth of8.6% in the first six months of2013. The year-on-year change forthe constant survey sample was+0.5%.
The repo books of 39 of thelatest sample of 68 institutionscontracted. This is much higherthan in the last survey, when 26repo books out of 65 contracted,suggesting a significant change ofbehavior by repo dealers.

10 I ICMA EUROPEAN REPO MARKET SURVEY DECEMBER 2013
December 2013 June 2013 December 2012users share users share users share
direct 68 53.2% 65 52.3% 71 50.9%of which tri-party 41 9.9% 37 9.6% 41 9.5%voice-brokers 52 15.1% 53 14.6% 58 16.3%ATS 52 31.7% 53 33.1% 52 32.8%
Trading analysis (Q1.1)
Table 2.2 – Trading analysis
The share of directly-negotiated repos continued to risefrom the low touched in June 2012(48.6%). However, in the latestperiod, this growth was no longerat the expense of voice-brokeredbusiness, which recovered from itsall-time low of 14.6% in June2013. Instead, the counterpart tothe growth of the share of directly-negotiated repos was a reducedshare for electronic trading.
Electronic trading not only lostmarket share. Data provideddirectly by the principal automaticrepo trading systems (ATS)operating in Europe – BrokerTec,Eurex Repo and MTS – showed thatthe outstanding value of allelectronic trading (not just by theinstitutions in the survey sample)also contracted, falling back to EUR936.7 billion from EUR 1,059billion.
The share of tri-party repoimproved slightly to 9.9% from9.6%. However, the outstandingvalue of tri-party repo reporteddirectly by the major tri-partyagents in Europe (ie all tri-partybusiness, not just that by theinstitutions in the survey sample)surged to a record EUR 1,344billion from EUR 1,103 billion. As
the absolute rate of growth ofbusiness reported directly by tri-party agents was some 22%,whereas the change in the share oftri-party repo in the survey was amodest 0.3 percentage points,there would appear to have been afurther expansion of the tri-partymarket outside the survey sample(which is mainly large repodealers). This supports anecdotalevidence of new types of customer(particularly non-bank financialinstitutions) adopting tri-party repoas a means of switching intocollateralised forms of short-terminvestment but may also reflectgreater use of the European repomarket by existing investors suchas US money market mutual funds(who were reported to have beenonce again increasing lending tocore eurozone banks, particularlyin France and Germany).
The share of directly-reportedtri-party repo accounted for by GCfinancing (mainly Eurex Repo’sEuro GC Pooling facility) fell backto 14.2% from 20.8%, possiblysuggesting that banks preferred totap the fixed-rate full-allotmentfacility provided by the ECB inDecember in order to mitigate end-of-year liquidity shortages.

ICMA EUROPEAN REPO MARKET SURVEY DECEMBER 2013 I 11
Table 2.3 – Numbers of participants reporting particular types of business
Dec-13 Jun-13 Dec-12 Jun-12 Dec-11 Jun-11ATS 52 53 52 45 47 44anonymous ATS 47 45 44 37 39 37voice-brokers 52 53 58 51 54 48tri-party repos 41 37 41 34 39 36total 68 65 71 62 64 58
Figure 2.1 – Counterparty analysis
Direct bilateral43.3%
ATS31.7%
Voice-brokered15.1% Direct tri-party
9.9%
In the current survey,participants were asked to breakout their GC financing businessfrom their other anonymouselectronic trading. The reportedshare was 4.4%, which isequivalent to about 40% of the
total outstanding value of Euro GCPooling reported directly (EUR164.9 billion). This means thatsurvey participants account for atleast this proportion of trading inEuro GC Pooling.

12 I ICMA EUROPEAN REPO MARKET SURVEY DECEMBER 2013
December 2013 June 2013 December 2012share users share users share users
domestic 26.1% 30.7% 29.7%cross-border to eurozone 18.0% 18.9% 18.9%cross-border to non-eurozone 30.9% 29.3% 31.6%anonymous 25.0% 47 21.1% 45 19.8% 44
Geographical analysis (Q1.1)
Table 2.4 – Geographical analysis
The share of anonymouselectronic trading in the surveycontinued to expand strongly,reaching 25.0%. This was at theexpense of domestic business,which fell back to 26.1% andcross-border transactions withcounterparties inside the Eurozone(down to 18%). It was suggestedin the report of the previous surveythat domestic repo businessappeared to be substituted bycentral bank assistance (inparticular, the ECB 3-year LTROsintroduced in December 2011 andFebruary 2012).This appears tohave happened again in December.Although some large bankscontinued to pay back their LTROdrawings, most sought to lock inliquidity over the year-end bytapping the ECB (reflected in ajump in the liquidity surplus at theECB in December).
The rise in anonymouselectronic trading was unexpected.Anecdotal evidence suggested thatthe continuing improvement inmarket confidence had prompted adecision by some banks that it wasless necessary, when dealing withfamiliar domestic counterparties,
to incur the expense of clearingacross CCPs. Given that most CCP-cleared business is negotiatedacross ATS, less use of CCPs shouldtranslate into less use ofanonymous electronic business.
There are a number ofexplanations for the unexpectedgrowth of anonymous electronictrading. First, there may be aproblem with the figures collected bythe survey in December 2013. Thelatest survey asked participants, forthe first time, to break out their GCfinancing business (principally,Eurex Repo’s Euro GC Poolingfacility). The response of 4.4% ispart of the overall figure of 25% forthe share of anonymous electronictrading. It is possible that,previously, some or all of thisbusiness was reported under tri-party repo (given that GC financinginvolves both anonymous tradingand tri-party collateral manage -ment). Anonymous electronictrading excluding GC financing wasonly 20.6%, lower than the 21.1%recorded in June 2013 and more inline with expectations about thereduced use of CCPs. Other datasuggests that anonymous electronic

ICMA EUROPEAN REPO MARKET SURVEY DECEMBER 2013 I 13
trading was weak. Thus, althoughanonymous business as apercentage of all electronic trading,as reported directly by the mainATSs, increased to 94.7% from94.1%, this was an increasingpercentage of a smaller marketshare, as the outstanding value of allelectronic trading decreased by17.4%.
Second, anecdotal evidence ofa net shift out of CCP-clearedbusiness may not apply to themarket as a whole. Many reportsreferred to Spanish banks takingadvantage of the easing of theirperceived counterparty credit risk.In contrast, it has also beenreported that some Italian bankswere forced into the CCP-clearedmarket by growing concerns overthe impact of political instability ontheir counterparty credit risk.Moreover, the impact of thereported shift of Spanish bank outof CCP-cleared repos will not haveaffected anonymous electronictrading as much as expected,because the repo business theyclear across the domestic CCP,MEFFRepo, is not electronicallytraded. Rather, they trade directlyand via voice-brokers and registerwith this CCP post trade. Post-trade registrations with MEFFRepopeaked at some EUR 139 billion inJuly 2013 and then dropped toabout EUR 97 billion in October,before recovering to EUR 111billion in December. The value ofrepos cleared across theinternational CCP serving theSpanish market, LCH.Clearnet SA(which accounts for about one-third of Spanish CCP-clearedbusiness), did not change much.
The impact of the new surveyquestion on GC financing makes itdifficult to assess the evolution ofthe repo business that is tradeddirectly or via voice-brokers andthen registered post trade withCCPs. If one excludes GC financingfrom the CCP-cleared total, thennon-electronic CCP-cleared busi -ness increased to 10.3% from8.5% in June. If one includes GCfinancing, then the share of non-electronic CCP-cleared businessdecreased to 5.9%. Figure 2.3shows the evolution of bothelectronic and non-electronic CCP-cleared business. It can be seenthat, as one might expect, theshare of non-electronic CCP-cleared business has been boostedby crises (the Lehman default inSeptember 2008 and the Europeansovereign debt crisis during 2010and early 2011) but appears to beon a downward trend, whereaselectronic CCP-cleared business ison an upward trend.
Data provided directly by tri-party repo agents saw domesticbusiness relapse, to 42.2% from43.8%, while cross-borderbusiness within the eurozone fellback to 17.7% from 24.8%. Thecounterpart to these reductionswas a massive expansion in theshare of cross-border businessbetween eurozone and non-eurozone counterparties to 40%from 31.5%. It is possible that thisreflects external investors such asUS money market mutual funds.
The share of domesticbusiness also shrank in thedirectly-reported business on ATSs,to 31.3% from 33.2%. However,

14 I ICMA EUROPEAN REPO MARKET SURVEY DECEMBER 2013
main survey ATS tri-party WMBAdomestic 26.1% 31.3% 42.3% 47.0%cross-border 48.9% 68.6% 57.7% 53.0%anonymous 25.0%
Table 2.5 – Geographical comparisons in December 2013
Figure 2.2 – Geographical analysis
Domestic26.1%
Anonymous ATS25.0%
Non-Eurozone30.9% Eurozone
18.0%
Dec-0
8
Dec-0
8
Jun-
08
Jun-
07
Jun-
09
Dec-0
9
Jun-
10
Dec-1
0
Jun-
11
Dec-1
1
Dec-1
2
Jun-
13
Dec-1
3
Jun-
120
5
10
15
20
25
30
35
ATS only (ex. GC financing)
Post-trade registration only
ATS + post-trade
all components of cross-borderbusiness expanded.
In contrast, the domestic busi -ness of voice-brokers recoveredsome of the losses in the first-half
of last year, reaching 47% from40.0%. However, given the Londonbias of the reporting voice-brokers,this change needs to be interpretedcautiously.
Clearing and settlement analysis (Q1.2 and Q1.8)
Figure 2.3 – Evolution of business cleared across CCPs

ICMA EUROPEAN REPO MARKET SURVEY DECEMBER 2013 I 15
The share of the eurorecovered further from its recentlow of 57.0% in June 2012, toreach 66.3%, despite the provisionof lending in euro by the ECB overthe year-end. This usually reducesthe need to borrow euro in themarket. The fact that the euro did
not retreat this time may reflectthe strength of the underlyingtrend back to market funding in theEurozone. On the other hand, theshare of euro in the tri-party andvoice-brokered segments of themarket did fall back.
December 2013 June 2012 December 2012EUR 66.3% 64.8% 61.4%GBP 10.2% 10.6% 13.3%USD 14.8% 15.2% 17.3%DKK, SEK 2.5% 2.5% 2.1%JPY 4.9% 4.9% 4.5%CHF 0.1% 0.2% 0.1%etc 1.3% 1.8% 1.3%cross-currency 0.9% 3.1% 2.1%
Cash currency analysis (Q1.3 and Q1.4)
Table 2.6 – Cash currency analysis
Other1.3%
JPY4.9%
DKK,SEK2.5%
USD14.8%
GBP10.2%
EUR66.3%
CHF0.1%
Figure 2.4 – Currency analysis

16 I ICMA EUROPEAN REPO MARKET SURVEY DECEMBER 2013
Table 2.7 – Currency comparison in December 2013
main survey ATS tri-party WMBAEUR 66.3% 95.4% 74.7% 54.9%GBP 10.2% 2.2% 4.3% 31.5%USD 14.8% 1.4% 18.9% 7.2%DKK, SEK 2.5% 0.0% 0.8% 0.8%JPY 4.9% 0.0% 0.6% 4.9%CHF 0.1% 0.9% 0.4% 0.0%etc 1.3% 0.1% 0.2% 0.7%cross-currency 0.9%
Collateral analysis (Q1.9)
Table 2.8 – Collateral analysis
December 2013 June 2013 December 2012Germany 21.9% 21.9% 22.0%Italy 9.2% 8.2% 8.7%France 11.5% 11.7% 11.0%Belgium 3.0% 3.4% 3.4%Spain 5.2% 4.6% 4.9%other eurozone 7.2% 8.1% 6.7%UK 11.4% 12.0% 14.2%DKK, SEK 2.8% 2.9% 2.4%International financial institutions 2.7% 2.2% 0.2%US 2.8% 2.6% 2.6%Accession countries 0.4% 0.3% 0.3%Japan 4.6% 4.2% 3.2%other OECD 10.3% 12.1% 12.7%other fixed income 6.6% 5.6% 7.2%equity 0.3% 0.3% 0.5%

ICMA EUROPEAN REPO MARKET SURVEY DECEMBER 2013 I 17
The share of all governmentbonds within the pool of EU-originated collateral reported in thesurvey recovered to 81.4% from80.1%, having fallen from 81.3%in December 2012.
The most significant shifts inthe composition of the collateralpool were an increase in Italiancollateral to 9.2% from 8.2% and,to a lesser extent, in Spanishcollateral (to 5.2% from 4.6%).There was no evidence of anyimpact from the downgrading ofseveral French banks by ratingagencies, but unusual volatility inFrench repo rates may havediscouraged trading. The share ofGerman collateral was unchanged.It is reported that the supply ofGerman government specialsremains relatively tight, perhaps asa result of sustained demand fromnon-European investors who donot lend securities as well as
unusual conditions in the Germangovernment bond futures market
In electronic trading directlyreported by the ATS, there was asharp further rise in the share ofItalian collateral, to 38.7% from32.6%. This would seem to confirmreports that some Italian bankshave had to fund themselves in theCCP-cleared market, which iselectronic, and may be the sourceof the increase in the use of Italiancollateral reported in the survey.This increase in Italian collateralhas taken place despite the alarmoccasioned in the summer by theannouncement of an updated set ofrules by LCH.Clearnet SA forclosing out positions in Italiancollateral held with the Italiandomestic CCP, CC&G, in the eventof a default by the latter.
In directly-reported tri-partybusiness, the biggest changes were
Germany21.9%
Italy9.2%
Spain5.2%Other
Eurozone7.2%
UK11.4%
DKK,SEK2.8%
US2.8%
OtherOECD10.3%
Others6.9%
Japan4.6%
IFI2.7%
Belgium3.0%
France11.5%
Accessioncountries0.4%
Figure 2.5 – Collateral analysis (main survey)

18 I ICMA EUROPEAN REPO MARKET SURVEY DECEMBER 2013
Table 2.9 – Tri-party repo collateral analysed by credit rating
December 2013 June 2013 December 2012AAA 36.9% 41.3% 47.5%AA 29.5% 27.8% 24.3%A 8.7% 7.4% 8.0%BBB 14.4% 13.4% 11.2%below BBB- 3.8% 3.5% 3.3%A1/P1 4.8% 3.2% 2.9%A2/P2 0.6% 1.3% 1.4%Non-Prime 0.5% 0.4% 0.0%unrated 0.8% 1.8% 1.4%
According to data reporteddirectly from the tri-party agents,there was another sharp fall inAAA-rated collateral, to 36.9% from
41.3%. This may be the result, inpart, of downgrades of France andthe Netherlands in November.
AAA AA A BBB subBBB A1/P1 A2/P2 NP Unrated
Dec-12
Jun-13
0
10
20
30
40
50
Dec-13
Figure 2.6 – Collateral analysis (tri-party agents) by credit rating
increases in French collateral (to17.2% from 14.2%) and UKgovernment securities (to 1.9%from 1.0%), and falls in Germannon-government securities to11.7% from 15.6% and issues by
international financial institutions to9.0% from 9.7%. The increase inthe use of French collateral in tri-party repo may reflect increasedlending by US money marketmutual funds to French banks.
ICMA EUROPEAN REPO MARKET SURVEY DECEMBER 2013 I 19
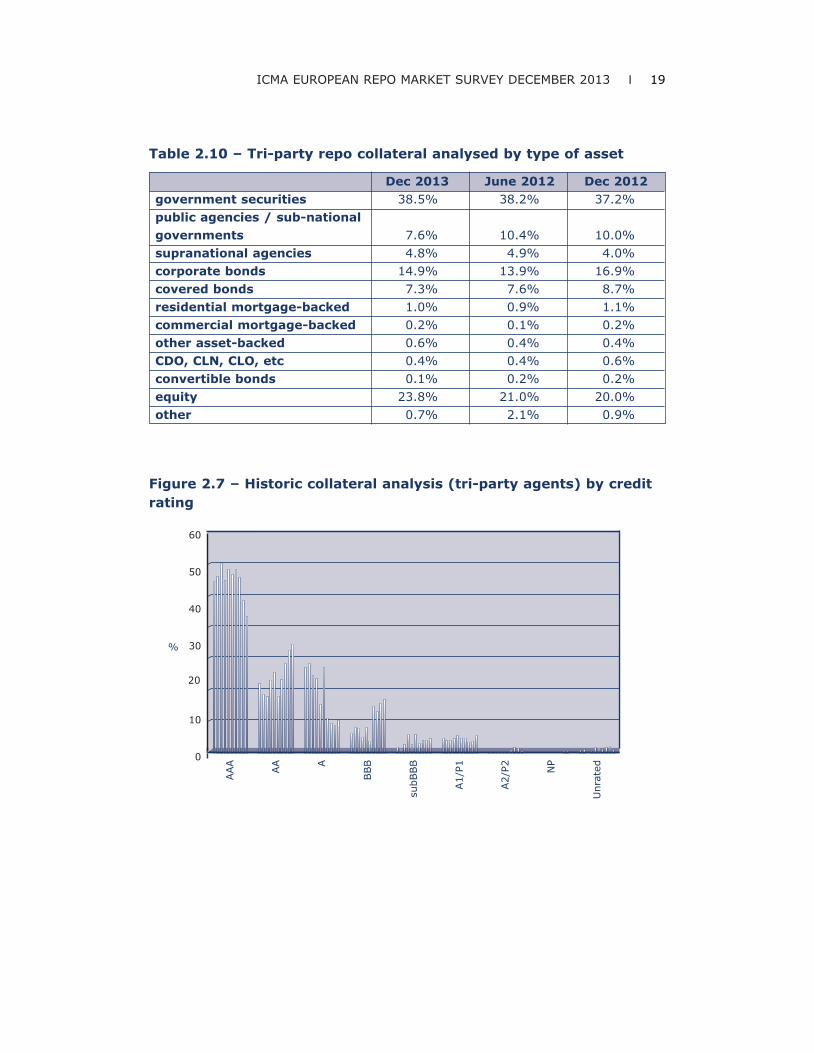
Dec 2013 June 2012 Dec 2012government securities 38.5% 38.2% 37.2%public agencies / sub-national governments 7.6% 10.4% 10.0%supranational agencies 4.8% 4.9% 4.0%corporate bonds 14.9% 13.9% 16.9%covered bonds 7.3% 7.6% 8.7%residential mortgage-backed 1.0% 0.9% 1.1%commercial mortgage-backed 0.2% 0.1% 0.2%other asset-backed 0.6% 0.4% 0.4%CDO, CLN, CLO, etc 0.4% 0.4% 0.6%convertible bonds 0.1% 0.2% 0.2%equity 23.8% 21.0% 20.0%other 0.7% 2.1% 0.9%
Table 2.10 – Tri-party repo collateral analysed by type of asset
AAA
AA A
BBB
subB
BB
A1/
P1
A2/
P2 NP
Unr
ated
0
10
20
30
40
50
60
%
Figure 2.7 – Historic collateral analysis (tri-party agents) by creditrating

20 I ICMA EUROPEAN REPO MARKET SURVEY DECEMBER 2013
Government38.5%
Public andSub-national7.6%
Supranational4.8%
Corporate14.9%
Covered7.3%
Equity23.8%
Other3.0%
Figure 2.8 – Collateral analysis (tri-party agents) by type of asset
Gov
ernm
ent
Publ
ic a
ndSub
-nat
iona
l
Sup
rana
tiona
l
Cor
pora
te
Cov
ered
M/A
BS
Equi
ty
Jun 09 – Dec 13
0
10
20
30
40
50
%
Figure 2.9 – Historic collateral analysis (tri-party agents) by type ofasset
Haircuts on collateral in tri-party repo did not changesignificantly, except for convertiblebonds (up to 13.1% from 4.4% ona weighted average basis),residential mortgage-backedsecurities (up to 10.9% from 8.6%)and commercial mortgage-backed
securities (down to 8.2% from9.5%). However, these are smallpools of collateral and, wherehaircuts have changed, this mayreflect changes in the specific issuesbeing offered as collateral withineach collateral category.

ICMA EUROPEAN REPO MARKET SURVEY DECEMBER 2013 I 21
Table 2.11 – Tri-party repo collateral haircuts analysed by type ofasset
(weighted average haircuts) Dec 2013 June 2013 Dec 2012government securities 2.7% 2.6% 2.7%public agencies / sub-national governments 2.3% 2.2% 2.6%supranational agencies 2.5% 2.7% 2.5%corporate bonds (financial)
5.8%4.8%
5.5%corporate bonds (non-financial) 6.3%covered bonds 3.1% 2.8% 2.3%residential mortgage-backed 10.9% 8.6% 9.2%commercial mortgage-backed 8.2% 9.5% 8.1%other asset-backed 8.0% 7.4% 6.8%CDO, CLN, CLO, etc 7.1% 7.6% 7.5%convertible bonds 13.1% 4.4% 6.9%equity 6.0% 5.8% 5.5%other 6.4% 3.3% 6.7
RepurchaseAgreements86.0%
DocumentedSell/Buy-back12.4%
UndocumentedSell/Buy-back1.6%
Contract analysis (Q1.5)
Figure 2.10 – Contract analysis

22 I ICMA EUROPEAN REPO MARKET SURVEY DECEMBER 2013
Repo rate analysis (Q1.6)
Table 2.12 – Contract comparison in December 2013
main survey ATS tri-partyrepurchase agreements 86.0% 67.3% 100.0%documented sell/buy-backs 12.4% 32.7% 0.0%undocumented sell/buy-backs 1.6% 0.0% 0.0%
Fixed Rate78.8%
Open12.6%
Floating rate8.6%
Figure 2.11 – Repo rate analysis
Table 2.13 – Repo rate comparison in June 2013
main survey ATS tri-partyfixed rate 78.8% 88.3% 48.2%floating rate 8.6% 11.7% 0.0%open 12.6% 0.0% 51.8%
Open repo continued to losemarket share, touching 12.6% from13.5%. The share of floating-raterepo regained ground, rising to 8.6%from 6.6%, possibly responding tothe steepening of the euro money
market curve that was driven by theincreasing demand for marketfunding prior to the year-end and theview that, following the ECB interestrate cut in November, euro rates mayfinally have bottomed out.

ICMA EUROPEAN REPO MARKET SURVEY DECEMBER 2013 I 23
Jun-
01D
ec-0
1Ju
n-02
Dec
-02
Jun-
03D
ec-0
3Ju
n-04
Dec
-04
Jun-
05D
ec-0
5Ju
n-06
Dec
-06
Jun-
07D
ec-0
7Ju
n-08
Dec
-08
Jun-
09D
ec-0
9Ju
n-10
Dec
-10
Jun-
11D
ec-1
1Ju
n-12
Jun-
13D
ec-1
2
Dec
-13
SD + open
1M+
0
10
20
30
% 40
50
60
70
80
open
Figure 2.12 – Maturity analysis: short dates, longer terms & forwards(main survey)
Table 2.14 – Maturity analysis
Maturity analysis (Q1.7)
Dec 2013 June 2013 Dec 20121 day 19.9% 18.2% 17.0%2 days to 1 week 15.8% 15.2% 16.3%1 week to 1 month 22.0% 23.8% 17.2%>1 month to 3 months 16.6% 10.7% 16.0%>3 months to 6 months 4.6% 4.1% 4.1%>6 months to 12 months 3.1% 4.5% 2.9%>12 months 3.1% 4.1% 5.9%forward-start 8.8% 12.1% 7.8%open 6.2% 7.3% 12.7%

24 I ICMA EUROPEAN REPO MARKET SURVEY DECEMBER 2013
Jun-
01D
ec-0
1Ju
n-02
Dec
-02
Jun-
03D
ec-0
3Ju
n-04
Dec
-04
Jun-
05D
ec-0
5Ju
n-06
Dec
-06
Jun-
07D
ec-0
7Ju
n-08
Dec
-08
Jun-
09D
ec-0
9Ju
n-10
Dec
-10
Jun-
11D
ec-1
1Ju
n-12
Jun-
13D
ec-1
3
Dec
-12
SD + open
1-6M
0
10
20
30
40
50
60
70
80
6M+
Figure 2.13 – Maturity analysis: non-forward terms (main survey)
Short-dated repos (one monthor less to maturity) were largelyunchanged at 57.7%.
Contracts with 1 to 3 monthsremaining to maturity reboundedvigorously to 16.6% from 10.7%, inpart, due to seasonal factors (this
range of terms always increases inDecember, approaching the turn ofthe year, and then falls back in June).The simultaneous rises in very short-term tenors and those in the 1 to6-month range have been explainedas an attempt by banks to lend atlonger durations in order to enhance
Figure 2.14 – Maturity analysis: breakdown of short dates plus open(main survey)
Jun-
01D
ec-0
1Ju
n-02
Dec
-02
Jun-
03D
ec-0
3Ju
n-04
Dec
-04
Jun-
05D
ec-0
5Ju
n-06
Dec
-06
Jun-
07D
ec-0
7Ju
n-08
Dec
-08
Jun-
09D
ec-0
9Ju
n-10
Dec
-10
Jun-
11D
ec-1
1Ju
n-12
Jun-
13D
ec-1
2
Dec
-13
1D
2D-1W
0
5
10
15
20
25
30
35
1W-1M
open

ICMA EUROPEAN REPO MARKET SURVEY DECEMBER 2013 I 25
yield, while building up a high level ofassets below 1-week in order tosatisfy liquidity requirements.
There were signs of a modestlengthening of tenors in electronicand tri-party repo business too.
Forward-start transactions fellback sharply to 8.8% from athree-year high of 12.1% in June2013, perhaps as expectations offurther changes in ECB policy rateswere receded after the cut inNovember.
1D
83.1%
0
20
40
60
80
100
%
Forward>6M3-6M
0.3% 0.7% 0.6%
1-3M
1.5%
8D-1M
2.5%
2-7D
11.2%
Figure 2.15 – Maturity analysis (ATS)
0
10
20
30
40
50
60
%
1D
11.2%
>12M
1.0%
Open
54.0%
6-12M
2.4%
3-6M
9.3%
1-3M
8.4%
1W-1M
6.3%
1D-1W
7.4%
Figure 2.16 – Maturity analysis (tri-party agents)

26 I ICMA EUROPEAN REPO MARKET SURVEY DECEMBER 2013
0
10
20
30
40
50
%
1D
3.9%
12M+
0.4%
fd-fd
42.6%
Open
3.8%
6-12M
5.9%
3-6M
5.0%
1-3M
18.2%
1W-1M
14.2%
1D-1W
6.1%
Figure 2.17 – Maturity analysis (voice-brokers)
Table 12.15 – Maturity comparison in December 2013
main survey ATS tri-party WMBA1 day 19.9% 83.1% 11.2% 3.9%2 days to 1 week 15.8% 11.2% 7.4% 6.1%1 week to 1 month 22.0% 2.5% 6.3% 14.2%>1 month to 3 months 16.6% 1.5% 8.4% 18.2%>3 months to 6 months 4.6% 0.3% 9.3% 5.0%>6 months to 12 months 3.1% 0.4% 2.4% 5.9%>12 months 3.1% 0.3% 1.0% 0.4%forward-start 8.8% 0.6% 42.6%open 6.2% 54.0% 3.8%
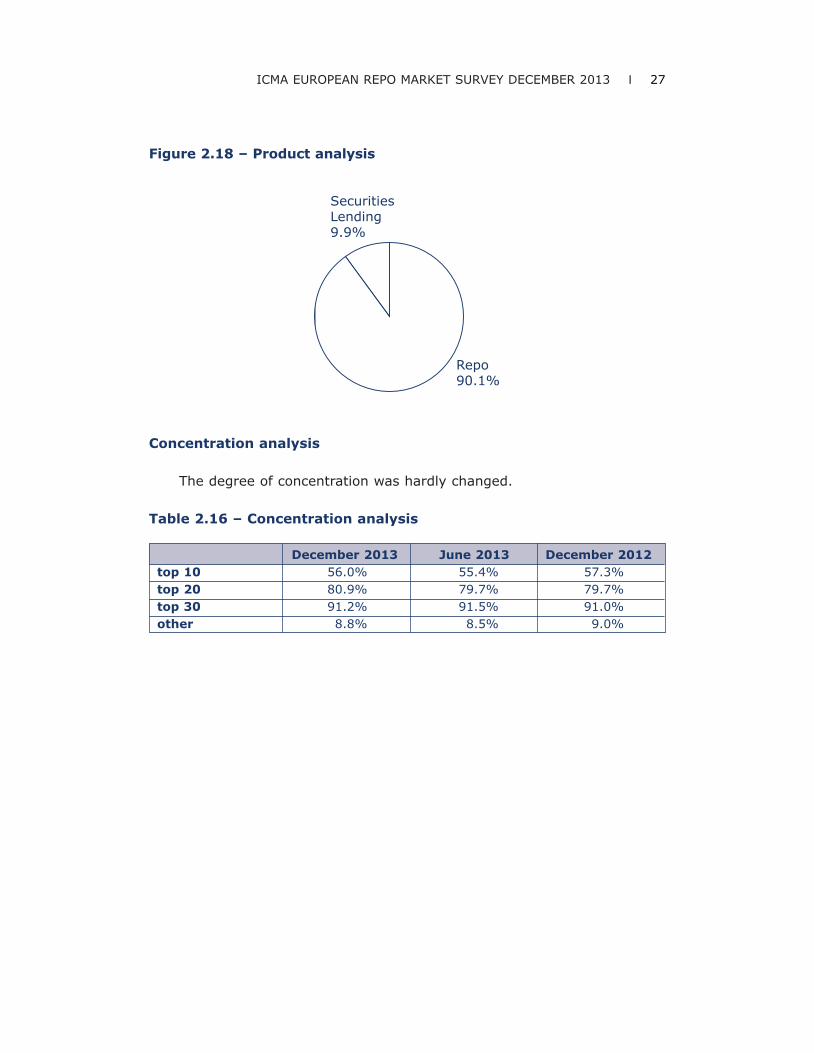
Product analysis (Q2)
The share of securities lendingconducted on repo desks continued
to contract, reaching a new recordlow of 9.9% from 10.4%.
ICMA EUROPEAN REPO MARKET SURVEY DECEMBER 2013 I 27
Repo90.1%
gSecuritiesLendin9.9%
Figure 2.18 – Product analysis
December 2013 June 2013 December 2012top 10 56.0% 55.4% 57.3%top 20 80.9% 79.7% 79.7%top 30 91.2% 91.5% 91.0%other 8.8% 8.5% 9.0%
Concentration analysis
The degree of concentration was hardly changed.
Table 2.16 – Concentration analysis

28 I ICMA EUROPEAN REPO MARKET SURVEY DECEMBER 2013
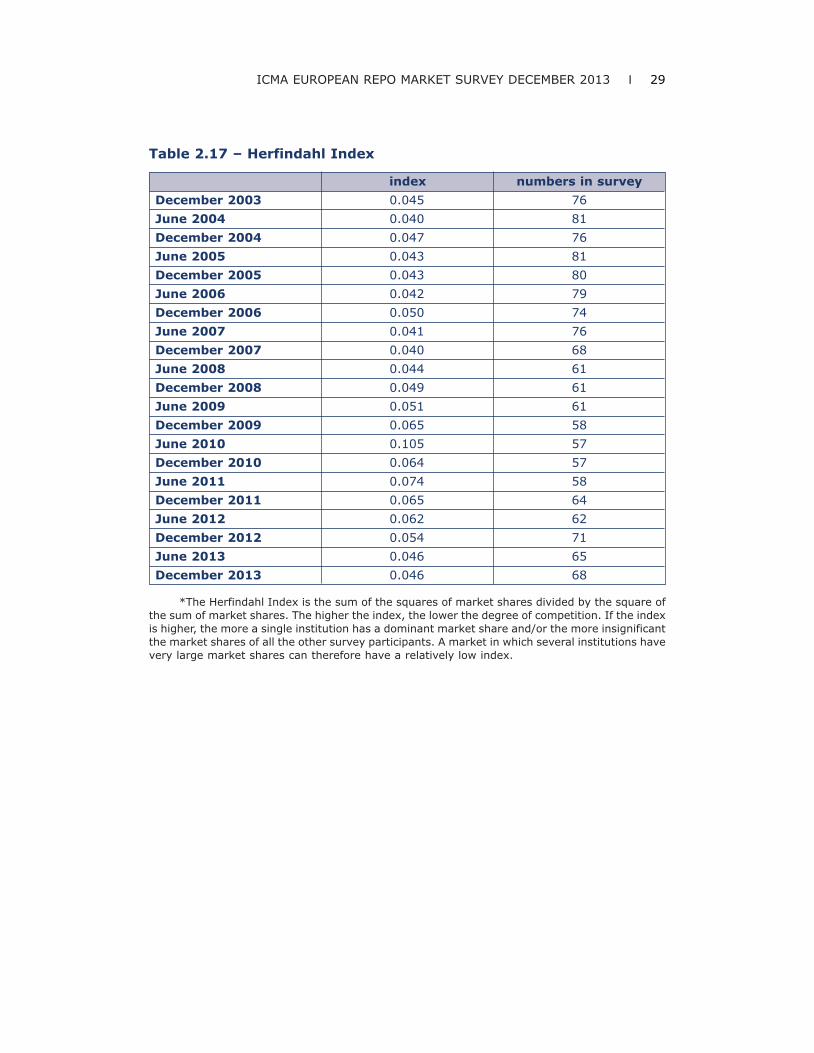
Although the apparent degreeof concentration of repo business ishigh, this does not mean that thelargest institutions havecommensurate market power. Abetter measure of market
concentration - often used incompetition analyses - is theHerfindahl Index. This indexshows market concentrationunchanged over 2013.
Top 1056.0%
Top 11-2024.9%
Top 21-3010.3%
Remainder8.8%
Figure 2.19 – Concentration analysis
ICMA EUROPEAN REPO MARKET SURVEY DECEMBER 2013 I 29
index numbers in surveyDecember 2003 0.045 76June 2004 0.040 81December 2004 0.047 76June 2005 0.043 81December 2005 0.043 80June 2006 0.042 79December 2006 0.050 74June 2007 0.041 76December 2007 0.040 68June 2008 0.044 61December 2008 0.049 61June 2009 0.051 61December 2009 0.065 58June 2010 0.105 57December 2010 0.064 57June 2011 0.074 58December 2011 0.065 64June 2012 0.062 62December 2012 0.054 71June 2013 0.046 65December 2013 0.046 68
Table 2.17 – Herfindahl Index
*The Herfindahl Index is the sum of the squares of market shares divided by the square ofthe sum of market shares. The higher the index, the lower the degree of competition. If the indexis higher, the more a single institution has a dominant market share and/or the more insignificantthe market shares of all the other survey participants. A market in which several institutions havevery large market shares can therefore have a relatively low index.

CHAPTER 3:CONCLUSION
The significant reduction in thesize of the survey over the secondhalf of 2013 would seem to be theresult of the usual contraction ofrepo books at year-end plus theimpact of the lending offered bythe ECB in December in order torelieve any seasonal fundingshortages. It may also have beendriven by the anticipation of futureregulatory constraints on short-term wholesale funding.
As in the past, ECB lending wasreflected in a drop in the share ofdomestic business, as well as areduction in the share of theelectronic market. With a fixed-ratefull allotment facility from the ECB,Eurozone banks had less need ofmarket funding. To this extent, theECB’s facility slowed the return tothe market seen in the previoussurvey, albeit temporarily. However,the continued recovery in marketconfidence seems to havesustained the share of directly-negotiated repos. And the trendback towards market funding wasstill visible and not just for coreeurozone banks. Thus, there was alarge increase in the share of Italiancollateral.
A conundrum in the latestsurvey results was the increase inanonymous (ie CCP-cleared)electronic trading. Anecdotalevidence suggested that bankswere taking advantage of increasedmarket confidence to shift out ofCCP-cleared trading and take
advantage of the lower haircuts inthe uncleared market. It is possiblethat a new question in the surveyasking banks to break out GCfinancing business may haveproduced a one-off adjustment tothe total for anonymous electronictrading (which includes GCfinancing) that obscured theunderlying trend. It is also possiblethat reports of a net migration outof CCP-cleared business have beenexaggerated. While Spanish banksappear to have reduced their use ofthe domestic CCP, this business isnot electronically originated. Andsome Italian banks appear to havebeen forced into the CCP-clearedmarket by counterparty creditconcerns arising from politicalinstability in Italy.
The reduced need for marketfunding would normally have beenexpected to hit the share of tri-party repo, as this is a purecash-driven product. However, theshare of tri-party repo actuallyincreased, if only modestly. Andthere was a dramatic expansion ofthe tri-party market outside thesurvey, which would seem toconfirm anecdotal evidence of newentrants arriving into that market.It may also be the result ofincreased use by existingparticipants, among whom, may beUS money market mutual funds.These investors increased theirlending to core Eurozone banks,not least, to French banks. It isnoteworthy that the share ofFrench collateral in tri-party repojumped.
30 I ICMA EUROPEAN REPO MARKET SURVEY JUNE 2013

ICMA EUROPEAN REPO MARKET SURVEY DECEMBER 2013 I 31
ABOUT THE AUTHOR
This report was compiled byRichard Comotto, who is a SeniorVisiting Fellow at the ICMA Centreat the University of Reading inEngland, where he is responsible forthe FX and money markets moduleof the Centre's postgraduate financeprogramme. He is also CourseDirector of the ICMA ProfessionalRepo Market Course conducted inEurope and Asia in co-operationwith the ACI and AFME/ASIFMA,and of the ICMA-ISLA GMRA-GMSLAWorkshop.
The author acts as anindependent consultant providingresearch, advice and training on theinternational money, securities andderivatives markets to professionalmarket associations, governmentagencies, regulatory authorities,international financial institutions,banks, brokers and financialinformation services.
The author has written anumber of books and articles on arange of financial topics, includingthe foreign exchange and moneymarkets, swaps and electronictrading systems. He takes particularinterest in the impact of electronictrading systems on the bond andrepo markets. Following thefinancial crisis, he has been advisingthe ICMA’s European Repo Councilon regulatory initiatives and hasproduced a series of papers: in July2010, a ‘White paper on the
operation of the European repomarket, the role of short-selling, theproblem of settlement failures andthe need for reform of the marketinfrastructure’; in September 2011,‘Interconnectivity of central andcommercial bank money in theclearing and settlement of theEuropean repo market’; in February2012, ‘Haircuts and Initial Marginsin the Repo Market’; in March 2012,‘Shadow Banking and Repo’; and in‘Collateral damage: the impact ofthe Financial Transaction Tax on theEuropean repo market’ in April2013. He writes on repo markettopics on the ICMA Centre blog aticmacentre.wordpress.com/.
The author served for ten yearsat the Bank of England, within itsForeign Exchange Division and onsecondment to the InternationalMonetary Fund in Washington DC.

32 I ICMA EUROPEAN REPO MARKET SURVEY DECEMBER 2013
APPENDIX A: SURVEYGUIDANCE NOTES
The following extract is basedon the Guidance notes issued toparticipants in conjunction with thesurvey that took place onWednesday, December 11, 2013
The data required by thissurvey are: the total value of therepos and reverse repos booked byyour repo desk that are stilloutstanding at close of business onWednesday, December 11, 2013,and various breakdowns of theseamounts.
Branches of your bank in othercountries in Europe may be askedto complete separate returns. Ifyour repo transactions are bookedat another branch, please forwardthe survey form to that branch. Ifbranches of your bank in othercountries run their own repobooks, please copy the survey formto these branches, so that they canalso participate in the survey.Please feel free to copy the surveyform to other banks, if youdiscover that they have notreceived it directly.
General guidance
a)Please fill in as much of theform as possible. For each questionthat you answer, you will receiveback your ranking in that category.
b)If your institution does nottransact a certain type of repobusiness, please enter ‘N/A’ in therelevant fields. On the other hand,if your institution does that type ofbusiness but is not providing thedata requested by the survey,please do not enter anything into
the relevant field. If yourinstitution does that type ofbusiness but has no transactionsoutstanding, please enter zero intothe relevant field.
c)You only need to givefigures to the nearest million.However, if you give figures withdecimal points, please use fullstops as the symbols for thedecimal points, not commas. Fornil returns, please use zeros, notdashes or text.
d)Please do not re-format thesurvey form, ie change its lay-out, and do not leave formulae inthe cells of the underlyingspreadsheet.
e)Include all repurchaseagreements (classic repos),sell/buy-backs and similar types oftransaction (e.g. pensions livrées).There is a separate question (seequestion 2) on securities lendingand borrowing transactions(including securities lending andborrowing against cash collateral).
f) Exclude repo transactionsundertaken with central banks aspart of their official money marketoperations. Other repotransactions with central banks,e.g. as part of their reservemanagement operations, should beincluded.
g)Give the value of the cashwhich is due to be repaid on allrepo and reverse repo contracts(not the market value or nominalvalue of the collateral) that are stilloutstanding at close of business onWednesday, December 11, 2013.This means the value oftransactions at their repurchaseprices.

ICMA EUROPEAN REPO MARKET SURVEY DECEMBER 2013 I 33
h)“Outstanding” means reposand reverse repos with a repurchasedate, or which will roll over, on orafter Thursday, December 12, 2013.You should include all open reposand reverse repos that have beenrolled over from Wednesday,December 11, 2013, to a later dateand all forward-forward repos andreverse repos that are stilloutstanding at close on Wednesday,December 11, 2013.
i) Give separate totals for (a)repos plus sell/buy-backs and (b)reverse repos plus buy/sell-backs.
j) The survey seeks to measurethe value of repos and reverserepos on a transaction date basis,rather than a purchase date basis.This means that you should includeall repo and reverse repo contractsthat have been agreed before closeof business on Wednesday,December 11, 2013, even if theirpurchase dates are later.
k)Give gross figures, i.e. donot net opposite transactions withthe same counterparty. If this isnot possible, please indicate thatyour figures are net.
l) In the case of equity repo,for synthetic structures, pleasegive the value of the cashpayment.
Guidance on specific questionsin the survey form
1.1 Transactions (1.1.1)direct with counterparties or(1.1.2) through voice-brokersshould exclude all repos transactedover an ATS (see below). Theseshould be recorded under (1.1.3).
(1.1.2) Transactions throughvoice-brokers should be brokendown in terms of the location of thecounterparties, rather than thelocation of the voice-brokers.
(1.1.3) “ATSs” are automatictrading systems (e.g. BrokerTec,Eurex Repo and MTS, but not voice-assisted electronic systems such ase-speed and GFInet). Transactionsthrough voice-assisted systemsshould be included in (1.1.2).Anonymous transactions throughan ATS with a central counterparty(e.g. CC&G, LIFFE-Clearnet, MEFFand Eurex Clearing) should berecorded in (1.1.3.4) and (1.1.3.5).GC financing systems in (1.1.3.4)are those ATS that are connected toa CCP and tri-party repo service.Examples include Eurex Euro GCPooling and LCH-Clearnet’s €GCbasket traded on Brokertec. Theydo not include GC basket trading onATS. This activity may be clearedacross a CCP but does not involve atri-party service, and should berecorded in (1.1.3.5).
1.2 This item includes allthe transactions recorded in (1.1.3)plus any transactions executeddirectly with counterparties and viavoice-brokers which are thenregistered with and cleared througha central counterparty.
1.6 “Repurchaseagreements” (also known as“classic repos”) include transactionsdocumented under the GlobalMaster Repurchase Agreement(GMRA) 1995, the Global MasterRepurchase Agreement (GMRA)2000 or the Global MasterRepurchase Agreement (GMRA)2011 without reference to theBuy/Sell-Back Annexes, andtransactions documented under

34 I ICMA EUROPEAN REPO MARKET SURVEY DECEMBER 2013
other master agreements.“Sell/buy-backs” are therefore takento include all transactions that arenot documented. Repurchaseagreements include pensionslivrées. Repurchase agreements arecharacterised by the immediatepayment by the buyer to the sellerof a manufactured or substitutepayment upon receipt by the buyerof a coupon on the collateral held bythe buyer. If a coupon is paid oncollateral during the term of asell/buy-back, the buyer does notmake an immediate manufacturedor substitute payment to the seller,but reinvests the coupon until therepurchase date of the sell/buy-backand deducts the manufactured orsubstitute payment (plusreinvestment income) from therepurchase price due to be receivedfrom the seller. Sell/buy-backs maybe quoted in terms of a forwardprice rather than a repo rate. Wheresell/buy-backs are documented(e.g. under the Buy/Sell-BackAnnexes to the GMRA 1995, GMRA2000 or GMRA 2011), periodicadjustments to the relative amountsof collateral or cash - which, for arepurchase agreement, would beperformed by margin maintenancetransfers or payments - are likely tobe made by early termination andadjustment or re-pricing. All openrepos are likely to be repurchaseagreements.
1.7 This section asks forthe remaining term to maturity(not the original term to maturity)of repos to be broken down asfollows:
(1.7.1.1) 1 day – this means:• all contracts transacted priorto Wednesday, December 11,2013, with a repurchase date onThursday, December 12, 2013;
• overnight, tom/next,spot/next and corporate/nextcontracts transacted onWednesday, December 11, 2013.
(1.7.1.2) 2–7 days – thismeans:
• all contracts transacted priorto Wednesday, December 11,2013, with a repurchase date onFriday, December 13, 2013, or anyday thereafter up to and includingWednesday, December 18, 2013;
• contracts transacted onWednesday, December 11, 2013,with an original repurchase date onFriday, December 13, 2013, or anyday thereafter up to and includingWednesday, December 18, 2013(irrespective of the purchase date,which will vary).
(1.7.1.3) More than 7 daysbut no more than 1 month – thismeans:• all contracts transacted priorto Wednesday, December 11, 2013,with a repurchase date on Thursday,December 19, 2013, or any daythereafter up to and includingMonday, January 13, 2014;• contracts transacted onWednesday, December 11, 2013,with an original repurchase date onThursday, December 19, 2013, orany day thereafter up to andincluding Monday, January 13,2014 (irrespective of the purchasedate, which will vary).
(1.7.1.4) More than 1 monthbut no more than 3 months – thismeans:• all contracts transacted priorto Wednesday, December 11,2013, with a repurchase date onTuesday, January 14, 2014, or anyday thereafter up to and includingTuesday, March 11, 2014;

ICMA EUROPEAN REPO MARKET SURVEY DECEMBER 2013 I 35
• contracts transacted onWednesday, December 11, 2013,with an original repurchase date onTuesday, January 14, 2014, or anyday thereafter up to and includingTuesday, March 11, 2014(irrespective of the purchase date,which will vary).
(1.7.1.5) More than 3 monthsbut no more than 6 months – thismeans:• all contracts transacted priorto Wednesday, December 11, 2013,with a repurchase date onWednesday, March 12, 2014, or anyday thereafter up to and includingWednesday, June 11, 2014;• contracts transacted onWednesday, December 11, 2013,with an original repurchase date onWednesday, March 12, 2014, orany day thereafter up to andincluding Wednesday, June 11,2014 (irrespective of the purchasedate, which will vary).
(1.7.1.6) More than 6 monthsbut no more than 12 months – thismeans;• all contracts transacted priorto Wednesday, December 11,2013, with a repurchase date onThursday, June 12, 2014, or anyday thereafter up to and includingThursday, December 11, 2014;
• contracts transacted onWednesday, December 11, 2013,with an original repurchase date onThursday, June 12, 2014, or anyday thereafter up to and includingThursday, December 11, 2014(irrespective of the purchase date,which will vary).
(1.7.1.7) More than 12months – this means;• all contracts transacted priorto Wednesday, December 11,2013, with a repurchase date on
Friday, December 12, 2014, or anyday thereafter;• contracts transacted onWednesday, December 11, 2013,with an original repurchase date onor after Friday, December 12, 2014(irrespective of the purchase date,which will vary).
(1.7.2) Forward-forwardrepos are defined for the purposesof this survey as contracts with apurchase date of Monday,December 16, 2013, or later. Thereis therefore an overlap withcorporate/next transactions. If thelatter cannot be identifiedseparately, it is accepted that theywill be recorded as forward-forward repos.
(1.7.3) Open repos aredefined for the purposes of thissurvey as contracts that have nofixed repurchase date whennegotiated but are terminable ondemand by either counterparty.This item should be equal to item(1.6.3). Open repos should, intheory, be floating-rate, but inpractice are often re-fixedirregularly, so are being treatedseparately from floating-rate repo(1.6.2).
1.8 Please confirmwhether the transactions recordedin the various questions in (1.7)include your tri-party repobusiness. Some institutions do notconsolidate their tri-party repotransactions with their direct orvoice-brokered business becauseof delays in receiving reports fromtri-party agents or the complexityof their tri-party business.
1.9 Eurobonds should beincluded as fixed income securitiesissued “by other issuers” in the

36 I ICMA EUROPEAN REPO MARKET SURVEY DECEMBER 2013
countries in which the bonds areissued. This will typically beLuxembourg (1.9.10) and the UK(1.9.15). Equity collateral shouldbe recorded in (1.9.34).
(1.9.28) “Officialinternational financial institutions,including multilateral developmentbanks” include:
African Development Bank (AfDB)Asian Development Bank (AsDB)Caribbean Development Bank(CDB)Central American Bank forEconomic Integration (CABEI)Corporacion Andina de Fomento(CAF)East African Development Bank(EADB)European Bank for Reconstructionand Development (EBRD)European Commission(EC)/European Financial StabilityMechanism (EFSM)European Financial StabilityFacility (EFSF)European Investment Bank (EIB)European Stabilisation Mechanism(ESM)Inter-American Development BankGroup (IADB)International Fund for AgriculturalDevelopment (IFAD)Islamic Development Bank (IDB)Nordic Development Fund (NDF)Nordic Investment Bank (NIB)OPEC Fund for InternationalDevelopment (OPEC Fund)West African Development Bank(BOAD)World Bank Group (IBRD and IFC)
(1.9.29) “US in the form offixed income securities but settledacross Euroclear or Clearstream”means only domestic and Yankeebonds. This includes Reg.144abonds, but excludes Eurodollar and
US dollar global bonds, whichshould be treated as bonds issued“by other issuers” in the countriesin which the bonds were issued.This will typically be Luxembourg(1.9.10) and the UK (1.9.15).
(1.9.31) “Other OECDcountries” are Australia, Canada,Chile, Iceland, Israel, Korea,Mexico, New Zealand, Norway,Switzerland, Turkey and the US. Inthe case of collateral issued in theUS, only collateral settled acrossthe domestic US settlement systemshould be included in (1.9.31). UScollateral settled across Euroclearand Clearstream Luxembourgshould be recorded in (1.9.29).
(1.9.32) “Other non-OECDEuropean, Middle Eastern & Africancountries” should exclude any EUcountries, specifically, Bulgaria(1.9.16), Latvia (1.9.21), Malta(1.9.23) and Romania (1.9.25).
(1.9.35) “Equity” includesordinary shares, preference sharesand equity-linked debt such asconvertible bonds.
2 “Total value of securitiesloaned and borrowed by your repodesk” includes the lending andborrowing of securities with eithercash or securities collateral.Exclude any securities lending andborrowing done by desks otherthan your repo desk. If your repodesk does not do any securitieslending and borrowing, this line willbe a nil return.
3 “Active” means about oncea week or more often.

ICMA EUROPEAN REPO MARKET SURVEY DECEMBER 2013 I 37
For further help and information
If, having read the Guidance Notes,you have any further queries, pleasee-mail the ICMA Centre [email protected] orcontact one of the followingmembers of the ERC SteeringCommittee:
German speakerEduard Cia, HVB,[email protected] +49 89 378 14172
Italian speakerStefano Bellani, JP Morgan,[email protected],+44 20 7779 2399
English speakerEdward Mcaleer, Morgan Stanley,[email protected],+44 20 7677 9595
French speakerGodfried de Vidts, ICAP,[email protected],+44 20 7000 5803
This survey is being conducted bythe ICMA Centre, University ofReading, UK, at the request ofICMA’s European Repo Council(ERC).
38 I ICMA EUROPEAN REPO MARKET SURVEY DECEMBER 2013
List of Jun Dec Jun Dec Jun Dec Jun Dec Jun Dec Jun Dec Jun Dec Jun Dec Jun Dec Jun Dec
respondents -04 -04 -05 -05 -06 -06 -07 -07 -08 -08 -09 -09 -10 -10 -11 -11 -12 -12 -13 -13
ABN Amro Bank x x x x x x x x x x x x x x x x
Allied Irish Banks x x x x x x x x x x x x x x x x x
AXA Bank Europe x x x x x x x x x x x x x x x x
Banc Sabadell x x x x
Banca
dʼIntermediazione
Mobiliare (IMI) x
Banca Monte dei
Paschi di Siena x x x x x x x x x x x x x x x x x x x x
Banco BPI x
Banco Nazional
del Lavoro x x x x x
Banco Popular
Espanol x
Banco Santander x x x x x x x x x x x x x x x x x x x x
Banco Urquijo x x
Bank Austria x x x x x x x x x
Bank fuer Arbeit und
Wirtschaft und
Oesterreichische
Postsparkasse
(Bawag) x x x x x x x x x x x x x x x x x x x
Bank of America
(merged to become
Bank of America
Merrill Lynch) x x x
Bank of Ireland x x x x x x x x x x x x x x x x
Bank Przemyslowo-
Handlowy SA x x x x x x x x x x x x x x
Landesbank Berlin x x x x x x x x x x x x x x x x x x
Banque de
Luxembourg x x x x x x x x x x x x x x x x x x x x
Banque et Caisse
dʼEpargne de lʼEtat x x x x x x x x x x x x x x x x x x x x
Barclays Capital x x x x x x x x x x x x x x x x x x x x
Bayerische
Landesbank x x x x x x x x x x x x x x x x x x x x
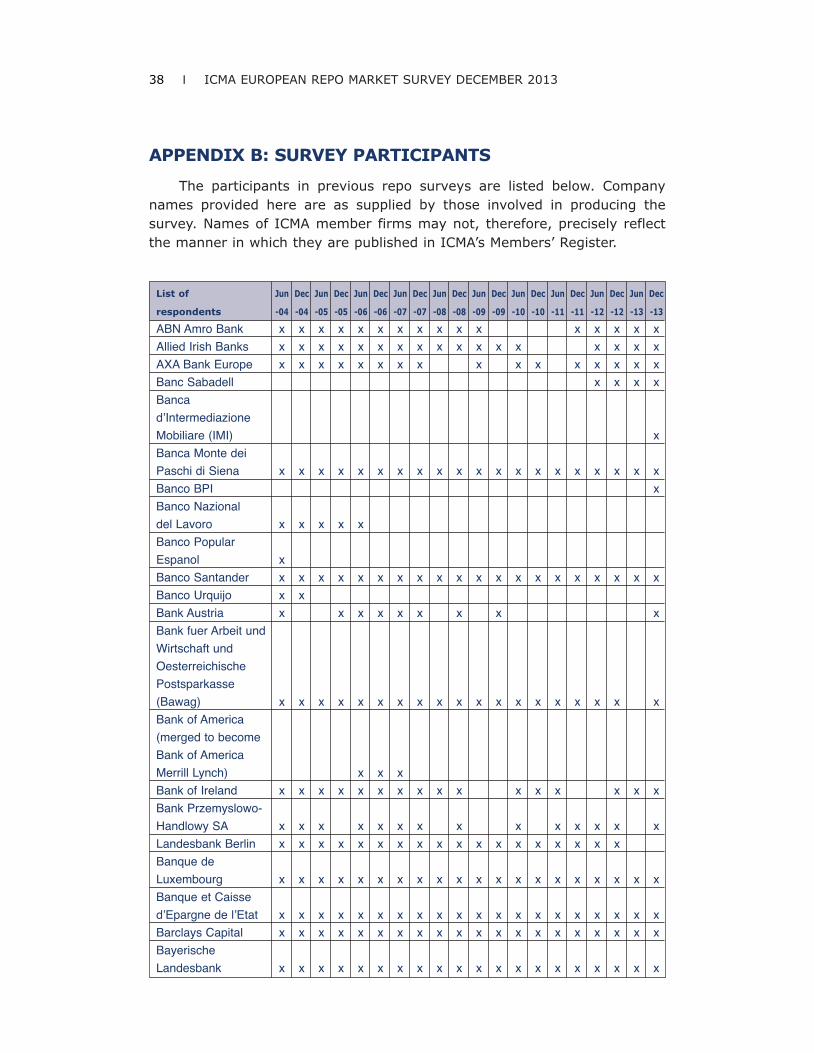
APPENDIX B: SURVEY PARTICIPANTS
The participants in previous repo surveys are listed below. Companynames provided here are as supplied by those involved in producing thesurvey. Names of ICMA member firms may not, therefore, precisely reflectthe manner in which they are published in ICMA’s Members’ Register.

ICMA EUROPEAN REPO MARKET SURVEY DECEMBER 2013 I 39
List of Jun Dec Jun Dec Jun Dec Jun Dec Jun Dec Jun Dec Jun Dec Jun Dec Jun Dec Jun Dec
respondents -04 -04 -05 -05 -06 -06 -07 -07 -08 -08 -09 -09 -10 -10 -11 -11 -12 -12 -13 -13
BBVA x x x x x x x x x x x x x x x x x x
BHF-Bank x x x x x x x x x x x x x x x x x x x
BHF-Bank
International x x x x x x x x x x x x x x x
BNP Paribas x x x x x x x x x x x x x x x x x x x
Bundesrepublik
Deutschland
Finanzagentur x x x x x x x x x x x x x x x x x
Caixa Bank x x x x
Caixa dʼEstalvis
de Catalunya x x x x x x x x x x x x x x
Bankia SA (formerly
Caja de Ahorros y
Monte de Piedad de
Madrid (Caja Madrid)) x x x x x x x x x x x x x x x x x x
CA-CIB
(formerly Calyon) x x x x x x x x x x x x x x x x x x x x
Capitalia x x x x x
NATIXIS
Zweigniederlassung
Deutschland x x x x x x x x
Citigroup Global
Markets Ltd x x x x x x x x x x x x x x x x x x x x
Commerzbank x x x x x x x x x x x x x x x x x x x x
Canadian Imperial
Bank of Commerce
and Credit (CIBC) x x x x x x x
Confederación
Española de Cajas
de Ahorros (CECA) x x x x x x x x x x x x x x x x x x x x
Credit Suisse
Securities
(Europe) Ltd x x x x x x x x x x x x x x x x x x x x
Danske Bank x x x x x x x x x x x x x x x x
Daiwa Securities
SMBC Europe x x x x x x x x x x x x x x x x x x x x
Dekabank Deutsche
Girozentrale x x x x x
DePfa ACS x x x x x x x x
DePfa Bank x x x
Deutsche Bank x x x x x x x x x x x x x x x x x x x x
Deutsche Postbank x x x x x x x x x x x x x x x x x x x x
Belfius Bank
(formerly Dexia) x x x x x x x x x x x x x x x x x x x x

40 I ICMA EUROPEAN REPO MARKET SURVEY DECEMBER 2013
List of Jun Dec Jun Dec Jun Dec Jun Dec Jun Dec Jun Dec Jun Dec Jun Dec Jun Dec Jun Dec
respondents -04 -04 -05 -05 -06 -06 -07 -07 -08 -08 -09 -09 -10 -10 -11 -11 -12 -12 -13 -13
Dexia BIL x x x x
Dexia Kommunal
Bank Deutschland x x x x x x x x x x x x x x
Dresdner Bank x x x x x x x x x x
DZ Bank x x x x x x x x x x x x x x x x x x x x
EFG Eurobank
Ergasias x x x x x x x x x x x x x x x x x x
Egnatia Bank x
Erste Bank der
Oesterreichischen
Sparkassen x x x x x x x x x x x x x x x x x x x x
Euroclear Bank x x x x x x x x x x x x x x x x x x x x
Eurohypo x x x x x
Hypothekenbank
Frankfurt International
(formerly Eurohypo
Europäische
Hypothekenbank) x x x x x x x x x x x x x x x
European Investment
Bank x x
Fortis Bank x x x x x x x x x x x x x x x x x x x x
Goldman Sachs x x x x x x x x x x x x x x x x x x x x
Halifax Bank of
Scotland x x x x x
HSBC x x x x
HSBC ATHENS X X X X X X X X
HSBC France x x x x x x x x x x x x
HSH Nordbank x x x
Bayerische Hypo-
und-Vereinsbank x x x x x x x x x x x x x x x x x x x x
IIB Bank
ING Bank x x x x x x x x x x x x x x x x x x
ING Belgium x x x
Intesa SanPaolo x x x x x x x x x x x x x x x x x x x
Jefferies
International Ltd x x x x
JP Morgan x x x x x x x x x x x x x x x x x x x x
KBC x x x x x x x x x x x x x x x x
KfW x x x x x x x x x x x x x
Kingdom of Belgium
Federal Public
Service Debt Agency x x x x x x x x x x x x x x x x x x x
Landesbank Baden-
Württemberg,
Stuttgart x x x x x x x x x x x x x x x x x x x x

ICMA EUROPEAN REPO MARKET SURVEY DECEMBER 2013 I 41
List of Jun Dec Jun Dec Jun Dec Jun Dec Jun Dec Jun Dec Jun Dec Jun Dec Jun Dec Jun Dec
respondents -04 -04 -05 -05 -06 -06 -07 -07 -08 -08 -09 -09 -10 -10 -11 -11 -12 -12 -13 -13
Landesbank Hessen-
Thüringen –
Girozentrale (Helaba) x x x x x x x x x x x x x x x x x x x
Landesbank
Rheinland Pfalz x x x x x x x
Landesbank
Sachsen Girozentrale x x x x x x x
Lehman Brothers x x x x x x x x x
Macquarie Bank x x x x x x
Bank of America
Merrill Lynch x x x x x x x x x x x x x x x x x x x
Mitsubishi Securities
International x x x x x x x x x x x x x x
Mizuho International x x x x x x x x x x x x x x x x x x x
Morgan Stanley x x x x x x x x x x x x x x x x x x x x
National Bank of
Greece x x x x x x x x x
Newedge x x x
Nomura International x x x x x x x x x x x x x x x x x x x x
Norddeutsche
Landesbank
Girozentrale x x x x x x x x x x x x
Nordea Markets x x x x x x x x x x x x x x x x x x x x
Norinchukin Bank x x x x x x x x x x x x x x x x x
Nova Ljubljanska
Banka d.d. x x x x x x x x x x x x
Rabobank x x x x x x x x x x x x x x x x x x x x
Royal Bank of
Canada x x
Royal Bank of
Scotland x x x x x x x x x x x x x x x x x x x
RBI x x x x x x x x x x x x x
Sal. Oppenheim Jr. x x x
Sampo Bank x x x
Société Générale x x x x x x x x x x x x x x x x x x x x
Toronto
Dominion Bank x x
UBS x x x x x x x x x x x x x x x x x x x x
Ulster Bank x x x x x
Unicredit/Bayerische
Hypo-un-Vereinsbank
Milano Branch x x x x x x x x x x x x x x x x x x x x
Vereins und
Westbank x

42 I ICMA EUROPEAN REPO MARKET SURVEY DECEMBER 2013
List of Jun Dec Jun Dec Jun Dec Jun Dec Jun Dec Jun Dec Jun Dec Jun Dec Jun Dec Jun Dec
respondents -04 -04 -05 -05 -06 -06 -07 -07 -08 -08 -09 -09 -10 -10 -11 -11 -12 -12 -13 -13
Westdeutsche
Landesbank
Girozentrale x x x x x x x x x
Zagrabacka Banka x x x x

ICMA EUROPEAN REPO MARKET SURVEY DECEMBER 2013 I 43
Q1 What are the total gross valuesof cash due to be repaid by you andrepaid to you on repo transactions 5,758 5,908 6,127 5,611 6,076 5,499maturing after (survey date) (figures in EUR billions)Of the amounts given in response to question (1) above:
Dec-09 Dec-10 Dec-11 Dec-12 Jun-13 Dec-131.1 How much was transacted: direct with counterparties• in the same country as you 19.7% 18.6% 16.3% 14.0% 16.8% 15.5%• cross-border in (other) eurozone countries 14.5% 12.7% 10.6% 11.7% 12.1% 12.5%• cross-border in non-eurozone countries 19.8% 20.3% 22.8% 25.3% 23.4% 25.2%through voice-brokers
• in the same country as you 9.8% 11.0% 11.9% 9.4% 7.4% 7.5%• cross-border in (other)
eurozone countries 5.0% 4.5% 4.0% 3.6% 4.1% 3.5%• cross-border in
non-eurozone countries 3.8% 4.8% 4.4% 3.3% 3.1% 4.1%on ATSs with counterparties
• in the same country as you 4.2% 4.0% 5.7% 6.3% 6.5% 3.1%• cross-border in (other)
eurozone countries 2.4% 2.9% 3.2% 3.7% 2.6% 2.0%• cross-border in
non-eurozone countries 2.6% 2.9% 3.2% 3.0% 2.8% 1.6%• anonymously across a
GC financing system 4.4%• anonymously through a central
clearing counterparty but not GC financing 18.3% 18.5% 17.9% 19.8% 21.1% 20.6%
1.2 Total through a central clearing counterparty 29.4% 32.3% 32.0% 31.7% 25.9% 30.9%
1.3 How much of the cash is denominated in:
• EUR 65.6% 62.7% 59.8% 61.4% 64.8% 66.3%• GBP 12.3% 10.5% 11.5% 13.3% 10.6% 10.2%• USD 15.9% 20.1% 17.1% 17.3% 15.2% 14.8%• SEK, DKK 2.4% 2.0% 2.0% 2.1% 2.5% 2.5%
APPENDIX C:SUMMARY OF SURVEY RESULTS

44 I ICMA EUROPEAN REPO MARKET SURVEY DECEMBER 2013
Dec-09 Dec-10 Dec-11 Dec-12 Jun-13 Dec-13• JPY 2.7% 3.6% 7.0% 4.5% 4.9% 4.9%• CHF 0.5% 0.2% 1.5% 0.1% 0.2% 0.1%• other currencies 0.5% 1.0% 1.0% 1.3% 1.8% 1.3%
1.4 How much is cross-currency? 2.6% 5.6% 3.0% 2.1% 3.1% 0.9%1.5 How much is:
• classic repo 86.2% 85.8% 87.0% 87.2% 87.6% 86.0%• documented sell/buy-backs 10.9% 10.6% 9.7% 10.8% 10.7% 12.4%• undocumented sell/buy-backs 2.9% 3.6% 3.3% 2.0% 1.8% 1.6%
1.6 How much is: • fixed rate 88.9% 86.4% 84.2% 74.7% 77.4% 78.8%• floating rate 7.0% 7.6% 9.7% 7.8% 6.6% 8.6%• open 4.1% 5.9% 6.0% 17.4% 13.5% 12.6%
1.7 How much repo is for value before (survey date)and has a remaining term to maturity of:
• 1 day 22.1% 20.9% 15.8% 17.0% 18.2% 19.9%• 2-7days 18.2% 18.9% 16.3% 16.3% 15.2% 15.8%• more than 7 days but no
more than 1 month 22.6% 22.7% 16.0% 17.2% 23.8% 22.0%• more than 1 month but no
more than 3 months 15.1% 15.2% 16.5% 16.0% 10.7% 16.6%• more than 3 months but no
more than 6 months 4.9% 5.4% 4.3% 4.1% 4.1% 4.6%• more than 6 months 4.6% 3.6% 2.9% 2.9% 4.5% 3.1%• more than 12 months 1.1% 1.0% 12.7% 5.9% 4.1% 3.1%• forward-forward repos 11.3% 6.7% 9.6% 7.8% 12.1% 8.8%• open 5.1% 5.7% 5.8% 12.7% 7.3% 6.2%
1.8 How much is tri-party repo: 11.5% 10.5% 11.4% 9.5% 9.6% 9.9%• for fixed terms to maturity 88.5% 89.5% 87.7% 91.9% 94.8% 95.1%• on an open basis 8.0% 11.6% 12.3% 12.6% 5.2% 4.7%
1.9 How much is against collateral issued in:
Austria• by the central government 0.8% 1.0% 1.4% 0.9% 1.0% 1.0%• by other issuers 0.2% 0.2% 0.1% 0.1% 0.1% 0.1%
Belgium• by the central government 1.6% 2.2% 3.2% 2.7% 2.7% 2.2%• by other issuers 0.1% 0.1% 0.9% 0.8% 0.7% 0.7%
Denmark• by the central government 0.2% 0.4% 0.5% 0.4% 0.5% 0.5%• by other issuers 0.4% 0.6% 0.4% 0.6% 0.8% 0.7%
Finland• by the central government 0.3% 0.3% 0.6% 0.6% 0.5% 0.5%• by other issuers 0.0% 0.0% 0.0% 0.1% 0.0% 0.0%

ICMA EUROPEAN REPO MARKET SURVEY DECEMBER 2013 I 45
Dec-09 Dec-10 Dec-11 Dec-12 Jun-13 Dec-13
France• by the central government 6.5% 7.3% 8.1% 9.6% 10.3% 10.0%• by other issuers 2.2% 2.1% 1.6% 1.5% 1.4% 1.4%
Germany• by the central government 20.9% 18.7% 15.4% 16.7% 16.6% 17.3%• pfandbrief 1.3% 1.3% 1.0% 1.5% 0.7% 0.4%• by other issuers 4.3% 4.3% 4.4% 3.8% 4.6% 4.2%
Greece• by the central government 2.0% 0.5% 0.2% 0.1% 0.0% 0.0%• by other issuers 0.2% 0.0% 0.0% 0.0% 0.0% 0.0%
Ireland• by the central government 0.6% 0.3% 0.2% 0.1% 0.4% 0.5%• by other issuers 0.9% 0.5% 0.1% 0.1% 0.7% 0.2%
Italy• by the central government 10.3% 9.8% 6.4% 8.3% 7.8% 8.7%• by other issuers 0.6% 0.5% 0.6% 0.4% 0.4% 0.5%
Luxembourg• by the central government 0.2% 0.1% 0.1% 0.1% 0.1% 0.1%• by other issuers 0.5% 0.4% 0.6% 0.9% 1.3% 1.2%
Netherlands• by the central government 1.7% 1.7% 2.9% 2.6% 2.7% 2.5%• by other issuers 0.6% 0.6% 0.9% 0.9% 0.9% 0.7%
Portugal• by the central government 0.9% 0.8% 0.3% 0.2% 0.2% 0.2%• by other issuers 0.4% 0.1% 0.0% 0.0% 0.0% 0.0%
Spain• by the central government 3.2% 3.9% 5.3% 4.2% 4.0% 4.6%• by other issuers 1.0% 1.2% 1.4% 0.7% 0.6% 0.6%
Sweden• by the central government 1.0% 0.5% 0.7% 0.7% 0.7% 0.9%• by other issuers 0.6% 0.8% 0.7% 0.8% 0.8% 0.8%
UK• by the central government 7.7% 8.0% 10.6% 12.4% 10.5% 9.8%• by other issuers 4.7% 3.6% 1.9% 1.8% 1.5% 1.6%
US but settled across EOC/CS 3.1% 3.1% 3.1% 2.6% 2.6% 2.8%other countriesBulgaria
• by the central government 0.0% 0.0% 0.0% 0.0% 0.0% 0.0%• by other issuers 0.0% 0.0% 0.0% 0.0% 0.0% 0.0%
Cyprus• by the central government 0.0% 0.0% 0.0% 0.0% 0.0% 0.0%• by other issuers 0.0% 0.0% 0.0% 0.0% 0.0% 0.0%
Czech Republic• by the central government 0.0% 0.0% 0.0% 0.0% 0.0% 0.0%

46 I ICMA EUROPEAN REPO MARKET SURVEY DECEMBER 2013
Dec-09 Dec-10 Dec-11 Dec-12 Jun-13 Dec-13
• by other issuers 0.0% 0.0% 0.0% 0.0% 0.0% 0.0%Estonia
• by the central government 0.0% 0.0% 0.0% 0.0% 0.0% 0.0%• by other issuers 0.0% 0.0% 0.0% 0.0% 0.0% 0.0%
Hungary• by the central government 0.1% 0.1% 0.2% 0.0% 0.1% 0.1%• by other issuers 0.0% 0.0% 0.0% 0.0% 0.0% 0.0%
Latvia• by the central government 0.0% 0.0% 0.0% 0.0% 0.0% 0.0%• by other issuers 0.0% 0.0% 0.0% 0.0% 0.0% 0.0%
Lithuania• by the central government 0.0% 0.0% 0.0% 0.0% 0.0% 0.0%• by other issuers 0.0% 0.0% 0.0% 0.0% 0.0% 0.0%
Malta• by the central government 0.0% 0.0% 0.0% 0.0% 0.0% 0.0%• by other issuers 0.0% 0.0% 0.0% 0.0% 0.0% 0.0%
Poland• by the central government 0.2% 0.2% 0.2% 0.2% 0.2% 0.2%• by other issuers 0.0% 0.0% 0.0% 0.0% 0.0% 0.0%
Romania• by the central government 0.0% 0.0% 0.0% 0.0% 0.0% 0.0%• by other issuers 0.0% 0.0% 0.0% 0.0% 0.0% 0.0%
Slovak Republic• by the central government 0.0% 0.0% 0.0% 0.0% 0.0% 0.0%• by other issuers 0.0% 0.0% 0.0% 0.0% 0.0% 0.0%
Slovenia• by the central government 0.2% 0.0% 0.0% 0.0% 0.0% 0.0%• by other issuers 0.0% 0.0% 0.0% 0.0% 0.0% 0.1%• official international institutions 0.8% 1.4% 2.2% 2.7%
Japan 2.1% 2.6% 5.2% 3.2% 4.2% 4.6%• other OECD 10.5% 13.7% 10.4% 12.7% 12.1% 10.3%• non-OECD EMEA 0.5% 0.6% 0.8% 0.7% 0.6% 0.6%• non-OECD Asian & Pacific 0.1% 0.3% 0.6% 0.8% 0.3% 0.4%• non-OECD Latin America 0.2% 0.4% 0.7% 0.5% 0.5% 0.5%• equity 0.5% 0.7% 0.0% 0.5% 0.3% 0.3%
collateral of unknown origin 6.8% 6.3% 7.0% 4.0% 4.3% 2.5%collateral in tri-party which cannot be attributed to a country or issuer 2.6%Q2 What is the total value of securitiesloaned and borrowed by your repo desk: to/from counterpartiesin the same country as you in
• fixed income 38.4% 46.8% 39.8% 40.8% 37.3% 38.8%• in equity 1.9% 1.7% 1.8% 0.8% 2.8% 1.1%

ICMA EUROPEAN REPO MARKET SURVEY DECEMBER 2013 I 47
Dec-09 Dec-10 Dec-11 Dec-12 Jun-13 Dec-13
• cross-border in (other) eurozone countries
• in fixed income 20.9% 16.8% 20.2% 16.1% 20.9% 23.8%• in equity 3.5% 3.6% 0.3% 1.2% 0.9% 2.3%• cross-border in
non-eurozone countries• in fixed income 35.4% 30.3% 35.8% 39.5% 36.8% 32.3%• in equity 1.4% 0.8% 2.1% 1.6% 1.3% 1.8%
for which the term to maturity is• fixed 74.9% 75.3% 70.1% 54.5% 50.7% 54.7%• open 25.1% 24.7% 29.9% 45.5% 49.3% 45.3%

APPENDIX D: THE ICMAEUROPEAN REPOCOUNCIL
The ICMA European RepoCouncil (ERC) is the forum where therepo dealer community meets andforges consensus solutions to thepractical problems of a rapidlyevolving marketplace. In this role, ithas been consolidating and codifyingbest market practice. The contactand dialogue that takes place at theERC underpins the strong sense ofcommunity and common interestthat characterises the professionalrepo market in Europe.
The ERC was established inDecember 1999 by the InternationalCapital Market Association (ICMA,which was then called theInternational Securities MarketAssociation or ISMA) as a bodyoperating under ICMA auspices.
Membership of the ERC is opento any ICMA member who hascommenced, or has undertaken tocommence, a dedicated repo activity,is willing to abide by the rulesapplicable to its and has sufficientprofessional expertise, financialstanding and technical resources tomeet its obligations as a member.
The ERC meets twice a year(usually in February/March andSeptember) at different financialcentres across Europe. The SteeringCommittee now comprises 19members elected annually andmeets four times a year.
More information about the ERCis available on www.icmagroup.org.
48 I ICMA EUROPEAN REPO MARKET SURVEY DECEMBER 2013