international capital market association european …...eur 2019 5 chapter 1: the survey on june 5,...
TRANSCRIPT
Number 37 - Conducted June 2019Published November 2019
International Capital Market Association
European Repo MarketSurvey

European Repo Market Survey November 20192
DisclaimerThis report has been compiled by Richard Comotto, Senior Visiting Fellow, ICMA Centre at Reading University.
© International Capital Market Association (ICMA), Zurich, 2019. All rights reserved.
No part of this publication may be reproduced or transmitted in any form or by any means without permission from ICMA. This report is intended for general information only and is not intended to be nor should it be relied upon as being legal, financial, investment tax, regulatory, business or other professional advice. Users of this report should seek appropriate independent advice before entering into any kind of specific transaction. While the information contained in this report is taken from sources believed to be reliable, neither ICMA nor the author represents or warrants that it is accurate, suitable or complete and neither ICMA nor the author shall have any liability arising from or relating to the use of this report and its contents.

European Repo Market Survey November 2019 3
Contents
Executive Summary 4
Chapter 1: The Survey 51.1 What the survey asked 5
1.2 The response to the survey 5
1.3 The next survey 5
Chapter 2: Analysis of Survey Results 6Total repo business (Q1) 6
Trading analysis (Q1.1) 8
Geographical analysis (Q1.1) 9
Clearing and settlement analysis (Q1.2 and Q1.8) 10
Cash currency analysis (Q1.3 and Q1.4) 10
Collateral analysis (Q1.9) 11
Contract analysis (Q1.5) 16
Repo rate analysis (Q1.6) 16
Maturity analysis (Q1.7) 17
Product analysis (Q2) 21
Concentration analysis 21
Chapter 3: Conclusion 23
About the Author 24
Appendix A: Survey Guidance Notes 25For further help and information 28
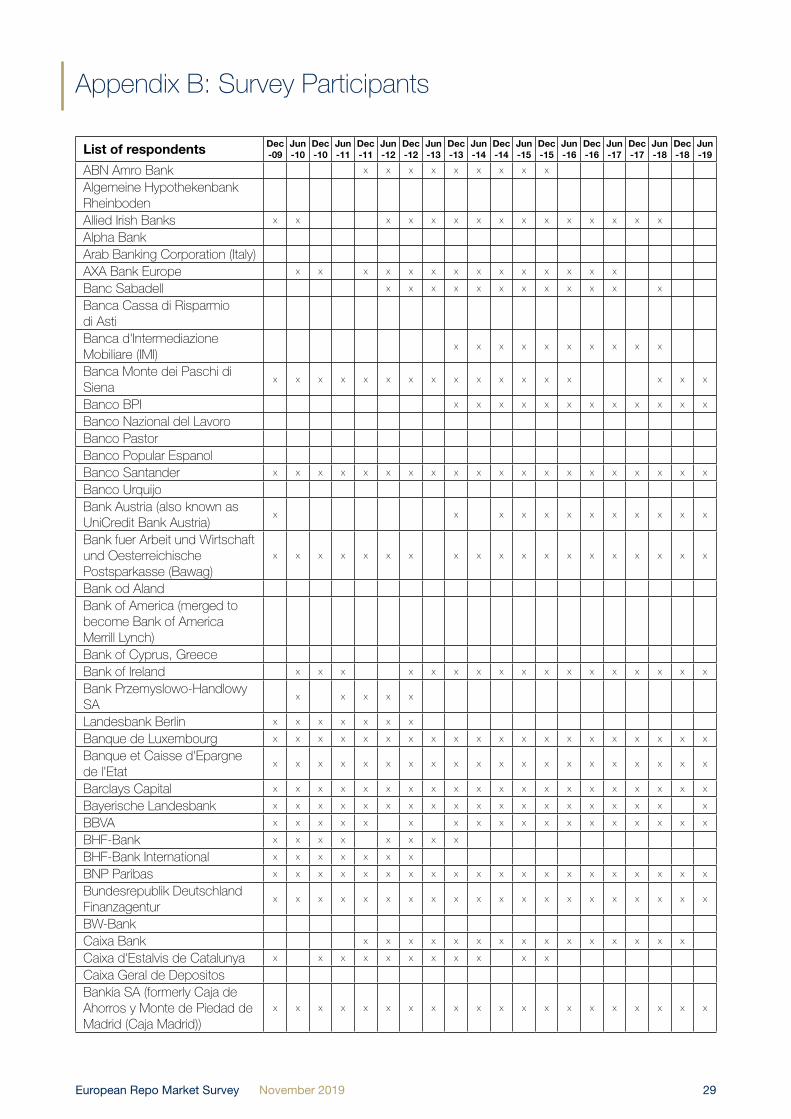
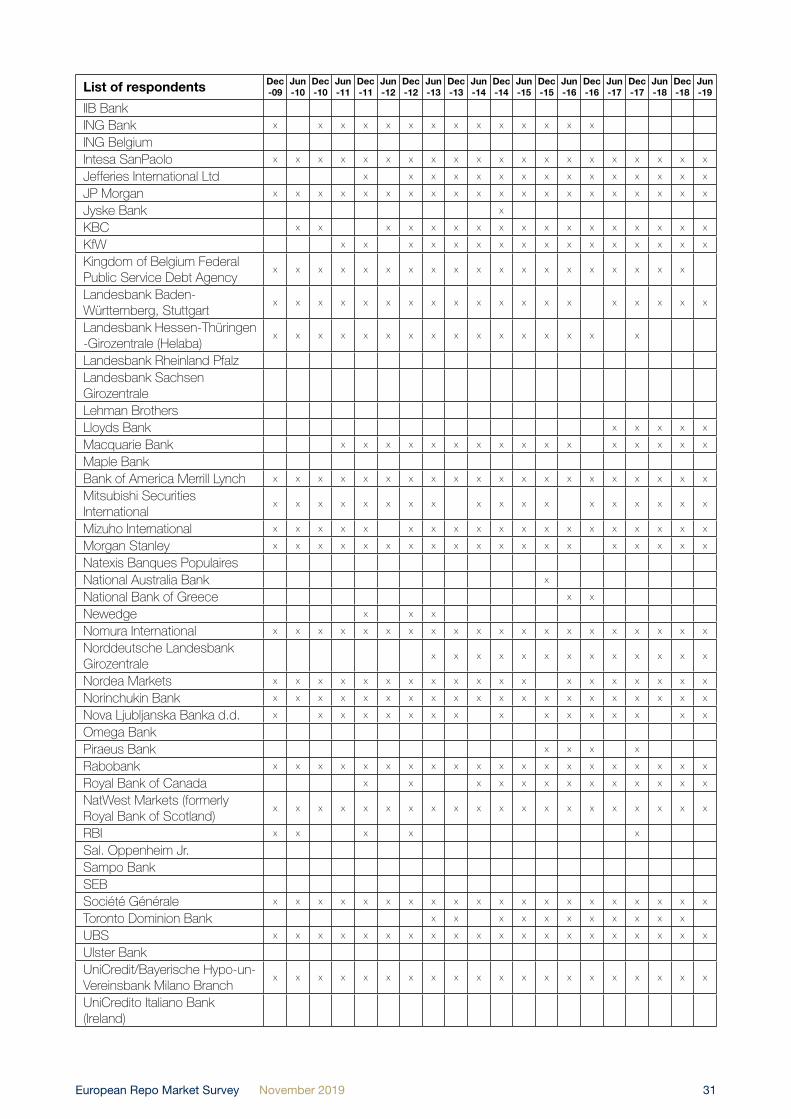
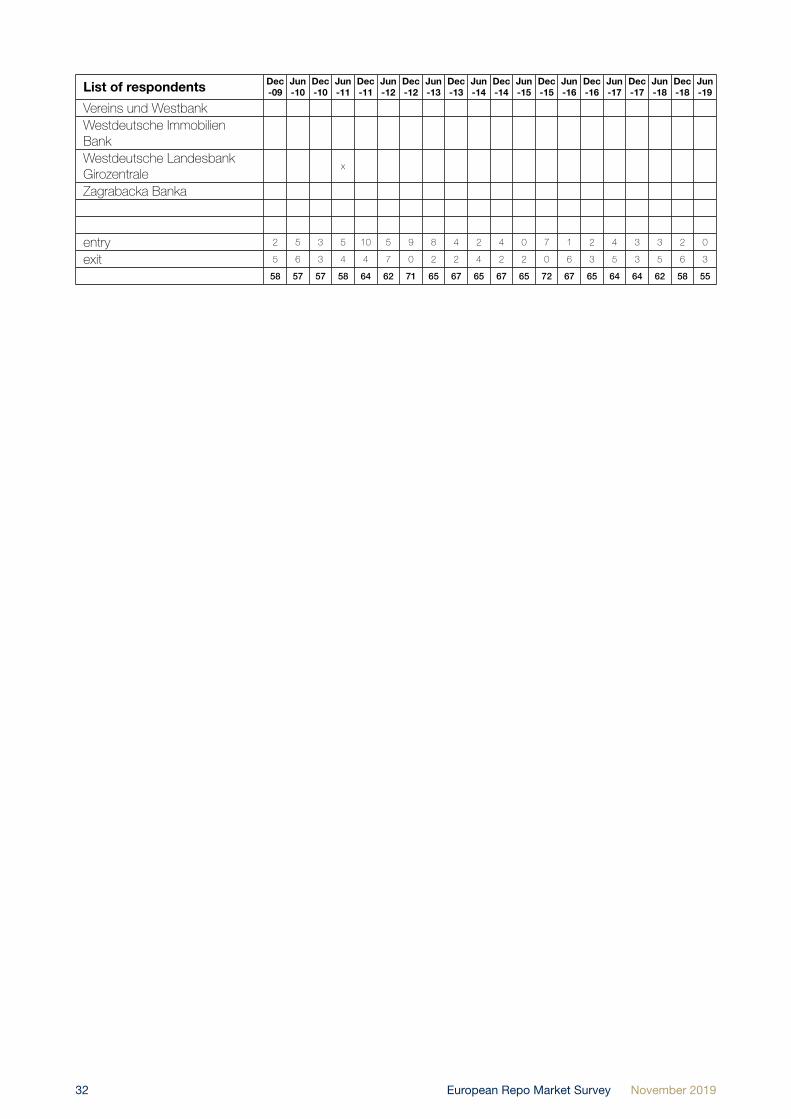
Appendix B: Survey Participants 29
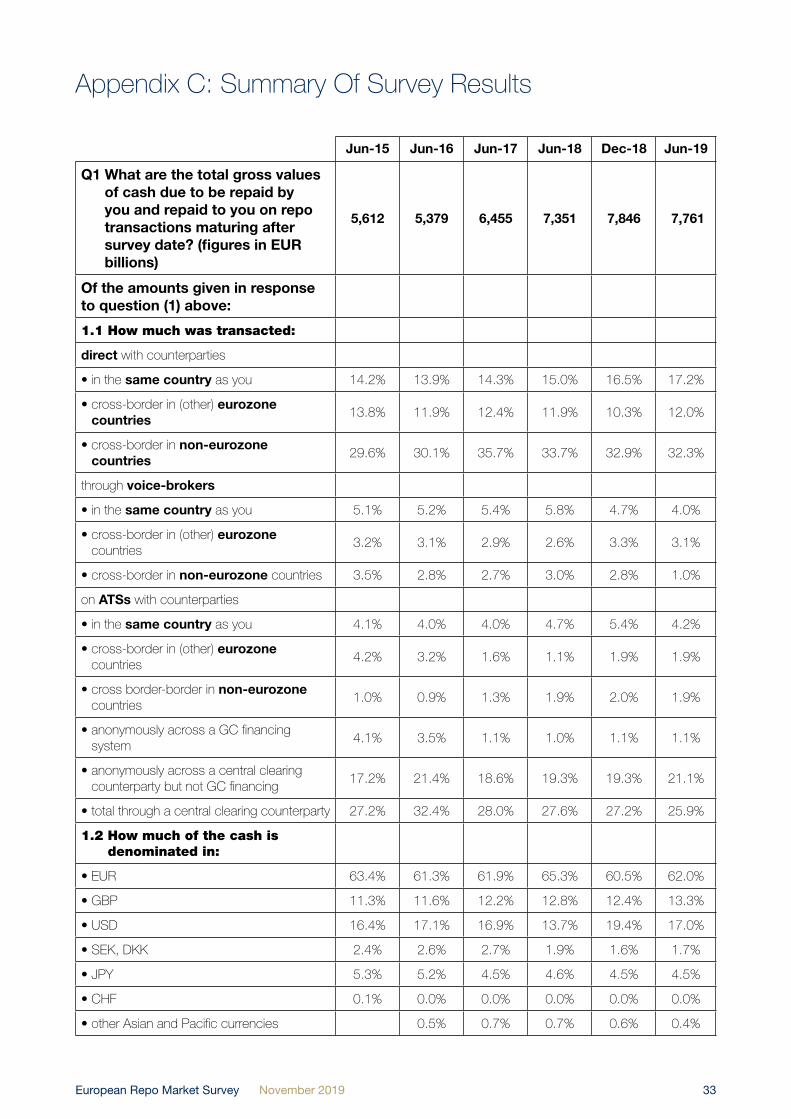
Appendix C: Summary Of Survey Results 33
Appendix D: The ICMA European Repo And Collateral Council 39
European Repo Market Survey November 20194
Executive Summary
In June 2019, the European Repo and Collateral Council (ERCC) of the International Capital Market Association (ICMA) conducted the 37th in its series of semi-annual surveys of the repo market in Europe. The latest survey asked a sample of financial institutions in Europe for the value and breakdown of their repo contracts that were still outstanding at close of business on June 5, 2019. Replies were received from 55 offices of 51 financial groups, mainly banks. Returns were also made directly by the principal automatic repo trading systems (ATS) and tri-party repo agents in Europe.
Total repo business
The total value of the repo contracts outstanding on the books of the 55 institutions who participated in the latest survey was EUR 7,761 billion, compared with the EUR 7,846 billion in December 2018, a rise of 5.6% year-on-year but a fall in the headline number of 1.1% since the June 2018 survey.
Trading analysis
Directly-negotiated repo (including tri-party repo) recovered sharply, despite increased electronic business transacted over automatic repo trading systems (ATS). This was largely due to a drop in the volume of business through voice-brokers to a new all-time low.
Geographical analysis
Cross-border business fell back slightly and domestic business more so, reflecting a surge in CCP-cleared (anonymous) electronic repo. There was a jump in domestic business on ATS, driven by repo against Italian government securities.
Clearing and settlement analysis
Tri-party repo in the survey continued to recover, rising to 8%.
Cash currency analysis
The US dollar fell back, largely to the benefit of the euro.
Collateral analysis
The share of EU government bonds rose to their highest level since 2002. Italian government securities were a major driver. The share of German collateral touched a record low.
Maturity analysis
Short-dated repos recovered at the expense of repos between one and three months, possibly due to seasonal factors. However, the weighted average term to maturity lengthened significantly. The share of forward repos fell back from its record high.
Concentration analysis
The concentration of business within the top 20 participants in the survey sample was significantly reduced.

European Repo Market Survey November 2019 5
Chapter 1: The Survey
On June 5, 2019, the European Repo and Collateral Council (ERCC) of the International Capital Market Association (ICMA) conducted the 37th in its series of semi-annual surveys of the repo market in Europe.
The survey was managed and the results analysed on behalf of ICMA by the author, who is based at the ICMA Centre at Reading University in England, under the guidance of the ERCC Steering Committee (“ERCC Committee”).
1.1 What the survey askedThe survey asked financial institutions operating in a number of European financial centres for the value of the cash side of repo and reverse repo contracts still outstanding at close of business on Wednesday, June 5, 2019.
The questionnaire also asked these institutions to analyse their business in terms of: the currency; the type of counterparty, contract and repo rate; the remaining term to maturity; the method of settlement; and the origin of the collateral. In addition, institutions were asked about securities lending and borrowing conducted on their repo desks.
The detailed results of the survey are set out in Appendix C. An extract of the accompanying Guidance Notes is reproduced in Appendix A.
Separate returns were made directly by the principal automatic repo trading systems (ATS) and tri-party repo agents in Europe. Once again, no return was made by the London-based European Venues and Intermediaries Association (EVIA), formerly the Wholesale Market Brokers’ Association (WMBA), because of an insufficient number of respondents.
1.2 The response to the surveyThe latest survey was completed by 55 offices of 51 financial groups. This is three fewer than in the December 2018 survey. Five institutions dropped out of the survey and two rejoined.
41 of the participants were headquartered across 14 European countries, including Norway (1) and Switzerland (2). Others were headquartered in Australia (1), Japan (4) and North America (8). 22 respondents were affiliates of foreign parents. Most (19) were located in the UK. 38 participants were headquartered across 14 of the 28 member states of the EU (there were no institutions in the survey from Finland and Sweden, and only one from a former Accession State). 29 participants were headquartered across 12 of the 19 countries of the eurozone.
Many institutions provided data for their entire European repo business. Others provided separate returns for one or more (but not necessarily all) of their European offices. A list of the institutions that have participated in the ICMA’s repo surveys is contained in Appendix B.
1.3 The next surveyThe next survey is scheduled to take place at close of business on Wednesday, December 11, 2019.
Any financial institution wishing to participate in the next survey will be able to download copies of the questionnaire and accompanying Guidance Notes from ICMA’s web site. The latest forms will be published shortly before the next survey at the following website: www.icmagroup.org/surveys/repo/participate.
Questions about the survey should be sent by e-mail to [email protected]. Institutions who participate in a survey receive, in confidence, a list of their rankings in the various categories of the survey.

European Repo Market Survey November 20196
Chapter 2: Analysis of Survey Results
The aggregate results of the latest two surveys and of the surveys in each June in the four previous years (2015-2019) are set out in Appendix C. The full results of all previous surveys can be found at www.icmagroup.org.
Due to a late correction in the response by a large participant to the December 2018 survey, there has been a significant change to the headline number of that survey and small revisions to other data.
Total repo business (Q1)The total value, at close of business on June 5, 2019, of repos and reverse repos outstanding on the books of the 55 institutions which participated in the latest survey was EUR 7,761.4 billion, compared with a revised total for December 2018, which was EUR 7,845.6 billion. This means the latest survey showed a rise of 5.6% year-on-year but a fall in the headline number of 1.1% since the December 2018 survey. Average daily turnover over the six months since the previous survey was about EUR 840 billion per day, which was 1.6% higher than the second-half of 2018.
Table 2.1 – Total repo business from 2001 to June 2019 (EUR billion)
survey total repo reverse repo2019 June 7,761 48.1% 51.9%2018 December 7,846 48.5% 51.5%2018 June 7,351 48.7% 51.3%2017 December 7,250 47.8% 52.2%2017 June 6,455 48.5% 51.5%2016 December 5,656 48.1% 51.9%2016 June 5,379 48.0% 52.0%2015 December 5,608 47.5% 52.5%2015 June 5,612 48.0% 52.0%2014 December 5,500 48.8% 51.2%2014 June 5,782 48.6% 51.4%2013 December 5,499 49.2% 50.8%2013 June 6,076 49.8% 50.2%2012 December 5,611 49.1% 51.9%2012 June 5,647 48.7% 51.3%2011 December 6,204 50.3% 49.7%2011 June 6,124 50.7% 49.3%2010 December 5,908 51.0% 49.0%2010 June 6,979 53.5% 46.5%2009 December 5,582 50.0% 50.0%2009 June 4,868 52.2% 47.8%2008 December 4,633 49.9% 50.1%2008 June 6,504 48.8% 51.2%2007 December 6,382 49.4% 50.6%2007 June 6,775 50.8% 49.2%2006 December 6,430 50.7% 49.3%2006 June 6,019 51.7% 48.3%2005 December 5,883 54.6% 45.4%2005 June 5,319 52.4% 47.6%2004 December 5,000 50.1% 49.9%2004 June 4,561 50.6% 49.4%2003 December 3,788 51.3% 48.7%2003 June 4,050 50.0% 50.0%2002 December 3,377 51.0% 49.0%2002 June 3,305 50.0% 50.0%2001 December 2,298 50.4% 49.6%2001 June 1,863 49.6% 50.4%

European Repo Market Survey November 2019 7
Figure 2.1 – Total business (EUR billion)
-
1,000
2,000
3,000
4,000
5,000
6,000
7,000
8,000
Jun-
01De
c-01
Jun-
02De
c-02
Jun-
03De
c-03
Jun-
04De
c-04
Jun-
05De
c-05
Jun-
06De
c-06
Jun-
07De
c-07
Jun-
08De
c-08
Jun-
09De
c-09
Jun-
10De
c-10
Jun-
11De
c-11
Jun-
12De
c-12
Jun-
13De
c-13
Jun-
14D
ec-1
4Ju
n-15
Dec-
15Ju
n-16
Dec-
16Ju
n-17
Dec-
17Ju
n-18
Dec
-18
Jun-
19
It is important to remember that the survey measures the value of outstanding transactions at close of business on the survey date. Measuring the stock of transactions at one date, rather than the flow between two dates, permits deeper analysis but is difficult to reconcile with the flow numbers published by some other sources. As the survey is a ‘snapshot’ of the market, it can miss peaks and troughs in business between survey dates, especially of very short-term transactions
In addition, the values measured by the survey are ‘gross’ figures, which mean that they have not been adjusted for the double counting of the same transactions between pairs of survey participants. However, a study (see the report of the December 2012 survey) suggested that the problem of double-counting was not very significant.
Nor does the survey measure the value of repos transacted with central banks as part of official monetary policy operations, which continue to be very substantial.
In order to accurately gauge the growth of the European repo market (or at least that segment represented by the institutions who have participated in the survey), it is not valid to simply compare headline numbers. Some of the changes will represent the entry and exit of institutions into and out of the survey, mergers between banks and the reorganization of repo books within banks. To overcome the problem caused by changes in the sample of survey participants, comparisons are made of the aggregate outstanding contracts reported by a sub-sample of institutions which have participated continuously in several surveys.
Out of the 55 institutions in the latest survey, 52 have participated in all of the last three surveys. Overall, the aggregate value of outstanding repos and reverse repos transacted by that constant sample of these 52 institutions grew by 5.6% year-on-year but fell by 1.2% since the December 2018 survey, much the same as for the headline number. The change for the 54 institutions which participated in the last two surveys was the same.
The repo books of 32 of the 55 institutions in the latest survey contracted or did not change. The unweighted mean percentage change fell back to 44.7% from a revised 50.8% in December. The median percentage change declined to +2.5% from a revised 3.4%. The survey sample slightly increased its role as a net lender to the rest of the market.
European Repo Market Survey November 20198
Figure 2.2 – Total repo versus reverse repo business (EUR billion)
0500
1,0001,5002,0002,5003,0003,5004,000
repo reverse
Jun-
01D
ec-0
1Ju
n-02
Dec
-02
Jun-
03D
ec-0
3Ju
n-04
Dec
-04
Jun-
05D
ec-0
5Ju
n-06
Dec
-06
Jun-
07D
ec-0
7Ju
n-08
Dec
-08
Jun-
09D
ec-0
9Ju
n-10
Dec
-10
Jun-
11D
ec-1
1Ju
n-12
Dec
-12
Jun-
13D
ec-1
3Ju
n-14
Dec
-14
Jun-
15D
ec-1
5Ju
n-16
Dec
-16
Jun-
17D
ec-1
7Ju
n-18
Jun-
19D
ec-1
8
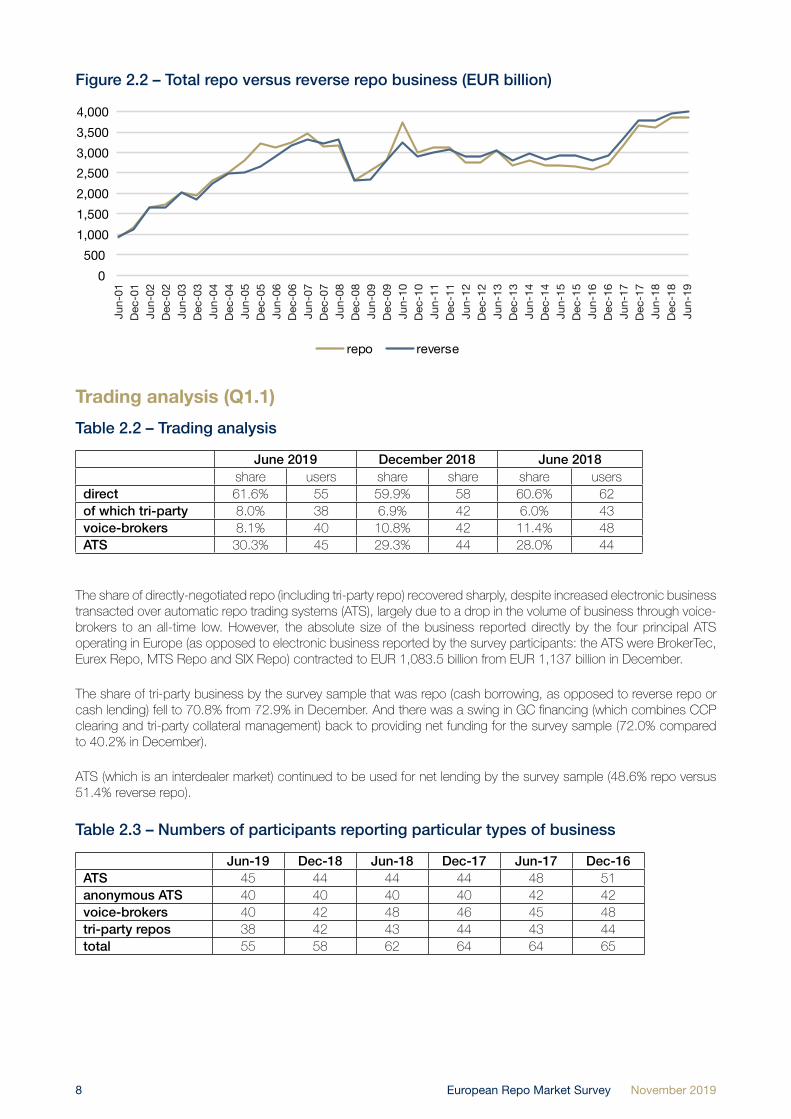
Trading analysis (Q1.1)
Table 2.2 – Trading analysis
June 2019 December 2018 June 2018share users share share share users
direct 61.6% 55 59.9% 58 60.6% 62of which tri-party 8.0% 38 6.9% 42 6.0% 43voice-brokers 8.1% 40 10.8% 42 11.4% 48ATS 30.3% 45 29.3% 44 28.0% 44
The share of directly-negotiated repo (including tri-party repo) recovered sharply, despite increased electronic business transacted over automatic repo trading systems (ATS), largely due to a drop in the volume of business through voice-brokers to an all-time low. However, the absolute size of the business reported directly by the four principal ATS operating in Europe (as opposed to electronic business reported by the survey participants: the ATS were BrokerTec, Eurex Repo, MTS Repo and SIX Repo) contracted to EUR 1,083.5 billion from EUR 1,137 billion in December.
The share of tri-party business by the survey sample that was repo (cash borrowing, as opposed to reverse repo or cash lending) fell to 70.8% from 72.9% in December. And there was a swing in GC financing (which combines CCP clearing and tri-party collateral management) back to providing net funding for the survey sample (72.0% compared to 40.2% in December).
ATS (which is an interdealer market) continued to be used for net lending by the survey sample (48.6% repo versus 51.4% reverse repo).
Table 2.3 – Numbers of participants reporting particular types of business
Jun-19 Dec-18 Jun-18 Dec-17 Jun-17 Dec-16ATS 45 44 44 44 48 51anonymous ATS 40 40 40 40 42 42voice-brokers 40 42 48 46 45 48tri-party repos 38 42 43 44 43 44total 55 58 62 64 64 65

European Repo Market Survey November 2019 9
Figure 2.3 - Trading analysis
30.3%ATS
8.1%Voice-brokered
8.0%Direct tri-party
53.6%Direct bilateral
Geographical analysis (Q1.1)
Table 2.4 – Geographical analysis
June 2019 December 2018 June 2018share users share users share users
domestic 25.5% 27.1% 25.5 %cross-border to (other) eurozone
17.0% 15.6% 15.6%
cross-border to (other) non-eurozone
35.3% 37.3% 38.7%
anonymous 22.3% 40 20.0% 40 20.2% 40
Cross-border business fell back slightly and domestic business more so, reflecting a surge in CCP-cleared electronic repo. There was a jump in domestic business on ATS, driven by repo against Italian government securities.
Table 2.5 – Geographical comparisons in June 2019 (December 2018)
main survey ATS tri-party EVIA (WMBA)domestic 25.5% (27.1%) 46.1% (34.0%) 31.9% (32.3%)cross-border 52.3% (52.9%) 50.5% (66.0%) 68.1% (67.7%)anonymous 22.3% (20.0%)
Figure 2.4 - Geographical analysis
25.5%domestic
35.3%to non eurozone
22.3%anonymous ATS
16.9%to eurozone
European Repo Market Survey November 201910
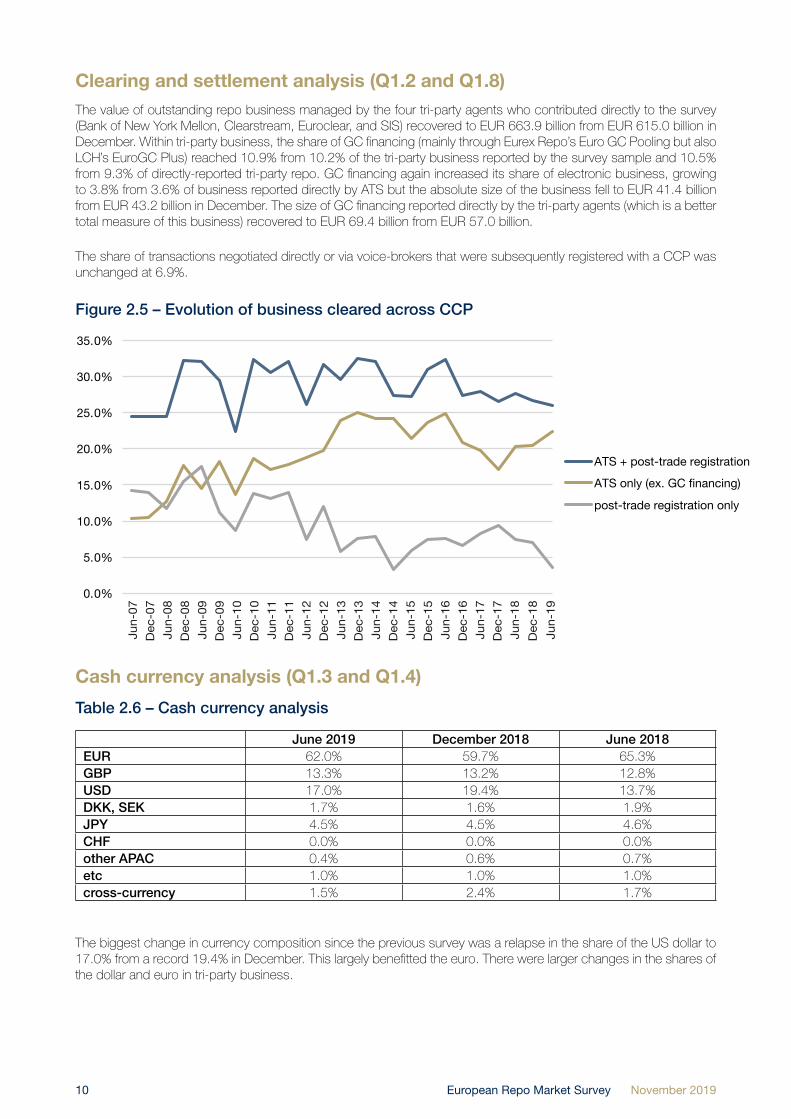
Clearing and settlement analysis (Q1.2 and Q1.8)The value of outstanding repo business managed by the four tri-party agents who contributed directly to the survey (Bank of New York Mellon, Clearstream, Euroclear, and SIS) recovered to EUR 663.9 billion from EUR 615.0 billion in December. Within tri-party business, the share of GC financing (mainly through Eurex Repo’s Euro GC Pooling but also LCH’s EuroGC Plus) reached 10.9% from 10.2% of the tri-party business reported by the survey sample and 10.5% from 9.3% of directly-reported tri-party repo. GC financing again increased its share of electronic business, growing to 3.8% from 3.6% of business reported directly by ATS but the absolute size of the business fell to EUR 41.4 billion from EUR 43.2 billion in December. The size of GC financing reported directly by the tri-party agents (which is a better total measure of this business) recovered to EUR 69.4 billion from EUR 57.0 billion.
The share of transactions negotiated directly or via voice-brokers that were subsequently registered with a CCP was unchanged at 6.9%.
Figure 2.5 – Evolution of business cleared across CCP
0.0%
5.0%
10.0%
15.0%
20.0%
25.0%
30.0%
35.0%
ATS + post-trade registration
ATS only (ex. GC financing)
post-trade registration only
Jun-
07D
ec-0
7Ju
n-08
Dec
-08
Jun-
09D
ec-0
9Ju
n-10
Dec
-10
Jun-
11D
ec-1
1Ju
n-12
Dec
-12
Jun-
13D
ec-1
3Ju
n-14
Dec
-14
Jun-
15D
ec-1
5Ju
n-16
Dec
-16
Jun-
17D
ec-1
7
Dec
-18
Jun-
18
Jun-
19
Cash currency analysis (Q1.3 and Q1.4)
Table 2.6 – Cash currency analysis
June 2019 December 2018 June 2018EUR 62.0% 59.7% 65.3%GBP 13.3% 13.2% 12.8%USD 17.0% 19.4% 13.7%DKK, SEK 1.7% 1.6% 1.9%JPY 4.5% 4.5% 4.6%CHF 0.0% 0.0% 0.0%other APAC 0.4% 0.6% 0.7%etc 1.0% 1.0% 1.0%cross-currency 1.5% 2.4% 1.7%
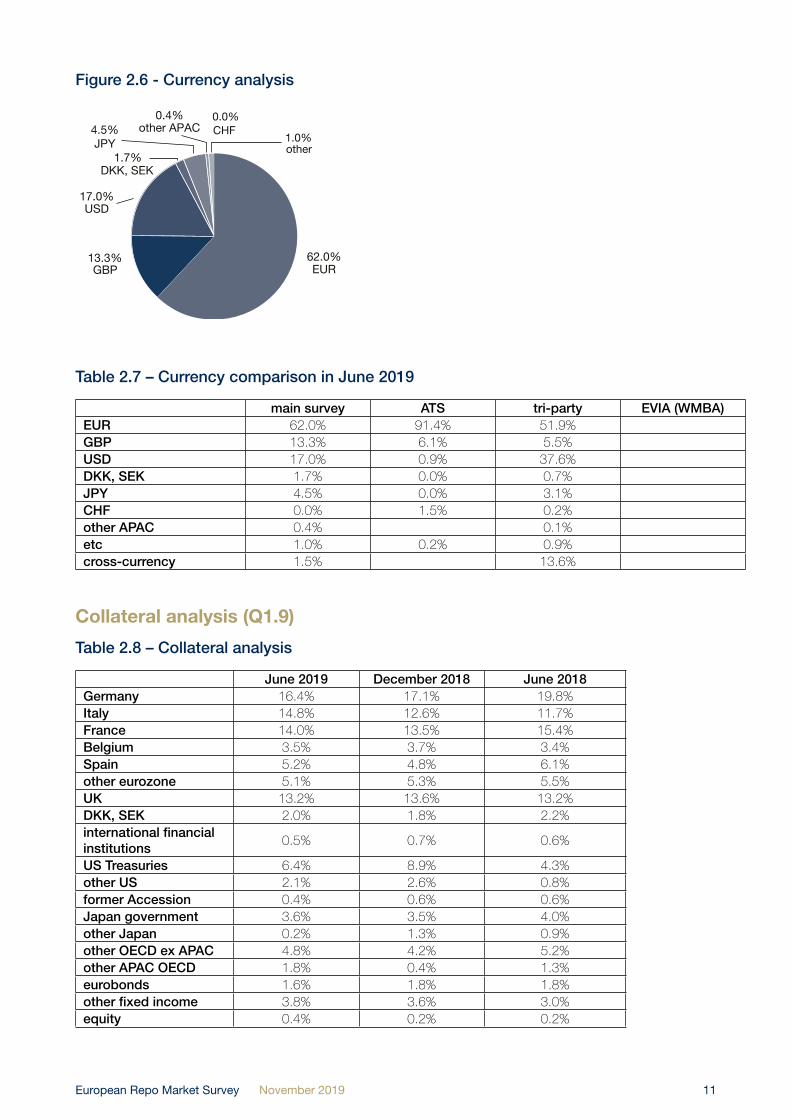
The biggest change in currency composition since the previous survey was a relapse in the share of the US dollar to 17.0% from a record 19.4% in December. This largely benefitted the euro. There were larger changes in the shares of the dollar and euro in tri-party business.
European Repo Market Survey November 2019 11
Figure 2.6 - Currency analysis
4.5%JPY
CHFother APAC0.0%0.4%
62.0%EUR
13.3%GBP
17.0%USD
1.7%DKK, SEK
1.0%other
Table 2.7 – Currency comparison in June 2019
main survey ATS tri-party EVIA (WMBA)EUR 62.0% 91.4% 51.9%GBP 13.3% 6.1% 5.5%USD 17.0% 0.9% 37.6%DKK, SEK 1.7% 0.0% 0.7%JPY 4.5% 0.0% 3.1%CHF 0.0% 1.5% 0.2%other APAC 0.4% 0.1%etc 1.0% 0.2% 0.9%cross-currency 1.5% 13.6%
Collateral analysis (Q1.9)
Table 2.8 – Collateral analysis
June 2019 December 2018 June 2018Germany 16.4% 17.1% 19.8%Italy 14.8% 12.6% 11.7%France 14.0% 13.5% 15.4%Belgium 3.5% 3.7% 3.4%Spain 5.2% 4.8% 6.1%other eurozone 5.1% 5.3% 5.5%UK 13.2% 13.6% 13.2%DKK, SEK 2.0% 1.8% 2.2%international financial institutions
0.5% 0.7% 0.6%
US Treasuries 6.4% 8.9% 4.3%other US 2.1% 2.6% 0.8%former Accession 0.4% 0.6% 0.6%Japan government 3.6% 3.5% 4.0%other Japan 0.2% 1.3% 0.9%other OECD ex APAC 4.8% 4.2% 5.2%other APAC OECD 1.8% 0.4% 1.3%eurobonds 1.6% 1.8% 1.8%other fixed income 3.8% 3.6% 3.0%equity 0.4% 0.2% 0.2%
European Repo Market Survey November 201912
Figure 2.7 - Collateral analysis (main survey)
8.6%Accession countries(outside eurozone)
Belgium
France
Germany
Italy
Spainother
eurozone
Japan
other OECDIFI
others
16.4%
6.6%
3.5%5.8%
14.0%
0.5%
14.8%
5.2%5.1%
13.2%DKK, SEK
3.7%
2.0%US
0.4%UK
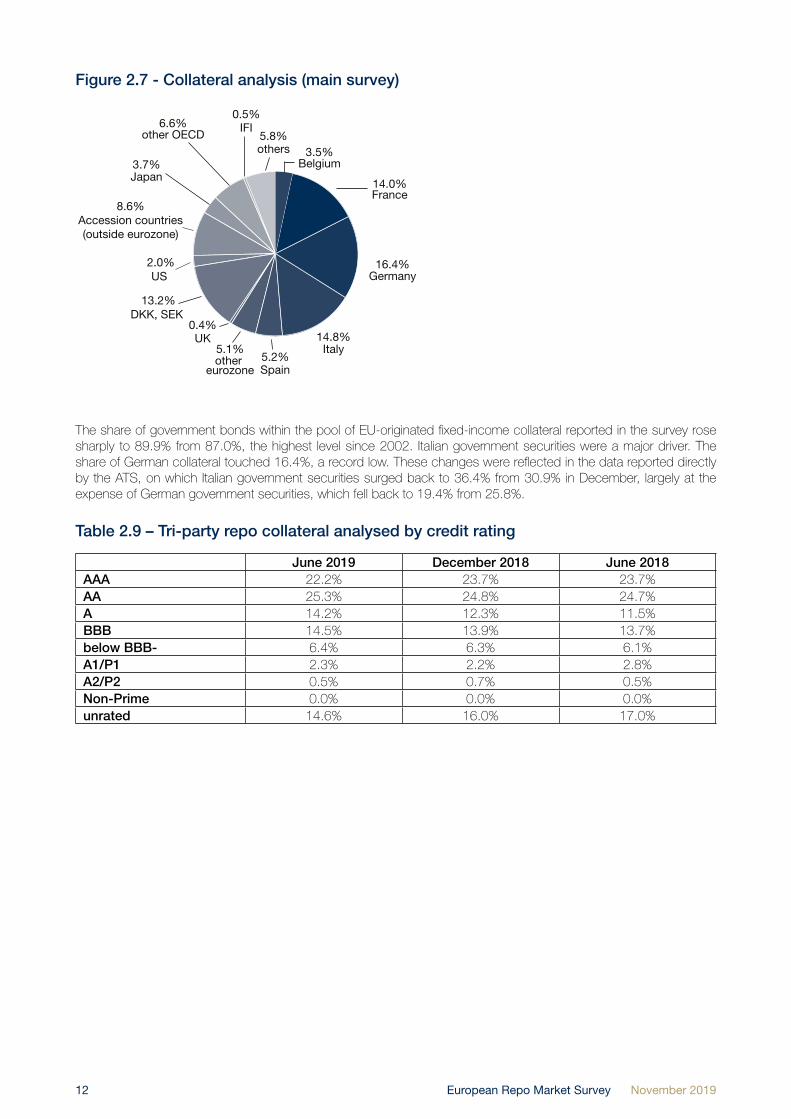
The share of government bonds within the pool of EU-originated fixed-income collateral reported in the survey rose sharply to 89.9% from 87.0%, the highest level since 2002. Italian government securities were a major driver. The share of German collateral touched 16.4%, a record low. These changes were reflected in the data reported directly by the ATS, on which Italian government securities surged back to 36.4% from 30.9% in December, largely at the expense of German government securities, which fell back to 19.4% from 25.8%.
Table 2.9 – Tri-party repo collateral analysed by credit rating
June 2019 December 2018 June 2018AAA 22.2% 23.7% 23.7%AA 25.3% 24.8% 24.7%A 14.2% 12.3% 11.5%BBB 14.5% 13.9% 13.7%below BBB- 6.4% 6.3% 6.1%A1/P1 2.3% 2.2% 2.8%A2/P2 0.5% 0.7% 0.5%Non-Prime 0.0% 0.0% 0.0%unrated 14.6% 16.0% 17.0%

European Repo Market Survey November 2019 13
Figure 2.8 - Collateral analysis (tri-party agents) by credit rating
-20.0%
-10.0%
0.0%
10.0%
20.0%
30.0%
unratedNPA2/P2A1/P1subBBBBBBAAA AAA-30.0%
Table 2.10 – Tri-party repo collateral analysed by type of asset
June 2019 December 2018 June 2018government securities 43.7% 47.2% 43.8%public agencies / sub-national governments 6.6% 9.4% 11.4%supranational agencies 2.5% 2.5% 2.4%corporate bonds 15.6% 16.3% 16.6%covered bonds 7.8% 7.7% 6.7%residential mortgage-backed 1.3% 1.6% 1.3%commercial mortgage-backed 0.3% 0.2% 0.1%other asset-backed 1.5% 1.2% 0.9%CDO, CLN, CLO, etc 1.3% 1.2% 1.0%convertible bonds 1.2% 1.4% 1.5%equity 17.4% 10.3% 13.4%other 0.9% 1.2% 1.0%
European Repo Market Survey November 201914
Figure 2.9 – Historic collateral analysis (tri-party agents) by credit rating
0.0%
10.0%
20.0%
30.0%
40.0%
50.0%
60.0%
Jun-0
9
Dec-09
Jun-1
0
Dec-10
Jun-1
1
Dec-11
Jun-1
2
Dec-12
Jun-1
3
Dec-13
Jun-1
4
Dec-14
Jun-1
5
Dec-15
Jun-1
6
Dec-16
Jun-1
7
Dec-17
Dec-18
Jun-1
7
Jun-1
9
AAA
AA
A
BBB
subBBB
A1/P1
A2/P2
NP
unrated
Figure 2.10 - Collateral analysis (tri-party agents) by type of asset
Government
Corporate
Covered
Equity
other
43.7%
17.4%
6.5%
2.5%Supranational Public &
subnational
6.6%
15.6%
7.8%
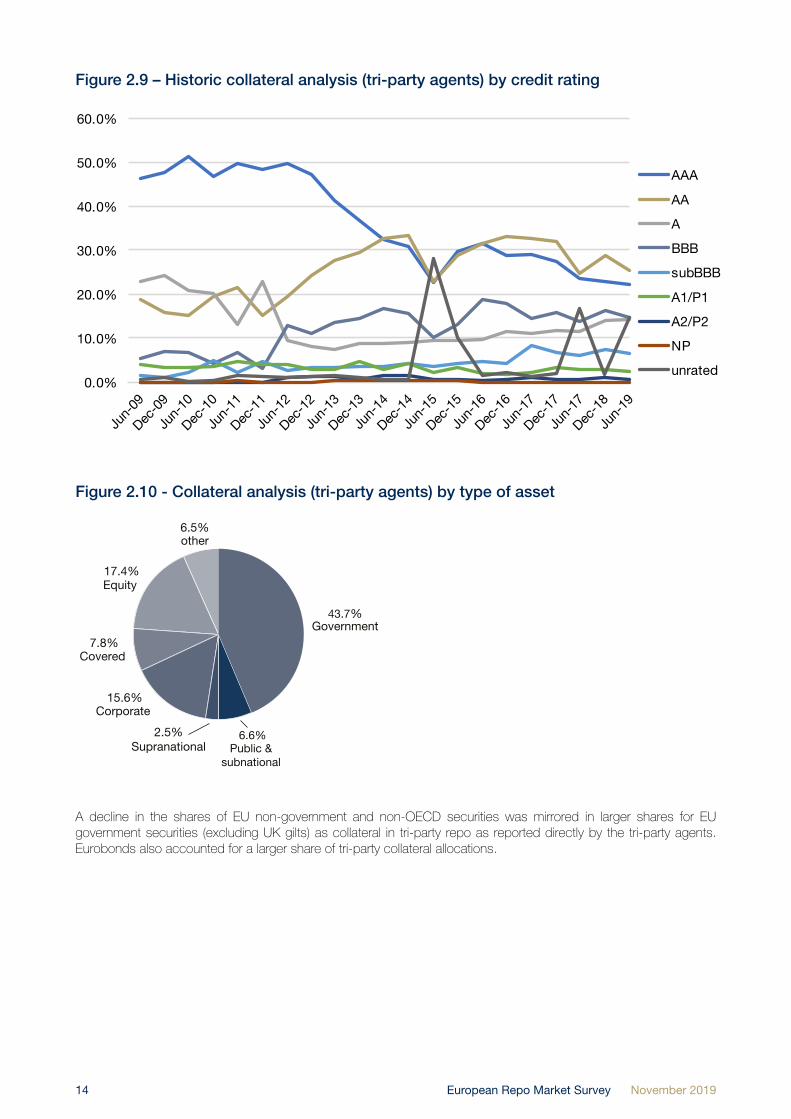
A decline in the shares of EU non-government and non-OECD securities was mirrored in larger shares for EU government securities (excluding UK gilts) as collateral in tri-party repo as reported directly by the tri-party agents. Eurobonds also accounted for a larger share of tri-party collateral allocations.
European Repo Market Survey November 2019 15
Figure 2.11 – Historic collateral analysis (tri-party agents) by type of asset
0.0%
10.0%
20.0%
30.0%
40.0%
50.0%
60.0%
Jun-0
9
Dec-09
Jun-1
0
Dec-10
Jun-1
1
Dec-11
Jun-1
2
Dec-12
Jun-1
3
Dec-13
Jun-1
4
Dec-14
Jun-1
5
Dec-15
Jun-1
6
Dec-16
Jun-1
7
Dec-17
Dec-18
Jun-1
8
Jun-1
9
government
public & sub
supranational
corporate
covered
M/ABS
equity
other
Table 2.11 – Tri-party repo collateral haircuts analysed by type of asset
(weighted average haircuts) June 2019 December 2018 June 2018government securities 2.3% 2.6% 2.7%public agencies / sub-national governments 2.8% 2.7% 2.5%supranational agencies 1.9% 2.7% 1.9%corporate bonds (financial)
5.8% 5.6% 6.1%corporate bonds (non-financial)covered bonds 2.6% 3.4% 3.1%residential mortgage-backed
6.8% 6.5% 6.3%commercial mortgage-backedother asset-backed 3.1% 4.8% 3.9%CDO, CLN, CLO, etc 6.0% 5.1% 4.1%convertible bonds 1.8% 5.9% 8.5%equity 4.4% 7.0% 7.1%other 3.8% 2.6% 2.7%

European Repo Market Survey November 201916
Contract analysis (Q1.5)
Figure 2.12 - Contract analysis
Repurchaseagreements
Documentedsell/buy-back
92.4%
7.3% 0.2%Undocumentedsell/buy-back
In the latest survey, respondents were asked to report the total number of repo master agreements which they had in place and the number of these agreements which were the ICMA’s Global Master Repurchase Agreement (GMRA). Among the banks that responded, there was an average of over 600 agreements in place, of which, some 78% were GMRAs, confirming the status of this agreement as a global standard. Other agreements took a larger than average share at German, Japanese and US banks, which would appear to reflect their large domestic markets, where local agreements are more common.
Table 2.12 – Contract comparison in December 2018 (June 2018)
main survey ATS tri-partyrepurchase agreements 92.4% (93.3%) 90.9% (92.6%) 100.0% (100.0%)documented sell/buy-backs 7.3% (6.5%) 9.1% (7.4%)undocumented sell/buy-backs 0.2% (0.2%)
Repo rate analysis (Q1.6)
Figure 2.13 - Repo rate analysis
79.0%Fixed rate
14.1%Floating rate
6.9%Open
Floating-rate repo accounted for a significantly higher share of repo traded on ATS and, to a lesser extent, among the survey sample.
European Repo Market Survey November 2019 17
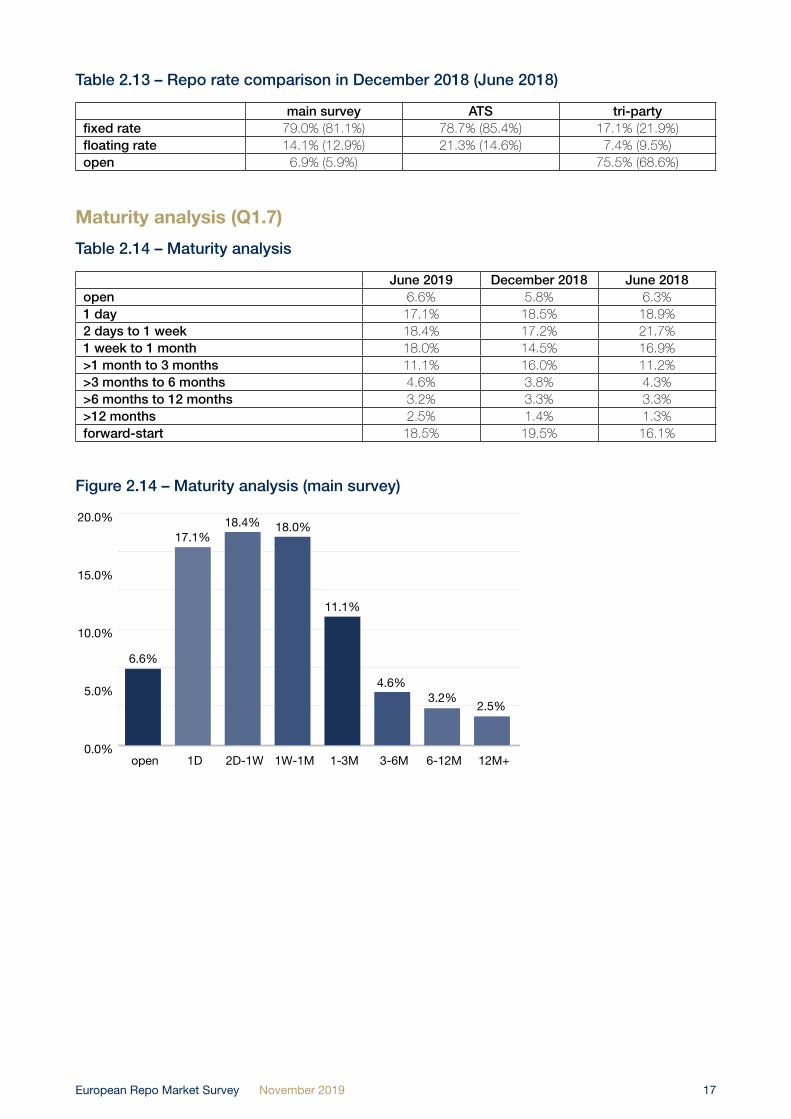
Table 2.13 – Repo rate comparison in December 2018 (June 2018)
main survey ATS tri-partyfixed rate 79.0% (81.1%) 78.7% (85.4%) 17.1% (21.9%)floating rate 14.1% (12.9%) 21.3% (14.6%) 7.4% (9.5%)open 6.9% (5.9%) 75.5% (68.6%)
Maturity analysis (Q1.7)
Table 2.14 – Maturity analysis
June 2019 December 2018 June 2018open 6.6% 5.8% 6.3%1 day 17.1% 18.5% 18.9%2 days to 1 week 18.4% 17.2% 21.7%1 week to 1 month 18.0% 14.5% 16.9%>1 month to 3 months 11.1% 16.0% 11.2%>3 months to 6 months 4.6% 3.8% 4.3%>6 months to 12 months 3.2% 3.3% 3.3%>12 months 2.5% 1.4% 1.3%forward-start 18.5% 19.5% 16.1%
Figure 2.14 – Maturity analysis (main survey)
6.6%
17.1%18.4% 18.0%
11.1%
4.6%
2.5%3.2%
18.5%
0.0%
5.0%
10.0%
15.0%
20.0%
fd-fd12M+6-12M3-6M1-3M1W-1M2D-1W1Dopen

European Repo Market Survey November 201918
Figure 2.15 – Maturity analysis: short dates, longer terms & forwards (main survey)
0.0%
10.0%
20.0%
30.0%
40.0%
50.0%
60.0%
70.0%
80.0%Ju
n-01
Dec-
01Ju
n-02
Dec-
02Ju
n-03
Dec-
03Ju
n-04
Dec-
04Ju
n-05
Dec-
05Ju
n-06
Dec-
06Ju
n-07
Dec-
07Ju
n-08
Dec-
08Ju
n-09
Dec-
09Ju
n-10
Dec-
10Ju
n-11
Dec-
11Ju
n-12
Dec-
12Ju
n-13
Dec-
13Ju
n-14
Dec-
14Ju
n-15
Dec-
15Ju
n-16
Dec-
16Ju
n-17
Dec-
17
Dec-
18Ju
n-18
Jun-
19
SD + open 1M+ forward
Figure 2.16 – Maturity analysis: non-forward terms (main survey)
0.0%
10.0%
20.0%
30.0%
40.0%
50.0%
60.0%
70.0%
80.0%
Jun-
01De
c-01
Jun-
02De
c-02
Jun-
03De
c-03
Jun-
04De
c-04
Jun-
05De
c-05
Jun-
06De
c-06
Jun-
07De
c-07
Jun-
08De
c-08
Jun-
09De
c-09
Jun-
10De
c-10
Jun-
11De
c-11
Jun-
12De
c-12
Jun-
13De
c-13
Jun-
14De
c-14
Jun-
15De
c-15
Jun-
16De
c-16
Jun-
17De
c-17
Dec-
18Ju
n-18
Jun-
19
SD + open 1-6M 6M+

European Repo Market Survey November 2019 19
Figure 2.17 – Maturity analysis: breakdown of short dates plus open (main survey)
0.0%
5.0%
10.0%
15.0%
20.0%
25.0%
30.0%
35.0%Ju
n-01
Dec-
01Ju
n-02
Dec-
02Ju
n-03
Dec-
03Ju
n-04
Dec-
04Ju
n-05
Dec-
05Ju
n-06
Dec-
06Ju
n-07
Dec-
07Ju
n-08
Dec-
08Ju
n-09
Dec-
09Ju
n-10
Dec-
10Ju
n-11
Dec-
11Ju
n-12
Dec-
12Ju
n-13
Dec-
13Ju
n-14
Dec-
14Ju
n-15
Dec-
15Ju
n-16
Dec-
16Ju
n-17
Dec-
17
Dec-
18Ju
n-18
Jun-
19
1D 2D-1W 1W-1M open
The share of short-dated repos (one month or less remaining to maturity) recovered to 53.5% from 50.2%. Maturities between two days and one month expanded but fell back sharply between one and three months. These changes may reflect seasonal factors, in particular, increased demand for high-quality liquid assets to meet regulatory liquidity ratios at year-end and reduced demand in between. However, the weighted average term to maturity lengthened significantly to 30-69 days from 24-59 days (the lower end of the range assumes that all transactions have the minimum term in each maturity band: the upper end assumes the maximum term). The share of forward repos fell back to 18.5% from a record 19.3% in December.
Overall, the market as represented by the survey sample was a net cash borrower in short-dated repos and a net lender in other maturity brackets including.
Figure 2.18 – Maturity analysis (ATS)
0.0%
10.0%
20.0%
30.0%
40.0%
50.0%
60.0%
70.0%
80.0%
90.0%
forward>6M3-6M1-3M8D-1M2-7D1Dopen
0.1% 0.0%
89.8%
1.1%4.8% 2.5% 1.2% 0.5%

European Repo Market Survey November 201920
Figure 2.19 – Maturity analysis (tri-party agents)
0.0%
10.0%
20.0%
30.0%
40.0%
50.0%
>12M6-12M3-6M1-3M1W-1M2-7D1Dopen
49.4%
13.1%
6.2%
10.2%8.4% 7.5%
2.3% 3.0%
Table 12.15 – Maturity comparison in December 2018 (June 2018)
main survey ATS tri-party EVIA (WMBA)open 6.6% (5.8%) 49.4% (47.0%)1 day 17.1% (18.5%) - (86.0%) 13.1% (11.3%)
2 days to 1 week 18.4% (17.2%) 89.8% (8.0%) 6.2% (9.1%)
1 week to 1 month 18.0% (14.5%) 1.1% (2.5%) 10.2% (8.4%)
>1 month to 3 months 11.1% (16.0%) 4.8% (2.5%) 8.4% (10.9%)
>3 months to 6 months 4.6% (3.8%) 2.5% (0.4%) 7.5% (6.8%)
>6 months to 12 months 3.2% (3.3%) 0.7% (0.2%) 2.3% (3.5%)
>12 months 2.5% (1.4%) 0.5% (0.1%) 3.0% (3.1%)
forward-start 18.5% (19.5%) 0.5% (0.4%)

European Repo Market Survey November 2019 21
Product analysis (Q2)The share of securities lending conducted on repo desks retreated to 12.1% from 13.4%.
Figure 2.20 - Product analysis
87.9%Repo
12.1%Securities lending
Concentration analysis
Table 2.16 – Concentration analysis
June 2019 December 2018 June 2018top 10 61.4% 67.7% 64.4%top 20 83.1% 86.3% 85.6%top 30 93.3% 95.0% 94.0%other 6.7% 5.0% 6.0%
Figure 2.21 - Concentration analysis
61.4%Top 10
10.2%Top 21-30
6.7%Remainder
21.6%Top 11-20
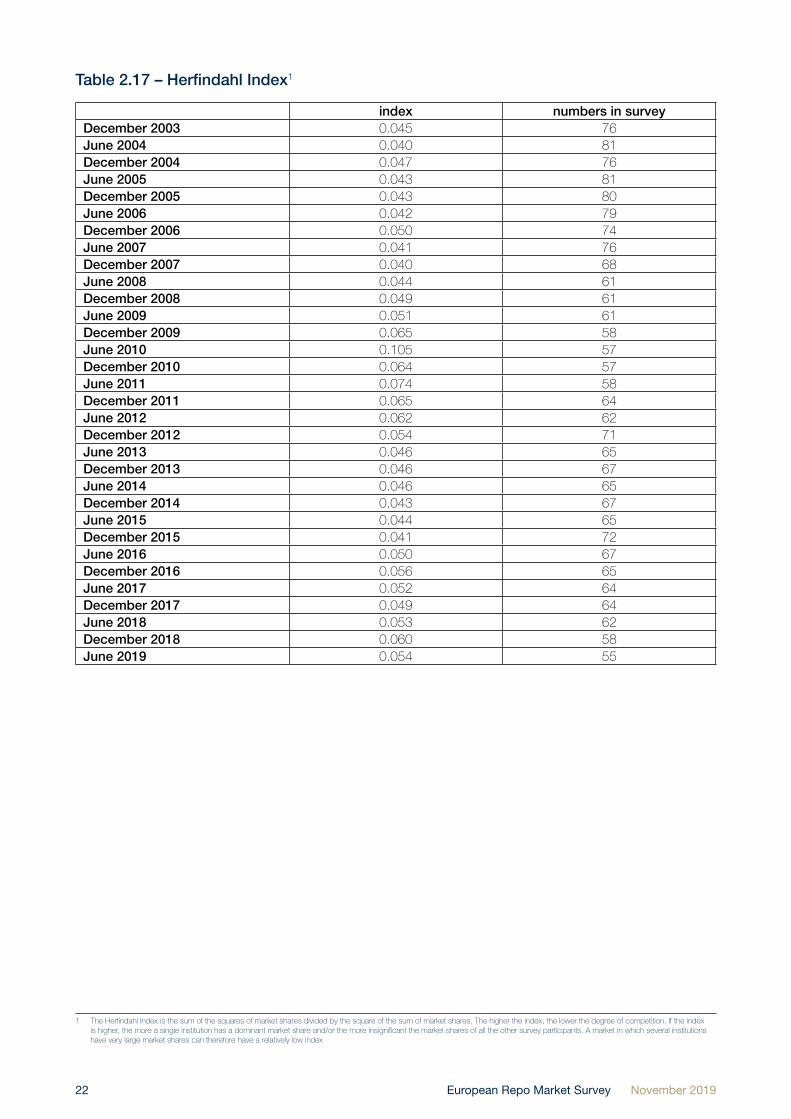
The concentration of business within the top 20 survey participants dropped significantly and was reflected in the Herfindahl Index, which fell to 5.4%.
European Repo Market Survey November 201922
Table 2.17 – Herfindahl Index1
index numbers in surveyDecember 2003 0.045 76June 2004 0.040 81December 2004 0.047 76June 2005 0.043 81December 2005 0.043 80June 2006 0.042 79December 2006 0.050 74June 2007 0.041 76December 2007 0.040 68June 2008 0.044 61December 2008 0.049 61June 2009 0.051 61December 2009 0.065 58June 2010 0.105 57December 2010 0.064 57June 2011 0.074 58December 2011 0.065 64June 2012 0.062 62December 2012 0.054 71June 2013 0.046 65December 2013 0.046 67June 2014 0.046 65December 2014 0.043 67June 2015 0.044 65December 2015 0.041 72June 2016 0.050 67December 2016 0.056 65June 2017 0.052 64December 2017 0.049 64June 2018 0.053 62December 2018 0.060 58June 2019 0.054 55
1 The Herfindahl Index is the sum of the squares of market shares divided by the square of the sum of market shares. The higher the index, the lower the degree of competition. If the index is higher, the more a single institution has a dominant market share and/or the more insignificant the market shares of all the other survey participants. A market in which several institutions have very large market shares can therefore have a relatively low index
European Repo Market Survey November 2019 23
Chapter 3: Conclusion
The European repo market survey, suggests the recovery of the market, as represented by the survey sample, that has been in progress since 2016 has paused, albeit close to its record level. The slowdown in the repo market may have reflected the impact on financial markets of increased uncertainty in the global economy and the effect of inverting yield curves on fixed-income trading. One exception to this was Italian government bonds, which continued to recapture share in the repo market and performed very strongly in the first-half of 2019. Italian securities have been favoured by investors in their search for yield, notwithstanding continued concerns about economic and financial stability in Italy. German securities on the other hand look to have suffered from increasingly negative yields.
The end of quantitative easing in the eurozone at the end of 2018 may have boosted the recovery of tri-party repo, which is a source of general collateral funding that has suffered from the plentiful supply of central bank money.
The latest survey confirmed the role of the ICMA’s Global Master Repurchase Agreement (GMRA) as the standard legal agreement for repo in the cross-border and many domestic markets. Some 78% of legal agreements reported by the survey were GMRAs.

European Repo Market Survey November 201924
About the Author
This report was compiled by Richard Comotto, who is a Senior Visiting Fellow at the ICMA Centre at the University of Reading in England. He is also a Senior Consultant to the ICMA’s financial crisis, he has been advising the ICMA’s European, author of the ICMA’s ‘Guide to Best Practice in the European Repo Market’ and its Repo FAQs, Course Director of the ICMA Professional Repo Market Course and of the ICMA-ISLA GMRA-GMSLA Workshop, and a lead in the ICMA’s work on SFTR.
The author acts as an independent consultant providing research, advice and training on the international money, securities and derivatives markets to professional market associations, government agencies, regulatory authorities, international financial institutions, banks, brokers and financial information services. This includes advising technical assistance missions by the IMF, World Bank, other multilateral development banks and other organizations to build repo markets in emerging economies.
The author has written a number of books and articles on a range of financial topics, including the foreign exchange and money markets, swaps and electronic trading systems. He takes particular interest in the impact of electronic trading systems on the bond and repo markets. Following the financial crisis, he has been advising the ICMA’s European Repo and Collateral Council on regulatory initiatives and has produced a series of papers: in July 2010, a ‘White paper on the operation of the European repo market, the role of short-selling, the problem of settlement failures and the need for reform of the market infrastructure’; in September 2011, ‘Interconnectivity of central and commercial bank money in the clearing and settlement of the European repo market’; in February 2012, ‘Haircuts and Initial Margins in the Repo Market’; in March 2012, ‘Shadow Banking and Repo’; and in ‘Collateral damage: the impact of the Financial Transaction Tax on the European repo market’ in April 2013.
The author served for ten years at the Bank of England, within its Foreign Exchange Division and on secondment to the International Monetary Fund in Washington DC.

European Repo Market Survey November 2019 25
Appendix A: Survey Guidance Notes
The following extract is based on the Guidance Notes issued to participants in conjunction with the survey that took place on Wednesday, June 5, 2019.
The data required by this survey are: the total value of the repos and reverse repos booked by your repo desk that are still outstanding at close of business on Wednesday, June 5, 2019, and various breakdowns of these amounts, as well as the total value of all repos and reverse repos turned over the six months since the previous survey (which was on December 5, 2018).
Branches of your bank in other countries in Europe may be asked to complete separate returns. If your repo transactions are booked at another branch, please forward the survey form to that branch. If branches of your bank in other countries run their own repo books, please copy the survey form to these branches, so that they can also participate in the survey. Please feel free to copy the survey form to other banks, if you discover that they have not received it directly.
Guidance Notes
General guidancea) Please fill in as much of the form as possible. For each question that you answer, you will receive back your
ranking in that category.
b) If your institution does not transact a certain type of repo business, please enter ‘N/A’ in the relevant fields. On the other hand, if your institution does that type of business but is not providing the data requested by the survey, please do not enter anything into the relevant field. If your institution does that type of business but has no transactions outstanding, please enter zero into the relevant field.
c) You only need to give figures to the nearest million. However, if you give figures with decimal points, please use full stops as the symbols for the decimal points, not commas. For nil returns, please use zeros, not dashes or text.
d) Please do not re-format the survey form, ie change its lay-out, and do not leave formulae in the cells of the underlying spreadsheet.
e) Include all varieties of repos, ie repurchase transactions (classic repos and pensions livrées) and sell/buy-backs (e.g. simultaneas and PCT). There is a separate question (see question 2) on securities lending and borrowing transactions (including securities lending and borrowing against cash collateral).
f) Exclude repo transactions undertaken with central banks as part of their official money market operations. Other repo transactions with central banks, e.g. as part of their reserve management operations, should be included.
g) Give the value of the cash which is due to be repaid on all repo and reverse repo contracts (not the market value or nominal value of the collateral) that are still outstanding at close of business on Wednesday, June 5, 2019. This means the value of transactions at their repurchase prices.
h) “Outstanding” means repos and reverse repos with a repurchase date, or which will roll over, on or after Thursday, June 6, 2019. You should include all open repos and reverse repos that have been rolled over from Wednesday, June 5, 2019, to a later date and all forward-forward repos and reverse repos that are still outstanding as forward contracts at close on Wednesday, June 5, 2019.
i) Give separate totals for (a) repos plus sell/buy-backs and (b) reverse repos plus buy/sell-backs.
j) The survey seeks to measure the value of repos and reverse repos on a transaction date basis, rather than a purchase date basis. This means that you should include all repo and reverse repo contracts that have been agreed before close of business on Wednesday, June 5, 2019, even if their purchase dates are later. An unavoidable consequence of using the transaction date is that tom/next and spot/next transactions that are rolled over will be counted more than once, eg a tom/next repo transacted on the day before the survey date and rolled over on the survey date will feature twice.
k) Give gross figures, i.e. do not net opposite transactions with the same counterparty. If this is not possible, please indicate that your figures are net.
l) In the case of equity repo, for synthetic structures, please give the value of the cash payment.
m) You should include intra-group transactions between different legal entities or between foreign branches and the parent company.
European Repo Market Survey November 201926
Guidance on specific questions in the survey form
1.1 Transactions (1.1.1) direct with counterparties or (1.1.2) through voice-brokers should exclude all repos transacted over an ATS (see below). These should be recorded under (1.1.3).
(1.1.2) Transactions through voice-brokers should be broken down in terms of the location of the counterparties, rather than the location of the voice-brokers.
(1.1.3) “ATSs” are automatic trading systems (e.g. BrokerTec, Eurex Repo and MTS, but not voice-assisted electronic systems used by voice-brokers or automated systems such as Bloomberg). Transactions through voice-assisted systems should be included in (1.1.2). Anonymous transactions through an ATS with a central counterparty (e.g. CC&G, LCH, MEFF and Eurex Clearing) should be recorded in either (1.1.3.4) or (1.1.3.5). (1.1.3.4) is for GC financing systems. These are ATS that are connected to a CCP and a tri-party repo service. Examples include Eurex Euro GC Pooling (EGCP) and LCH’s €GCPlus. They do not include GC basket trading on ATS in which the seller selects the securities to be delivered from a list prescribed by the ATS. This activity may be cleared across a CCP but does not involve a tri-party service, and should be recorded in (1.1.3.5).
1.2 This item includes all the transactions recorded in (1.1.3) plus any transactions executed directly with counterparties and via voice-brokers which are then registered with and cleared through a central counterparty.
1.5 “Repurchase transactions” (also known as “classic repos”) include transactions documented under the Global Master Repurchase Agreement (GMRA) 1995, the Global Master Repurchase Agreement (GMRA) 2000 or the Global Master Repurchase Agreement (GMRA) 2011 without reference to the Buy/Sell-Back Annexes, and transactions documented under other master agreements. “Sell/buy-backs” are therefore taken to include all transactions that are not documented. Repurchase transactions are characterised by the immediate payment by the buyer to the seller of a compensatory or manufactured payment upon receipt by the buyer of a coupon or other income on the collateral held by the buyer. If a coupon or other income is paid on collateral during the term of a sell/buy-back, the buyer does not make an immediate compensatory or manufactured payment to the seller, but reinvests the income until the repurchase date of the sell/buy-back and deducts the resulting amount (including reinvestment income) from the repurchase price that would otherwise be due to be received from the seller. Sell/buy-backs may be quoted in terms of a forward price rather than a repo rate. Where sell/buy-backs are documented (e.g. under the Buy/Sell-Back Annexes to the GMRA 1995, 2000 or 2011), periodic adjustments to the relative amounts of collateral or cash - which, for a repurchase transaction, would be performed by margin maintenance transfers or payments - are made by adjustment or re-pricing. All open repos are likely to be repurchase transactions.
1.6 “Open” repos are defined for the purposes of this survey as contracts that have no fixed repurchase date when negotiated but are terminable on demand by either counterparty. This item should be equal to item (1.8.3). Open repos could be regarded as floating-rate, given that rates may be updated, but this tends to be irregular, so open repos are being treated separately from floating-rate repo (1.6.2).
1.7 This section asks for the remaining term to maturity (not the original term to maturity) of repos to be broken down as follows:
(1.7.1.1) 1 day – this means:
• all contracts transacted prior to Wednesday, June 5, 2019, with a repurchase date on Thursday, June 6, 2019;
• overnight, tom/next, spot/next and corporate/next contracts transacted on Wednesday, June 5, 2019.
(1.7.1.2) 2–7 days – this means:
• all contracts transacted prior to Wednesday, June 5, 2019, with a repurchase date on Friday, June 7, 2019, or any day thereafter up to and including Wednesday, June 12, 2019;
• contracts transacted on Wednesday, June 5, 2019, with an original repurchase date on Friday, June 7, 2019, or any day thereafter up to and including Wednesday, June 12, 2019 (irrespective of the purchase date, which will vary).
(1.7.1.3) More than 7 days but no more than 1 month – this means:
• all contracts transacted prior to Wednesday, June 5, 2019, with a repurchase date on Thursday, June 13, 2019, or any day thereafter up to and including Monday, July 5, 2019;
• contracts transacted on Wednesday, June 5, 2019, with an original repurchase date on Thursday, June 13, 2019, or any day thereafter up to and including Monday, July 5, 2019 (irrespective of the purchase date, which will vary).

European Repo Market Survey November 2019 27
(1.7.1.4) More than 1 month but no more than 3 months – this means:
• all contracts transacted prior to Wednesday, June 5, 2019, with a repurchase date on Tuesday, July 6, 2019, or any day thereafter up to and including Thursday, September 5, 2019;
• contracts transacted on Wednesday, June 5, 2019, with an original repurchase date on Tuesday, July 6, 2019, or any day thereafter up to and including Thursday, September 5 2019 (irrespective of the purchase date, which will vary).
(1.7.1.5) More than 3 months but no more than 6 months – this means:
• all contracts transacted prior to Wednesday, June 5, 2019, with a repurchase date on Friday, September 6, 2019, or any day thereafter up to and including Thursday, December 5, 2019;
• contracts transacted on Wednesday, June 5, 2019, with an original repurchase date on Friday, September 6, 2019, or any day thereafter up to and including Thursday, December 5, 2019 (irrespective of the purchase date, which will vary).
(1.7.1.6) More than 6 months but no more than 12 months – this means;
• all contracts transacted prior to Wednesday, June 5, 2019, with a repurchase date on Friday, December 6, 2019, or any day thereafter up to and including Friday, June 5, 2020;
• contracts transacted on Wednesday, June 5, 2019, with an original repurchase date on Friday, December 6, 2019, or any day thereafter up to and including Friday, June 5, 2020 (irrespective of the purchase date, which will vary).
(1.7.1.7) More than 12 months – this means;
• all contracts transacted prior to Wednesday, June 5, 2019, with a repurchase date on Monday, June 8, 2020, or any day thereafter;
• contracts transacted on Wednesday, June 5, 2019, with an original repurchase date on or after Monday, June 8, 2020 (irrespective of the purchase date, which will vary).
(1.7.2) For repos against collateral that includes a transferable security regulated under the EU MiFID and that have been traded or which it is possible to trade on a MiFIR-regulated trading venue (regulated market, multilateral trading facility or organised trading facility), forward-forward repos are defined for the purposes of this survey as contracts with a purchase date of Monday, June 10, 2019, or later. There is therefore an overlap with corporate/next transactions. If the latter cannot be identified separately, it is accepted that they will be recorded as forward-forward repos. It does not matter than many repos may actually be traded for T+1 (ie a purchase date of Thursday, June 6, 2019). For repos transacted in the OTC market or against collateral not regulated under MiFID, the definition of forward-forward may be different.
(1.7.3) Open repos in this field should equal open repos in item (1.6.3).
1.8 Please confirm whether the transactions recorded in the questions in (1.6 and 1.7) include your tri-party repo business. Some institutions do not consolidate their tri-party repo transactions with their direct or voice-brokered business because of delays in receiving reports from tri-party agents or the complexity of their tri-party business.
(1.8.1) and (1.8.2) should not include any repos transacted across GC financing systems and recorded in (1.8.3).
1.9 “Eurobonds” (also known as “international bonds”) are defined as securities held outside national central securities depositories (CSD), usually in an ICSD such as Clearstream or Euroclear, or a custodian bank; typically with the ISIN prefix XS; often issued in a currency foreign to the place of issuance; and sold cross-border to investors outside the domestic market of the place of issuance. Eurobonds should be recorded in (1.9.30-33), except for those issues by “official international financial institutions”, which should be recorded in (1.9.20). Eurobond does not mean a bond denominated in euros.
(1.9.20) “Official international financial institutions, including multilateral development banks” such as:
African Development Bank (AfDB)
Asian Development Bank (AsDB)
Bank for International Settlements (BIS)
Caribbean Development Bank (CDB)
Central American Bank for Economic Integration (CABEI)
Corporacion Andina de Fomento (CAF)

European Repo Market Survey November 201928
East African Development Bank (EADB)
European Bank for Reconstruction and Development (EBRD)
European Commission (EC)/European Financial Stability Mechanism (EFSM)
European Financial Stability Facility (EFSF)
European Investment Bank (EIB)
European Stabilisation Mechanism (ESM)
Inter-American Development Bank Group (IADB)
International Fund for Agricultural Development (IFAD)
Islamic Development Bank (IDB)
Nordic Development Fund (NDF)
Nordic Investment Bank (NIB)
OPEC Fund for International Development (OPEC Fund)
West African Development Bank (BOAD)
World Bank Group (IBRD and IFC)
In addition, securities issued by the EU should be included.
(1.9.21) “US Treasury” includes bills, notes and bonds, including floating-rate notes, issued by the US central government but not securities guaranteed by that government, such as Agency securities.
(1.9.23) “Japanese government” includes bills, notes and bonds issued by the Japanese central government but not securities guaranteed by that government.
(1.9.25) “Other OECD countries” are Australia, Canada, Chile, Iceland, Israel, Korea, Mexico, New Zealand, Norway, Switzerland and Turkey.
(1.9.26) “Other non-OECD European, Middle Eastern & African countries” should exclude any EU countries.
(1.9.34) “Equity” includes ordinary shares, preference shares and equity-linked debt such as convertible bonds.
2.1 This question asks for the total gross value of transactions with a transaction date on or after December 6, 2018 (the day after the previous survey date), to and including June 5, 2019 (the latest survey date). In other words, it asks for the turnover or flow of business over the six month interval and includes all business transacted since the last survey date, even if it has matured before the survey date. This section is therefore different from the rest of the survey, which asks for the value of business outstanding on the survey date, in other words, the stock of transactions.
2.2 This question asks for the number of individual transactions with a transaction date on or after December 6, 2018 (the day after the previous survey date), to and including June 5, 2019 (the latest survey date), even if it has matured before the survey date. In other words, this is the number of tickets written.
3 “Total value of securities loaned and borrowed by your repo desk” includes the lending and borrowing of securities with either cash or securities collateral. Exclude any securities lending and borrowing done by desks other than your repo desk. If your repo desk does not do any securities lending and borrowing, this line will be a nil return.
4.1 “Active” means about once a week or more often.
For further help and informationIf, having read the Guidance Notes, you have any further queries, please e-mail the ICMA Centre at [email protected]. This survey is being conducted by the ICMA Centre, University of Reading, UK, at the request of ICMA’s European Repo and Collateral Council (ERCC).
European Repo Market Survey November 2019 29
Appendix B: Survey Participants
List of respondents Dec -09
Jun -10
Dec -10
Jun -11
Dec -11
Jun -12
Dec -12
Jun -13
Dec -13
Jun -14
Dec -14
Jun -15
Dec -15
Jun -16
Dec -16
Jun -17
Dec -17
Jun -18
Dec -18
Jun -19
ABN Amro Bank x x x x x x x x x
Algemeine Hypothekenbank RheinbodenAllied Irish Banks x x x x x x x x x x x x x x x
Alpha BankArab Banking Corporation (Italy)AXA Bank Europe x x x x x x x x x x x x x x
Banc Sabadell x x x x x x x x x x x x
Banca Cassa di Risparmio di AstiBanca d'Intermediazione Mobiliare (IMI)
x x x x x x x x x x
Banca Monte dei Paschi di Siena
x x x x x x x x x x x x x x x x x
Banco BPI x x x x x x x x x x x x
Banco Nazional del LavoroBanco PastorBanco Popular EspanolBanco Santander x x x x x x x x x x x x x x x x x x x x
Banco UrquijoBank Austria (also known as UniCredit Bank Austria)
x x x x x x x x x x x x
Bank fuer Arbeit und Wirtschaft und Oesterreichische Postsparkasse (Bawag)
x x x x x x x x x x x x x x x x x x x
Bank od AlandBank of America (merged to become Bank of America Merrill Lynch)Bank of Cyprus, GreeceBank of Ireland x x x x x x x x x x x x x x x x x
Bank Przemyslowo-Handlowy SA
x x x x x
Landesbank Berlin x x x x x x x
Banque de Luxembourg x x x x x x x x x x x x x x x x x x x x
Banque et Caisse d'Epargne de l'Etat
x x x x x x x x x x x x x x x x x x x x
Barclays Capital x x x x x x x x x x x x x x x x x x x x
Bayerische Landesbank x x x x x x x x x x x x x x x x x x x
BBVA x x x x x x x x x x x x x x x x x x
BHF-Bank x x x x x x x x
BHF-Bank International x x x x x x x
BNP Paribas x x x x x x x x x x x x x x x x x x x x
Bundesrepublik Deutschland Finanzagentur
x x x x x x x x x x x x x x x x x x x x
BW-BankCaixa Bank x x x x x x x x x x x x x x x
Caixa d'Estalvis de Catalunya x x x x x x x x x x x
Caixa Geral de DepositosBankia SA (formerly Caja de Ahorros y Monte de Piedad de Madrid (Caja Madrid))
x x x x x x x x x x x x x x x x x x x x

European Repo Market Survey November 201930
List of respondents Dec -09
Jun -10
Dec -10
Jun -11
Dec -11
Jun -12
Dec -12
Jun -13
Dec -13
Jun -14
Dec -14
Jun -15
Dec -15
Jun -16
Dec -16
Jun -17
Dec -17
Jun -18
Dec -18
Jun -19
CA-CIB (formerly Calyon) x x x x x x x x x x x x x x x x x x x x
CapitaliaNATIXIS Zweigniederlassung DeutschlandCitigroup Global Markets Ltd x x x x x x x x x x x x x x x x x x x x
Commerzbank x x x x x x x x x x x x x x x x x x x x
Canadian Imperial Bank of Commerce and Credit (CIBC)
x x x x x x x x x x x x x x x x
Confederación Española de Cajas de Ahorros (CECA)
x x x x x x x x x x x x x x x x x x x x
Credito ValtellineseCroatian National BankCredit Suisse Securities (Europe) Ltd
x x x x x x x x x x x x x x x x x x x x
Danske Bank x x x x x x x x x x x x x x x x x x x x
Daiwa Securities SMBC Europe
x x x x x x x x x x x x x
Dekabank Deutsche Girozentrale
x x x x x x x x x x x x x x
Delta Lloyd SecuritiesDNB Bank ASA x x x x x x x x
DePfa ACSDePfa BankDeutsche Bank x x x x x x x x x x x x x x x x x x x x
Deutsche Postbank x x x x x x x x x x x x x x x x x x
Belfius Bank (formerly Dexia) x x x x x x x x x x x x x x x x x x x x
Banque Internationale Luxembourg (formerly Dexia BIL)
x x x
Dexia Kommunal Bank Deutschland
x x x x x
Dresdner BankDZ Bank x x x x x x x x x x x x x x x x x x x x
EFG Eurobank Ergasias x x x x x x x x x x x x x x x x x x
Egnatia BankErste Bank der Oesterreichischen Sparkassen
x x x x x x x x x x x x x x x x x x x x
Euroclear Bank x x x x x x x x x x x x x x x x x x x
EurohypoHypothekenbank Frankfurt International (formerly Eurohypo Europäische Hypothekenbank)
x x x x x x x x x x
European Investment BankFortis Bank x x x x x x x x x x x x x x x x x x x x
General Bank of GreeceGoldman Sachs x x x x x x x x x x x x x x x x x x x x
Halifax Bank of ScotlandHSBC x
x x x x x x x x x x x x x x x x x x xHSBC AthensHSBC France x
HSH Nordbank x
Bayerische Hypo-und-Vereinsbank
x x x x x x x x x x x x x x x x x x x x
ICBC Standard Bank x x x
European Repo Market Survey November 2019 31
List of respondents Dec -09
Jun -10
Dec -10
Jun -11
Dec -11
Jun -12
Dec -12
Jun -13
Dec -13
Jun -14
Dec -14
Jun -15
Dec -15
Jun -16
Dec -16
Jun -17
Dec -17
Jun -18
Dec -18
Jun -19
IIB BankING Bank x x x x x x x x x x x x x x
ING BelgiumIntesa SanPaolo x x x x x x x x x x x x x x x x x x x x
Jefferies International Ltd x x x x x x x x x x x x x x x
JP Morgan x x x x x x x x x x x x x x x x x x x x
Jyske Bank x
KBC x x x x x x x x x x x x x x x x x
KfW x x x x x x x x x x x x x x x x
Kingdom of Belgium Federal Public Service Debt Agency
x x x x x x x x x x x x x x x x x x x
Landesbank Baden-Württemberg, Stuttgart
x x x x x x x x x x x x x x x x x x x
Landesbank Hessen-Thüringen -Girozentrale (Helaba)
x x x x x x x x x x x x x x x x
Landesbank Rheinland PfalzLandesbank Sachsen GirozentraleLehman BrothersLloyds Bank x x x x x
Macquarie Bank x x x x x x x x x x x x x x x x
Maple BankBank of America Merrill Lynch x x x x x x x x x x x x x x x x x x x x
Mitsubishi Securities International
x x x x x x x x x x x x x x x x x x
Mizuho International x x x x x x x x x x x x x x x x x x x
Morgan Stanley x x x x x x x x x x x x x x x x x x x
Natexis Banques PopulairesNational Australia Bank x
National Bank of Greece x x
Newedge x x x
Nomura International x x x x x x x x x x x x x x x x x x x x
Norddeutsche Landesbank Girozentrale
x x x x x x x x x x x x x
Nordea Markets x x x x x x x x x x x x x x x x x x x
Norinchukin Bank x x x x x x x x x x x x x x x x x x x x
Nova Ljubljanska Banka d.d. x x x x x x x x x x x x x x x x
Omega BankPiraeus Bank x x x x
Rabobank x x x x x x x x x x x x x x x x x x x x
Royal Bank of Canada x x x x x x x x x x x x x
NatWest Markets (formerly Royal Bank of Scotland)
x x x x x x x x x x x x x x x x x x x x
RBI x x x x x
Sal. Oppenheim Jr.Sampo BankSEBSociété Générale x x x x x x x x x x x x x x x x x x x x
Toronto Dominion Bank x x x x x x x x x x x
UBS x x x x x x x x x x x x x x x x x x x x
Ulster BankUniCredit/Bayerische Hypo-un-Vereinsbank Milano Branch
x x x x x x x x x x x x x x x x x x x x
UniCredito Italiano Bank (Ireland)
European Repo Market Survey November 201932
List of respondents Dec -09
Jun -10
Dec -10
Jun -11
Dec -11
Jun -12
Dec -12
Jun -13
Dec -13
Jun -14
Dec -14
Jun -15
Dec -15
Jun -16
Dec -16
Jun -17
Dec -17
Jun -18
Dec -18
Jun -19
Vereins und WestbankWestdeutsche Immobilien BankWestdeutsche Landesbank Girozentrale
x
Zagrabacka Banka
entry 2 5 3 5 10 5 9 8 4 2 4 0 7 1 2 4 3 3 2 0
exit 5 6 3 4 4 7 0 2 2 4 2 2 0 6 3 5 3 5 6 3
58 57 57 58 64 62 71 65 67 65 67 65 72 67 65 64 64 62 58 55
European Repo Market Survey November 2019 33
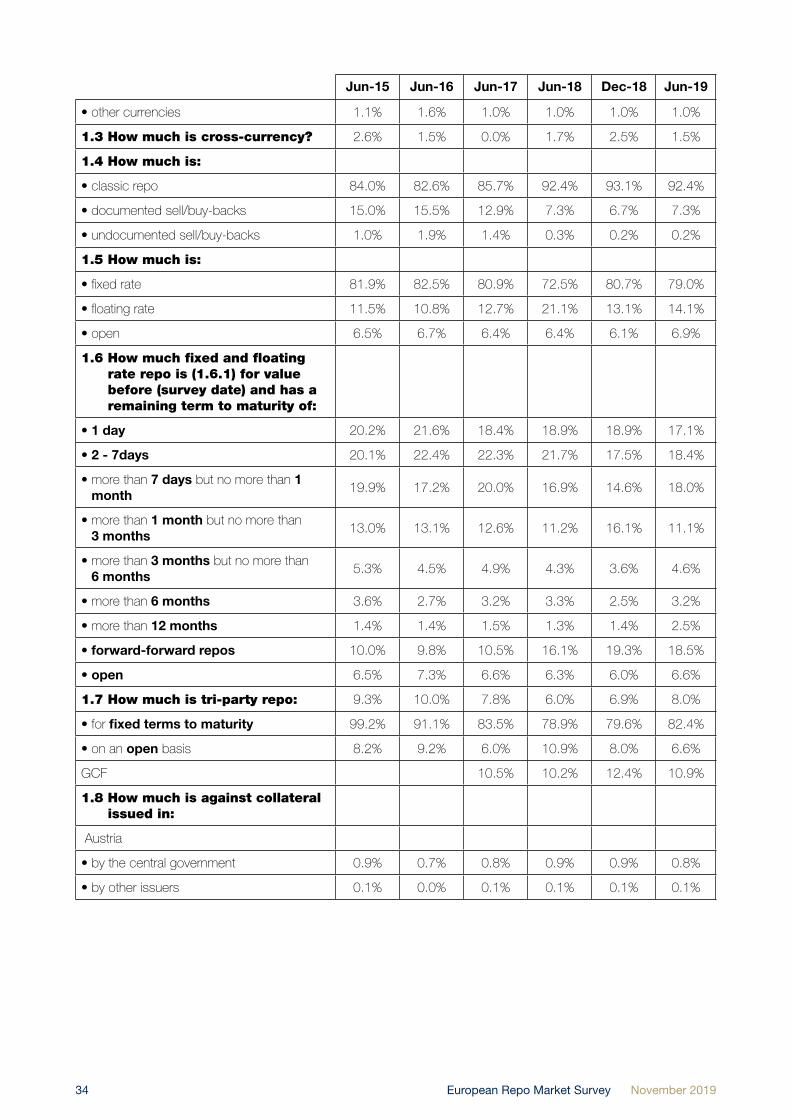
Appendix C: Summary Of Survey Results
Jun-15 Jun-16 Jun-17 Jun-18 Dec-18 Jun-19
Q1 What are the total gross values of cash due to be repaid by you and repaid to you on repo transactions maturing after survey date? (figures in EUR billions)
5,612 5,379 6,455 7,351 7,846 7,761
Of the amounts given in response to question (1) above:
1.1 How much was transacted:
direct with counterparties
• in the same country as you 14.2% 13.9% 14.3% 15.0% 16.5% 17.2%
• cross-border in (other) eurozone countries
13.8% 11.9% 12.4% 11.9% 10.3% 12.0%
• cross-border in non-eurozone countries
29.6% 30.1% 35.7% 33.7% 32.9% 32.3%
through voice-brokers
• in the same country as you 5.1% 5.2% 5.4% 5.8% 4.7% 4.0%
• cross-border in (other) eurozone countries
3.2% 3.1% 2.9% 2.6% 3.3% 3.1%
• cross-border in non-eurozone countries 3.5% 2.8% 2.7% 3.0% 2.8% 1.0%
on ATSs with counterparties
• in the same country as you 4.1% 4.0% 4.0% 4.7% 5.4% 4.2%
• cross-border in (other) eurozone countries
4.2% 3.2% 1.6% 1.1% 1.9% 1.9%
• cross border-border in non-eurozone countries
1.0% 0.9% 1.3% 1.9% 2.0% 1.9%
• anonymously across a GC financing system
4.1% 3.5% 1.1% 1.0% 1.1% 1.1%
• anonymously across a central clearing counterparty but not GC financing
17.2% 21.4% 18.6% 19.3% 19.3% 21.1%
• total through a central clearing counterparty 27.2% 32.4% 28.0% 27.6% 27.2% 25.9%
1.2 How much of the cash is denominated in:
• EUR 63.4% 61.3% 61.9% 65.3% 60.5% 62.0%
• GBP 11.3% 11.6% 12.2% 12.8% 12.4% 13.3%
• USD 16.4% 17.1% 16.9% 13.7% 19.4% 17.0%
• SEK, DKK 2.4% 2.6% 2.7% 1.9% 1.6% 1.7%
• JPY 5.3% 5.2% 4.5% 4.6% 4.5% 4.5%
• CHF 0.1% 0.0% 0.0% 0.0% 0.0% 0.0%
• other Asian and Pacific currencies 0.5% 0.7% 0.7% 0.6% 0.4%
European Repo Market Survey November 201934
Jun-15 Jun-16 Jun-17 Jun-18 Dec-18 Jun-19
• other currencies 1.1% 1.6% 1.0% 1.0% 1.0% 1.0%
1.3 How much is cross-currency? 2.6% 1.5% 0.0% 1.7% 2.5% 1.5%
1.4 How much is:
• classic repo 84.0% 82.6% 85.7% 92.4% 93.1% 92.4%
• documented sell/buy-backs 15.0% 15.5% 12.9% 7.3% 6.7% 7.3%
• undocumented sell/buy-backs 1.0% 1.9% 1.4% 0.3% 0.2% 0.2%
1.5 How much is:
• fixed rate 81.9% 82.5% 80.9% 72.5% 80.7% 79.0%
• floating rate 11.5% 10.8% 12.7% 21.1% 13.1% 14.1%
• open 6.5% 6.7% 6.4% 6.4% 6.1% 6.9%
1.6 How much fixed and floating rate repo is (1.6.1) for value before (survey date) and has a remaining term to maturity of:
• 1 day 20.2% 21.6% 18.4% 18.9% 18.9% 17.1%
• 2 - 7days 20.1% 22.4% 22.3% 21.7% 17.5% 18.4%
• more than 7 days but no more than 1 month
19.9% 17.2% 20.0% 16.9% 14.6% 18.0%
• more than 1 month but no more than 3 months
13.0% 13.1% 12.6% 11.2% 16.1% 11.1%
• more than 3 months but no more than 6 months
5.3% 4.5% 4.9% 4.3% 3.6% 4.6%
• more than 6 months 3.6% 2.7% 3.2% 3.3% 2.5% 3.2%
• more than 12 months 1.4% 1.4% 1.5% 1.3% 1.4% 2.5%
• forward-forward repos 10.0% 9.8% 10.5% 16.1% 19.3% 18.5%
• open 6.5% 7.3% 6.6% 6.3% 6.0% 6.6%
1.7 How much is tri-party repo: 9.3% 10.0% 7.8% 6.0% 6.9% 8.0%
• for fixed terms to maturity 99.2% 91.1% 83.5% 78.9% 79.6% 82.4%
• on an open basis 8.2% 9.2% 6.0% 10.9% 8.0% 6.6%
GCF 10.5% 10.2% 12.4% 10.9%
1.8 How much is against collateral issued in:
Austria
• by the central government 0.9% 0.7% 0.8% 0.9% 0.9% 0.8%
• by other issuers 0.1% 0.0% 0.1% 0.1% 0.1% 0.1%
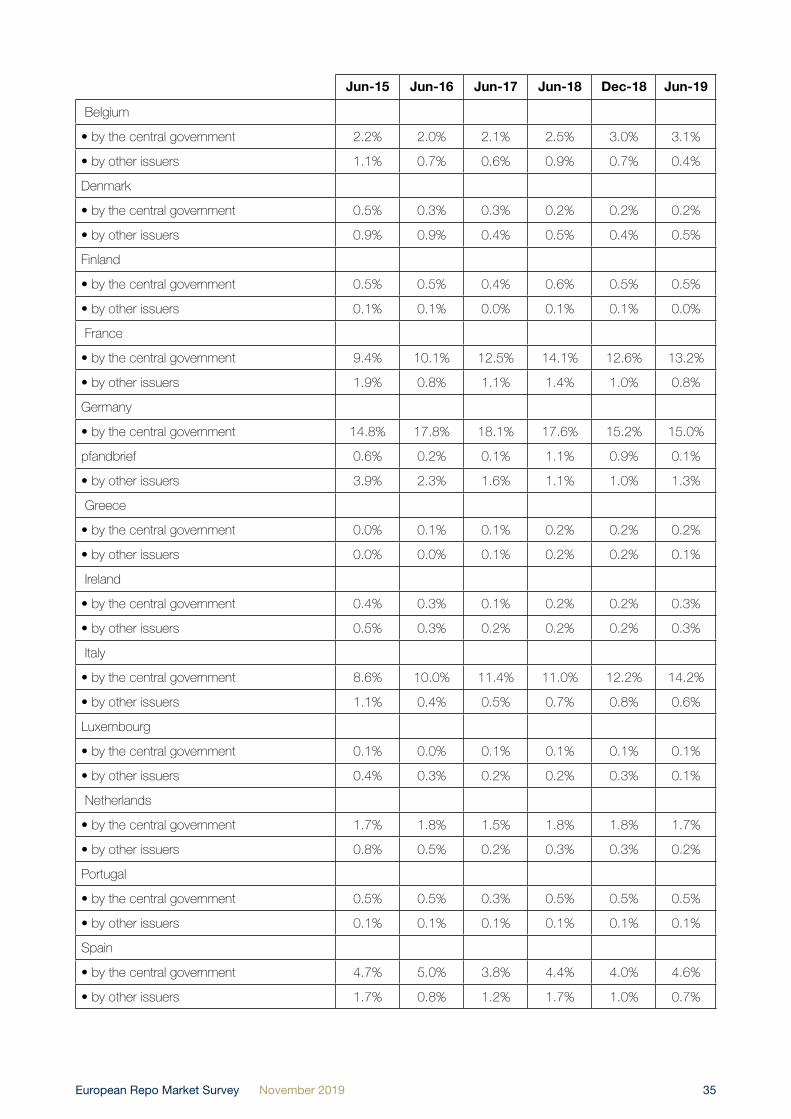
European Repo Market Survey November 2019 35
Jun-15 Jun-16 Jun-17 Jun-18 Dec-18 Jun-19
Belgium
• by the central government 2.2% 2.0% 2.1% 2.5% 3.0% 3.1%
• by other issuers 1.1% 0.7% 0.6% 0.9% 0.7% 0.4%
Denmark
• by the central government 0.5% 0.3% 0.3% 0.2% 0.2% 0.2%
• by other issuers 0.9% 0.9% 0.4% 0.5% 0.4% 0.5%
Finland
• by the central government 0.5% 0.5% 0.4% 0.6% 0.5% 0.5%
• by other issuers 0.1% 0.1% 0.0% 0.1% 0.1% 0.0%
France
• by the central government 9.4% 10.1% 12.5% 14.1% 12.6% 13.2%
• by other issuers 1.9% 0.8% 1.1% 1.4% 1.0% 0.8%
Germany
• by the central government 14.8% 17.8% 18.1% 17.6% 15.2% 15.0%
pfandbrief 0.6% 0.2% 0.1% 1.1% 0.9% 0.1%
• by other issuers 3.9% 2.3% 1.6% 1.1% 1.0% 1.3%
Greece
• by the central government 0.0% 0.1% 0.1% 0.2% 0.2% 0.2%
• by other issuers 0.0% 0.0% 0.1% 0.2% 0.2% 0.1%
Ireland
• by the central government 0.4% 0.3% 0.1% 0.2% 0.2% 0.3%
• by other issuers 0.5% 0.3% 0.2% 0.2% 0.2% 0.3%
Italy
• by the central government 8.6% 10.0% 11.4% 11.0% 12.2% 14.2%
• by other issuers 1.1% 0.4% 0.5% 0.7% 0.8% 0.6%
Luxembourg
• by the central government 0.1% 0.0% 0.1% 0.1% 0.1% 0.1%
• by other issuers 0.4% 0.3% 0.2% 0.2% 0.3% 0.1%
Netherlands
• by the central government 1.7% 1.8% 1.5% 1.8% 1.8% 1.7%
• by other issuers 0.8% 0.5% 0.2% 0.3% 0.3% 0.2%
Portugal
• by the central government 0.5% 0.5% 0.3% 0.5% 0.5% 0.5%
• by other issuers 0.1% 0.1% 0.1% 0.1% 0.1% 0.1%
Spain
• by the central government 4.7% 5.0% 3.8% 4.4% 4.0% 4.6%
• by other issuers 1.7% 0.8% 1.2% 1.7% 1.0% 0.7%
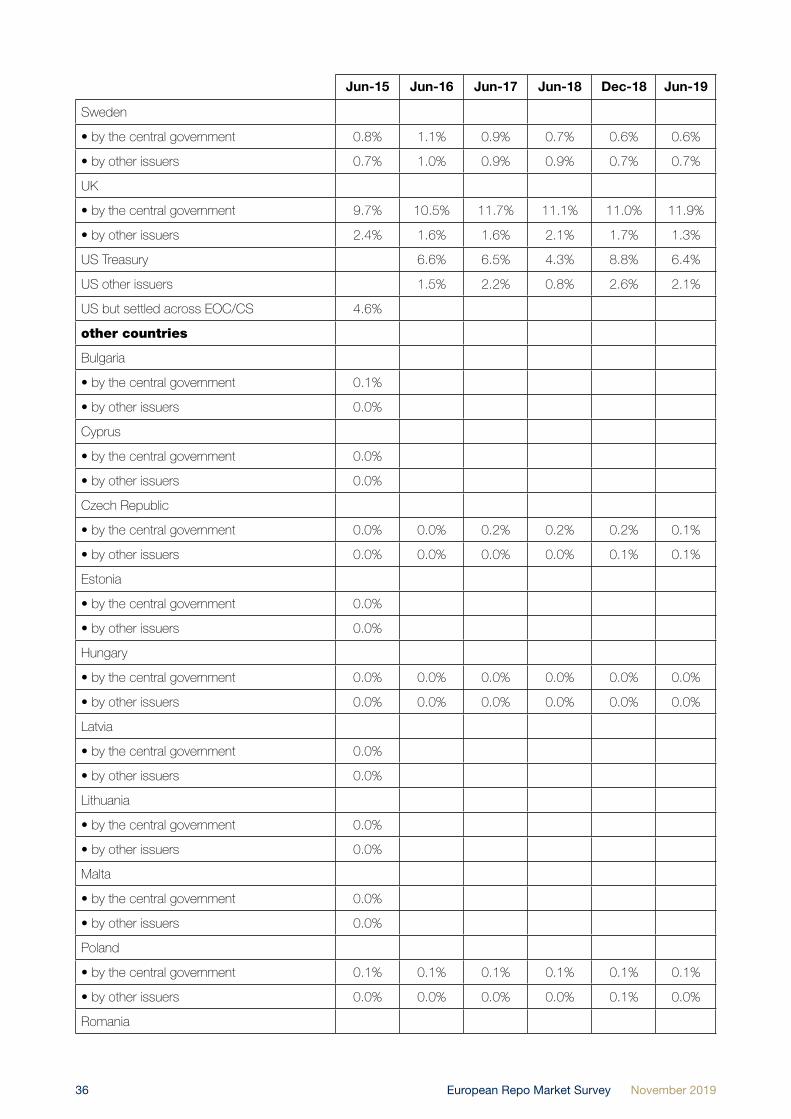
European Repo Market Survey November 201936
Jun-15 Jun-16 Jun-17 Jun-18 Dec-18 Jun-19
Sweden
• by the central government 0.8% 1.1% 0.9% 0.7% 0.6% 0.6%
• by other issuers 0.7% 1.0% 0.9% 0.9% 0.7% 0.7%
UK
• by the central government 9.7% 10.5% 11.7% 11.1% 11.0% 11.9%
• by other issuers 2.4% 1.6% 1.6% 2.1% 1.7% 1.3%
US Treasury 6.6% 6.5% 4.3% 8.8% 6.4%
US other issuers 1.5% 2.2% 0.8% 2.6% 2.1%
US but settled across EOC/CS 4.6%
other countries
Bulgaria
• by the central government 0.1%
• by other issuers 0.0%
Cyprus
• by the central government 0.0%
• by other issuers 0.0%
Czech Republic
• by the central government 0.0% 0.0% 0.2% 0.2% 0.2% 0.1%
• by other issuers 0.0% 0.0% 0.0% 0.0% 0.1% 0.1%
Estonia
• by the central government 0.0%
• by other issuers 0.0%
Hungary
• by the central government 0.0% 0.0% 0.0% 0.0% 0.0% 0.0%
• by other issuers 0.0% 0.0% 0.0% 0.0% 0.0% 0.0%
Latvia
• by the central government 0.0%
• by other issuers 0.0%
Lithuania
• by the central government 0.0%
• by other issuers 0.0%
Malta
• by the central government 0.0%
• by other issuers 0.0%
Poland
• by the central government 0.1% 0.1% 0.1% 0.1% 0.1% 0.1%
• by other issuers 0.0% 0.0% 0.0% 0.0% 0.1% 0.0%
Romania
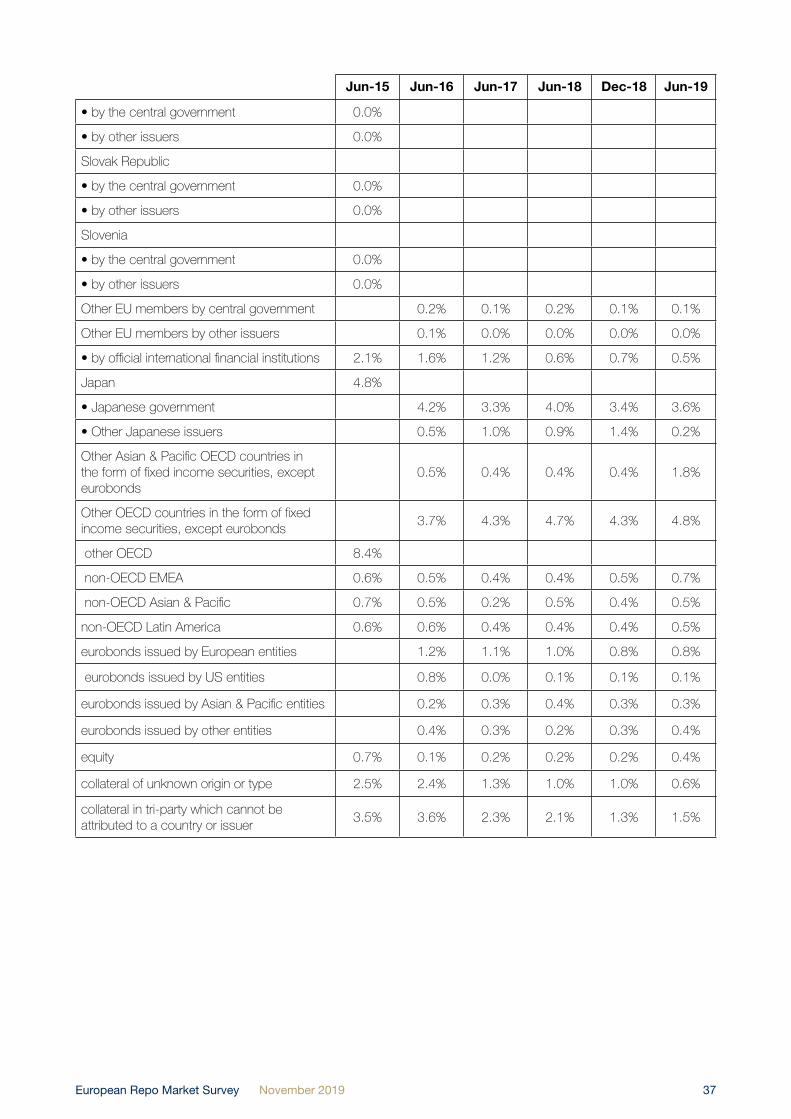
European Repo Market Survey November 2019 37
Jun-15 Jun-16 Jun-17 Jun-18 Dec-18 Jun-19
• by the central government 0.0%
• by other issuers 0.0%
Slovak Republic
• by the central government 0.0%
• by other issuers 0.0%
Slovenia
• by the central government 0.0%
• by other issuers 0.0%
Other EU members by central government 0.2% 0.1% 0.2% 0.1% 0.1%
Other EU members by other issuers 0.1% 0.0% 0.0% 0.0% 0.0%
• by official international financial institutions 2.1% 1.6% 1.2% 0.6% 0.7% 0.5%
Japan 4.8%
• Japanese government 4.2% 3.3% 4.0% 3.4% 3.6%
• Other Japanese issuers 0.5% 1.0% 0.9% 1.4% 0.2%
Other Asian & Pacific OECD countries in the form of fixed income securities, except eurobonds
0.5% 0.4% 0.4% 0.4% 1.8%
Other OECD countries in the form of fixed income securities, except eurobonds
3.7% 4.3% 4.7% 4.3% 4.8%
other OECD 8.4%
non-OECD EMEA 0.6% 0.5% 0.4% 0.4% 0.5% 0.7%
non-OECD Asian & Pacific 0.7% 0.5% 0.2% 0.5% 0.4% 0.5%
non-OECD Latin America 0.6% 0.6% 0.4% 0.4% 0.4% 0.5%
eurobonds issued by European entities 1.2% 1.1% 1.0% 0.8% 0.8%
eurobonds issued by US entities 0.8% 0.0% 0.1% 0.1% 0.1%
eurobonds issued by Asian & Pacific entities 0.2% 0.3% 0.4% 0.3% 0.3%
eurobonds issued by other entities 0.4% 0.3% 0.2% 0.3% 0.4%
equity 0.7% 0.1% 0.2% 0.2% 0.2% 0.4%
collateral of unknown origin or type 2.5% 2.4% 1.3% 1.0% 1.0% 0.6%
collateral in tri-party which cannot be attributed to a country or issuer
3.5% 3.6% 2.3% 2.1% 1.3% 1.5%

European Repo Market Survey November 201938
Jun-15 Jun-16 Jun-17 Jun-18 Dec-18 Jun-19
Q2 What is the total value of securities loaned and borrowed by your repo desk: to/from counterparties
in the same country as you
• in fixed income 30.2% 28.2% 26.3% 26.8% 22.3% 24.3%
• in equity 2.3% 0.3% 0.4% 0.2% 0.1% 0.8%
• cross-border in (other) eurozone countries
• in fixed income 32.5% 36.0% 32.8% 29.5% 32.1% 34.1%
• in equity 2.3% 2.6% 1.9% 1.4% 1.3% 1.1%
• cross-border in non-eurozone countries
• in fixed income 27.1% 32.4% 36.9% 40.8% 43.1% 37.8%
• in equity 5.5% 0.5% 1.7% 1.3% 1.1% 2.0%
for which the term to maturity is
fixed 65.8% 56.1% 61.7% 62.7% 72.8% 69.2%
open 34.2% 43.9% 38.3% 37.3% 27.2% 30.8%
European Repo Market Survey November 2019 39
Appendix D: The ICMA European Repo And Collateral Council
The ICMA European Repo and Collateral Council (ERCC) (formerly the ICMA European Repo Council) is the forum where the repo dealer community meets and forges consensus solutions to the practical problems of a rapidly evolving marketplace. In this role, it has been consolidating and codifying best market practice. The contact and dialogue that takes place at the ERCC underpins the strong sense of community and common interest that characterises the professional repo market in Europe.
The ERCC was established in December 1999 by the International Capital Market Association (ICMA, which was then called the International Securities Market Association or ISMA) as a body operating under ICMA auspices.
Membership of the ERCC is open to any ICMA member to commence, dedicated repo or collateral market activity, is willing to abide by the rules and has sufficient professional expertise, financial standing and technical resources to meet its obligations as a member.
The ERCC meets twice a year (usually in February/March and September) at different financial centres across Europe. The Steering Committee now comprises 19 members elected annually and meets six or seven times a year.
More information about the ERCC is available on www.icmagroup.org.

European Repo Market Survey November 201940
ICMA ZurichT: +41 44 363 4222 Dreikönigstrasse 8 CH-8002 Zurich
www.icmagroup.org
ICMA LondonT: +44 20 7213 0310 23 College Hill London EC4R 2RP
ICMA Hong KongT: +852 2531 6592 Unit 3603, Tower 2, Lippo Centre 89 Queensway Admiralty
ICMA ParisT: +33 1 70 17 64 72 62 rue la Boétie 75008 Paris