internaonalpastaorganisaon* pasta industry survey... · iran chile peru argentina germany france...
TRANSCRIPT
Interna'onal Pasta Organisa'on

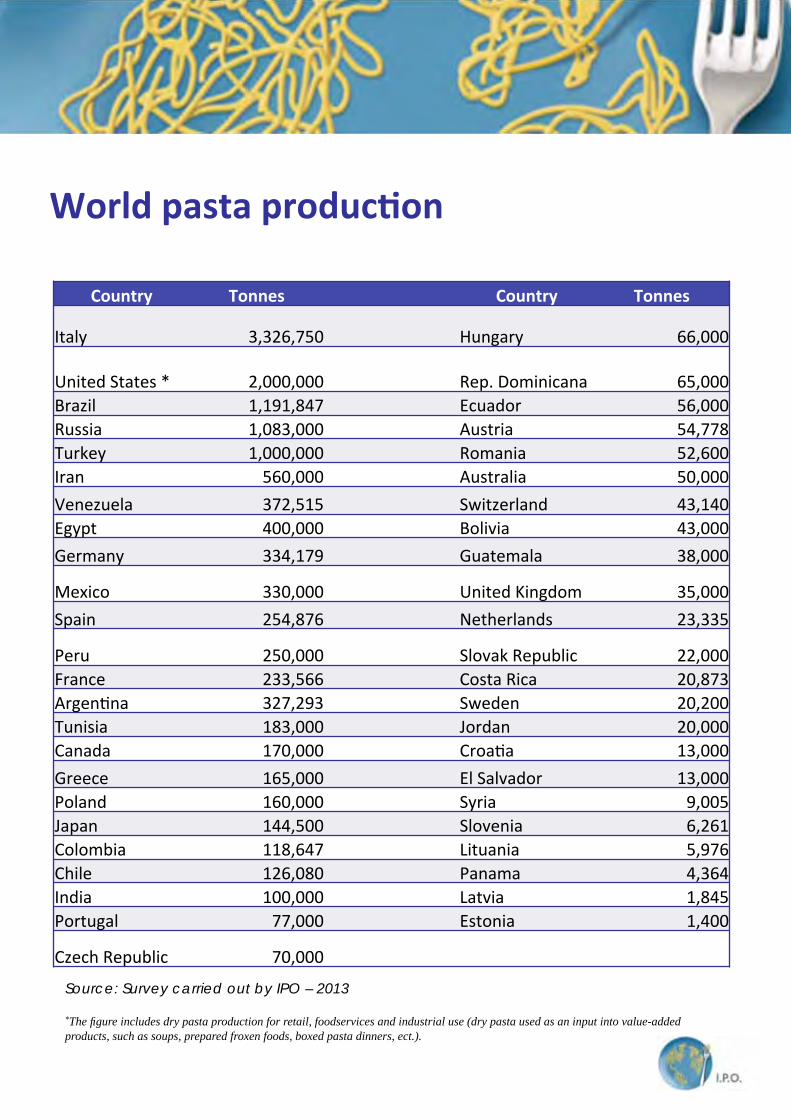
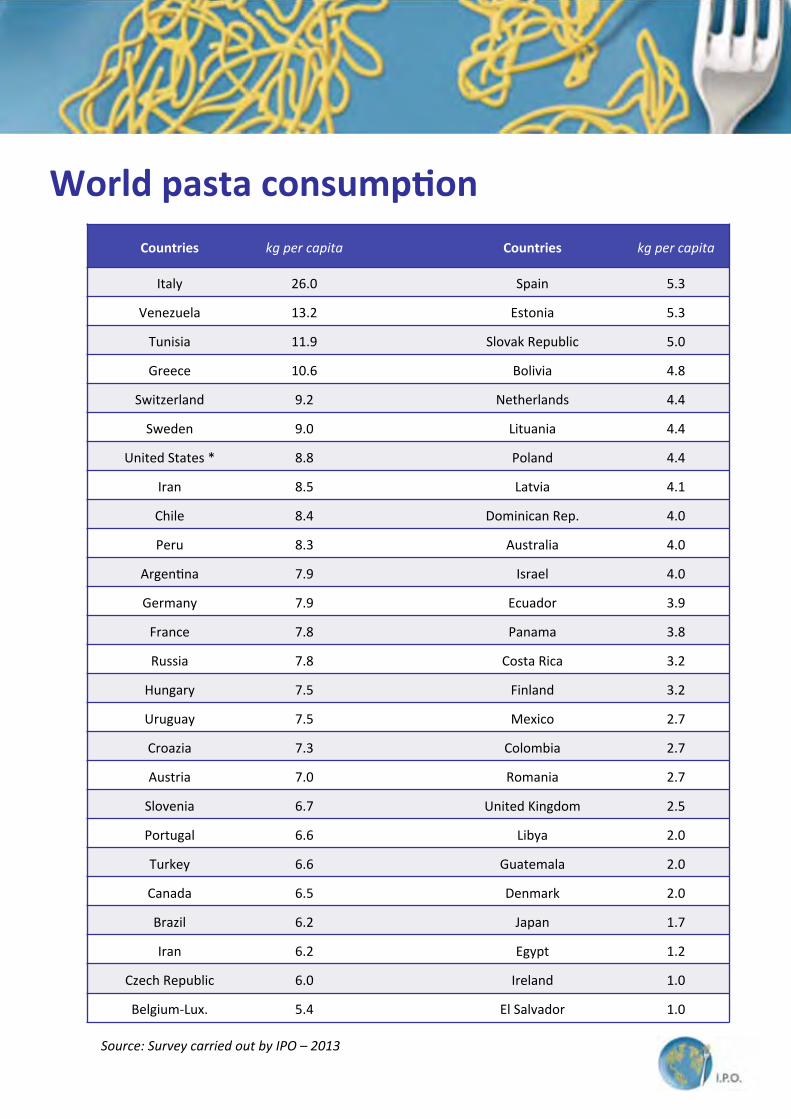
Source: Survey carried out by IPO – 2013
*The figure includes dry pasta production for retail, foodservices and industrial use (dry pasta used as an input into value-added products, such as soups, prepared froxen foods, boxed pasta dinners, ect.).
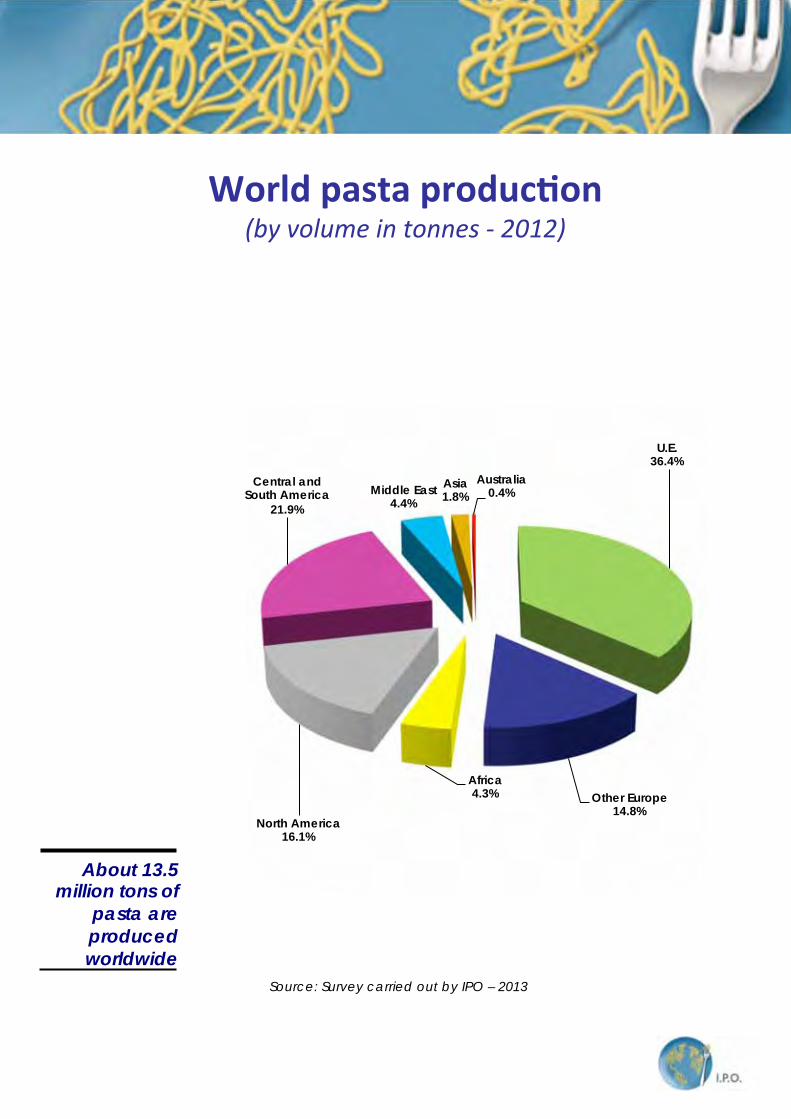
About 13.5 million tons of
pasta are produced worldwide
U.E. 36.4%
Other Europe 14.8%
Africa 4.3%
North America 16.1%
Central and South America
21.9%
Middle East 4.4%
Asia 1.8%
Australia 0.4%
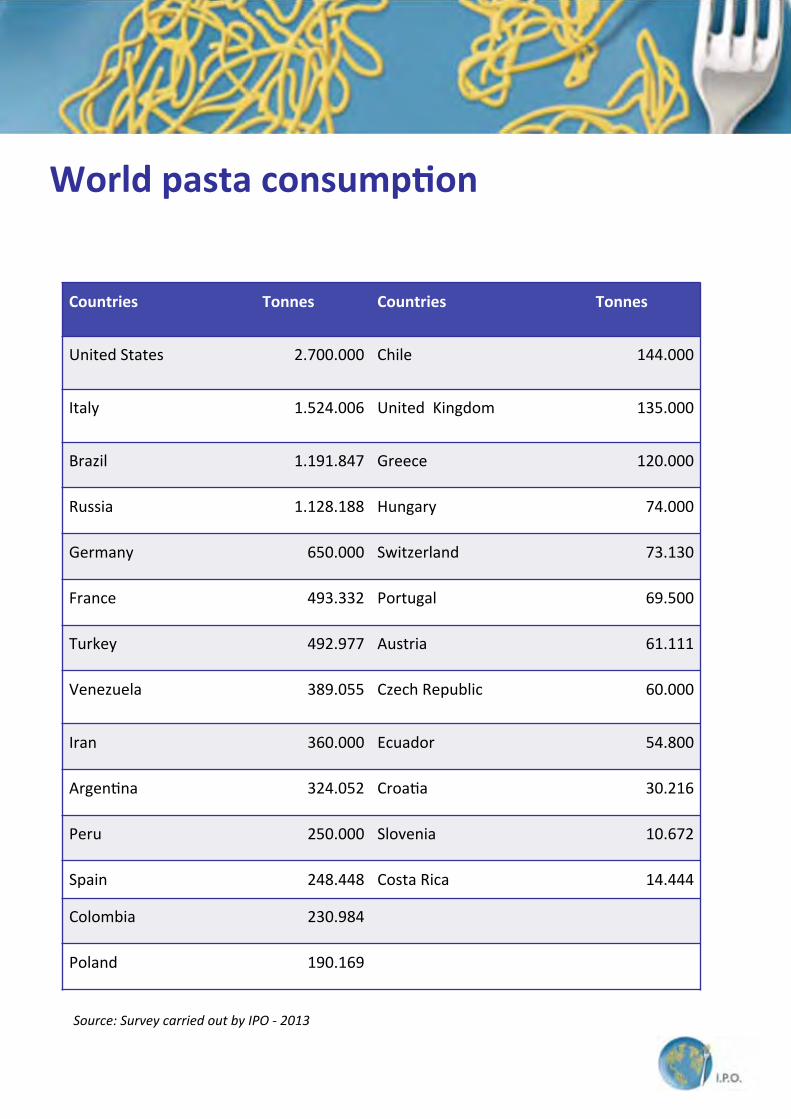
Source: Survey carried out by IPO – 2013

(kg per capita)
26.0
13.2
11.9
10.6
9.2
9.0
8.8
8.5
8.4
8.3
7.9
7.9
7.8
7.8
7.5
0.0 10.0 20.0 30.0
Italy
Venezuela
Tunisia
Greece
Switzerland
Sweden
United States
Iran
Chile
Peru
Argentina
Germany
France
Russia
Hungary
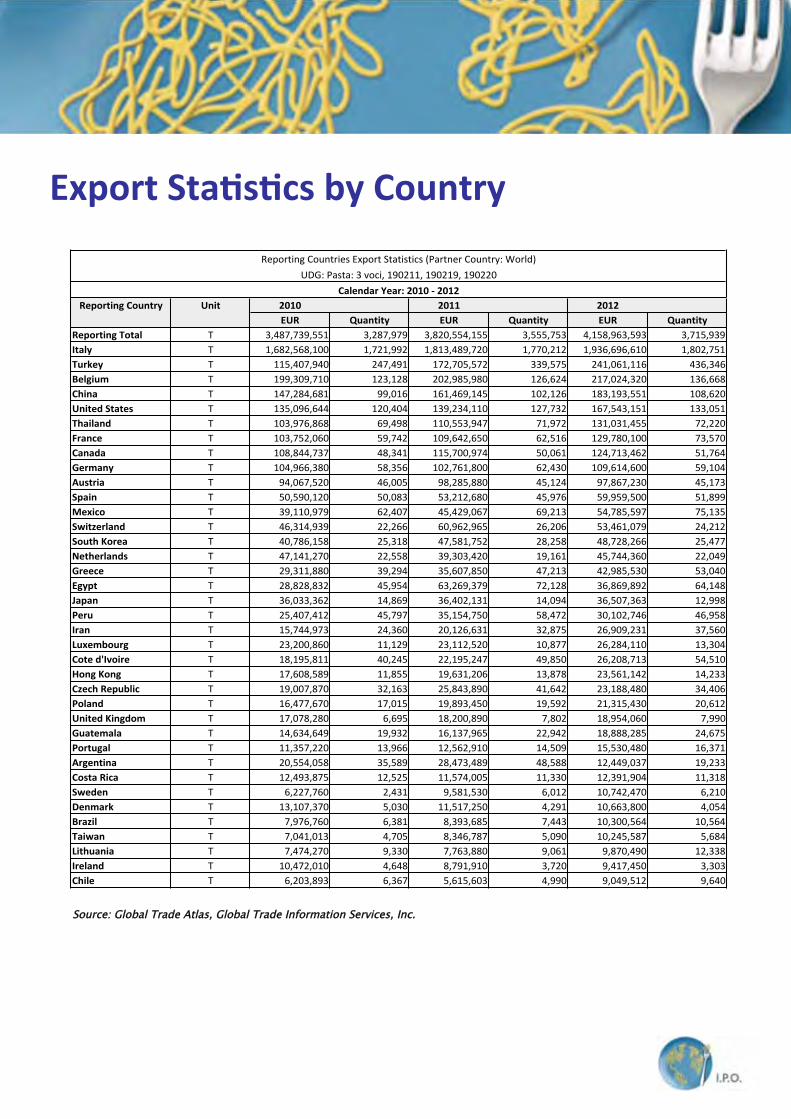
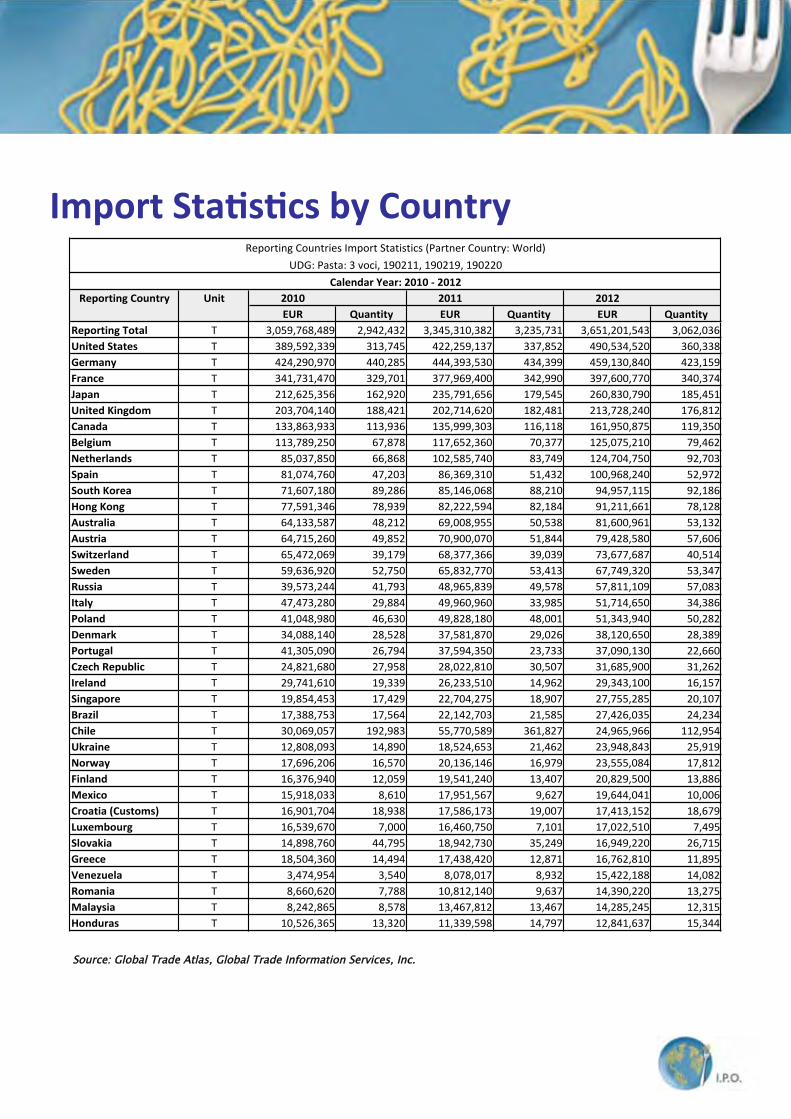
Source: Global Trade Atlas, Global Trade Information Services, Inc.
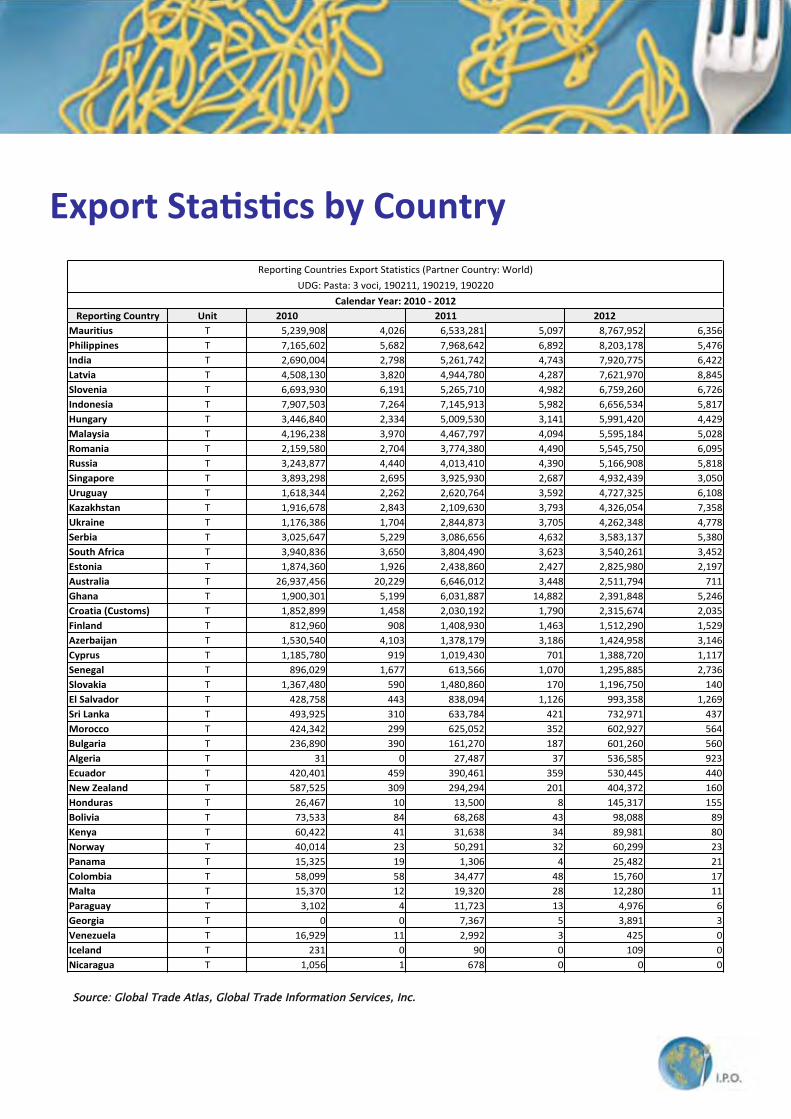
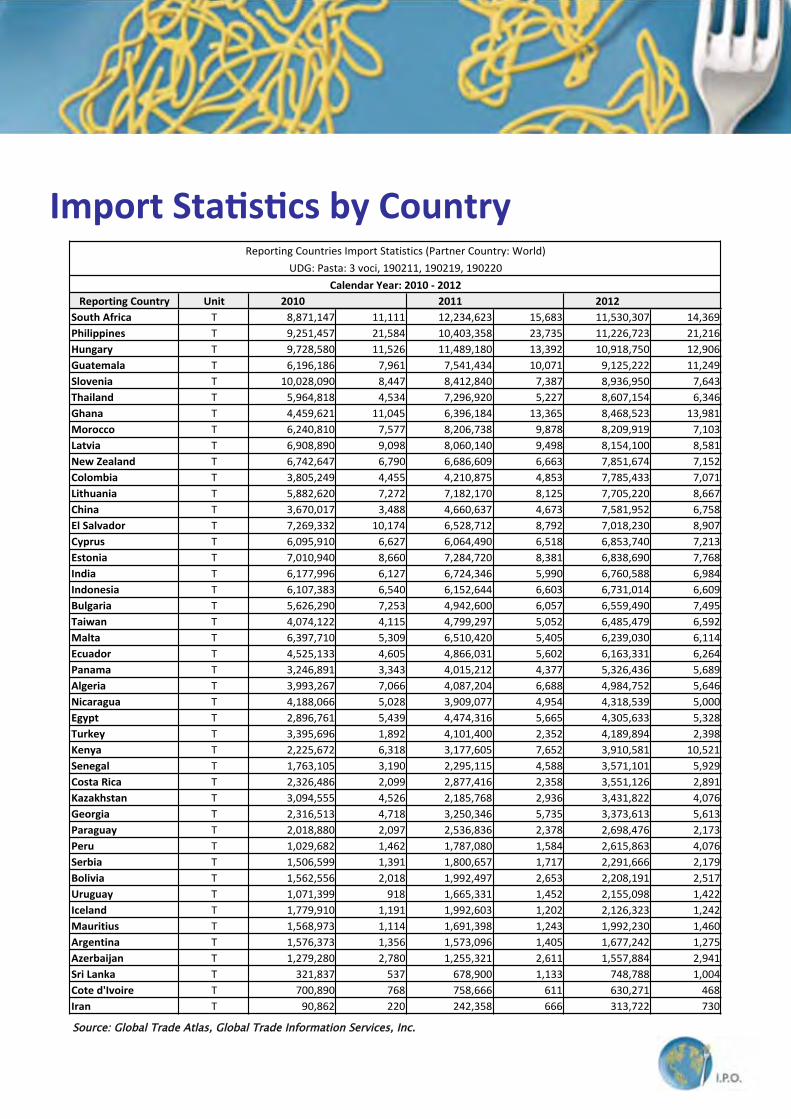
Source: Global Trade Atlas, Global Trade Information Services, Inc.
Source: Global Trade Atlas, Global Trade Information Services, Inc.
Source: Global Trade Atlas, Global Trade Information Services, Inc.
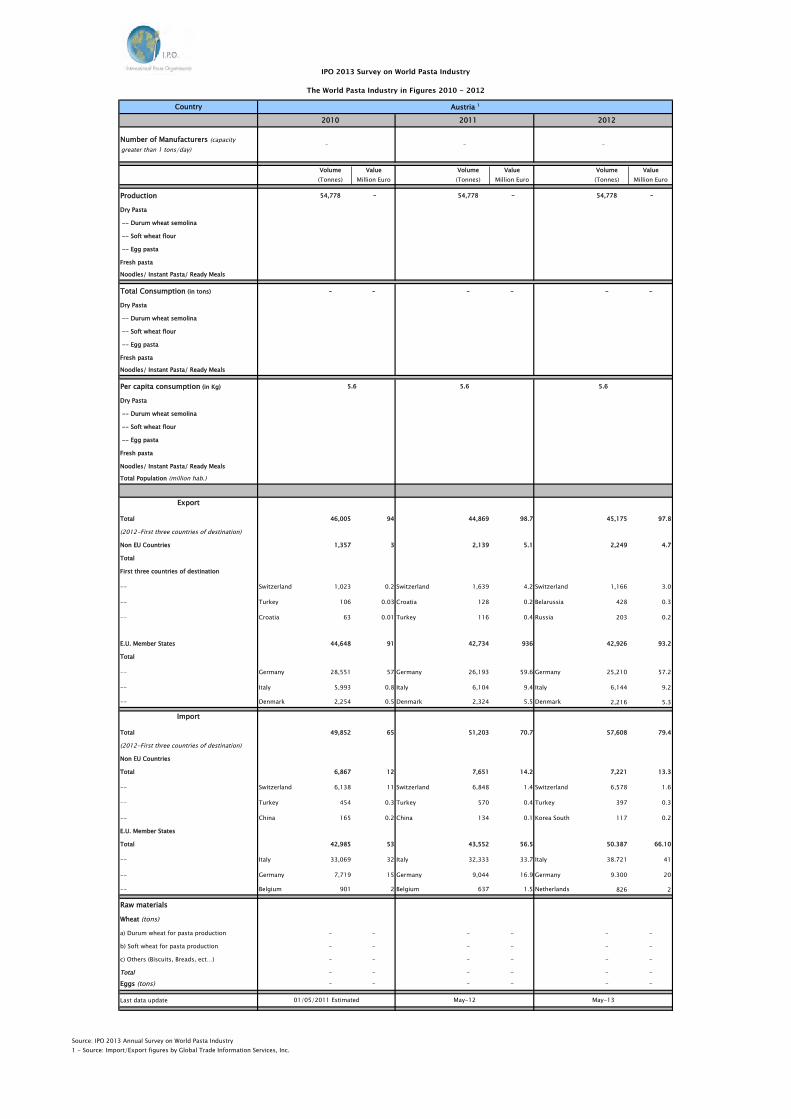
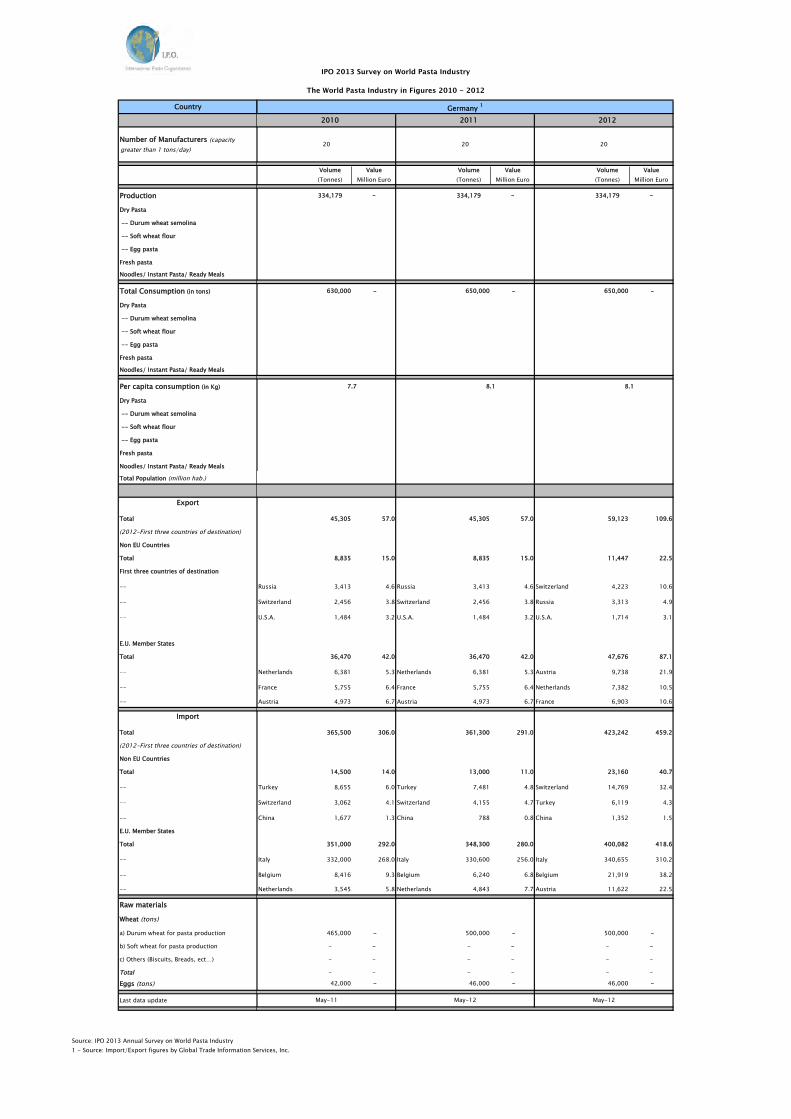
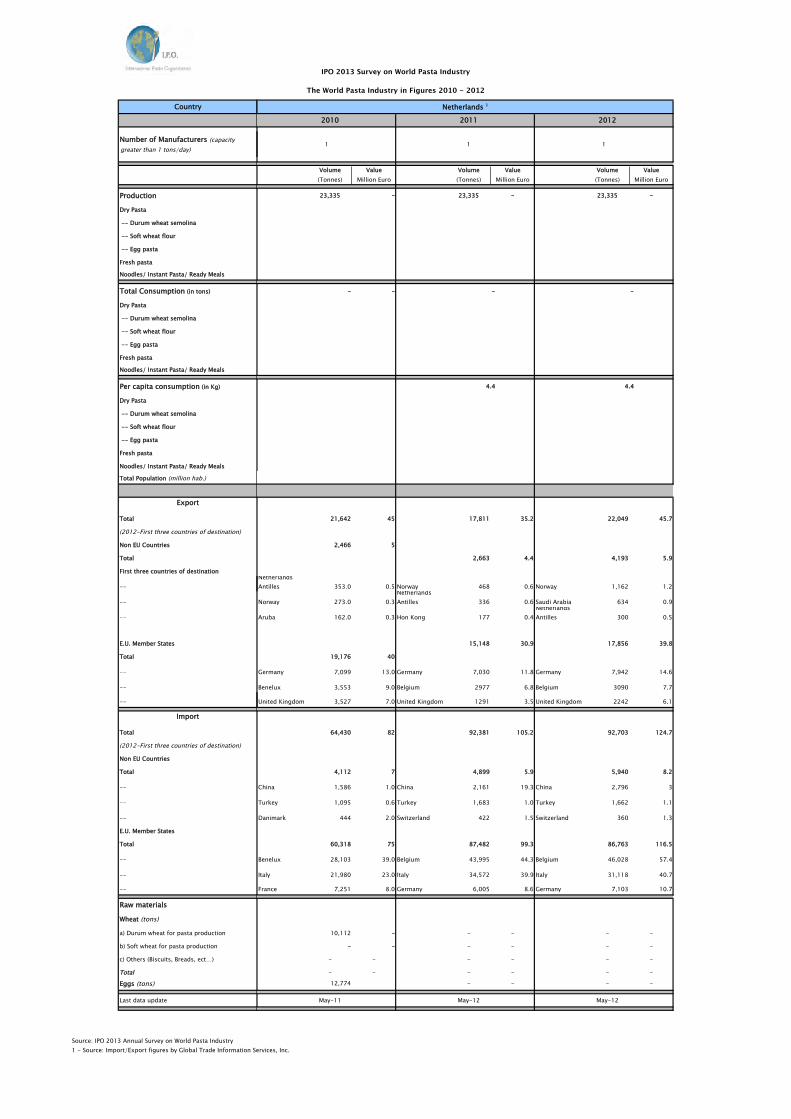
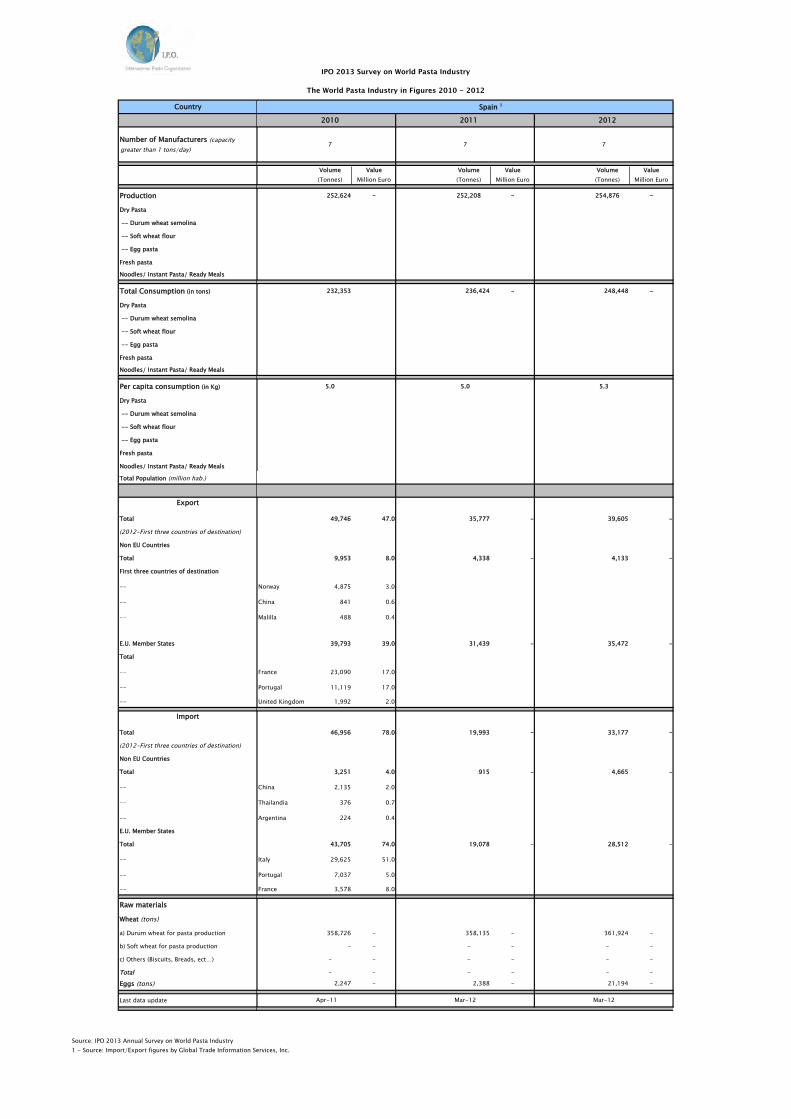
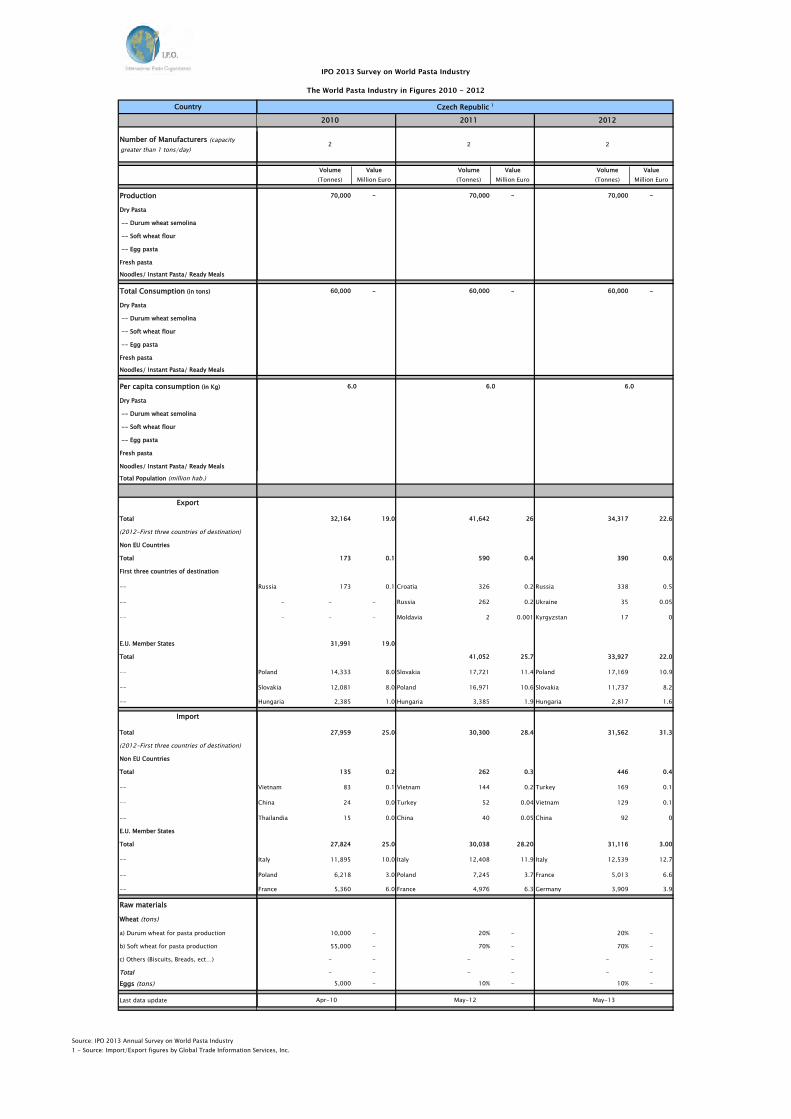
IPO 2013 Survey on World Pasta Industry
The World Pasta Industry in Figures 2010 - 2012
Source: IPO 2013 Annual Survey on World Pasta Industry1 - Source: Import/Export figures by Global Trade Information Services, Inc.
Country
2010 2011 2012
Number of Manufacturers (capacity greater than 1 tons/day)
Volume Value Volume Value Volume Value(Tonnes) Million Euro (Tonnes) Million Euro (Tonnes) Million Euro
Production 54,778 - 54,778 - 54,778 -
Dry Pasta
-- Durum wheat semolina
-- Soft wheat flour
-- Egg pasta
Fresh pasta
Noodles/ Instant Pasta/ Ready Meals
Total Consumption (in tons) - - - - - -
Dry Pasta
-- Durum wheat semolina
-- Soft wheat flour
-- Egg pasta
Fresh pasta
Noodles/ Instant Pasta/ Ready Meals
Per capita consumption (in Kg)
Dry Pasta
-- Durum wheat semolina
-- Soft wheat flour
-- Egg pasta
Fresh pasta
Noodles/ Instant Pasta/ Ready Meals
Total Population (million hab.)
Export
Total 46,005 94 44,869 98.7 45,175 97.8
(2012-First three countries of destination)
Non EU Countries 1,357 3 2,139 5.1 2,249 4.7
Total
First three countries of destination
-- Switzerland 1,023 0.2 Switzerland 1,639 4.2 Switzerland 1,166 3.0
-- Turkey 106 0.03 Croatia 128 0.2 Belarussia 428 0.3
-- Croatia 63 0.01 Turkey 116 0.4 Russia 203 0.2
E.U. Member States 44,648 91 42,734 936 42,926 93.2
Total
-- Germany 28,551 57 Germany 26,193 59.6 Germany 25,210 57.2
-- Italy 5,993 0.8 Italy 6,104 9.4 Italy 6,144 9.2
-- Denmark 2,254 0.5 Denmark 2,324 5.5 Denmark 2,216 5.3
Import
Total 49,852 65 51,203 70.7 57,608 79.4
(2012-First three countries of destination)
Non EU Countries
Total 6,867 12 7,651 14.2 7,221 13.3
-- Switzerland 6,138 11 Switzerland 6,848 1.4 Switzerland 6,578 1.6
-- Turkey 454 0.3 Turkey 570 0.4 Turkey 397 0.3
-- China 165 0.2 China 134 0.1 Korea South 117 0.2
E.U. Member States
Total 42,985 53 43,552 56.5 50.387 66.10
-- Italy 33,069 32 Italy 32,333 33.7 Italy 38.721 41
-- Germany 7,719 15 Germany 9,044 16.9 Germany 9.300 20
-- Belgium 901 2 Belgium 637 1.5 Netherlands 826 2
Raw materials
Wheat (tons)
a) Durum wheat for pasta production - - - - - -
b) Soft wheat for pasta production - - - - - -
c) Others (Biscuits, Breads, ect…) - - - - - -
Total - - - - - -
Eggs (tons) - - - - - -
Last data update
Austria 1
- - -
01/05/2011 Estimated May-12 May-13
5.6 5.6 5.6
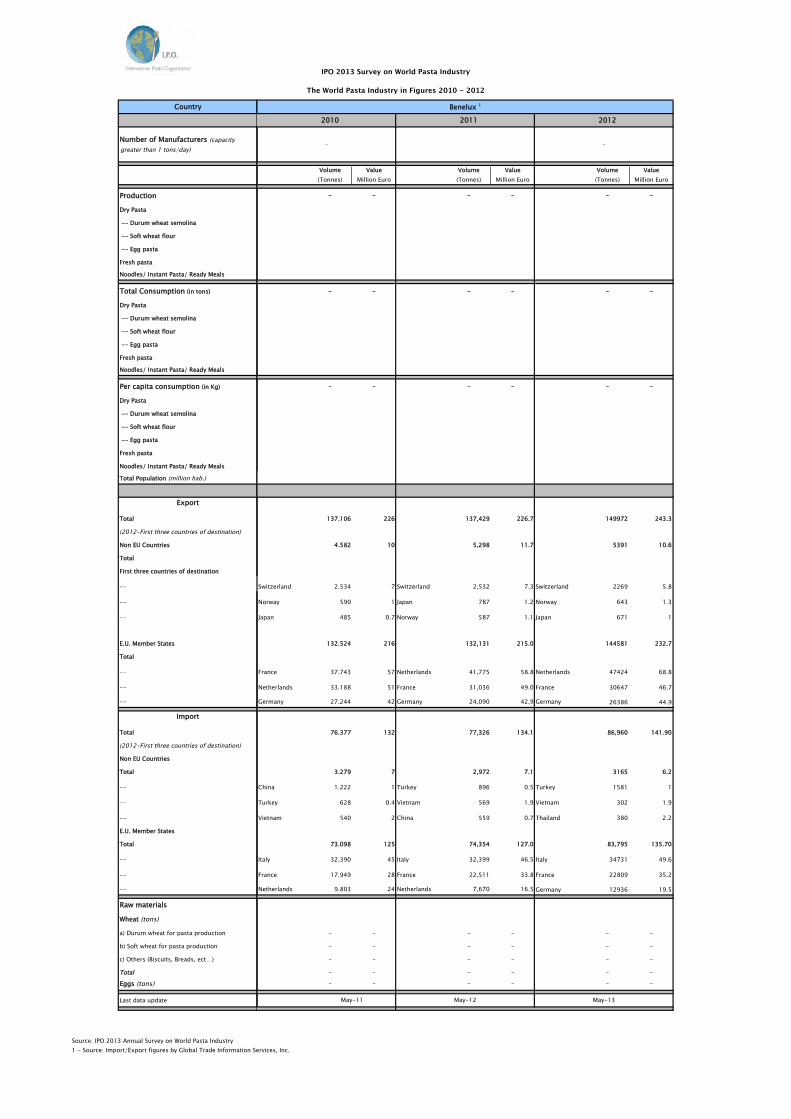
IPO 2013 Survey on World Pasta Industry
The World Pasta Industry in Figures 2010 - 2012
Source: IPO 2013 Annual Survey on World Pasta Industry1 - Source: Import/Export figures by Global Trade Information Services, Inc.
Country
Number of Manufacturers (capacity greater than 1 tons/day)
Production
Dry Pasta
-- Durum wheat semolina
-- Soft wheat flour
-- Egg pasta
Fresh pasta
Noodles/ Instant Pasta/ Ready Meals
Total Consumption (in tons)
Dry Pasta
-- Durum wheat semolina
-- Soft wheat flour
-- Egg pasta
Fresh pasta
Noodles/ Instant Pasta/ Ready Meals
Per capita consumption (in Kg)
Dry Pasta
-- Durum wheat semolina
-- Soft wheat flour
-- Egg pasta
Fresh pasta
Noodles/ Instant Pasta/ Ready Meals
Total Population (million hab.)
Export
Total
(2012-First three countries of destination)
Non EU Countries
Total
First three countries of destination
--
--
--
E.U. Member States
Total
--
--
--
Import
Total
(2012-First three countries of destination)
Non EU Countries
Total
--
--
--
E.U. Member States
Total
--
--
--
Raw materials
Wheat (tons)
a) Durum wheat for pasta production
b) Soft wheat for pasta production
c) Others (Biscuits, Breads, ect…)
Total
Eggs (tons)
Last data update
2010 2011 2012
Volume Value Volume Value Volume Value(Tonnes) Million Euro (Tonnes) Million Euro (Tonnes) Million Euro
- - - - - -
- - - - - -
- - - - - -
137.106 226 137,429 226.7 149972 243.3
4.582 10 5,298 11.7 5391 10.6
Switzerland 2.534 7 Switzerland 2,532 7.3 Switzerland 2269 5.8
Norway 590 1 Japan 787 1.2 Norway 643 1.3
Japan 485 0.7 Norway 587 1.1 Japan 671 1
132.524 216 132,131 215.0 144581 232.7
France 37.743 57 Netherlands 41,775 58.8 Netherlands 47424 68.8
Netherlands 33.188 51 France 31,036 49.0 France 30647 46.7
Germany 27.244 42 Germany 24,090 42.9 Germany 26386 44.9
76.377 132 77,326 134.1 86,960 141.90
3.279 7 2,972 7.1 3165 6.2
China 1.222 1 Turkey 896 0.5 Turkey 1581 1
Turkey 628 0.4 Vietnam 569 1.9 Vietnam 302 1.9
Vietnam 540 2 China 559 0.7 Thailand 380 2.2
73.098 125 74,354 127.0 83,795 135.70
Italy 32.390 45 Italy 32,399 46.5 Italy 34731 49.6
France 17.949 28 France 22,511 33.8 France 22809 35.2
Netherlands 9.803 24 Netherlands 7,670 16.5 Germany 12936 19.5
- - - - - -
- - - - - -
- - - - - -
- - - - - -- - - - - -
-
Benelux 1
May-11 May-13May-12
-

IPO 2013 Survey on World Pasta Industry
The World Pasta Industry in Figures 2010 - 2012
Source: IPO 2013 Annual Survey on World Pasta Industry1 - Source: Import/Export figures by Global Trade Information Services, Inc.
Country
Number of Manufacturers (capacity greater than 1 tons/day)
Production
Dry Pasta
-- Durum wheat semolina
-- Soft wheat flour
-- Egg pasta
Fresh pasta
Noodles/ Instant Pasta/ Ready Meals
Total Consumption (in tons)
Dry Pasta
-- Durum wheat semolina
-- Soft wheat flour
-- Egg pasta
Fresh pasta
Noodles/ Instant Pasta/ Ready Meals
Per capita consumption (in Kg)
Dry Pasta
-- Durum wheat semolina
-- Soft wheat flour
-- Egg pasta
Fresh pasta
Noodles/ Instant Pasta/ Ready Meals
Total Population (million hab.)
Export
Total
(2012-First three countries of destination)
Non EU Countries
Total
First three countries of destination
--
--
--
E.U. Member States
Total
--
--
--
Import
Total
(2012-First three countries of destination)
Non EU Countries
Total
--
--
--
E.U. Member States
Total
--
--
--
Raw materials
Wheat (tons)
a) Durum wheat for pasta production
b) Soft wheat for pasta production
c) Others (Biscuits, Breads, ect…)
Total
Eggs (tons)
Last data update
2010 2011 2012
Volume Value Volume Value Volume Value(Tonnes) Million Euro (Tonnes) Million Euro (Tonnes) Million Euro
247.411 - 241,933 - 233,566 -
505,628 - 513,008 - 493,332 -
28.153 34.0 28,438 35.2 32,445 42.6
12.644 16.0 12,740 16.0 15,057 21.7
United Arab Emirates 1313.000 1.5
United Arab Emirates 1,313 1.5
United Arab Emirates 1,590 1.9
Oman 1.094 0.9 Switzerland 1,136 1.3 Switzerland 1,117 3363.0
Maroc 980.0 1.7 Maroc 980 1.7 Maroc 1,114 1.3
15698.000 19.2 15,698 19.2 11,996 13.8
Belgium 7,634 7.6 Belgium 7,634 7.6 Belgium 7,718 8.2
Germany 2,529 3.9 Germany 2,529 3.9 Germany 2,326 3.9
Spain 1,148 1.4 Spain 1,148 1.5 Spain 1,952 1.7
289.775 238 303,230 269.0 296,038 275.743
11.400 11 9,510 10.7 11,223 12.503
France (retour) 7.738 7 France (retour) 3,745 3.6 France (retour) 5,536 4.851
China 1.125 1 China 2,554 2.6 China 2,027 2.289
Thailand 801 1 Thailand 917 1.4 Thailand 945 1.574
278.375 227 293,720 258.4 284,815 263.24
Italy 238.882 194 Italy 251,208 221.1 Italy 238,096 221.085
Spain 23.749 15 Spain 23,801 17.0 Spain 28,613 21.696
Belgium 10.544 10 Belgium 13,227 13.2 Belgium 12,076 12.711
376.119 - 367,791 - 355,071 -
- - - - - -
- - - - - -
- - - - - -8.557 - 7,888 - 7,815 -
8
8.1 7.7
France
May-13
88
May-11 May-12
8.0
IPO 2013 Survey on World Pasta Industry
The World Pasta Industry in Figures 2010 - 2012
Source: IPO 2013 Annual Survey on World Pasta Industry1 - Source: Import/Export figures by Global Trade Information Services, Inc.
Country
Number of Manufacturers (capacity greater than 1 tons/day)
Production
Dry Pasta
-- Durum wheat semolina
-- Soft wheat flour
-- Egg pasta
Fresh pasta
Noodles/ Instant Pasta/ Ready Meals
Total Consumption (in tons)
Dry Pasta
-- Durum wheat semolina
-- Soft wheat flour
-- Egg pasta
Fresh pasta
Noodles/ Instant Pasta/ Ready Meals
Per capita consumption (in Kg)
Dry Pasta
-- Durum wheat semolina
-- Soft wheat flour
-- Egg pasta
Fresh pasta
Noodles/ Instant Pasta/ Ready Meals
Total Population (million hab.)
Export
Total
(2012-First three countries of destination)
Non EU Countries
Total
First three countries of destination
--
--
--
E.U. Member States
Total
--
--
--
Import
Total
(2012-First three countries of destination)
Non EU Countries
Total
--
--
--
E.U. Member States
Total
--
--
--
Raw materials
Wheat (tons)
a) Durum wheat for pasta production
b) Soft wheat for pasta production
c) Others (Biscuits, Breads, ect…)
Total
Eggs (tons)
Last data update
2010 2011 2012
Volume Value Volume Value Volume Value(Tonnes) Million Euro (Tonnes) Million Euro (Tonnes) Million Euro
334,179 - 334,179 - 334,179 -
630,000 - 650,000 - 650,000 -
45,305 57.0 45,305 57.0 59,123 109.6
8,835 15.0 8,835 15.0 11,447 22.5
Russia 3,413 4.6 Russia 3,413 4.6 Switzerland 4,223 10.6
Switzerland 2,456 3.8 Switzerland 2,456 3.8 Russia 3,313 4.9
U.S.A. 1,484 3.2 U.S.A. 1,484 3.2 U.S.A. 1,714 3.1
36,470 42.0 36,470 42.0 47,676 87.1
Netherlands 6,381 5.3 Netherlands 6,381 5.3 Austria 9,738 21.9
France 5,755 6.4 France 5,755 6.4 Netherlands 7,382 10.5
Austria 4,973 6.7 Austria 4,973 6.7 France 6,903 10.6
365,500 306.0 361,300 291.0 423,242 459.2
14,500 14.0 13,000 11.0 23,160 40.7
Turkey 8,655 6.0 Turkey 7,481 4.8 Switzerland 14,769 32.4
Switzerland 3,062 4.1 Switzerland 4,155 4.7 Turkey 6,119 4.3
China 1,677 1.3 China 788 0.8 China 1,352 1.5
351,000 292.0 348,300 280.0 400,082 418.6
Italy 332,000 268.0 Italy 330,600 256.0 Italy 340,655 310.2
Belgium 8,416 9.3 Belgium 6,240 6.8 Belgium 21,919 38.2
Netherlands 3,545 5.8 Netherlands 4,843 7.7 Austria 11,622 22.5
465,000 - 500,000 - 500,000 -
- - - - - -
- - - - - -
- - - - - -42,000 - 46,000 - 46,000 -
20
7.7 8.1 8.1
Germany 1
2020
May-12May-12May-11

IPO 2013 Survey on World Pasta Industry
The World Pasta Industry in Figures 2010 - 2012
Source: IPO 2013 Annual Survey on World Pasta Industry1 - Source: Import/Export figures by Global Trade Information Services, Inc.
Country
Number of Manufacturers (capacity greater than 1 tons/day)
Production
Dry Pasta
-- Durum wheat semolina
-- Soft wheat flour
-- Egg pasta
Fresh pasta
Noodles/ Instant Pasta/ Ready Meals
Total Consumption (in tons)
Dry Pasta
-- Durum wheat semolina
-- Soft wheat flour
-- Egg pasta
Fresh pasta
Noodles/ Instant Pasta/ Ready Meals
Per capita consumption (in Kg)
Dry Pasta
-- Durum wheat semolina
-- Soft wheat flour
-- Egg pasta
Fresh pasta
Noodles/ Instant Pasta/ Ready Meals
Total Population (million hab.)
Export
Total
(2012-First three countries of destination)
Non EU Countries
Total
First three countries of destination
--
--
--
E.U. Member States
Total
--
--
--
Import
Total
(2012-First three countries of destination)
Non EU Countries
Total
--
--
--
E.U. Member States
Total
--
--
--
Raw materials
Wheat (tons)
a) Durum wheat for pasta production
b) Soft wheat for pasta production
c) Others (Biscuits, Breads, ect…)
Total
Eggs (tons)
Last data update
2010 2011 2012
Volume Value Volume Value Volume Value(Tonnes) Million Euro (Tonnes) Million Euro (Tonnes) Million Euro
149,000 - 145,000 - 165,000 -
122,000 - 115,000 - 120,000 -
40,900 31 40,897 30.1 53,467 43.4
12,303 9 397 0.3 8,074 7.7
Albania 5,378 3
Japan 2,114 1.5
U.S.A. 1,403 1.3
28,597 22 40,500 29.0 45,392 35.7
Italy 15,858 13
Bulgaria 3,607 3
Poland 1,922 1
13,929 18.9 13,769 19.3 12,896 18.8
172 0.2 169 0.3 240 0.5
China 59 0.08
Turkey 54 0.06
Thailand 24 0.04
13,757 18.7 13,600 19.0 12,657 18.3
Italy 11,117 15
Portugal 903 0.6
Germany 834 1.6
228,000 - 218,000 - 248,000 -
- - - - - -
- - - - - -
- - - - - -71 - 65 - 62 -
May-13
Greece 1
44
10.4
4
May-12May-10
10.5 10.6

IPO 2013 Survey on World Pasta Industry
The World Pasta Industry in Figures 2010 - 2012
Source: IPO 2013 Annual Survey on World Pasta Industry1 - Source: Import/Export figures by Global Trade Information Services, Inc.
Country
Number of Manufacturers (capacity greater than 1 tons/day)
Production
Dry Pasta
-- Durum wheat semolina
-- Soft wheat flour
-- Egg pasta
Fresh pasta
Noodles/ Instant Pasta/ Ready Meals
Total Consumption (in tons)
Dry Pasta
-- Durum wheat semolina
-- Soft wheat flour
-- Egg pasta
Fresh pasta
Noodles/ Instant Pasta/ Ready Meals
Per capita consumption (in Kg)
Dry Pasta
-- Durum wheat semolina
-- Soft wheat flour
-- Egg pasta
Fresh pasta
Noodles/ Instant Pasta/ Ready Meals
Total Population (million hab.)
Export
Total
(2012-First three countries of destination)
Non EU Countries
Total
First three countries of destination
--
--
--
E.U. Member States
Total
--
--
--
Import
Total
(2012-First three countries of destination)
Non EU Countries
Total
--
--
--
E.U. Member States
Total
--
--
--
Raw materials
Wheat (tons)
a) Durum wheat for pasta production
b) Soft wheat for pasta production
c) Others (Biscuits, Breads, ect…)
Total
Eggs (tons)
Last data update
2010 2011 2012
147
Volume Value Volume Value Volume Value(Tonnes) Million Euro (Tonnes) Million Euro (Tonnes) Million Euro
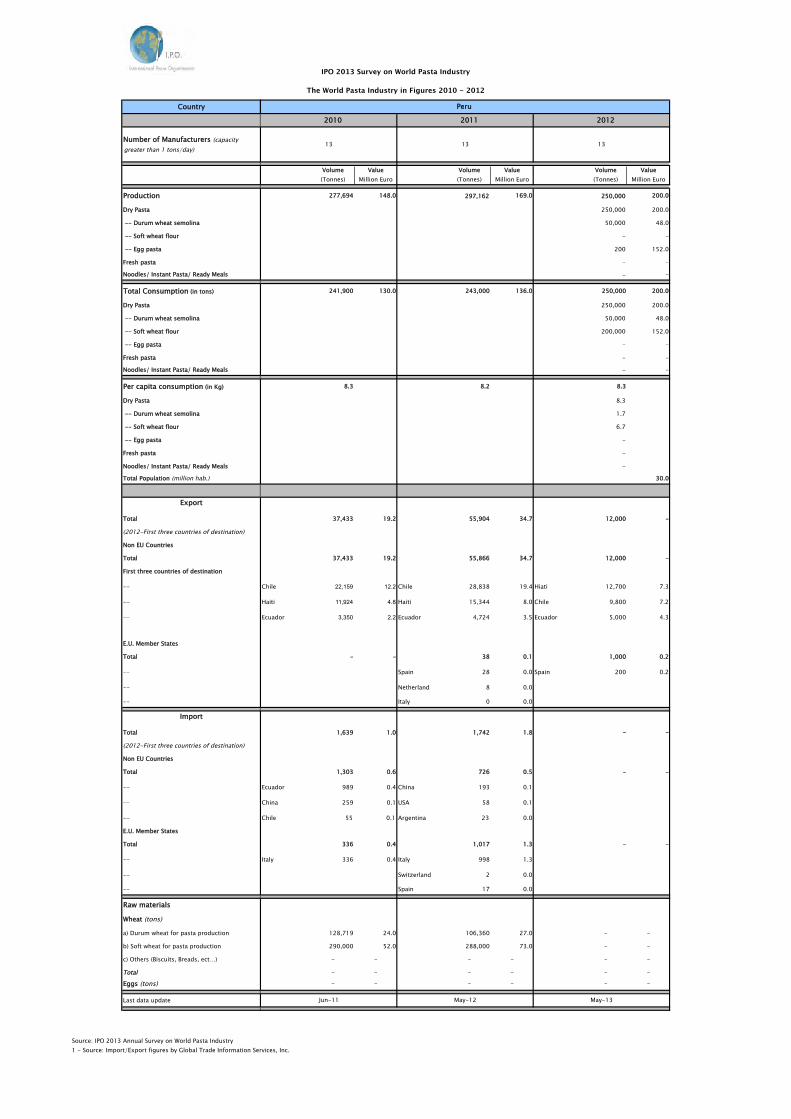
3,262,269 4,362 3,310,681 451 3,326,750 4,605
3,103,386 3,602 3,151,351 3,733 3,170,164 3,839
2,806,287 2,841 2,853,061 2,952 2,875,835 3,050
- - - - - -
174,765 440 175,749 440 171,504 448
158,883 760 159,330 768 156,586 766
- - - - - -
1,540,288 2,680 1,540,846 2,687 1,524,006 2,668
1,381,405 1,920 1,381,150 1,919 1,367,420 1,902
1,284,388 1,582 1,286,957 1,586 1,276,661 1,573
- - - - - -
91,660 306 87,994 298 84,826 295
158,883 760 159,330 768 156,586 766
- - - - - -
26 25.9 25.6
- 23.2 23.0
- - -
- - -
- -
2.7 2.6
- - -
59 59 60
1,658,491 1,716 1,770,201 1,814 1,802,744 1,937
513,819 533 569,812 584.1 584,920 643.8
U.S.A. 121,155 142 U.S.A. 134,087 155.3 U.S.A. 137,462 175.3
Japan 80,362 86 Japan 84,430 84.9 Japan 88,360 93.5
Switzerland 28,370 42 Russia 37,184 31.9 Russia 41,983 38.6
1,144,672 1,183 1,200,389 1,229.4
1,217,824 1,292.8
Germany 332,425 309 Germany 327,020 301.6 Germany 339,887 323.7
France 257,624 252 France 279,656 274.9 France 276,327 288.5
United Kingdom 241,479 258 United Kingdom 248,485 256.1 United Kingdom 248,673 270.3
34,965 51 33,985 49.9 34,389 51.7
3,858 6 3,158 6.9 3,639 7.4
Switzerland 1,776 4.0 Switzerland 1,664 4.7 Switzerland 1,707 4.7
China 1,275 0.7 China 896 0.7 China 1,122 1.2
Japan 248 0.3 Singapore 189 0.4 Singapore 226 0.5
31,106 45 30,827 43.0 30,750 44.2
Greece 17,358 13 Greece 15,929 11.1 Greece 15,535 13.7
France 8,694 17 France 10,173 19.0 France 10,946 20.7
Belgium 2,909 11 Belgium 2,397 8.0 Belgium 1,802 5.8
4,955,000 - 4,180,000 - 4,200,000 -
- - - - - -
- - - - - -
- - - - - -112,000 - 116,000 - 114,000 -
Italy
May-13May-11 May-12
120147
IPO 2013 Survey on World Pasta Industry
The World Pasta Industry in Figures 2010 - 2012
Source: IPO 2013 Annual Survey on World Pasta Industry1 - Source: Import/Export figures by Global Trade Information Services, Inc.
Country
Number of Manufacturers (capacity greater than 1 tons/day)
Production
Dry Pasta
-- Durum wheat semolina
-- Soft wheat flour
-- Egg pasta
Fresh pasta
Noodles/ Instant Pasta/ Ready Meals
Total Consumption (in tons)
Dry Pasta
-- Durum wheat semolina
-- Soft wheat flour
-- Egg pasta
Fresh pasta
Noodles/ Instant Pasta/ Ready Meals
Per capita consumption (in Kg)
Dry Pasta
-- Durum wheat semolina
-- Soft wheat flour
-- Egg pasta
Fresh pasta
Noodles/ Instant Pasta/ Ready Meals
Total Population (million hab.)
Export
Total
(2012-First three countries of destination)
Non EU Countries
Total
First three countries of destination
--
--
--
E.U. Member States
Total
--
--
--
Import
Total
(2012-First three countries of destination)
Non EU Countries
Total
--
--
--
E.U. Member States
Total
--
--
--
Raw materials
Wheat (tons)
a) Durum wheat for pasta production
b) Soft wheat for pasta production
c) Others (Biscuits, Breads, ect…)
Total
Eggs (tons)
Last data update
2010 2011 2012
1
Volume Value Volume Value Volume Value(Tonnes) Million Euro (Tonnes) Million Euro (Tonnes) Million Euro
23,335 - 23,335 - 23,335 -
- - - -
21,642 45 17,811 35.2 22,049 45.7
2,466 5
2,663 4.4 4,193 5.9
Netherlands Antilles 353.0 0.5 Norway 468 0.6 Norway 1,162 1.2
Norway 273.0 0.3Netherlands Antilles 336 0.6 Saudi Arabia 634 0.9
Aruba 162.0 0.3 Hon Kong 177 0.4Netherlands Antilles 300 0.5
15,148 30.9 17,856 39.8
19,176 40
Germany 7,099 13.0 Germany 7,030 11.8 Germany 7,942 14.6
Benelux 3,553 9.0 Belgium 2977 6.8 Belgium 3090 7.7
United Kingdom 3,527 7.0 United Kingdom 1291 3.5 United Kingdom 2242 6.1
64,430 82 92,381 105.2 92,703 124.7
4,112 7 4,899 5.9 5,940 8.2
China 1,586 1.0 China 2,161 19.3 China 2,796 3
Turkey 1,095 0.6 Turkey 1,683 1.0 Turkey 1,662 1.1
Danimark 444 2.0 Switzerland 422 1.5 Switzerland 360 1.3
60,318 75 87,482 99.3 86,763 116.5
Benelux 28,103 39.0 Belgium 43,995 44.3 Belgium 46,028 57.4
Italy 21,980 23.0 Italy 34,572 39.9 Italy 31,118 40.7
France 7,251 8.0 Germany 6,005 8.6 Germany 7,103 10.7
10,112 - - - - -
- - - - - -
- - - - - -
- - - - - -12,774 - - - -
May-11 May-12 May-12
1
Netherlands 1
1
4.4 4.4

IPO 2013 Survey on World Pasta Industry
The World Pasta Industry in Figures 2010 - 2012
Source: IPO 2013 Annual Survey on World Pasta Industry1 - Source: Import/Export figures by Global Trade Information Services, Inc.
Country
Number of Manufacturers (capacity greater than 1 tons/day)
Production
Dry Pasta
-- Durum wheat semolina
-- Soft wheat flour
-- Egg pasta
Fresh pasta
Noodles/ Instant Pasta/ Ready Meals
Total Consumption (in tons)
Dry Pasta
-- Durum wheat semolina
-- Soft wheat flour
-- Egg pasta
Fresh pasta
Noodles/ Instant Pasta/ Ready Meals
Per capita consumption (in Kg)
Dry Pasta
-- Durum wheat semolina
-- Soft wheat flour
-- Egg pasta
Fresh pasta
Noodles/ Instant Pasta/ Ready Meals
Total Population (million hab.)
Export
Total
(2012-First three countries of destination)
Non EU Countries
Total
First three countries of destination
--
--
--
E.U. Member States
Total
--
--
--
Import
Total
(2012-First three countries of destination)
Non EU Countries
Total
--
--
--
E.U. Member States
Total
--
--
--
Raw materials
Wheat (tons)
a) Durum wheat for pasta production
b) Soft wheat for pasta production
c) Others (Biscuits, Breads, ect…)
Total
Eggs (tons)
Last data update
2010 2011 2012
Volume Value Volume Value Volume Value(Tonnes) Million Euro (Tonnes) Million Euro (Tonnes) Million Euro
76,000 - 76,000 - 77,000 -
70,000 - 69,000 - 69,500 -
13,435 11.0 14,016 12.5 16,376 15.5
5,316 6.0
5,082 4.9 5,707 5.9
Angola 2,096 2.0 Angola 2,149 2 Angola 2,074 2.4
Capo verde 911 0.6Sao Tome & Principe 769 0.5
Sao Tome & Principe 997 0.7
Sao Tome & Principe 750 0.5 Guinea-Bissau 728 0.5 Guinea-Bissau 635 0.4
8,119 5.0 8,934 7.6 10,669 9.7
Spain 7,177 5.0 Spain 7,960 6.4 Spain 9,203 7.4
France 538 0.5 France 591 0.7 France 777 1.3
Belgium 305 0.4 Luxemburgo 283 0.4 Luxemburgo 362 4.5
18,509 36.0 19,760 36.2 22,669 37.1
243 0.5 310 0.4 302 0.4
China 164 0.1 China 218 0.2 China 201 0.2
Japan 31 0.1 Thailandia 23 0.09 Indonesia 35 0.06
Thailandia 28 0.1 Japan 35 0.09 Thailandia 25 0.04
18,266 35.0 19,450 35.8 22,367 36.7
Spain 7,492 11.0 Spain 8,253 12.8 Spain 9,948 16.2
Italy 5,229 13.0 Italy 6,591 11.1 Italy 7,903 11.7
France 4,841 10.0 France 4,078 10.5 France 3,883 7.5
- - 100,000 - 100,000 -
- - - - - -
- - - - - -
- - - - - -- - - - - -
May-12 May-12 May-13
Portugal 1
11 1
6.5 6.6 6.6
IPO 2013 Survey on World Pasta Industry
The World Pasta Industry in Figures 2010 - 2012
Source: IPO 2013 Annual Survey on World Pasta Industry1 - Source: Import/Export figures by Global Trade Information Services, Inc.
Country
Number of Manufacturers (capacity greater than 1 tons/day)
Production
Dry Pasta
-- Durum wheat semolina
-- Soft wheat flour
-- Egg pasta
Fresh pasta
Noodles/ Instant Pasta/ Ready Meals
Total Consumption (in tons)
Dry Pasta
-- Durum wheat semolina
-- Soft wheat flour
-- Egg pasta
Fresh pasta
Noodles/ Instant Pasta/ Ready Meals
Per capita consumption (in Kg)
Dry Pasta
-- Durum wheat semolina
-- Soft wheat flour
-- Egg pasta
Fresh pasta
Noodles/ Instant Pasta/ Ready Meals
Total Population (million hab.)
Export
Total
(2012-First three countries of destination)
Non EU Countries
Total
First three countries of destination
--
--
--
E.U. Member States
Total
--
--
--
Import
Total
(2012-First three countries of destination)
Non EU Countries
Total
--
--
--
E.U. Member States
Total
--
--
--
Raw materials
Wheat (tons)
a) Durum wheat for pasta production
b) Soft wheat for pasta production
c) Others (Biscuits, Breads, ect…)
Total
Eggs (tons)
Last data update
2010 2011 2012
7
Volume Value Volume Value Volume Value(Tonnes) Million Euro (Tonnes) Million Euro (Tonnes) Million Euro
252,624 - 252,208 - 254,876 -
232,353 236,424 - 248,448 -
5.0
49,746 47.0 35,777 - 39,605 -
9,953 8.0 4,338 - 4,133 -
Norway 4,875 3.0
China 841 0.6
Malilla 488 0.4
39,793 39.0 31,439 - 35,472 -
France 23,090 17.0
Portugal 11,119 17.0
United Kingdom 1,992 2.0
46,956 78.0 19,993 - 33,177 -
3,251 4.0 915 - 4,665 -
China 2,135 2.0
Thailandia 376 0.7
Argentina 224 0.4
43,705 74.0 19,078 - 28,512 -
Italy 29,625 51.0
Portugal 7,037 5.0
France 3,578 8.0
358,726 - 358,135 - 361,924 -
- - - - - -
- - - - - -
- - - - - -2,247 - 2,388 - 21,194 -
Spain 1
7 7
5.35.0
Mar-12Apr-11 Mar-12

IPO 2013 Survey on World Pasta Industry
The World Pasta Industry in Figures 2010 - 2012
Source: IPO 2013 Annual Survey on World Pasta Industry1 - Source: Import/Export figures by Global Trade Information Services, Inc.
Country
Number of Manufacturers (capacity greater than 1 tons/day)
Production
Dry Pasta
-- Durum wheat semolina
-- Soft wheat flour
-- Egg pasta
Fresh pasta
Noodles/ Instant Pasta/ Ready Meals
Total Consumption (in tons)
Dry Pasta
-- Durum wheat semolina
-- Soft wheat flour
-- Egg pasta
Fresh pasta
Noodles/ Instant Pasta/ Ready Meals
Per capita consumption (in Kg)
Dry Pasta
-- Durum wheat semolina
-- Soft wheat flour
-- Egg pasta
Fresh pasta
Noodles/ Instant Pasta/ Ready Meals
Total Population (million hab.)
Export
Total
(2012-First three countries of destination)
Non EU Countries
Total
First three countries of destination
--
--
--
E.U. Member States
Total
--
--
--
Import
Total
(2012-First three countries of destination)
Non EU Countries
Total
--
--
--
E.U. Member States
Total
--
--
--
Raw materials
Wheat (tons)
a) Durum wheat for pasta production
b) Soft wheat for pasta production
c) Others (Biscuits, Breads, ect…)
Total
Eggs (tons)
Last data update
2010 2011 2012
Volume Value Volume Value Volume Value(Tonnes) Million Euro (Tonnes) Million Euro (Tonnes) Million Euro
35,000 - 35,000 - 35,000 -
135,000 - 135,000 - 135,000 -
6,517 17.0 7,754 18.2 7,966 18.8
900 2.0 1,391 2.2 1103 1.8
South Korea 255 0.2 South Korea 646 0.5 South Korea 461 0.5
Malaysia 163 0.1 Japan 198 0.2 Malaysia 162 0.2
Norway 73 0.1 Thailandia 103 0.1United Arab Emirates 123 0.3
5,617 15.0 6,363 16.0 6,863 17.1
Ireland 4,219 11.0 Ireland 4,990 12.9 Ireland 5,573 13.9
Denmark 521 1.0 Denmark 362 1.0 Denmark 311 0.9
Spain 193 0.5 France 233 0.7 Belgium 188 0.4
188,326 204.0 188,518 210.9 176,789 213.6
1,959 3.0 3,095 3.5 6,209 8.6
Turkey 689 0.4 Turkey 1,807 1.1 Turkey 4224 2.6
Thailandia 265 1.0 Thailandia 268 0.6 Vietnam 366 2.4
China 185 0.2 China 176 0.4 Thailandia 321 0.8
186,367 201.0 185,423 207.5 170,580 205
Italy 150,604 152.0 Italy 149,241 159.5 Italy 134,990 150.5
Belgium 13,832 17.0 Belgium 12,725 15.0 Belgium 12,833 16.6
Germany 6,476 8.0 Germany 7,061 7.4 France 5,635 11.4
- - - - - -
- - - - - -
- - - - - -
- - - - - -- - - - - -
United Kingdom 1
8 8 8
2.5 2.5 2.5
Apr-06 Apr-10 Apr-10
IPO 2013 Survey on World Pasta Industry
The World Pasta Industry in Figures 2010 - 2012
Source: IPO 2013 Annual Survey on World Pasta Industry1 - Source: Import/Export figures by Global Trade Information Services, Inc.
Country
Number of Manufacturers (capacity greater than 1 tons/day)
Production
Dry Pasta
-- Durum wheat semolina
-- Soft wheat flour
-- Egg pasta
Fresh pasta
Noodles/ Instant Pasta/ Ready Meals
Total Consumption (in tons)
Dry Pasta
-- Durum wheat semolina
-- Soft wheat flour
-- Egg pasta
Fresh pasta
Noodles/ Instant Pasta/ Ready Meals
Per capita consumption (in Kg)
Dry Pasta
-- Durum wheat semolina
-- Soft wheat flour
-- Egg pasta
Fresh pasta
Noodles/ Instant Pasta/ Ready Meals
Total Population (million hab.)
Export
Total
(2012-First three countries of destination)
Non EU Countries
Total
First three countries of destination
--
--
--
E.U. Member States
Total
--
--
--
Import
Total
(2012-First three countries of destination)
Non EU Countries
Total
--
--
--
E.U. Member States
Total
--
--
--
Raw materials
Wheat (tons)
a) Durum wheat for pasta production
b) Soft wheat for pasta production
c) Others (Biscuits, Breads, ect…)
Total
Eggs (tons)
Last data update
2010 2011 2012
2 2 2
Volume Value Volume Value Volume Value(Tonnes) Million Euro (Tonnes) Million Euro (Tonnes) Million Euro
70,000 - 70,000 - 70,000 -
60,000 - 60,000 - 60,000 -
32,164 19.0 41,642 26 34,317 22.6
173 0.1 590 0.4 390 0.6
Russia 173 0.1 Croatia 326 0.2 Russia 338 0.5
- - - Russia 262 0.2 Ukraine 35 0.05
- - - Moldavia 2 0.001 Kyrgyzstan 17 0
31,991 19.0
41,052 25.7 33,927 22.0
Poland 14,333 8.0 Slovakia 17,721 11.4 Poland 17,169 10.9
Slovakia 12,081 8.0 Poland 16,971 10.6 Slovakia 11,737 8.2
Hungaria 2,385 1.0 Hungaria 3,385 1.9 Hungaria 2,817 1.6
27,959 25.0 30,300 28.4 31,562 31.3
135 0.2 262 0.3 446 0.4
Vietnam 83 0.1 Vietnam 144 0.2 Turkey 169 0.1
China 24 0.0 Turkey 52 0.04 Vietnam 129 0.1
Thailandia 15 0.0 China 40 0.05 China 92 0
27,824 25.0 30,038 28.20 31,116 3.00
Italy 11,895 10.0 Italy 12,408 11.9 Italy 12,539 12.7
Poland 6,218 3.0 Poland 7,245 3.7 France 5,013 6.6
France 5,360 6.0 France 4,976 6.3 Germany 3,909 3.9
10,000 - 20% - 20% -
55,000 - 70% - 70% -
- - - - - -
- - - - - -5,000 - 10% - 10% -
Czech Republic 1
May-12Apr-10
6.0 6.0 6.0
May-13
IPO 2013 Survey on World Pasta Industry
The World Pasta Industry in Figures 2010 - 2012
Source: IPO 2013 Annual Survey on World Pasta Industry1 - Source: Import/Export figures by Global Trade Information Services, Inc.
Country
Number of Manufacturers (capacity greater than 1 tons/day)
Production
Dry Pasta
-- Durum wheat semolina
-- Soft wheat flour
-- Egg pasta
Fresh pasta
Noodles/ Instant Pasta/ Ready Meals
Total Consumption (in tons)
Dry Pasta
-- Durum wheat semolina
-- Soft wheat flour
-- Egg pasta
Fresh pasta
Noodles/ Instant Pasta/ Ready Meals
Per capita consumption (in Kg)
Dry Pasta
-- Durum wheat semolina
-- Soft wheat flour
-- Egg pasta
Fresh pasta
Noodles/ Instant Pasta/ Ready Meals
Total Population (million hab.)
Export
Total
(2012-First three countries of destination)
Non EU Countries
Total
First three countries of destination
--
--
--
E.U. Member States
Total
--
--
--
Import
Total
(2012-First three countries of destination)
Non EU Countries
Total
--
--
--
E.U. Member States
Total
--
--
--
Raw materials
Wheat (tons)
a) Durum wheat for pasta production
b) Soft wheat for pasta production
c) Others (Biscuits, Breads, ect…)
Total
Eggs (tons)
Last data update
2010 2011 2012
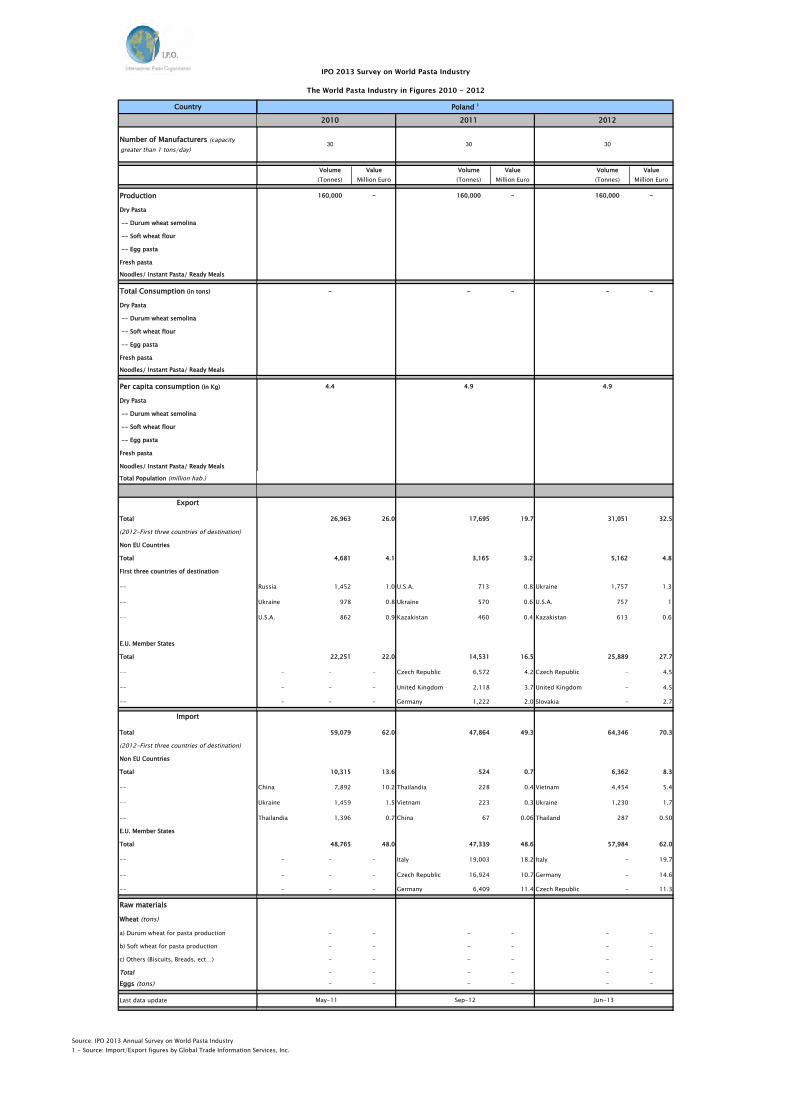
30 30 30
Volume Value Volume Value Volume Value(Tonnes) Million Euro (Tonnes) Million Euro (Tonnes) Million Euro
160,000 - 160,000 - 160,000 -
- - - - -
4.4 4.9 4.9
26,963 26.0 17,695 19.7 31,051 32.5
4,681 4.1 3,165 3.2 5,162 4.8
Russia 1,452 1.0 U.S.A. 713 0.8 Ukraine 1,757 1.3
Ukraine 978 0.8 Ukraine 570 0.6 U.S.A. 757 1
U.S.A. 862 0.9 Kazakistan 460 0.4 Kazakistan 613 0.6
22,251 22.0 14,531 16.5 25,889 27.7
- - - Czech Republic 6,572 4.2 Czech Republic - 4.5
- - - United Kingdom 2,118 3.7 United Kingdom - 4.5
- - - Germany 1,222 2.0 Slovakia - 2.7
59,079 62.0 47,864 49.3 64,346 70.3
10,315 13.6 524 0.7 6,362 8.3
China 7,892 10.2 Thailandia 228 0.4 Vietnam 4,454 5.4
Ukraine 1,459 1.5 Vietnam 223 0.3 Ukraine 1,230 1.7
Thailandia 1,396 0.7 China 67 0.06 Thailand 287 0.50
48,765 48.0 47,339 48.6 57,984 62.0
- - - Italy 19,003 18.2 Italy - 19.7
- - - Czech Republic 16,924 10.7 Germany - 14.6
- - - Germany 6,409 11.4 Czech Republic - 11.3
- - - - - -
- - - - - -
- - - - - -
- - - - - -- - - - - -
Poland 1
Sep-12May-11 Jun-13
IPO 2013 Survey on World Pasta Industry
The World Pasta Industry in Figures 2010 - 2012
Source: IPO 2013 Annual Survey on World Pasta Industry1 - Source: Import/Export figures by Global Trade Information Services, Inc.
Country
Number of Manufacturers (capacity greater than 1 tons/day)
Production
Dry Pasta
-- Durum wheat semolina
-- Soft wheat flour
-- Egg pasta
Fresh pasta
Noodles/ Instant Pasta/ Ready Meals
Total Consumption (in tons)
Dry Pasta
-- Durum wheat semolina
-- Soft wheat flour
-- Egg pasta
Fresh pasta
Noodles/ Instant Pasta/ Ready Meals
Per capita consumption (in Kg)
Dry Pasta
-- Durum wheat semolina
-- Soft wheat flour
-- Egg pasta
Fresh pasta
Noodles/ Instant Pasta/ Ready Meals
Total Population (million hab.)
Export
Total
(2012-First three countries of destination)
Non EU Countries
Total
First three countries of destination
--
--
--
E.U. Member States
Total
--
--
--
Import
Total
(2012-First three countries of destination)
Non EU Countries
Total
--
--
--
E.U. Member States
Total
--
--
--
Raw materials
Wheat (tons)
a) Durum wheat for pasta production
b) Soft wheat for pasta production
c) Others (Biscuits, Breads, ect…)
Total
Eggs (tons)
Last data update
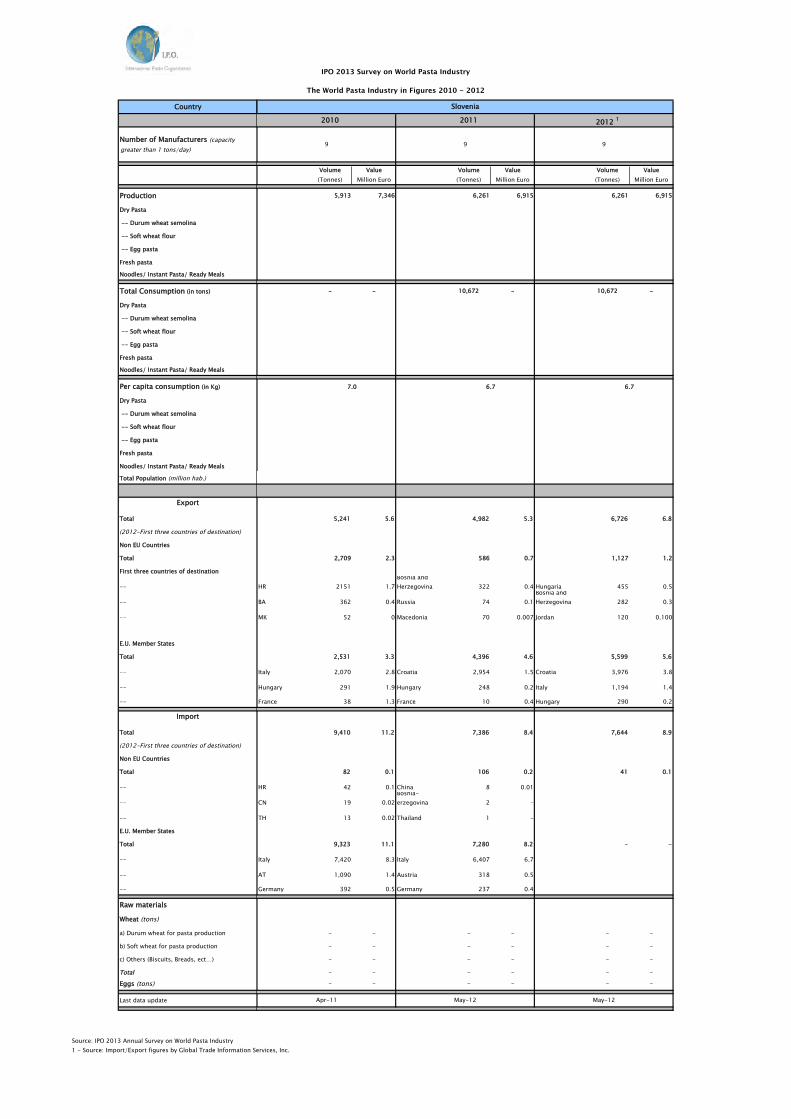
2010 2011 2012 1
Volume Value Volume Value Volume Value(Tonnes) Million Euro (Tonnes) Million Euro (Tonnes) Million Euro
5,913 7,346 6,261 6,915 6,261 6,915
- - 10,672 - 10,672 -
5,241 5.6 4,982 5.3 6,726 6.8
2,709 2.3 586 0.7 1,127 1.2
HR 2151 1.7Bosnia and Herzegovina 322 0.4 Hungaria 455 0.5
BA 362 0.4 Russia 74 0.1Bosnia and Herzegovina 282 0.3
MK 52 0 Macedonia 70 0.007 Jordan 120 0.100
2,531 3.3 4,396 4.6 5,599 5.6
Italy 2,070 2.8 Croatia 2,954 1.5 Croatia 3,976 3.8
Hungary 291 1.9 Hungary 248 0.2 Italy 1,194 1.4
France 38 1.3 France 10 0.4 Hungary 290 0.2
9,410 11.2 7,386 8.4 7,644 8.9
82 0.1 106 0.2 41 0.1
HR 42 0.1 China 8 0.01
CN 19 0.02Bosnia-erzegovina 2 -
TH 13 0.02 Thailand 1 -
9,323 11.1 7,280 8.2 - -
Italy 7,420 8.3 Italy 6,407 6.7
AT 1,090 1.4 Austria 318 0.5
Germany 392 0.5 Germany 237 0.4
- - - - - -
- - - - - -
- - - - - -
- - - - - -- - - - - -
Slovenia
9
May-12
9
Apr-11
7.0
May-12
9
6.7 6.7
IPO 2013 Survey on World Pasta Industry
The World Pasta Industry in Figures 2010 - 2012
Source: IPO 2013 Annual Survey on World Pasta Industry1 - Source: Import/Export figures by Global Trade Information Services, Inc.
Country
Number of Manufacturers (capacity greater than 1 tons/day)
Production
Dry Pasta
-- Durum wheat semolina
-- Soft wheat flour
-- Egg pasta
Fresh pasta
Noodles/ Instant Pasta/ Ready Meals
Total Consumption (in tons)
Dry Pasta
-- Durum wheat semolina
-- Soft wheat flour
-- Egg pasta
Fresh pasta
Noodles/ Instant Pasta/ Ready Meals
Per capita consumption (in Kg)
Dry Pasta
-- Durum wheat semolina
-- Soft wheat flour
-- Egg pasta
Fresh pasta
Noodles/ Instant Pasta/ Ready Meals
Total Population (million hab.)
Export
Total
(2012-First three countries of destination)
Non EU Countries
Total
First three countries of destination
--
--
--
E.U. Member States
Total
--
--
--
Import
Total
(2012-First three countries of destination)
Non EU Countries
Total
--
--
--
E.U. Member States
Total
--
--
--
Raw materials
Wheat (tons)
a) Durum wheat for pasta production
b) Soft wheat for pasta production
c) Others (Biscuits, Breads, ect…)
Total
Eggs (tons)
Last data update
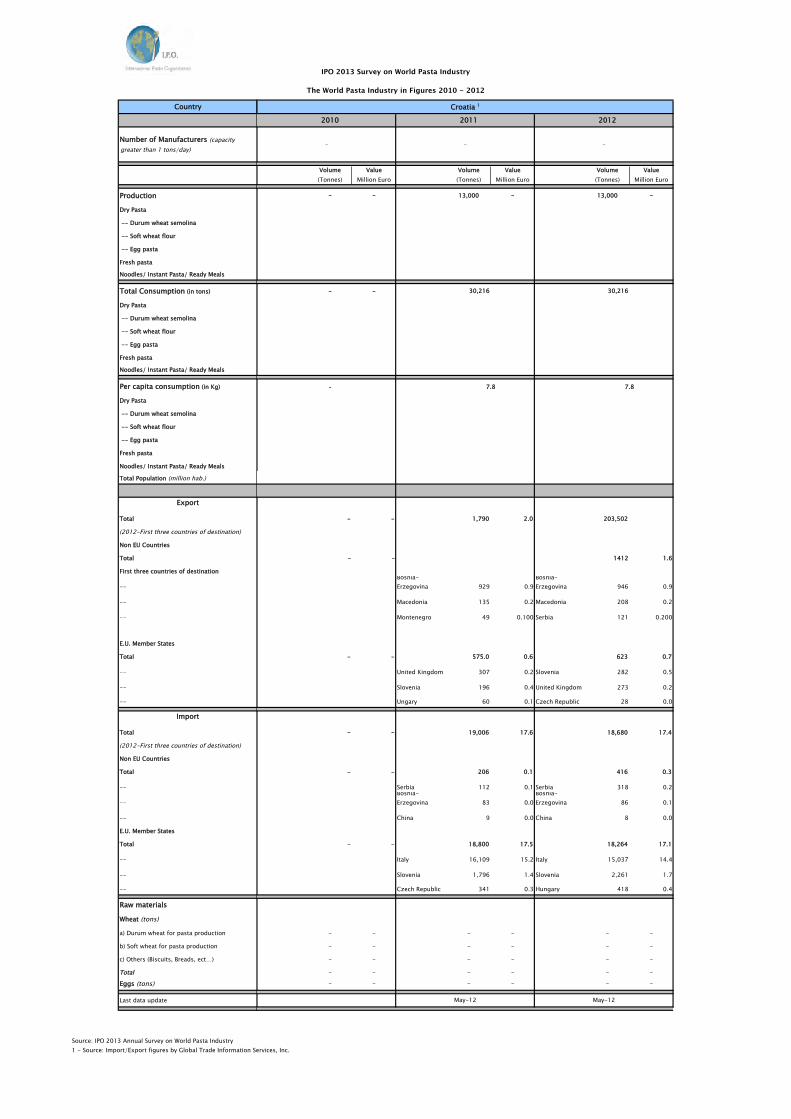
2010 2011 2012
Volume Value Volume Value Volume Value(Tonnes) Million Euro (Tonnes) Million Euro (Tonnes) Million Euro
- - 13,000 - 13,000 -
- - 30,216 30,216
-
- - 1,790 2.0 203,502
- - 1412 1.6
Bosnia-Erzegovina 929 0.9
Bosnia-Erzegovina 946 0.9
Macedonia 135 0.2 Macedonia 208 0.2
Montenegro 49 0.100 Serbia 121 0.200
- - 575.0 0.6 623 0.7
United Kingdom 307 0.2 Slovenia 282 0.5
Slovenia 196 0.4 United Kingdom 273 0.2
Ungary 60 0.1 Czech Republic 28 0.0
- - 19,006 17.6 18,680 17.4
- - 206 0.1 416 0.3
Serbia 112 0.1 Serbia 318 0.2Bosnia-Erzegovina 83 0.0
Bosnia-Erzegovina 86 0.1
China 9 0.0 China 8 0.0
- - 18,800 17.5 18,264 17.1
Italy 16,109 15.2 Italy 15,037 14.4
Slovenia 1,796 1.4 Slovenia 2,261 1.7
Czech Republic 341 0.3 Hungary 418 0.4
- - - - - -
- - - - - -
- - - - - -
- - - - - -- - - - - -
- -
Croatia 1
-
7.8 7.8
May-12 May-12

IPO 2013 Survey on World Pasta Industry
The World Pasta Industry in Figures 2010 - 2012
Source: IPO 2013 Annual Survey on World Pasta Industry1 - Source: Import/Export figures by Global Trade Information Services, Inc.
Country
Number of Manufacturers (capacity greater than 1 tons/day)
Production
Dry Pasta
-- Durum wheat semolina
-- Soft wheat flour
-- Egg pasta
Fresh pasta
Noodles/ Instant Pasta/ Ready Meals
Total Consumption (in tons)
Dry Pasta
-- Durum wheat semolina
-- Soft wheat flour
-- Egg pasta
Fresh pasta
Noodles/ Instant Pasta/ Ready Meals
Per capita consumption (in Kg)
Dry Pasta
-- Durum wheat semolina
-- Soft wheat flour
-- Egg pasta
Fresh pasta
Noodles/ Instant Pasta/ Ready Meals
Total Population (million hab.)
Export
Total
(2012-First three countries of destination)
Non EU Countries
Total
First three countries of destination
--
--
--
E.U. Member States
Total
--
--
--
Import
Total
(2012-First three countries of destination)
Non EU Countries
Total
--
--
--
E.U. Member States
Total
--
--
--
Raw materials
Wheat (tons)
a) Durum wheat for pasta production
b) Soft wheat for pasta production
c) Others (Biscuits, Breads, ect…)
Total
Eggs (tons)
Last data update
2010 2011 2012
Volume Value Volume Value Volume Value(Tonnes) Million Euro (Tonnes) Million Euro (Tonnes) Million Euro
- - 1,083,000 - 1,083,000 -
- - 1,128,188 1,128,188
-
- - 4,388 4.0 5,819 5.2
- - 4,388 4.0 5799 5.2
Ukraine 1,643 1.8 Ukraine 2,648 3.0
Tajikistan 1,233 1.1 Tajikistan 1,581 0.6
Mongolia 530 0.300 Moldova 354 0.3
- - - - 20 0.0
- - Lithuania 19 0.0
- - Latvia 1 0.0
- - - -
- - 49,576 48.9 49,576 48.9
- - 5,683 5.0 5,683 5.0
China 3525 2.3 China 3525 2.3
Vietnam 576 0.5 Vietnam 576 0.5
Ukraine 511 0.6 Ukraine 511 0.6
- - 43,893 43.9 43,893 43.9
Italy 38,749 36.7 Italy 38,749 36.7
Germany 3,727 5.7 Germany 3,727 5.7
Lithuania 460 0.3 Lithuania 460 0.3
- - - - - -
- - - - - -
- - - - - -
- - - - - -- - - - - -
Russia 1
-
7.8 7.8
May-12 May-12
- -
IPO 2013 Survey on World Pasta Industry
The World Pasta Industry in Figures 2010 - 2012
Source: IPO 2013 Annual Survey on World Pasta Industry1 - Source: Import/Export figures by Global Trade Information Services, Inc.
Country
Number of Manufacturers (capacity greater than 1 tons/day)
Production
Dry Pasta
-- Durum wheat semolina
-- Soft wheat flour
-- Egg pasta
Fresh pasta
Noodles/ Instant Pasta/ Ready Meals
Total Consumption (in tons)
Dry Pasta
-- Durum wheat semolina
-- Soft wheat flour
-- Egg pasta
Fresh pasta
Noodles/ Instant Pasta/ Ready Meals
Per capita consumption (in Kg)
Dry Pasta
-- Durum wheat semolina
-- Soft wheat flour
-- Egg pasta
Fresh pasta
Noodles/ Instant Pasta/ Ready Meals
Total Population (million hab.)
Export
Total
(2012-First three countries of destination)
Non EU Countries
Total
First three countries of destination
--
--
--
E.U. Member States
Total
--
--
--
Import
Total
(2012-First three countries of destination)
Non EU Countries
Total
--
--
--
E.U. Member States
Total
--
--
--
Raw materials
Wheat (tons)
a) Durum wheat for pasta production
b) Soft wheat for pasta production
c) Others (Biscuits, Breads, ect…)
Total
Eggs (tons)
Last data update
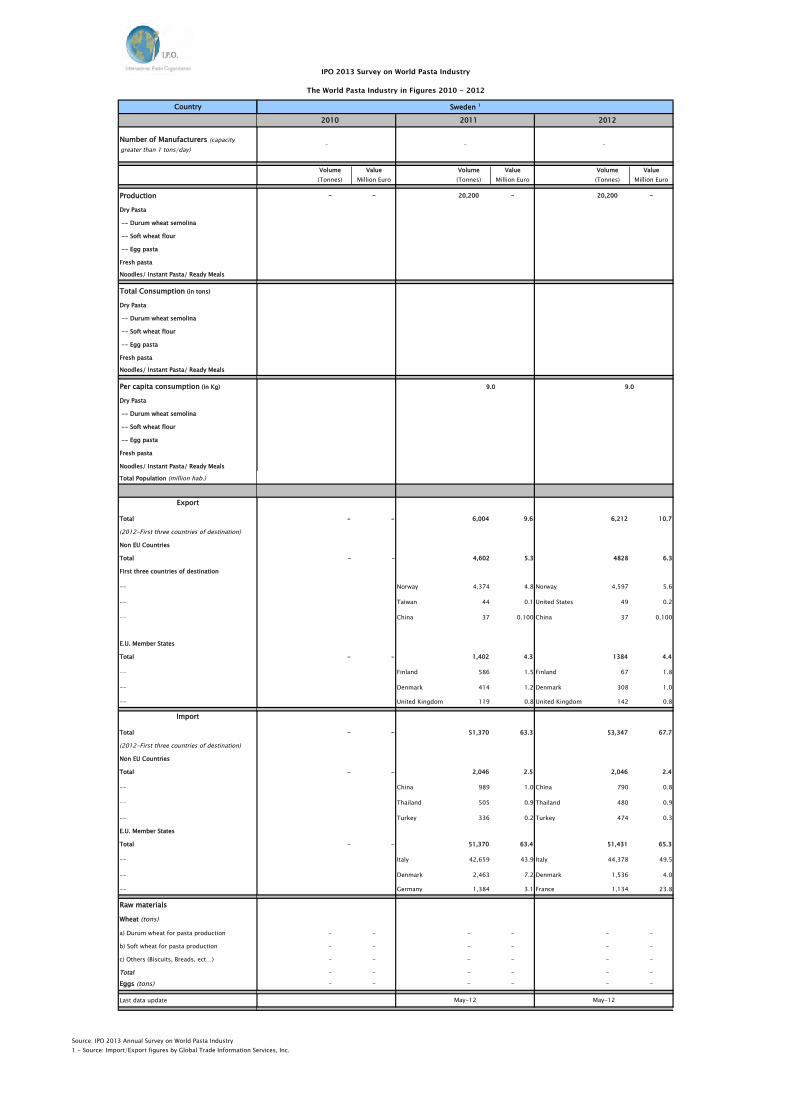
2010 2011 2012
Volume Value Volume Value Volume Value(Tonnes) Million Euro (Tonnes) Million Euro (Tonnes) Million Euro
- - 20,200 - 20,200 -
- - 6,004 9.6 6,212 10.7
- - 4,602 5.3 4828 6.3
Norway 4,374 4.8 Norway 4,597 5.6
Taiwan 44 0.1 United States 49 0.2
China 37 0.100 China 37 0.100
- - 1,402 4.3 1384 4.4
Finland 586 1.5 Finland 67 1.8
Denmark 414 1.2 Denmark 308 1.0
United Kingdom 119 0.8 United Kingdom 142 0.8
- - 51,370 63.3 53,347 67.7
- - 2,046 2.5 2,046 2.4
China 989 1.0 China 790 0.8
Thailand 505 0.9 Thailand 480 0.9
Turkey 336 0.2 Turkey 474 0.3
- - 51,370 63.4 51,431 65.3
Italy 42,659 43.9 Italy 44,378 49.5
Denmark 2,463 7.2 Denmark 1,536 4.0
Germany 1,384 3.1 France 1,134 23.8
- - - - - -
- - - - - -
- - - - - -
- - - - - -- - - - - -
Sweden 1
9.0 9.0
-
May-12
--
May-12
IPO 2013 Survey on World Pasta Industry
The World Pasta Industry in Figures 2010 - 2012
Source: IPO 2013 Annual Survey on World Pasta Industry1 - Source: Import/Export figures by Global Trade Information Services, Inc.
Country
Number of Manufacturers (capacity greater than 1 tons/day)
Production
Dry Pasta
-- Durum wheat semolina
-- Soft wheat flour
-- Egg pasta
Fresh pasta
Noodles/ Instant Pasta/ Ready Meals
Total Consumption (in tons)
Dry Pasta
-- Durum wheat semolina
-- Soft wheat flour
-- Egg pasta
Fresh pasta
Noodles/ Instant Pasta/ Ready Meals
Per capita consumption (in Kg)
Dry Pasta
-- Durum wheat semolina
-- Soft wheat flour
-- Egg pasta
Fresh pasta
Noodles/ Instant Pasta/ Ready Meals
Total Population (million hab.)
Export
Total
(2012-First three countries of destination)
Non EU Countries
Total
First three countries of destination
--
--
--
E.U. Member States
Total
--
--
--
Import
Total
(2012-First three countries of destination)
Non EU Countries
Total
--
--
--
E.U. Member States
Total
--
--
--
Raw materials
Wheat (tons)
a) Durum wheat for pasta production
b) Soft wheat for pasta production
c) Others (Biscuits, Breads, ect…)
Total
Eggs (tons)
Last data update
2010 2011 2012
Volume Value Volume Value Volume Value(Tonnes) Million Euro (Tonnes) Million Euro (Tonnes) Million Euro
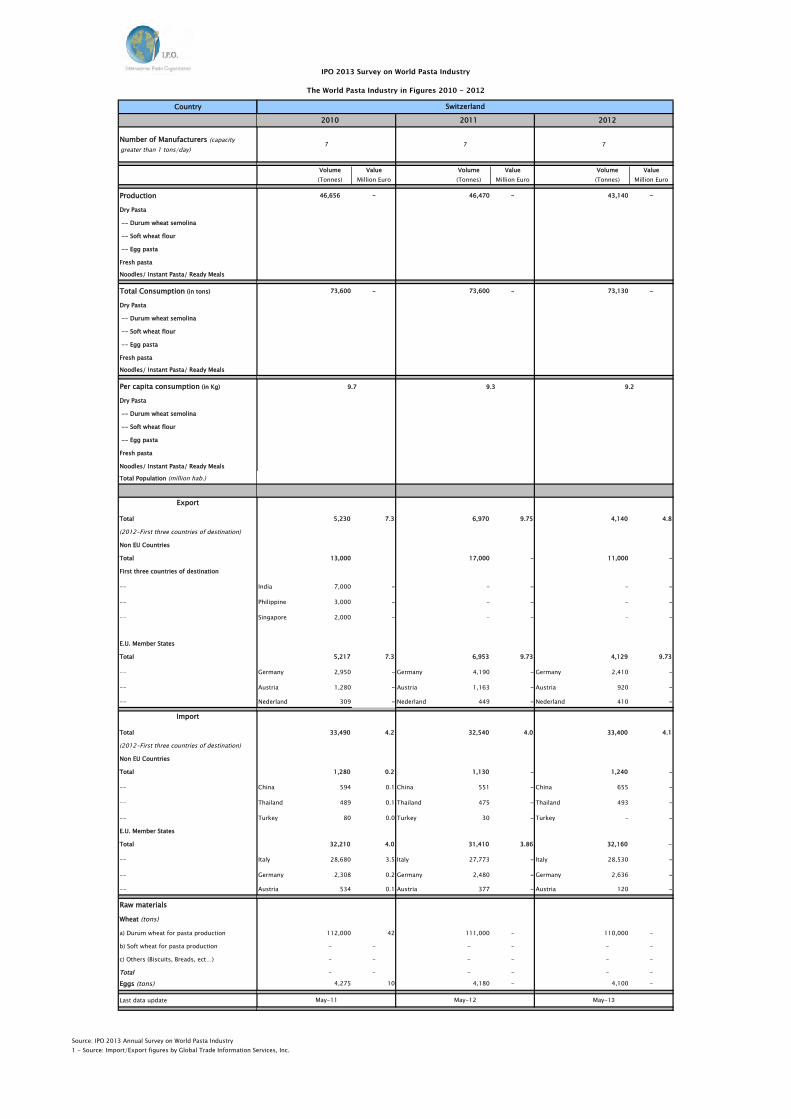
46,656 - 46,470 - 43,140 -
73,600 - 73,600 - 73,130 -
5,230 7.3 6,970 9.75 4,140 4.8
13,000 17,000 - 11,000 -
India 7,000 - - - - -
Philippine 3,000 - - - - -
Singapore 2,000 - - - - -
5,217 7.3 6,953 9.73 4,129 9.73
Germany 2,950 - Germany 4,190 - Germany 2,410 -
Austria 1,280 - Austria 1,163 - Austria 920 -
Nederland 309 - Nederland 449 - Nederland 410 -
33,490 4.2 32,540 4.0 33,400 4.1
1,280 0.2 1,130 - 1,240 -
China 594 0.1 China 551 - China 655 -
Thailand 489 0.1 Thailand 475 - Thailand 493 -
Turkey 80 0.0 Turkey 30 - Turkey - -
32,210 4.0 31,410 3.86 32,160 -
Italy 28,680 3.5 Italy 27,773 - Italy 28,530 -
Germany 2,308 0.2 Germany 2,480 - Germany 2,636 -
Austria 534 0.1 Austria 377 - Austria 120 -
112,000 42 111,000 - 110,000 -
- - - - - -
- - - - - -
- - - - - -4,275 10 4,180 - 4,100 -
Switzerland
7 7
9.7 9.3 9.2
May-13May-12
7
May-11

IPO 2013 Survey on World Pasta Industry
The World Pasta Industry in Figures 2010 - 2012
Source: IPO 2013 Annual Survey on World Pasta Industry1 - Source: Import/Export figures by Global Trade Information Services, Inc.
Country
Number of Manufacturers (capacity greater than 1 tons/day)
Production
Dry Pasta
-- Durum wheat semolina
-- Soft wheat flour
-- Egg pasta
Fresh pasta
Noodles/ Instant Pasta/ Ready Meals
Total Consumption (in tons)
Dry Pasta
-- Durum wheat semolina
-- Soft wheat flour
-- Egg pasta
Fresh pasta
Noodles/ Instant Pasta/ Ready Meals
Per capita consumption (in Kg)
Dry Pasta
-- Durum wheat semolina
-- Soft wheat flour
-- Egg pasta
Fresh pasta
Noodles/ Instant Pasta/ Ready Meals
Total Population (million hab.)
Export
Total
(2012-First three countries of destination)
Non EU Countries
Total
First three countries of destination
--
--
--
E.U. Member States
Total
--
--
--
Import
Total
(2012-First three countries of destination)
Non EU Countries
Total
--
--
--
E.U. Member States
Total
--
--
--
Raw materials
Wheat (tons)
a) Durum wheat for pasta production
b) Soft wheat for pasta production
c) Others (Biscuits, Breads, ect…)
Total
Eggs (tons)
Last data update
2010 2011 2012
Volume Value Volume Value Volume Value(Tonnes) Million Euro (Tonnes) Million Euro (Tonnes) Million Euro
66,000 - - -
74,000 - 74,000 - 72,991 -
4,670 7.0 112 0.2 4,431 6.0
2,689 4.0 86 0.1 675 0.9
Croatia 179 0.5 Ukraine 64 0.1 Ukraine 525 0.6
Ukraine 74 0.1 Croatia 6 0.0 USA 76 0.2
USA 63 0.1 USA 5 0.0 Canada 54 0.1
1,981 3.0 26 4.3 3,756 5.0
Romania 943 0.8 Romania 19 0.0 Romania 1,789 1.6
Slovakia 495 0.6 Slovakia 3 0.0 Slovakia 815 1.0United Kingdoma 158 0.6 Poland 2 0.0 France 434 1.5
11,528 10.0 13,273 7.5 12,908 10.9
46 0.1 349 0.0 33 0
Switzerland 19 0.0 Vietnam 295 0.0 China 15 0
Croatia 9 0.0 Switzerland 15 0.0 Vietnam 9 0.0
Turkey 8 0.0 Turkey 14 0.0 Brazil 5 0.0
11,412 9.9 12,924 7.4 12,875 10.9
Italy 6,065 5.0 Italy 7,273 5.0 Italy 6,923 5.9
Czech Republic 2,231 1.0 Czech Republic 2,927 1.4 Czech Republic 2,741 1.5
France 1,063 1.0 Germany 823 0.4 France 899 1.3
9,000 - - - - -
220,000 - - - - -
- - - - - -
- - - - - -15,000 - - - - -
Hungary 1
-
7.4
May-10 May-10
7.4 7.5
-
Sep-12
100

IPO 2013 Survey on World Pasta Industry
The World Pasta Industry in Figures 2010 - 2012
Source: IPO 2013 Annual Survey on World Pasta Industry1 - Source: Import/Export figures by Global Trade Information Services, Inc.
Country
Number of Manufacturers (capacity greater than 1 tons/day)
Production
Dry Pasta
-- Durum wheat semolina
-- Soft wheat flour
-- Egg pasta
Fresh pasta
Noodles/ Instant Pasta/ Ready Meals
Total Consumption (in tons)
Dry Pasta
-- Durum wheat semolina
-- Soft wheat flour
-- Egg pasta
Fresh pasta
Noodles/ Instant Pasta/ Ready Meals
Per capita consumption (in Kg)
Dry Pasta
-- Durum wheat semolina
-- Soft wheat flour
-- Egg pasta
Fresh pasta
Noodles/ Instant Pasta/ Ready Meals
Total Population (million hab.)
Export
Total
(2012-First three countries of destination)
Non EU Countries
Total
First three countries of destination
--
--
--
E.U. Member States
Total
--
--
--
Import
Total
(2012-First three countries of destination)
Non EU Countries
Total
--
--
--
E.U. Member States
Total
--
--
--
Raw materials
Wheat (tons)
a) Durum wheat for pasta production
b) Soft wheat for pasta production
c) Others (Biscuits, Breads, ect…)
Total
Eggs (tons)
Last data update
2010 2011 2012
Volume Value Volume Value Volume Value(Tonnes) Million Euro (Tonnes) Million Euro (Tonnes) Million Euro
560,000 346 560,000 346 560,000 346
350,000 360,000 - 360,000 -
247,492 16.0 54,000 28.0 37,565 26.9
24,308 16.0 53,977 28 37,500 25.7
Afghanistan 9,164 6.0 Afghanistan 12,861 7.8 Afghanistan 17,963 11.9
Iraq 5,579 4.0 Iraq 5,195 3.2 Iraq 4,982 3.8
Turkmenistan 3,077 2.0 Turkmenistan 3,401 2.0 Turkmenistan 3,972 2.6
53 0.0 23 0.0 65 1.1
France 25 0.0 Germany 23 0.0 Germany 22 0.0
Italy 14 0.0 - - Italy 22 0.0
United Kingdom 13 0.0 - - Poland 19 1.1
220 0.1 666 0.2 730 0.3
191 0.1 590 0.2 711 0.3
Turkey 145 0.1 Turkey 386 0.1United Arab Emirates 339 0.1
United Arab Emirates 46 0.0
United Arab Emirates 176 0.1 Turkey 291 0.1
- - Singapore 25 0.0 Thailandia 19 0.0
29 0.0 76 0.0 19 0.0
Italy 24 0.0 Italy 45 0.0 Italy 19 0.0
France 5 0.0 Poland 31 0.0 - -
- - - - - -
- - 9,000 - 9,000 -
- - 220,000 - 220,000 -
- - - - - -
- - - - - -- - 15,000 - 15,000 -
-10
Iran 1
-
8.5 8.5
Oct-12Oct-12
7.0
Jul-11
IPO 2013 Survey on World Pasta Industry
The World Pasta Industry in Figures 2010 - 2012
Source: IPO 2013 Annual Survey on World Pasta Industry1 - Source: Import/Export figures by Global Trade Information Services, Inc.
Country
Number of Manufacturers (capacity greater than 1 tons/day)
Production
Dry Pasta
-- Durum wheat semolina
-- Soft wheat flour
-- Egg pasta
Fresh pasta
Noodles/ Instant Pasta/ Ready Meals
Total Consumption (in tons)
Dry Pasta
-- Durum wheat semolina
-- Soft wheat flour
-- Egg pasta
Fresh pasta
Noodles/ Instant Pasta/ Ready Meals
Per capita consumption (in Kg)
Dry Pasta
-- Durum wheat semolina
-- Soft wheat flour
-- Egg pasta
Fresh pasta
Noodles/ Instant Pasta/ Ready Meals
Total Population (million hab.)
Export
Total
(2012-First three countries of destination)
Non EU Countries
Total
First three countries of destination
--
--
--
E.U. Member States
Total
--
--
--
Import
Total
(2012-First three countries of destination)
Non EU Countries
Total
--
--
--
E.U. Member States
Total
--
--
--
Raw materials
Wheat (tons)
a) Durum wheat for pasta production
b) Soft wheat for pasta production
c) Others (Biscuits, Breads, ect…)
Total
Eggs (tons)
Last data update
2010 2011 2012
Volume Value Volume Value Volume Value(Tonnes) Million Euro (Tonnes) Million Euro (Tonnes) Million Euro
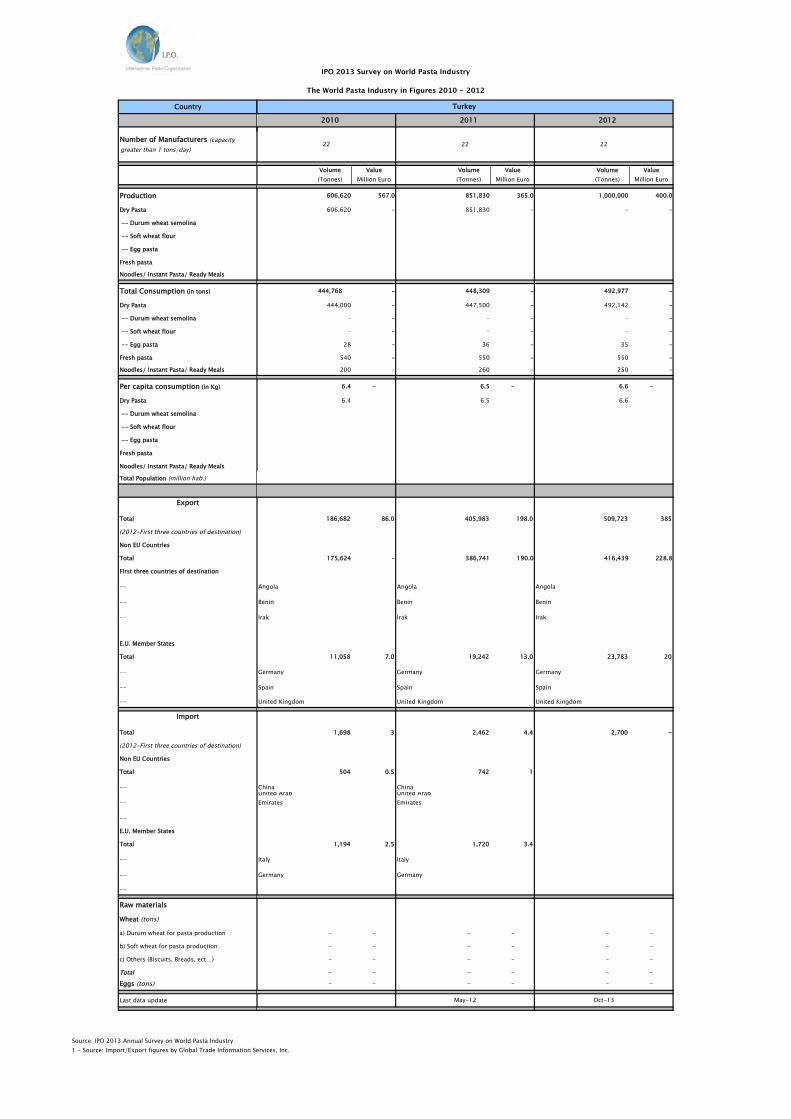
606,620 567.0 851,830 365.0 1,000,000 400.0
606,620 - 851,830 - - -
444,768 - 448,309 - 492,977 -
444,000 - 447,500 - 492,142 -
- - - - - -
- - - - - -
28 - 36 - 35 -
540 - 550 - 550 -
200 - 260 - 250 -
6.4 - 6.5 - 6.6 -
6.4 6.5 6.6
186,682 86.0 405,983 198.0 509,723 385
175,624 - 386,741 190.0 416,439 228.8
Angola Angola Angola
Benin Benin Benin
Irak Irak Irak
11,058 7.0 19,242 13.0 23,783 20
Germany Germany Germany
Spain Spain Spain
United Kingdom United Kingdom United Kingdom, ,
1,698 3 2,462 4.4 2,700 -
504 0.5 742 1
China ChinaUnited Arab Emirates
United Arab Emirates
1,194 2.5 1,720 3.4
Italy Italy
Germany Germany
- - - - - -
- - - - - -
- - - - - -
- - - - - -- - - - - -
May-12
22
Oct-13
Turkey
22 22
IPO 2013 Survey on World Pasta Industry
The World Pasta Industry in Figures 2010 - 2012
Source: IPO 2013 Annual Survey on World Pasta Industry1 - Source: Import/Export figures by Global Trade Information Services, Inc.
Country
Number of Manufacturers (capacity greater than 1 tons/day)
Production
Dry Pasta
-- Durum wheat semolina
-- Soft wheat flour
-- Egg pasta
Fresh pasta
Noodles/ Instant Pasta/ Ready Meals
Total Consumption (in tons)
Dry Pasta
-- Durum wheat semolina
-- Soft wheat flour
-- Egg pasta
Fresh pasta
Noodles/ Instant Pasta/ Ready Meals
Per capita consumption (in Kg)
Dry Pasta
-- Durum wheat semolina
-- Soft wheat flour
-- Egg pasta
Fresh pasta
Noodles/ Instant Pasta/ Ready Meals
Total Population (million hab.)
Export
Total
(2012-First three countries of destination)
Non EU Countries
Total
First three countries of destination
--
--
--
E.U. Member States
Total
--
--
--
Import
Total
(2012-First three countries of destination)
Non EU Countries
Total
--
--
--
E.U. Member States
Total
--
--
--
Raw materials
Wheat (tons)
a) Durum wheat for pasta production
b) Soft wheat for pasta production
c) Others (Biscuits, Breads, ect…)
Total
Eggs (tons)
Last data update
2010 2011 2012
28 28 28
Volume Value Volume Value Volume Value(Tonnes) Million Euro (Tonnes) Million Euro (Tonnes) Million Euro
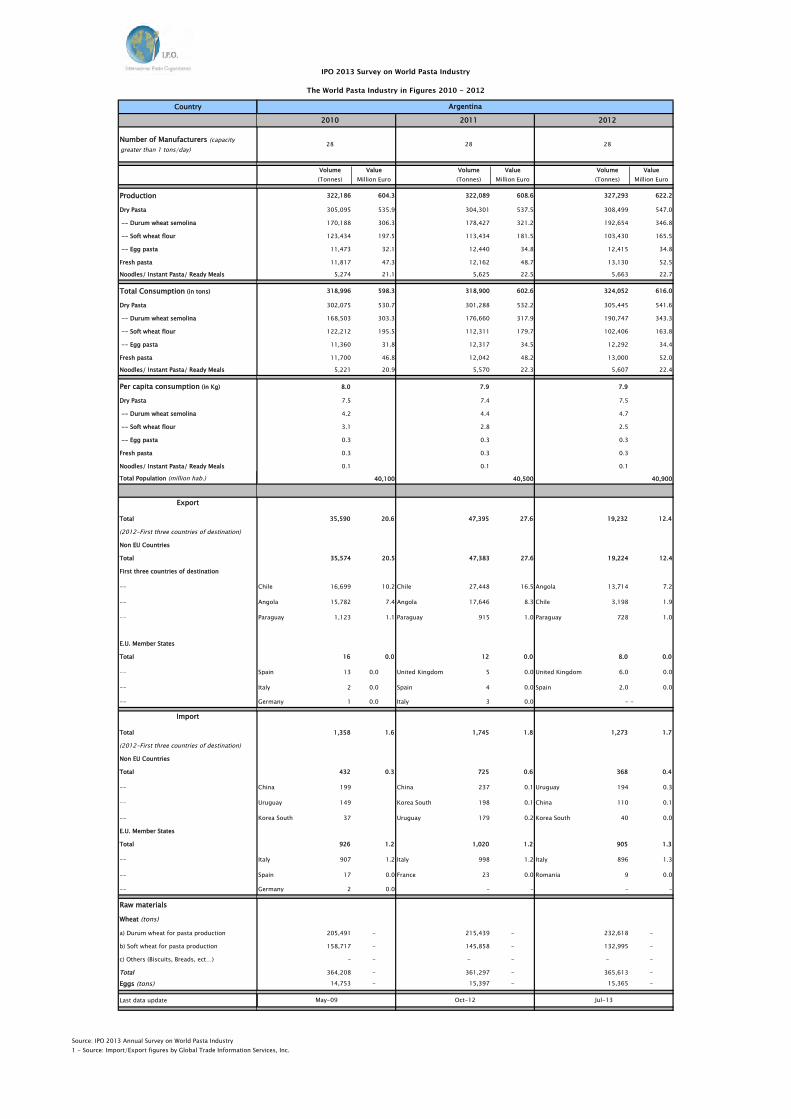
322,186 604.3 322,089 608.6 327,293 622.2
305,095 535.9 304,301 537.5 308,499 547.0
170,188 306.3 178,427 321.2 192,654 346.8
123,434 197.5 113,434 181.5 103,430 165.5
11,473 32.1 12,440 34.8 12,415 34.8
11,817 47.3 12,162 48.7 13,130 52.5
5,274 21.1 5,625 22.5 5,663 22.7
318,996 598.3 318,900 602.6 324,052 616.0
302,075 530.7 301,288 532.2 305,445 541.6
168,503 303.3 176,660 317.9 190,747 343.3
122,212 195.5 112,311 179.7 102,406 163.8
11,360 31.8 12,317 34.5 12,292 34.4
11,700 46.8 12,042 48.2 13,000 52.0
5,221 20.9 5,570 22.3 5,607 22.4
8.0 7.9 7.9
7.5 7.4 7.5
4.2 4.4 4.7
3.1 2.8 2.5
0.3 0.3 0.3
0.3 0.3 0.3
0.1 0.1 0.1
35,590 20.6 47,395 27.6 19,232 12.4
35,574 20.5 47,383 27.6 19,224 12.4
Chile 16,699 10.2 Chile 27,448 16.5 Angola 13,714 7.2
Angola 15,782 7.4 Angola 17,646 8.3 Chile 3,198 1.9
Paraguay 1,123 1.1 Paraguay 915 1.0 Paraguay 728 1.0
16 0.0 12 0.0 8.0 0.0
Spain 13 0.0 United Kingdom 5 0.0 United Kingdom 6.0 0.0
Italy 2 0.0 Spain 4 0.0 Spain 2.0 0.0
Germany 1 0.0 Italy 3 0.0 - -
1,358 1.6 1,745 1.8 1,273 1.7
432 0.3 725 0.6 368 0.4
China 199 China 237 0.1 Uruguay 194 0.3
Uruguay 149 Korea South 198 0.1 China 110 0.1
Korea South 37 Uruguay 179 0.2 Korea South 40 0.0
926 1.2 1,020 1.2 905 1.3
Italy 907 1.2 Italy 998 1.2 Italy 896 1.3
Spain 17 0.0 France 23 0.0 Romania 9 0.0
Germany 2 0.0 - - - -
205,491 - 215,439 - 232,618 -
158,717 - 145,858 - 132,995 -
- - - - - -
364,208 - 361,297 - 365,613 -14,753 - 15,397 - 15,365 -
Argentina
May-09 Oct-12
40,100 40,500 40,900
Jul-13

IPO 2013 Survey on World Pasta Industry
The World Pasta Industry in Figures 2010 - 2012
Source: IPO 2013 Annual Survey on World Pasta Industry1 - Source: Import/Export figures by Global Trade Information Services, Inc.
Country
Number of Manufacturers (capacity greater than 1 tons/day)
Production
Dry Pasta
-- Durum wheat semolina
-- Soft wheat flour
-- Egg pasta
Fresh pasta
Noodles/ Instant Pasta/ Ready Meals
Total Consumption (in tons)
Dry Pasta
-- Durum wheat semolina
-- Soft wheat flour
-- Egg pasta
Fresh pasta
Noodles/ Instant Pasta/ Ready Meals
Per capita consumption (in Kg)
Dry Pasta
-- Durum wheat semolina
-- Soft wheat flour
-- Egg pasta
Fresh pasta
Noodles/ Instant Pasta/ Ready Meals
Total Population (million hab.)
Export
Total
(2012-First three countries of destination)
Non EU Countries
Total
First three countries of destination
--
--
--
E.U. Member States
Total
--
--
--
Import
Total
(2012-First three countries of destination)
Non EU Countries
Total
--
--
--
E.U. Member States
Total
--
--
--
Raw materials
Wheat (tons)
a) Durum wheat for pasta production
b) Soft wheat for pasta production
c) Others (Biscuits, Breads, ect…)
Total
Eggs (tons)
Last data update
2010 2011 2012
Volume Value Volume Value Volume Value(Tonnes) Million Euro (Tonnes) Million Euro (Tonnes) Million Euro
1,232,691 2,301.4 1,195,483 2,381.1 1,191,847 2,423.3
1,006,517 1,436.7 960,894 1,443.4 953,597 1,451.0
50,326 71.8 48,045 72.2 47,680 72.6
956,191 1,364.9 912,849 1,371.3 905,918 1,378.5
- - - - - -
45,174 177.5 51,109 209.9 50,465 213.6
181,000 687.2 183,480 727.7 187,785 758.7
1,232,691 2,301.4 1,195,483 2381.1 1,191,847 2,423.3
1,006,517 1,436.7 960,894 1,443.4 953,597 1,451.0
50,326 71.8 48,045 72.2 47,680 72.5
956,191 1,364.9 912,849 1,371.3 905,918 1,378.5
- - - - - -
45,174 177.5 51,109 209.9 50,465 213.6
181,000 687.2 183,480 727.7 187,785 758.7
6.5 6.2 6.2
5.3 5.0 5.0
0.3 0.3 0.3
5.0 4.8 4.7
- - -
0.2 0.3 0.3
1.0 1.0 1.0
190,756 192,376 193,947
7,010 8.4 8,025 9.9 11,343 11.5
6,971 8.3 7,885 9.6 10,989 10.8
Venezuela Venezuela Venezuela 7,779 5.2
Chile Chile Chile 779 1.3
Paraguay Paraguay Paraguay 742 1.0
39.0 0.1 140 0.3 354 0.7
Portugal Portugal Portugal 307 0.6
Hungary Hungary Hungary 23 0.0
Ucraina Ucraina Ucraina 9 0.0
18,642.0 17.6 23,085 25.8 25,902 30.0
4,513.0 4.2 5,737 6.7 7,246 8.5
Uruguay Uruguay Uruguay 2,630 1.9
Chile Chile Chile 1,785 3.3
Mexico Mexico Mexico 747 0.5
14,129.0 13.3 17,348 19.1 18,656 21.6
Italy Italy Italy 18,581 21.3
France France France 83 0.1
Monaco Monaco Monaco 34 0.1
62,900 - 60,056 - 59,600 -
1,540,863 - 1,494,353 - 1,489,808 -
8,540,100 - 9,055,591 - 8,950,592 -
10,143,863 - 10,610,000 - 10,500,000 -40,000 - 40,000 - 40,000 -
May-13
150150
May-13
Brazil
May-13
140
IPO 2013 Survey on World Pasta Industry
The World Pasta Industry in Figures 2010 - 2012
Source: IPO 2013 Annual Survey on World Pasta Industry1 - Source: Import/Export figures by Global Trade Information Services, Inc.
Country
Number of Manufacturers (capacity greater than 1 tons/day)
Production
Dry Pasta
-- Durum wheat semolina
-- Soft wheat flour
-- Egg pasta
Fresh pasta
Noodles/ Instant Pasta/ Ready Meals
Total Consumption (in tons)
Dry Pasta
-- Durum wheat semolina
-- Soft wheat flour
-- Egg pasta
Fresh pasta
Noodles/ Instant Pasta/ Ready Meals
Per capita consumption (in Kg)
Dry Pasta
-- Durum wheat semolina
-- Soft wheat flour
-- Egg pasta
Fresh pasta
Noodles/ Instant Pasta/ Ready Meals
Total Population (million hab.)
Export
Total
(2012-First three countries of destination)
Non EU Countries
Total
First three countries of destination
--
--
--
E.U. Member States
Total
--
--
--
Import
Total
(2012-First three countries of destination)
Non EU Countries
Total
--
--
--
E.U. Member States
Total
--
--
--
Raw materials
Wheat (tons)
a) Durum wheat for pasta production
b) Soft wheat for pasta production
c) Others (Biscuits, Breads, ect…)
Total
Eggs (tons)
Last data update
2010 2011 2012 1
Volume Value Volume Value Volume Value(Tonnes) Million Euro (Tonnes) Million Euro (Tonnes) Million Euro
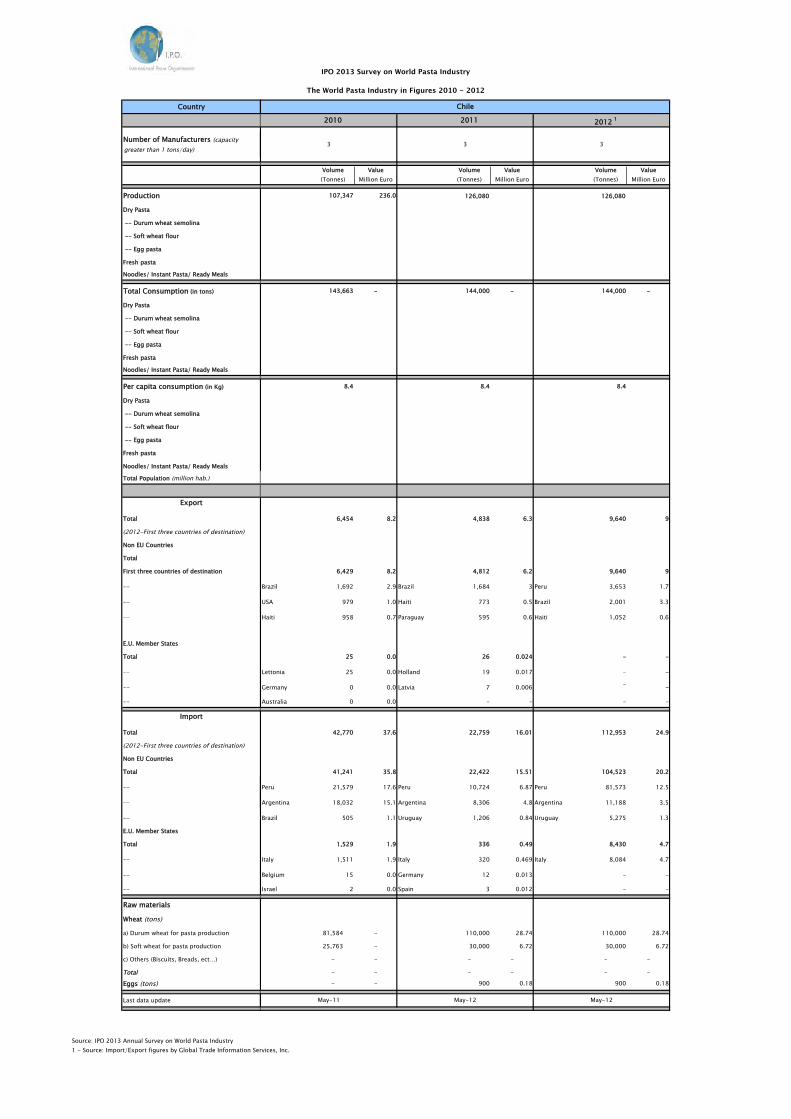
107,347 236.0 126,080 126,080
143,663 - 144,000 - 144,000 -
8.4 8.4 8.4
6,454 8.2 4,838 6.3 9,640 9
6,429 8.2 4,812 6.2 9,640 9
Brazil 1,692 2.9 Brazil 1,684 3 Peru 3,653 1.7
USA 979 1.0 Haiti 773 0.5 Brazil 2,001 3.3
Haiti 958 0.7 Paraguay 595 0.6 Haiti 1,052 0.6
25 0.0 26 0.024 - -
Lettonia 25 0.0 Holland 19 0.017 - -
Germany 0 0.0 Latvia 7 0.006 - -
Australia 0 0.0 - - - -
42,770 37.6 22,759 16.01 112,953 24.9
41,241 35.8 22,422 15.51 104,523 20.2
Peru 21,579 17.6 Peru 10,724 6.87 Peru 81,573 12.5
Argentina 18,032 15.1 Argentina 8,306 4.8 Argentina 11,188 3.5
Brazil 505 1.1 Uruguay 1,206 0.84 Uruguay 5,275 1.3
1,529 1.9 336 0.49 8,430 4.7
Italy 1,511 1.9 Italy 320 0.469 Italy 8,084 4.7
Belgium 15 0.0 Germany 12 0.013 - -
Israel 2 0.0 Spain 3 0.012 - -
81,584 - 110,000 28.74 110,000 28.74
25,763 - 30,000 6.72 30,000 6.72
- - - - - -
- - - - - -- - 900 0.18 900 0.18
May-12
3
May-11
Chile
3 3
May-12
IPO 2013 Survey on World Pasta Industry
The World Pasta Industry in Figures 2010 - 2012
Source: IPO 2013 Annual Survey on World Pasta Industry1 - Source: Import/Export figures by Global Trade Information Services, Inc.
Country
Number of Manufacturers (capacity greater than 1 tons/day)
Production
Dry Pasta
-- Durum wheat semolina
-- Soft wheat flour
-- Egg pasta
Fresh pasta
Noodles/ Instant Pasta/ Ready Meals
Total Consumption (in tons)
Dry Pasta
-- Durum wheat semolina
-- Soft wheat flour
-- Egg pasta
Fresh pasta
Noodles/ Instant Pasta/ Ready Meals
Per capita consumption (in Kg)
Dry Pasta
-- Durum wheat semolina
-- Soft wheat flour
-- Egg pasta
Fresh pasta
Noodles/ Instant Pasta/ Ready Meals
Total Population (million hab.)
Export
Total
(2012-First three countries of destination)
Non EU Countries
Total
First three countries of destination
--
--
--
E.U. Member States
Total
--
--
--
Import
Total
(2012-First three countries of destination)
Non EU Countries
Total
--
--
--
E.U. Member States
Total
--
--
--
Raw materials
Wheat (tons)
a) Durum wheat for pasta production
b) Soft wheat for pasta production
c) Others (Biscuits, Breads, ect…)
Total
Eggs (tons)
Last data update
2010 2011 2012
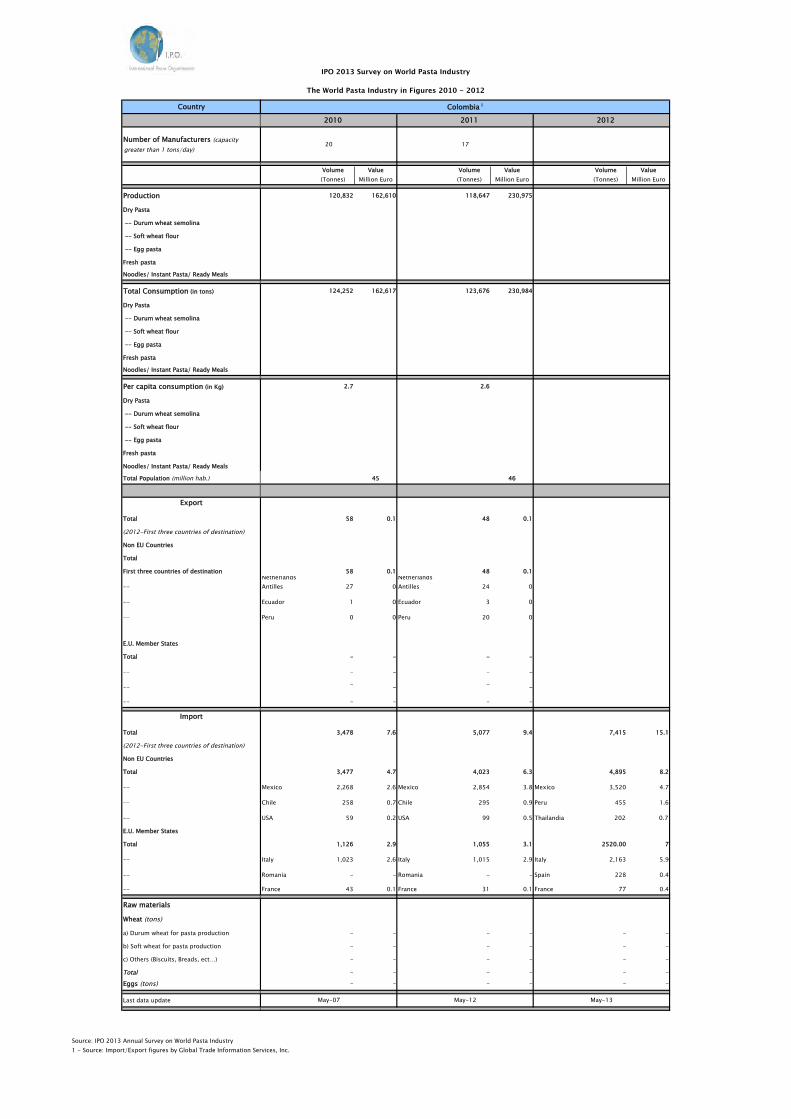
Volume Value Volume Value Volume Value(Tonnes) Million Euro (Tonnes) Million Euro (Tonnes) Million Euro
120,832 162,610 118,647 230,975
124,252 162,617 123,676 230,984
2.7 2.6
45 46
58 0.1 48 0.1
58 0.1 48 0.1Netherlands Antilles 27 0
Netherlands Antilles 24 0
Ecuador 1 0 Ecuador 3 0
Peru 0 0 Peru 20 0
- - - -
- - - -
- - - -
- - - -
3,478 7.6 5,077 9.4 7,415 15.1
3,477 4.7 4,023 6.3 4,895 8.2
Mexico 2,268 2.6 Mexico 2,854 3.8 Mexico 3,520 4.7
Chile 258 0.7 Chile 295 0.9 Peru 455 1.6
USA 59 0.2 USA 99 0.5 Thailandia 202 0.7
1,126 2.9 1,055 3.1 2520.00 7
Italy 1,023 2.6 Italy 1,015 2.9 Italy 2,163 5.9
Romania - - Romania - - Spain 228 0.4
France 43 0.1 France 31 0.1 France 77 0.4
- - - - - -
- - - - - -
- - - - - -
- - - - - -- - - - - -
Colombia 1
20 17
May-07 May-12 May-13
IPO 2013 Survey on World Pasta Industry
The World Pasta Industry in Figures 2010 - 2012
Source: IPO 2013 Annual Survey on World Pasta Industry1 - Source: Import/Export figures by Global Trade Information Services, Inc.
Country
Number of Manufacturers (capacity greater than 1 tons/day)
Production
Dry Pasta
-- Durum wheat semolina
-- Soft wheat flour
-- Egg pasta
Fresh pasta
Noodles/ Instant Pasta/ Ready Meals
Total Consumption (in tons)
Dry Pasta
-- Durum wheat semolina
-- Soft wheat flour
-- Egg pasta
Fresh pasta
Noodles/ Instant Pasta/ Ready Meals
Per capita consumption (in Kg)
Dry Pasta
-- Durum wheat semolina
-- Soft wheat flour
-- Egg pasta
Fresh pasta
Noodles/ Instant Pasta/ Ready Meals
Total Population (million hab.)
Export
Total
(2012-First three countries of destination)
Non EU Countries
Total
First three countries of destination
--
--
--
E.U. Member States
Total
--
--
--
Import
Total
(2012-First three countries of destination)
Non EU Countries
Total
--
--
--
E.U. Member States
Total
--
--
--
Raw materials
Wheat (tons)
a) Durum wheat for pasta production
b) Soft wheat for pasta production
c) Others (Biscuits, Breads, ect…)
Total
Eggs (tons)
Last data update
2010 2011 2012
2
Volume Value Volume Value(Tonnes) Million Euro (Tonnes) Million Euro
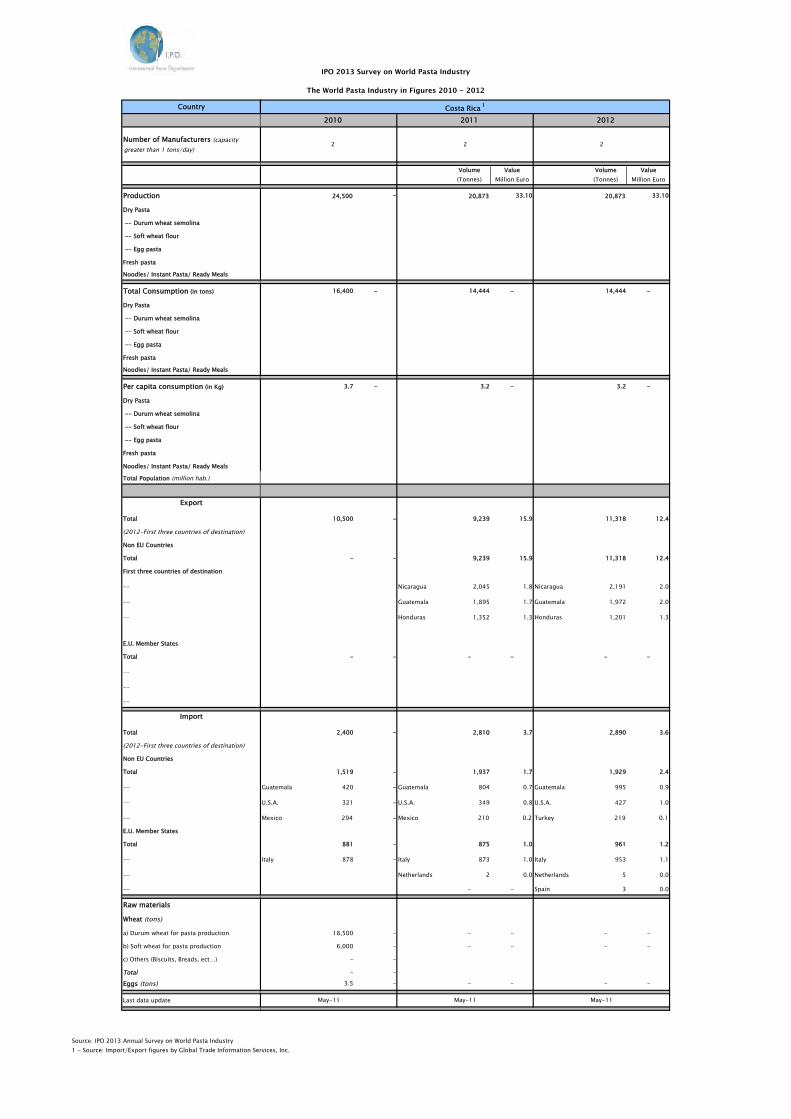
24,500 - 20,873 33.10 20,873 33.10
16,400 - 14,444 - 14,444 -
3.7 - 3.2 - 3.2 -
10,500 - 9,239 15.9 11,318 12.4
- - 9,239 15.9 11,318 12.4
Nicaragua 2,045 1.8 Nicaragua 2,191 2.0
Guatemala 1,895 1.7 Guatemala 1,972 2.0
Honduras 1,352 1.3 Honduras 1,201 1.3
- - - - - -
2,400 - 2,810 3.7 2,890 3.6
1,519 - 1,937 1.7 1,929 2.4
Guatemala 420 - Guatemala 804 0.7 Guatemala 995 0.9
U.S.A. 321 - U.S.A. 349 0.8 U.S.A. 427 1.0
Mexico 294 - Mexico 210 0.2 Turkey 219 0.1
881 - 875 1.0 961 1.2
Italy 878 - Italy 873 1.0 Italy 953 1.1
Netherlands 2 0.0 Netherlands 5 0.0
- - Spain 3 0.0
18,500 - - - - -
6,000 - - - - -
- -
- -3.5 - - - - -
Costa Rica 1
2
May-11May-11 May-11
2
IPO 2013 Survey on World Pasta Industry
The World Pasta Industry in Figures 2010 - 2012
Source: IPO 2013 Annual Survey on World Pasta Industry1 - Source: Import/Export figures by Global Trade Information Services, Inc.
Country
Number of Manufacturers (capacity greater than 1 tons/day)
Production
Dry Pasta
-- Durum wheat semolina
-- Soft wheat flour
-- Egg pasta
Fresh pasta
Noodles/ Instant Pasta/ Ready Meals
Total Consumption (in tons)
Dry Pasta
-- Durum wheat semolina
-- Soft wheat flour
-- Egg pasta
Fresh pasta
Noodles/ Instant Pasta/ Ready Meals
Per capita consumption (in Kg)
Dry Pasta
-- Durum wheat semolina
-- Soft wheat flour
-- Egg pasta
Fresh pasta
Noodles/ Instant Pasta/ Ready Meals
Total Population (million hab.)
Export
Total
(2012-First three countries of destination)
Non EU Countries
Total
First three countries of destination
--
--
--
E.U. Member States
Total
--
--
--
Import
Total
(2012-First three countries of destination)
Non EU Countries
Total
--
--
--
E.U. Member States
Total
--
--
--
Raw materials
Wheat (tons)
a) Durum wheat for pasta production
b) Soft wheat for pasta production
c) Others (Biscuits, Breads, ect…)
Total
Eggs (tons)
Last data update
2010 2011 2012
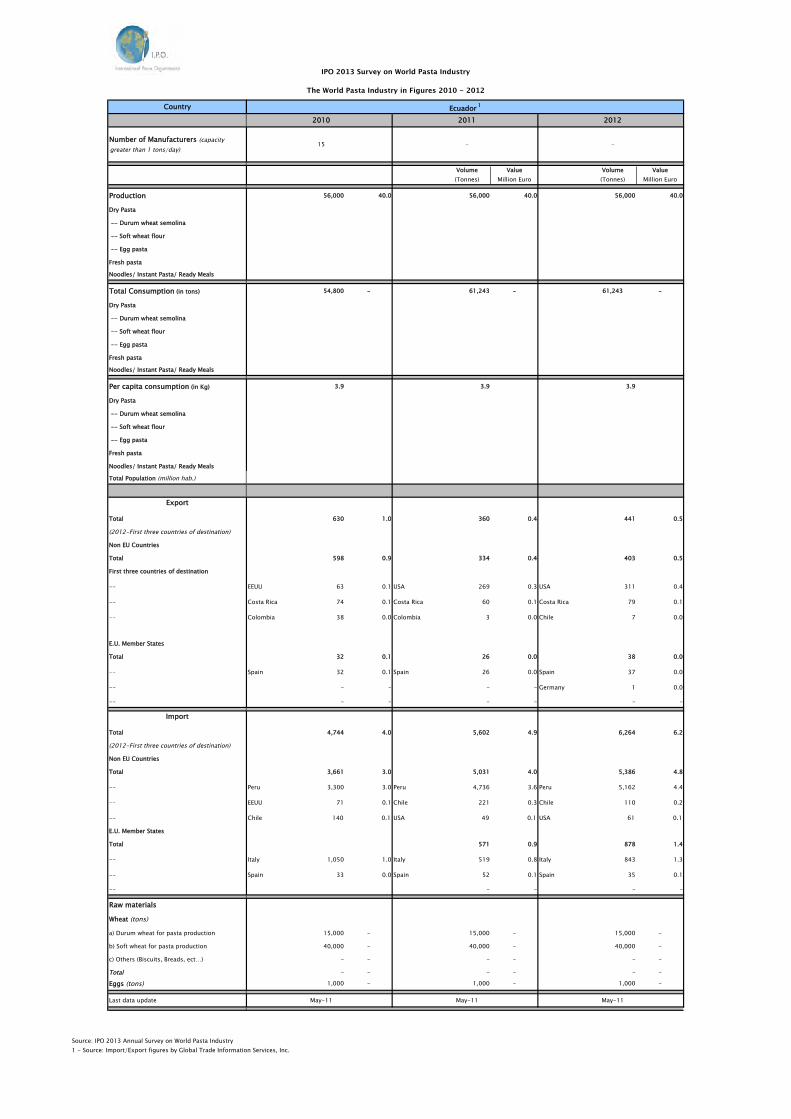
15 - -
Volume Value Volume Value(Tonnes) Million Euro (Tonnes) Million Euro
56,000 40.0 56,000 40.0 56,000 40.0
54,800 - 61,243 - 61,243 -
3.9 3.9 3.9
630 1.0 360 0.4 441 0.5
598 0.9 334 0.4 403 0.5
EEUU 63 0.1 USA 269 0.3 USA 311 0.4
Costa Rica 74 0.1 Costa Rica 60 0.1 Costa Rica 79 0.1
Colombia 38 0.0 Colombia 3 0.0 Chile 7 0.0
32 0.1 26 0.0 38 0.0
Spain 32 0.1 Spain 26 0.0 Spain 37 0.0
- - - - Germany 1 0.0
- - - - - -
4,744 4.0 5,602 4.9 6,264 6.2
3,661 3.0 5,031 4.0 5,386 4.8
Peru 3,300 3.0 Peru 4,736 3.6 Peru 5,162 4.4
EEUU 71 0.1 Chile 221 0.3 Chile 110 0.2
Chile 140 0.1 USA 49 0.1 USA 61 0.1
571 0.9 878 1.4
Italy 1,050 1.0 Italy 519 0.8 Italy 843 1.3
Spain 33 0.0 Spain 52 0.1 Spain 35 0.1
- - - -
15,000 - 15,000 - 15,000 -
40,000 - 40,000 - 40,000 -
- - - - - -
- - - - - -1,000 - 1,000 - 1,000 -
May-11 May-11 May-11
Ecuador 1

IPO 2013 Survey on World Pasta Industry
The World Pasta Industry in Figures 2010 - 2012
Source: IPO 2013 Annual Survey on World Pasta Industry1 - Source: Import/Export figures by Global Trade Information Services, Inc.
Country
Number of Manufacturers (capacity greater than 1 tons/day)
Production
Dry Pasta
-- Durum wheat semolina
-- Soft wheat flour
-- Egg pasta
Fresh pasta
Noodles/ Instant Pasta/ Ready Meals
Total Consumption (in tons)
Dry Pasta
-- Durum wheat semolina
-- Soft wheat flour
-- Egg pasta
Fresh pasta
Noodles/ Instant Pasta/ Ready Meals
Per capita consumption (in Kg)
Dry Pasta
-- Durum wheat semolina
-- Soft wheat flour
-- Egg pasta
Fresh pasta
Noodles/ Instant Pasta/ Ready Meals
Total Population (million hab.)
Export
Total
(2012-First three countries of destination)
Non EU Countries
Total
First three countries of destination
--
--
--
E.U. Member States
Total
--
--
--
Import
Total
(2012-First three countries of destination)
Non EU Countries
Total
--
--
--
E.U. Member States
Total
--
--
--
Raw materials
Wheat (tons)
a) Durum wheat for pasta production
b) Soft wheat for pasta production
c) Others (Biscuits, Breads, ect…)
Total
Eggs (tons)
Last data update
2010 2011 2012
Volume Value Volume Value Volume Value(Tonnes) Million Euro (Tonnes) Million Euro (Tonnes) Million Euro
325,000 - 330,000 - 330,000 -
- - - - - -
3.0 - 2.7 - 3.0 -
62,405 39 107,656 75,136 54.8
62,405 39 107,615 75,079 54.7
U.S.A. 50,462 32 U.S.A. 93,363 U.S.A. 59,954 43.7
Guatemala 3,236 2 Guatemala 4,738 Guatemala 6,669 4.7
Puerto Rico 2,225 1Trinidad & Tobaco 2,306 Puerto Rico 2,341 1.8
- - 41 0.0 57 0.1
Spain 38 0.0 Spain 36 0.0
Germany 3 0.0 Netherlands 21 0.0
- -
8,610 16 75,937 10.8 10,004 19.6
4,718 10 59,596 12.5 5,912 13.1
U.S.A. 3,901 8 U.S.A. 44,615 11.0 U.S.A. 4,983 11.2
China 465 0.5 China 6,743 0.6 China 574 0.8
Canada 103 0.6 Japan 1,840 0.2 Canada 87 0.5
3,892 6.0 16,341 5.4 4,092 6.6
Italy 3,315 5.0 Italy 14,166 4.4 Italy 3,359 5.6
Spain 289 0.3 Sapin 1,220 0.6 France 422 0.5
France 269 0.3 France 881 0.4 Spain 286 0.4
80% - - - 80% -
20% - - - 20% -
- - - - - -
- - - - - -- - - - - -
Mexico 1
10
May-10
13
Oct-12
10
Oct-12
IPO 2013 Survey on World Pasta Industry
The World Pasta Industry in Figures 2010 - 2012
Source: IPO 2013 Annual Survey on World Pasta Industry1 - Source: Import/Export figures by Global Trade Information Services, Inc.
Country
Number of Manufacturers (capacity greater than 1 tons/day)
Production
Dry Pasta
-- Durum wheat semolina
-- Soft wheat flour
-- Egg pasta
Fresh pasta
Noodles/ Instant Pasta/ Ready Meals
Total Consumption (in tons)
Dry Pasta
-- Durum wheat semolina
-- Soft wheat flour
-- Egg pasta
Fresh pasta
Noodles/ Instant Pasta/ Ready Meals
Per capita consumption (in Kg)
Dry Pasta
-- Durum wheat semolina
-- Soft wheat flour
-- Egg pasta
Fresh pasta
Noodles/ Instant Pasta/ Ready Meals
Total Population (million hab.)
Export
Total
(2012-First three countries of destination)
Non EU Countries
Total
First three countries of destination
--
--
--
E.U. Member States
Total
--
--
--
Import
Total
(2012-First three countries of destination)
Non EU Countries
Total
--
--
--
E.U. Member States
Total
--
--
--
Raw materials
Wheat (tons)
a) Durum wheat for pasta production
b) Soft wheat for pasta production
c) Others (Biscuits, Breads, ect…)
Total
Eggs (tons)
Last data update
2010 2011 2012
Volume Value Volume Value Volume Value(Tonnes) Million Euro (Tonnes) Million Euro (Tonnes) Million Euro
277,694 148.0 297,162 169.0 250,000 200.0
250,000 200.0
50,000 48.0
- -
200 152.0
- -
- -
241,900 130.0 243,000 136.0 250,000 200.0
250,000 200.0
50,000 48.0
200,000 152.0
- -
- -
- -
8.3 8.2 8.3
8.3
1.7
6.7
-
-
-
30.0
37,433 19.2 55,904 34.7 12,000 -
37,433 19.2 55,866 34.7 12,000 -
Chile 22,159 12.2 Chile 28,838 19.4 Hiati 12,700 7.3
Haiti 11,924 4.8 Haiti 15,344 8.0 Chile 9,800 7.2
Ecuador 3,350 2.2 Ecuador 4,724 3.5 Ecuador 5,000 4.3
- - 38 0.1 1,000 0.2
Spain 28 0.0 Spain 200 0.2
Netherland 8 0.0
Italy 0 0.0
1,639 1.0 1,742 1.8 - -
1,303 0.6 726 0.5 - -
Ecuador 989 0.4 China 193 0.1
China 259 0.1 USA 58 0.1
Chile 55 0.1 Argentina 23 0.0
336 0.4 1,017 1.3 - -
Italy 336 0.4 Italy 998 1.3
Switzerland 2 0.0
Spain 17 0.0
128,719 24.0 106,360 27.0 - -
290,000 52.0 288,000 73.0 - -
- - - - - -
- - - - - -- - - - - -
Peru
13
May-12
13
Jun-11
13
May-13
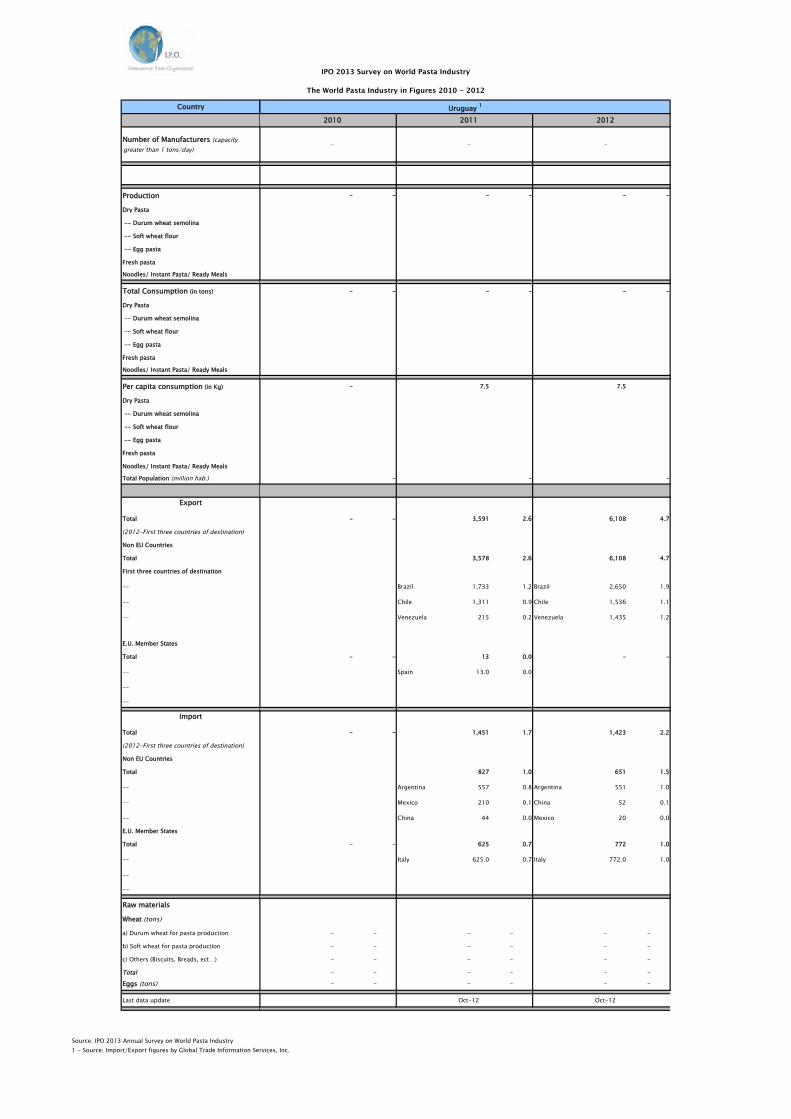
IPO 2013 Survey on World Pasta Industry
The World Pasta Industry in Figures 2010 - 2012
Source: IPO 2013 Annual Survey on World Pasta Industry1 - Source: Import/Export figures by Global Trade Information Services, Inc.
Country
Number of Manufacturers (capacity greater than 1 tons/day)
Production
Dry Pasta
-- Durum wheat semolina
-- Soft wheat flour
-- Egg pasta
Fresh pasta
Noodles/ Instant Pasta/ Ready Meals
Total Consumption (in tons)
Dry Pasta
-- Durum wheat semolina
-- Soft wheat flour
-- Egg pasta
Fresh pasta
Noodles/ Instant Pasta/ Ready Meals
Per capita consumption (in Kg)
Dry Pasta
-- Durum wheat semolina
-- Soft wheat flour
-- Egg pasta
Fresh pasta
Noodles/ Instant Pasta/ Ready Meals
Total Population (million hab.)
Export
Total
(2012-First three countries of destination)
Non EU Countries
Total
First three countries of destination
--
--
--
E.U. Member States
Total
--
--
--
Import
Total
(2012-First three countries of destination)
Non EU Countries
Total
--
--
--
E.U. Member States
Total
--
--
--
Raw materials
Wheat (tons)
a) Durum wheat for pasta production
b) Soft wheat for pasta production
c) Others (Biscuits, Breads, ect…)
Total
Eggs (tons)
Last data update
2010 2011 2012
- - -
- - - - - -
- - - - - -
- 7.5 7.5
- - -
- - 3,591 2.6 6,108 4.7
3,578 2.6 6,108 4.7
Brazil 1,733 1.2 Brazil 2,650 1.9
Chile 1,311 0.9 Chile 1,536 1.1
Venezuela 215 0.2 Venezuela 1,435 1.2
- - 13 0.0 - -
Spain 13.0 0.0
- - 1,451 1.7 1,423 2.2
827 1.0 651 1.5
Argentina 557 0.8 Argentina 551 1.0
Mexico 210 0.1 China 52 0.1
China 44 0.0 Mexico 20 0.0
- - 625 0.7 772 1.0
Italy 625.0 0.7 Italy 772.0 1.0
- - - - - -
- - - - - -
- - - - - -
- - - - - -- - - - - -
Oct-12 Oct-12
Uruguay 1
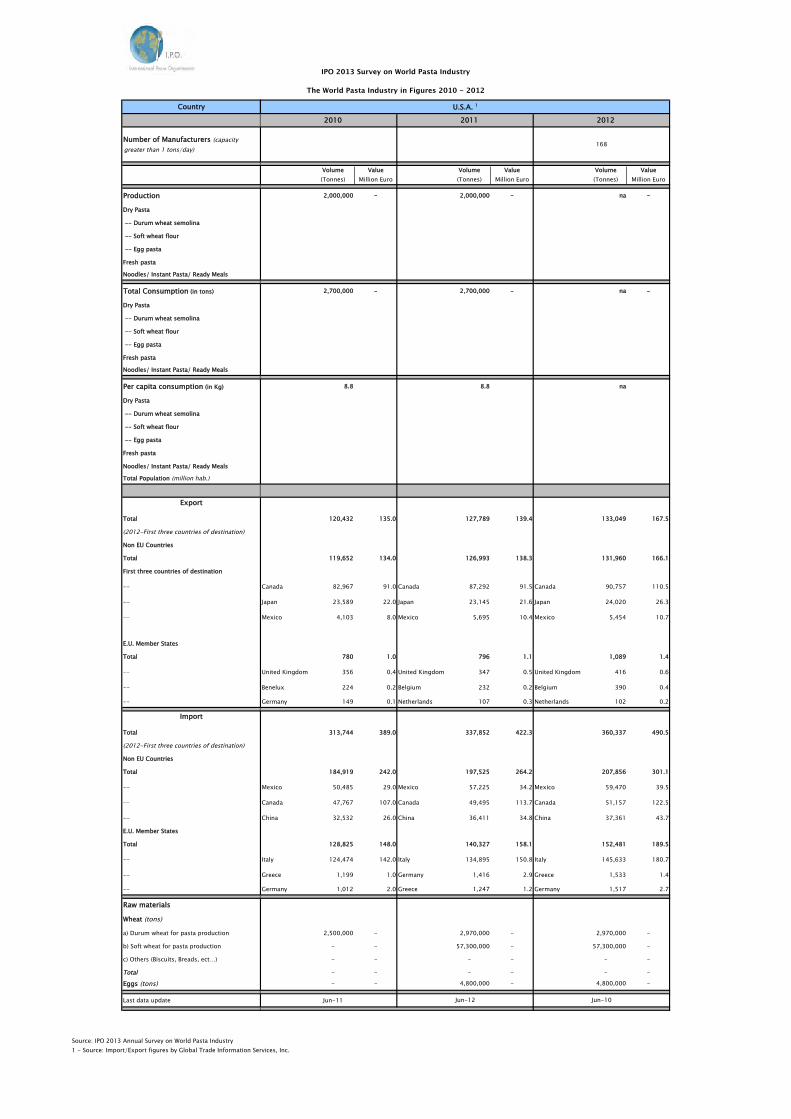
IPO 2013 Survey on World Pasta Industry
The World Pasta Industry in Figures 2010 - 2012
Source: IPO 2013 Annual Survey on World Pasta Industry1 - Source: Import/Export figures by Global Trade Information Services, Inc.
Country
Number of Manufacturers (capacity greater than 1 tons/day)
Production
Dry Pasta
-- Durum wheat semolina
-- Soft wheat flour
-- Egg pasta
Fresh pasta
Noodles/ Instant Pasta/ Ready Meals
Total Consumption (in tons)
Dry Pasta
-- Durum wheat semolina
-- Soft wheat flour
-- Egg pasta
Fresh pasta
Noodles/ Instant Pasta/ Ready Meals
Per capita consumption (in Kg)
Dry Pasta
-- Durum wheat semolina
-- Soft wheat flour
-- Egg pasta
Fresh pasta
Noodles/ Instant Pasta/ Ready Meals
Total Population (million hab.)
Export
Total
(2012-First three countries of destination)
Non EU Countries
Total
First three countries of destination
--
--
--
E.U. Member States
Total
--
--
--
Import
Total
(2012-First three countries of destination)
Non EU Countries
Total
--
--
--
E.U. Member States
Total
--
--
--
Raw materials
Wheat (tons)
a) Durum wheat for pasta production
b) Soft wheat for pasta production
c) Others (Biscuits, Breads, ect…)
Total
Eggs (tons)
Last data update
2010 2011 2012
Volume Value Volume Value Volume Value(Tonnes) Million Euro (Tonnes) Million Euro (Tonnes) Million Euro
2,000,000 - 2,000,000 - na -
2,700,000 - 2,700,000 - na -
8.8 8.8 na
120,432 135.0 127,789 139.4 133,049 167.5
119,652 134.0 126,993 138.3 131,960 166.1
Canada 82,967 91.0 Canada 87,292 91.5 Canada 90,757 110.5
Japan 23,589 22.0 Japan 23,145 21.6 Japan 24,020 26.3
Mexico 4,103 8.0 Mexico 5,695 10.4 Mexico 5,454 10.7
780 1.0 796 1.1 1,089 1.4
United Kingdom 356 0.4 United Kingdom 347 0.5 United Kingdom 416 0.6
Benelux 224 0.2 Belgium 232 0.2 Belgium 390 0.4
Germany 149 0.1 Netherlands 107 0.3 Netherlands 102 0.2
313,744 389.0 337,852 422.3 360,337 490.5
184,919 242.0 197,525 264.2 207,856 301.1
Mexico 50,485 29.0 Mexico 57,225 34.2 Mexico 59,470 39.5
Canada 47,767 107.0 Canada 49,495 113.7 Canada 51,157 122.5
China 32,532 26.0 China 36,411 34.8 China 37,361 43.7
128,825 148.0 140,327 158.1 152,481 189.5
Italy 124,474 142.0 Italy 134,895 150.8 Italy 145,633 180.7
Greece 1,199 1.0 Germany 1,416 2.9 Greece 1,533 1.4
Germany 1,012 2.0 Greece 1,247 1.2 Germany 1,517 2.7
2,500,000 - 2,970,000 - 2,970,000 -
- - 57,300,000 - 57,300,000 -
- - - - - -
- - - - - -- - 4,800,000 - 4,800,000 -
Jun-11
U.S.A. 1
Jun-12
168
Jun-10

IPO 2013 Survey on World Pasta Industry
The World Pasta Industry in Figures 2010 - 2012
Source: IPO 2013 Annual Survey on World Pasta Industry1 - Source: Import/Export figures by Global Trade Information Services, Inc.
Country
Number of Manufacturers (capacity greater than 1 tons/day)
Production
Dry Pasta
-- Durum wheat semolina
-- Soft wheat flour
-- Egg pasta
Fresh pasta
Noodles/ Instant Pasta/ Ready Meals
Total Consumption (in tons)
Dry Pasta
-- Durum wheat semolina
-- Soft wheat flour
-- Egg pasta
Fresh pasta
Noodles/ Instant Pasta/ Ready Meals
Per capita consumption (in Kg)
Dry Pasta
-- Durum wheat semolina
-- Soft wheat flour
-- Egg pasta
Fresh pasta
Noodles/ Instant Pasta/ Ready Meals
Total Population (million hab.)
Export
Total
(2012-First three countries of destination)
Non EU Countries
Total
First three countries of destination
--
--
--
E.U. Member States
Total
--
--
--
Import
Total
(2012-First three countries of destination)
Non EU Countries
Total
--
--
--
E.U. Member States
Total
--
--
--
Raw materials
Wheat (tons)
a) Durum wheat for pasta production
b) Soft wheat for pasta production
c) Others (Biscuits, Breads, ect…)
Total
Eggs (tons)
Last data update
2010 2011 2012
Volume Value Volume Value Volume Value(Tonnes) Million Euro (Tonnes) Million Euro (Tonnes) Million Euro
363,663 240 341,554 310 372,515 535
367,661 - 350,213 - 389,055 -
13.0 - 12.3 - 13.2 -
- - - - - -
- - - - - -
- - - -
- - - - - -
3,998 4.1 8,659 8.64 16,540 18.9
2,676 2.4 1,313 1.31 6,065 7.3
Turkey 2,100 2.0 Brasil 1,262 1.23 Brasil 1,030 1.0
Hong Kong 288 0.2 Panama 38 0.054 Canada 383 0.4
Thailandia 287 0.1United Arab Emirates 13 0.02 China 318 0.3
1,133 1.0 7,344 7.326 9,551 10.8
Italy 1,115 1.4 Italy 5,294 5.388 Italy 5,887 6.6
Spain 18 0.0 Turkey 2,050 2 Turkey 3,664 4.2
398,000 - 398,000 - 420,848 -
80,000 - 95,000 - 99,505 -
- - - - - -
- - - - - -- - - - - -
Venezuela 1
12
May-12 May-12
12
May-13
12

Interna'onal Pasta Organisa'on Secretariat General c/o Associazione delle Industrie del Dolce e della Pasta Italiane Viale del Poggio Fiorito 61 00144 Roma Tel. +39 06 8091071 Fax +39 06 8073186 [email protected] www.internaIonalpasta.org