intern. j. of research in marketing - idcportal.idc.ac.il/en/main/research/ijrm/documents/... · j....
TRANSCRIPT

Intern. J. of Research in Marketing xxx (2012) xxx–xxx
IJRM-00957; No of Pages 17
Contents lists available at SciVerse ScienceDirect
Intern. J. of Research in Marketing
j ourna l homepage: www.e lsev ie r .com/ locate / i j resmar
The effects of mailing design characteristics on direct mail campaign performance
Sebastian Feld a, Heiko Frenzen b, Manfred Krafft c, Kay Peters d,⁎,1, Peter C. Verhoef e,2
a Center for Interactive Marketing and Media Management, c/o Institute of Marketing, University of Muenster, Am Stadtgraben 13-15, 48143 Muenster, Germanyb Aston Business School, Aston Triangle, Birmingham B4 7ET, United Kingdomc Institute of Marketing, University of Muenster, Am Stadtgraben 13-15, 48143 Muenster, Germanyd SVI-Endowed Chair for Dialog Marketing, Institute of Marketing and Media, University of Hamburg, Esplanade 36, 20354 Hamburg, Germanye Faculty of Economics and Business, University of Groningen, 9747 AE Groningen, Netherlands
⁎ Corresponding author. Tel.: +49 40 42838 9510; faE-mail addresses: [email protected] (S. Feld), h
(H. Frenzen), [email protected] (M. Krafft), kay(K. Peters), [email protected] (P.C. Verhoef).
1 Visiting professor at the University of California Dav2 Research professor at BI Norwegian Business Schoo
0167-8116/$ – see front matter © 2012 Elsevier B.V. Allhttp://dx.doi.org/10.1016/j.ijresmar.2012.07.003
Please cite this article as: Feld, S., et al., Thein Marketing (2012), http://dx.doi.org/10.10
a b s t r a c t
a r t i c l e i n f oArticle history:First received in 18, June 2011 and wasunder review for 6 monthsAvailable online xxxx
Area editor: Harald J. van Heerde
Designing effective direct mail pieces is considered a key success factor in direct marketing. However, relatedpublished empirical research is scarce while design recommendations are manifold and often conflicting.Compared with prior work, our study aims to provide more elaborate and empirically validated findingsfor the effects of direct mail design characteristics by analyzing 677 direct mail campaigns from non-profitorganizations and financial service providers. We investigate the effects of (1) various envelope characteris-tics and observable cues on opening rates, and (2) characteristics of the envelope content on the keepingrates of direct mail campaigns. We show that visual design elements on the outer envelope – rather thansender-related details – are the predominant drivers of opening rates. Factors such as letter length, provisionof sender information in the letter, and personalization positively influence the keeping rate. We also observethat opening and keeping rates are uncorrelated at the campaign level, implying that opening direct mailpieces is only a necessary condition for responding to offers, but not per se a driver of direct mail response.
© 2012 Elsevier B.V. All rights reserved.
1. Introduction
Direct marketing is a key component of the advertising media mixfor many firms (DMA, 2011). Direct marketing serves a range of firmcommunication goals from creating brand awareness to generatingresponse along with TV, print or online advertising (e.g., Briggs,Krishnan, & Borin, 2005; Naik & Peters, 2009). Among all direct mar-keting media, directmail is clearly the predominant element, accountingfor over one-third of direct marketing expenditures in most countries(DMA, 2011). Hence, consumers are confronted with a continuouslygrowing direct mail volume in the mailbox that brings increased com-petition for their limited attention (Van Diepen, Donkers, & Franses,2009a). In responding to this competition, firms follow two primaryroutes. First, they improve the targeting, timing, and sequencing oftheir direct mail campaigns. This development is well reflected in theacademic literature, which explores how the response to direct mailhas been optimized by better segmentation and targeting (e.g., Bult &Wansbeek, 1995; Donkers, Paap, Jonker, & Franses, 2006) as well as bet-ter timing and sequencing, and by identifying the appropriate number ofmailings per customer (e.g., Elsner, Krafft, & Huchzermeier, 2004; Gönül
x: +49 40 42838 [email protected]@wiso.uni-hamburg.de
is.l, Oslo, Norway.
rights reserved.
effects of mailing design char16/j.ijresmar.2012.07.003
& Ter Hofstede, 2006; Jen, Chou, & Allenby, 2009; Rust & Verhoef, 2005;Van Diepen et al., 2009a).
Second, to catch attention in the mailbox, firms strive to improvethe design of their direct mail. These efforts are reflected in the in-creased focus that design characteristics are given in practice and inthe textbooks on direct marketing (e.g., Nash, 2000; Stone & Jacobs,2008). The textbooks claim that the creative elements and designcharacteristics of direct mail account for up to a quarter of its overallsuccess (e.g., Roberts & Berger, 1999, p. 7; Stone & Jacobs, 2008, p. 6):the favorable presentation of the solicitation facilitates the consumer'sresponse process by attracting attention and then generating interestin the offer. Accordingly, design primarily acts as a critical responseenabler in the early and intermediate stages of the direct mail funnel.Hence, design drives the intermediate stages, such as the opening andreading of a direct mail piece, rather than ultimate response (DeWulf,Hoekstra, & Commandeur, 2000). Unfortunately, these pre-responsestages are currently a “black box” for marketing managers: they onlyobserve the number of final responses resulting from a particularcampaign. This limitation could, to some extent, explain why designoptimization has received less attention compared to selection andtargeting, both ofwhich are easilymeasured and can be linked directlyto response. If systematicmarketing research data on the intermediatefunnel stages were available, however, such information could pro-vide diagnostic value to managers. Given the low response rates ofapproximately 1–2% on average (DMA, 2006), it would help to inferwhere andwhy themajority of direct mail becomes stuck in the directmail funnel and how to overcome it. This study analyzes a unique
acteristics on direct mail campaign performance, Intern. J. of Research

Table 1Selected studies on direct mailing characteristics.
Study Research design
Author(s) Main issue Survey (S)/observation(O)
Panel(P)
Field (F)/laboratory (L)experiment
Capon and Farley (1976) Impact of message on response O/S FHozier and Robles (1985) Effects of prenotification, letter structure, ethnicity of signatory, and personalization on direct mail response O FBeard et al. (1990) Impact of letter length on response O FGordon and Kellerman(1990)
Impact on prompt-response and quality premiums on response O F
Sherman, Greene, andPlank (1991)
Effects of one-sided, two-sided, and comparative message structure on response O F
Williams, Beard, andKelly (1991)
Effect of readability of direct-mail sales letters on response O F
James and Li (1993) Effects of envelope characteristics on opening behavior (from consumers' and practitioners' point of view) SMcMellon and Ducoffe(1995)
Impact of envelope appearance on consumers' mail-sorting behavior S L
Seaver and Simpson (1995) Effects of mail order catalog design on consumer response behavior O FSmith and Berger (1996) Impact of charitable direct mail appeals (suggested anchors, message framing, and reference information)
on donor decisionsO F
Van der Scheer et al. (1996) Impact of reply card design on response rate and amount of donation O FBult et al. (1997) Direct and interactive effects of target and mailing characteristics on response to charitable mails solicitations O FVriens et al. (1998) Study 1: identification of most “attractive” envelope design for different consumer segments S L
Study 2: effects of mailing characteristics on response and amount of donation O FDe Wulf et al. (2000) Effect of direct mail design characteristics on the opening and reading behavior of business-to-business direct mail S FBell et al. (2006) Experimental testing of response effects of direct mail design and offer characteristics O FLedolter and Sweesey (2006) Impact of direct mail design and offer features on magazine subscription response rates O FBekkers and Crutzen (2007) Effect of color picture on envelope response and amount of donation O FDiamond and Iyer (2007) Effects of audience involvement, enclosures and different appeals on the effectiveness of charitable solicitations S FCurrent study (2013) Impact of various mailing characteristics on opening rate and keeping rate of direct mailing campaigns O P
2 S. Feld et al. / Intern. J. of Research in Marketing xxx (2012) xxx–xxx
commercial direct mail panel that explicitly covers these intermediatedirect mail funnel stages by measuring the opening and keeping rate.
In general, there are numerous specific mailing design guidelines inthe practitioner literature without an emerging consensus (e.g., aboutwhether cover letters should be short or long) and mostly withoutreference to any empirical study. Only a few scientific empirical studieshave been published on related issues. These studies focus mostly onthe advertising context of direct marketing and on a particular industryor firm, and they typically employ firm-specific experimental designsleading to non-generalizable results (e.g., Bell, Ledolter, & Swersey,2006; De Wulf et al., 2000; Diamond & Iyer, 2007; Gordon &Kellerman, 1990; Van der Scheer, Hoekstra, & Vriens, 1996). Given thevariety of industries and their peculiarities (e.g., Stone & Jacobs, 2008),it would not be surprising if only a few design characteristics actuallyachieve cross-industry importance, while the majority of effects mightbe industry-specific.
Accordingly, our primary research objective is to investigate theeffect of direct mail design on the intermediate stages of the directmail response funnel, namely the opening and keeping rates of directmailing campaigns instead of the ultimate response rates. As a secondresearch objective, we intend to compare the effect of specific designcharacteristics across industries, investigating the extent to whichfindings in one industry can be valid for another. Accordingly, we usea database of 677 direct mail campaigns in 2 industries: the financialservices and the non-profit industry. For the intermediate stages, wedefine the opening rate (OR) of a campaign as the percentage of recip-ients that open the direct mail envelope, while the keeping rate (KR)is defined as the percentage of recipients that keep the mailing afteropening the envelope. Using these intermediate communication met-rics at the campaign level will enable us to shed unprecedented lightinto the “black box” of the direct mail funnel.
Our empirical results show that the design elements substantiallyimpact the OR and the KR. Surprisingly, we observe no relationshipbetween the OR and the KR, implying that opening is a necessarybut not sufficient condition for generating a campaign response. Ourresults also show that some design characteristics are of varyingimportance at different stages of the direct mail funnel. For instance,
Please cite this article as: Feld, S., et al., The effects of mailing design charin Marketing (2012), http://dx.doi.org/10.1016/j.ijresmar.2012.07.003
presenting the sender's logo on the envelope decreases the OR forfinancial service providers. Providing this information in the letter,however, increases the KR in both industries.
The remainder of the paper is organized as follows. We review theliterature on direct mail design. Next, we present our research frame-work and its theoretical underpinnings. After this, the data collection,sample properties, and model estimation will be described, followedby a presentation of our empirical results. From these results, wewill derive conclusions as well as implications for research and man-agement. We conclude with directions for further research.
2. Prior research on direct mail design
We define the scope of our literature review based on 2 selectioncriteria. First, the studies should focus on the effects of the designcharacteristics rather than on the other success factors of the directmail solicitations (such as timing, targeting, offer design, or messageappeals). Second, we exclude studies on the design of mail surveys(e.g., Gendall, 2005; Helgeson, Voss, & Terpening, 2002; Yu & Cooper,1983). Hence, we select only studies that involve design features incommercial direct mail solicitations. Table 1 provides an overview ofthe studies published in reviewed journals that fit these criteria. Acrossthe studies, we compare (1) the research design and sample descrip-tion, (2) the dependent variables, and (3) the category of independentvariables, namely design characteristics and covariates. At this point,we intentionally refrain from describing the empirical results of thesestudies. Instead, we will draw on their findings later in Section 4.2when discussing the effects of different types of design characteristics.Here, we focus on the methodological aspects to highlight the gaps inthe previous research that our study aims to address.
2.1. Research design and sample description
The reported studies have typically adopted field experiments witha single firm in a single industry. In particular, non-profit organizationshave been frequently studied; the other industries studied are primarilyfinancial or B2B services. The number of investigated campaigns or
acteristics on direct mail campaign performance, Intern. J. of Research

Sample description
Country Industry No. of firms/organizations
No. of recipients/respondents
Volume ofcampaign(s)
No. of stimuli(campaigns)
USA Magazine subscription 1 1,624 1,624 4USA B2B service 1 1,068 1,068 8USA Consumer durables 1 1,152 k 1,152 k 2USA Medical supply 1 20 k 20 k 2
USA B2B service 1 2,333 2,333 3
USA Newsletter subscription 1 158 k 158 k 2
USA n.a. n.a 692 n.a. n.aUSA n.a. n.a. 106 n.a. 2
USA Mail order (soft goods) 1 >250 k >250 k 16USA Charity (university) 1 18,144 18,144 8
NL Charity 1 14,851 14,851 8NL Charity (healthcare) 1 48 k 48 k 16NL Charity (healthcare) 1 170 170 16NL Charity (healthcare) 1 48 k 48 k 16BEL B2B n.a. 60 2,005 n.a.USA Banking (credit card) 1 100 k 100 k 20USA Publishing 1 40 k 40 k 16NL Charity 1 89,937 89,937 2USA Charity 1 1,440 1,440 4GER Banking and charity 146 3,000 (84 m) 25,946 (307.2 m) 677
(continued on next page)
3S. Feld et al. / Intern. J. of Research in Marketing xxx (2012) xxx–xxx
different stimuli employed varies between 2 and 20. Given the limitednumber of campaigns and stimuli investigated in the previous studies,inferring general insights is hardly feasible. Hence, there is a need fora study that considers a large number of campaigns to develop general-izable findings.
2.2. Dependent variables
The direct mail response rate is the most frequently studied behav-ioral variable (in 14 out of 18 cases). However, the studies investigatingenvelope design characteristics usually investigate their impact on theOR (e.g., James & Li, 1993; Vriens, van der Scheer, Hoekstra, & Bult,1998).When the additional design characteristics from the other directmail elements are included, they are related to reading behavior as anintermediate measure that reflects elevated interest (De Wulf et al.,2000). In sum, what emerges from the literature is a direct mail re-sponse funnel from (a) opening behavior to a stage of (b) interest to(c) ultimate response.3 Design exerts its primary influence on the first2 stages of the directmail funnel, while the final stage of actual responseis largely driven by targeting, timing, and the actual offer characteristics(De Wulf et al., 2000). Accordingly, our investigation on the designcharacteristics focuses on the intermediate opening and interest stagesof the funnel.
2.3. Independent variables
The design characteristics are usually attributed to 4 core mailelements: (1) the envelope, (2) the cover letter, (3) any supplements(e.g., leaflets, brochures or catalogs), and (4) the response device.Selectively, 2 additional categories comprise add-ons (e.g., enclosure
3 Analogous funnel stages have been identified in other marketing contexts. For ex-ample, Gopalakrishna and Lilien (1995) propose a 3-stage model of industrial tradeshow performance with attraction, contact, and conversion efficiency as the perfor-mance metrics at each stage. Smith, Gopalakrishna, and Chatterjee (2006) employ a3-stage model to assess and subsequently optimize integrated communications atthe marketing–sales interface for a construction firm.
Please cite this article as: Feld, S., et al., The effects of mailing design charin Marketing (2012), http://dx.doi.org/10.1016/j.ijresmar.2012.07.003
of incentive) and covariates (e.g., characteristics of recipients). Theseelements contribute differently across the stages of the direct mailfunnel. For example, envelope design characteristics and observablehaptic cues are the main drivers of the opening behavior because theother elements are usually invisible to the recipients. Hence, we incor-porate this distinction into our framework.
The majority of studies investigate a limited number of character-istics across selected mail elements with some notable exceptions(e.g., Bell et al., 2006; Bult, van der Scheer, & Wansbeek, 1997; DeWulf et al., 2000). The number of characteristics studied per mailelement varies between 1 (e.g., Capon & Farley, 1976) and 14 (DeWulf et al., 2000). Additionally, the levels or the variants of the designcharacteristics investigated appear to be largely driven by the specificcontext of the cooperating organization. To avoid a bias in effect infer-ence, we need to account for a rather comprehensive set of designelements across all 4 core mail elements and derive the levels of thedesign characteristics from a broader set of sources, e.g., from explor-ing our panel data, from the literature, and from industry expertinterviews.
Only a few studies control for the effects of covariates (e.g., campaignvolume). Not controlling for these effects can potentially cause biasedestimates of the design characteristic's impact.
In sum, the literature review suggests the need for a study thatcovers a substantial portion of all campaigns rather than only selectedmailings from single organizations. The study needs to span the directmail response funnel with a focus on the “black box” that occurs priorto response, and it should employ a comprehensive set of designcharacteristics extracted from various sources. There is an additionalneed to control for various covariates that might exert significant in-fluence on the direct mail funnel stages.
3. Conceptual framework
From the literature review, we infer that different funnel stagesexist along the direct mail response process. These linear stages canbe explicitly linked because the outcome at a specific stage dependson the outcome of the previous. For instance, at the first stage, a
acteristics on direct mail campaign performance, Intern. J. of Research

Table 1 (continued)
Study Dependent variable(s) Design characteristics and covariates
Author(s) Stage 1:Opening
Stage 2:Interest
Stage 3:Response
Envelope Letter Supplement Responsedevice
Others Covariates
Capon and Farley (1976) X X Response rate/response intention 1Hozier and Robles (1985) X Response rate 3 1 1Beard et al. (1990) X Response rate, response channel 1Gordon and Kellerman(1990)
X Response rate 2
Sherman, Greene, andPlank (1991)
X Response rate 1 1
Williams, Beard, andKelly (1991)
X Response rate 1 1
James and Li (1993) X Opening propensity (rating scale) 9McMellon and Ducoffe(1995)
X X Information processing, opening propensity 1 1
Seaver and Simpson (1995) X Response rate 5 2Smith and Berger (1996) X Response rate, amount of donation 4
Van der Scheer et al. (1996) X Response rate, amount of donation 5 1Bult et al. (1997) X Response rate 5 1 1 4Vriens et al. (1998) X Opening propensity (rating scale) 6
X Response rate, amount of donation 5 1 1De Wulf et al. (2000) X X Opening and reading behavior (rating scale) 14 12 12 5Bell et al. (2006) X Response rate 5 11 1 2Ledolter and Sweesey (2006) X Response rate 1 2 1 3Bekkers and Crutzen (2007) X Response rate, amount of donation 1 6Diamond and Iyer (2007) X X Attention, comprehension, intension to donate 1 1 1Current study (2013) X X Opening rate, keeping rate 11 23 7 10 6 5
Table 1 (continued)
4 S. Feld et al. / Intern. J. of Research in Marketing xxx (2012) xxx–xxx
certain percentage of recipients pay elevated attention to the pieceand might decide to open the envelope; others discard the mailpiece without further attention. The ratio of opening to total recipi-ents can then be defined as the OR. At the second stage, the mail re-cipients exhibit some level of interest in the other mail elementsand read them. The recipients might eventually decide to keep themail for further action (e.g., response). The percentage of recipientswho keep the direct mail piece in relation to the number of recipientsthat open it can be defined as the KR. This measure thus reflects con-sumer interest. At the third stage, after deciding to keep the mailpiece, the recipients might finally decide to respond to it. This resultsin the qualified response rate. As the direct mail recipients follow thisstaged process, they build up their commitment while moving step-by-step towards the offer, inducing them to behave consistently withthe small prior commitments they havemade. This link at the individualrecipient level should be reflected in the linked subsequent stages atthe campaign level. Taken together, the overall response rate that themanagers usually observe builds up as described in Eq. (1):
∗#Recipients Opening #Recipients Keeping Total #Responding
Response Rate =Total #Recipients # Recipients Opening #Recipients Keeping
Opening Rate (OR) Keeping Rate (KR) Qual. Response Rate
Stage 1 Stage 2 Stage 3
Focus of our design study
∗ ∗100
ð1Þ
Following the extant literature on direct mail effectiveness andinformation processing, the design characteristics exhibit the stron-gest effect at the first 2 stages of the direct mail funnel: OR and KR(Broadbent, 1958; De Wulf et al., 2000; Pieters & Wedel, 2004). Addi-tionally, both ratios are necessary predecessors of response and thusprovide managers with valuable diagnostics—analogous to the atten-tion and intention measures used for other media. Similar to TV andprint advertisements, direct mail pieces are exposures to stimulithat generate contact with the recipients of these campaigns. Opening
Please cite this article as: Feld, S., et al., The effects of mailing design charin Marketing (2012), http://dx.doi.org/10.1016/j.ijresmar.2012.07.003
a mail item is equivalent to a qualified contact because the envelopeand its design create a certain degree of curiosity and interest in fur-ther investigating the content of the mail item. Taking a closer lookat the letter, the brochure and/or response device at the secondstage reflects a larger extent of processing information. This elevatedinterest towards the offer, expressed in our KR measure, enables therepetition of the sender's messages, facilitating processing and increas-ing encoding opportunities. Reading and keeping a piece of mail cannurture the sharing of a firm's message with others and can help toform brand attitude (MacInnis & Jaworski, 1989). Hence, this studyfills an important gap in the direct marketing research, where interme-diate communication measures have been studied to only a limited ex-tent (exceptions are DeWulf et al., 2000; Diamond & Iyer, 2007; Vrienset al., 1998).
Our conceptual model is shown in Fig. 1. The model includes anexplicit link between OR and KR, as implied by the direct mail funnelspecified in Eq. (1). In our model, both dependent variables are drivenby design characteristics. We categorize these design characteristicsalong 2 dimensions. First, we group the general design characteristicsaccording to the mail element as performed in previous studies:(1) envelope, (2) letter, (3) supplement, and (4) response device. Weassume that the envelope characteristics exert a direct influence onthe OR by definition. It is conceivable, however, that the direct mailrecipients are able to gain a sense of the contents of the mail packageeven before opening the envelope, resulting in observational learning.To capture these haptic experiences, we incorporate several envelopecontent features when analyzing the OR, such as weight, supplements,or give-aways that might be sensed before opening. The design char-acteristics of the other mail elements cannot be observed at that time.Accordingly, the design characteristics of the other mail elements are as-sumed to influence the KR. Second, within each mail element, wecategorize eachdesign characteristic by its dominatingnature, i.e., wheth-er it (1) constitutes a visual design element, (2) identifies the originatingsender, (3) represents a personalization cue, or (4) is a measure of infor-mation intensity. Third, as suggested in the literature, we investigate theeffects of additional industry-specific characteristics along the mail ele-ments, e.g., the position of the payment device in the case of charitable
acteristics on direct mail campaign performance, Intern. J. of Research

Keeping Rate (KR)
Envelope (E)
Letter (L)
Supplement (S)
Response Device (RD)
VD SI
VD SI P II
VD P II
VD PSI
SI
VD Visual Design SI Sender Identity P Personalization II Information IntensityVariable is identical for allobservations in the sample
POpening Rate (OR)
Industry-specific Design
•Letter (L)
•Supplement (S)
•Response Device (RD)
•Incentive (INC)
•Offer (OFF)
Common Controls
•Campaign Volume (CV)
•Sender Volume (SV)
•„End-of-Month“ Effect
Observational Learning
Fig. 1. Conceptual framework of present study.
5S. Feld et al. / Intern. J. of Research in Marketing xxx (2012) xxx–xxx
mailings from Non-profit Organizations (NPOs) or information on thenearest branch for a financial service provider (FSP). Extending themail element categories above, we add information on the included in-centives (NPO) and offer-related information in both industries. Theseadditional categories add contextual information that could eithermod-erate the effect of the design characteristics or could have a direct effecton our dependent variables. Fourth,we introduce 3 covariates to controlfor themain drivers of mail performance apart from design: (1) the rel-ative campaign volumewithin the respective industry, reflecting the se-lection approach; (2) the share of voice or annual sender volume,reflecting the sender's position in the respective industry and advertis-ing channel; and (3) the “end-of-month” effect, as keeping behavior ismost likely higher for the direct mail received at the end of themonth because consumers have had less time to respond before send-ing it in for collection purposes and therefore tend to keep it.4 In thefollowing section, we elaborate on the underlying theory and the ef-fects of the direct mail design characteristics on the OR and the KR.
4. Theory on the effects of the design characteristics
4.1. Theoretical foundation
The inclusion of the 4 types of design characteristics discussed abovecan be motivated by the capacity theories of attention (e.g., Broadbent,1958) as well as by information-processing models (e.g., MacInnis &Jaworski, 1989). According to Broadbent's (1958) filter theory, aconsumer's perceptual system contains a filter mechanism. Amongthemany stimuli ormessages presented, only those stimuli that possesssalient physical characteristics are allowed through the filter and aresubsequently actively processed. Hence, Broadbent's theory helps toexplain the selectivity of attention. The theory implies that salient andfamiliar verbal or visual stimuli should be used to attract the consumers'attention. Interestingly, similar insights regarding saliency-based at-tention have been delivered in the field of neuroscience (e.g., Itti &Koch, 2001) and by related research in marketing (e.g., Van der Lans,Pieters, & Wedel, 2008; Zhang, Wedel, & Pieters, 2009). Examples ofsalient stimuli in a direct mailing are the use of teasers and headlines,postscripts, typographic accentuations, special envelope formats, col-ored illustrations or paper, and so forth.
With regard to the information processing models, the processingof an ad stimulus is a function of motivation, ability and opportunity(M-A-O), which are, in part, influenced by the physical properties
4 We thank an anonymous reviewer for this suggestion. See also Section 5.1 for fur-ther details.
Please cite this article as: Feld, S., et al., The effects of mailing design charin Marketing (2012), http://dx.doi.org/10.1016/j.ijresmar.2012.07.003
and design characteristics of the advertisement. More specifically,it is considered that advertisement design properties such as formatand size, color, headlines, typography, and other creative elementsplay a crucial role in attracting consumers' attention (e.g., Pieters &Wedel, 2004; Pieters, Wedel, & Zhang, 2007) as well as in buildingpersuasive and emotional effects (e.g., Percy & Rossiter, 1983; Smith,MacKenzie, Yang, Buchholz, & Darley, 2007; Yang & Smith, 2009).Based on these theories and research on the effects of design in othermedia, we assume that the 4 different types of direct mail design cate-gories exhibit differential effects on the directmail performance, partic-ularly at the first 2 stages of the direct mail funnel.
4.2. The effects of direct mail design categories on the opening andkeeping rates
4.2.1. Visual designOur first category of variables refers to visual design elements
such as color, illustrations, bold type or capital letters, extraordinarymailing formats, etc. The use of diverse visual stimuli and their effectson consumers' reactions has been extensively investigated in the con-text of print advertisements (e.g., Assael, Kofron, & Burgi, 1967; Percy& Rossiter, 1983; Pieters & Wedel, 2004). In particular, the effects ofvisual stimuli have been the subject of research in visual imagery(e.g., Rossiter, 1982; Rossiter & Percy, 1980). It has been shown thatpictorial stimuli can facilitate persuasive communication in a varietyof ways. For example, pictures can lead to more extensive mentalprocessing because they are attention-getting devices (Finn, 1988;MacKenzie, 1986). In addition, pictures can improve the memorabilityof other semantic information. Research has generally supported theview that pictures can affect ad and brand attitudes, beyond the effectsthey have on the consumers' beliefs about the product (e.g., Miniard,Bhatla, Lord, Dickson, & Unnava, 1991). The direct marketing literaturehas provided some initial support for the effectiveness of using certainvisual stimuli such as typographic accentuations and illustrations(Bult et al., 1997), teasers (Roberts & Berger, 1999; Van der Scheer etal., 1996; Vriens et al., 1998), or special envelope formats (Nash, 2000;Vriens et al., 1998).
4.2.2. Sender identityThe second category refers to the presentation of the originating
sender's name and/or logo on the direct mail piece, which translatesinto the prominence of the brand element. These sender-related cuescan be featured on all elements of the directmail package. Contradictingtheories on the effects of sender-related cues can be found in the litera-ture (Pieters & Wedel, 2004). Some scholars argue that a prominent
acteristics on direct mail campaign performance, Intern. J. of Research

6 S. Feld et al. / Intern. J. of Research in Marketing xxx (2012) xxx–xxx
brand element drives more attention to the brand, which is a necessarycondition for obtaining the desired brand-communication effects (e.g.,Keller, 2007). In contrast, some advertising practitioners caution againsthighlighting the brand in advertising because the brand element mightsignal that the message is an advertisement in which consumers pur-portedly are not interested (e.g., Aitchinson, 1999; Kover, 1995).
In the context of direct mail design, most of the brand-relateddebate centers on whether the sender should be clearly displayedon the outer envelope or not. Featuring the sender's name can signalfamiliarity and trustworthiness to the recipient (Hoyer & MacInnis,2007). Conversely, not placing the sender's name or logo is likely tocreate curiosity with the direct mail receiver (Nash, 2000; Roberts &Berger, 1999) and might result in higher ORs. However, this immedi-ate effect might be counter-productive if the receiver feels deceived orirritated by the unexpected commercial content of the letter (Nash,2000; Van Diepen, Donkers, & Franses, 2009b). The preceding dis-cussion suggests that featuring the sender's name or brand in promo-tional campaigns can be dysfunctional. The prior studies on directmaildesign did not show any significant effects from revealing the sender'sidentity on the envelope on the opening or the response behavior (Bellet al., 2006; De Wulf et al., 2000; Vriens et al., 1998).
4.2.3. PersonalizationThe third category reflects the degree of personalization for the
direct mail design. Personalization is intimately connected with theidea of interactive marketing. Dillman (2007) offers personalizationguidelines for surveys that are applicable to direct mail design aswell. His personalization strategy is based on the guiding principlethat the tone and content of a cover letter should reflect the styleused in a business letter to an acquaintance who is not known to thesender. The specific elements of personalization proposed by Dillmanare as follows: specific date (e.g., March 14th, 2013); the recipient'sname and address; a personal salutation; a real signature in contrast-ing ink (i.e., a “pressed blue ball-point pen signature”); and letterheadrather than copied stationery (Dillman, 2007).
Prior research suggests that personalized advertising approachesmight increase attention and response to offers (e.g., Ansari & Mela,2003). However, personalization or customization is not beneficialunder all circumstances (e.g., Kramer, Spolter-Weisfeld, & Thakkar,2007; Zhang & Wedel, 2009) and can even be harmful if the person-alized solicitations are perceived as intrusive (e.g., White, Zahay,Thorbjörnsen, & Shavitt, 2008). With regard to direct mail advertis-ing, research has provided moderate support for the positive effectsof personalization on response behavior (e.g., Bell et al., 2006; DeWulf et al., 2000; Hozier & Robles, 1985; James & Li, 1993). Studiesinvestigating response rates to mail surveys have yielded mixed find-ings on personalization: in their review of 93 journal articles, Yu andCooper (1983) find significant results showing the response-enhancingeffects of personalization. In contrast, the more recent survey responsestudies failed to detect any significant effects from personalization onattention (Helgeson et al., 2002) and response rates (e.g., Gendall, 2005).
4.2.4. Information intensityThe last category of variables refers to the amount of information
present in an advertisement. Within the M-A-O-framework, informa-tion intensity can affect the recipient's opportunity to process a mes-sage (MacInnis & Jaworski, 1989). From a memory perspective, itwould appear that fewer message-points per given time frame andadvertising space are preferable. One could argue that with less tolearn or comprehend from a commercial communication, the likeli-hood of retention and subsequent attitude or behavior change shouldincrease (Percy & Rossiter, 1980, p. 118). With too much information,only selected message points can be processed and stored effectivelyabove a necessary threshold (Percy & Rossiter, 1980, p. 5).
Although this reasoning has intuitive appeal, it should be notedthat the limited capacity of short-term memory is of less concern
Please cite this article as: Feld, S., et al., The effects of mailing design charin Marketing (2012), http://dx.doi.org/10.1016/j.ijresmar.2012.07.003
if the receiver deliberately seeks exposure to the advertisement andactively attends to the content (Rossiter, 1982). For example, directmail advertising often receives active attention from consumers oncethe envelope has been opened. Hence, unlike in print or TV ads, thetypical technique in direct mail advertising is to provide the readerwith sufficient information to achieve a decision to advance the re-sponse process (Rossiter, 1982, p. 103). Only Beard, Williams, andKelly (1990) investigate the effects of information intensity empirically,i.e., response rates of long versus short cover letters in direct mailings,but they find no significant impact.
5. Methodology
5.1. Data and sample description
Our unique data set is based on a representative direct mail panelfrom GfK. This household panel consists of 3,000 households whosesocio-demographics are representative of the entire population of the35 million private German households. The panel is solely aimed atmeasuring the intermediate effects, namely the OR and KR, along thedirect mail funnel. The panel does not measure the actual response.
The panel participants continuously collect any unsolicited andpersonally addressed direct mail piece that they receive. At the endof each month, the panel members send GfK all of the direct mailingsthat they have received during that month and that they do not wantto keep. These mailings are either (i) unopened mailings that wouldnormally be discarded right away, or (ii) opened mailings that wouldbe discarded due to a lack of appeal for the recipient after checkingthe content. GfK scans all of these mail pieces, stores the images in apicture database, and records some key characteristics such as weight,envelope format, postage, or type of response device.
For those mailings that the panel members choose to keep for fur-ther consideration (e.g., to read the letter/brochure in greater detailor to respond to the offer at a later time), they are asked to fill outand send GfK a form listing all of these mailings line by line. The spe-cific instruction for the panel participants is as follows: “Below, pleasefill in only those personally addressed direct mailings that you do notwant to send to us, because you want to keep them. Please do not fillin any direct mailings that you send us.” For each of these mail pieces,the panel participant is required to fill in the sender's name, the datethe mailing was received, the type of mailing (postcard, letter orcatalog), and the essential subject (slogan/theme) of the campaign.GfK uses this information to precisely match the individual mailingsreceived by households with specific campaigns. The KR of a cam-paign is then calculated as the percentage of recipients in the panelwho keep the corresponding mail piece in relation to the total num-ber of recipients who opened the direct mail piece (see Eq. (1)). Forthis study, GfK provided us with the aggregate ORs and KRs percampaign derived from this panel as well as access to sample copiesof the respective direct mail pieces. The actual response rates are notavailable because this would require the cooperation of all of the orga-nizations that sent direct mail pieces. These organizations generallyregard their actual response rates as very sensitive information.
5.1.1. Sample descriptionOur sample comprises information on the largest direct mail cam-
paigns (in terms ofmailing volume) across a 1-year period from2differ-ent industries—non-profit organizations (NPOs) and financial serviceproviders (FSPs). Both industries are characterized by a heavy relianceon direct mail campaigns (DMA, 2011; Van Diepen et al., 2009a,b).Together, they account for over 30% of the total mailing volume repre-sented in the GfK direct mail panel and, thus, both belong in the top 5industries employing directmailings. Across both industries, we observe677 distinct campaigns: 396 campaigns (58.5%) from 98 different orga-nizations in the NPO subsample and 281 campaigns (41.5%) from 48firms in the FSP subsample. Only 1 or 2 campaigns were executed by
acteristics on direct mail campaign performance, Intern. J. of Research

7S. Feld et al. / Intern. J. of Research in Marketing xxx (2012) xxx–xxx
54.1% (60.4%) of the NPOs (FSPs); 34.7% (18.8%) of the NPOs (FSPs) ranbetween 3 and 9 campaigns; and 14.2% (20.8%) of the firms ran 10 ormore campaigns within the 1-year period. Of the mailing packages,97.9% (98.0%), or nearly all, include a cover letter, 71.4% (65.8%) containa supplement and 97.5% (80.1%) contain a response device (including apayment device in the NPO sample).
5.1.2. Dependent variables—direct mail funnelGfK records the receipt of the distinct direct mail pieces by house-
hold and howmany of these pieces of mail were opened or kept. Thus,GfK computes the OR and KR per campaign as described in Eq. (1). Themean OR for the NPO (FSP) campaigns is 87.4% (88.9%). These valuesare consistent with the evidence from the direct mail literature andpractice, indicating the high propensity of consumers to open andread direct mailings (e.g., Nielsen, 2009; Deutsche Post, 2006; Stone& Jacobs, 2008, p. 412). The average KR for the NPO (FSP) industry is8.2% (5.3%) per campaign. These percentages are very close to theresponse intention percentages of 8.1% (4.3%) in the NPO (FSP) indus-try found in a recent U.S. study (DMA, 2011, p. 28), again lendinginternational validity to the German data. The actual response ratesare usually substantially lower (1.38–3.42%; DMA, 2011) and suffi-ciently distinct, thus underlining the importance of the KR as an inter-mediate measure of the direct mail response funnel.
5.1.3. Independent variables—design elementsTo identify and operationalize the design elements for our anal-
ysis, we follow a 4-step procedure. First, we search for elementsthat relate to the theories of attention capacity and information-processing models as well as to our framework by mail element(e.g., envelope) and design characteristic (e.g., personalization). Sec-ond, we check the literature in Table 1 and the prominent textbooks(e.g., Geller, 2002; Jones, 1997; Nash, 2000; Roberts & Berger, 1999;Stone & Jacobs, 2008) for cues on the relevant design elements.Third, we scan our database across both industries and collect a vari-ety of design elements empirically. Fourth, we conduct a series ofinterviews with industry experts that have NPO and FSP back-grounds as well as with specialized advertising agencies, Germany'slargest lettershops, and Deutsche Post DHL. Similarly, our choice forthe specific attribute levels is informed. As a result, we arrive at acollection of design variables, their operationalization, and theirexpected impact on the OR and the KR as shown in Table 2.
Only a few design characteristics (e.g., product category, format,postage and weight) are tracked and recorded by GfK in a systematicfashion. We manually classify and code all other (design) characteris-tics for each of the 677 campaigns based on the original direct mailpiece provided by GfK. The vast majority of design characteristicsare rather objective in nature (e.g., presence of teaser, type of infor-mation in letterhead, length of headline). For the few subjective vari-ables (e.g., concreteness of donation purpose, color proportion), weconduct cross-checks among the coders to ensure inter-rater reliabil-ity for all of the data accumulated. For brevity, we do not explain eachvariable in detail here, but we provide an overview in Table 2. Table 2also provides references to the previous direct mail design studies(Table 1) that have analyzed particular design variables in a similarway. As observed, many of the design variables included in our studyhave not been empirically examined in the prior research.
5.1.4. Common design characteristics across industriesIn total, we record 36 design characteristics with 68 distinct de-
sign attributes across mail elements and design categories that arecommon across both industries. Some design characteristics containmultiple attributes, either representing different aspects of the re-spective characteristic (e.g., 3 different types of accentuations) or dif-ferent degrees of implementation (e.g., the proportion of color in thesupplement). For these, we distinguish between the mutually exclu-sive and the overlapping design attributes in Table 2. Most of these
Please cite this article as: Feld, S., et al., The effects of mailing design charin Marketing (2012), http://dx.doi.org/10.1016/j.ijresmar.2012.07.003
variables are binary, indicating whether a design characteristic or itsattribute is observed (=1) in a campaign or not (=0). Only a fewvariables are metric, such as the length of headline or the number ofpages in the supplement. We indicate these variables in Table 2. Thefrequencies or the means per industry and for the pooled data setare reported there.
5.1.5. Industry-specific variablesBased on the theoretical considerations, the extant literature,
and the interviews with industry experts, we additionally record21 industry-specific variables: 10 (with 31 design attributes) forthe NPO and 11 (with 29 design attributes) for the FSP subsamples.These industry-specific design characteristics serve 2 purposes. First,the literature on direct marketing suggests that some of the effects ofthe direct mailing design characteristics are highly industry-specific(e.g., the type of testimonial for NPOs or awards and exemplary calcula-tions for the FSP industry; Smith & Berger, 1996; Stone & Jacobs, 2008).Second, the design characteristics simultaneously act as controls: theexpert interviews indicate that one-time donations require a differentapproach than continuous donation requests and hence the design ofthe mailing has to be adapted accordingly. Correspondingly, in the FSPindustry, selling investment funds involves a different communicationapproach than selling consumer loans. Accounting for these differenceshelps to avoid biases when assessing the impact of the common designcharacteristics. Table 2 also contains these variables and the respectiveinformation.
5.1.6. Common controlsBased on the literature review and the expert interviews, we inte-
grate 3 variables as common controls. First, the relative campaignvolume (CV) is calculated by dividing the number of mailings percampaign by the total annual campaign volume in theNPOor FSP indus-tries. Accordingly, the CV controls for the relative selectiveness of firmsin choosingmail recipients in their campaigns (Bult &Wansbeek, 1995;Donkers et al., 2006). For example, target groups, and likewise CV, willusually be smaller if ambitious response goals and specific target groupsguide the selection process. Second, we summate CVs for each NPO andFSP, resulting in the medium-specific relative annual sender volume(SV), i.e., reflecting the organization's share of voice in the letter boxof households. This variable accounts for the differences in share ofvoice, which are typically higher for larger organizations. Both controls,CV and SV, are also tested for nonlinear effects via squared terms(i.e., CV2 and SV2). Third, we control for the average receptiondate within a month for all campaigns (1, 2, …, 31), which was pro-vided to us by GfK. Given the nature of how the data are collected(i.e., panel members send direct mailings to GfK at the end of themonth), it is conceivable that keeping behavior could be higher forthe direct mail received at the end of the month because consumershave less time to respond and therefore choose to keep it (the“end-of-month” effect). This variable reflects the number of daysthat have passed in a month. Hence, following this line of argument,the larger the number is, the higher the KR should be. Fourth, weadd an effect-coded industry dummy to the pooled analysis to ac-count for industry-specific effects (NPO=1; FSP=−1).
5.2. Modeling and estimation approach
5.2.1. Model specificationBoth dependent variables, the OR and the KR, are measured as
fractions with a double truncation at 0 and 1. Accordingly, we employa logit transformation to both variables to reduce their departuresfrom non-normality (Ailawadi, Pauwels, & Steenkamp, 2008; Krafft,Albers, & Lal, 2004) and rename them LOR and LKR, respectively.Corresponding to our conceptual framework (cf. Fig. 1), we formulateregression equations for both dependent variables, LOR and LKR, foreach sample i=1, 2, 3 (NPO, FSP, and the pooled sample, respectively).
acteristics on direct mail campaign performance, Intern. J. of Research

Table 2Variable descriptives, expected impact, and rationale.
Mail element Type of variables Sample descriptivesb Expected impact
Type ofdesign
Parameter Characteristic Operationalizationb Selected sourcesc Obs.learning
NPO(396 Mails)
FSP(281 Mails)
Bothindustries
OR KR Major rationale OR; KR
OR KR
Envelope (E) VD βi1 Weighta >20 g New (1) Yes 94 46 140 + 0 Curiosity; n.a.βi2 Formata Special and large sizes 6,7,10, (11,12,13) Yes 50 15 65 + 0 Curiosity; n.a.βi3 Presence of address window No/yes 6,7 (12,13) 391 274 665 + 0 Preview; n.a.βi4 Presence of teaser No/yes 4,6,10 (11,12,13,14) 211 119 330 + +/− Curiosity; met expectation?βi5 Teaser content Urgency appeal New (1) (13,14) 57 11 68 + +/− Curiosity; met expectation?βi6 Questioning techniques 7 (11,13,14) 7 3 10 + +/− Curiosity; met expectation?βi7 Sweepstake/freebie New (1) (11,13,14) 12 5 17 + +/− Curiosity; met expectation?βi8 Colored design No/yes 6,7 (11,13,14) 296 99 395 + 0 Attention; n.a.βi9 Promotional design on back side No/yes New (1) (11) 151 24 175 + 0 Attention; n.a.βi10 Pictures/illustrations No/yes 3,4,6 (11,12,13) 168 42 210 + 0 Attention; n.a
SI βi11 Sender's name on front side No/yes 4,6,10 (11,12,14) 302 199 501 + 0 Familiarity, Trust; n.a.βi12 Sender's name on back side No/yes 4,6,10 (11,12,14) 143 61 204 + 0 Familiarity, Trust; n.a.
P βi13 Postage placementa Stamp 4,6 (11,12) 20 2 22 + 0 Personalization; n.a.βi14 (mutually exclusive attributes) Postage paid 4 (12) 339 189 528 0 0 less personal– With ink stamp or
in window4 (12) 37 90 127 0 0 less personal
Letter (L) VD γi1 Presence of headline No/yes New (1) (11,12) 215 254 469 + n.a.; focal informationγi2 Length of headline (metric) No. of words New (1) 4.8 9.5 6.7 ∩ n.a.; too many is worseγi3 Post scriptum Presence no/yes 4,6,10 (11,12,15) 302 198 500 + n.a; attention, summaryγi4 Summary of offer 4,5,6,10 (11,2) 203 25 228 + n.a; attention, summaryγi5 New aspect/info 5,10 (12) 87 77 164 + n.a; attention, summaryγi6 Response appeal New (1) (12) 13 103 116 + n.a.; attention, actionγi7 Topography: letters with serifs No/yes New (1) (11,12) 104 73 177 + n.a.; attentionγi8 Bold type 5 (11) 134 261 395 + n.a.; attentionγi9 Accentuations Underlines New (1) (11,12) 162 19 181 + n.a.; attentionγi10 Capital letters New (1) (11) 14 26 40 + n.a.; attentionγi11 Color of paper White vs. colored 6 390 279 669 0 n.a.; normal, deviation attentionγi12 Color of font Uniform black/blue vs.
partly colored6 (11) 16 58 74 + n.a.; attention
γi13 Colored background print No/yes New (1) 18 11 29 + n.a.; attentionγi14 Colored illustration No/yes 5,10 (12) 281 105 386 + n.a.; attention, easier processing
SI γi15 Content of letter head Logo New (1) 368 262 630 + n.a.; trustγi16 Address New (1) 280 201 481 + n.a.; trustγi17 Phone number New (1) (11) 209 123 332 + n.a.; trustγi18 Fax number New (1) 186 43 229 + n.a.; trustγi19 Website New (1) 171 60 231 + n.a.; trustγi20 Photo of sender New (1) 103 6 109 + n.a.; trustγi21 E-mail New (1) 136 14 150 + n.a.; trustγi22 Toll-free phone number New (1) (11) 11 11 22 + n.a.; trustγi23 Presence of testimonial No/yes 8 52 36 88 + n.a.; trust
P γi24 Presence of calendar date No/yes 4 350 271 621 + n.a.; recencyγi25 Current calendar date No/yes New (1) 350 253 603 + n.a.; recencyγi26 Presence of sender's signature No/yes 6 (11,12) 379 271 650 + n.a.; personal
II βi15 γi27 Length of letter >1 page 2,6 (11,12,13,14) Yes 145 32 177 + ∩ curiosity; too much is worseNPO γ1,59 Tonality Factual New (1) (12) 72 − n.a.; likely less successful
– (mutually exclusive attributes) Emotional New (1) (12) 324 + n.a.; more involvementγ1,60 Concreteness of donation purpose Concrete New (1) 148 + n.a.; actual demand obvious– (mutually exclusive attributes) Vague New (1) 248 − n.a.; less involvementγ1,61 Types of testimonials Doctor New (1) 27 + n.a.; high reputation, trustγ1,62 Celebrity New (1) 19 + n.a.; high reputation, trustγ1,63 Helper New (1) 3 + n.a.; “doer”, trust– (mutually exclusive with
presence of testimonial)Others New (1) 3 0 n.a.; neutral as no relation
8S.Feld
etal./
Intern.J.ofResearchin
Marketing
xxx(2012)
xxx–xxx
Pleasecite
thisarticle
as:Feld,S.,etal.,Theeffects
ofmailing
designcharacteristics
ondirectm
ailcampaign
performance,Intern.J.ofResearch
inMarketing
(2012),http://dx.doi.org/10.1016/j.ijresmar.2012.07.003
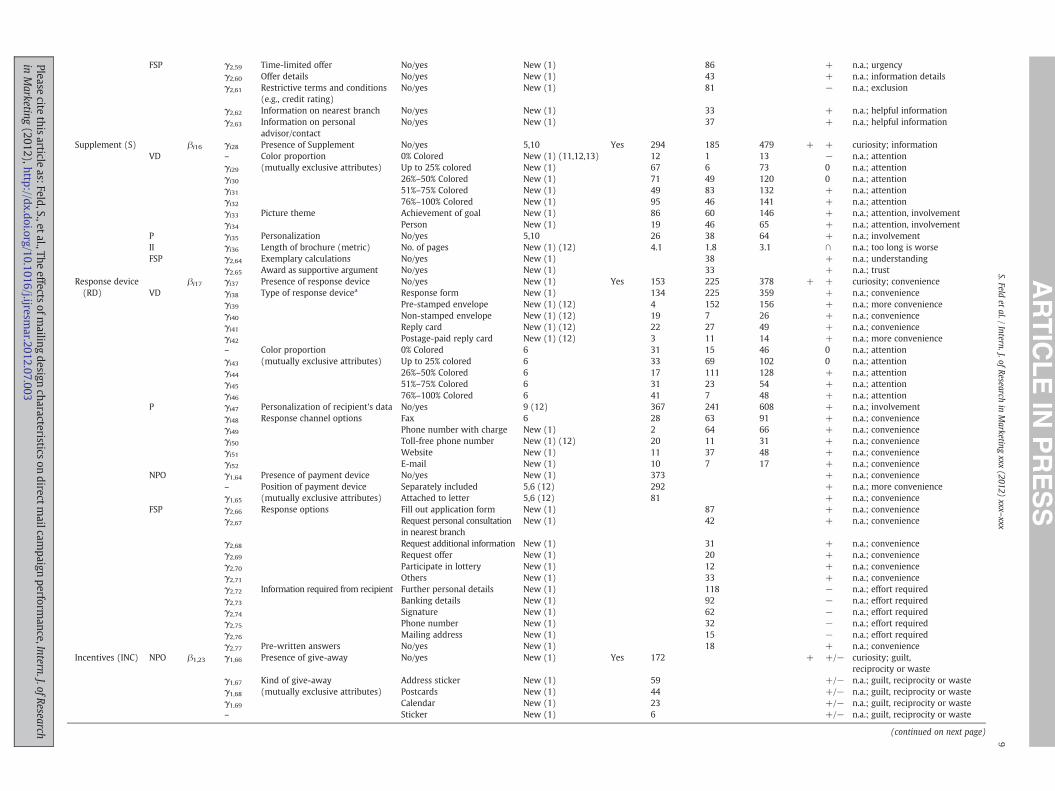
FSP γ2,59 Time-limited offer No/yes New (1) 86 + n.a.; urgencyγ2,60 Offer details No/yes New (1) 43 + n.a.; information detailsγ2,61 Restrictive terms and conditions
(e.g., credit rating)No/yes New (1) 81 − n.a.; exclusion
γ2,62 Information on nearest branch No/yes New (1) 33 + n.a.; helpful informationγ2,63 Information on personal
advisor/contactNo/yes New (1) 37 + n.a.; helpful information
Supplement (S) βi16 γi28 Presence of Supplement No/yes 5,10 Yes 294 185 479 + + curiosity; informationVD – Color proportion 0% Colored New (1) (11,12,13) 12 1 13 − n.a.; attention
γi29 (mutually exclusive attributes) Up to 25% colored New (1) 67 6 73 0 n.a.; attentionγi30 26%–50% Colored New (1) 71 49 120 0 n.a.; attentionγi31 51%–75% Colored New (1) 49 83 132 + n.a.; attentionγi32 76%–100% Colored New (1) 95 46 141 + n.a.; attentionγi33 Picture theme Achievement of goal New (1) 86 60 146 + n.a.; attention, involvementγi34 Person New (1) 19 46 65 + n.a.; attention, involvement
P γi35 Personalization No/yes 5,10 26 38 64 + n.a.; involvementII γi36 Length of brochure (metric) No. of pages New (1) (12) 4.1 1.8 3.1 ∩ n.a.; too long is worseFSP γ2,64 Exemplary calculations No/yes New (1) 38 + n.a.; understanding
γ2,65 Award as supportive argument No/yes New (1) 33 + n.a.; trustResponse device(RD)
βi17 γi37 Presence of response device No/yes New (1) Yes 153 225 378 + + curiosity; convenienceVD γi38 Type of response devicea Response form New (1) 134 225 359 + n.a.; convenience
γi39 Pre-stamped envelope New (1) (12) 4 152 156 + n.a.; more convenienceγi40 Non-stamped envelope New (1) (12) 19 7 26 + n.a.; convenienceγi41 Reply card New (1) (12) 22 27 49 + n.a.; convenienceγi42 Postage-paid reply card New (1) (12) 3 11 14 + n.a.; more convenience– Color proportion 0% Colored 6 31 15 46 0 n.a.; attentionγi43 (mutually exclusive attributes) Up to 25% colored 6 33 69 102 0 n.a.; attentionγi44 26%–50% Colored 6 17 111 128 + n.a.; attentionγi45 51%–75% Colored 6 31 23 54 + n.a.; attentionγi46 76%–100% Colored 6 41 7 48 + n.a.; attention
P γi47 Personalization of recipient's data No/yes 9 (12) 367 241 608 + n.a.; involvementγi48 Response channel options Fax 6 28 63 91 + n.a.; convenienceγi49 Phone number with charge New (1) 2 64 66 + n.a.; convenienceγi50 Toll-free phone number New (1) (12) 20 11 31 + n.a.; convenienceγi51 Website New (1) 11 37 48 + n.a.; convenienceγi52 E-mail New (1) 10 7 17 + n.a.; convenience
NPO γ1,64 Presence of payment device No/yes New (1) 373 + n.a.; convenience– Position of payment device Separately included 5,6 (12) 292 + n.a.; more convenienceγ1,65 (mutually exclusive attributes) Attached to letter 5,6 (12) 81 + n.a.; convenience
FSP γ2,66 Response options Fill out application form New (1) 87 + n.a.; convenienceγ2,67 Request personal consultation
in nearest branchNew (1) 42 + n.a.; convenience
γ2,68 Request additional information New (1) 31 + n.a.; convenienceγ2,69 Request offer New (1) 20 + n.a.; convenienceγ2,70 Participate in lottery New (1) 12 + n.a.; convenienceγ2,71 Others New (1) 33 + n.a.; convenienceγ2,72 Information required from recipient Further personal details New (1) 118 − n.a.; effort requiredγ2,73 Banking details New (1) 92 − n.a.; effort requiredγ2,74 Signature New (1) 62 − n.a.; effort requiredγ2,75 Phone number New (1) 32 − n.a.; effort requiredγ2,76 Mailing address New (1) 15 − n.a.; effort requiredγ2,77 Pre-written answers No/yes New (1) 18 + n.a.; convenience
Incentives (INC) NPO β1,23 γ1,66 Presence of give-away No/yes New (1) Yes 172 + +/− curiosity; guilt,reciprocity or waste
γ1,67 Kind of give-away Address sticker New (1) 59 +/− n.a.; guilt, reciprocity or wasteγ1,68 (mutually exclusive attributes) Postcards New (1) 44 +/− n.a.; guilt, reciprocity or wasteγ1,69 Calendar New (1) 23 +/− n.a.; guilt, reciprocity or waste– Sticker New (1) 6 +/− n.a.; guilt, reciprocity or waste
(continued on next page)
9S.Feld
etal./
Intern.J.ofResearchin
Marketing
xxx(2012)
xxx–xxx
Pleasecite
thisarticle
as:Feld,S.,etal.,Theeffects
ofmailing
designcharacteristics
ondirectm
ailcampaign
performance,Intern.J.ofResearch
inMarketing
(2012),http://dx.doi.org/10.1016/j.ijresmar.2012.07.003

Table 2 (continued)
Mail element Type of variables Sample descriptivesb Expected impact
Type ofdesign
Parameter Characteristic Operationalizationb Selected sourcesc Obs.learning
NPO(396 Mails)
FSP(281 M ls)
Bothindustries
OR KR Major rationale OR; KR
OR KR
γ1,70 Others New (1) 40 +/− n.a.; guilt, reciprocity or wasteγ1,71 Value appearance of give-away Low 4 40 + n.a.; involvement or reciprocity– (mutually exclusive attributes) Medium 4 113 + n.a.; guilt, reciprocityγ1,72 High 4 19 − n.a.; waste
Offer (OFF) NPO γ1,73 Charitable categorya Child aid New (1) 128 +/− n.a.; n.a.γ1,74 Diseases/disabilities New (1) 74 +/− n.a.; n.a.γ1,75 Environment/animals New (1) 63 +/− n.a.; n.a.γ1,76 Foreign aid New (1) 36 +/− n.a.; n.a.γ1,77 Religion/church New (1) 14 + n.a.; n.a.γ1,78 Goal/intention of charitable maila One-time donation New (1) 371 n.a.; lower commitmentγ1,79 Continuous donations New (1) 119 − n.a.; higher commitmentγ1,80 Mere information New (1) 17 +/− n.a.; guilt or wasteγ1,81 Recruiting new members New (1) 16 − n.a.; higher commitmentγ1,82 Thank-you letter New (1) 15 + n.a.; involvementγ1,83 Adoption/sponsorship New (1) 8 − n.a.; higher commitment
FSP γ2,78 Product categorya Loans New (1) 132 +/− n.a.; n.a.γ2,79 (mutually exclusive attributes) Savings/investments New (1) 40 +/− n.a.; n.a.γ2,80 Stocks/funds New (1) 34 +/− n.a.; n.a.γ2,81 Credit card New (1) 20 +/− n.a.; n.a.γ2,82 Retirement provisions New (1) 10 +/− n.a.; n.a.γ2,83 Home purchase savings New (1) 9 +/− n.a.; n.a.γ2,84 Information, no offer New (1) 7 +/− n.a.; n.a.γ2,85 Investment advice New (1) 2 +/− n.a.; n.a.– Others New (1) 27 +/− n.a.; n.a.
Opening rate γi,58
Common Controls βi18βi19 γi53γi54 Campaign Volume (metric)(main effect and squared)
New (1) 0.0 0.0 0.0 − − higher volume less targeted
βi20βi21 γi55γi56 Firm Volume (metric)(main effect and squared)
New (1) 0.0 0.0 0.0 + + Bigger brand and higher trust
βi22 γi57 “End of Month”-Effect (metric) New (1) 17.6 14.6 16.5 − − urgency to check before mail-inβ3,24 γ3,59 Industry Dummy n.a. n.a.; n.a.
VD=visual design, SI=sender identity, P=personalization, II=information intensity, NPO/FSP=industry-specific design variable; n.a.=not applicable.a Record by GfK.b Item frequency for dummy variables (yes) and means for metric variables.c Sources: 1 New, based on theory, expert interviews and empirical assessments; Empirical Studies (see Table 1): 2 Beard et al. (1990): 3 Bekkers and Crutzen (2007); 4 Bel t al. (2006); 5 Bult et al. (1997); 6 DeWulf et al. (2000); 7 James
and Li (1993); 8 Ledolter and Sweesey (2006); 9 Van der Scheer et al. (1996); 10 Vriens et al. (1998); Textbooks: 11 Geller (2002); 12 Jones (1997); 13 Nash (2000); 14 R erts and Berger (1999); 15 Stone and Jacobs (2008)—Textbooksources are no (refereed) empirical studies.
10S.Feld
etal./
Intern.J.ofResearchin
Marketing
xxx(2012)
xxx–xxx
Pleasecite
thisarticle
as:Feld,S.,etal.,Theeffects
ofmailing
designcharacteristics
ondirectm
ailcampaign
performance,Intern.J.ofResearch
inMarketing
(2012),http://dx.doi.org/10.1016/j.ijresmar.2012.07.003
ai
l eob

11S. Feld et al. / Intern. J. of Research in Marketing xxx (2012) xxx–xxx
In each of these 3 samples, we have a different number of j(i)=1,2,…,J(i) campaigns (J(1)=396, J(2)=281, J(3)=677, respectively). Toanalyze the effects of K(i) sample-specific independent variables onthe respective dependents (see Table 2 for details), we employ an OLSregression on the respective equations specified in Eqs. (2) and (3):
lorij ¼ βi0 þXK ið Þ
k¼1
βikxijk þ uij ð2Þ
In Eq. (2), lorij refers to the dependent variable, the logit of the OR,in sample i for campaign j. Across campaigns, the dependent variableis explained by a sample-specific set of parameters (βik) and a corre-sponding set of explanatory variables (xijk), resulting in a normallydistributed error (uij). Across all samples, the parameters include anintercept (βi0) and 11 design characteristics for the envelope with15 design attributes, of which one is defined by the other 2 exclusivealternatives (βi1,…, βi14, see Table 2). Additionally, we incorporateseveral design characteristics that indicate observational learning,where the recipients might sense special content in the direct mailpiece. Apart from weight and format (βi1, βi2), which are already sub-sumed under the envelope characteristics, we associate letter lengthand the presence of a supplement or a response devicewith observation-al learning (βi15,…, βi17). The presence of a give-away is only relevant fortheNPO industry (β1,23).Moreover, the controls CV and SVwith their re-spective squared terms for testing a potentially nonlinear influence aswell as the “end-of-month” effect enter the equation to control for thefirms' selectiveness in choosing mail recipients and firm brand effects(βi18,…, βi22). For the pooled analysis, we add an effect-coded industrydummy (β3,24) to account for the industry-specific effects.
lkrij ¼ γi0 þXK ið Þ
k¼1
γikzijk þ vij ð3Þ
In Eq. (3), lkrij refers to the dependent variable, the logit of KR, insample i for campaign j. Across campaigns, the dependent variable isexplained by a sample-specific set of parameters (γik) and a corre-sponding set of explanatory variables (zijk), resulting in a normallydistributed error (vij). Across all samples, the parameters include anintercept γi0, 15 design characteristics for the letter with 27 designlevel attributes (γi1,…, γi27), 4 characteristics for the supplementwith 8 design level attributes (γi28,…, γi36) and 4 characteristics forthe response device with 16 design level attributes (γi37,…, γi52).5
Analogous to Eq. (2), we account for the potential (nonlinear) effectsof CV and SV as well as for the “end-of-month” effect (γi53,…, γi57). Totest the link between the 2 stages, we include OR in both industries(γi58). For the pooled analysis, we again add an industry dummy(γ3,59) to account for the industry-specific effects.
In the NPO (FSP) model, we extend the Z1 (Z2) vector by the 10(11) industry-specific variables from Table 2 (γ1,59,…, γ1,83; γ2,59,…,γ2,85, respectively).
To limit the industry sample size effects in the pooled analysis, weweight all cases from the NPO (FSP) industry with a factor of .8548(1.2046).
5.2.2. Variable selectionThe specification of the full model incorporates a large number of
parameters across both equations and thus requires a systematic re-duction of variables to arrive at a parsimonious model. To achievethis reduction, we first estimate a full model with all of the availableindependent variables for both equations in each of the 2 industries.Next, we drop all of the variables with t-values smaller than 1 becauseonly variables with t-values larger than 1 add more information thannoise. This variable selection strategy is widely used in the literature
5 As some design level attributes are mutually exclusive, they require 1 parameterless (see Table 2 for details).
Please cite this article as: Feld, S., et al., The effects of mailing design charin Marketing (2012), http://dx.doi.org/10.1016/j.ijresmar.2012.07.003
(e.g., Dekimpe & Hanssens, 1995; Krafft et al., 2004; Pesaran, Pierse,& Lee, 1993).
5.2.3. Robustness checksWespecifically test for linearmodel assumptions. To assess the degree
of multicollinearity, we calculate the bivariate correlations and the vari-ance inflation factors (VIFs) (see the correlation matrices and the VIFsin Appendix). In the OR models, all of the VIF scores are below 6 andthus do not exceed the critical values (Belsley, Kuh, & Welsh, 2004). Forinstance, the highest VIF scores for the full ORmodel in the NPO industryare 3.609 and 3.102 for campaign volume and its squared equivalent, re-spectively; in the FSP industry, they are 5.893 and 5.743 for firm volumeand its squared equivalent, respectively. Both VIF values are somewhatlower in the final model, as can be expected after variable elimination.For the full KR models, we initially find substantially higher VIFs for the12 variables in each industry (e.g., the VIFs for presence and type of re-sponse device were 56.478 and 46.320, respectively, for NPOs; the VIFsfor presence and color proportion of the brochure 51–75% were213.616 and 190.888, respectively, for FSPs). However, in the final KRmodels, these variables are eliminated and the VIFs of all of the remainingvariables fall well below the critical values.6 In the final models, the cor-relations between the variables are also relatively low, with the vastmajority of correlation coefficients below .3. Thus, multicollinearitydoes not affect our final results. Both the Breusch–Pagan–Godfrey testand the White test indicate a substantial level of heteroscedasticity.Hence, we correct for heteroscedasticity by applying White's (1980)correction to derive robust standard errors. Furthermore, we controlfor correlated error terms between the OR and the KR model by apply-ing Breusch and Pagan's Lagrange Multiplier test (Breusch & Pagan,1980). The correlation between the residuals of our final OR and KRmodels are below .10 for both FSPs and NPOs, resulting in insignificantLagrange multipliers (p-value NPO=.63; p-value FSP=.36). Accord-ingly, the OR and KR equations can be estimated independently. Never-theless, we test our final estimation results for the OR and the KR byalso running a Seemingly Unrelated Regression (Zellner, 1962) andfind no distinct results with regard to both the relative effects of thevariables and their significance levels.With the OR being the dependentvariable in Eq. (2) and a potential predictor in Eq. (3), we also con-ducted Hausman's (1978) residual test to account for any potentialendogeneity problems caused by the simultaneity of the OR in thefirst estimation step. The test results do not indicate any need tomodifyour models and our estimation approach in the first step, and the ORis subsequently dropped in the second step for both industries.
6. Empirical results
6.1. Direct mail funnel and the impact of design characteristics
First, we report the findings on the connection between the 2stages of the direct mail funnel as well as the impact of the designcharacteristics at those stages, represented by the OR and KR, respec-tively. Concerning the relationship between the OR and the KR ofcampaigns, the positive spill-over effect presumed in our conceptualmodel (see Fig. 1) is not confirmed. In neither of the 2 industriesdo we find a significant effect for the OR on the KR. With t-values of− .29 (NPO) and .99 (FSP), the OR was dropped from the KR modelin the initial stage of the variable selection process because it hadt-values smaller than 1. This finding implies that a higher/lower ORdoes not imply a higher or lower KR. Both rates are statistically inde-pendent of each other for both industries.
In Table 3, we report the estimation results for the first funnelstage for the 2 industries (see Eq. (2)) regarding the common and
6 We selectively included variables with high VIF scores and t-values lower than 1 inthe final models but were unable to detect additional significant effects for these vari-ables. Hence, we did not extend our final models further.
acteristics on direct mail campaign performance, Intern. J. of Research

Table 3Empirical results on opening rates.
Variables NPO FSP Weighted pooled analysis
Parameter Estimate (SE) t Parameter Estimate t Parameter Estimate (SE) t
Constant β1,0 3.959 (.281) 14.11⁎⁎⁎ β2,0 7.605 (1.197) 6.35⁎⁎⁎ β3,0 4.890 (.328) 14.90⁎⁎⁎
Visual design:Weight: >20 g β1,1 .412 (.276) 1.50 β2,1 1.571 (.399) 3.94⁎⁎⁎ β3,1 .948 (.250) 3.79⁎⁎⁎
Format: special and larger sizes β1,2 .917 (.380) 2.42⁎⁎⁎ β2,2 −1.589 (.814) −1.95 β3,2 .333 (.365) .91Presence of address window β2,3 − .937 (.918) −1.02Presence of teaser β2,4 −1.772 (.419) −4.23⁎⁎⁎ β3,4 − .830 (.204) −4.07⁎⁎⁎
Teaser: questioning technique β1,6 3.020 (.829) 3.64⁎⁎⁎ β3,6 2.253 (.997) 2.26⁎⁎
Colored design β1,8 −1.773 (.279) −6.35⁎⁎⁎ β2,8 −1.487 (.447) −3.33⁎⁎⁎ β3,8 − .495 (.224) −2.22⁎⁎⁎
Promotional design on back side β1,9 .712 (.237) 2.99⁎⁎⁎ β2,9 − .836 (.543) −1.54 β3,9 .415 (.241) 1.72Sender identity:
Sender's name on front side β2,11 −2.096 (.374) −5.61⁎⁎⁎ β3,11 − .838 (.229) −3.67⁎⁎⁎
Personalization:Postage placement; postage paid β2,14 −1.342 (.296) −4.54⁎⁎⁎ β3,14 − .982 (.254) −3.87⁎⁎⁎
Observational learning:Length of letter β2,15 .764 (.508) 1.51
Common controls:Campaign volume β1,18 −1.024 (.238) −4.31⁎⁎⁎ β2,18 .153 (.154) 1.00 β3,18 − .290 (.195) −1.49Campaign volume squared β1,19 .139 (.064) 2.17⁎⁎ β3,19 .038 (.046) .83Firm volume β1,20 .469 (.194) 2.42⁎⁎ β2,20 − .625 (.309) −2.02⁎⁎ β3,20 − .251 (.177) −1.42Firm volume squared β2,21 .518 (.179) 2.89⁎⁎⁎ β3,21 .200 (.123) 1.62Industry dummy β3,24 − .171 (.125) 1.37
Adj. R2 .173 .260 .116F-Statistic (probability) 10.127⁎⁎⁎ 9.200⁎⁎⁎ 7.829⁎⁎⁎
a. OLS-Model estimated with White's (1980) correction for heteroscedasticity (robust standard errors).⁎⁎⁎ sig. pb .01.⁎⁎ sig. pb .05.
12 S. Feld et al. / Intern. J. of Research in Marketing xxx (2012) xxx–xxx
industry-specific design effects on the OR. We also report a pooledanalysis across the 2 industries, where the samples are weighted bysize and only the effects that are significant at the 5-percent level(2-sided, t≥1.97) in either of the 2 industries are kept. The overallgoodness-of-fit criteria indicate a reasonable explanatory power forour parsimonious models for the 2 industries with adj. R2s of .173for NPOs and .260 for FSPs. Table 4 shows the estimations per indus-try and the weighted pooled analysis for the KR. The adjusted R2 forthe NPO is .340, while it is lower for FSPs with a value of .164. Forboth the OR and the KR equations, the adjusted R2s are lower or sim-ilar for the weighted pooled analysis, with values of .116 (OR) and.173 (KR).
6.2. Impact of design characteristics by category
We base our assessments of the effects of each design characteris-tic on the t-statistics (see Tables 3 and 4). In our discussion, we focuson the effects with a p-value b .05.
6.2.1. Visual design categoryRegarding theOR, a colored envelope design for the envelopehas neg-
ative main effects on the OR for both industries. This finding is confirmedin the pooled analysis across both samples. The industry-specific esti-mates indicate that larger format sizes for the envelope, teasersemploying the questioning technique and a promotional design on thebackside of the envelope show positive main effects in the NPO industry.However, only the positive effect of a teaserwith a questioning techniqueis confirmed in the pooled analysis. Interestingly, special and larger enve-lope sizes positively influence the OR in the NPO industry, while exertinga negative, weakly significant effect in the FSP industry. In the FSP indus-try, a larger weight positively influences the OR while the presence of ateaser reveals a negative main effect. These effects are confirmed in thepooled analysis. Overall, most of the significant visual design variablesin the industry-specific analyses are also significant in the pooled analysis.
With respect to the KR, for the NPO industry, only the pre-stampedenvelope as a response device yields a positive influence. In the FSPindustry we do, however, find 3 significant main effects. The lengthof the headline is positively related to the KR. The presence of a post
Please cite this article as: Feld, S., et al., The effects of mailing design charin Marketing (2012), http://dx.doi.org/10.1016/j.ijresmar.2012.07.003
scriptum negatively influences the KR. However, when this postscriptum provides some new information, it positively influences theKR. In the pooledmodel, the latter variable is the only significant visu-al design characteristic with a positive influence on the KR.
6.2.2. Sender identityConcerning the OR, we do not find any significant effect for this
type of design characteristic in the NPO industry. In the FSP industry,placing the sender's name on the front side has a negative main effect.In the pooled analysis, this effect remains negative and significant.
For the KR, our estimation results in both industries show positiveeffects for placing the company logo and the fax number in the letter-head. The effect of the logo is confirmed in the pooled model; how-ever, the fax number is only marginally significant. Remarkably, thepresence of a phone number for the sender in the letterhead nega-tively influences the KR in the NPO industry. One reason could bethat the recipients expect a toll-free number.
6.2.3. Personalization categoryAt the OR stage, envelope personalization is captured by the type of
postage placement. Using the least personalized option, i.e., the imprint“postage paid,” leads to significantly lower overall ORs in the FSP indus-try. This negative main effect is also found in the pooled analysis.
With respect to the KR, the personalization of the supplement ex-erts a positive main effect in both industries. Although a personalizedsupplement is significantly positive in the pooled model and for theNPO industry, it is only marginally significant in the FSP industry.
6.2.4. Information intensity categoryNo significant variables capturing the information intensity of the
mailing are found in the OR equations across industries. This resultis hardly surprising because the envelope usually does not containsubstantially varying degrees of information.
The aspects that reflect the information intensity of the direct mailpackage are captured for the KR. Here, the length of the cover letterexerts a positive influence in the NPO industry, while the length ofthe brochure has a positive main effect in the FSP industry. In thepooledmodel, only the positive effect of the letter length is confirmed.
acteristics on direct mail campaign performance, Intern. J. of Research

Table 4Empirical results on keeping rates.
Variables NPO FSP Weighted pooled analysis
Parameter Estimate (SE) t-Value Parameter Estimate (SE) t-Value Parameter Estimate (SE) t-Value
Constant γ1,0 −5.894 (.729) 8.09⁎⁎⁎ γ2,0 −6.777 (.583) −11.62⁎⁎⁎ γ3,0 −6.654 (.470) −14.14⁎⁎⁎
Visual design:L: Length of headline γ2,2 .064 (.025) 2.57⁎⁎ γ3,2 .015 (.016) .91L: Presence of post scriptum γ2,3 − .870 (.351) −2.48⁎⁎ γ3,3 − .330 (.221) −1.50L: Post scriptum: new aspect/info γ2,5 1.377 (.318) 4.33⁎⁎⁎ γ3,5 .569 (.226) 2.52⁎⁎⁎
L: Typography: letters with serifs γ2,7 .508 (.357) 1.42L: Accentuations: underlines γ2,9 .838 (.621) 1.35L: Accentuations: capital letters γ2,10 .584 (.524) 1.11L: Color of paper γ1,11 1.083 (.840) 1.29RD: Pre-stamped envelope γ1,39 1.227 (.554) 2.22⁎⁎ γ3,39 − .277 (.262) −1.06RD: Color proportion: up to 25% colored γ1,43 .363 (.442) .819 γ2,43 − .617 (.488) −1.26RD: Color proportion: 26–50% colored γ1,44 − .661 (.505) −1.31 γ2,44 − .324 (.412) − .78RD: Color proportion: 51–75% colored γ2,45 − .163 (.576) − .28RD: Color proportion: 76–100% colored γ1,46 .468 (.341) 1.38 γ2,46 −1.413 (.1.060) −1.33
Sender identity:L: Content of letter head: logo γ1,15 1.228 (.315) 3.90⁎⁎⁎ γ2,15 1.399 (.466) 3.00⁎⁎⁎ γ3,15 1.618 (.361) 4.48⁎⁎⁎
L: Content of letter head: phone number γ1,17 −1.010 (.395) −2.56⁎⁎ γ3,17 .337 (.204) 1.65L: Content of letter head: fax number γ1,18 1.506 (.396) 3.80⁎⁎⁎ γ2,18 1.094 (.443) 2.47⁎⁎ γ3,18 .445 (.229) 1.94L: Content of letter head: photo of sender γ1,20 − .507 (.267) −1.90L: Content of letter head:toll-free phone number
γ2,22 −1.119 (.855) −1.31
L: Presence of testimonial γ1,23 − .440 (.491) − .90Personalization:
L: Presence of sender's signature γ1,26 .398 (521) .77S: Personalization γ1,35 2.963 (.302) 9.80⁎⁎⁎ γ2,35 .843 (.440) 1.90 γ3,35 1.811 (.309) 5.87⁎⁎⁎
RD: Response channel option: fax γ1,48 − .890 (.461) −1.93RD: Response channel option:toll-free phone number
γ1,50 1.058 (.597) 1.77
Information intensity:L: Length of letter (>1 page) γ1,27 .635 (.242) 2.62⁎⁎⁎ γ2,27 .521 (.489) 1.05 γ3,27 .578(.228) 2.54⁎⁎⁎
S: Length of brochure γ1,36 − .012 (.014) − .81 γ2,36 .075 (.022) 3.44⁎⁎⁎ γ3,36 .008 (.014) .54Industry-specific variables (NOI:)
L: Type of testimonials: doctor γ1,61 .475 (.561) .85L: Type of testimonials: helper γ1,63 2.430 (1.029) 2.36⁎⁎
INC: Kind of give-away: calendar γ1,69 .511 (.516) .99INC: Kind of give-away: others γ1,70 .609 (.360) 1.69INC: Value appearance of give-away: high γ1,72 −1.222 (.544) −2.25⁎⁎
OFF: Charitable category:environment/animals
γ1,75 − .553 (.324) −1.71
OFF: Charitable category: religion/church γ1,77 −1.942 (.327) −5.94⁎⁎⁎
OFF: Goal/intention of charitable mail:one-time donation
γ1,78 .520 (.471) 1.11
OFF: Goal/intention of charitable mail:recruiting new members
γ1,81 −1.363 (.372) −3.66⁎⁎⁎
Industry-specific variables (FSP):L: Offer details γ2,60 .979 (.418) 2.34⁎⁎
L: Restrictive terms and conditions γ2,61 − .731 (.354) −2.07⁎⁎
RD: Response options:fill out application form
γ2,66 −1.139 (.392) −2.90⁎⁎⁎
RD: Response options:request additional information
γ2,68 1.764 (.484) 3.65⁎⁎⁎
RD: Information required from recipient:mailing address
γ2,76 .929 (.752) 1.24
Common controls:Campaign volume (linear) γ1,53 1.765 (.241) 7.32⁎⁎⁎ γ3,53 .644 (.199) 3.24⁎⁎⁎
Campaign volume (squared) γ1,54 − .404 (.086) −4.70⁎⁎⁎ γ3,54 − .103 (.054) −1.89Firm volume (linear) γ1,55 .424 (.196) 2.17⁎⁎ γ3,55 .395 (.167) 2.36⁎⁎
Firm volume (squared) γ1,56 − .893 (.184) −4.84⁎⁎⁎ γ3,56 − .271 (.121) −2.25⁎⁎
"End of month"-effect γ1,57 .031 (.014) 2.12⁎⁎ γ3,57 .025 (.014) 1.86Industry dummy γ3,59 .355 (.132) 2.69⁎⁎⁎
Adj. R2 .340 .164 .173.F-statistic (probability) 7.792⁎⁎⁎ 3.619⁎⁎⁎ 8.607⁎⁎⁎
a. OLS-Model estimated with White's (1980) correction for heteroscedasticity (robust standard errors).⁎⁎⁎ sign. at pb .01.⁎⁎ sign. at pb .05.
13S. Feld et al. / Intern. J. of Research in Marketing xxx (2012) xxx–xxx
6.2.5. Observational learningAcross all design categories, we identify those design character-
istics that allow the recipient to learn about the expected content ofthe direct mail piece. Because these types of characteristics poten-tially generate curiosity, they might positively influence the OR. In
Please cite this article as: Feld, S., et al., The effects of mailing design charin Marketing (2012), http://dx.doi.org/10.1016/j.ijresmar.2012.07.003
Table 2, all of these design characteristics are identified in the re-spective column. Across both industries, we find that the larger for-mats in the NPO industry and a higher weight in the FSP industryraise the OR in these industries. In the pooled sample, only a higherweight is confirmed as driving the OR.
acteristics on direct mail campaign performance, Intern. J. of Research

14 S. Feld et al. / Intern. J. of Research in Marketing xxx (2012) xxx–xxx
6.2.6. Industry-specific design characteristicsWe do not capture industry-specific design characteristics for the
OR stage. For the KR in the NPO industry, depicting a helper as a testi-monial enhances the KR. In contrast, the campaigns with a high-valueappearance for the giveaway, campaigns from religious institutions,or campaigns with the primary objective of recruiting new memberslead to lower KRs. For the FSPs, we find that presenting offer details inthe letter or offering the response option to request additional informa-tion exerts a positive effect on the KR. Displaying restrictive terms andconditions or asking the recipient to fill out an application form leadsto significantly lower KRs. This latter finding parallels with the newmembership request in the NPO industry, suggesting that any initialdirect mail solicitations in both industries should not be intrusive.
6.2.7. Common controlsAt the OR stage of the direct mail funnel, the results show that the
ORs drop with increasing campaign mailing volumes in the NPO indus-try only. This drop, however, becomes smaller as the campaign volumeincreases because we find a positive significant quadratic term for thecampaign volume (U-shaped relationship). In the FSP industry, no sig-nificant effects for the campaign volume are found. The firm volume ap-pears to be positively related to the OR in the NPO industry, while itsmain effect is negative in the FSP industry. The positive quadratic coef-ficient for the firm volume in the FSP industry suggests that this nega-tive effect becomes smaller as the firm volume increases (U-shape).Overall, our results suggest that there is mixed evidence between the2 industries on the role of the campaign and the firm volume on theOR. As none of the effects can be found in the pooled sample, it appearsthat these effects are rather industry-specific.
At the KR stage of the direct mail funnel, we detect a curvilinear,inverted U-shape relationship between the campaign volume andthe KR and between the firm volume and the KR in the NPO industry,given that the parameter estimate for the linear (quadratic) term issignificant and positive (negative). These effects are absent in the FSPindustry. However, both effects are also found in the pooled model,but the quadratic effect for the campaign volume is only weakly signif-icant here. We also observe a positive end-of-month effect in the NPOindustry, suggesting that there are higher KRs when the mailings aresent at the end of the month. This positive effect can be detected onlymarginally in the pooledmodel. The industry dummy is only significantin the pooled analysis for the KR, indicating that there are higher overallKRs in the NPO industry.
7. Discussion
7.1. Insights into the direct mail funnel
The unique data set utilized in this study reveals that the previouslyunobservable “black box” of the intermediate stages of the direct mailfunnel appears to contain valuable diagnostic information for mar-keters. This finding compares to the systematic use of intermediatecommunication measures for other media (such as awareness, recall,or recognition).
7.1.1. Industry differences in opening and keeping ratesOverall, the ORs are statistically similar in both industries, but non-
profit organizations manage to attain higher overall KRs (indicated bya significant positive industry dummy, see Table 4). By habit or out ofcuriosity, consumers are generally inclined to open direct mail enve-lopes. In addition, when receiving a mailing from an FSP, many recipi-ents are likely to open the envelope to make sure that no potentiallyimportant information is being missed, e.g., to confirm that they arenot mistakenly discarding personal balance information. Additionally,the negative effect of a colored envelope design is somewhat more neg-ative in the NPO industry and, at the same time, more widely used (75%vs. 35%, as observed in Table 2). Both effects combined might explain
Please cite this article as: Feld, S., et al., The effects of mailing design charin Marketing (2012), http://dx.doi.org/10.1016/j.ijresmar.2012.07.003
the marginally higher ORs in the FSP campaigns. Conversely, one con-ceivable explanation for the higher KRs in the NPO campaigns is thatcharitable solicitations, by their very nature, usually have a broader ap-peal (e.g., helping people) than financial offerings. The latter is typicallymore specific in nature (e.g., signing up for another credit card). More-over, compared to other product categories, the recipients of non-profitmailings often exhibit a higher level of involvement with the charitablesolicitation because of the emotional importance attached to helpingbehavior (e.g., Francis & Holland, 1999).
7.1.2. Disconnect between the opening and the keeping rateAnother noteworthy finding is the lack of a significant relationship
between the ORs and the KRs, i.e., from opening the direct mail tokeeping it. This finding suggests that there are no significant spill-over effects in the direct mail funnel at the aggregate campaignlevel, at least within our sample representing 2 major direct mailindustries. In other words, opening a direct mail piece is obviouslya necessary condition for responding to the offer, but it is not per sea driver of direct mail keeping and, accordingly, the subsequent re-sponse. As a consequence, both stages in the response process shouldbe optimized independently.
It appears that curiosity in the initial contact stage induces con-sumers to look inside the envelope, but afterwards, benefit motivesprevail. In some cases, the outside envelope might even have beenmisleading, resulting in dissonant feelings on the part of the recipient.Discarding the direct mail piece might then be used as a dissonance-reducing strategy (Festinger, 1957).
7.2. Impact of design characteristics on the opening and keeping rates
7.2.1. Overall impact of design characteristicsThe direct mail design characteristics determine the campaign ef-
fectiveness to a substantial degree: for the NPOs (FSPs), they explain13.7% (24.4%) of the total variance of the ORs and 21.5% (16.4%) of theKRs (i.e., when controls are dropped from the equation). Hence, ourstudy furnishes the first empirical support for the claim offered indirect marketing textbooks suggesting that 10 to 25% of direct mailcampaign success can be attributed to creative execution (e.g., Roberts& Berger, 1999, p. 7; Stone & Jacobs, 2008, p. 6).
7.2.2. Impact of specific mailing design categoriesOur results indicate that the different categories of direct mail
characteristics are of differential importance in explaining the ORsand the KRs.Whereas the visual design elements on the outer envelopeappear to be the predominant drivers of the ORs, the other categoriesof design characteristics become comparatively more important forexplaining the KRs. Notably, for the OR, the effects of several visualdesign characteristics differ between the 2 industries. This finding un-derlines the claims in the literature that the effectiveness of directmail design is to a considerable extent industry-specific (e.g., Stone &Jacobs, 2008). Additionally, whereas 3 visual design variables exert asignificant influence on the KRs in the FSP industry, only the pre-stamped response device drives the KR in the NPO industry.
Considering the effects of all visual design characteristics on the ORin concert, it appears that the FSPs are well advised to use plain enve-lopes resembling official business mail and to avoid design elementsthat signal the promotional quality of the mail (e.g., extraordinaryformats, teasers, and colorful design). For the NPO mailings, a morenuanced picture emerges: while colorful envelope design should beavoided in most cases, some design features such as special envelopeformats, teasers with questioning techniques or promotional designson the back side can help to enhance the opening behavior.
With respect to the sender identity-related variables, our findingsare somewhat ambivalent. The ORs can be increased by withholdingthe sender's name on the envelope. This tactic of creating curiosityis particularly effective in the FSP campaigns, but generates no
acteristics on direct mail campaign performance, Intern. J. of Research

15S. Feld et al. / Intern. J. of Research in Marketing xxx (2012) xxx–xxx
significant effect in the NPO campaigns. For the letter, however, ourresults unanimously show that placing the company's logo in the let-terhead can significantly enhance the KRs in both industries. Thisfinding underscores the value of brand elements in marketing com-munications (e.g., Keller, 2007; Pieters & Wedel, 2004).
Our results regarding personalization are somewhat mixed. Onthe outer envelope, a personalization impression can be conveyedthrough the type of postage payment employed. In the FSP industry,the direct mail envelope should not appear to the recipient to bebulk mail. This impression could be caused by using a “postagepaid” imprint instead of ink or real stamps, resulting in reduced ORsfor the campaigns. Additionally, among the various personalizationoptions for the other components of the mailing, only supplementpersonalization significantly and consistently enhances the KRs inboth industries studied. Because all mailings in our data set are per-sonally addressed by default, the vast majority of them also exhibitthe standard personalization features such as a personal salutaryaddress, the current calendar date, the sender's signature and a re-sponse device with the addressee's name, etc. As a consequence,these personalization features are rather static and, thus, cannot exertdifferential effects across campaigns. By contrast, the personalizationof the supplement is only used by relatively few companies in our sam-ple and can thus serve as a differentiating factor. Hence, the personaliza-tion of specific elements can be an effective tactic compared to usingstandardized mailings. In sum, our results show that personalizationis primarily a driver of the KR, thereby confirming the literature onsurvey response rates, which states that personalization is important(e.g., Dillman, 2007).
Interestingly, we find that 2 information intensity variables are pos-itively related to the KRs. These variables are, however, different for the2 industries. While the letter length positively influences the KR in theNPO industry, the length of the brochure positively influences the KRin the FSP industry. The finding of these 2 positive effects is noteworthybecause it contrasts with the widely accepted notion of informationoverload in advertising and consumer behavior (e.g., Hoyer &MacInnis, 2007). While this view has intuitive appeal, it should benoted that direct mail advertising usually receives deliberate and activeattention by consumers once the envelope has been opened. In addi-tion, not all information must be processed at the moment of openingthe direct mail piece. If there is a brochure or a long letter in the enve-lope, it could well be that people keep the mail piece to read all of theinformation when they have the time. As a result, information overloaddue to the limited capacity of short-termmemory is of less concern thanit is in the case in real-time media such as TV or online advertising.
With respect to our controls, the effects of the campaign- andsender-level mailing volumes differ across industries and funnelstages. Again, this difference underlines the diagnostic value of analyz-ing the intermediate stages of the direct mail funnel. For the NPO cam-paigns, we find a positive relationship between the firm volume andthe OR. In other words, the direct mail from large and well-knownnon-profit organizations has a higher likelihood of being opened. Wealso find a U-shaped relationship between the campaign volume andthe ORs; up to some point, the ORs tend to drop with the increasingcampaign volumes, suggesting that there are wastage effects due toless selective targeting. For very large campaigns, however, the ORstend to increase again. This result could be because large campaignsare typically accompanied by cross-media support (e.g., web, TV, andradio advertising), and could thus benefit from heightened awareness.For the KRs of NPO campaigns, we find a pronounced inverted U-shaperelationship with both campaign volume and firm volume. On the onehand, the KRs start to drop beyond some optimal volume—most likelyalso due to a less targeted address selection. As large-volume cam-paigns inevitably address the less responsive consumer segments,the wastage effects drive down the KRs. On the other hand, it appearsthat charitable campaigns must reach some reasonable size and comefrom bigger organizations to be perceived by the recipient as
Please cite this article as: Feld, S., et al., The effects of mailing design charin Marketing (2012), http://dx.doi.org/10.1016/j.ijresmar.2012.07.003
trustworthy and relevant. Up to some point, at which the wastage ef-fects start to dominate, it appears that trust and the positive image cre-ated through the brand name of a large and well-known non-profitorganization enhance the effectiveness of charitable solicitations(Bendapudi, Singh, & Bendapudi, 1996). With regard to the timing ofcampaigns, we detect a significant “end of month” effect for the KR inthe NPO sample, in that the direct mail pieces are more likely to bekept by the panel participants if the mail is received closer to the endof the month. Accordingly, if researchers and practitioners analyze thistype of panel data, they need to control for this effect.
Compared to the NPO campaigns, the control variable effects forthe FSPs appear to be less pronounced. We do not find any significantvolume or timing effects on the KRs. In contrast to NPOs, we do notdetect the positive linear effect of firm volume on the OR but find aU-shaped effect. It appears that the small and large FSPs (in termsof mailing volume) are better able than the medium-sized FSPs to en-tice consumers to examine their offers. For the large FSPs, the positivefamiliarity effect of well-known institutions is likely to play out. Smallfinancial service providers, on the other hand, could be targeting verywell well-defined segments with direct mail pieces that signal exclu-sive offerings (e.g., regional players or private banks).
8. Implications
We show how researchers and firms can systematically investigatethe effect of design characteristics on direct mail performance. Re-searchers can use the previously unavailable panel data on the interme-diate stages of the directmail funnel to better investigate heterogeneouseffects across the funnel. The panel data also allow them to comparedifferences at the intermediate communication stages. Managers canleverage the commercially available direct mail panel data to augmenttheir managerial tool set by covering a previous blind spot, namely theactive management of design for direct mailings. Our approach in com-bination with the panel data offers them an opportunity to furtherimprove the design of mailing characteristics as an important meansto increase the OR and the KR as drivers of response rates.
Moreover, our study findings offer some specific guidelines for themarketing managers who are responsible for running direct mail cam-paigns. Researchers and managers are likely to gain new insights, asseveral of our design recommendations are in marked contrast withthe current methods used to design the majority of direct mailings bycompanies. Even some non-significant or negative findings might beworth noting: for example, as shown in Table 2, 43% of all campaignsfromNPOs (172 out of 396) contain some type of give-away to potentialdonors. However, the presence of giveaways does not appear to en-hance the response process. To the contrary, our results suggest thatthe giveaways with a high-value appearance even lead to lower KRs,thus casting doubt on the benefits from the costly inclusion of give-aways. Likewise, over two thirds of direct mail letters from FSPs (198out of 281) contain some type of postscript, as this is commonly as-sumed to be an effective technique. Our results challenge this commonpractice and paint a more nuanced picture: on average, the use of post-scripts is associated with lower KRs in the FSP industry unless somenew aspect or information regarding the offer is presented (seeTable 4). Other features such as attaching payment devices to cover let-ters or the depiction of awards (e.g., “rated as best investment fund”)have been proposed to stimulate the response process but fail to exertsignificant effects in our study. As these and some other examplesgiven below reveal, several of our findings are rather unexpected.
Our guidelines for managers can be summarized in some “directmail design recommendations” to increase the intermediate perfor-mance of direct mail campaigns. Based on our study, the generalizablesuggestions across campaigns and industries include the following.
• Use color with caution. This recommendation is based on our find-ing that a colorful envelope design reduces the ORs across both
acteristics on direct mail campaign performance, Intern. J. of Research

16 S. Feld et al. / Intern. J. of Research in Marketing xxx (2012) xxx–xxx
industries. As shown in Table 2, colored envelopes are actuallyemployed in the majority of campaigns (i.e., in 395 out of 677 cam-paigns), but our results indicate that this prevailing practice mightactually be counterproductive.
• Use your sender identity with care. Our results indicate that eliminat-ing your name from the envelope can facilitate the ORs, particularlyin FSP campaigns. For the letter, by contrast, the findings unanimouslyshow that the KRs are higher if the letterhead contains a company logo.Hence, the direct marketers should capitalize on the positive brandcommunication effects in the letter to signal familiarity and gaintrust. To establish this type of qualified contact, however, itmight actu-ally be beneficial to create curiosity by not identifying the sender of thepromotionalmessage up front on the envelope. Analogous to a person-al selling situation, this recommendation is similar to getting a “foot inthe door” as a necessary condition for presenting the offer.
• Provide sufficient information. In both industries, we find someevidence that providing more information increases the KR. NPOsshould use long rather than short letters to convey enough informa-tion. Providing information is important for non-profit organizationsbecause the prospective donors must first believe the charity's mes-sage depicting need (Bendapudi et al., 1996). Longer texts could behelpful to present a variety of details on the non-profit organizationitself as well as regarding the cause of the need and the objective ofthe corresponding donation. Similarly, offering comprehensive anddetailed information is of paramount importance for financial serviceproviders to reduce the risk perceptions on the part of their prospec-tive customers (e.g., Gemuenden, 1985). The FSPs should provideoffer details in the cover letter, use comprehensive brochures toconvey additional information, and provide a “request information”response option to accommodate the further information demandsof the direct mail recipients.
• Use personalization as a differentiating factor.Most organizations thatsend out personally addressed directmailings employ certain person-alization techniques by default (e.g., personal salutary address). Thesepersonalization features have become commonplace and, thus, canhardly continue to serve as distinguishing design factors. However,personalization of the additional parts of the mailing such as supple-ments is still not commonly employed; as shown in Table 2, only 64out of 479 campaigns containing a supplement are personalized tothe recipient. Under these circumstances, personalization can serveas an effective differentiator.
• Take little steps when approaching prospects. Another interesting par-allel is that neither the NPOnor the FSP campaigns should be too intru-sive. In prospecting, charitable direct mail solicitations should aim atone-time donations rather than formal and enduring new member-ships (see Table 4). Similarly, the FSPs should be cautious about imme-diately requesting that the prospective customer sign a contract in thedirect mail solicitations. Likewise, mentioning restrictive terms andconditions up front in the letter should be avoided. The focus of finan-cial mailings should rather be on initiating a promising customeracquisition process by providing sufficient information in the letterand supplement and by offering a request for further information asa response option in case the prospect is interested (see Table 4). Asshown in Table 2, common industry practice is not consistent withthis finding: out of 225 FSP campaigns containing a response device,87 campaigns aim to have an application form filled out right away,whereas only 31 campaigns offer a request for additional informationas a response option. Our general recommendation, however, is thatthe solicitations that aim at substantial immediate commitments byprospects should only be considered if thefinal payoff of the completedapplications or memberships overcompensates for the lower KRs.
9. Future research
The data-driven constraints in our study indicate areas for future re-search. First, our study is thefirst to investigate directmail characteristics
Please cite this article as: Feld, S., et al., The effects of mailing design charin Marketing (2012), http://dx.doi.org/10.1016/j.ijresmar.2012.07.003
inGermany.While Germany is one of the largest economies in theworld,it has to be taken into account that the households in Europe receive amuch smaller number of directmail solicitations than those in theUnitedStates (Hesse, Krafft, & Peters, 2007). One could argue that consumers'preferences and attitudes towards direct mail advertising vary betweencountries. Accordingly, the effects of specific mailing characteristicson the various measures such as opening, keeping, and response ratescan differ. Hence, there is a need for an international study that coversmultiple countries, preferably from different continents including theAmericas and Asia. Second, the actual response rates were not availableto us.Whilewe argue that theORs and the KRs of the campaigns as inter-mediate measures reflect the effectiveness of envelope and direct maildesign characteristics more accurately, the inclusion of actual responserates would have been desirable to put our results into perspective.Third, while our study comprises a wide range of design variables, it ispossible that there are additional design features that also influence cam-paign performance. Similarly, different operationalizations of our vari-ables could produce different results. For example, letter length wasmeasured by a dummy variable indicating whether the letter is longerthan 1 page. We demonstrate positive effects of letter length on theKRs. More fine-grained measures such as the number of lines or wordswould have permitted us to test for nonlinearities such as invertedU-shape effects. Fourth, individual-level data are not available to us be-cause GfK only provided us with aggregate data at the campaign level.A disaggregate analysis could provide deeper insights into the effective-ness of mailing characteristics across individuals. Customer characteris-tics as well as unobservable factors, such as attitudes or preferences,can be included in this type of estimation framework and could resultin an even better understanding of consumer behavior in the contextof direct mail advertising.
Acknowledgments
The authors thank the Editor, the Area Editor and the anonymousreferees for their support, guidance, and encouragement. AshwinAravindakshan, Norris I. Bruce, Bas Donkers, Edward Fox, EdwardC. Malthouse, Prasad A. Naik, Kalyan Raman, the participants of the2008 DDV scientific congress, 2009 Marketing Science at Universityof Michigan, 2009 Joint Statistical Meeting in Washington DC, 2009PhD Seminar Rothenberge, 2009 SALTY Conference at Kiel University,and 2010 DMEF Conference at San Francisco provided valuable feed-back on earlier versions. The authors thank Deutsche Post DHL, theSVI Siegfried Vögele Institute, and GfK for their support with financialresources, insights and data. The authors thank Christina Gnacke andBrigitte Jansen for their initial support in collecting and preparingthe raw data.
Appendix A. Supplementary data
Supplementary data to this article can be found online at http://dx.doi.org/10.1016/j.ijresmar.2012.07.003.
References
Ailawadi, K. L., Pauwels, K. H., & Steenkamp, J. -B. E. M. (2008). Private-label use andstore loyalty. Journal of Marketing, 72(6), 19–30.
Aitchinson, J. (1999). Cutting edge advertising: How to create the world's best print forbrands in the 21st century. New York: Prentice Hall.
Ansari, A., & Mela, C. F. (2003). E-Customization. Journal of Marketing Research, 40(2),131–145.
Assael, H., Kofron, J. H., & Burgi, W. (1967). Advertising performance as a function ofprint ad characteristics. Journal of Advertising Research, 7(2), 20–26.
Beard, J. D., Williams, D. L., & Kelly, J. P. (1990). The long versus the short letter: A largesample study of a direct-mail campaign. Journal of Direct Marketing, 4(1), 13–20.
Bekkers, R., & Crutzen, O. (2007). Just keep it simple: A field experiment on fundraisingletters. International Journal of Nonprofit and Voluntary Sector Marketing, 12(4),371–378.
Bell, G. H., Ledolter, J., & Swersey, A. J. (2006). Experimental design on the front lines ofmarketing: Testing new ideas to increase direct mail sales. International Journal ofResearch in Marketing, 23(3), 309–319.
acteristics on direct mail campaign performance, Intern. J. of Research

17S. Feld et al. / Intern. J. of Research in Marketing xxx (2012) xxx–xxx
Belsley, D. A., Kuh, E., &Welsh, R. E. (2004). Regression diagnostics: Identifying influentialdata and sources of collinearity. Hoboken: John Wiley & Sons.
Bendapudi, N., Singh, S. N., & Bendapudi, V. (1996). Enhancing helping behavior: Anintegrative framework for promotion planning. Journal of Marketing, 60(3), 33–49.
Breusch, T. S., & Pagan, A. R. (1980). The Lagrange multiplier test and its applicationsto model specifications in econometrics. The Review of Economic Studies, 47(1),239–253.
Briggs, R., Krishnan, R., & Borin, N. (2005). Integrated multichannel communicationstrategies: Evaluating the return on marketing objectives - the case of the 2004FORD F-150 launch. Journal of Interactive Marketing, 19(3), 81–90.
Broadbent, D. E. (1958). Perception and communication. London: Pergamon.Bult, J. R., van der Scheer, H., & Wansbeek, T. (1997). Interaction between target and
mailing characteristics in direct marketing, with an application to health carefundraising. International Journal of Research in Marketing, 14(4), 301–308.
Bult, J. R., & Wansbeek, T. (1995). Optimal selection for direct marketing. MarketingScience, 14(4), 378–394.
Capon, N., & Farley, J. U. (1976). The impact of message on direct mail response. Journalof Advertising Research, 16(5), 69–75.
DeWulf, K., Hoekstra, J. C., & Commandeur, H. R. (2000). The openingand readingbehaviorof business-to-business directmail. IndustrialMarketingManagement, 29(2), 133–145.
Dekimpe, M. G., & Hanssens, D. M. (1995). The persistence of marketing effects onsales. Marketing Science, 14(1), 1–21.
Deutsche Post (2006). Direct Marketing Monitor International 2006. Bonn: Deutsche Post.Diamond,W. D., & Iyer, E. S. (2007). Creating effective direct Mail charitable solicitations:
The effects of enclosures and different appeals. Journal of Nonprofit & Public SectorMarketing, 18(1), 81–100.
Dillman, D. A. (2007). Mail and internet surveys: The tailored design method (2nd ed.).New York: John Wiley & Sons.
DMA (2006). Response rate trends report. New York: Direct Marketing Association.DMA (2011). Statistical fact book. New York: Direct Marketing Association.Donkers, B., Paap, R., Jonker, J. -J., & Franses, P. H. (2006). Deriving target selection rules
from endogenously selected samples. Journal of Applied Econometrics, 21(5), 549–562.Elsner, R., Krafft, M., & Huchzermeier, A. (2004). Optimizing Rhenania's direct marketing
business through dynamic multilevel modeling (DMLM) in a multicatalog-brandenvironment.Marketing Science, 23(2), 192–206.
Festinger, L. (1957). A theory of cognitive dissonance. Stanford: Stanford University Press.Finn, A. (1988). Print ad recognition readership scores: An information processing per-
spective. Journal of Marketing Research, 25(2), 168–177.Francis, N., & Holland, N. (1999). The diary of a charity donor: An exploration of research
information from the royal mail consumer panel and mail characteristics survey.International Journal of Nonprofit and Voluntary Sector Marketing, 4(3), 217–223.
Geller, L. K. (2002). Response: The complete guide to profitable direct marketing. New York:Oxford University Press.
Gemuenden, H. G. (1985). Perceived risk and information search: A systematic meta-analysis of the empirical evidence. International Journal of Research in Marketing,2(2), 79–100.
Gendall, P. (2005). The effect of covering letter personalisation inmail surveys. InternationalJournal of Market Research, 47(4), 367–382.
Gönül, F. F., & Ter Hofstede, F. (2006). How to compute optimal catalog mailing deci-sions. Marketing Science, 25(1), 65–74.
Gopalakrishna, S., & Lilien, G. L. (1995). A three-stage model of industrial trade showperformance. Marketing Science, 14(1), 22–42.
Gordon, P. J., & Kellerman, B. J. (1990). Impact of prompt-response and quantity premiumson direct mail response rates. Journal of Direct Marketing, 4(3), 41–45.
Hausman, J. A. (1978). Specification tests in econometrics. Econometrica, 46(6), 1251–1271.Helgeson, J. G., Voss, K. E., & Terpening, W. D. (2002). Determinants of mail-survey
response: Survey design factors and respondent factors. Psychology and Marketing,19(3), 303–328.
Hesse, J., Krafft, M., & Peters, K. (2007). International direct marketing: Principles, bestpractices, marketing facts. Berlin: Springer.
Hoyer,W.D., &MacInnis, D. J. (2007).Consumer behavior (4th ed.). Boston:Houghton-Mifflin.Hozier, G. C., Jr., & Robles, F. (1985). Direct mail response factors for an industrial ser-
vice. Industrial Marketing Management, 14(2), 113–118.Itti, L., & Koch, C. (2001). Computational modelling of visual attention. Nature Reviews
Neuroscience, 2(3), 194–203.James, E. L., & Li, H. (1993). Why do consumers open direct mail? Contrasting perspec-
tives. Journal of Direct Marketing, 7(2), 34–40.Jen, L., Chou, C. -C., & Allenby, G. M. (2009). The importance of modeling temporal de-
pendence of timing and quantity in direct marketing. Journal of Marketing Research,46(4), 482–493.
Jones, S. K. (1997). Creative strategy in direct marketing (2nd ed.). Lincolnwood: NTCBusiness Books.
Keller, K. L. (2007). Strategic brand management: Building, measuring, and managingbrand equity (3rd ed.). Upper Saddle River: Prentice Hall.
Kover, A. J. (1995). Copywriters' implicit theories of communication: An exploration.Journal of Consumer Research, 21(4), 596–611.
Krafft, M., Albers, S., & Lal, R. (2004). Relative explanatory power of agency theory andtransaction cost analysis in German salesforces. International Journal of Research inMarketing, 21(3), 265–283.
Kramer, T., Spolter-Weisfeld, S., & Thakkar, M. (2007). The effect of cultural orientationon consumer responses to personalization. Marketing Science, 26(2), 246–258.
Ledolter, J., & Sweesey, A. J. (2006). Using a fractional factorial design to increase directmail response at Mother Jones Magazine. Quality Engineering, 18(4), 469–475.
Please cite this article as: Feld, S., et al., The effects of mailing design charin Marketing (2012), http://dx.doi.org/10.1016/j.ijresmar.2012.07.003
MacInnis, D. J., & Jaworski, B. J. (1989). Information processing from advertisements:Toward an integrative framework. Journal of Marketing, 53(4), 1–23.
MacKenzie, S. B. (1986). The role of attention in mediating the effect of advertising onattribute importance. Journal of Consumer Research, 13(2), 174–195.
McMellon, C. A., & Ducoffe, R. H. (1995). Sorting the mail: A study of categorization anddeliberative processing. Journal of Direct Marketing, 9(1), 56–66.
Miniard, P. W., Bhatla, S., Lord, K. R., Dickson, P. R., & Unnava, R. (1991). Picture-basedpersuasion processes and the moderating role of involvement. Journal of ConsumerResearch, 18(1), 92–107.
Naik, P. A., & Peters, K. (2009). A hierarchical marketing communications model of on-line and offline media synergies. Journal of Interactive Marketing, 23(4), 288–299.
Nash, E. (2000). Direct marketing: Strategy, planning, execution (4th ed.). New York:McGraw-Hill.
Nielsen (2009). Status report direct mail—first half-year 2009. Hamburg: Nielsen MediaResearch.
Percy, L., & Rossiter, J. R. (1980). Advertising strategy: A communication theory approach.New York: Praeger.
Percy, L., & Rossiter, J. R. (1983). Effects of picture size and color on brand attitude re-sponses in print advertising. Advances in Consumer Research, 10(1), 17–20.
Pesaran, M. H., Pierse, R. G., & Lee, R. G. (1993). Persistence, cointegration, andaggregation: A disaggregated analysis of output fluctuations in the U.S. economy.Journal of Econometrics, 56(1–2), 57–88.
Pieters, R., & Wedel, M. (2004). Attention capture and transfer in advertising: Brand,pictorial, and text-size effects. Journal of Marketing, 68(2), 36–50.
Pieters, R., Wedel, M., & Zhang, J. (2007). Optimal feature advertising design undercompetitive clutter. Management Science, 53(11), 1815–1828.
Roberts, M. L., & Berger, P. D. (1999). Direct marketing management (2nd ed.). UpperSaddle River: Prentice Hall.
Rossiter, J. R. (1982). Visual imagery: Applications to advertising. Advances in ConsumerResearch, 9(1), 101–106.
Rossiter, J. R., & Percy, L. (1980). Attitude change through visual imagery in advertising.Journal of Advertising, 9(2), 10–16.
Rust, R. T., & Verhoef, P. C. (2005). Optimizing the marketing interventions mix inintermediate-term CRM. Marketing Science, 24(3), 477–489.
Seaver, B. L., & Simpson, E. (1995). Mail order catalog design and consumer responsebehavior: Experimentation and analysis. Journal of Direct Marketing, 9(3), 8–20.
Sherman, E., Greene, J. N., & Plank, R. E. (1991). Exploring business-to-business directmail campaigns: Comparing one-sided, two-sided, and comparative messagestructures. Journal of Direct Marketing, 5(2), 25–30.
Smith, G. E., & Berger, P. D. (1996). The impact of direct marketing appeals on charita-ble marketing effectiveness. Journal of the Academy of Marketing Science, 24(3),219–231.
Smith, T. M., Gopalakrishna, S., & Chatterjee, R. (2006). A three-stage model of integratedmarketing communications at the marketing–sales interface. Journal of MarketingResearch, 43(4), 564–579.
Smith, R., MacKenzie, S. B., Yang, X., Buchholz, L. M., & Darley, W. K. (2007). Modelingthe determinants and effects of creativity in advertising. Marketing Science, 26(6),819–833.
Stone, B., & Jacobs, R. (2008). Successful direct marketing methods (8th ed.). New York:McGraw-Hill.
Van der Lans, R., Pieters, R., & Wedel, M. (2008). Competitive brand salience. MarketingScience, 27(5), 922–931.
Van der Scheer, H. R., Hoekstra, J. C., & Vriens, M. (1996). Using “opt out” reply cards indirect mail: Optimal design, target selection, and profit implications. Journal ofDirect Marketing, 10(3), 18–27.
Van Diepen, M., Donkers, B., & Franses, P. H. (2009a). Dynamic and competitive effectsof direct mailings: A charitable giving application. Journal of Marketing Research,46(1), 120–133.
Van Diepen,M., Donkers, B., & Franses, P. H. (2009b). Does irritation induced by charitabledirect mailings reduce donations? International Journal of Research in Marketing,26(3), 180–188.
Vriens, M., van der Scheer, H. R., Hoekstra, J. C., & Bult, J. R. (1998). Conjoint experiments fordirect mail response optimization. European Journal of Marketing, 32(3/4), 323–339.
White, H. L., Jr. (1980). A heteroskedasticity-consistent covariance matrix and a directtest for heteroskedasticity. Econometrica, 48(4), 817–838.
White, T. B., Zahay, D. L., Thorbjörnsen, H., & Shavitt, S. (2008). Getting too personal:Reactance to highly personalized email solicitations. Marketing Letters, 19(1), 39–50.
Williams, D. L., Beard, J. D., & Kelly, J. P. (1991). The readability of direct-mail copy: Atest of its effect on response rates. Journal of Direct Marketing, 5(1), 27–34.
Yang, X., & Smith, R. E. (2009). Beyond attention effects: Modeling the persuasive andemotional effects of advertising creativity. Marketing Science, 28(5), 935–949.
Yu, J., & Cooper, H. (1983). A quantitative review of research design effects on responserates to questionnaires. Journal of Marketing Research, 20(1), 36–44.
Zellner, A. (1962). An efficient method of estimating appearingly unrelated regressionsand tests for aggregation bias. Journal of the American Statistical Association, 57(298),348–368.
Zhang, J., & Wedel, M. (2009). The effectiveness of customized promotions in onlineand offline stores. Journal of Marketing Research, 46(2), 190–206.
Zhang, J., Wedel, M., & Pieters, R. (2009). Sales effects of attention to feature advertise-ments. Journal of Marketing Research, 46(5), 669–681.
acteristics on direct mail campaign performance, Intern. J. of Research