intermarket perspective - hascol-...
TRANSCRIPT

Inter Market Perspective
To find our Research on Bloomberg, please type - IMKP <GO> www.jamapunji.pk
ANALYST CERTIFICATION AND REQUIRED DISCLOSURES BEGIN ON PAGE 17 & 18
Research Entity Number – REP-085
20 February 2017
Muneeb Naseem
+92-21-37131600 Ext. 305
..
• We reinstate coverage on HASCOL – the 3rd
largest OMC in Pakistan – with a Sell
stance and TP of PkR316/sh (downside: 12%). HASCOL enjoys unmatched ability to
sustain sales growth momentum and management track record is excellent;
however, changing industry dynamics will eventually decelerate growth, which itself
will become more expensive to sustain, in our view.
• Four main factors that will slow down growth are (i) other OMCs will replicate
HASCOL’s storage advantage, (ii) it will potentially be competing with 21 OMCs who
have recently obtained OMC license, (iii) chronically shrinking FO market, and (iv) a
less diversified sales mix than peers.
• HASCOL’s CY17F P/E of 23.6x appears stretched even as 3yr NPAT CAGR is projected
at 26% (PEG of 0.91x). We believe that the present pace of earnings growth is
difficult to sustain beyond the medium-term, particularly given the risks attached
with high leverage to finance the rapid expansion and the working capital
constraints of an imports based model.
Organic growth to slow down, reinstate coverage with Sell stance
We expect Hascol Petroleum (HASCOL) to continue gaining market share and reach an
overall level of 13% (from 7.5% currently) in the next three years after which resurgent
competition should moderate incremental growth. HASCOL’s sales have doubled since
CY13 led by aggressive retail and storage expansion amid low oil prices and complacent
competition. Its market share rapidly swelled from 2.5% to 7.5%, but incumbent
competition is now bringing its act together. Moreover, OGRA’s recent move to
encourage competition by granting licenses to 21 new players may also hurt growth
prospects, where new entrants will likely attempt to replicate HASCOL’s growth strategy
to gain market share.
Growth is not diversified…
Out of the three major products of HASCOL, one – furnace oil (FO) - is in a secular decline
due to GoP’s policy of rationalizing power fuel mix. While HASCOL has historically focused
on HSD/Mogas sales, it has not been able to penetrate Lubricants, Jet fuel and LPG
markets – which are difficult territories but also promise a second leg of growth for OMCs.
Failure to adequately substitute FO sales with other products will be a drag on growth.
…and will be expensive in future
HASCOL’s robust sales growth (last 3yr sales CAGR: 26%) has masked the high cost of
growth. Higher leverage is necessary to finance the aggressive expansion (capital leases
and issuance of Sukuks) complemented by working capital requirements (inventory and ST
borrowing), given predominantly import based business model (75% of purchases are
imported). Hence while sales growth will remain on a steep gradient, earnings growth will
not completely mimic the former going forward due to high operation and finance costs.
Valuations are pricing in a blue sky scenario
HASCOL trades at a CY17F P/E of 23.6x, which appears stretched notwithstanding
projected 3yr NPAT CAGR of 26% (PEG 0.91x) and synergies associated with partnering
with Vitol. In our view, the market has incorporated an implied market share of 15%+
along with phenomenal success of Lubricants business – which will be very difficult with
resurgent competition, in our view.
What can change our thesis?
(i) M&A activity where HASCOL potentially acquires a competitor, (ii) success in the
lubricants market exceed expectations and (iii) rentals from expanded storage.
Organic growth is already priced in; Sell
Hascol Petroleum Limited
Hascol Petroleum Limited
Price (PkR/sh) 357.96
TP (PkR/sh) 316.00
Stance Sell
Downside 11.7%
Fwd D/Y 2.5%
Total Return -9.2%
Bloomberg / Reuters HPL PA / HASC.KA
Mkt Cap (US$mn) 412.1
52wk Hi-Low (PkR/sh) 373.32-131.64
3m Avg. Daily Vol ('000 shrs) 890
3m Avg. Traded Val (US$mn) 3.127
Key Ratios CY15A CY16F CY17F CY18F
EPS (PkR) 9.41 12.12 15.15 18.62
EPS Gth (%) 28.9% 24.9% 22.9% 30.6%
P/E (x) 38.06 29.52 23.63 19.22
BVPS (PkR) 47.81 59.90 75.01 93.58
PBV (x) 7.49 5.98 4.77 3.83
DPS (PkR) 5.00 7.30 9.00 11.20
DY (%) 1.4% 2.0% 2.5% 3.1%
ROE (%) 19.6% 20.2% 20.1% 19.8%
ROA (%) 4.3% 4.5% 4.8% 4.7%
Debt/ EQT. (%) 39.8% 55.9% 46.4% 29.4%
EV/EBITDA (x) 23.25 12.68 11.82 10.30
Gross Margin 3.7% 4.5% 3.9% 3.6%
Source: IMS Research
HASCOL vs. KSE100 Index
-30%
0%
30%
60%
90%
120%
150%
180%
Feb
-16
Ap
r-1
6
Ma
y-1
6
Jul-
16
Au
g-1
6
Sep
-16
No
v-1
6
De
c-1
6
Feb
-17
KSE100 Index HASCOL
Source: IMS Research

2 | P a g e
Perspective
…which have lower margins
1.0%
1.5%
2.0%
2.5%
3.0%
3.5%
4.0%
CY1
4
CY1
5
CY1
6
CY1
7F
CY1
8F
CY1
9F
CY2
0F
CY2
1F
Mogas Margins HSD Margins FO Margins
Source: IMS Research
Finance costs will rise on expansion
0.0
1.0
2.0
3.0
4.0
5.0
6.0
7.0
CY14 CY15 CY16 CY17F CY18F CY19F CY20F CY21F
Finance Cost/share (PkR/Shr)
Source: IMS Research
Rapid increase in market share for all products…
0%
2%
4%
6%
8%
10%
12%
14%
CY13 CY14 CY15 CY16
FO MOGAS HSD
Source: OCAC, IMS Research
..but sales growth expected to taper off after 2-3yrs
0%
10%
20%
30%
40%
50%
60%
70%
80%
90%
CY15 CY16 CY17F CY18F CY19F CY20F CY21F
Mogas Sales Growth HSD Sales Growth
Source: IMS Research
Higher reliance on Mogas and HSD sales…
12%
40%
48%
0.5%
FO MOGAS HSD Lubricants
Source: IMS Research, OCAC
Success in lubricants market will be crucial for profitability
0
5,000
10,000
15,000
20,000
25,000
30,000
CY14 CY15 CY16 CY17F CY18F CY19F CY20F CY21F
Lubricant Volumes (M.Tons)
Source: IMS Research, OCAC

3 | P a g e
Perspective
Company Profile
Hascol Petroleum Ltd. (HASCOL) is one of the fastest growing Oil Marketing Companies
(OMC) in Pakistan, currently ranked at No.3 in terms of overall sales of POL products.
Incorporated in 2001 and converted into a public limited company in 2007, HASCOL has
achieved supernormal growth over the last 5yrs (tenfold increase in sales since CY10)
following a unique business model of relying on imports rather than local refineries and
expanding retail channels in suburbs and highways rather than city centers. HASCOL
currently has 424 fuel outlets with exclusive rights for M-2 motorway and has a
cumulative storage capacity of 136,600MT of fuel. HASCOL is currently the largest
importer of POL products in Pakistan after PSO, backed by Vitol Group which recently
acquired 25% stake in the company (intial 15% was followed by exercise of option for
another 10%).
HASCOL is spearheaded by Mr. Mumtaz Hasan Khan who has 50 years experience in the
Oil industry with start of his career in Burmah Shell Oil storage and Distribution
Company. He formed Hascombe Ltd. in 1980 as an oil trading company supplying crude
oil to major oil companies like Shell and Elf. Mr. Mumtaz also serves as the Director of
Pakistan Refinery Ltd (PRL). The current management has shown an unmatched ability
to identify opportunities and capitalize on competitor weaknesses.
Vitol Dubai Ltd., a global giant acquired a strategic 15% stake in HASCOL in February
2016 and it recently exercised the call option to acquire a further 10% stake in the
company. Vitol is one of the largest oil trading company in the world with terminals in
about 40 countries of the world trading 6mn bpd of POL products. Soon after the
acquisition, Vitol also signed a joint venture agreement with HASCOL to set up the
largest storage facility in the country at Port Qasim (200k MT).
HASCOL Journey: Supernormal growth HASCOL was granted the OMC license in 2005 and has been marketing POL products in
Pakistan ever since, with noticeable growth since its IPO in 2014. In a short span of
time, HASCOL has given intense competition to established OMCs like Pakistan State
Oil (PSO), Attock Petroleu m (APL) and Shell Pakistan (SHEL) by rapidly opening new fuel
stations - commissoning as many as 424 stations as of 2016. The company also has a
sizeable 136,600 MT of storage under operation enabling it to compete head on with
larger OMCs of Pakistan.
M
Hascol Revenue Breakup
12%
40%
48%
0.5%
FO MOGAS HSD Lubricants
Source: IMS Research, Company Accounts
Shareholding Pattern
General
Public
27%
Directors
27%
Marshal Gas
Pvt Ltd.
6%
Fossil Energy
Pvt Ltd.
7%
Vitol Dubai
Ltd.
25%
Others
8%
Source: IMS Research, Company Accounts
Market Share: HASCOL has disrupted the industry in the last 3 years
PSO,
63.1%
SHEL,
10.1%
APL,
8.9%
HASCOL,
2.5%
CY13
PSO,
56.5%
SHEL,
9.6%
APL,
7.2% HASCOL,
7.5%
CY16
Source: IMS Research, OCAC

4 | P a g e
Perspective
At the time of its IPO in 2014 (raised PkR1,406mn for storage and retail network),
HASCOL’s strategy was significantly different from what it is now. In a high oil price
scenario, the company was largely dependent on local refineries for supply of POL
products due to limited muscle to import fuel on its own. The company had only
imported 3 cargoes of fuel by then. It was also establishing a small 9,500 MT fuel
storage at Machike. Post IPO however, changes in both global and local dynamics (low
oil prices and lingering circular debt handicap for peers) led to an entirely different,
more aggressive strategy resulting in the shift to a more import based model and drive
towards large storage capacities.
Pre-IPO (2014) Now IPO Plan PkRmn
Retail Outlets 210 424 Machike Terminal 200
Storage Facilities (MT) 69,900 136,600 Retail Stations 100
Market Share 2.5% 7.5% Working Capital 200
Total Requirement 500
Source: IMS Research, Company Website, OCAC, OGRA
HASCOL has been able to achieve an overall market share of 7.5% in a short span of
time by following a unique supply chain strategy, penetrating deep in the market. On
the retail front, HASCOL targeted suburban areas and highways to generate higher
volumes per fuel station; it was also able to win the exclusive contract for M-2
motorway, which was earlier held by PSO. In order to maintain sustainable stream of
revenues, HASCOL targeted institutional customers and pushed sales with efficient
delivery and availability of products with storage terminals at strategic locations across
the country. Growth was conducive due to weaker competition at the time when larger
OMCs like PSO were in the midst of Circular Debt (a cash crisis in the power sector
which absorbs a large portion of overall OMC sales, majorly Furnace Oil) and
multinationals were looking to exit the market. HASCOL also followed an import based
model with lesser dependence on local refineries which was aided by a low oil price
scenario, to break the monopoly of larger OMCs.
HASCOL’s current revenue stream consists mainly of three major POL products: Mogas,
HSD and FO. It also plans to enter the LPG and Jet fuel market, where regulatory issues
and long-term contracts are barring penetration.The company also has a distribution
license of Germany based Fuchs lubricants, which it also plans to blend locally with a
new Lube blending facility.
HASCOL initially relied heavily on FO for its revenue due to (i) a low number of retail
outlets and (ii) PSO’s circular debt issue, which crippled its cash flows. HASCOL’s
revenue contribution from FO was c.39% in 2013, gradually shrinking to c.12% presently
with expansion in the retail network and PSO regaining strength through imports.
HASCOL plans to fuel ongoing growth trajectory by continuing to add 100 retail stations
every year, and gradually penetrating the urban centers. In order to maintain an
efficient supply chain given the import based model, it plans to build the largest storage
capacity of 456,900MT (total storage) at all strategic locations of Pakistan.
HASCOL raised PkR1.4bn in the IPO against the
initial target of PkR500mn due to
overwhelming interest from investors.
Three major products HSD, Mogas and FO
contribute 99.5% of revenue.
HASCOL has gained an overall market share of
7.5% from 2.5% in just 3 years

5 | P a g e
Perspective
Current Storage
Location / Terminal Petrol Diesel Fuel Oil Status Remarks
Al Abbas KMR 16,500 - - Leased
ZYCO Hsacol Terminal KMR 21,100 5,000 - Company Owned 3 Tanks Under Construction under OGRA Inspection
VTT Port qasim - - 56,000 Leased
Daulatpur 2,250 4,000 -
Shikarpure 2,750 6,000 - Company Owned
Machike 3,500 6,000 - Company Owned
Mehmoodkot 4,500 9,000 - Company Owned December 2016, Under OGRA Inspection
Sub Total (MT) 50,600 30,000 56,000
Under Construction Storages Location / Terminal Petrol Diesel Fuel Oil Status Expected Completion & Remarks
Port Qasim 50,000 69,600 87,000 Company Owned September 17 & September 18
Shikarpur Additional - 6,000 - Company Owned 18-March
Daulatpur Additional - 3,000 - Company Owned 18-March
Sahiwal 2,000 4,000 - Company Owned June 17
Kotla-Jam 4,000 4,000 - Company Owned December 17
Machike 'B' 50,000 10,000 - Company Owned December 17 Subject to NOC By LDA
Amangarh 500 2,200 - Company Owned December 16 Under OGRA Inspection
Thallian 16,000 12,000 - Company Owned December 17
Sub Total (MT) 122,500 110,800 87,000
Grand Total 173,100 140,800 143,000
Grand Total All Storages (MT)
456,900
Source: IMS Research

6 | P a g e
Perspective
Organic growth to slow down; reinstate coverage with Sell stance
We expect Hascol Petroleum (HASCOL) to continue gaining market share and reach an
overall level of 13% (from 7.5% currently) in the next three years after which
resurgent competition should moderate incremental growth. HASCOL’s sales have
doubled since CY13 led by aggressive retail and storage expansion amid low oil prices
and complacent competition. Its market share rapidly swelled from 2.5% to 7.5%, but
incumbent competition is now bringing its act together. Moreover, OGRA’s recent
move to encourage competition by granting licenses to 21 new players may also hurt
growth prospects, where new entrants will likely attempt to replicate HASCOL’s
growth strategy to gain market share.
Momentum to continue in the short term
HASCOL’s current sales growth momentum is likely to continue in the next couple of
years given the lagged competitive response from other OMCs, in our view. We believe
PSO, SHEL and APL will take some time to catch up with the storage advantage of
HASCOL and begin to recover their lost market share. The rapid growth of HASCOL was
partly supported by lackluster performance of bigger players where PSO was suffering
from severe cash flow issues due to circular debt, SHEL was widely understood to be
considering an exit from Pakistan and APL did not have enough storage to push growth
despite support from two group refineries (NRL and ATRL). We believe PSO and APL’s
new storage infrastructure will take time to come online; meanwhile, HASCOL can
continue to take advantage and grow. However, this window will eventually narrow
while excessive reliance on non-urban and non-retail channel sales (60% of total sales)
also calls into question the sustainability of growth as new competition seeps in and
uses similar strategy (targeting suburban areas).
Likely response from competitors in the medium term Competitor OMCs ha ve shown serious intent to counter the threat posed by HASCOL,
although we reiterate it will likely take some time for them to stop the bleeding. In a bid
to retain market share, the three major OMCs are likely to fill the gaps that they have
left for HASCOL to exploit in the last few years.
PSO: PSO is planning an investment of up to PkR8bn to double its Mogas storage
capacity to store inventory of up to 20 days (from 9-10 days presently) to ensure
availability of fuel at its 3,800 fuel stations spread across the country, which will shore
up its leadership position.
HASCOL sales growth is expected to moderate after next 2-3yrs
0%
10%
20%
30%
40%
50%
60%
70%
80%
90%
0
200,000
400,000
600,000
800,000
1,000,000
1,200,000
1,400,000
1,600,000
CY15 CY16 CY17F CY18F CY19F CY20F CY21F
(MT)
Mogas Volumes HSD Volumes Mogas Sales Growth (Rhs)
Source: IMS Research
Sales growth is expected to moderate after
medium-term

7 | P a g e
Perspective
SHEL: SHEL has already announced revamp of its fuel stations (neglected while it was
perhaps planning to exit Pakistan) to attract more customers. It has a very strong brand
name to leverage and a strong supply chain to bolster revival of its operations in little
time. To recall, SHEL historically had a market share of 13% where supportive GoP
policies (OMC margins linkage with CPI) and promising demand outlook may be
compelling them to stay in the market.
APL: APL has announced ramping up storage capacity by building terminals at strategic
locations of Port Qasim, Mehmood Kot, Gatti and Shikarpur. Note these are the same
locations where HASCOL’s storage facilities are located. It also continues to benefit
from presence of group refineries NRL and ATRL to back its supply chain.
Overall Market Share No. of Pumps Storage Capacity (MT)
PSO 57% 3,421 958,238
SHEL 10% 801 130,547
APL 7% 582 64,375
HASCOL 7% 424 136,600
Source: IMS Research, OCAC, OGRA
The completion of these plans will lead to a more level playing field and HASCOL will
have to resort to new competitive tactics to sustain market share growth.
Fragmented market expected in the long term
OGRA has recently granted OMC licenses to 21 new companies vs. only 12 currently
operating, in a bid to encourage competition, enhance customer service and shift to a
completely deregulated environment in the long run. The present business
environment with promising volumetric growth outlook, low oil prices and OMC
margins linked with inflation provide a lucrative opportunity for new players to enter
the industry. Key success factor will be big financial muscle because OGRA requires new
OMCs to enhance storage capacity for Pakistan, in order to avert shortage amid rapidly
growing demand.
We believe that the new players will imitate HASCOL’s growth strategy in order to
attain market share. A cost effective strategy used by HASCOL is to set up retail pumps
in outskirts of cities, small towns and highways, procure supplies from local refineries
and once cash flow is generated, move to the urban centers and start importing on its
own. They would also need significant capital for storage and supply chain
infrastructure, which is also easier to raise through both equity and debt market in the
present environment. Newer industry dynamics are suggestive of a fragmented market
resulting in shift to a more defensive approach for incumbents to defend their market
share rather than concentrating on gaining market share once competition becomes
fiercer.
HASCOL has audaciously challenged market share of competitors
0%
10%
20%
30%
40%
50%
60%
70%
80%
Overall FO Mogas HSD
PSO SHEL APL HASCOL
Source: IMS Research, OCAC
OGRA issued license to 21 new OMCs which is
unprecedented. GoP is likely planning a more
competitive deregulated market.
APL is building storage capacities in the same
localities as HASCOL.

8 | P a g e
Perspective
Thin margins on lack of diversified sales mix
FO is one of the highest selling POL products (with relatively higher margins)
constituting a major chunk of OMC sector sales. In this regard, GoP’s recent policy to
shift power generation mix away from FO is likely to dampen Industry sales where
HASCOL will also be impacted. While HASCOL has historically focused on HSD/Mogas
sales, it has not been able to penetrate Lubricants, Jet fuel and LPG market – which
are difficult territories but also promise a second leg of growth for OMCs. Failure to
adequately substitute FO sales with other products can also be a drag on growth.
Pakistan’s changing fuel mix
Pakistan is expected to add about 10,000MW of power generation capacity till 2018,
most of which is Coal based under the CPEC arrangement. Moreover, in a rising
international oil price scenario, FO based power generation would be 2x more
expensive than Natural Gas (above US$70/bbl) hence more substitution is likely to take
place. This would also be true for industrial consumers; with increased electricity
generation, reliance of industry on alternate power generators will also decrease.
Declining FO market will increase reliance on HSD and Mogas
HASCOL’s revenue concentration in three major products may also pose a risk to
revenue growth. Whereas HASCOL is partly immune to Pakistan’s changing power fuel
mix (shifting away from furnace oil to more coal/LNG/hydel based generation) due to
lower sales to power sector, increased availability of LNG and alternate fuels may also
reduce the reliance of industries on FO. Contribution from lubricants to revenue is
expected to increase with the installation of a lube blending plant; however, with major
players like SHEL, Caltex and PSO still present in the market, success of this product is
still questionable. Moreover, HASCOL has still not been able to penetrate the Jet fuel
and LPG market to broaden the product base to reduce dependence on Mogas and
HSD.
Dependence on Mogas and HSD is positive on a cash-flow basis due to possibility of
high turnover. However, on a profitability basis, both Mogas and HSD are thin margin
products while FO has relatively higher margins. Decline in FO sales going forward will
hurt the profitability of the company given high finance costs to import fuel and finance
capital expenditure. However, success of lubricants can be an offsetting factor.
FO Contribution to the revenue is decreasing
0%
5%
10%
15%
20%
25%
30%
35%
40%
45%
CY13 CY14 CY15 CY16
Source: IMS Research
FO Industry sales volume (MT)
5,500,000
7,000,000
8,500,000
10,000,000
CY
14
CY
15
CY
16
CY
17
F
CY
18
F
CY
19
F
CY
20
F
CY
21
F
CY
22
F
CY
23
F
CY
24
F
CY
25
F
FO Industry Sales
Source: IMS Research
GoP has decided to change the power fuel mix
due to expensive cost of electricity amid higher
oil prices.

9 | P a g e
Perspective
Sustaining growth will entail high costs
HASCOL’s robust sales growth (last 3yr sales CAGR: 26%) has masked the high cost of
growth. Higher leverage is necessary to finance the aggressive expansion (capital
leases and issuance of Sukuks) complemented by working capital requirements
(inventory and ST borrowing), given predominantly import based business model
(75% of purchases are imported). Hence, while sales growth will remain on a steep
gradient, earnings growth will not completely mimic the former going forward due to
high operational and finance costs.
Increasing leverage to finance expansion
HASCOL has followed an aggressive growth strategy in adding retail fuel outlets and
storages, where it plans to add a further 320,300MT of storage, continue expansion in
retail fuel outlets and install a new lube blending plant at a cost of PkR1.8bn. While all
this growth looks promising, HASCOL’s reliance on debt and capital leases has made it
more expensive (CY15 finance cost: PkR2.9/sh). With the current growth trajectory, we
forecast that this burden of finance costs is likely to increase further and will push
down on earnings where a hike in interest rates may slow down the expansion strategy.
Given the thin margins HASCOL earns on its sales, higher cost of financing is likely to
keep earnings growth in check. As it is, earnings growth outlook is not as promising as
sales outlook.
Import based model requires more working capital HASCOL’s massive dependence on imports will result in significant requirements for
working capital amidst large import costs, in our view. It currently imports 75% of its
total inventory, as per management guidance and hence has very low reliance on local
refineries for POL products. Whereas this strategy allows them to capitalize on the fluctuations in international oil prices, high import costs are an additional burden on
the profitability of the company, especially at a time when international oil prices will
be rising. Up till now, HASCOL could mitigate these costs through import differentials;
now however, the rapid increase in finance and imports cost will result in slower
earnings growth than revenue growth.
In a low oil price scenario, relying on imports might be feasible but as soon as oil prices
start to rise, HASCOL would need large working capital to import similar quantity of
inventory and thus costs would rise in tandem. In future, HASCOL would have built large
storages and reverting back to local refineries for supplies would mean wasting storage
and incurring maintenance costs too. Inventory gains due to price differentials will be
an offsetting factor in this regard; however, these would be possible if international
prices are rising.
Rising finance costs related to imports will trim margins
0.0
1.0
2.0
3.0
4.0
5.0
6.0
7.0
CY14 CY15 CY16 CY17F CY18F CY19F CY20F CY21F
Finance Cost/share (PkR/Shr)
Source: IMS Research
HASCOL recently issued PkR2bn Sukuks to
finance expansion.
10 | P a g e
Perspective
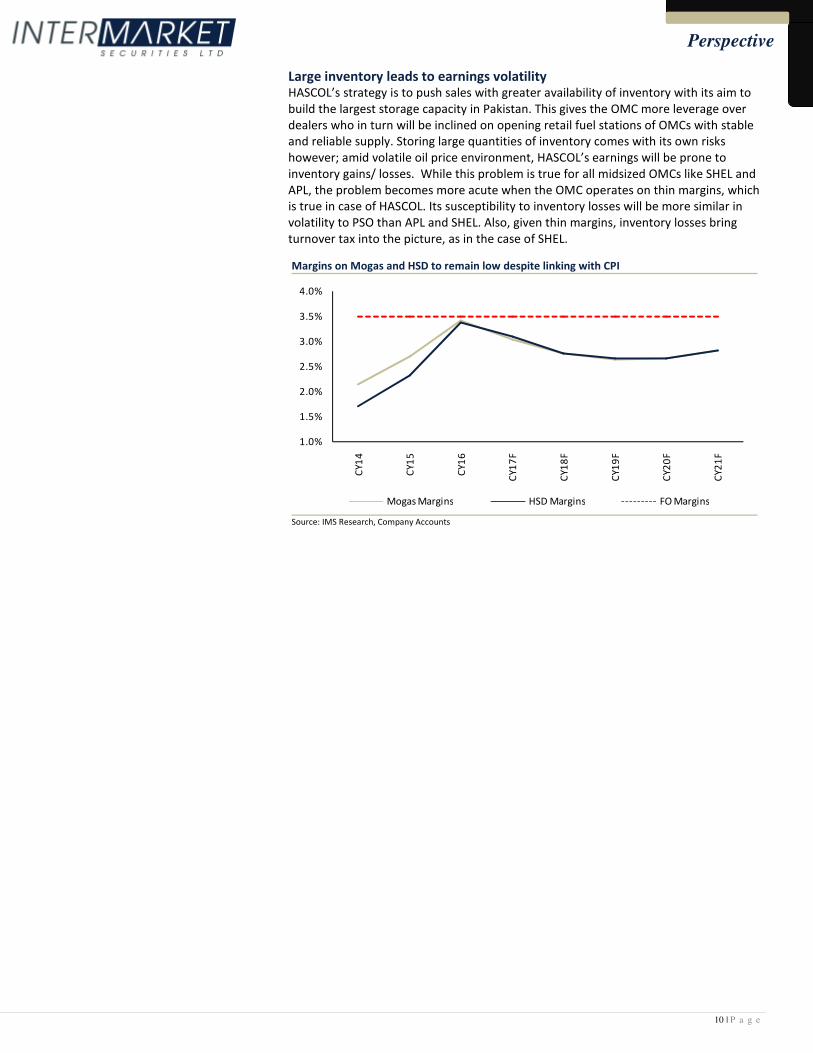
Large inventory leads to earnings volatility HASCOL’s strategy is to push sales with greater availability of inventory with its aim to
build the largest storage capacity in Pakistan. This gives the OMC more leverage over
dealers who in turn will be inclined on opening retail fuel stations of OMCs with stable
and reliable supply. Storing large quantities of inventory comes with its own risks
however; amid volatile oil price environment, HASCOL’s earnings will be prone to
inventory gains/ losses. While this problem is true for all midsized OMCs like SHEL and
APL, the problem becomes more acute when the OMC operates on thin margins, which
is true in case of HASCOL. Its susceptibility to inventory losses will be more similar in
volatility to PSO than APL and SHEL. Also, given thin margins, inventory losses bring
turnover tax into the picture, as in the case of SHEL.
Margins on Mogas and HSD to remain low despite linking with CPI
1.0%
1.5%
2.0%
2.5%
3.0%
3.5%
4.0%
CY1
4
CY1
5
CY1
6
CY1
7F
CY1
8F
CY1
9F
CY2
0F
CY2
1F
Mogas Margins HSD Margins FO Margins
Source: IMS Research, Company Accounts

11 | P a g e
Perspective
Competitor Analysis
HASCOL has followed a unique business model to penetrate in the OMC market, and
has followed a thin margin/volume driven approach. Narrow margins in a high fixed
costs business model are not sustainable, in our view, as realized by other mature
OMCs who have moved in high margin businesses and created synergies.
Revenue Mix: HASCOL is largely dependent on 3 major products for its revenues out of
which FO is a declining market and other revenue streams like Jet Fuel, LPG and
Lubricants are either absent or not contributing materially to revenue. While HASCOL
may try to grow these lines, it faces inhibiting factors such as (i) PSO’s fuel supply
agreements for FO and Jet fuel, (ii) APL’s presence in non-energy products market like
Bitumen and (iii) SHEL’s brand equity in Lubricants and Jet fuel market. Moreover, GoP
has recently deregulated HOBC which is a high margin product; sales of this product
would be concentrated in urban centers where HASCOL has less presence.
Profitability: Gross profitability of all the companies looks higher than HASCOL due to a
diversified product mix, where all the other players have deregulated products in their
product portfolio unlike HASCOL. We argue that, like PSO, since the sales are leveraged,
HASCOL’s thin margins expose it to risks.
Fuel Supply Arrangements: PSO is the largest importer of POL products and has been
able to sustain the model based on the scale and GoP backing that it has. SHEL has
resorted to local refineries for fuel supply while APL has leveraged group refineries for
efficient availability of inventory. Comparison of the OMC space suggests import based
model is only sustainable with scale economies as high as PSO to bear high finance and
storage operations costs. Therefore, HASCOL can become a more profitable OMC with
more local procurement. Increasing stake in Pakistan Refinery (PRL) will have helped
circumvent this issue, but PSO has taken over the opportunity. Future refineries (in
Karak, KPK) or fully operational Byco Oil refinery will provide other ways out of this
problem.
Leverage: All the OMCs except PSO are deleveraged, which is still in the midst of a
circular debt crisis and is only able to sustain with GoP backing. It is worth noting that
both APL and SHEL can potentially undergo aggressive expansion to counter HASCOL
going forward where HASCOL is set to remain leveraged as it undergoes further
expansion given the policy of capital leases to acquire assets.
Payout: We believe that distribution of earnings for HASCOL will remain low in the
medium term as compared to competitors where APL already has a healthy payout
policy and PSO will start paying out as soon as circular debt issue eases out.
PSO APL SHEL HASCOL
Revenue Mix (major products) HSD, Mogas and FO HSD, Mogas, FO and Bitumen HSD, Mogas, Lubricants and Jet fuel HSD, MS and FO
Gross margins* 4.32% 4.37%. 5.58% 3.69%
Net margins* 2.43% 2.42% 2.54% 1.48%
ROE* 19.4% 25.5% 22.4% 20.3%
Fuel Supply Arrangements Majorly Imported Group Refineries Import + local refineries Majorly Imported
Retail Network (before Rev) 3,800 563 780 424
Debt to Equity 1.15 0 0.34 0.56
Exposure to circular debt High Low None None
Payout Low High Low Low
P/E 7.8x 11x 14.5x 23.6x
*Adjusted for inventory gains/losses
HASCOL may try to diversify its revenue mix but
it will face challenges.
12 | P a g e
Perspective
Valuations are pricing in a blue sky scenario
HASCOL trades at a CY17F P/E of 23.6x, which appears stretched notwithstanding
projected 3yr NPAT CAGR of 26% and synergies associated with partnering with Vitol.
In our view, the market has incorporated an implied market share of 15%+ along with
phenomenal success of Lubricants business. While these expectations are possible,
these would require weaker competition as has been the case in the last 3 years. A
lower payout (20%) despite cash sales also dampens the investment case.
Valuations stretched even in bull case scenario
HASCOL trades at a CY17F P/E of 23.6x, at a 195% premium to the OMC space and
116% premium to the KSE-100 Index. We believe valuations are stretched where the
market is ostensibly equating earnings growth with volumetric growth, ignoring higher
finance and inventory costs going forward. HASCOL’s valuations appear stretched even
by assuming a bull-case scenario of 15% market share in the next 3yrs.
We have valued HASCOL by assuming an overall market share of 13% in the next 3
years (vs. 7.5% at present) and adequate success in the lubricants business (market
share of 10% by CY20). We believe that low payout despite cash sales further calls into
question the premium assigned to the scrip.
We indicate that similar growth trajectory was also seen for APL in 2005-07 period
when the average 3-year earnings CAGR was 70%. During this time, APL followed a
similar strategy of building fuel stations in the outskirts concentrating in high demand
areas of Punjab. Interestingly APL traded at a P/E in the range of 14-16x at that time as
compared to HASCOL which is forecasted to grow at a 3-year CAGR of 26%; much below
APL’s peak growth rate. The historical comparison is suggestive of a massive premium
being assigned to HASCOL.
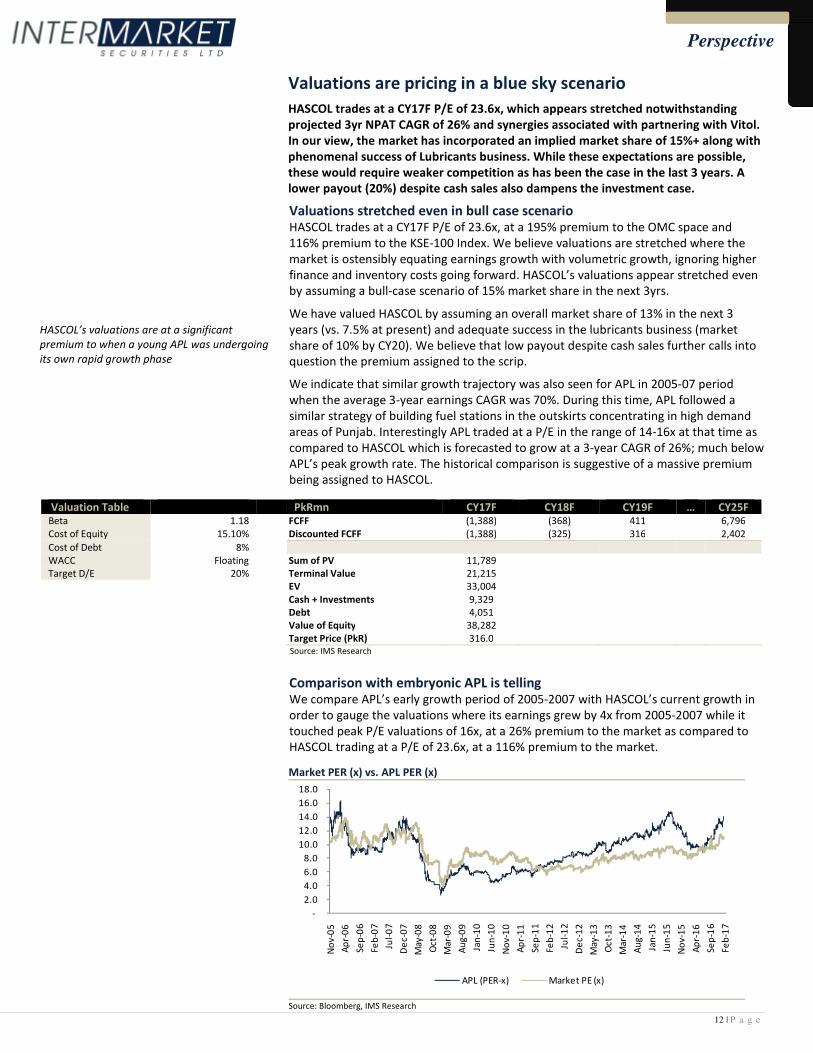
Comparison with embryonic APL is telling
We compare APL’s early growth period of 2005-2007 with HASCOL’s current growth in
order to gauge the valuations where its earnings grew by 4x from 2005-2007 while it
touched peak P/E valuations of 16x, at a 26% premium to the market as compared to
HASCOL trading at a P/E of 23.6x, at a 116% premium to the market.
Market PER (x) vs. APL PER (x)
-
2.0
4.0
6.0
8.0
10.0
12.0
14.0
16.0
18.0
No
v-0
5
Ap
r-0
6
Sep
-06
Feb
-07
Jul-
07
De
c-0
7
May
-08
Oct
-08
Mar
-09
Au
g-0
9
Jan
-10
Jun
-10
No
v-1
0
Ap
r-1
1
Sep
-11
Feb
-12
Jul-
12
De
c-1
2
May
-13
Oct
-13
Mar
-14
Au
g-1
4
Jan
-15
Jun
-15
No
v-1
5
Ap
r-1
6
Sep
-16
Feb
-17
APL (PER-x) Market PE (x)
Source: Bloomberg, IMS Research
HASCOL’s valuations are at a significant
premium to when a young APL was undergoing
its own rapid growth phase
Valuation Table PkRmn CY17F CY18F CY19F … CY25F Beta 1.18
FCFF (1,388) (368) 411
6,796
Cost of Equity 15.10%
Discounted FCFF (1,388) (325) 316
2,402
Cost of Debt 8%
WACC Floating
Sum of PV 11,789
Target D/E 20%
Terminal Value 21,215
EV 33,004
Cash + Investments 9,329
Debt 4,051
Value of Equity 38,282
Target Price (PkR) 316.0
Source: IMS Research
13 | P a g e
Perspective
While there are similarities, between the young APL and today’s HASCOL, there are
marked operational advantages for the former that HASCOL does not have. APL grew at
a much faster growth rate than HASCOL during that time with rapid retail outlets
expansion (similar to HASCOL with 50-70 outlets every year). It also had the advantage
of two group refineries (NRL and ATRL) providing strong inventory support. With the
storage infrastructure of group refineries in place, APL used to store only 4-6 days of
inventory in its storage, thereby saving working capital and operational costs. Lesser
inventory storage also reduced APL’s correlation to oil market volatility. Comparing this
with an import based model of HASCOL, high working capital and import costs would
depress earnings and dampen the pace of growth trajectory followed by APL.
Moreover, APL had a more profitable revenue portfolio with significant contribution
from deregulated products while HASCOL is largely dependent on sales of Mogas and
HSD which have regulated margins. Additional support for APL came from export of POL
products to land-locked Afghanistan and significant commission for export of NAPTHA
on behalf of NRL and ATRL. This diverse product mix gave a unique advantage to APL
which HASCOL currently does not have. In our view, HASCOL trading at 116% premium
to the market (vs. 27% peak premium for APL), despite having relatively slower earnings
growth, reliance on imports and lower margins product mix, is unjustified.

14 | P a g e
Perspective
Upside Risks: What can change our thesis?
While we argue that HASCOL’s sales growth will slow down beyond the medium term
due to multiple reasons and that earnings growth will remain lower as compared to the
sales growth, there are some upside risks associated with our thesis which have been
taken into consideration.
Above expected success in the Lubricants market
We argue that HASCOL’s current business model will translate in slower earnings
growth as compared to sales growth due to high import, working capital and financing
costs. In order to accelerate earnings growth and improve margins, HASCOL needs to
achieve phenomenal success in the lubricants market. In this regard, HASCOL has a
technical service agreement with Fuchs Labs Germany for marketing “Fuchs” branded
lubricants in Pakistan and has announced a Lube blending plant at a cost of US$20mn.
This will enable HASCOL to aggressively market the products where it only sold c.
7,000MT in CY16 as per our estimates. Success in our view can take two forms: either
HASCOL replicates high double-digit growth as in petroleum products or becomes able
to charge high margins like the incumbents in this market.
Pakistan’s lubricants market is estimated to have a demand of 200,000MT/year which is
expected to grow at 5% CAGR. This demand is driven both by automobile and industries
where Motor Oil, Heavy duty engine oil and Industrial oil are consumed the most. The
industry is divided into organized and unorganized sector, where most of the sales
come through the retail fuel stations (organized sector).
Market for lubricants is concentrated with the largest three players dominating c. 60%
of the market. Brand equity and retail network play a major role in success in this
industry. The industry is dominated by SHEL, Caltex and PSO (constituting c.60% of the
market) backed by high brand equity and widespread retail network all over the
country. Lubricants are the highest margin products for OMCs where margins range
between 20-40% depending on the OMC. Our estimates suggest c.45% of Shell’s profits
for CY15 were contributed by Lubricant sales which contributed only 7% to revenues.
We have assumed a decent success of lubricants business in our model driven by
aggressive expansion in retail network, which will boost availability of the products.
However, taking SHEL and PSO as proxy, SHEL (800 outlets) has dominated the
lubricants market despite PSO’s larger retail network (3,800 retail outlets). This is
suggestive that brand equity plays a higher role in success in this market. Our channel
checks suggest higher brand equity for SHEL and Caltex branded lubricants where
consumers are willing to pay premium for their product. Given this context, success of a
relatively new brand would be limited in our view and sales would be pushed through
the HASCOL retail channel.
Lubricant Volumes
0
5,000
10,000
15,000
20,000
25,000
30,000
CY14 CY15 CY16 CY17F CY18F CY19F CY20F CY21F
Lubricant Volumes (M.Tons)
Source: IMS Research
Lubricants have the highest margin among POL
products, in the range of 25-40%.
Brand Equity is the most important factor in
Lubricants business while Lube blending plant
can improve supply chain.
15 | P a g e
Perspective
Storage Rental can generate substantial income
Historically, PSO and SHEL were the major importers of POL products in the country and
have had substantial storage capacities to store inventory. Other smaller OMCs relied
on local refineries for inventory and hence were able to avoid expenditure on storage.
More recently, HASCOL took the lead with its import based model and is investing
heavily in storage facilities. The new strategy is driven by the philosophy of pushing
sales with efficient and widespread of availability of products across the country which
is only possible with storage facilities at strategic locations.
HASCOL currently has 136,600MT of owned and leased storage for different products
across the country while it plans to add 320,300MT in the next 2 years. Availability of
such huge storage space will not only help HASCOL ensure availability of its inventory
throughout the country but may also open up additional revenue streams in the form of
storage rental, which is currently only contributing PkR50mn to the profits but may be
substantial in the future. Affordability of own storages is only possible for operations at
a certain scale and all the 21 new OMCs might not be able to achieve that scale
immediately, hence HASCOL might be able to lease out its storage facility potentially
generating substantial income in return.
Potential acquisition of a competitor
A potential upside trigger for HASCOL would be acquisition of a competitor like SHEL
which has been said to be mulling exit from the market since quite some time (it is
perhaps now considering to stay in the space given improved industry dynamics). This
move can give HASCOL an instant access to retail outlets at premium locations which
alternatively would take several years to replicate. However, this instant access would
come at a premium and financing such an acquisition might be a pertinent issue given
the already high leverage to finance expansions. We indicate that HASCOL has Vitol as a
strong sponsor which may play a role in financing such acquisition. This move would be
unchallenged since other competitors like APL or new entrants might also pursue such
lucrative quick entry in the premium market which would push the price further north.
Support from Vitol in sustaining the import based model
Vitol Dubai Ltd. which recently acquired a 25% stake in HASCOL is a huge oil giant
involved in trading of POL products all over the globe. We recognize that support from
Vitol in order to sustain an import based model in the medium term can be an upside
trigger. This support can come in the form of financing new expansions such as its role
in Port Qasim installation. It may also play a stronger role as an import arm for HASCOL,
where Vitol may import POL products on HASCOL’s behalf and they may not have to
invest in working capital. Lastly, HASCOL can benefit from Vitol’s expertise in global oil
trade in order to capitalize on the volatility in the international oil market.
16 | P a g e
Perspective
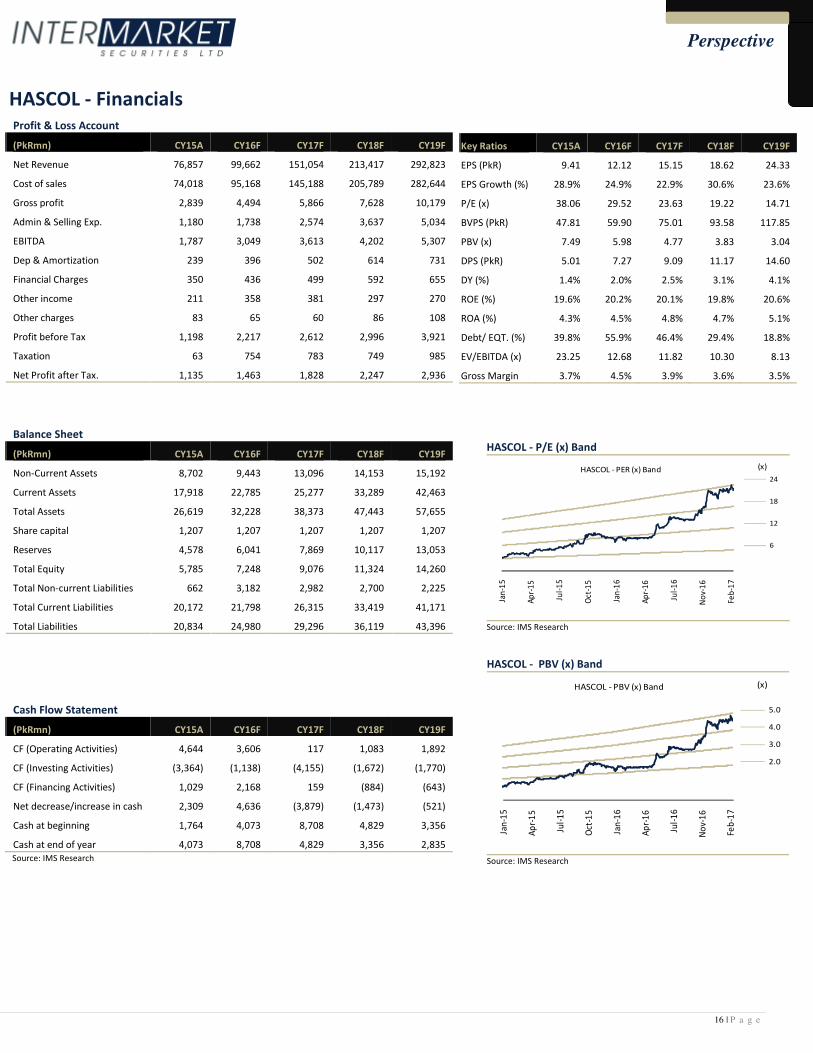
Profit & Loss Account
(PkRmn) CY15A CY16F CY17F CY18F CY19F
Net Revenue 76,857 99,662 151,054 213,417 292,823
Cost of sales 74,018 95,168 145,188 205,789 282,644
Gross profit 2,839 4,494 5,866 7,628 10,179
Admin & Selling Exp. 1,180 1,738 2,574 3,637 5,034
EBITDA 1,787 3,049 3,613 4,202 5,307
Dep & Amortization 239 396 502 614 731
Financial Charges 350 436 499 592 655
Other income 211 358 381 297 270
Other charges 83 65 60 86 108
Profit before Tax 1,198 2,217 2,612 2,996 3,921
Taxation 63 754 783 749 985
Net Profit after Tax. 1,135 1,463 1,828 2,247 2,936
Balance Sheet
(PkRmn) CY15A CY16F CY17F CY18F CY19F
Non-Current Assets 8,702 9,443 13,096 14,153 15,192
Current Assets 17,918 22,785 25,277 33,289 42,463
Total Assets 26,619 32,228 38,373 47,443 57,655
Share capital 1,207 1,207 1,207 1,207 1,207
Reserves 4,578 6,041 7,869 10,117 13,053
Total Equity 5,785 7,248 9,076 11,324 14,260
Total Non-current Liabilities 662 3,182 2,982 2,700 2,225
Total Current Liabilities 20,172 21,798 26,315 33,419 41,171
Total Liabilities 20,834 24,980 29,296 36,119 43,396
Cash Flow Statement
(PkRmn) CY15A CY16F CY17F CY18F CY19F
CF (Operating Activities) 4,644 3,606 117 1,083 1,892
CF (Investing Activities) (3,364) (1,138) (4,155) (1,672) (1,770)
CF (Financing Activities) 1,029 2,168 159 (884) (643)
Net decrease/increase in cash 2,309 4,636 (3,879) (1,473) (521)
Cash at beginning 1,764 4,073 8,708 4,829 3,356
Cash at end of year 4,073 8,708 4,829 3,356 2,835
Source: IMS Research
Key Ratios CY15A CY16F CY17F CY18F CY19F
EPS (PkR) 9.41 12.12 15.15 18.62 24.33
EPS Growth (%) 28.9% 24.9% 22.9% 30.6% 23.6%
P/E (x) 38.06 29.52 23.63 19.22 14.71
BVPS (PkR) 47.81 59.90 75.01 93.58 117.85
PBV (x) 7.49 5.98 4.77 3.83 3.04
DPS (PkR) 5.01 7.27 9.09 11.17 14.60
DY (%) 1.4% 2.0% 2.5% 3.1% 4.1%
ROE (%) 19.6% 20.2% 20.1% 19.8% 20.6%
ROA (%) 4.3% 4.5% 4.8% 4.7% 5.1%
Debt/ EQT. (%) 39.8% 55.9% 46.4% 29.4% 18.8%
EV/EBITDA (x) 23.25 12.68 11.82 10.30 8.13
Gross Margin 3.7% 4.5% 3.9% 3.6% 3.5%
HASCOL - Financials
HASCOL - P/E (x) Band
Jan
-15
Ap
r-1
5
Jul-
15
Oct
-15
Jan
-16
Ap
r-1
6
Jul-
16
No
v-1
6
Feb
-17
(x)HASCOL - PER (x) Band 24
18
12
6
Source: IMS Research
HASCOL - PBV (x) Band
Jan
-15
Ap
r-1
5
Jul-
15
Oct
-15
Jan
-16
Ap
r-1
6
Jul-
16
No
v-1
6
Feb
-17
(x)HASCOL - PBV (x) Band
5.0
4.0
3.0
2.0
Source: IMS Research

17 | P a g e
Perspective
I, Muneeb Naseem, certify that the views expressed in the report reflect my personal views about the subject securities. I also
certify that no part of my compensation was, is, or will be, directly or indirectly, related to the specific recommendations made in
this report. I further certify that I do not have any beneficial holding of the specific securities that I have recommendations on in
this report.
Ratings Guide* Total Return
Buy More than 15%
Neutral Between 0% - 15%
Sell Below 0%
*Based on 12 month horizon unless stated otherwise in the report. Total Return is sum of any Upside/Downside
(percentage difference between the Target Price and Market Price) and Dividend Yield.
Valuation Methodology: We use multiple valuation methodologies in arriving at a Target Price including, but not limited to,
Discounted Cash Flow (DCF), Dividend Discount Model (DDM) and relative multiples based valuations.
Risks: Please refer to page 14.
Disclaimer: Intermarket Securities Limited has produced this report for private circulation only. The information, opinions and
estimates herein are not direct at, or intended for distribution to or use by, any person or entity in any jurisdiction where doing so
would be contrary to law or regulation or which would subject Intermarket Securities Limited to any additional registration or
licensing requirement within such jurisdiction. The information and statistical data herein have been obtained from sources we
believe to be reliable where such information has not been independently verified and we make no representation or warranty as to
its accuracy, completeness and correctness. This report makes use of forward looking statements that are based on assumptions
made and information currently available to us and those are subject to certain risks and uncertainties that could cause the actual
results to differ materially. No part of the compensation of the author(s) of this report is related to the specific recommendations or
views contained in this report.
This report is not a solicitation or any offer to buy or sell any of the securities mentioned herein. It is meant for information purposes
only and does not take into account the particular investment objectives, financial situation or needs of individual recipients. Before
acting on any information in this report, you should consider whether it is suitable for your particular circumstances and, if
appropriate, seek professional advice. Neither Intermarket Securities Limited nor any of its affiliates or any other person associated
with the company directly or indirectly accepts any liability whatsoever for any direct or consequential loss arising from any use of this
report or the information contained herein.
Subject to any applicable law and regulations, Intermarket Securities Limited, its affiliates or group companies or individuals
connected with Intermarket Securities Limited directly or indirectly may have used the information contained herein before
publication and may have positions in, or may from time to time purchase or sell or have a material interest in any of the securities
mentioned or may currently or in future have or have had a relationship with, or may provide investment banking, capital markets
and/or other services to, the entities mentioned herein, their advisors and/or any other connected parties.
18 | P a g e
Perspective
NOTICE TO US INVESTORS
This report was prepared, approved, published and distributed by Intermarket Securities Limited (IMS) located outside of
the United States (a “non-US Group Company”). This report is distributed in the U.S. by LXM LLP USA, a U.S. registered
broker dealer, on behalf of IMS only to major U.S. institutional investors (as defined in Rule 15a-6 under the U.S.
Securities Exchange Act of 1934 (the “Exchange Act”)) pursuant to the exemption in Rule 15a-6 and any transaction
effected by a U.S. customer in the securities described in this report must be effected through LXM LLP USA.
Neither the report nor any analyst who prepared or approved the report is subject to U.S. legal requirements or the
Financial Industry Regulatory Authority, Inc. (“FINRA”) or other regulatory requirements pertaining to research reports or
research analysts. No non-US Group Company is registered as a broker-dealer under the Exchange Act or is a member of
the Financial Industry Regulatory Authority, Inc. or any other U.S. self-regulatory organization.
Analyst Certification. Each of the analysts identified in this report certifies, with respect to the companies or securities
that the individual analyses, that (1) the views expressed in this report reflect his or her personal views about all of the
subject companies and securities and (2) no part of his or her compensation was, is or will be directly or indirectly
dependent on the specific recommendations or views expressed in this report. Please bear in mind that (i) IMS is the
employer of the research analyst(s) responsible for the content of this report and (ii) research analysts preparing this
report are resident outside the United States and are not associated persons of any US regulated broker-dealer and that
therefore the analyst(s) is/are not subject to supervision by a US broker-dealer, and are not required to satisfy the
regulatory licensing requirements of FINRA or required to otherwise comply with US rules or regulations regarding,
among other things, communications with a subject company, public appearances and trading securities held by a
research analyst account.
Important US Regulatory Disclosures on Subject Companies. This material was produced by Analysis of IMS solely for
information purposes and for the use of the recipient. It is not to be reproduced under any circumstances and is not to
be copied or made available to any person other than the recipient. It is distributed in the United States of America by
LXM LLP USA and elsewhere in the world by IMS or an authorized affiliate of IMS. This document does not constitute an
offer of, or an invitation by or on behalf of IMS or its affiliates or any other company to any person, to buy or sell any
security. The information contained herein has been obtained from published information and other sources, which IMS
or its Affiliates consider to be reliable. None of IMS accepts any liability or responsibility whatsoever for the accuracy or
completeness of any such information. All estimates, expressions of opinion and other subjective judgments contained
herein are made as of the date of this document. Emerging securities markets may be subject to risks significantly higher
than more established markets. In particular, the political and economic environment, company practices and market
prices and volumes may be subject to significant variations. The ability to assess such risks may also be limited due to
significantly lower information quantity and quality. By accepting this document, you agree to be bound by all the
foregoing provisions.
LXM LLP USA assumes responsibility for the research reports content in regards to research distributed in the U.S. LXM
LLP USA or its affiliates has not managed or co-managed a public offering of securities for the subject company in the
past 12 months, has not received compensation for investment banking services from the subject company in the past 12
months, does not expect to receive and does not intend to seek compensation for investment banking services from the
subject company in the next 3 months. LXM LLP USA has never owned any class of equity securities of the subject
company. There are not any other actual, material conflicts of interest of LXM LLP USA at the time of the publication of
this research report. As of the publication of this report LXM LLP USA, does not make a market in the subject securities.