interim report of iima on revival bsnl 8-1-19
TRANSCRIPT

Report on Revival /Restructuring of BSNL
IIM A
Prof Rekha Jain (co-ordinator)
Prof Vishal Gupta
Prof Ajay Pandey

1
Interim Report on Revival /Restructuring of BSNL
IIMA was given an assignment on studying BSNL and giving its recommendations for “revival/restructuring of BSNL” vide letter F.No. 10-3/2017-SU-I dated April 6, 2018 and July 31, 2018. The Terms of Reference were:
“To undertake a study with the objective of ‘Restructuring/ Revival of BSNL’, in accordance with the principles laid down in DPE guidelines dated 29.10.2015. The study will aim to propose new (or modifications to the existing) business, operational and financial plans of the Company. The findings of the study will additionally suggest the necessary changes that need to be made for revival/restructuring of BSNL”.
As a part of the study, the faculty members visited five circles representing somewhat well performing and not so well performing circles including one North-East circle. The well performing circles were – Kerala and Punjab, and the not so well performing circles included Gujarat, Calcutta Telephones and North East 1. The details of these visits are provided in Exhibit 1. These visits ended on December 5, 2018.
At the request of DoT as some key decisions are contemplated with regards to BSNL, IIMA was requested to provide an interim report on its assessment at the strategic level for BSNL. While the terms of reference as mentioned above are more comprehensive, this interim report gives a broader perspective and addresses four specific issues outlined in an interim meeting with DoT on December 26, 2018.
The specific questions addressed in this interim report are:
1. What should be the role of BSNL in the sector? 2. Should BSNL be allocated 4G spectrum? 3. What are some of the salient challenges necessary to be addressed for revival
/restructuring of BSNL? 4. What steps need to be taken for revival /restructuring of BSNL and how will the
restructuring be financed?
Parts A, B, C, D of the interim report covers our assessment on the issues listed above respectively.
Executive Summary
The Indian telecom sector has gone through consolidation and has a high degree of rivalry, especially with the entry of Reliance ‘Jio’. A natural question arises whether BSNL has any strategic role in the sector. In the long term, three cases for such a role are to ensure: (i) rivalry/competitiveness in the sector should the need arise in future, (ii) continued availability of telecom infrastructure and (iii) coverage to underserved/strategic areas. In the short term (0-5 years), there is a need to revive BSNL through strategic transformative initiatives. A decision on the way forward for BSNL after five years needs to be taken based on the review of steps implemented effectively.
Of these, the first objective of being an effective rival to retain competitiveness in the sector can be met by BSNL only after substantial transformative steps. Then its performance needs to be reviewed after five years to judge its suitability for its continuance. In its current form its market share is too low, it has mounting substantial losses and high costs to be able to
2
compete effectively in the sector. Further, it can be argued that the continued availability of infrastructure can be ensured through appropriate regulatory framework such that the telecom infrastructure is maintained/handed over even if private sector operator(s) cease to exist/operate. However, in the current political and social environment, a project organization created under BSNL be made responsible for the same. Both for the second and third option, too BSNL needs to be restructured dramatically to take care of only under-served/strategic areas or provide continuity of telecom infrastructure as a backstop option.
As far as allocation of 4G is concerned, there is the opportunity cost of 4G spectrum, additional capex for 4G roll-out and risk of continuing with business-as-usual attitude. On the other hand, non-allocation would result in further loss of market-share, revenue and loss of morale among the employees. On balance, we recommend that 4G spectrum may be allocated for 5 years’ conditional on BSNL addressing the issues related to manpower, real estate monetization/utilization and improvement is market-share/operating performance.
We make suggestions in the report on some of the salient issues that need to be addressed immediately by both DoT and the BSNL to enable its revival/restructuring. These include hiving off the infrastructure parts: both tower and fibre, creating a project organization, timely review of the state of BSNL’s performance after five years to see whether to continue with the existing organizational form. If BSNL performs well and undertakes the suggested measures, we recommend that BSNL be privatized at that point in time. In the current form with its legacy human resources and continued loss making, there is likely to be little private interest. Lastly, we make an estimate of the likely cost that will be involved in the revival/restructuring of BSNL and some ideas of how this cost may be financed.
Methodology
For primary data collection, the IIMA team initially held meetings with the top management of BSNL: CMD, Director (HR and Finance) and Marketing. The team also had meetings with the DoT headquarter in New Delhi. The team then identified 5 circles that represented a mix of good and poor performing circles as well as the various geographies. These are given below: 1. Gujarat – representing a poorly performing circle and the Western geographical area; 2. Kerala – representing a well performing circle and the Southern geographical area; 3. NE-1 – representing a poorly performing circle and the North-Eastern geographical area; 4. Calcutta Telephones – representing a poorly performing circle and the Eastern
geographical area; and 5. Punjab – representing a relatively well performing circle and the Northern geographical
area. In all the circles, the IIMA team met with the CGM, members and heads of HR & Admin, Finance and Telephone Revenues, CFA, CM, Enterprise Business, Operations, Sales and Marketing teams in each circle as well as the representatives of employee unions and associations. The IIMA team visited these circles for 1-2 days and had extensive one-on-one discussions with the circle employees. The list of officials we met is given in Annexure 1. The team requested inputs from the circle employees on the following questions: 1. What are the challenges you face in performing your duties? 2. What improvements/changes do you suggest should be made to your departments?

3
3. What improvements/changes do you suggest should be made in BSNL in order to turn it around from a sick organization to a profitable organization?
The IIMA team also worked with the responses to these questions that were made in writing. A copy of the responses was handed over to the IIMA team either during the visit or soft copies were mailed subsequently. The team also collected relevant circle-level/overall BSNL-level data wherever needed. Data from secondary sources, such as industry reports, discussion with experts and prior experience was used for the analysis.
Part A: Role of BSNL in the Indian Telecom Sector
To delineate a role for BSNL in the Indian telecom sector, we first broadly review its performance and hence its role in the current scenario of the existing sectoral and competition policies.
Background
BSNL was incorporated on October 1, 2000 by vesting with it the mandate of providing telecom services and network management hitherto done by the Department of Telecom (DOT), Government of India. This was done in a context where the telecom sector had been opened to the private sector beginning 1994. While initially the sector was opened for one private operator per circle for fixed line and two private players for cellular services, the number of private operators grew over time. An independent regulator, TRAI, was created in 1997. The telecom market took off from early 2000s with change in telecom policies allowing greater pricing freedom and a greater number of private operators competing to acquire consumers in each circle. Due to the fast-changing technology, the scope of services increased from voice to mobile Internet. Falling prices of technology and competition ensured that coverage expanded, prices fell, and the consumer-base grew exponentially accompanied by intense rivalry in the sector. Exhibit 2 shows the total subscribers of different operators from 2009-2018.
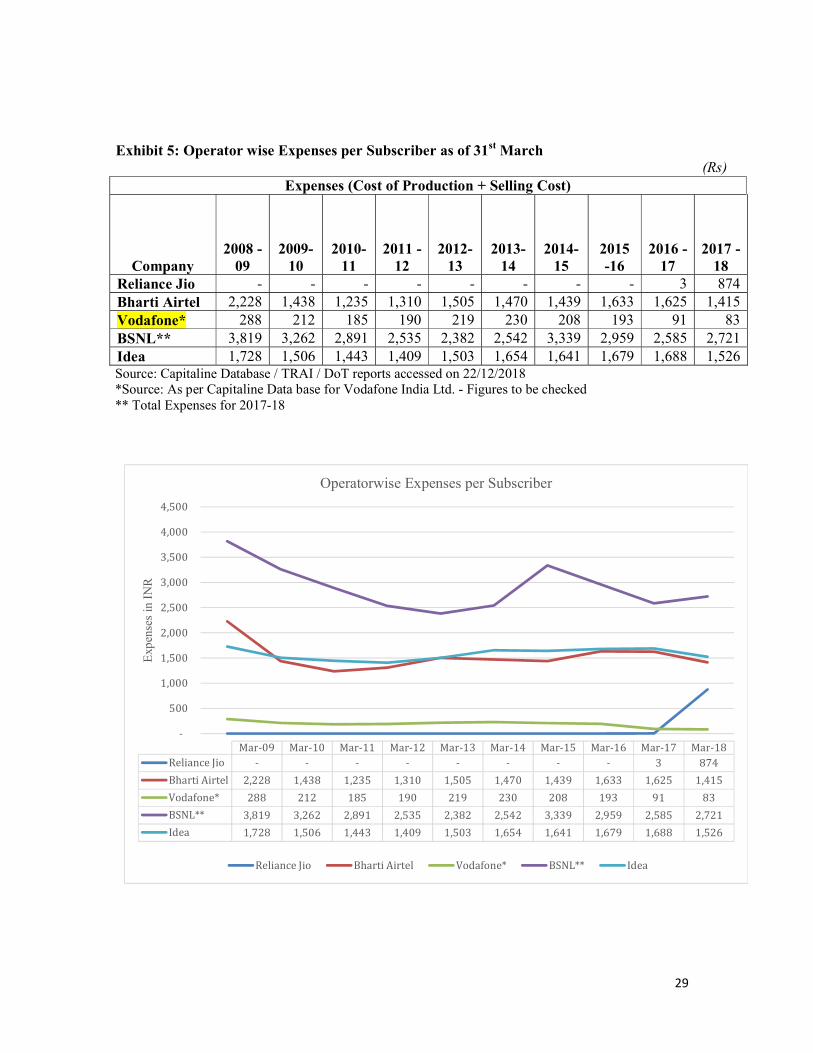
Even though the sector subsequently saw consolidation, a new competitive threat emerged with the entry of Reliance Industries in the telecom sector under the “Jio” brand. With competitive pricing, it has been able to acquire a large market share (close to being the top). Because of intense rivalry, Idea decide to merge with Vodafone leaving three large private players in Indian telecom sector - Reliance, Airtel and Vodafone-Idea. As the sector became more competitive, BSNL’s operating margins and market share started to decline. Exhibit 3 shows the relative market shares of key operators from 2009-2018 and decline in BSNL’s market share over this period. The subscriber market share as of BSNL as of March 31, 2018 was 12% and its revenue market share from Access Services was 8%. This decline had started even when the market shares of other operators were growing. The market share of other key operators has seen a decline only with the entry of Jio. Exhibits 4a, 4b and 4c show the revenues, expenses and profit/loss of the key operators for the same period. As can be seen, not only did the relative performance of BSNL go down during this period, its revenues steadily declined while its costs did not vary much. Its per subscriber cost of operations is also highest amongst the telecom operators (Exhibit 5).
It is in this context that the following questions need to be asked about the future and whether BSNL has any:

(a) Strategic role in the sector? Relevance for India’s growth and development?
(b) Role in ensuring competition in the sector in
To answer the above, there is a need to examine the larger context of policy and regulation in the sector. At one end are the competition policy related issues such as market definition and dominance that include frameworks for definition of acquisition, minimum number of players, definition of significant market power and abusive behaviour. On the other end are issues related to sectoral regulation such as licensing, interconnection mandates, USOF, and spectrum mbearing on the response to the issues raised above. It will be in the emergent context that we need to address the organizational restructuring of BSNL. This is depicted below:
The Arguments for Competition in the Telecom Sector
Traditionally telecom was considered a natural monopoly, like the electricity sector, with “wires” being the core reason. Changes in technology led to recognition that telecom can no more be considered as a natural monopoly (Stiglitz, 1999). In the absenceargument and with the realization that monopolies, whether private and public, resulted in loss of efficiency; the sector has been opened up for competition all over the world. This shifted the focus of attention from regulation on exercise of maintenance of competition.
In general, the case for competition is built around different aspects of efficiencies particularly in the context of telecom sector given its significant positive externality on the rest of the economy. These aspects of efficiencies include: (a) technical or Xsector should operate at the lowest possible cost; (b) economic efficiency reasonable and reflect marginal costs; and (c) dynamic efficiency innovative and offer new products/services to the customers (Glaeser, 1927).
(a) Strategic role in the sector? Relevance for India’s growth and development?
(b) Role in ensuring competition in the sector in the future?
To answer the above, there is a need to examine the larger context of policy and regulation in the sector. At one end are the competition policy related issues such as market definition and dominance that include frameworks for definition of relevant markets, mergers and acquisition, minimum number of players, definition of significant market power and abusive behaviour. On the other end are issues related to sectoral regulation such as licensing, interconnection mandates, USOF, and spectrum management. These will have a significant bearing on the response to the issues raised above. It will be in the emergent context that we need to address the organizational restructuring of BSNL. This is depicted below:
Competition in the Telecom Sector
Traditionally telecom was considered a natural monopoly, like the electricity sector, with “wires” being the core reason. Changes in technology led to recognition that telecom can no more be considered as a natural monopoly (Stiglitz, 1999). In the absenceargument and with the realization that monopolies, whether private and public, resulted in loss of efficiency; the sector has been opened up for competition all over the world. This shifted the focus of attention from regulation on exercise of monopoly to increasing and
In general, the case for competition is built around different aspects of efficiencies particularly in the context of telecom sector given its significant positive externality on the
my. These aspects of efficiencies include: (a) technical or X-efficiency sector should operate at the lowest possible cost; (b) economic efficiency – profits should be reasonable and reflect marginal costs; and (c) dynamic efficiency – the sector shoinnovative and offer new products/services to the customers (Glaeser, 1927).
4
To answer the above, there is a need to examine the larger context of policy and regulation in the sector. At one end are the competition policy related issues such as market definition and
relevant markets, mergers and acquisition, minimum number of players, definition of significant market power and abusive behaviour. On the other end are issues related to sectoral regulation such as licensing,
anagement. These will have a significant bearing on the response to the issues raised above. It will be in the emergent context that we need to address the organizational restructuring of BSNL. This is depicted below:
Traditionally telecom was considered a natural monopoly, like the electricity sector, with “wires” being the core reason. Changes in technology led to recognition that telecom can no more be considered as a natural monopoly (Stiglitz, 1999). In the absence of such an argument and with the realization that monopolies, whether private and public, resulted in loss of efficiency; the sector has been opened up for competition all over the world. This
monopoly to increasing and
In general, the case for competition is built around different aspects of efficiencies particularly in the context of telecom sector given its significant positive externality on the
efficiency – the profits should be
the sector should be

5
Workable or Effective Competition
The degree of competition and rivalry is an abstract idea, which has to be translated into a set of operational criteria to judge and monitor the effectiveness of the competition. In the context of telecom sector specifically, the factors that can inhibit and promote competitive pressures have been discussed and identified (Jamison, 2012) in the literature. Some of the prominent structural factors which can inhibit competitive pressures are:
● Switching cost faced by consumers; ● Network effects – the value derived because of other customers; ● Lack of information with the customers about the implications of their choice; ● Entry barriers due to large sunk costs; ● Licensing restrictions on substitutability; ● Significant first mover advantage; ● Control of essential facilities; ● Exclusive rights on key technologies; ● Exclusive distribution rights; and ● Economies of scale and scope
The first two of these can be taken care of by regulations on number portability, improving the ease of portability, and comprehensive interconnections. Third one may be taken care of by improved disclosures, measurements and simple-to-understand pricing plans. All the others are supply side factors and their relevance depends upon the policies and regulations under which entry, continuation or exit is allowed.
Of the factors listed above, two are relevant for making an assessment on the question as to whether BSNL has strategic any role in the sector. The first of these is – “economies of scale and scope”. This is the only factor which implies that in the presence of significant economies of scale and scope, it is optimal to have fewer number of players. Thus, there is a trade-off between economies of scale/scope and rivalry. The second relevant factor is - “control of essential facilities”. If any player is vested with unfettered right to create and control network/ backbone and the player decides to exit/becomes bankrupt, then strategically the consumers and the country can be held to ransom. The simplest solution to this problem would be forcing the sharing of such essential facilities through regulations at least in the event of bankruptcy/exit as is the case with sectors such as roads, ports, and electric distribution companies. Such facilities are designated as public assets and cannot be liquidated under any circumstances. We could not find a definite answer to whether this is enabled in the telecom license as of now. There is a clause that allows the licensor to suspend the operation as given below and given the sovereign role, the government could take over infrastructure.
“The Licensor reserves the right to suspend the operation of this License/Service Authorization in whole or in part, at any time, if, in the opinion of the Licensor, it is necessary or expedient to do so in public interest or in the interest of the security of the State or for the proper conduct of the Telegraph. License Fee payable to the Licensor will not be required to be paid for the period for which the operation of this License remains suspended in whole. Provided that if situation so warrants, the Licensor may dispense with the issue of notice prior to such suspension. The decision of the Licensor shall be final and binding in this regard.”
In addition to the factors listed above, the conduct of players can also give rise to reduced effective competition. Some of the relevant cases are:
● Predatory pricing or cross-subsidization across businesses/markets;

6
● Exploiting informational advantage related to customers /technology; and ● Cartelization/Dividing the market
The conduct of players needs to be monitored by the regulator to ensure competitive behaviour in the sector and is determined by the effectiveness of the regulator in monitoring the conduct of players in the sector. Effective monitoring can rule out the possibility of reduction in rivalry and in the limit leading to emergence of monopoly/monopolies in the markets they serve.
How Many Players Are Required to Ensure Competitive Behaviour?
In the context of the telecom sector in India, the regulator does not regulate prices/tariffs (other than for rural areas) but has regulations covering structural factors such as number portability, interconnection rules and terms, entry and exit conditions and conduct of the players. One natural question which arises is how many players are required to ensure the outcomes/efficiencies usually associated with competitive markets.
This question can be and has been answered in two ways: (a) by specifying the number of players and the maximum market share of the dominant player up front, or (b) by specifying the conditions from which it can be inferred that the market is not competitive enough. Shepherd (2004) states that 5 players with no one having more than 40% with easy entry is likely to lead to outcomes similar to competitive markets from the consumers’ perspective. Possibly, similar reasoning was in the mind of Secretary (Telecom1) wherein he reportedly stated that the Indian Telecom Market will have 5 large players, 4 private and 1 BSNL-MTNL. In the presence of scale economies, the number could arguably be less with somewhat even lower number of players preventing any loss of rivalry due to structural factors or conduct of players. Clearly, the lower bound on this number is 3-4 with large enough market share of each player.
Experiences in Other Countries/Regions
In the EU, in several instances 4 to 3 mergers have not been allowed, fearing loss of consumer welfare, especially due to price increases (Tyagi, K., 2018) (Exhibit 6). Though, a recent merger of T Mobile NL with Tele2 NL reduced the number of players from 4 to 3, it was allowed to go through. These were the third and fourth largest players in the market, with a combined share of 25%. However, the regulators clarified that this was a special case and not necessarily a precedent. The regulators went through an investigation and came to the important conclusion that the transaction would not lead to significant price increase or likelihood of coordinated behavior.
In the US, the merger of AT&T Mobility and T-Mobile USA was contested by the Department of Justice and not allowed to go through. There were concerns that such a merger would reduce consumer welfare, increase prices and reduce innovation. However, the current planned merger of Sprint and T Mobility is being viewed with favor, given the relatively smaller sizes of the merging entities (“Blocking T Mobile’s Last Big Merger”, 2018).
In Australia, regulators review the impact of proposed merger, before allowing it to go through. Further, the ACCC has the mandate to review past mergers and open them for investigation (Armitage, Zaurrini, Tesvic & Ashurst, 2018).
1 “Indian telcos market to yield five major players creating 'enough competition': Telecom Secretary” Economics Times, 26th Feb 2017 available at https://economictimes.indiatimes.com/news/company/corporate-trends/indian-telcos-market-to-yield-five-major-players-creating-enough-competition-telecom-secretary/articleshow/57354485.cms

7
Thus, Competition Authorities/Regulators do have great concerns regarding reduction in number of players from 4 to 3 and have taken significant steps to ensure continued competitiveness and consumer welfare, especially, in terms of reduced prices.
The Indian Context
In the existing telecom scenario of three private and a public operator, it may be claimed that existence of BSNL is necessary to maintain competitiveness in the sector and ensure that consumers do not face price increases. However, even the concern of maintaining a competitive telecom sector by revival of BSNL is difficult to justify in its current organizational and functional condition of a revenue market share of around 8% and subscriber market share of around 12% and mounting losses of nearly Rs 56,000 cr (Exhibit 3 and 4c). In the current state, BSNL-MTNL can be an effective rival to the other players only through aggressive price based competition which has to be supported by the Government. And a case cannot be made for price support to BSNL-MTNL across the board.
The other way of answering the question of whether adequate competitiveness exists is to specify the conditions under which it can be inferred that market is not competitive enough. Sonik (1968) outlined a set of criteria that the market should be free from:
● Unsatisfactory product quality, suppression of new products, and incomplete standardization
● Over or under production because prices deviate from marginal cost ● Inefficient market processes, caused by restricting buyer access to less costly
alternatives, unnecessarily large transaction costs, and restrictions on price competition
● Inefficient production caused by poor business locations, outdated techniques, unexploited economies of scale or integration, and X-inefficiency
● Negative externalities, which occur when people not involved in an economic exchange is nevertheless negatively affected by the exchange
● Loss of rivalry because of malicious interference with competitors or fraud against customers or suppliers, predatory activities against rivals, foreclosure of rivals, refusals to deal, and collusion
● Discrimination among customers not justified by differences in demand or costs ● Excessive entry resulting in operators not achieving economies of scale or excessive
price competition that causes revenues to be inadequate to finance investment and innovation”
Based on the above conditions and from the current market scenario, most of the these do not seem to a big concern at this point in Indian telecom sector. However, at this point of time the only factor that needs some close monitoring of alleged “predatory” pricing by the most recent entrant and its consequences for the loss of rivalry in the sector over a period of time. In the future, competition policy in the sector may need to examine mergers more closely, especially when these reduce the number of market players to three. In such cases there may be a need to specify remedies that do not harm consumer welfare. In the current scenario, absent such a framework, the concern is dealing with predatory pricing. Even from that perspective, and in case of emergence of a dominant player, it is not obvious that BSNL-MTNL can play any meaningful role in such a situation, due to their lack of innovation, high costs, very few relevant content partnerships, and small and rapidly declining market shares as stated earlier.

8
Based on the analysis above, it is clear that in its current organizational and financial condition, BSNL-MTNL cannot be an effective rival to the other players except through price-based competition which has to be supported by the Government. We contend that given the grave challenges facing BSNL at this time, the entity needs significant restructuring in order to be able to face the competition existing in the sector. The best case, thus, for BSNL-MTNL is that they can be an effective rival (in terms of market share and costs) to other 3 private players and in the process help in building and retaining the competitive character of telecom sector. As argued earlier, this will require considerable restructuring of BSNL with change in work culture to make it more competitive and removal of ill-effects of legacy issues such as excess manpower, bureaucratic inefficiencies, appropriate utilization of real estate and other resources such as infrastructure to improve its cost effectiveness. Given that lot of the costs related to manpower and infrastructure are already committed, it is optimal to attempt revival of BSNL-MTNL with a clear time-frame (5 years) after which further role of BSNL as a continuing entity can be envisaged. Possible Role for BSNL in the Sector? Two other reasons for continued presence of BSNL in the telecom sector could be: (a) coverage of areas not adequately covered by other private players; and (b) continued availability of key telecom infrastructure even if private players exit/become bankrupt, as indicated earlier. The second problem can be addressed by the existing licensing regime as highlighted above. BSNL, in its current form, is not required for this reason. The first reason of covering under-served/strategic areas, even if not covered by private sector, could be covered by BSNL, but not necessarily in its current form. The rationale is elaborated below. Given the need of the nation (necessity of serving rural and underserved regions) or being involved in strategic sectors such as providing services to the armed forces or being the major backbone provider, we feel that in the current political and social context, BSNL as a state supervised entity could continue. Even in this limited role, BSNL needs to undergo substantial restructuring. BSNL’s claim that it has been serving the rural population while private operators have not done so effectively is not borne out by data. As is evident from Exhibit 7 that shows the rural subscribers and market shares for all operators, the rural penetration of BSNL is low in comparison to private operators and thus if BSNL has to play a significant role in this area, a restructuring would be required. In this situation, the self-sustainability of BSNL needs to be viewed in two dimensions: The immediate steps that need to be taken for short term (0-5 years) and longer term (> 5 years). In the short term, in order to become self-sustaining, BSNL needs to undergo a significant restructuring and must have strict performance orientation to emerge as a full-fledged effective pan-India players competing with the private sector. A significant part of this revival will entail dealing with issues such as 4G spectrum allocation, creation of infrastructure and project organizations, such as an Infrastructure Company and a Project Company. These would utilize the existing network and human resources of the existing BSNL and reduction in BSNL HR requirements. This latter would/could include transfer of employees to the new organizations as well as transfer to new areas of work such as Digital India, Smart Cities, and other national level networking projects for other PSUs, in addition to voluntary separation of employees due to superannuate in the next 4-5 years. The longer term sustainability should be reviewed after 5 years to ensure that BSNL is able to do what it

9
takes to survive for the next 5 years and in the longer term. If BSNL is able to turn around and emerge as a competitive player, then the options may include privatization through listing or/and a strategic sale and may require policy changes both at the sectoral and competition level. As argued elsewhere, the revival would require dealing with internal organizational issues as well as financial support/ spectrum with time-based milestones. On the other hand; if BSNL is not able to compete effectively and fails to obtain meaningful market share and generate operating profits, then a scaled-down version of BSNL may be contemplated to serve the strategic needs of the country with respect to telecom infrastructure or to cover under-served areas.
Part B: Policy Decision on 4G Spectrum Allocation to BSNL The issue of 4G spectrum allocation to BSNL has been pending for some time with the Government of India. Given that its competitors have already rolled out 4G in the regions serviced by them, it is essential that the government takes an immediate decision on allocation of 4G spectrum to BSNL. Exhibit 8 shows the spectrum holding by bands to private operators and BSNL/MTNL. This clearly shows that the amount of spectrum available with BSNL is far lower. Most of this is “unliberalized” spectrum, making it difficult for BSNL to offer 4G in the bands available with it as shown in Exhibit 9. BSNL did not get the spectrum in the 4G bands at the time of allocation to private bidders in 2010. Since it is required to pay the highest bid for spectrum in each circle (like other operators), other than when spectrum is shared or traded, BSNL found the price to be too high vis-a-vis its financial situation. However, after Jio’s entry, any operator not having 4G spectrum can effectively close its operations, as the data speeds and bandwidths available with 4G coupled with very low prices initially offered by Jio, have lured many 2G and 3G subscribers to 4G. Airtel has plans to phase all 2G and 3G subscribers and use the vacated premier 900 MHz band for 4G (https://telecom.economictimes.indiatimes.com/news/airtel-to-start-phasing-out-2g-3g-for-4g-says-vittal/66380933). Along with this transition, Airtel has also worked out a device deployment strategy largely in partnership with Karbon for low cost 4G handset. A harmonious handset device strategy is extremely important as borne out by Jio’s strategy and introduction of low cost handsets. Vodafone-Idea have similar plans (https://m.dailyhunt.in/news/india/english/gear-epaper gear/vodafone+idea+plans+to+phase+out+its+2g+and+3g+networks+to+shift+to+4g+only+report-newsid-100669886).
While BSNL was given spectrum in the 2500 MHz band (a 4G band), the ecosystem was not well developed at that point in time. BSNL wanted to return that spectrum. It is not clear why BSNL did not opt to use its 2100 MHz spectrum for 4G. The ecosystem for this band is well developed and is currently being used by various private operator. While BSNL could claim delays in 4G spectrum allocation by DoT, effectively, it has shown little initiative in using its existing spectrum for 4G. This indicates a lack of proactive approach to competition. BSNL has significant spectrum in the 900 MHz band, but this is unliberalized and due to existing regulation cannot be used for 4G (Exhibit 9). This needs to be ‘converted’ to 4G spectrum by paying an amount equal to that paid by the highest bidder in the previously held auction. From a cost-benefit point of view, the costs of 4G spectrum allocations are: (i) the opportunity cost of spectrum; (ii) incremental capital expenditure by BSNL for 4G roll-out; and possibly (iii) inertial continuity (business-as-usual) of BSNL. The benefits, on the other hand, are: (i) savings in the contribution from revenue (which will be lost eventually in the

10
absence of 4G); (ii) continued market presence of BSNL; and (iii) possibly improved morale of the BSNL employees. The costs and benefits are further discussed in detail: Costs:
1. Opportunity Cost of Spectrum: To analyse this, we look at the current spectrum bands i.e. 800 MHz, 900MHz, 1800 MHz, 2100MHz, 2300 MHz and 2500 MHz for 4G. As per the TRAI Recommendations on Pricing of Spectrum dated August 1, 2018, the only available bands in which BSNL could get minimum 5 MHz spectrum across all LSAs is 700 MHz and 2100 MHz (other than Rajasthan). For Rajasthan, BSNL has requested 5 MHz in the 800 MHz band. Exhibit 10 gives the comparative aspects of the three feasible bands for 4G: 700 MHz, 2100 MHz and 2300 MHz and the associated issues.
In the current state of the telecom sector, most bidders are not willing to participate in auctions as their financial health is poor. They are also concerned about the high reserve prices in the TRAI Recommendations. For example, out of the 360 MHz put up for auction in October 2016 in the 2100 MHz band, 85 MHz was sold in 12 LSA (as per TRAI Recommendations, page 11). While the above based on the usual license period of 20 years, it is not necessary that BSNL may be allocated 4G spectrum for the 20-year period, right at the beginning. The allocation could be a non-standard contingent allocation for 5 years to be extended only if BSNL is able to transform itself for a meaningful or competitive role. Given the above, there is little opportunity cost for the government for the next three to five years. Since the 2100 MHz band has better coverage characteristics than the 2300 MHz band in which many of the operators have their 4G services. So, there may be demand for this band when auctions are held in the future.
2. Incremental Capital Expenditure by BSNL for 4G Roll-out: BSNL has submitted to DoT that capex required for the existing 80,000 2G and 3G sites to be upgraded to 4G and for additional 20,000 towers that BSNL intends to deploy for 4G, would be around Rs 11,000 cr. BSNL should be asked to do tower sharing and use managed service operations to reduce capex. This is what all private operators do.
3. Inertial continuity (business-as-usual) of BSNL: This cannot be quantified and can
only be managed with appropriate performance measures.
Benefits: i) Savings in the contribution from revenue (which will be lost eventually in the
absence of 4G): This will cease to be relevant as after 2-3 years without 4G, BSNL or any other operator would have the only very low end subscribers, from whom much lower revenues are expected. Without 4G, there is very little data revenue. Enterprises, seeking complete solutions would also seek 4G services as an integral part of the vendor offering.
ii) Continued Market Presence of BSNL: As highlighted above, this is contingent on
it getting 4G spectrum. But under strict performance guidelines.

11
iii) Possibly Improved Morale of the BSNL Employees: This will contribute in case
the above points materialize. Thus, sustainability of BSNL without giving it 4G spectrum is not foreseen. The market shares and financial health of BSNL is already very poor (Exhibits 3, 4a, 4b and 4c). If BSNL has to be revived, any further loss of market share due to non-allocation of 4G would make it almost impossible for BSNL to be able to sustain in the future. To the extent any meaningful role of BSNL is envisaged in the future with a market-wide role, allocation of f 4G spectrum is imperative. Non-allocation, de facto, may make BSNL virtually defunct in next few years as far mobile services are concerned. Our analysis and opinion on the issue of allocating 4G spectrum to BSNL is as follows:
1. While there is some opportunity cost or possible loss of revenue to the government and it may turn into a case of ‘spending good money after bad’, not allotting the spectrum to BSNL will be a clear signal that the government wants the BSNL to close down and die.
Not allotting the spectrum to BSNL at this stage will be counter-productive and also anti-people given that BSNL has already been preparing for roll out of 4G for last many months. Also, in the circles that we surveyed, many citizens are still using BSNL services and are expecting that they will be given 4G services soon.
2. Giving the spectrum to BSNL will also be perceived as a positive decision by the
employees of BSNL given that the prevailing perception in the organization (BSNL) is that they have been given a step-motherly treatment by the government (DOT) so far.
Though allocation of 4G to BSNL runs the risk of BSNL continuing with a business-as-usual attitude without seriously changing itself, conditional allocation of 4G spectrum for an initial period of five years may be given provided there is commitment to address manpower, real estate and operating performance related issues by DoT and BSNL going forward. We recommend the following conditions to be put on BSNL when allocating it 4G spectrum:
1. Since by allocating 4G spectrum, not only the DoT but BSNL also needs to spend additional resources as given above in rolling out 4G network, hence there is a need to minimize capital expenditure by BSNL. This could be more aggressive tower sharing and leasing, drastically reducing delays in procurement and efficiently rolling out area/customer specific tariff plans. Our estimate of a three year cost of rolling out 4G using a managed service contract and leasing towers based on reported data of private operators over a three year period is significantly lower than that proposed by BSNL over the same time period (Exhibit 11). The scenarios generated in the Exhibit show the analysis for a range of BTS that may be deployed.
2. The spectrum should be allocated for 5 years review period, after which the license
period may be extended, based on performance, for another 15 years. The total license period would then be at par with the regime for private operators. This would lead to lesser concern from private operators regarding any ‘special concession’ being given to BSNL. For BSNL, this mechanism could mean a reduced flow of spectrum license
12
fee. Since the upfront license fee payable is only 50%, and BSNL is being given the license initially for five years (in contrast to the 20 year license fee period of private operators), the immediately payable fee (50%) would only be Rs (15000* 5/20) *0.50 =Rs 1875 cr.
3. Each circle of BSNL and BSNL as a whole must be given a strict mandate to become operationally self-sustaining (should be able to meet at least all operational expenses) from the third-year post the allocation of 4G spectrum.
3. While there are actions that BSNL may be able to undertake on its own such as
redesign of its organizational policies and structure, it will need DoT’s support in dealing with its excess human resources.
4. Future allocation of other spectrum bands (4G, 5G, etc.) will be conditional upon BSNL’s (and each circle’s) performance as monitored from the third-year post 4G allocation.

13
Part C: Identified Challenges in Revival /Restructuring of BSNL
The challenges facing BSNL can be classified into three major heads:
1. Technological/Market: These include the rapid evolution of technology (5G, IOT), fast evolving consumer needs of data consumption, changing demographics patterns and increasing role of content in driving businesses. Such a combination of technology/market characteristics requires organizations to have agility, build partnerships, reduce costs, and be innovative. On all these dimensions BSNL has significant challenges. The mechanism for responding to the challenges is not elaborated as it is included in the part on organizational challenges.
2. Policy Environment: Since BSNL is 100% government owned, it is often subject to the delays and decisions made by the government. For example, while the government has transferred its liabilities (i.e., workforce) to BSNL, the transfer of land and building assets are yet to be completed. There seems to be a lot of confusion surrounding the ownership of the land and building assets of BSNL.
3. Organizational: These are specific to the systems and processes adopted by BSNL. These relate to delays in procurement due to its own inefficiencies and the need to follow guidelines for public procurement; centralization of deployment of tariff plans, leading to inflexibility in service offerings; poor linkage of performance with incentives, frequent transfers etc. The larger challenges relate to developing organizational responses on rapid developments in the sector, building partnerships, enhanced marketing orientation.
Below we describe some of the significant challenges being faced by BSNL in those categories where BSNL/DoT could take action.
Policy Environment
a. Delay in allocation of 4G spectrum as outlined in Part B.
b. Lack of a separate project organization: BSNL operates as a single entity under a UAS License: All telecom service operators have to pay 8% revenue share from all activities that occur under the UAS License. BSNL’s bid for projects, including those that do not explicitly involve telecom services is higher due to the revenue share. This makes its bid uncompetitive. In comparison, other operators have set up subsidiaries that can undertake such projects, and thus there is no mandate of revenue share.
c. Flux in the Decision Regarding MTNL: MTNL serves the national capital region and
Mumbai. BSNL serves the rest of the country. All telecom service providers have pan-India presence and earn about 40-50% of the revenues and 30-40% profit from these two metropolitan cities. However, despite this, MTNL has been suffering mounting losses. The operation of BSNL and MTNL as two separate entities is economically, operationally and financially sub-optimal.
d. Delays in Project Allotment and Project Funding: The project allotment may get stuck due to bureaucratic procedures and processes, and also delays in decision-making. Often times, lack of clarity of criteria on which to base decision is missing. Also, at time the payments for the approved and completed projects is delayed by DoT. The delays in

14
allotment of projects and the payments from DoT leads to avoidable demotivation and financial loss for BSNL.
e. Removing Market/Financial Inefficiency: At present, BSNL is 100% government
entity. In order to infuse capital and also to bring in market/financial efficiency, it may be important to think about listing of BSNL (like other PSUs such as ONGC, GAIL, NTPC, etc.).
Organizational Challenges
a. Large Legacy Workforce: BSNL has a huge legacy workforce. Exhibit 12 shows that
workforce of BSNL is 1,71,523. Majority (about 70%) of this workforce was transferred to BSNL from DoT at the time of formation of BSNL. The workforce of BSNL has an average age of more than 55 years (especially in the group C and D field staff). This workforce lacks interest in improvement of services, providing good quality customer service and even lacks technical knowledge.
b. The Board: There have been concerns about the Board composition and representation
from the business fraternity. Also top and Board positions often go vacant for long periods of time. The middle level management is dominated by executives promoted from JEs/JTOs who were absorbed/transferred to BSNL at the time of its formation. These professionals are mostly above 55 years of age and have very little motivation to improve the condition of BSNL.
c. Centralized Structure – Important activities like procurement of equipment, handling of
finances, preparation of tariff plans, recruitment, etc. are done centrally through the BSNL headquarters. The circle heads (CGM and PGM) are not empowered to make decisions regarding the above-mentioned issues by themselves.
d. Lack of Well-thought Out Policies and Systems: Even after about 19 years of existence,
BSNL does not have well thought out people-related policies. Some of the important policies such as the ones mentioned below are missing:
i. Performance management and promotion policy – The performance
management system in BSNL is quite superficial. The promotion happens in a time-bound manner and there is no recognition of merit in the system. Today, mediocre people are holding important positions. There is lack of professional leadership in the organization.
ii. Manpower planning and recruitment – There is no serious manpower
planning that has happened in the organization since the time it was found. The recruitment has happened over the years in a very ad hoc manner at both the headquarter as well as the circle level.
iii. Different cadres in the organization – People hired at the same level job
titles have been given different job designations.

15
iv. Shutting down of small exchanges – There are a lot of exchanges that are unviable due to low number of connection but are still being maintained/operated by BSNL. There is no clear policy/decision being taken by the headquarters about shutting down of these unviable exchanges.
e. Lack of Customer Orientation – There is tremendous demotivation in the BSNL
workforce due to the poor performance of the PSU, ill-thought policies, lack of commitment of the leadership, aging workforce, non-implementation of 3rd PRC and suspension of staff amenities and other dues like the reimbursement of medical bills, LTC, etc. This lack of enthusiasm has transferred into poor customer service leading to a reduction in customer connections over time.
Part D: Suggestions for Revival /Restructuring of BSNL
While not completely within the purview of the IIMA MOU for this project, our analysis suggests that the government and DoT need a more refined policy on the sector structure and mergers in the sector. This is more relevant when number of effective operators reduce from 4 to 3. Other key initiatives include review of MTNL and its relationship to BSNL and articulating the role of a public telecommunication service provider in the current context. Based on our analysis, below we identify the key areas for transformation of BSNL.
1. Accelerate Asset Transfers: DoT should work closely with BSNL to identify all lands and buildings that have not yet been transferred to BSNL. Though the land valuation as has been done so far and given in Exhibit 13 as in 2015 was around Rs 6000 crores (may be 7000-8000 crores at most), the land and real estate not required by BSNL-MTNL for telecom operations need to be not only monetized to finance revival of BSNL but also will put this real estate for more efficient usage. This needs to be done within a six month period. Maximizing value of the released real estate may not only require support from the Government for land use change but also an independent entity specializing in real estate development. The amount assessed as of now, however, does not look significant enough to help finance BSNL revival completely.
2. Accelerate the Operation of BSNL Tower Corporation Limited (BTCL). This company is not totally operational as BSNL has not transferred all the towers to it. While having a separate company will bring in the required efficiencies, it also gives BSNL an opportunity to do a variety of projects under it. Since this is an infrastructure company, it is not subject to the 8% revenue share charges. This is a flexibility that could be easily exploited by BSNL. We recommend BSNL should complete the transfer of towers from BSNL to BTCL within six months..
3. Create a Separate Fibre Infrastructure Division: This should be a part of the BTCL, given that in spirit it is a network infrastructure company. There could be a rationale for setting up this as a separate company, but given the time it would take to set up the company, for the short term, we are suggesting, creation of a Fibre Infrastructure Division under BTCL. Given the projected growth of Broadband, optical fibre network is a valuable asset for any telecom service company. Increasingly, FTTH is an important source of new services, as homes start to use mobile broadband, smart TVs and other
16
devices. However, BSNL has not been able to leverage this asset to its full potential. In order to release this potential, BSNL should create a separate fibre infrastructure division. This should be done with focus and efficiently and not allowed to languish as was the case for the tower company. This division, like the tower company should work with third parties, including state governments. This should be done over a time frame of six months..
4. Create a Project Division: This should be a part of the BTCL. There could be a rationale
for setting up this as a separate company, but given the time it would take to set up the company, for the short term, we are suggesting, creation of a This organization should undertake projects of strategic importance to the nation such as deploying rural services, creating a network for armed forces, connecting hilly areas. The projects would be funded by the organizations that require such services. Relevant staff from BSNL should be transferred to this division. This will further bring down the human resource costs to BSNL. Having a separate division will bring in the transparency of efficiencies in project execution, costs and outputs. This would also allow BSNL project bids to be more competitive as the projects under this division would not be subject to the 8% revenue share.
5. Facilitate 4G Spectrum Allocation: 5MHz of 2100 MHz band as 4G spectrum should be allocated to BSNL immediately but only for a limited 5-year period. This may require around Rs 1875 crores of license fee payment for 5 years. This can be financed by either equity injection from the Government or by borrowing the same with guarantee from the Government given financial condition of BSNL. Also, the Government should pose the following conditions on the BSNL while allocating the spectrum:
i. i. BSNL should be forced to get into aggressive tower sharing and leasing agreements with other telecom service providers. This will reduce the expenditure of rolling out 4G services by BSNL. Instead of Rs 11,000 crores asked for by BSNL to roll-out 4G services, BSNL might be asked to re-examine the proposed capital expenditure with tower-sharing and managed-services model.
ii. ii. The spectrum should be allotted circle-wise for 5 years. Each circle of BSNL and BSNL as a whole must be given a strict mandate to become operationally self-sustaining (should be able to meet at least all operational expenses) from the third-year post the allotment of 4G spectrum.
iii. iIii. The 4G allocation should be conditional on circles preparing a business plan, including identification of only core and relevant human resources for BSNL’s continued operation, policies for greater professionalization, increased devolution of decision making to the circle heads, improved IT systems etc.
iv. iv. BSNL and DoT must come up with a plan within six months of allocation of
4G spectrum as to how it can best utilize its resources including human resources. The latter may require offering/negotiation at various levels with BSNL, possibility of VRS or reduction of superannuation age along with discussion on business plan and pay-revision and transfer of employees to different proposed infrastructure and project organizations of BSNL and programs such as Digital

17
India, Solar mission, Smart Cities etc. The details of the impact of reducing the retirement age and introduction of VRS are presented in point 6.
v. v. Future allotment of other spectrum bands (4G, 5G, etc.) will be conditional
upon BSNL’s (and each circle’s) performance as monitored from the third-year post 4G allotment.
6. Organizational Restructuring: including design for challenges highlighted in Part C and
reduction in superannuation age by 2 years.
a. Reduction of Retirement Age: We recommend the reduction of retirement age to 58 years. The average age of BSNL workforce is above 55 years. As can be seen from Exhibit 12, if the retirement age is brought down to 58 years, the reduction of workforce that may be achieved will be about 33,568 employees (17142+16426).
The employee benefits expense of BSNL in 2016-17 was about Rs. 15,715 Cr (Exhibit 14). The employee strength of BSNL in the same year was 1,96,448 (from BSNL annual report 2016-17). This implies the per employee cost is about Rs. 8 lakhs (as per 2016-17 figures). As shown in Exhibit 12, the total saving due to reduction of retirement age to 58 years over the next six years will be about Rs 13,895.44 Cr. Even if the reduction of retirement age has to be done at the cost of implementing the 7th CPC recommendations (or 3rd PRC of BSNL), the saving will be about Rs 7,505 Cr (assuming a 15% rise in employee cost due to the implementation of 3rd PRC).
b. VRS scheme: A VRS scheme should be brought in for all employees in the age group of 50 or more years.
The scheme will be modelled on the following lines (as per DPE guidelines and the ‘Gujarat Model’):
i. An ex-gratia amount of salary (pay & dearness allowance) of 35 days for every completed year of service and 25 days for the balance of service left until superannuation (of up to 58 years) shall be paid to the employee.
ii. All normal pensionary benefits under Rule 37A of the CCS Pension Rules in addition to the ex-gratia benefits would be available to the employee who has been given VRS.
Expected Cost of VRS Scheme: The cost components of VRS are as follows: Ex-Gratia, Gratuity, Pre-ponement of Pension, Pension Commutation, Leave Encashment. The number of employees who will retire through VRS will be 20,883 (assuming 25% of [16158+15882+13582+11698+9059+7163+5264+4537]) (refer Exhibit 12). The employee cost that BSNL will likely save due to the VRS will be 20,883 * 8 lakhs = Rs. 1,670.56 Cr per year (without implementing 3rd PRC) and 20,883*9.2 lakhs = Rs. 1921,24 Cr per year (after implementing 3rd PRC).

18
As of now, we do not have exact data of VRS components.. However, given the experience of MTNL (estimated cost was Rs. 5953 Cr. for 9527 employees of MTNL2), we estimate the cost of VRS will be about Rs 13,048.86 Cr.
c. BSNL Leadership and Board of Directors: The Board of Directors should also include professionals who have had experience of running large businesses. The board should not have only civil servants and academicians as Independent Directors who have not been associated with running of business. Academicians for top-ranked Indian management institutes or foreign institutes may be opted for board positions. However, the number of academicians should not be more than 1 at any time. Also, the top managerial positions should not be left vacant for a period of more than 3 months.
d. Implementing a performance-driven culture: All employees should be evaluated on a well established performance criteria. A merit-based culture should be created in the organization. All appointments (recruitments and promotions) should be based strictly on merit. The top leadership of BSNL should be evaluated by DoT and should be made accountable for the profits and health of the organization. We even suggest that the top leader (CMD) should be a professional who has had experience of running business rather than a government servant who is appointed on a fixed-tenure by the government.
e. Details of other changes in BSNL that will be required for a turnaround will be provided in the Final Draft Report. The above is indicative of the major changes necessary at the top level only.
7. Provide Contingent Liquidity Support for BSNL: Given its financial condition, BSNL may require financial support for it to be revived in future. BSNL has already asked for authorization to take loans for 50% of its operating expenses for next 2 years. While from an accounting point of view, asking for letter of comfort (a contingent liability) is not same as budgetary support, economically both are equivalent. Instead of providing an ad-hoc support as asked for, BNSL needs to be provided this much needed support based on circle-wise business plans and its continuation/enhancement should be based on key milestones to be achieved going forward.
8. Postpone Listing of BSNL: While there is a possibility of listing of BSNL to bring in financial efficiencies, given BSNL’s current financial situation and the market sentiments with regard to performance of government entities, we do not think this is an opportune time for this. ("Most IPOs of the government companies in the past two years have not been fruitful to investors. Share prices of companies – including Garden Reach Shipbuilders & Engineers Limited, Ircon International Limited, The New India Assurance Company, General Insurance Corporation of India – which were listed on the stock exchanges are trading much below the issue price. This has resulted in steep losses to the IPO investors and dented demand for shares of government companies coming up for listing." (https://indianexpress.com/article/business/railtel-wapcos-among-6-cpses-to-issue-ipos-listing-schedule-to-follow-5514366/ accessed on January 4, 2019)
2 As per details shared with us about VRS scheme for MTNL by DoT

19
After five years, if BSNL is able to implement critical suggestions to improve its financial and organizational situation, then at that point, BSNL should be considered for privatization, either through a listing or a strategic role.
9. Create an Independent Review Mechanism: Simultaneously in working out the steps identified above, the government must set up an independent on-going review mechanism for assessing the efficacy of BSNL’s board decisions. This mechanism should have a very low representation from the government. Since continuation of BSNL would be contingent upon it taking several steps, including those mentioned above, and some of these are difficult and transformational, such a mechanism will strengthen the Board processes and provide visibility to BSNL’s efforts.

20
References (to be added)

21
Exhibits
Exhibit 1: Date and Location of Meeting BSNL Teams
Sr No Location Circle Dates of Meeting
Vertical / Team
1 Ahmedabad Gujarat 8th and 9th
October, 2018
CGM, PGM (Fin), PGM (CM), PGM (NWP - CFA), PGM (NOW-CFA), Sr. GM (HR/Admin), GM (Mktg - CM),
Unions and Associations
2 Trivandrum Kerala 1st and 2nd November,
2018
CGM, PGM (Fin), PGM (TVM BA), Sr. GM (Sales and Marketing), GM
(HR and admin)
3 Shillong NE 1 29th
November, 2018
CGM, GM (S&M - EB), PGM (CFA), PGM (CM), GM (HR and Admin and
Chief Engineer Civil), Unions and Association
4 Kolkata Calcutta
Telephones
30th November
and 1st December
2018
CGM, Sr GM (HR and Admin), PGM (Fin), PGM (CFA), PGM
(Transmission), PGM (Planning and Development), PGM (Transmission),
PGM (CM), GM (Sales and Marketing), Unions and Associations
5 Chandigarh Punjab Circle 4th and 5th December,
2018
CGM, DGM (Marketing), GM (CM), GM (CFA), GM (Finance), GM (EB and IT), GM (HR and Admin), CE
(Civil / Electrical)
Source: Meeting schedule as shared by BSNL

22
Exhibit 2: Total Subscribers by Operator as of 31st March (cr)
Company 2008-09
2009-10
2010-11
2011-12
2012-13
2013-14
2014-15
2015-16
2016-17
2017-18
Reliance Jio - - - - - - - - 11 19 Bharti Airtel 10 13 17 18 19 21 23 25 28 31 Vodafone 7 10 13 15 15 17 18 20 21 22 BSNL 8 10 12 12 12 11 9 10 12 12 Idea 4 6 9 11 12 14 16 18 19 20 Total 29 39 51 57 59 62 66 73 90 104
Source: DoT compiled data from Telecom Statistics India Report 2018 accessed on 22/12/2018
Mar-09 Mar-10 Mar-11 Mar-12 Mar-13 Mar-14 Mar-15 Mar-16 Mar-17 Mar-18
Reliance Jio - - - - - - - - 11 19
Bharti Airtel 10 13 17 18 19 21 23 25 28 31
Vodafone 7 10 13 15 15 17 18 20 21 22
BSNL 8 10 12 12 12 11 9 10 12 12
Idea 4 6 9 11 12 14 16 18 19 20
-
5
10
15
20
25
30
35
No
of S
ubsc
ribe
rs in
cr
Total Subscribers by Operator
Reliance Jio Bharti Airtel Vodafone BSNL Idea

23
Exhibit 3: Subscriber Market Share by Operator as of 31st March (%)
Company 2008-09
2009 -10
2010-11
2011 - 12
2012-13
2013 -14
2014-15
2016-16
2016-17
2017-18
Reliance Jio - - - - - - - - 12 18 Bharti Airtel 33 33 33 32 33 33 35 35 31 30 Vodafone 24 26 27 26 26 27 28 27 23 22 BSNL 28 25 23 21 21 18 14 14 13 12 Idea 15 16 18 20 21 22 24 24 21 19 Total 100 100 100 100 100 100 100 100 100 100
Source: DoT compiled data from Telecom Statistics India Report 2018 accessed on 22/12/2018
-
5
10
15
20
25
30
35
40
Mar
ket S
hare
%
Mar-09 Mar-10 Mar-11 Mar-12 Mar-13 Mar-14 Mar-15 Mar-16 Mar-17 Mar-18Reliance
Jio - - - - - - - - 12 18
Bharti Airtel 33 33 33 32 33 33 35 35 31 30
Vodafone 24 26 27 26 26 27 28 27 23 22
BSNL 28 25 23 21 21 18 14 14 13 12
Idea 15 16 18 20 21 22 24 24 21 19
Subscriber Market Share by Operator
Reliance Jio Bharti Airtel Vodafone BSNL Idea

24
Exhibit 4a: Operator wise Total Income for the Year Ending 31st March (Rs cr)
Company
2008-09
2009-10
2010-11
2011-12
2012-13
2013-14
2014-15
2015-16
2016-17
2017-18
Reliance Jio
-
0
1
0
0
0
1
3
1
20,158
Bharti Airtel
34,539
35,987
38,339
42,229
46,814
50,772
60,689
62,044
64,803
54,740
Vodafone*
20,400
23,600
27,300
31,649
36,586
40,606
45,550
43,302
42,843
34,757
BSNL
35,812
32,045
29,688
27,934
27,128
27,996
28,645
32,411
31,533
26,766
Idea
10,334
12,312
15,507
19,308
22,157
26,403
31,732
35,981
35,476
28,127 Source: Capitaline Database / TRAI / DoT reports accessed on 22/12/2018 *Source: Voice&Data, from various editions, available at http://voicendata.ciol.com/, accessed on July 20, 2018 and Company's annual reports accessed from CMIE PASE database on 22/12/2018
-
10,000
20,000
30,000
40,000
50,000
60,000
70,000
Inco
me
in c
r IN
R
Mar-09 Mar-10 Mar-11 Mar-12 Mar-13 Mar-14 Mar-15 Mar-16 Mar-17 Mar-18Reliance Jio - 0 1 0 0 0 1 3 1 20,158
Bharti Airtel 34,539 35,987 38,339 42,229 46,814 50,772 60,689 62,044 64,803 54,740
Vodafone* 20,400 23,600 27,300 31,649 36,586 40,606 45,550 43,302 42,843 34,757
BSNL 35,812 32,045 29,688 27,934 27,128 27,996 28,645 32,411 31,533 26,766
Idea 10,334 12,312 15,507 19,308 22,157 26,403 31,732 35,981 35,476 28,127
Opertorwise Total Income
Reliance Jio Bharti Airtel Vodafone* BSNL Idea

25
Service Provider wise Adjusted Gross Revenue for Access Services
Operator
Calendar Year (Rs cr)
Market Share (%)
2016 2017 2016 2017 Reliance Jio -303 7,466 -0.19 6.09
Bharti 48,880 36,922 29.88 30.11 Vodafone 34,680 26,308 21.20 21.46
BSNL 13,110 10,564 8.01 8.62 Idea 29,436 22,616 17.99 18.44
Others 37,802 18,738 23.11 15.28
Total 1,63,605 1,22,614 100 100 Source: TRAI Yearly Performance Indicators of Indian Telecom Sector 2017, https://www.trai.gov.in/sites/default/files/YPIRReport04052018

26

27
Exhibit 4b: Total Expenses by Operator for the Year Ending March 31st (Rs cr)
Company 2008
-09 2009
-10 2010 - 11
2011 -12
2012 -13
2013 -14
2014 -15
2015 -16
2016 -17
2017 -18
Reliance Jio - 1 1 3 3 5 9 15 31 16,312 Bharti Airtel 21,534 18,800 20,443 24,179 28,822 30,692 33,026 41,627 45,106 43,606 Vodafone* 1,984 2,142 2,493 2,854 3,336 3,837 3,833 3,825 1,911 1,845 BSNL** 31,117 31,731 33,842 30,665 28,971 28,759 31,132 30,060 29,756 33,724 Idea 7,436 9,613 12,916 15,881 18,275 22,465 25,894 29,398 32,071 29,755 Source: Capitaline Database / TRAI / DoT reports accessed on 22/12/2018 *Source: As per Capitaline Data base for Vodafone India Ltd. - Figures to be checked. ** Total Expenses for 2017-18
-
10,000
20,000
30,000
40,000
50,000
Exp
ense
s in
cr
INR
Mar-09 Mar-10 Mar-11 Mar-12 Mar-13 Mar-14 Mar-15 Mar-16 Mar-17 Mar-18Reliance Jio - 1 1 3 3 5 9 15 31 16,312
Bharti Airtel 21,534 18,800 20,443 24,179 28,822 30,692 33,026 41,627 45,106 43,606
Vodafone* 1,984 2,142 2,493 2,854 3,336 3,837 3,833 3,825 1,911 1,845
BSNL** 31,117 31,731 33,842 30,665 28,971 28,759 31,132 30,060 29,756 33,724
Idea 7,436 9,613 12,916 15,881 18,275 22,465 25,894 29,398 32,071 29,755
Total Expenses by Operator
Reliance Jio Bharti Airtel Vodafone* BSNL** Idea

28
Exhibit 4c: Operator wise Profit after Tax for the Year Ending 31st March
(Rs cr)
Profit after Tax (PAT)
Company 2008 -
09 2009-
10 2010-
11 2011 -
12 2012-
13 2013-
14 2014-
15 2015 -16
2016 -17
2017 -18
Reliance Jio - -1 -5 -5 -6 -11 -23 -16 -31 723 Bharti Airtel
7,744 9,426 7,717 5,730 5,096 6,600 13,201 7,780 -9,926 79
Vodafone*† 147 250 -1,157 -2,251 -1,391 1,166 -17 1,322 -4,314 -8,082 BSNL 575 -1,823 -6,384 -8,851 -7,884 -7,020 -8,234 -4,859 -4,793 -6,213 Idea 1,001 1,054 845 577 818 1,689 2,810 2,646 -831 -4,781 Source: Capitaline Database / TRAI / DoT reports accessed on 22/12/2018 *Source: Consolidated from yearly annual reports of the company on CMIE Pace database accessed on 22/12/2018 †PAT for years '09, '11 and '12 are for Vodafone India Ltd and do not include other group companies as the date for them could not be validated
-15,000
-10,000
-5,000
-
5,000
10,000
15,000
PA
T in
cr
INR
Mar-09 Mar-10 Mar-11 Mar-12 Mar-13 Mar-14 Mar-15 Mar-16 Mar-17 Mar-18Reliance
Jio - -1 -5 -5 -6 -11 -23 -16 -31 723
Bharti Airtel 7,744 9,426 7,717 5,730 5,096 6,600 13,201 7,780 -9,926 79
Vodafone*† 147 250 -1,157 -2,251 -1,391 1,166 -17 1,322 -4,314 -8,082
BSNL 575 -1,823 -6,384 -8,851 -7,884 -7,020 -8,234 -4,859 -4,793 -6,213
Idea 1,001 1,054 845 577 818 1,689 2,810 2,646 -831 -4,781
Operatorwise PAT
Reliance Jio Bharti Airtel Vodafone*† BSNL Idea
29
Exhibit 5: Operator wise Expenses per Subscriber as of 31st March (Rs)
Expenses (Cost of Production + Selling Cost)
Company 2008 -
09 2009-
10 2010-
11 2011 -
12 2012-
13 2013-
14 2014-
15 2015 -16
2016 -17
2017 -18
Reliance Jio - - - - - - - - 3 874 Bharti Airtel 2,228 1,438 1,235 1,310 1,505 1,470 1,439 1,633 1,625 1,415 Vodafone* 288 212 185 190 219 230 208 193 91 83 BSNL** 3,819 3,262 2,891 2,535 2,382 2,542 3,339 2,959 2,585 2,721 Idea 1,728 1,506 1,443 1,409 1,503 1,654 1,641 1,679 1,688 1,526
Source: Capitaline Database / TRAI / DoT reports accessed on 22/12/2018 *Source: As per Capitaline Data base for Vodafone India Ltd. - Figures to be checked ** Total Expenses for 2017-18
-
500
1,000
1,500
2,000
2,500
3,000
3,500
4,000
4,500
Exp
ense
s in
IN
R
Mar-09 Mar-10 Mar-11 Mar-12 Mar-13 Mar-14 Mar-15 Mar-16 Mar-17 Mar-18Reliance Jio - - - - - - - - 3 874
Bharti Airtel 2,228 1,438 1,235 1,310 1,505 1,470 1,439 1,633 1,625 1,415
Vodafone* 288 212 185 190 219 230 208 193 91 83
BSNL** 3,819 3,262 2,891 2,535 2,382 2,542 3,339 2,959 2,585 2,721
Idea 1,728 1,506 1,443 1,409 1,503 1,654 1,641 1,679 1,688 1,526
Operatorwise Expenses per Subscriber
Reliance Jio Bharti Airtel Vodafone* BSNL** Idea

30
Exhibit 6: Merger Control in Three EU Markets
Country Austria
Year 2012
Players H3G, Orange, Telecom Austria ,T-Mobile
Proposed Merger
H3G/Orange
Decision on Merger
Overall evidence indicated that merger would lead to significant unilateral effects which was identified as principal theory of harm
Quantitative Techniques
Evidence from surveys, market data and econometric simulations to asses closeness between H3G/Orange
Gross upward pricing pressure index was used for first time in Phase -II merger to analyze the impact of concentration on retail mobile prices
Merger Challenges
H3G was identified as modern innovative MNO that had disrupted market through first-time services, best network quality, aggressive price-based competition & data focused strategy
Disappearance of H3G was expected to lead to stabilization of markets and absent substantial efficiency gains to result in diminished incentives for H3G to continue to compete aggressively in markets
Quantitative evidence indicated H3G was a more significant competitive force than its market share showed
After merger it was unlikely that a new MNO could enter the market in short term
MVNOs which could discipline prices at the retail level were few and far in between as incumbent mnos had raised artificially high barriers to entry by protecting retail business through high whole sale access fees and in some cases outright refusal to enter into negotiations with mvnos
Overall immense market failure
To operate as an MVNO in Austria required entrants to access portability database involving substantial investment and lengthy period of time or needed to enter agreement with another MNO. Orange was in four mnos to offer this service
In absence of remedies unlikely MVNO or MNO could enter the market
Merger Remedies
Parties entered into an upfront MVNO agreement with UPC to ensure entry as full MVNO
Parties also offered to provide wholesale access on competitive terms and conditions to up to 16mvnos over next 10 years to more than 30% of H3Gs network capacity
Fast track dispute resolution was proposed
H3G offered to divest 2* 10 mhz of spectrum in the 2600 mhz frequency band to a new entrant - that spectrum reserved to be sold at an auction
Merger was conditional on sale of subsidiary to A1 Telekom Austria & H3G offered to sell spectrum and some assets to A1
Merger Impact
Evidence of positive impact of consolidation on innovation and quality of service by examining direct measures of consumer benefits
Gsma report highlights importance of dynamic efficiencies in mobile mergers and, in particular, how these efficiencies directly benefit consumers
Analysis shows that the 2012 merger accelerated hutchison’s 4g population coverage by 20 to 30 per cent and delivered 4g download and upload speeds that are 7mbps and 3mbps higher than would have been expected without the merger
Resulted in hutchison outperforming european operators in similar market positions
The merger significantly increased the quality of all mobile networks, with 4g download and upload speeds increasing by more than 13 mbps and 4mbps, respectively
Suggests that the merger enhanced competition in network quality, with resulting benefits seen across the entire mobile market
Findings have potential implications for all competition policies that deal with market concentration, and for policymakers considering how different market structures in mobile markets can deliver sustainable competition and investments in the latest mobile technology

31
Country Ireland
Year 2013
Player Hutchinson 3G
UK Telefonica Ireland
(O2) Eircom Vodafone
Proposed Merger
Hutchinson 3G UK/ Telefonica Ireland (O2)
Decision on Merger
Allowed with conditions
Quantitative Techniques
Effects based approach of the Commission under 2004 regulation
Merger Challenges
unilateral effects identified as
principal of harm
elimination of H3G expected to weaken pressure on MNOs
including O2
merger expected to remove this competitive constraint &
generate market equilibrium
Wholesale level H3G /O2 competed to provide access
to MVNO with limited offering from Vodafone,
Eircom would have limited ability to offer access to
MVNO
Reduced competition at wholesale level was expected to
devitalize competition at the retail level
Merger Remedies
Parties committed to reinstate loss of
competitive constraint exerted
by H3G and to preserve pre-
merger state of competition in the
market
parties entered into an upfront capacity
agreement at a fixed price with pre-
approved MVNO
Upfront MVNO to be offered option to acquire sub-brand of O2 or
its customer base
Parties offered to enter into good-faith negotiations with potential second MVNO during entry
period, and on failure to enter agreement during
period divestiture trustee had authority to offer the capacity for allocation to
all potential MVNO entrants at pre-agreed
minimum price
parties offered 1st or 2nd MVNO option to
buy 5 blocks of spectrum in 1800,
2100, 900 MHz bands - MVNOs had 10 year
period in which to enter negotiations with merged entity
Eircom commitment parties offered to amend NSA so it had more options
Merger Impact
For Ireland data are available for only one and a half years after the merger and therefore only
short to medium run effects can be
estimated.
In the Irish case, the results of the
estimations suggest that the merger led to
a statistically significant price
increase in all three baskets (low, medium and high usage), but
that the magnitude and persistence of this effect varies across
baskets.
It is only for the high basket that the price
effect is sustained across the
entire period under study.
Although the size of the coefficients and the
statistical significance vary across specifications, most specifications show at least
one significant price increase in at least one post-merger period for
each of the three baskets.
The impact of the MVNO remedy was small: two MVNOs
entered the market in the second half of
2015, but their market share remained below 1% each by mid-2017
and one of the MVNOs left the market in 2018.
Commission found
commitments o be insufficient to
alleviate competition concerns and
prohibited merger
Country United Kingdom
Year 2016
Player H3G Telefonica Vodafone BT Everything
Everywhere Proposed Merger
H3G / Telefonica
Decision on Merger
Expected to have adverse effects on retail markets for mobile services and
Expected to have adverse effects on retail markets for wholesale access and call origination on
public mobile telephone networks
Quantitative Techniques
Diversion ratios indicated merging parties were best alternatives for one another as EE and Vodafone focus was on value generation and customer retention
Merger also expected to have adverse vertical effects on the retail
markets for the provision of downstream (mobile) and upstream
(wholesale). services.
4 MNOs participated in complex intertwined NSAs & merger was
expected to effect at least one

32
Merger Challenges
Qualitative and quantitative evidence that H3G was an imp competitive constraint that
prompted competitors to offer aggressive subscriptions at cheaper rates
H3G had offered disruptive monetization and roaming
proposition "roaming w/o bill shock" - forcing others to respond
with similar offer
H3G offered 4G services at no extra cost as against 4g as premium service -
led to price war
wholesale competition also impacted as H3G offered access to all
types of MVNO
Merger Remedies
Tesco mobile component: divest O2 stake in Tesco mobile / create independent MVNO
new entrant operator commitment: upfront commitment to offer access to O2 network in form of perpetual
fractional network interest
network sharing commitment: implement network integration plan
wholesale market commitment: offered equivalent quality of
service
Merger Impact
While both BT/EE merger and H3G UK concerned same relevant market one was
allowed though second although assessed on similar grounds and process and
undertaking similar commitments was not allowed.
H3G decision is inconsistent with Commission's approach in other mergers following the priority-
based principle
Raises questions with regard to substantial
aspects of EU merger control
Source: Tyagi, Kalpana (2018). "Four to Three Telecom Mergers: Substantial Issues in EU Merger Control in the Mobile Telecommunications Sector", International Review of Intellectual Property and Competition Law, February 2018, Volume 49, Issue 2, pp 185-220
Exhibit 7: Total and Rural Market Share of Telecom Service Providers as of March 31, 2018
Service
Provider Total
Subscribers
(cr)
Subscriber Market Share
(%)
Urban Revenue Market Share
Total Rural Subscribers
(cr)
Rural Subscribers
(%)
Rural Subscriber
Market Share (%)

33
(%)
Reliance Jio 19 15 15 5 27 9 Bharti Airtel 31 26 28 16 51 30 Vodafone 22 18 31 12 54 23 BSNL 12 10 3 4 32 7 Idea 21 18 6 11 54 22 Others 15 13 18 4 29 8 Total* 121 100 100 52 41 100 *Operator wise year end figure represents average Source: The Indian Telecom Service Performance Indicators report by TRAI accessed on 22/12/2018
Exhibit 8: Spectrum Holding by Band as of 2018
Operator Bands (MHz)
850 900 1800 2100 2300 2500 Bharti Airtel 53 117 349 170 561 Aircel 13 75 65
Reliance Jio Bharti Airtel Vodafone BSNL Idea Others
Total Subscribers (cr) 18.66 30.81 22.29 12.40 21.12 15.35
Total Rural Subscribers (cr) 4.97 15.70 12.03 3.91 11.47 4.38
18.66
30.81
22.29
12.40
21.12
15.35
4.97
15.70
12.03
3.91
11.47
4.38
-
5.00
10.00
15.00
20.00
25.00
30.00
35.00
No
of S
ubsc
ribe
rs in
(m
n)
Total and Rural Market Share of Telecom Service Providers
Total Subscribers (cr) Total Rural Subscribers (cr)

34
Vodafone (Vodafone Idea) 137 393 195 30 370 RJio 204 10 164 65 600 BSNL/MTNL 38 138 66 215 280 Source: Spectrum Holding Sheet as of 2018, telecomtalk.info
Bharti AirtelVodafone (Vodafone
Idea)RJio Aircel BSNL/MTNL
2500 MHz 370 280
2300 Mhz 561 30 600
2100 MHz 170 195 65 65 215
1800 MHz 349 393 164 75 66
900 MHz 117 137 10 13 138
850 MHz 53 204 38
53 204
38 117 137
10
13 138
349 393 164
75
66
170 195
65
65
215
561
30 600
370
280
-
200
400
600
800
1,000
1,200
1,400
Am
ount
Of
Spe
ctru
m B
y B
and
Spectrum Holding By Bands
850 MHz 900 MHz 1800 MHz 2100 MHz 2300 Mhz 2500 MHz
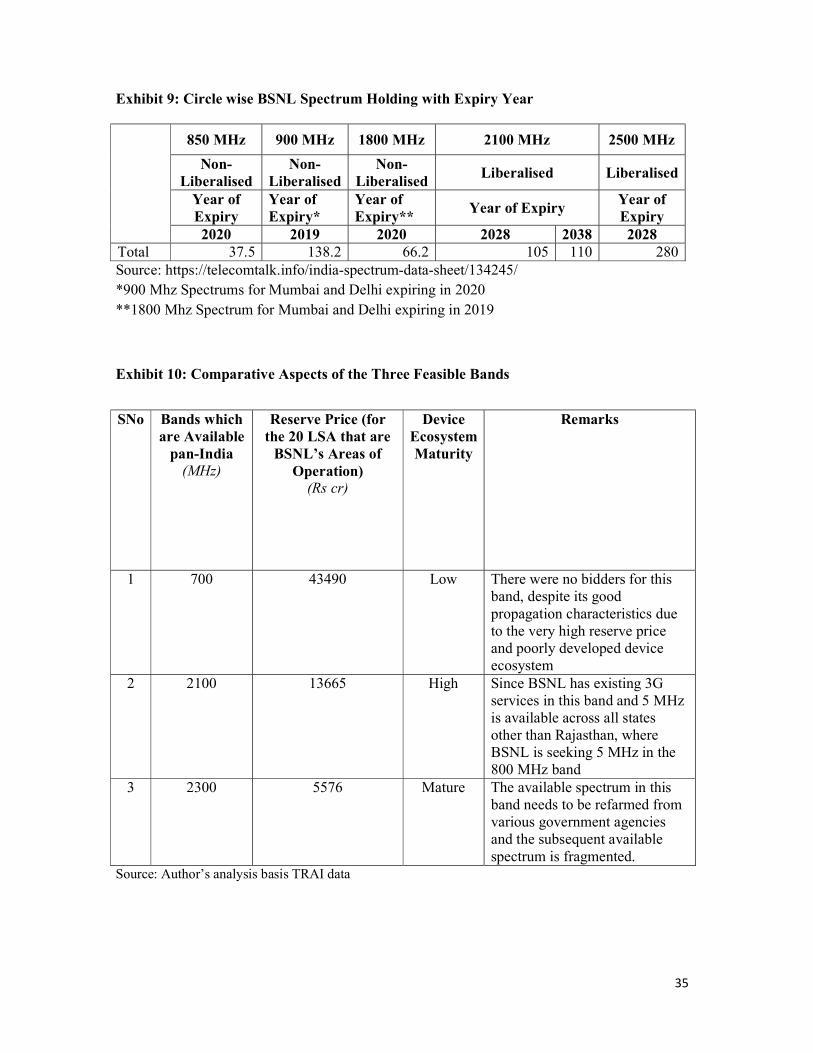
35
Exhibit 9: Circle wise BSNL Spectrum Holding with Expiry Year
850 MHz 900 MHz 1800 MHz 2100 MHz 2500 MHz
Non-Liberalised
Non-Liberalised
Non-Liberalised
Liberalised Liberalised
Year of Expiry
Year of Expiry*
Year of Expiry**
Year of Expiry Year of Expiry
2020 2019 2020 2028 2038 2028 Total 37.5 138.2 66.2 105 110 280 Source: https://telecomtalk.info/india-spectrum-data-sheet/134245/ *900 Mhz Spectrums for Mumbai and Delhi expiring in 2020 **1800 Mhz Spectrum for Mumbai and Delhi expiring in 2019
Exhibit 10: Comparative Aspects of the Three Feasible Bands
SNo Bands which are Available
pan-India (MHz)
Reserve Price (for the 20 LSA that are
BSNL’s Areas of Operation)
(Rs cr)
Device Ecosystem Maturity
Remarks
1 700 43490 Low There were no bidders for this band, despite its good propagation characteristics due to the very high reserve price and poorly developed device ecosystem
2 2100 13665 High Since BSNL has existing 3G services in this band and 5 MHz is available across all states other than Rajasthan, where BSNL is seeking 5 MHz in the 800 MHz band
3 2300 5576 Mature The available spectrum in this band needs to be refarmed from various government agencies and the subsequent available spectrum is fragmented.
Source: Author’s analysis basis TRAI data

36
Exhibit 11: Infrastructure Costs of BTS
Operator Contractor
No of BTS (3,00,000 to
482252)
Total BTS Management Cost
for 3 Years (Rs cr)
Annual BTS Management Cost per BTS
(Rs)
Average Annual Rental per BTS
Airtel Ericsson 3,00,000.00 3,350.00 37,222.22 3,60,000.00
Per year contract cost 1,116.67
Operator Contractor
No of BTS (3,00,000 to
482252)
Total BTS Management Cost
(Rs cr)
Scenario 1 No of BTS 482252
BSNL existing towers 80000
Annual Cost of Upgradation (Rs cr) 185
New Proposed Towers 20000
Annual Cost of Maintenance (Rs cr) 766 Total Cost of all towers for 3 years (Rs cr) 2855
Scenario 2 No of BTS 300000
BSNL existing towers 80000
Annual Cost of Upgradation(Rs cr) 298
New Proposed Towers 20000
Anual Cost of Maintainence (Rs cr) 794 Total Cost of all towers for 3 years (Rs cr) 3,277 *The above calculation is representative and has been derived from publicly available information. Similar values are available for other operators for leasing. Rental for old towers not taken as they already exist. Source: https://telecom.economictimes.indiatimes.com/news/ericsson-bags-500-million-pan-india-managed- services-deal-from-bharti-airtel/55094651 as accessed on 03/01/2018
Source: https://economictimes.indiatimes.com/news/company/corporate-trends/reliance-jio-signs-lease-for-base-stations-with-tower-companies/articleshow/53954248.cms
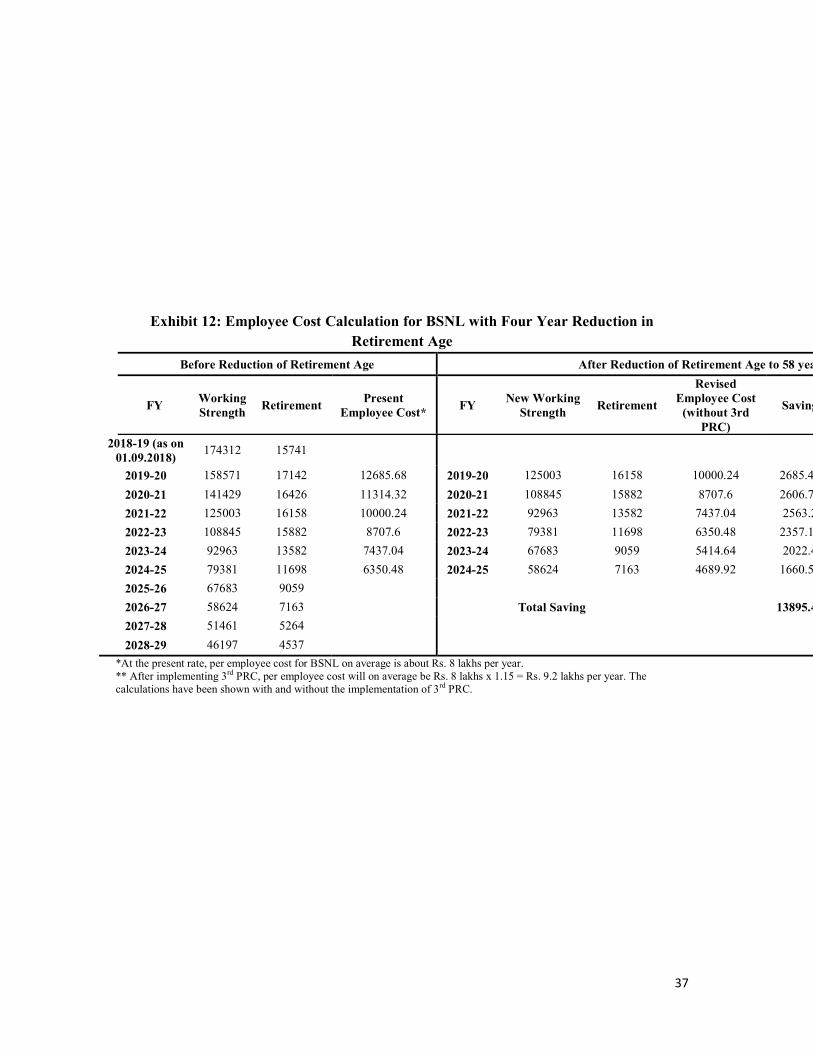
37
Exhibit 12: Employee Cost Calculation for BSNL with Four Year Reduction in Retirement Age
Before Reduction of Retirement Age After Reduction of Retirement Age to 58 years
FY Working Strength
Retirement Present
Employee Cost* FY
New Working Strength
Retirement
Revised Employee Cost
(without 3rd PRC)
Saving
2018-19 (as on 01.09.2018)
174312 15741
2019-20 158571 17142 12685.68 2019-20 125003 16158 10000.24 2685.44
2020-21 141429 16426 11314.32 2020-21 108845 15882 8707.6 2606.72
2021-22 125003 16158 10000.24 2021-22 92963 13582 7437.04 2563.2
2022-23 108845 15882 8707.6 2022-23 79381 11698 6350.48 2357.12
2023-24 92963 13582 7437.04 2023-24 67683 9059 5414.64 2022.4
2024-25 79381 11698 6350.48 2024-25 58624 7163 4689.92 1660.56
2025-26 67683 9059
2026-27 58624 7163 Total Saving
13895.44
2027-28 51461 5264
2028-29 46197 4537
*At the present rate, per employee cost for BSNL on average is about Rs. 8 lakhs per year. ** After implementing 3rd PRC, per employee cost will on average be Rs. 8 lakhs x 1.15 = Rs. 9.2 lakhs per year. The calculations have been shown with and without the implementation of 3rd PRC.

38
Exhibit 13: Land Valuation of BSNL - DoT
Source: Internal BSNL Documents

39
Exhibit 14: BSNL Revenues and Expenses
Sl. No. Circle Name Income/Revenue Other Income
Employee benefits expenses
Other expenses
2015-16 2016-17 2015-16 2016-17 2015-16 2016-17 2015-16 2016-17
1 CORPORATE OFFICE 2981.04 408.43 1522.24 374.30 -637.11 -151.89 32.94 0.01
2 ASSAM 468.83 510.87 32.72 82.15 287.84 289.89 204.96 181.92
3 KOLKATA TELEPHONES 693.04 697.42 90.68 126.41 564.48 554.34 350.19 315.07
4 CHENNAI TELEPHONES 975.05 973.22 39.56 85.55 581.47 550.19 243.49 239.21
5 ANDHRA 2571.69 2617.23 278.03 157.49 1633.49 1649.61 915.60 815.11
6 BIHAR 473.79 549.64 68.18 98.36 336.33 342.48 400.18 375.87
7 GUJRAT 1500.84 1521.45 64.46 85.68 1189.08 1183.18 414.08 431.73
8 J&K 459.50 461.72 19.85 18.39 152.99 156.99 165.96 163.91
9 KARNATAKA 2498.33 2311.68 258.35 98.89 1226.33 1190.70 682.02 780.46
10 KERALA 3059.25 3176.84 101.07 85.49 965.63 967.55 837.74 869.14
11 MADHYA PRADESH 1011.07 961.15 133.17 129.82 599.12 559.11 326.30 349.85
12 MAHARASHTRA 2931.25 3390.85 160.73 339.09 1589.74 1489.55 1188.41 1081.04
13 NE-I 204.38 217.58 22.81 38.78 120.03 120.84 85.62 84.88
14 PUNJAB 1118.93 1365.61 49.12 123.45 580.64 590.02 500.31 439.07
15 ORISSA 930.19 928.32 47.00 62.16 270.34 277.78 343.47 356.54
16 RAJASTHAN 1353.77 1196.06 237.78 67.57 676.97 684.17 456.11 466.09
17 TAMIL NADU 2161.16 2176.95 130.88 152.87 1170.87 1139.70 749.01 730.76
18 UP EAST 1524.49 1489.83 157.73 59.34 696.42 691.42 896.81 804.07
19 UP WEST 794.25 763.17 60.98 113.40 479.34 465.74 451.22 469.63
20 WEST BENGAL 579.51 886.16 80.52 331.79 484.01 473.22 329.80 394.89
21 HARYANA 804.36 799.53 45.53 60.85 333.69 294.70 313.02 361.06
22 HIMACHAL PRADESH 411.91 373.92 4.54 11.56 206.27 216.36 164.05 110.68
23 TELECOM STORES 0.30 3.25 0.30 3.25 15.98 16.17 0.72 1.25

40
24 TF MUMBAI 43.50 51.74 1.72 3.89 45.09 20.76 2.79 40.41
25 TF KOLKATA 7.96 124.43 3.83 1.71 37.43 50.30 12.72 87.39
26 TF JABALPUR 23.06 119.98 1.73 2.33 22.86 22.56 4.03 120.00
27 NTP 1.47 1.18 1.47 1.18 48.97 38.99 6.26 4.09
28 WTP 23.25 16.13 23.25 16.13 21.95 10.57 9.06 3.73
29 STP 122.47 100.69 50.66 21.29 48.89 43.20 24.81 33.67
30 ETP 4.95 0.95 4.95 0.95 39.19 24.81 1.03 1.99
31 NTR 696.78 882.37 66.06 52.67 236.96 242.21 577.54 452.45
32 WTR 6.36 14.76 3.92 10.42 146.66 151.09 52.56 66.34
33 STR 35.46 39.96 4.21 7.13 178.88 187.91 66.64 71.86
34 ETR 3.51 4.64 3.44 4.64 138.74 143.57 58.26 106.74
35 T&D JABALPUR 0.20 0.21 0.20 0.21 49.89 51.58 1.20 1.44
38 BRBRAITT 3.88 3.66 3.88 3.66 16.73 17.70 2.55 4.87
39 ALTTC 1.99 2.38 1.99 2.38 23.20 22.45 4.22 4.04
40 TASK FORCE GHY 0.12 -30.69 0.12 1.48 0.00 27.43 0.03 2.96
41 BBNW 0.27 0.29 0.27 0.29 23.18 26.37 29.39 50.93
42 NCNGN 0.18 0.07 0.18 0.07 14.15 18.74 20.58 28.39
43 A&N 158.19 190.79 2.16 11.35 20.57 21.75 22.73 25.50
44 PAO HQ 532.47 861.82 6.36 109.56 160.52 198.99 262.95 296.99
46 QA 8.58 19.43 8.58 19.43 25.31 23.47 1.70 1.42
48 ITPC PUNE 0.00 2.09 0.00 2.09 0.00 64.20 0.00 66.20
49 NATFM 1.17 0.26 1.17 0.26 3.82 2.94 1.91 1.37
50 CHATTISGARH 342.52 445.43 16.03 10.14 126.85 126.81 131.23 154.82
51 JHARKHAND 271.37 434.68 34.64 65.39 170.34 174.25 172.32 207.24
52 UTTARANCHAL 287.69 270.02 17.81 12.73 143.20 146.68 109.48 103.77
53 NE-II 327.01 195.29 165.62 61.69 101.82 102.62 197.36 62.12
62 NFS 0.00 0.00 0.00 0.00 0.00 1.70 0.00 0.18
Total 32411.33 31533.45 4030.47 3129.72 15369.17 15715.45 11825.37 11823.13 Source: BSNL Internal Documents

1
Annexure
Annexure 1: List of People Met (to be inserted later)