interim report - ardagh group
TRANSCRIPT
Ardagh Group S.A.
Interim Report For the three months ended March 31, 2021
Ardagh Group S.A.
1
INDEX TO THE UNAUDITED CONSOLIDATED INTERIM FINANCIAL STATEMENTS
Ardagh Group S.A.
Unaudited Consolidated Interim Financial Statements
Consolidated Interim Income Statement for the three months ended March 31, 2021 and 2020 2
Consolidated Interim Statement of Comprehensive Income for the three months ended March 31, 2021 and 2020 3
Consolidated Interim Statement of Financial Position at March 31, 2021 and December 31, 2020 4
Consolidated Interim Statement of Changes in Equity for the three months ended March 31, 2021 and 2020 5
Consolidated Interim Statement of Cash Flows for the three months ended March 31, 2021 and 2020 6
Notes to the Unaudited Consolidated Interim Financial Statements 7
Management’s Discussion and Analysis of Financial Condition and Results of Operations for the three months ended
March 31, 2021 22
Cautionary Statement Regarding Forward-Looking Statements 34
As used herein, “AGSA” or the “Company” refer to Ardagh Group S.A., and “we”, “our”, “us”, “Ardagh” and the
“Group” refer to AGSA and its consolidated subsidiaries, unless the context requires otherwise.
Ardagh Group S.A.
2
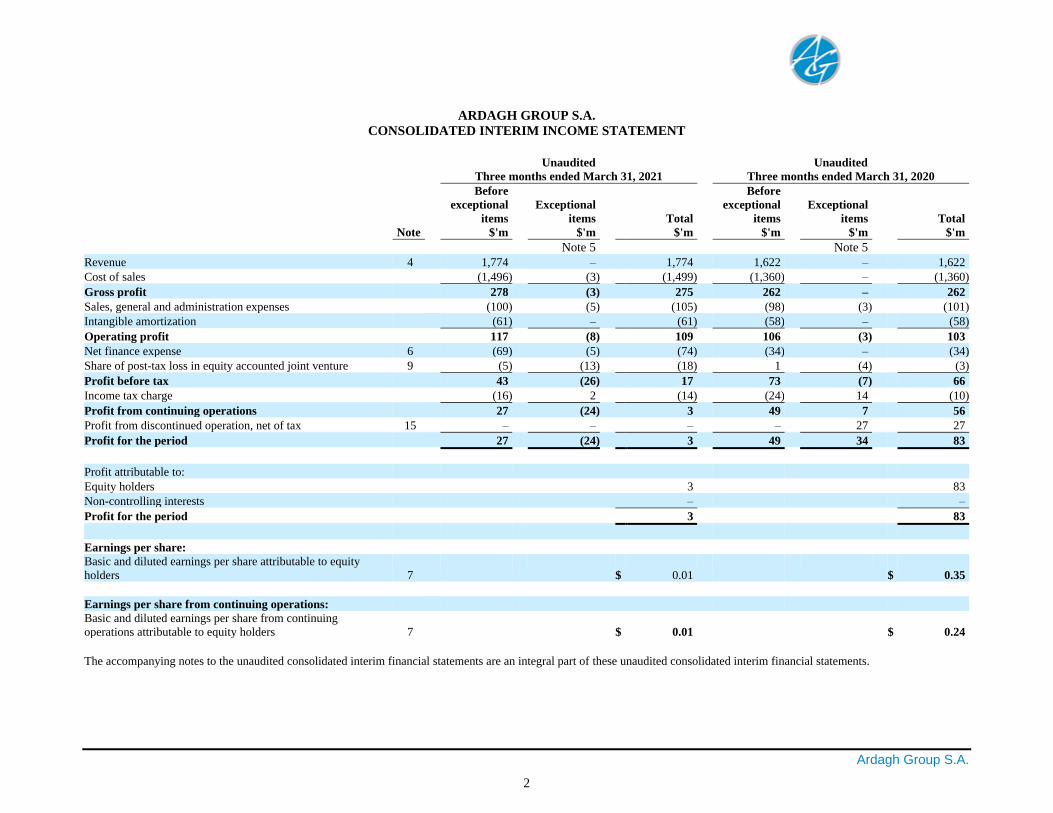
ARDAGH GROUP S.A.
CONSOLIDATED INTERIM INCOME STATEMENT
Unaudited Unaudited
Three months ended March 31, 2021 Three months ended March 31, 2020
Before Before
exceptional Exceptional exceptional Exceptional
items items Total items items Total
Note $'m $'m $'m $'m $'m $'m
Note 5 Note 5
Revenue 4 1,774 – 1,774 1,622 – 1,622
Cost of sales (1,496) (3) (1,499) (1,360) – (1,360)
Gross profit 278 (3) 275 262 – 262
Sales, general and administration expenses (100) (5) (105) (98) (3) (101)
Intangible amortization (61) – (61) (58) – (58)
Operating profit 117 (8) 109 106 (3) 103
Net finance expense 6 (69) (5) (74) (34) – (34)
Share of post-tax loss in equity accounted joint venture 9 (5) (13) (18) 1 (4) (3)
Profit before tax 43 (26) 17 73 (7) 66
Income tax charge (16) 2 (14) (24) 14 (10)
Profit from continuing operations 27 (24) 3 49 7 56
Profit from discontinued operation, net of tax 15 – – – – 27 27
Profit for the period 27 (24) 3 49 34 83
Profit attributable to:
Equity holders 3 83
Non-controlling interests – –
Profit for the period 3 83
Earnings per share:
Basic and diluted earnings per share attributable to equity
holders 7 $ 0.01 $ 0.35
Earnings per share from continuing operations:
Basic and diluted earnings per share from continuing
operations attributable to equity holders 7 $ 0.01 $ 0.24
The accompanying notes to the unaudited consolidated interim financial statements are an integral part of these unaudited consolidated interim financial statements.
Ardagh Group S.A.
3
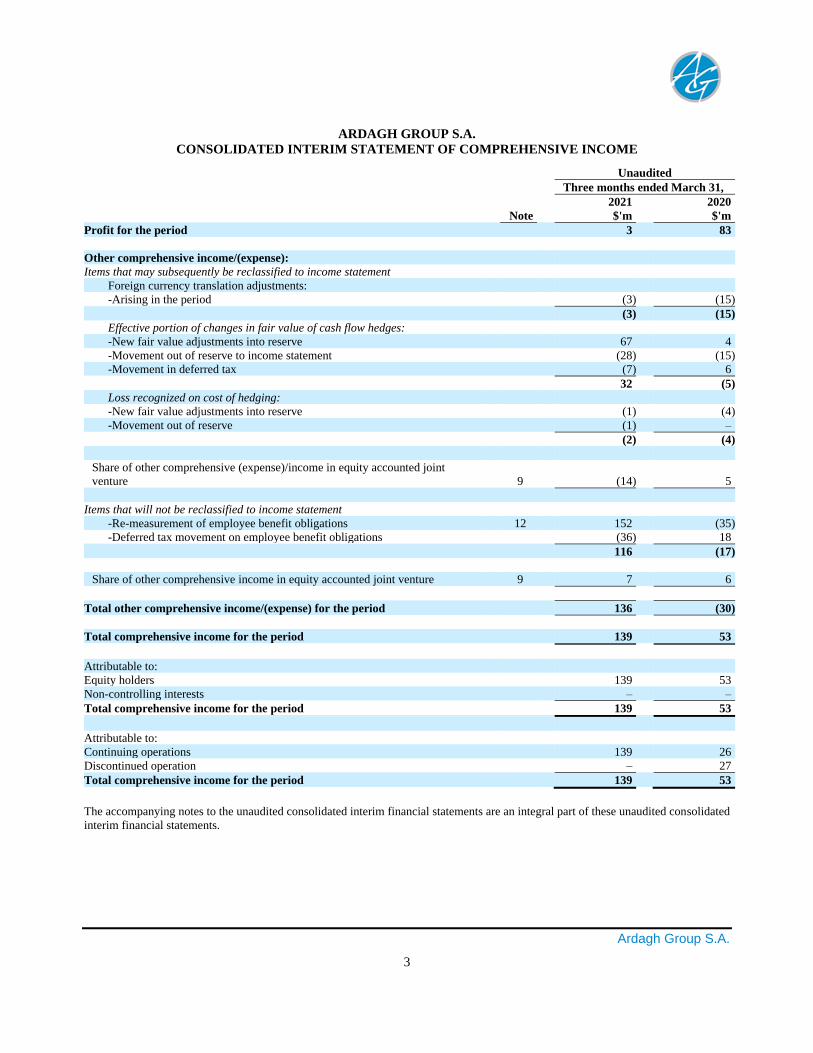
ARDAGH GROUP S.A.
CONSOLIDATED INTERIM STATEMENT OF COMPREHENSIVE INCOME
Unaudited
Three months ended March 31,
2021 2020 Note $'m $'m
Profit for the period 3 83 Other comprehensive income/(expense): Items that may subsequently be reclassified to income statement
Foreign currency translation adjustments: -Arising in the period (3) (15)
(3) (15) Effective portion of changes in fair value of cash flow hedges: -New fair value adjustments into reserve 67 4 -Movement out of reserve to income statement (28) (15) -Movement in deferred tax (7) 6
32 (5) Loss recognized on cost of hedging: -New fair value adjustments into reserve (1) (4) -Movement out of reserve (1) –
(2) (4)
Share of other comprehensive (expense)/income in equity accounted joint
venture 9 (14) 5
Items that will not be reclassified to income statement
-Re-measurement of employee benefit obligations 12 152 (35) -Deferred tax movement on employee benefit obligations (36) 18
116 (17)
Share of other comprehensive income in equity accounted joint venture 9 7 6
Total other comprehensive income/(expense) for the period 136 (30)
Total comprehensive income for the period 139 53
Attributable to: Equity holders 139 53 Non-controlling interests – –
Total comprehensive income for the period 139 53
Attributable to: Continuing operations 139 26 Discontinued operation – 27
Total comprehensive income for the period 139 53
The accompanying notes to the unaudited consolidated interim financial statements are an integral part of these unaudited consolidated
interim financial statements.
Ardagh Group S.A.
4
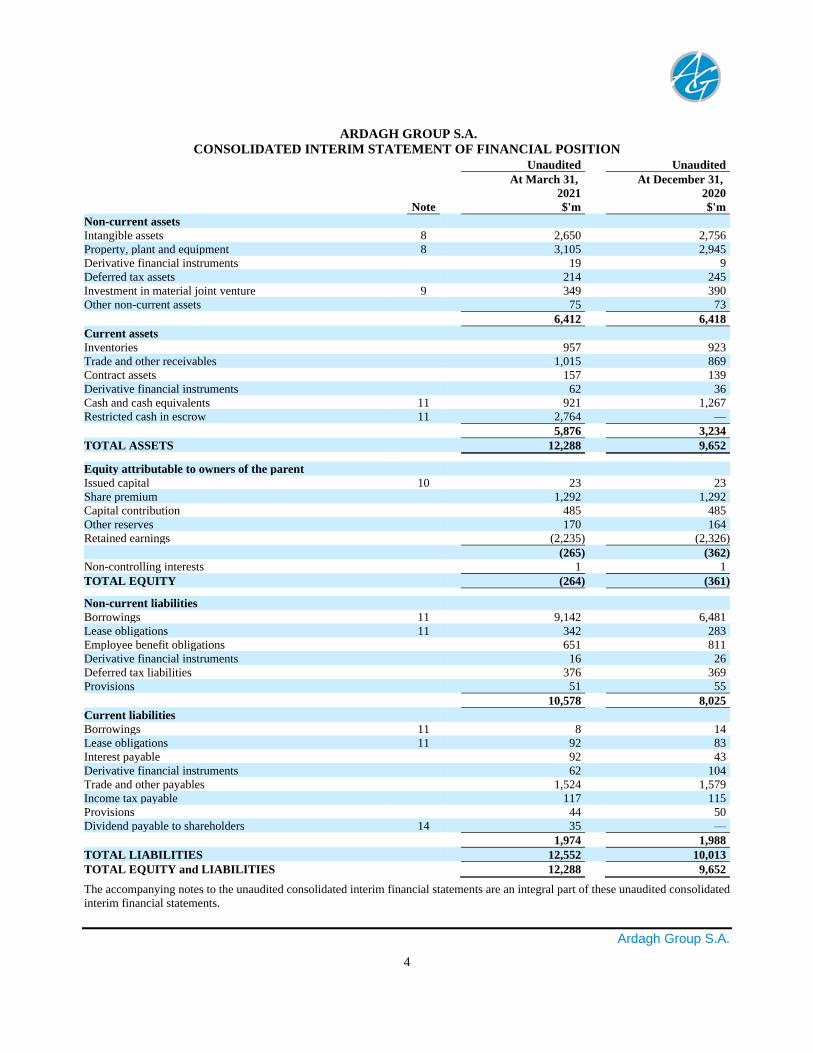
ARDAGH GROUP S.A.
CONSOLIDATED INTERIM STATEMENT OF FINANCIAL POSITION Unaudited Unaudited
At March 31, At December 31, 2021 2020 Note $'m $'m
Non-current assets Intangible assets 8 2,650 2,756 Property, plant and equipment 8 3,105 2,945 Derivative financial instruments 19 9 Deferred tax assets 214 245 Investment in material joint venture 9 349 390 Other non-current assets 75 73
6,412 6,418
Current assets Inventories 957 923 Trade and other receivables 1,015 869 Contract assets 157 139 Derivative financial instruments 62 36 Cash and cash equivalents 11 921 1,267 Restricted cash in escrow 11 2,764 —
5,876 3,234
TOTAL ASSETS 12,288 9,652
Equity attributable to owners of the parent Issued capital 10 23 23 Share premium 1,292 1,292 Capital contribution 485 485 Other reserves 170 164 Retained earnings (2,235) (2,326)
(265) (362) Non-controlling interests 1 1
TOTAL EQUITY (264) (361)
Non-current liabilities Borrowings 11 9,142 6,481 Lease obligations 11 342 283 Employee benefit obligations 651 811 Derivative financial instruments 16 26 Deferred tax liabilities 376 369 Provisions 51 55
10,578 8,025
Current liabilities Borrowings 11 8 14 Lease obligations 11 92 83 Interest payable 92 43 Derivative financial instruments 62 104 Trade and other payables 1,524 1,579 Income tax payable 117 115 Provisions 44 50 Dividend payable to shareholders 14 35 —
1,974 1,988
TOTAL LIABILITIES 12,552 10,013
TOTAL EQUITY and LIABILITIES 12,288 9,652
The accompanying notes to the unaudited consolidated interim financial statements are an integral part of these unaudited consolidated
interim financial statements.
Ardagh Group S.A.
5
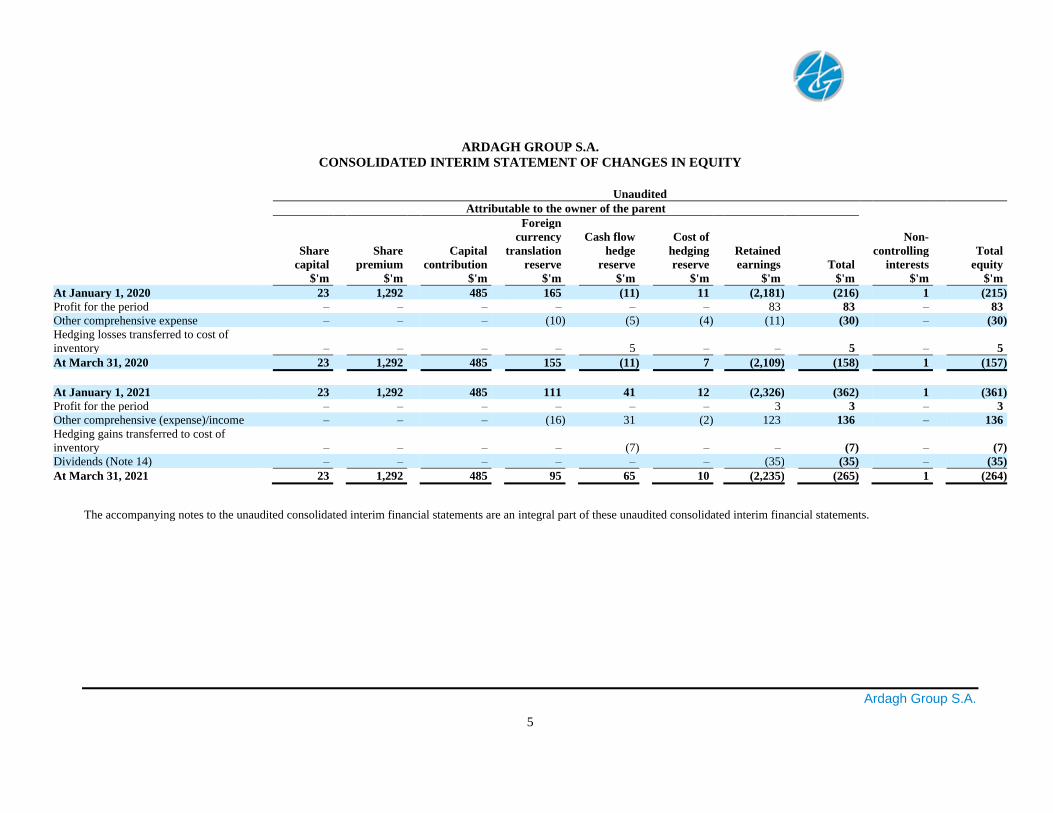
ARDAGH GROUP S.A.
CONSOLIDATED INTERIM STATEMENT OF CHANGES IN EQUITY
Unaudited
Attributable to the owner of the parent
Foreign currency Cash flow Cost of Non- Share Share Capital translation hedge hedging Retained controlling Total capital premium contribution reserve reserve reserve earnings Total interests equity $'m $'m $'m $'m $'m $'m $'m $'m $'m $'m
At January 1, 2020 23 1,292 485 165 (11) 11 (2,181) (216) 1 (215) Profit for the period – – – – – – 83 83 – 83 Other comprehensive expense – – – (10) (5) (4) (11) (30) – (30) Hedging losses transferred to cost of
inventory – – – – 5 – – 5 – 5
At March 31, 2020 23 1,292 485 155 (11) 7 (2,109) (158) 1 (157)
At January 1, 2021 23 1,292 485 111 41 12 (2,326) (362) 1 (361) Profit for the period – – – – – – 3 3 – 3 Other comprehensive (expense)/income – – – (16) 31 (2) 123 136 – 136 Hedging gains transferred to cost of
inventory – – – – (7) – – (7) – (7) Dividends (Note 14) – – – – – – (35) (35) – (35)
At March 31, 2021 23 1,292 485 95 65 10 (2,235) (265) 1 (264)
The accompanying notes to the unaudited consolidated interim financial statements are an integral part of these unaudited consolidated interim financial statements.

Ardagh Group S.A.
6
ARDAGH GROUP S.A.
CONSOLIDATED INTERIM STATEMENT OF CASH FLOWS
Unaudited
Three months ended March 31,
2021 2020 Note $'m $'m
Cash flows used in operating activities Cash used in operations 13 (12) (191) Interest paid (19) (84) Income tax paid (4) (12)
Cash flows used in operating activities (35) (287)
Cash flows used in investing activities Purchase of property, plant and equipment (244) (124) Purchase of software and other intangibles (3) (2) Other investing cash flows (13) –
Cash flows used in investing activities (260) (126)
Cash flows from financing activities Proceeds from borrowings – 832 Repayment of borrowings (6) (18) Lease payments (27) (22) Deferred debt issue costs paid (4) (5) Consideration paid on maturity of derivative financial instruments 11 (5) –
Net cash (outflow)/inflow from financing activities (42) 787
Net (decrease)/increase in cash and cash equivalents (337) 374
Cash and cash equivalents at beginning of period 1,267 614 Foreign exchange losses on cash and cash equivalents (9) (26)
Cash and cash equivalents at end of period 11 921 962
The accompanying notes to the unaudited consolidated interim financial statements are an integral part of these unaudited consolidated
interim financial statements.
Ardagh Group S.A.
7
ARDAGH GROUP S.A.
NOTES TO THE UNAUDITED CONSOLIDATED INTERIM FINANCIAL STATEMENTS
1. General information
Ardagh Group S.A. (the “Company”) was incorporated in Luxembourg on May 6, 2011.
Ardagh Group S.A. and its subsidiaries (together the “Group” or “Ardagh”) are a leading supplier of sustainable
innovative, value-added rigid packaging solutions. The Group’s products include metal beverage cans and glass containers
primarily for beverage and food markets. End-use categories include beer, wine, spirits, carbonated soft drinks, energy
drinks, juices and water, as well as food and pharmaceuticals. Ardagh also holds a stake of approximately 42% in Trivium
Packaging B.V. (“Trivium”), a leading supplier of metal packaging in the form of cans and aerosol containers, serving a
broad range of end-use categories, principally including food, seafood, pet food and nutrition, as well as beauty and
personal care.
On February 22, 2021, the Group entered into a business combination agreement with Gores Holdings V Inc., a
special purpose acquisition company sponsored by an affiliate of The Gores Group (“Gores Holdings V”) for the purpose
of effecting a merger, acquisition, or similar business combination, under which Gores Holdings V will combine with
Ardagh’s metal packaging business that will be held by an Ardagh wholly owned subsidiary, Ardagh Metal Packaging
S.A. (“Ardagh Metal Packaging” or “AMP”) to create an independent, pure-play beverage can business, public company.
AMP also announced its intention to apply to list its shares on the NYSE.
Ardagh’s metal packaging business is a leading supplier of beverage cans globally, with a particular focus on the
Americas and Europe. The business supplies sustainable and infinitely recyclable metal packaging to a diversified
customer base of leading global, regional and national beverage producers. Ardagh’s metal packaging business operates
23 production facilities in Europe and the Americas, employs approximately 4,900 people and recorded revenues of $3.5
billion in 2020.
Additional investors have committed to participate in the proposed business combination by purchasing 60
million shares of AMP for an aggregate purchase price of $600 million in a private placement at $10.00. In connection
with the transactions, on March 12, 2021, two affiliates of the Ardagh Group (the “Co-Issuers”) issued green bonds of
$2.8 billion equivalent, consisting of €450 million 2.000% Senior Secured Notes due 2028, $600 million 3.250% Senior
Secured Notes due 2028, €500 million 3.000% Senior Notes due 2029 and $1,050 million 4.000% Senior Notes due 2029
(the “AMP Notes Issuance”). Assuming no share redemptions by the public stockholders of Gores Holdings V,
approximately $525 million in cash held in Gores Holdings V’s trust account, together with the $600 million in private
placement proceeds and approximately $2.3 billion of the new debt raised by AMP, will be used to pay up to $3.4 billion
in cash to the Group, as well as to pay transaction expenses with the remainder of the AMP Notes issuance used for general
corporate purposes. Upon closing of the transactions, assuming no redemptions by Gores Holdings V’s public
stockholders, the Group will retain an equity interest in AMP of approximately 80%, the investors in the private placement
will hold approximately 10% and Gores Holdings V’s stockholders and its sponsor will hold approximately 10%.
The proposed business combination, which has been approved by the boards of directors of both Ardagh and
Gores Holdings V, is expected to close in the second quarter of 2021, subject to receipt of Gores Holdings V stockholder
approval, approval of AMP’s shares for listing on the NYSE, the satisfaction of the condition to Ardagh’s obligations that
it receives at least $3 billion in cash from the transactions and the satisfaction or waiver of other customary closing
conditions.
These unaudited consolidated interim financial statements reflect the consolidation of the legal entities forming
the Group for the periods presented.
Ardagh Group S.A.
8
The significant accounting policies that have been applied to the unaudited consolidated interim financial
statements are described in note 3.
2. Statement of directors’ responsibilities
The Directors are responsible for preparing the unaudited consolidated interim financial statements. The Directors
are required to prepare financial information for each financial period on the state of affairs of the Group and of the profit
or loss of the Group for that period. In preparing the unaudited consolidated interim financial statements, the Directors are
required to:
- select suitable accounting policies and then apply them consistently;
- make judgments and estimates that are reasonable and prudent; and
- prepare the financial statements on the going concern basis, unless it is inappropriate to presume that the Group
will continue in business.
The Directors confirm that they have complied with the above requirements in preparing the unaudited
consolidated interim financial statements. Changes to accounting policies applied in the three months ended March 31,
2021 are outlined in note 3.
The Directors are responsible for the maintenance and integrity of the corporate and financial information
included on the Group’s website at: www.ardaghgroup.com.
The unaudited consolidated interim financial statements were approved for issue by the board of directors of
Ardagh Group S.A. (the “Board”) on April 28, 2021.
3. Summary of significant accounting policies
Basis of preparation
The unaudited consolidated interim financial statements of the Group for the three months ended March 31, 2021
and 2020, have been prepared in accordance with IAS 34 “Interim Financial Reporting”. The unaudited consolidated
interim financial statements do not include all of the information required for full annual financial statements and should
be read in conjunction with the Annual Report for the year ended December 31, 2020 which was prepared in accordance
with International Financial Reporting Standards (“IFRS”).
The unaudited consolidated interim financial statements are presented in U.S. dollar rounded to the nearest
million.
Income tax in interim periods is accrued using the effective tax rate expected to be applied to annual earnings.
The accounting policies, presentation and methods of computation followed in the unaudited consolidated interim
financial statements are consistent with those applied in the Group’s latest Annual Report.
Recent changes in accounting pronouncements
The impact of new standards, amendments to existing standards and interpretations issued and effective for annual
periods beginning on or after January 1, 2021 have been assessed by the Directors and as a result, no new standards or
amendments to existing standards effective January 1, 2021 have had a material impact for the Group. The Directors’
assessment of the impact of new standards, which are not yet effective and which have not been early adopted by the
Group, on the consolidated interim financial statements is on-going.
Ardagh Group S.A.
9
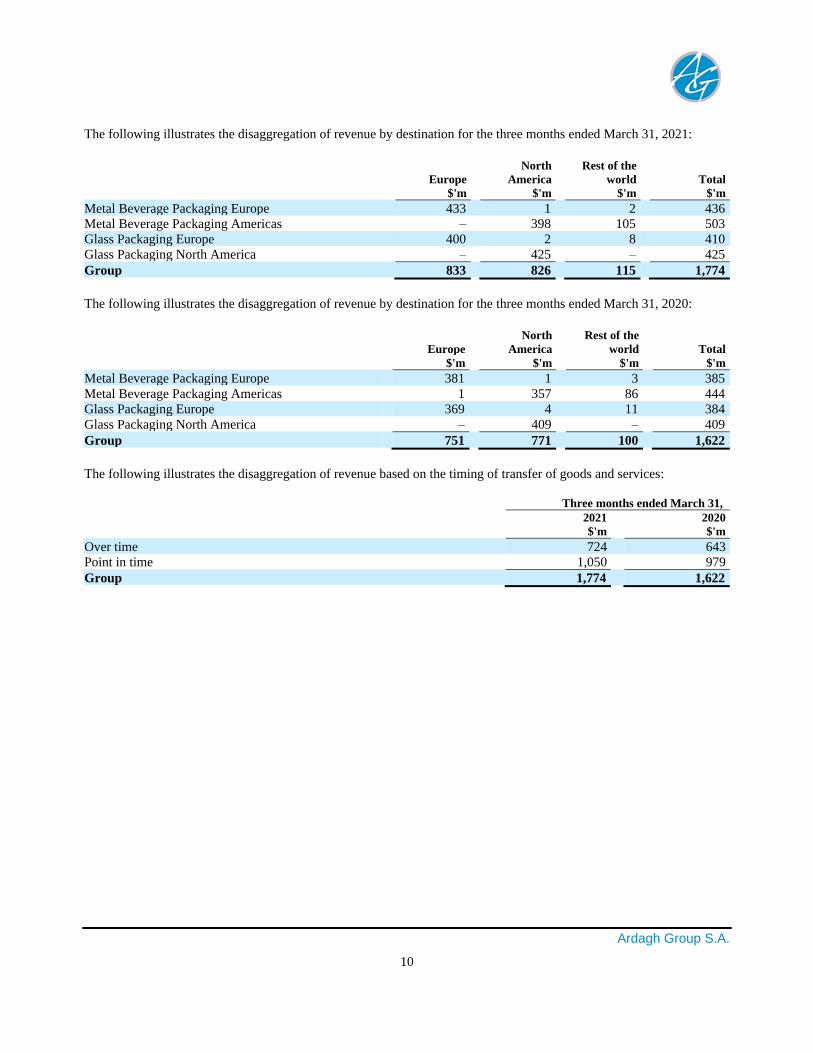
4. Segment analysis
The Group’s operating and reportable segments, which are set out below, reflect the basis on which the Group’s
performance is reviewed by management and presented to the Board, which has been identified as the Chief Operating
Decision Maker (“CODM”) for the Group.
• Metal Beverage Packaging Europe
• Metal Beverage Packaging Americas
• Glass Packaging Europe
• Glass Packaging North America.
Performance of the business is assessed based on Adjusted EBITDA. Adjusted EBITDA is the profit or loss for
the period before income tax charge or credit, net finance expense, depreciation and amortization, exceptional operating
items and share of profit or loss in equity accounted joint venture. Other items are not allocated to segments, as these are
reviewed by the CODM on a group-wide basis. Segmental revenues are derived from sales to external customers. Inter-
segment revenue and revenue with joint ventures is not material.
Reconciliation of profit for the period to Adjusted EBITDA
Three months ended March 31,
2021 2020 $'m $'m
Profit for the period 3 56 Income tax charge 14 10 Net finance expense 74 34 Depreciation and amortization 183 167 Exceptional operating items 8 3 Share of post-tax loss in equity accounted joint venture 18 3
Adjusted EBITDA 300 273
Segment results for the three months ended March 31, 2021 and 2020 are:
Revenue Adjusted EBITDA
2021 2020 2021 2020 $'m $'m $'m $'m
Metal Beverage Packaging Europe 436 385 66 54
Metal Beverage Packaging Americas 503 444 82 61
Glass Packaging Europe 410 384 97 89
Glass Packaging North America 425 409 55 69
Group 1,774 1,622 300 273
No customer accounted for greater than 10% of total revenue in the three months ended March 31, 2021 (2020:
none).
Within each reportable segment our respective packaging containers have similar production processes and
classes of customers. Further, they have similar economic characteristics, as evidenced by similar profit margins, similar
degrees of risk and similar opportunities for growth. Based on the foregoing, we do not consider that they constitute
separate product lines and therefore additional disclosures relating to product lines is not necessary.
Ardagh Group S.A.
10
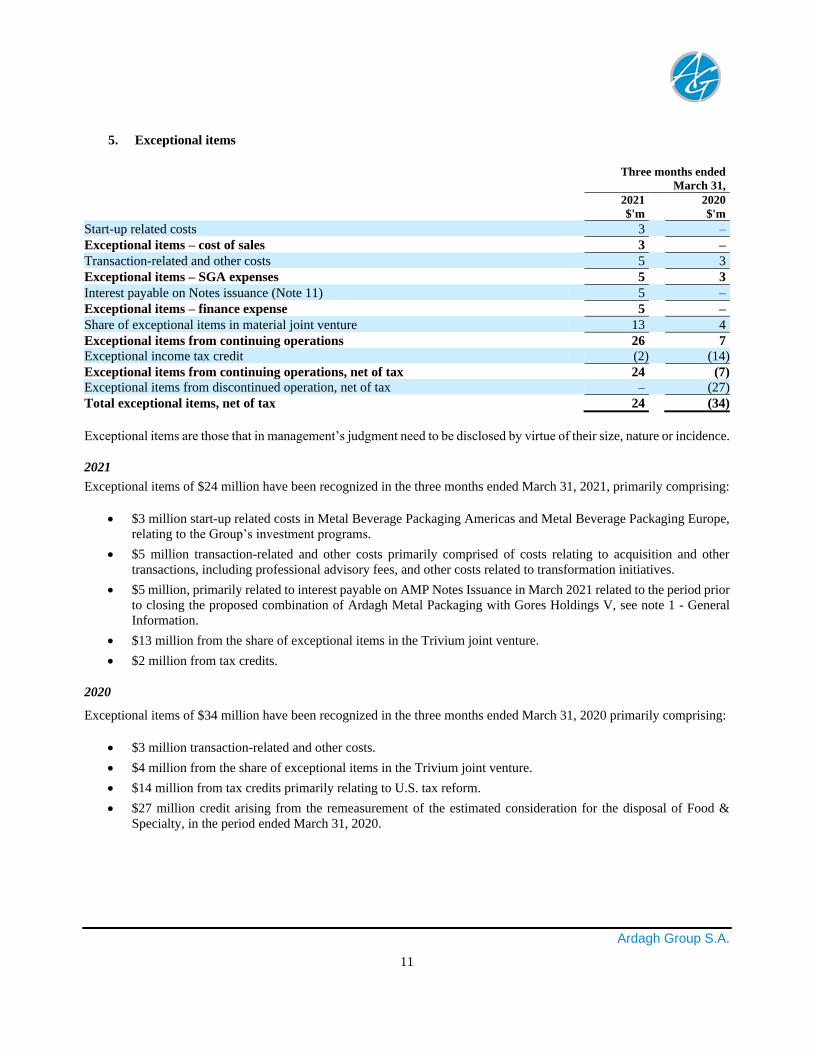
The following illustrates the disaggregation of revenue by destination for the three months ended March 31, 2021:
North Rest of the Europe America world Total $'m $'m $'m $'m
Metal Beverage Packaging Europe 433 1 2 436
Metal Beverage Packaging Americas – 398 105 503
Glass Packaging Europe 400 2 8 410
Glass Packaging North America – 425 – 425
Group 833 826 115 1,774
The following illustrates the disaggregation of revenue by destination for the three months ended March 31, 2020:
North Rest of the Europe America world Total $'m $'m $'m $'m
Metal Beverage Packaging Europe 381 1 3 385 Metal Beverage Packaging Americas 1 357 86 444 Glass Packaging Europe 369 4 11 384 Glass Packaging North America – 409 – 409
Group 751 771 100 1,622
The following illustrates the disaggregation of revenue based on the timing of transfer of goods and services:
Three months ended March 31,
2021 2020 $'m $'m
Over time 724 643 Point in time 1,050 979
Group 1,774 1,622
Ardagh Group S.A.
11
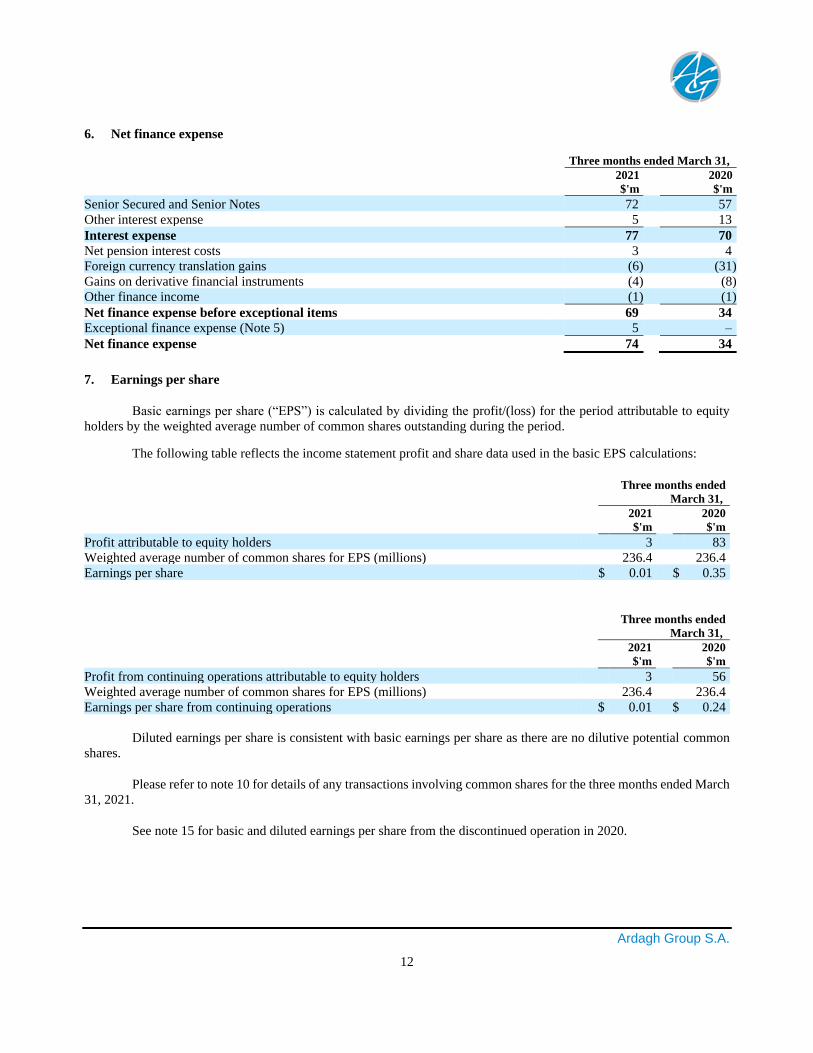
5. Exceptional items
Three months ended
March 31,
2021 2020 $'m $'m
Start-up related costs 3 –
Exceptional items – cost of sales 3 –
Transaction-related and other costs 5 3
Exceptional items – SGA expenses 5 3
Interest payable on Notes issuance (Note 11) 5 –
Exceptional items – finance expense 5 –
Share of exceptional items in material joint venture 13 4
Exceptional items from continuing operations 26 7 Exceptional income tax credit (2) (14)
Exceptional items from continuing operations, net of tax 24 (7) Exceptional items from discontinued operation, net of tax – (27)
Total exceptional items, net of tax 24 (34)
Exceptional items are those that in management’s judgment need to be disclosed by virtue of their size, nature or incidence.
2021
Exceptional items of $24 million have been recognized in the three months ended March 31, 2021, primarily comprising:
• $3 million start-up related costs in Metal Beverage Packaging Americas and Metal Beverage Packaging Europe,
relating to the Group’s investment programs.
• $5 million transaction-related and other costs primarily comprised of costs relating to acquisition and other
transactions, including professional advisory fees, and other costs related to transformation initiatives.
• $5 million, primarily related to interest payable on AMP Notes Issuance in March 2021 related to the period prior
to closing the proposed combination of Ardagh Metal Packaging with Gores Holdings V, see note 1 - General
Information.
• $13 million from the share of exceptional items in the Trivium joint venture.
• $2 million from tax credits.
2020
Exceptional items of $34 million have been recognized in the three months ended March 31, 2020 primarily comprising:
• $3 million transaction-related and other costs.
• $4 million from the share of exceptional items in the Trivium joint venture.
• $14 million from tax credits primarily relating to U.S. tax reform.
• $27 million credit arising from the remeasurement of the estimated consideration for the disposal of Food &
Specialty, in the period ended March 31, 2020.
Ardagh Group S.A.
12
6. Net finance expense
Three months ended March 31,
2021 2020 $'m $'m
Senior Secured and Senior Notes 72 57 Other interest expense 5 13
Interest expense 77 70 Net pension interest costs 3 4 Foreign currency translation gains (6) (31) Gains on derivative financial instruments (4) (8) Other finance income (1) (1)
Net finance expense before exceptional items 69 34 Exceptional finance expense (Note 5) 5 –
Net finance expense 74 34
7. Earnings per share
Basic earnings per share (“EPS”) is calculated by dividing the profit/(loss) for the period attributable to equity
holders by the weighted average number of common shares outstanding during the period.
The following table reflects the income statement profit and share data used in the basic EPS calculations:
Three months ended
March 31,
2021 2020 $'m $'m
Profit attributable to equity holders 3 83 Weighted average number of common shares for EPS (millions) 236.4 236.4 Earnings per share $ 0.01 $ 0.35
Three months ended
March 31,
2021 2020 $'m $'m
Profit from continuing operations attributable to equity holders 3 56 Weighted average number of common shares for EPS (millions) 236.4 236.4 Earnings per share from continuing operations $ 0.01 $ 0.24
Diluted earnings per share is consistent with basic earnings per share as there are no dilutive potential common
shares.
Please refer to note 10 for details of any transactions involving common shares for the three months ended March
31, 2021.
See note 15 for basic and diluted earnings per share from the discontinued operation in 2020.
Ardagh Group S.A.
13
8. Intangible assets and property, plant and equipment
Property, Intangible plant and assets equipment $'m $'m
Net book value at January 1, 2021 2,756 2,945 Additions 3 323 Acquisition – 15 Charge for the period (61) (122) Foreign exchange (48) (56)
Net book value at March 31, 2021 2,650 3,105
At March 31, 2021, the carrying amount of goodwill included within intangible assets was $1,652 million
(December 31, 2020: $1,682 million).
At March 31, 2021, the carrying amount of the right-of-use assets included within property, plant and equipment
was $393 million (December 31, 2020: $319 million).
The Group recognized a depreciation charge of $122 million in the three months ended March 31, 2021 (2020:
$109 million), of which $25 million (2020: $21 million) relates to right-of-use assets.
In March 2021, the Group completed the acquisition of the Longhorn glass manufacturing facility located in
Houston, Texas. The transaction, which is subject to the final agreement of customary completion adjustments, is not
material to the Group. These unaudited consolidated interim financial statements include management’s preliminary
estimate of the fair values of assets acquired and liabilities assumed.
Impairment test for goodwill
Goodwill is not subject to amortization and is tested annually for impairment following the approval of the annual
budget (normally at the end of the financial year), or more frequently if events or changes in circumstances indicate a
potential impairment.
Management has considered whether any impairment existed at the reporting date, or subsequent to the date that
the unaudited consolidated interim financial statements were approved for issue by the board of directors, including
assessing whether any cash-generating units (“CGU”) had experienced or are expected to experience prolonged cessation
of operations or had suffered or are expected to suffer either a prolonged decline in demand or prices and profitability as
a result of COVID-19. In addition, management assessed the likely impact of potential reduced economic activity in the
markets in which the Group operates. The results of this assessment are that management concluded goodwill is fully
recoverable as at March 31, 2021.
9. Investment in material joint venture
Investment in material joint venture is comprised of the Group’s approximate 42% investment in Trivium
Packaging B.V. incorporated in the Netherlands, with corporate offices in Amsterdam. The remaining approximate 58%
is held by Ontario Teachers’ Pension Plan Board. As the Group jointly controls both the financial and operating policy
decisions of Trivium, the investment is accounted for under the equity method. The shareholders of Trivium have entered
into a Shareholders Agreement, dated October 31, 2019, which governs their relationship as owners of Trivium, including
in respect of the governance of Trivium and its subsidiaries, their ability to transfer their shares in Trivium and other
customary matters.
Ardagh Group S.A.
14
The following tables provide aggregated financial information for Trivium as it relates to the amounts recognized
in the income statement, statement of comprehensive income and statement of financial position.
Three months
ended March 31, Three months
ended March 31,
2021 2020
$'m $'m
Loss for the period (18) (3) Other comprehensive (expense)/income (7) 11
Total comprehensive (expense)/income (25) 8
At March 31, At December 31,
2021 2020
$'m $'m
Investment in joint venture 349 390
The reconciliation of summarized financial information presented to the carrying amount of the Group’s interest
in Trivium is set out below.
2021
$'m
Group's interest in net assets of joint venture - January 1, 390
Share of total comprehensive expense (25)
Foreign exchange (16)
Carrying amount of interest in joint venture - March 31, 349
In respect of the Group’s equity accounted investment in Trivium, management has considered the carrying
amount of the investment and concluded that it is fully recoverable as at March 31, 2021.
The Group is party to a Mutual Services Agreement (“MSA”) with Trivium, pursuant to which the Group and
Trivium provide services to each other. The services generally relate to administrative support in respect of treasury
activities, tax reporting, procurement and logistics, R&D and certain IT services. The MSA provides for the sharing of
certain facilities leased by the Group in connection with the provision of services, with appropriate segregation in place
between the Group’s entities, on the one hand, and Trivium, on the other hand.
At March 31, 2021 and December 31, 2020, the Group had no significant related party balances outstanding with
Trivium. Income recognised by the Group from the MSA in the three months ended March 31, 2021 is not material.
In May 2020, the Group, as lender, entered into a credit facility (the “Trivium Credit Facility”) with Trivium, as
borrower. The amount of the Trivium Credit Facility is $36 million, and the facility matures on April 30, 2021. At March
31, 2021, the amount outstanding under the Trivium Credit Facility was $nil.
Ardagh Group S.A.
15
10. Issued capital and reserves
Share capital
Issued and fully paid shares:
Class A
common shares
(par value €0.01)
Class B
common shares
(par value €0.10) Total shares Total (million) (million) (million) $'m
At December 31, 2020 18.67 217.70 236.37 23 Share issuance – – – –
At March 31, 2021 18.67 217.70 236.37 23
There were no material share transactions in the three months ended March 31, 2021.
11. Financial assets and liabilities
At March 31, 2021 the Group’s net debt and available liquidity was as follows:
Maximum Final amount maturity Facility Undrawn Facility Currency drawable date type Amount drawn amount
Local Local currency currency $'m $'m m m
5.250% Senior Secured Notes USD 700 30-Apr-25 Bullet 700 700 – 4.125% Senior Secured Notes USD 1,215 15-Aug-26 Bullet 1,215 1,215 – 2.125% Senior Secured Notes EUR 439 15-Aug-26 Bullet 439 515 – 2.125% Senior Secured Notes EUR 790 15-Aug-26 Bullet 790 926 – 2.000% Senior Secured Notes* EUR 450 01-Sep-28 Bullet 450 528 – 3.250% Senior Secured Notes* USD 600 01-Sep-28 Bullet 600 600 – 6.000% Senior Notes USD 800 15-Feb-25 Bullet 800 817 – 4.750% Senior Notes GBP 400 15-Jul-27 Bullet 400 550 – 5.250% Senior Notes USD 800 15-Aug-27 Bullet 800 800 – 5.250% Senior Notes USD 1,000 15-Aug-27 Bullet 1,000 1,000 – 3.000% Senior Notes* EUR 500 01-Sep-29 Bullet 500 586 – 4.000% Senior Notes* USD 1,050 01-Sep-29 Bullet 1,050 1,050 – Global Asset Based Loan Facility USD 663 07-Dec-22 Revolving – – 663 Lease obligations Various – Amortizing – 434 – Other borrowings/credit lines Various – Rolling Amortizing – 8 1
Total borrowings / undrawn facilities 9,729 664 Deferred debt issue costs and bond
discounts/bond premium* (145) –
Net borrowings / undrawn facilities 9,584 664 Cash and cash equivalents (921) 921 Restricted cash in escrow* (2,764) – Derivative financial instruments used to
hedge foreign currency and interest rate
risk 66 –
Net debt / available liquidity 5,965 1,585
*Net debt excluding the AMP Notes Issuance, as outlined in note 1 – General information, and the associated restricted cash in escrow
of $2,764 million and deferred debt issue costs of $40 million, is $6,005 million.
Ardagh Group S.A.
16
Net debt includes the fair value of associated derivative financial instruments that are used to hedge foreign
exchange, interest rate risks relating to Group borrowings and restricted cash in escrow.
The fair value of the Group’s total borrowings excluding lease obligations and the fair value of Ardagh Metal
Packaging newly issued notes of $2,745 million, at March 31, 2021 is $6,642 million (December 31, 2020: $6,798 million).
A number of the Group’s borrowing agreements contain certain covenants that restrict the Group’s flexibility in
areas such as incurrence of additional indebtedness (primarily maximum secured borrowings to Adjusted EBITDA and a
minimum Adjusted EBITDA to interest expense), payment of dividends and incurrence of liens. The Global Asset Based
Loan Facility is subject to a fixed charge coverage ratio covenant if 90% or more of the facility is drawn. The facility also
includes cash dominion, representations, warranties, events of default and other covenants that are generally of a nature
customary for such facilities.
At December 31, 2020, the Group’s net debt and available liquidity was as follows:
Maximum Final amount maturity Facility Undrawn Facility Currency drawable date type Amount drawn amount
Local Local currency currency $'m $'m m m 5.250% Senior Secured Notes USD 700 30-Apr-25 Bullet 700 700 – 4.125% Senior Secured Notes USD 1,215 15-Aug-26 Bullet 1,215 1,215 – 2.125% Senior Secured Notes EUR 439 15-Aug-26 Bullet 439 539 – 2.125% Senior Secured Notes EUR 790 15-Aug-26 Bullet 790 969 – 6.000% Senior Notes USD 800 15-Feb-25 Bullet 800 826 – 4.750% Senior Notes GBP 400 15-Jul-27 Bullet 400 546 – 5.250% Senior Notes USD 800 15-Aug-27 Bullet 800 800 – 5.250% Senior Notes USD 1,000 15-Aug-27 Bullet 1,000 1,000 – Global Asset Based Loan Facility USD 599 07-Dec-22 Revolving – – 599 Lease obligations Various – Amortizing – 366 – Other borrowings/credit lines Various – Rolling Amortizing – 14 1
Total borrowings / undrawn
facilities 6,975 600 Deferred debt issue costs and bond
discounts/bond premium (114) –
Net borrowings / undrawn
facilities 6,861 600 Cash, cash equivalents and restricted
cash (1,267) 1,267 Derivative financial instruments
used to hedge foreign currency and
interest rate risk 105 –
Net debt / available liquidity 5,699 1,867

Ardagh Group S.A.
17
The maturity profile of the Group’s net borrowings is as follows:
At March 31, At December 31,
2021 2020
$'m $'m
Within one year or on demand 100 97 Between one and three years 125 113 Between three and five years 1,596 1,588 Greater than five years 7,908 5,177
Total borrowings 9,729 6,975
Deferred debt issue costs and bond discounts/bond premium (145) (114)
Net borrowings 9,584 6,861
Financing activity
2021
On March 12, 2021, the Group, in connection with the transaction related to the combination of Ardagh Metal
Packaging with Gores Holdings V, issued €450 million 2.000% Senior Secured Notes due 2028, $600 million 3.250%
Senior Secured Notes due 2028, €500 million 3.000% Senior Notes due 2029 and $1,050 million 4.000% Senior Notes
due 2029. Details related to the transaction and use of proceeds from this issuance are outlined in note 1 – General
Information and note 20 – Events after the reporting period. Restricted cash in escrow, at March 31, 2021, reflects the
proceeds from the issuance of the Notes of approximately $2.8 billion, which was treated as a non-cash transaction for
purpose of the statement of cashflows.
Lease obligations at March 31, 2021 of $434 million (December 31, 2020: $366 million), primarily reflects $103
million of new lease liabilities, partly offset by $35 million of principal repayments and foreign currency movements in
the three months ended March 31, 2021.
At March 31, 2021 the Group had $663 million available under the Global Asset Based Loan Facility.
Cross currency interest rate swaps
The Group hedges certain of its external borrowings and interest payable thereon using cross-currency interest
rate swaps (“CCIRS”), with a net liability position at March 31, 2021 of $66 million (December 31, 2020: $105 million
net liability).
On February 15, 2021, a tranche of the Group’s $700 million U.S. dollar to euro CCIRS matured. The fair value
of the swap at maturity was $6 million and the cash settlement was $5 million.
Fair value methodology
There has been no change to the fair value hierarchies for determining and disclosing the fair value of financial
instruments.
Fair values are calculated as follows:
(i) Senior secured and senior notes – the fair value of debt securities in issue is based on valuation techniques in which
all significant inputs are based on observable market data and represent Level 2 inputs.
(ii) Global Asset Based Loan Facility and other borrowings – the estimated value of fixed interest-bearing deposits is
based on discounted cash flows using prevailing money-market interest rates for debts with similar credit risk and
remaining maturity and represents Level 2 inputs.
(iii) CCIRS – the fair value of the CCIRS are based on quoted market prices and represent Level 2 inputs.
(iv) Commodity and foreign exchange derivatives – the fair value of these derivatives are based on quoted market prices
and represent Level 2 inputs.
Ardagh Group S.A.
18
12. Employee benefit obligations
Employee benefit obligations at March 31, 2021 have been reviewed in respect of the latest discount rates and
asset valuations. A re-measurement gain of $152 million (2020: loss of $35 million) has been recognized in the unaudited
consolidated interim statement of comprehensive income for the three months ended March 31, 2021.
The re-measurement gain of $152 million (2020: loss of $35 million) recognized for the three months ended
March 31, 2021 consisted of a decrease in the obligations of $209 million (2020 decrease: $129 million), partly offset by
a decrease in asset valuations of $57 million (2020 decrease: $164 million).
13. Cash used in operating activities
Three months ended March 31,
2021 2020 $'m $'m
Profit from continuing operations 3 56 Income tax charge 14 10 Net finance expense 74 34 Depreciation and amortization 183 167 Exceptional operating items 8 3 Share of post-tax loss in equity accounted joint venture 18 3 Movement in working capital (290) (409) Transaction-related, start-up and other exceptional costs paid (22) (54) Exceptional restructuring paid – (1)
Cash used in operations (12) (191)
14. Dividends
Three months ended
March 31,
2021 2020 $'m $'m
Cash dividends on common shares declared: Interim dividend for 2021: $0.15 per share (2020: $0.14 per share) (35) (33)
(35) (33)
On February 15, 2021, the Company approved a cash dividend of $0.15 per common share. The dividend of $35
million was paid on April 1, 2021 to shareholders of record on March 18, 2021.
15. Discontinued operation
On October 31, 2019, the Group completed the combination of its Food & Specialty business with the business
of Exal to form Trivium. In the three months ended March 31, 2020, the Group recognized a non-cash gain on disposal of
$27 million arising from the remeasurement of the estimated consideration for the disposal of the Food & Specialty
business.
Basic and diluted earnings per share from discontinued operation 2020
Three months
ended March 31,
2020
$'m
Profit from discontinued operation attributable to equity holders 27 Weighted average number of common shares for EPS (millions) 236.4 Earnings per share from discontinued operation 0.11
Ardagh Group S.A.
19
16. Related party transactions
With the exception of the transactions in note 9 ‘Investment in material joint venture’, there have been no
transactions in the three months ended March 31, 2021 with related parties, as disclosed in the Group’s Annual Report,
that had a material effect on the financial position or performance of the Group.
17. Contingencies
Environmental issues
The Group is regulated under various national and local environmental, occupational health and safety and other
governmental laws and regulations relating to:
• the operation of installations for manufacturing of metal packaging and surface treatment using
solvents;
• the operation of installations for manufacturing of container glass;
• the generation, storage, handling, use and transportation of hazardous materials;
• the emission of substances and physical agents into the environment;
• the discharge of waste water and disposal of waste;
• the remediation of contamination;
• the design, characteristics, collection and recycling of its packaging products; and
• the manufacturing, sale and servicing of machinery and equipment for the container glass and metal
packaging industry.
The Group believes, based on current information, that it is in substantial compliance with applicable
environmental laws and regulations and permit requirements. It does not believe it will be required, under existing or
anticipated future environmental laws and regulations, to expend amounts, over and above the amounts accrued, which
will have a material effect on its business, financial condition or results of operations or cash flows. In addition, no material
proceedings against the Group arising under environmental laws are pending.
Legal matters
In 2015, the German competition authority (the Federal Cartel Office) initiated an investigation of the practices
in Germany of metal packaging manufacturers, including Ardagh’s Food & Specialty Metal Packaging business which
was sold to Trivium. In 2018, the European Commission took over this investigation and the German investigation is, as
a result, at an end. Ardagh has agreed to provide an indemnity in respect of certain losses that Trivium might incur in
connection with this investigation. The European Commission’s investigation is ongoing, and there is, at this stage no
certainty as to the extent of any charge which may arise. Accordingly, no provision or indemnification liability has been
recognized.
With the exception of the above legal matter, the Group is involved in certain other legal proceedings arising in
the normal course of its business. The Group believes that none of these proceedings, either individually or in aggregate,
are expected to have a material adverse effect on its business, financial condition, results of operations or cash flows.
Ardagh Group S.A.
20
18. Seasonality of operations
The Group’s revenue and cash flows are both subject to seasonal fluctuations, with the Group generally building
inventories in anticipation of these seasonal demands resulting in working capital requirements typically being the greatest
at the end of the first quarter of the year.
The demand for our metal beverage products is strongest during spells of warm weather and therefore demand
typically peaks during the summer months, as well as in the period leading up to holidays in December. Demand for
beverage products within our Glass Packaging business is similarly strongest during the summer and during periods of
warm weather, as well as the period leading up to holidays in December.
The Group manages the seasonality of working capital principally by supplementing operating cash flows with
drawings under our Global Asset Based Loan facility.
19. Other information
COVID-19
The COVID-19 global pandemic and measures to prevent its spread, including restrictions on travel, imposition
of quarantines and prolonged closures of workplaces and other businesses, including hospitality, leisure and entertainment
outlets, and the related cancellation of events, has impacted our business in a number of ways including as a result of the
impact of reduced global economic activity which resulted in lower demand for some of our customers’ products and,
therefore, certain of the products we manufacture.
COVID-19 may continue to have an adverse effect on our business and operations, including potential disruptions
to our supply chain and workforce. Although our production has not been significantly impacted to date, our plants may
be required to curtail or cease production in order to respond to any future measures which may arise in order to prevent
the spread of COVID-19. In addition, the pandemic may in the future impact on capital markets which could impact our
cost of borrowing. During the three months ended March 31, 2021, incremental COVID-19 related costs, including safety
and cleaning costs, were incurred throughout the Group.
The ultimate significance of the disruptions arising as a result of COVID-19, including the extent of their adverse
impact on our financial and operational results, will be determined by the duration of the ongoing pandemic, its severity
in the markets that we serve and the nature and efficacy of government and other regulatory responses, protective measures
and vaccination programs and the related impact on macroeconomic activity and consumer behavior.
20. Events after the reporting period
On April 28, 2021, the Board declared a cash dividend of $0.15 per common share, payable on June 16, 2021 to
the shareholders of record on June 2, 2021.
Combination of Ardagh Metal Packaging with Gores Holdings V
In connection with the closing of the business combination, the Group effected on April 1, 2021 a series of
transactions that resulted in (a) the equity interests of Ardagh Packaging Holdings Limited, an Irish subsidiary of the
Group, and certain other subsidiaries of the Group that are engaged in the metal beverage can business (the “AMP
Business”) being directly or indirectly owned by Ardagh Metal Packaging (all such entities collectively, the “AMP
Entities”) and (b) any assets and liabilities relating to the business of the Group (other than the AMP Business) that are
held by the AMP Entities being transferred to subsidiaries of the Group that are not AMP Entities, and assets and liabilities
relating to the AMP Business that are held by subsidiaries of the Group (other than the AMP Entities) being transferred to
the AMP Entities (such transactions, collectively, the “AMP Transfer”). On completion of the AMP Transfer on April 1,
Ardagh Group S.A.
21
2021, $2.3 billion of the AMP Notes Issuance was paid to Ardagh on the release of the proceeds of the AMP Notes Issuance
from escrow.
In connection with the AMP Notes Issuance, the Group has designated the Co-Issuers and the AMP entities as
unrestricted subsidiaries under its existing bond indentures and the Global Asset Based Loan Facility.
On April 1, 2021, the Group reduced the size of Global Asset Based Loan Facility from $700 million to $500
million as a result of the transaction between Ardagh Metal Packaging and Gores Holdings V.

Ardagh Group S.A.
22
MANAGEMENT’S DISCUSSION AND ANALYSIS OF FINANCIAL CONDITION AND
RESULTS OF OPERATIONS
The following discussion should be read together with, and is qualified in its entirety by, reference to the Unaudited
Consolidated Interim Financial Statements for the three months ended March 31, 2021 including the related notes thereto.
As used in this section, the “Group” refers to Ardagh Group S.A. and its subsidiaries.
Some of the measures used in this report are not measurements of financial performance under IFRS and should
not be considered an alternative to cash flow from operating activities as a measure of liquidity or an alternative to
operating profit/(loss) or profit/(loss) for the period as indicators of our operating performance or any other measures of
performance derived in accordance with IFRS.
Business Drivers
The main factors affecting our results of operations for Metal Beverage Packaging and Glass Packaging are: (i)
global economic trends and end-consumer demand for our products; (ii) prices of energy and raw materials used in our
business, primarily aluminum, steel, cullet, sand, soda ash and coatings, and our ability to pass through these and other
cost increases to our customers, through contractual pass through mechanisms under multi-year contracts, or through
renegotiation in the case of short-term contracts; (iii) investment in operating cost reductions; (iv) acquisitions; and (v)
foreign exchange rate fluctuations and currency translation risks arising from various currency exposures, primarily with
respect to the euro, U.S. dollar, British pound, Swedish krona, Polish zloty, Danish krone and Brazilian real.
The COVID-19 global pandemic and measures to prevent its spread, including restrictions on travel, imposition
of quarantines and prolonged closures of workplaces and other businesses, including hospitality, leisure and entertainment
outlets, and the related cancellation of events, has impacted our business in a number of ways including as a result of the
impact of reduced global economic activity which resulted in lower demand for some of our customers’ products and,
therefore, certain of the products we manufacture.
COVID-19 may continue to have an adverse effect on our business and operations, including potential disruptions
to our supply chain and workforce. Although our production has not been significantly impacted to date, our plants may
be required to curtail or cease production in order to respond to any future measures which may arise in order to prevent
the spread of COVID-19. In addition, the pandemic may in the future impact on capital markets which could impact our
cost of borrowing.
The ultimate significance of the disruptions arising as a result of COVID-19, including the extent of their adverse
impact on our financial and operational results, will be determined by the duration of the ongoing pandemic, its severity
in the markets that we serve and the nature and efficacy of government and other regulatory responses, protective measures
and vaccination programs and the related impact on macroeconomic activity and consumer behavior.
During the three months ended March 31, 2021, incremental COVID-19 related costs, including safety and
cleaning costs, continued to be incurred throughout the Group.
Metal Beverage Packaging
Metal Beverage Packaging generates its revenue from supplying metal can packaging to the beverage end use
category. Revenue is primarily dependent on sales volumes and sales prices.
Sales volumes are influenced by a number of factors, including factors driving customer demand, seasonality and
the capacity of our metal beverage packaging plants. Demand for our metal beverage cans may be influenced by trends in
the consumption of beverages, industry trends in packaging, including marketing decisions, and the impact of
Ardagh Group S.A.
23
environmental regulations and shifts in consumer sentiment towards a greater awareness of sustainability. The demand for
our beverage products is strongest during spells of warm weather and therefore demand typically, based on historical
trends, peaks during the summer months, as well as in the period leading up to holidays in December. Accordingly, we
generally build inventories in the first and fourth quarter in anticipation of the seasonal demands in our beverage business.
Metal Beverage Packaging’s Adjusted EBITDA is based on revenue derived from selling our metal beverage
cans and is affected by a number of factors, primarily cost of sales. The elements of Metal Beverage Packaging’s cost of
sales include (i) variable costs, such as electricity, raw materials (including the cost of aluminum), packaging materials,
decoration and freight and other distribution costs, and (ii) fixed costs, such as labor and other plant-related costs including
depreciation, maintenance and sales, marketing and administrative costs. Metal Beverage Packaging’s variable costs have
typically constituted approximately 75% and fixed costs approximately 25% of the total cost of sales for our Metal
Beverage Packaging business.
Glass Packaging
Glass Packaging generates its revenue principally from selling glass containers. Glass Packaging revenue is
primarily dependent on sales volumes and sales prices. Glass Packaging includes our glass engineering business, Heye
International.
Sales volumes are affected by a number of factors, including factors impacting customer demand, seasonality and
the capacity of Glass Packaging’s plants. Demand for glass containers may be influenced by trends in the consumption of
beverages, fruit and vegetable harvests, industry trends in packaging, including marketing decisions, and the impact of
environmental regulations, as well as changes in consumer sentiment including a greater awareness of sustainability issues.
In the U.S., for example, the growth in consumption of imported beer has seen reduced demand for domestically-
produced mass beer brands, resulting in reduced demand for glass packaging for this end-use category. Recent years have
also seen an increase in the imports of empty glass containers into the United States. In response, the Group reduced
production capacity in its Glass Packaging North America division by over 10%, in the period 2018-2019. The Group is
pursuing growth opportunities in stronger performing end-markets, including food, wines and spirits and has converted
production capacity from the mass beer sector to serve these alternative end-markets. Investments in advanced inspection
equipment and automation have also been undertaken, and continue to be undertaken, in order to enhance quality and
productivity.
Beverage sales within our Glass Packaging business are seasonal in nature, with strongest demand during the
summer and during periods of warm weather, as well as the period leading up to holidays in December. Accordingly, Glass
Packaging’s shipment volumes of glass containers is typically lower in the first quarter. Glass Packaging builds inventory
in the first quarter in anticipation of these seasonal demands. In addition, Glass Packaging generally schedules shutdowns
of its plants for furnace rebuilding and repairs of machinery in the first quarter. These strategic shutdowns and seasonal
sales patterns adversely affect profitability in Glass Packaging’s glass manufacturing operations during the first quarter of
the year. Plant shutdowns may also affect the comparability of results from period to period. Glass Packaging’s working
capital requirements are typically greatest at the end of the first quarter of the year.
Glass Packaging’s Adjusted EBITDA is based on revenue derived from selling glass containers and glass
engineering products and services and is affected by a number of factors, primarily cost of sales. The elements of Glass
Packaging’s cost of sales for its glass container manufacturing business include (i) variable costs, such as natural gas and
electricity, raw materials (including the cost of cullet), packaging materials, decoration and freight and other distribution
costs, and (ii) fixed costs, such as labor and other plant-related costs including depreciation, maintenance and sales,
marketing and administrative costs. Glass Packaging’s variable costs have typically constituted approximately 40% and
fixed costs approximately 60% of the total cost of sales for our glass container manufacturing business.

Ardagh Group S.A.
24
Results of operations
Three months ended March 31, 2021 compared with three months ended March 31, 2020:
Unaudited
(in $ millions)
Three months ended March 31,
2021 2020
Revenue 1,774 1,622 Cost of sales (1,499) (1,360)
Gross profit 275 262 Sales, general and administration expenses (105) (101) Intangible amortization (61) (58)
Operating profit 109 103 Net finance expense (74) (34) Share of post-tax loss in equity accounted joint venture (18) (3)
Profit before tax 17 66 Income tax charge (14) (10)
Profit from continuing operations 3 56 Profit from discontinued operation – 27
Profit for the period 3 83
Revenue
Revenue in the three months ended March 31, 2021 increased by $152 million, or 9%, to $1,774 million,
compared with $1,622 million in the three months ended March 31, 2020. The increase in revenue is primarily driven by
favorable volume/mix effects, which includes an impact of the Group’s business growth investment program, the pass
through to customers of higher input costs and favorable foreign currency translation effects of $65 million.
Cost of sales
Cost of sales in the three months ended March 31, 2021 increased by $139 million, or 10%, to $1,499 million,
compared with $1,360 million in the three months ended March 31, 2020. The increase in cost of sales is principally due
to unfavorable foreign currency translation effects, increased sales as noted above, higher input costs and higher
exceptional cost of sales, which increased by $3 million. Further analysis of the movements in exceptional items is set out
in the “Supplemental Management’s Discussion and Analysis” section.
Gross profit
Gross profit in the three months ended March 31, 2021 increased by $13 million, or 5%, to $275 million,
compared with $262 million in the three months ended March 31, 2020. Gross profit percentage in the three months ended
March 31, 2021 decreased by 70 basis points to 15.5%, compared with 16.2% in the three months ended March 31, 2020.
Excluding exceptional cost of sales, gross profit percentage in the three months ended March 31, 2021 decreased by 50
basis points to 15.7% compared with 16.2% in the three months ended March 31, 2020. Further analysis of the movements
in exceptional items is set out in the “Supplemental Management’s Discussion and Analysis” section.
Ardagh Group S.A.
25
Sales, general and administration expenses
Sales, general and administration expenses in the three months ended March 31, 2021 increased by $4 million,
or 4%, to $105 million, compared with $101 million in the three months ended March 31, 2020. Excluding exceptional
items, sales, general and administration expenses increased by $2 million. Exceptional sales, general and administration
expenses increased by $2 million, due to higher transaction-related and other costs.
Intangible amortization
Intangible amortization of $61 million in the three months ended March 31, 2021 increased by $3 million, or 5%,
compared with $58 million in the three months ended March 31, 2020, primarily driven by unfavourable foreign exchange.
Operating profit
Operating profit of $109 million in the three months ended March 31, 2021 increased by $6 million, or 6%,
compared with the three months ended March 31, 2020, due to higher gross profit, as outlined above, partly offset by
higher sales, general and administration expenses and higher intangible amortization charges.
Net finance expense
Net finance expense for the three months ended March 31, 2021 increased by $40 million, or 118%, to $74 million
compared with $34 million for the three months ended March 31, 2020. Net finance expense for the three months ended
March 31, 2021 and 2020 comprised the following:
Unaudited
(in $ millions)
Three months ended March 31,
2021 2020
Interest expense 77 70 Net pension interest costs 3 4 Foreign currency translation gains (6) (31) Gains on derivative financial instruments (4) (8) Other finance income (1) (1)
Net finance expense before exceptional items 69 34 Exceptional finance expense 5 –
Net finance expense 74 34
Interest expense increased by $7 million to $77 million in the three months ended March 31, 2021 compared with
$70 million in the three months ended March 31, 2020. The increase primarily relates to higher interest expense on the
Group’s Senior Secured Notes and Senior Notes as a result of 2020 financing activities, partly offset by a reduction in
other interest expense.
Foreign currency translation gains in the three months ended March 31, 2021 decreased by $25 million, to $6
million, compared with $31 million in the three months ended March 31, 2020, driven by foreign exchange rate
fluctuations, primarily the U.S. dollar and British pound.
Gains on derivative financial instruments of $4 million in the three months ended March 31, 2021 decreased by
$4 million, compared to a gain of $8 million in the three months ended March 31, 2020. The gain is related to the Group’s
CCIRS.
Ardagh Group S.A.
26
Exceptional finance expense for the three months ended March 31, 2021 of $5 million primarily related to interest
charges incurred on the Notes issued in March 2021 in connection with the transaction related to the combination of
Ardagh Metal Packaging with Gores Holdings.
Share of post–tax loss in equity accounted joint venture
The Group recognized an $18 million share of post-tax loss in its equity accounted joint venture, relating to its
approximate 42% investment in Trivium. Please refer to note 9 of these unaudited consolidated interim financial
statements.
Income tax charge
Income tax charge in the three months ended March 31, 2021 was $14 million, a movement of $4 million from
an income tax charge of $10 million in the three months ended March 31, 2020. The movement of $4 million in the income
tax charge is primarily due to a decrease in exceptional tax credits of $12 million mainly attributable to tax credits from
U.S. tax reform in the three months ended March 31, 2020, partially offset by a decrease in the pre-exceptional income
tax charge of $8 million in the three months ended March 31, 2021, which is attributable to a decrease in profit before
exceptional items and share of post-tax loss in equity accounted joint venture in the three months ended March 31, 2021
compared to the three months ended March 31, 2020.
The effective income tax rate on profit before exceptional items and share of post-tax loss in equity accounted
joint venture for the three months ended March 31, 2021 was 33%, consistent with the three months ended March 31,
2020.
Profit from continuing operations
As a result of the items described above, the Group recognized a profit of $3 million for the three months ended
March 31, 2021, compared with a profit of $56 million in the three months ended March 31, 2020.
Supplemental Management’s Discussion and Analysis
Key operating measures
Adjusted EBITDA consists of profit/(loss) for the year before income tax charge/(credit), net finance expense,
depreciation and amortization, exceptional operating items and share of profit or loss in equity accounted joint venture.
We use Adjusted EBITDA to evaluate and assess our segment performance. Adjusted EBITDA is presented because we
believe that it is frequently used by securities analysts, investors and other interested parties in evaluating companies in
the packaging industry. However, other companies may calculate Adjusted EBITDA in a manner different from ours.
Adjusted EBITDA is not a measure of financial performance under IFRS and should not be considered an alternative to
profit/(loss) as indicators of operating performance or any other measures of performance derived in accordance with
IFRS.
For a reconciliation of the profit/(loss) for the period to Adjusted EBITDA see note 4 of the unaudited
consolidated interim financial statements.
Adjusted EBITDA in the three months ended March 31, 2021 increased by $27 million, or 10%, to $300 million,
compared with $273 million in the three months ended March 31, 2020.
Ardagh Group S.A.
27
Exceptional items
The following table provides detail on exceptional items from continuing operations included in cost of sales and
sales, general and administration expenses:
Three months ended March 31,
2021 2020 $'m $'m
Start-up related costs 3 –
Exceptional items – cost of sales 3 –
Transaction-related and other costs 5 3
Exceptional items – SGA expenses 5 3
Interest payable on Notes issuance (Note 11) 5 –
Exceptional items – finance expense 5 –
Share of exceptional items in material joint venture 13 4
Exceptional items from continuing operations 26 7
Exceptional income tax credit (2) (14)
Exceptional items from continuing operations, net of tax 24 (7)
Exceptional items from discontinued operation, net of tax – (27)
Total exceptional items, net of tax 24 (34)
Exceptional items of $24 million have been recognized in the three months ended March 31, 2021, primarily comprising:
• $3 million start-up related costs in Metal Beverage Packaging Americas and Metal Beverage Packaging Europe,
relating to the Group’s investment programs.
• $5 million transaction-related and other costs primarily comprised of costs relating to acquisition and other
transactions, including professional advisory fees, and other costs related to transformation initiatives.
• $5 million, primarily related to interest payable on AMP Notes Issuance in March 2021 related to the period prior
to closing the proposed combination of Ardagh Metal Packaging with Gores Holdings V combination.
• $13 million from the share of exceptional items in the Trivium joint venture.
• $2 million from tax credits.
Exceptional items of $34 million have been recognized in the three months ended March 31, 2020 primarily comprising:
• $3 million transaction-related and other costs.
• $4 million from the share of exceptional items in the Trivium joint venture.
• $14 million from tax credits primarily relating to U.S. tax reform.
• $27 million credit arising from the remeasurement of the estimated consideration for the disposal of Food &
Specialty, in the period ended March 31, 2020.
Ardagh Group S.A.
28
Segment Information
Three months ended March 31, 2021 compared with three months ended March 31, 2020
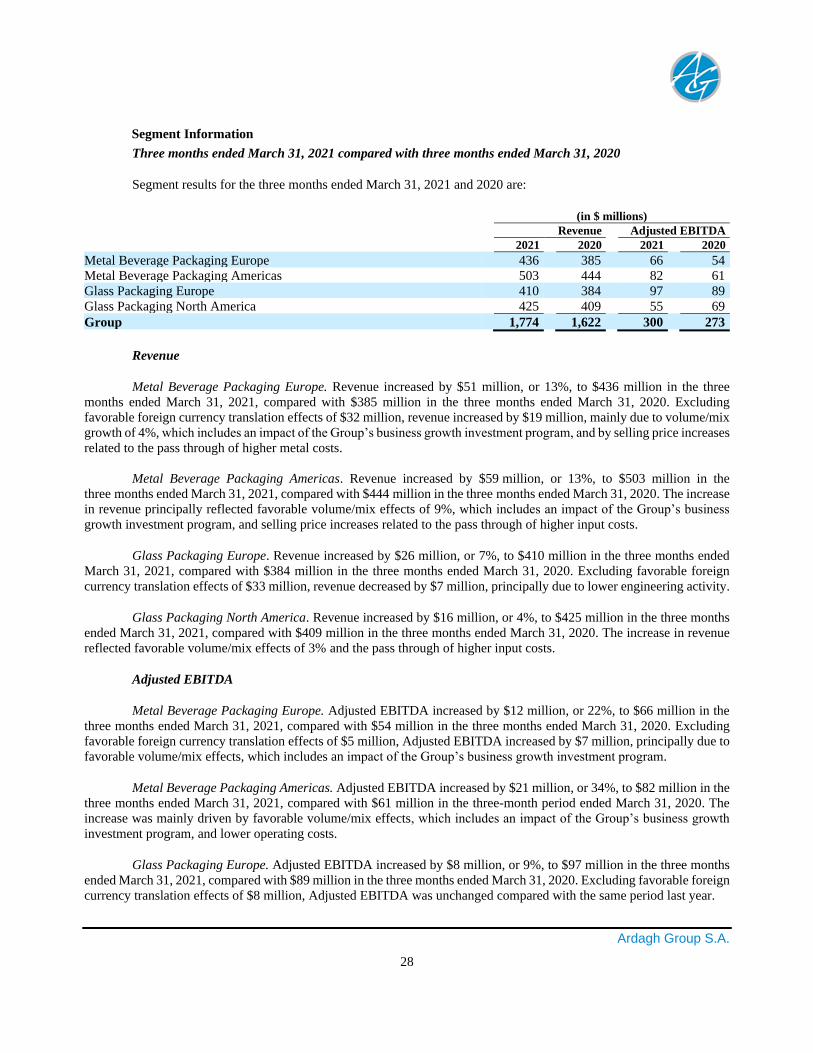
Segment results for the three months ended March 31, 2021 and 2020 are:
(in $ millions)
Revenue Adjusted EBITDA
2021 2020 2021 2020
Metal Beverage Packaging Europe 436 385 66 54 Metal Beverage Packaging Americas 503 444 82 61 Glass Packaging Europe 410 384 97 89 Glass Packaging North America 425 409 55 69
Group 1,774 1,622 300 273
Revenue
Metal Beverage Packaging Europe. Revenue increased by $51 million, or 13%, to $436 million in the three
months ended March 31, 2021, compared with $385 million in the three months ended March 31, 2020. Excluding
favorable foreign currency translation effects of $32 million, revenue increased by $19 million, mainly due to volume/mix
growth of 4%, which includes an impact of the Group’s business growth investment program, and by selling price increases
related to the pass through of higher metal costs.
Metal Beverage Packaging Americas. Revenue increased by $59 million, or 13%, to $503 million in the
three months ended March 31, 2021, compared with $444 million in the three months ended March 31, 2020. The increase
in revenue principally reflected favorable volume/mix effects of 9%, which includes an impact of the Group’s business
growth investment program, and selling price increases related to the pass through of higher input costs.
Glass Packaging Europe. Revenue increased by $26 million, or 7%, to $410 million in the three months ended
March 31, 2021, compared with $384 million in the three months ended March 31, 2020. Excluding favorable foreign
currency translation effects of $33 million, revenue decreased by $7 million, principally due to lower engineering activity.
Glass Packaging North America. Revenue increased by $16 million, or 4%, to $425 million in the three months
ended March 31, 2021, compared with $409 million in the three months ended March 31, 2020. The increase in revenue
reflected favorable volume/mix effects of 3% and the pass through of higher input costs.
Adjusted EBITDA
Metal Beverage Packaging Europe. Adjusted EBITDA increased by $12 million, or 22%, to $66 million in the
three months ended March 31, 2021, compared with $54 million in the three months ended March 31, 2020. Excluding
favorable foreign currency translation effects of $5 million, Adjusted EBITDA increased by $7 million, principally due to
favorable volume/mix effects, which includes an impact of the Group’s business growth investment program.
Metal Beverage Packaging Americas. Adjusted EBITDA increased by $21 million, or 34%, to $82 million in the
three months ended March 31, 2021, compared with $61 million in the three-month period ended March 31, 2020. The
increase was mainly driven by favorable volume/mix effects, which includes an impact of the Group’s business growth
investment program, and lower operating costs.
Glass Packaging Europe. Adjusted EBITDA increased by $8 million, or 9%, to $97 million in the three months
ended March 31, 2021, compared with $89 million in the three months ended March 31, 2020. Excluding favorable foreign
currency translation effects of $8 million, Adjusted EBITDA was unchanged compared with the same period last year.

Ardagh Group S.A.
29
Glass Packaging North America. Adjusted EBITDA decreased by $14 million, or 20%, to $55 million in the
three months ended March 31, 2021, compared with $69 million in the three months ended March 31, 2020. The decrease
was mainly as a result of increased freight and other operating costs including related to severe weather events in the
United States during the quarter.
Liquidity and Capital Resources
Cash requirements related to operations
Our principal sources of cash are cash generated from operations and external financings, including borrowings
and other credit facilities. Our principal funding arrangements include borrowings available under the Global Asset Based
Loan Facility.
The following table outlines our principal financing arrangements as at March 31, 2021:
Maximum Final amount maturity Facility Undrawn Facility Currency drawable date type Amount drawn amount
Local Local currency currency $'m $'m m m 5.250% Senior Secured Notes USD 700 30-Apr-25 Bullet 700 700 – 4.125% Senior Secured Notes USD 1,215 15-Aug-26 Bullet 1,215 1,215 – 2.125% Senior Secured Notes EUR 439 15-Aug-26 Bullet 439 515 – 2.125% Senior Secured Notes EUR 790 15-Aug-26 Bullet 790 926 – 2.000% Senior Secured Notes* EUR 450 01-Sep-28 Bullet 450 528 3.250% Senior Secured Notes* USD 600 01-Sep-28 Bullet 600 600 6.000% Senior Notes USD 800 15-Feb-25 Bullet 800 817 – 4.750% Senior Notes GBP 400 15-Jul-27 Bullet 400 550 – 5.250% Senior Notes USD 800 15-Aug-27 Bullet 800 800 – 5.250% Senior Notes USD 1,000 15-Aug-27 Bullet 1,000 1,000 – 3.000% Senior Notes* EUR 500 01-Sep-29 Bullet 500 586 4.000% Senior Notes* USD 1,050 01-Sep-29 Bullet 1,050 1,050 Global Asset Based Loan Facility USD 663 07-Dec-22 Revolving – – 663 Lease obligations Various – Amortizing – 434 – Other borrowings/credit lines Various – Rolling Amortizing – 8 1
Total borrowings / undrawn facilities 9,729 664 Deferred debt issue costs and bond
discounts/bond premium* (145) –
Net borrowings / undrawn facilities 9,584 664 Cash and cash equivalents (921) 921 Restricted cash in escrow* (2,764) –
Derivative financial instruments used to
hedge foreign currency and interest rate
risk 66 –
Net debt / available liquidity 5,965 1,585
*Net debt excluding the AMP Notes Issuance, as outlined in note 1 – General information, and the associated restricted cash in escrow
of $2,764 million and deferred debt issue costs of $40 million, is $6,005 million.
Ardagh Group S.A.
30
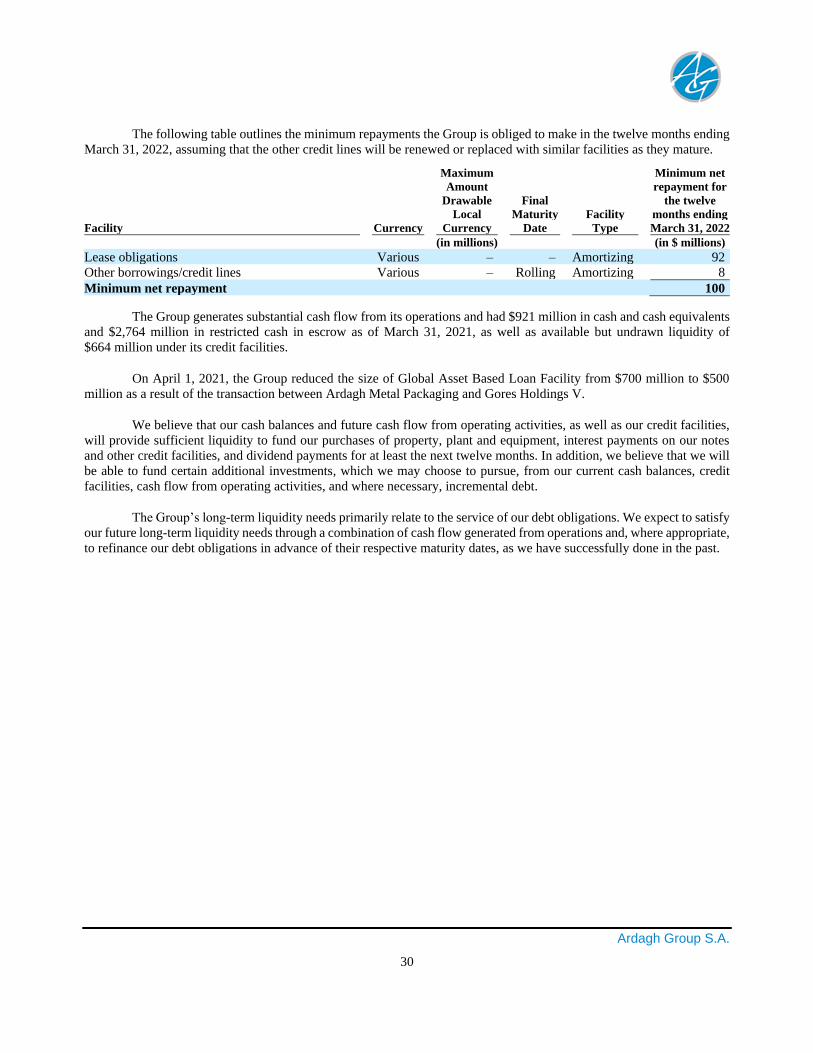
The following table outlines the minimum repayments the Group is obliged to make in the twelve months ending
March 31, 2022, assuming that the other credit lines will be renewed or replaced with similar facilities as they mature.
Maximum Minimum net Amount repayment for Drawable Final the twelve Local Maturity Facility months ending
Facility Currency Currency Date Type March 31, 2022
(in millions) (in $ millions)
Lease obligations Various – – Amortizing 92 Other borrowings/credit lines Various – Rolling Amortizing 8
Minimum net repayment 100
The Group generates substantial cash flow from its operations and had $921 million in cash and cash equivalents
and $2,764 million in restricted cash in escrow as of March 31, 2021, as well as available but undrawn liquidity of
$664 million under its credit facilities.
On April 1, 2021, the Group reduced the size of Global Asset Based Loan Facility from $700 million to $500
million as a result of the transaction between Ardagh Metal Packaging and Gores Holdings V.
We believe that our cash balances and future cash flow from operating activities, as well as our credit facilities,
will provide sufficient liquidity to fund our purchases of property, plant and equipment, interest payments on our notes
and other credit facilities, and dividend payments for at least the next twelve months. In addition, we believe that we will
be able to fund certain additional investments, which we may choose to pursue, from our current cash balances, credit
facilities, cash flow from operating activities, and where necessary, incremental debt.
The Group’s long-term liquidity needs primarily relate to the service of our debt obligations. We expect to satisfy
our future long-term liquidity needs through a combination of cash flow generated from operations and, where appropriate,
to refinance our debt obligations in advance of their respective maturity dates, as we have successfully done in the past.
Ardagh Group S.A.
31
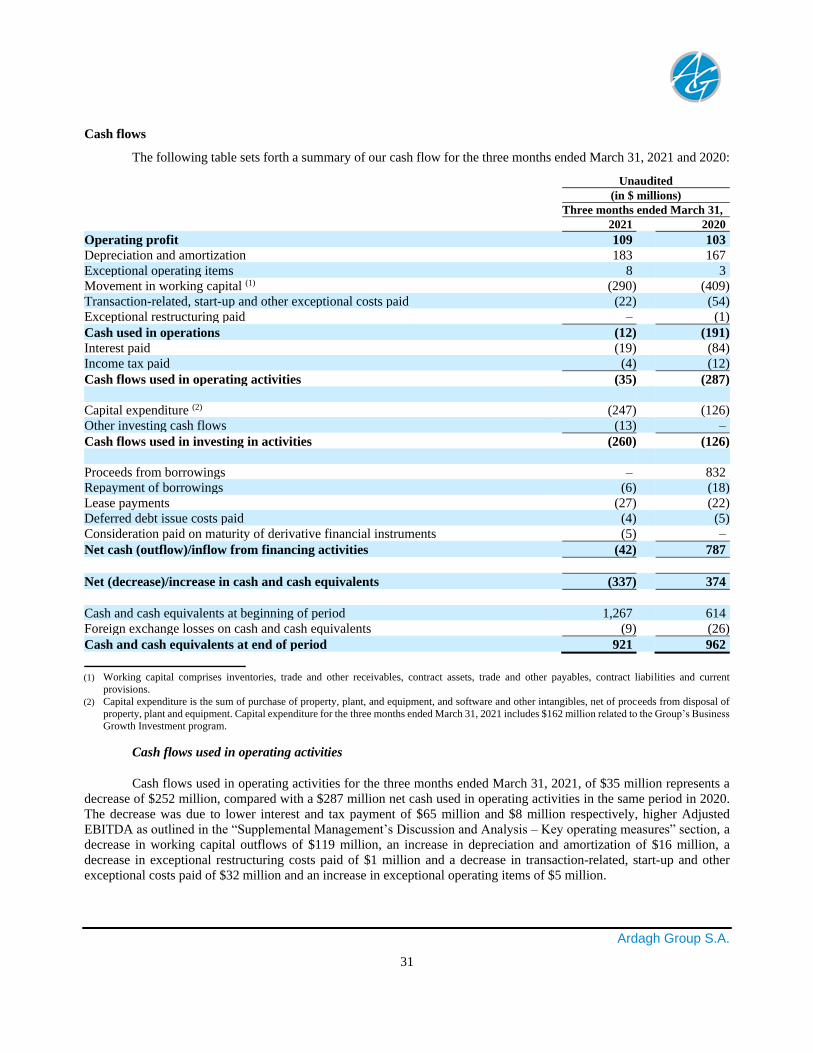
Cash flows
The following table sets forth a summary of our cash flow for the three months ended March 31, 2021 and 2020:
Unaudited
(in $ millions)
Three months ended March 31,
2021 2020
Operating profit 109 103 Depreciation and amortization 183 167 Exceptional operating items 8 3 Movement in working capital (1) (290) (409) Transaction-related, start-up and other exceptional costs paid (22) (54) Exceptional restructuring paid – (1)
Cash used in operations (12) (191) Interest paid (19) (84) Income tax paid (4) (12)
Cash flows used in operating activities (35) (287) Capital expenditure (2) (247) (126) Other investing cash flows (13) –
Cash flows used in investing in activities (260) (126) Proceeds from borrowings – 832 Repayment of borrowings (6) (18) Lease payments (27) (22) Deferred debt issue costs paid (4) (5) Consideration paid on maturity of derivative financial instruments (5) –
Net cash (outflow)/inflow from financing activities (42) 787
Net (decrease)/increase in cash and cash equivalents (337) 374
Cash and cash equivalents at beginning of period 1,267 614 Foreign exchange losses on cash and cash equivalents (9) (26)
Cash and cash equivalents at end of period 921 962
(1) Working capital comprises inventories, trade and other receivables, contract assets, trade and other payables, contract liabilities and current
provisions.
(2) Capital expenditure is the sum of purchase of property, plant, and equipment, and software and other intangibles, net of proceeds from disposal of
property, plant and equipment. Capital expenditure for the three months ended March 31, 2021 includes $162 million related to the Group’s Business
Growth Investment program.
Cash flows used in operating activities
Cash flows used in operating activities for the three months ended March 31, 2021, of $35 million represents a
decrease of $252 million, compared with a $287 million net cash used in operating activities in the same period in 2020.
The decrease was due to lower interest and tax payment of $65 million and $8 million respectively, higher Adjusted
EBITDA as outlined in the “Supplemental Management’s Discussion and Analysis – Key operating measures” section, a
decrease in working capital outflows of $119 million, an increase in depreciation and amortization of $16 million, a
decrease in exceptional restructuring costs paid of $1 million and a decrease in transaction-related, start-up and other
exceptional costs paid of $32 million and an increase in exceptional operating items of $5 million.
Ardagh Group S.A.
32
Cash flows used in investing activities
Cash flows used in investing activities increased by $134 million to $260 million in the three months ended March
31, 2021, compared with $126 million in the same period in 2020 mainly driven by increased capital expenditure on the
Group’s business growth investment program, the timing of projects and furnace rebuild and repair activity.
Net (outflow)/inflow from financing activities
Net cash from financing activities represents an outflow of $42 million in the three months ended March 31, 2021
compared with a $787 million inflow in the same period in 2020.
Lease payments of $27 million in the three months ended March 31, 2021, increased by $5 million compared to
$22 million in the three months ended March 31, 2020, reflecting increased principal repayments on the Group’s lease
obligations.
Working capital
For the three months ended March 31, 2021, the working capital outflow during the period decreased by $119
million to $290 million, from an outflow of $409 million for the three months ended March 31, 2020. The decrease is
mainly due to favorable movements from inventory, trade and other payables and trade and other receivables, compared
with the same period in 2020.
Transaction-related, start-up and other exceptional costs paid
Transaction-related, start-up and other exceptional costs paid in the three months ended March 31, 2021 decreased
by $32 million to $22 million, compared with $54 million in the three months ended March 31, 2020. In the three months
ended March 31, 2021 amounts paid of $22 million primarily related to transformation and other transaction-related costs.
In the three months ended March 31, 2020 amounts paid of $54 million primarily related to costs arising on the combination
of the Group’s Food and Speciality Metal Packaging business with the business of Exal Corporation to form Trivium.
Income tax paid
Income tax paid during the three months ended March 31, 2021 was $4 million, which represents a decrease of
$8 million, compared with $12 million in the three months period ended March 31, 2020. The decrease is primarily
attributable to the timing of tax payments and refunds received in certain jurisdictions.
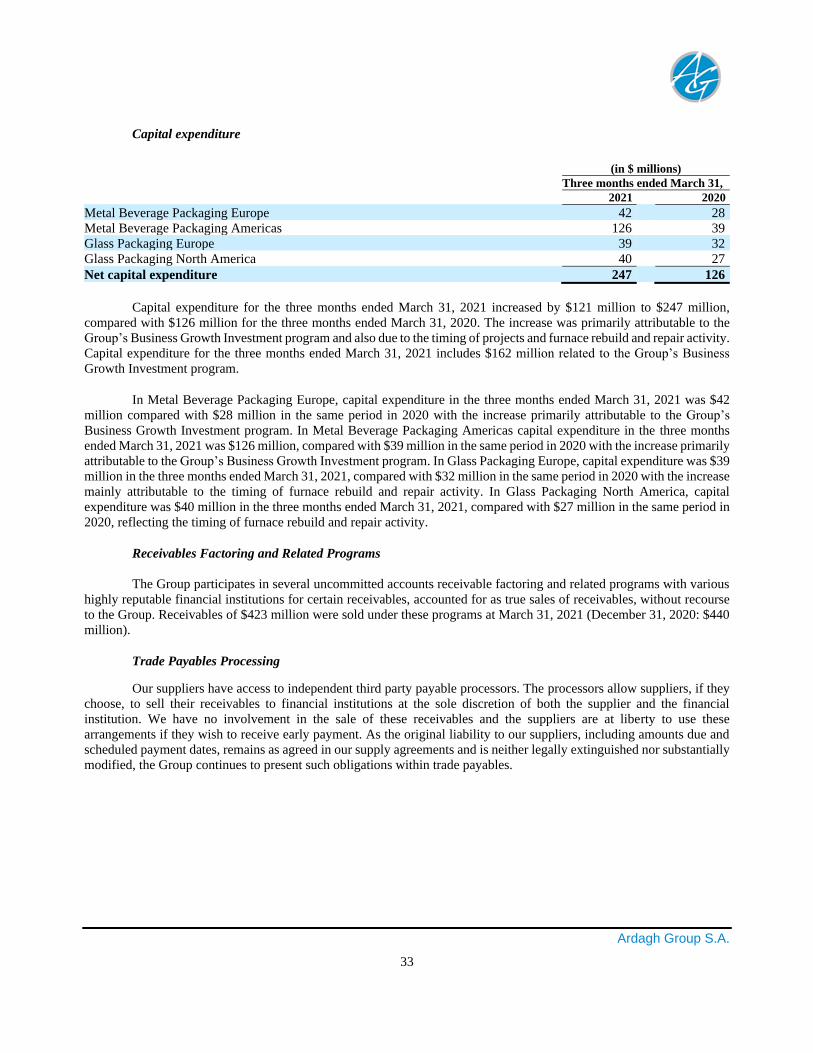
Ardagh Group S.A.
33
Capital expenditure
(in $ millions)
Three months ended March 31,
2021 2020
Metal Beverage Packaging Europe 42 28 Metal Beverage Packaging Americas 126 39 Glass Packaging Europe 39 32 Glass Packaging North America 40 27
Net capital expenditure 247 126
Capital expenditure for the three months ended March 31, 2021 increased by $121 million to $247 million,
compared with $126 million for the three months ended March 31, 2020. The increase was primarily attributable to the
Group’s Business Growth Investment program and also due to the timing of projects and furnace rebuild and repair activity.
Capital expenditure for the three months ended March 31, 2021 includes $162 million related to the Group’s Business
Growth Investment program.
In Metal Beverage Packaging Europe, capital expenditure in the three months ended March 31, 2021 was $42
million compared with $28 million in the same period in 2020 with the increase primarily attributable to the Group’s
Business Growth Investment program. In Metal Beverage Packaging Americas capital expenditure in the three months
ended March 31, 2021 was $126 million, compared with $39 million in the same period in 2020 with the increase primarily
attributable to the Group’s Business Growth Investment program. In Glass Packaging Europe, capital expenditure was $39
million in the three months ended March 31, 2021, compared with $32 million in the same period in 2020 with the increase
mainly attributable to the timing of furnace rebuild and repair activity. In Glass Packaging North America, capital
expenditure was $40 million in the three months ended March 31, 2021, compared with $27 million in the same period in
2020, reflecting the timing of furnace rebuild and repair activity.
Receivables Factoring and Related Programs
The Group participates in several uncommitted accounts receivable factoring and related programs with various
highly reputable financial institutions for certain receivables, accounted for as true sales of receivables, without recourse
to the Group. Receivables of $423 million were sold under these programs at March 31, 2021 (December 31, 2020: $440
million).
Trade Payables Processing
Our suppliers have access to independent third party payable processors. The processors allow suppliers, if they
choose, to sell their receivables to financial institutions at the sole discretion of both the supplier and the financial
institution. We have no involvement in the sale of these receivables and the suppliers are at liberty to use these
arrangements if they wish to receive early payment. As the original liability to our suppliers, including amounts due and
scheduled payment dates, remains as agreed in our supply agreements and is neither legally extinguished nor substantially
modified, the Group continues to present such obligations within trade payables.
Ardagh Group S.A.
34
Cautionary Statement Regarding Forward-Looking Statements
This report includes statements that are, or may be deemed to be, forward-looking statements. All statements
other than statements of historical fact included in this report regarding our business, financial condition, results of
operations and certain of our plans, objectives, assumptions, projections, expectations or beliefs with respect to these items
and statements regarding other future events or prospects, are forward-looking statements. These statements include,
without limitation, those concerning: our strategy and our ability to achieve it; expectations regarding sales, profitability
and growth; our possible or assumed future results of operations; R&D, capital expenditures and investment plans;
adequacy of capital; and financing plans. The words “aim”, “may”, “will”, “expect”, “is expected to”, “anticipate”,
“believe”, “future”, “continue”, “help”, “estimate”, “plan”, “schedule”, “intend”, “should”, “would be”, “seeks”,
“estimates”, “shall” or the negative or other variations thereof, as well as other statements regarding matters that are not
historical fact, are or may constitute forward-looking statements.
Although we believe that the estimates reflected in the forward-looking statements are reasonable, such estimates
may prove to be incorrect. By their nature, forward-looking statements involve risk and uncertainty because they relate to
events and depend on circumstances that will occur in the future.
All forward-looking statements included in this report are based on information available to us on the date of this
report. We undertake no obligation to update publicly or revise any forward-looking statement, whether as a result of new
information, future events or otherwise, except as may be required by applicable law. All subsequent written and oral
forward-looking statements attributable to us or persons acting on our behalf are expressly qualified in their entirety by
the cautionary statements contained throughout this report.

ardaghgroup.com