interim report and accounts for the six … · • investment in passenger facilities: ... tonnes...
TRANSCRIPT

magairports.com
MAGINTERIM REPORT AND ACCOUNTS FOR THE SIX MONTHS ENDED 30 SEPTEMBER 2017

2MAGInterim Report and Accounts 2018
270destinations by
70 airlines
55.9mpassengers per year
680ktonnes of cargo
shipped
MAG is a leading UK airport group and owns and operates four UK airports:
Manchester London Stansted East Midlands Bournemouth
and operates a successful airport property business
MAG PropertyCONTENTSOverview3 Financial and operational highlights
4 Our Company at a glance
Strategic report6 Chief Executive’s operating review
10 Financial review
Financial statements15 Responsibility statement of the directors in respect of the
half-yearly financial report
16 Accounting policies
18 Condensed consolidated income statement
19 Condensed consolidated statement of comprehensive income
19 Condensed consolidated statement of changes in equity
21 Condensed consolidated statement of financial position
22 Condensed consolidated statement of cash flows
23 Notes to the financial statements
MAG refers to Manchester Airports Holdings Limited

3
Ov
ERv
IEw
STR
ATE
GIC
REp
ORT
FIN
AN
CIA
l ST
ATE
MEN
TS
Operating highlights• Summer season demonstrates strength of
demand for flights from MAG airports• Jet2.com establishes major new base at
London Stansted, its first in the South East• Investment in passenger facilities:
transformation programmes with a combined value of more than £1.5bn now underway
• Manchester Airport Transformation Programme (‘MAN-TP'), the largest ever private investment in the North West, launched by the Rt Hon Chris Grayling
• Planning permission for new arrivals building at London Stansted secured
• Major new employment programme, MAG Connect, launched in response to expected growth in the coming years
“ MAG’s vision is to be the premier airport management and services company.”
Financial highlightsRevenue
£544.6m
+£62.3m+12.9%
2017 544.6
2016 482.3
2015 445.5
Passenger numbers
34.9m
+2.9m+9.1%
2017 34.9
2016 32.0
2015 29.7
Adjusted EBITDA*
£236.6m
+£20.7m+9.6%
2017 236.6
2016 215.9
2015 202.5
Cash generated from operations
£188.0m2017 188.0
2016 180.5
2015 180.2
+£7.5m+4.2%
Adjusted operating profit*
£164.6m
+£16.2m+10.9%
2017 164.6
2016 148.4
2015 137.0
Result from operations
£159.9m
+£14.4m+9.9%
2017 159.9
2016 145.5
2015 137.0
* As explained in the financial review on page 11

4MAGInterim Report and Accounts 2018
£6.2bnContributed to the UK economy from
MAG airports
Manchester
East Midlands
london Stansted
Bournemouth
40,000jobs on our
sites
£7.1bncontributed to the UK economy from
MAG airports
£482.3m2016
£544.6m2017
Group revenue
Aviation
Retail
Car parking
Property
Other
Our Company at a glance
The Group saw over 55 million passengers flying through its airports last year, which together employ over 5,000 MAG personnel and support 40,000 jobs on our sites.
MAG is a leading UK airport group and owns and operates four UK airports – Manchester, London Stansted, East Midlands and Bournemouth. The Group serves over 55 million passengers flying through its airports each year, which together employ over 5,000 MAG personnel and support 40,000 jobs on our sites.
MAG’s overall strategic intent is to increase long-term shareholder value by generating profitable growth, developing its assets and deploying efficient and customer-focused operating processes throughout the business.

5
Ov
ERv
IEw
STR
ATE
GIC
REp
ORT
FIN
AN
CIA
l ST
ATE
MEN
TS
270More than 70 air-lines serving more than 270 destina-
tions direct
200+ shops, bars and restaurants across
our airports
£603mof investment
property assets across all airports
36,000+parking spaces across all our
sites
MAG has a diverse carrier mix from across the globe, with an excellent track record of supporting and delivering passenger growth.
By forging strong commercial partnerships with airlines, our airports have been able to increase choice and convenience for our passengers, and make a stronger contribution to economic growth in their regions.
MAG also owns and operates three of the top four cargo airports in the UK, which handle over £27.5bn and 700,000 tonnes of air cargo to and from the UK every year.
We use a combination of market-leading analytical, ecommerce, marketing and trading expertise to deliver a tried and tested formula for our highly successful airport car parking businesses. Our car parks cater for all tastes and budgets ranging from our competitively priced JetParks brand through to Meet & Greet and Valet services.
Across our airports, retail space at MAG extends to in excess of 400,000 sq ft with over 50 operators, and we work with a diverse range of brands, both new and established, to help them operate successfully in an airport environment.
Partnering with MAG gives retailers access to potentially more than 55 million customers each year.
MAG Property manages almost six million sq ft of high-quality space in offices, terminals, hangars, warehouses and hotels across our airport portfolio at Manchester, London Stansted, East Midlands and Bournemouth.
We do much more than simply let the space: we understand the complexities of the infrastructure and services that make airports work, so we know how to help businesses based there take full advantage of them.
Aviation Retail
PropertyCar parking
Revenue
£103.1m2016: £91.0m
Revenue
£23.6m2016: £24.8m
Revenue
£104.6m2016: £92.2m
Revenue
£274.5m2016: £238.2m

6MAGInterim Report and Accounts 2018
90%full flights operating
over the summer
Passengernumbers
34.9m2016: 32.0m
+2.9m+9.1%
Revenue
£544.6m2016: £482.3m
+£62.3m+12.9%
Chief Executive’s operating review
Our airports have continued to grow strongly in the first half of this financial year, with passenger numbers increasing by 2.9 million to a record 34.9 million.Charlie CornishChief Executive, MAG
“ This year has seen significant progress towards the future redevelopment of our two largest airports – Manchester and London Stansted.”

7
Ov
ERv
IEw
STR
ATE
GIC
REp
ORT
FIN
AN
CIA
l ST
ATE
MEN
TS
MAG-O is a dedicated digital business tasked with building stress-free customer-centric, omni-channel experiences for our customers. The team, working in collaboration with MAG’s airports, are responsible for product management, development and innovation, digital marketing, revenue management and customer insights. Over the past year the team have grown to around 60 people working from offices on the Manchester Airport campus. The team have seen some great successes over the past 12 months including the redesign of MAG’s airport websites in an effort to improve customer experience and further drive revenue.
Adjusted EBITDA*
£236.6m2016: £215.9m+£20.7m+9.6%
Passenger numbers
34.9m2016: 32.0m+2.9m+9.1%
Result from operations
£159.9m2016: £145.5m +£14.4m+9.9%
Revenue
£544.6m2016: £482.3m+£62.3m+12.9%
* As explained in the financial review on page 11
MAG is investing to enhance its airports and ensure they cater for the growing demand for flights to long-haul, European and domestic destinations. Across the Group, our commercial approach to engaging with airlines to attract new seat capacity has been successful in increasing passenger numbers in the six months to September 2017 by 2.9 million, to a record 34.9 million.
This aviation growth, combined with an ongoing focus on passenger experience and non-aviation revenues, has resulted in continued growth in adjusted EBITDA* (+9.6% to £236.6m) – the 13th consecutive half year of adjusted EBITDA* growth.
The six months to September 2017 include the busiest period of the year for our airports and the progress we have made during the summer season demonstrates the strength of demand for long-haul and short-haul flights from our airports across the UK.
We are responding to this by investing in our passenger facilities, in particular at Manchester and London Stansted where transformation programmes with a combined value of more than £1.5bn are now underway. This investment will significantly increase the capacity of our terminal facilities at Manchester and London Stansted, and provide improved passenger facilities at the two largest airports in the country with available runway capacity.
In July, we welcomed the Government’s statement that it supports making best use of existing capacity at all airports around the country. We are now calling on Government to set out an ambitious plan to help make better use of existing runway capacity and improve the UK’s international connectivity. A key part of this will be commitments from Government to improving road and rail access to airports to help them offer better global connections.
In September, we published our annual Corporate Social Responsibility report, highlighting that our airports contribute £7.1bn in economic value to the UK economy. We also announced a major new employment programme called ‘MAG Connect’ which extends our recruitment into nearby areas where it will have the greatest impact. As part of the programme, London Stansted now has a permanent partnership with Tottenham Job Centre Plus, which will bring jobs to an area that has relatively high unemployment but is just 35 minutes from the airport.
Such initiatives demonstrate the commitment we have at MAG to working together with our wider communities to mutual benefit.
In 2017,
MAG celebrated the first year of MAG-O, its new
digital division.

8MAGInterim Report and Accounts 2018
Chief Executive’s operating review continued
Manchester Airport is now serving more passengers than ever before. This time last year we reported that the airport had surpassed 25 million passengers per annum. We have now seen 27.5 million passengers use Manchester in the last 12 months.
A highlight of the last six months has been the start of works on our Manchester Airport Transformation Programme (‘MAN-TP'), an occasion welcomed in person by the Secretary of State for Transport, the Rt Hon Chris Grayling, who also took the opportunity to launch the Government’s Aviation Strategy consultation process. The £1bn programme is the largest ever private investment in the North West and will transform Manchester Airport’s facilities.
MAN-TP will create a new ‘super-terminal’ offering state-of-the-art amenities, making even better use of our two full-length runways. Recent long-haul route launches to Hong Kong, Beijing, Singapore, San Francisco and Houston have been popular with passengers and the new facilities will provide airlines even better opportunities to grow their services at Manchester.
Manchester Airport is the global gateway from the North, providing the long-haul connectivity the region needs to destinations not otherwise available outside London. We are working with Government to ensure the airport is integrated into a high-speed rail network that provides passengers with quick connections from the North, South, East and West. This will bring cities such as Liverpool, Sheffield, Leeds, Hull and Newcastle much closer to the airport by public transport and facilitate trade and inward investment in the region.
Our aim is for the airport’s growth to benefit as many people in the community as possible, and under our MAG Connect initiative the airport is sponsoring its local secondary school, the Manchester Enterprise Academy, and offers its students interview support, work preparedness training and opportunities to shadow MAG employees.
Turning to london Stansted, this airport is also experiencing record passenger volumes and now serves over 25.5m passengers per year. The establishment of a new base by Jet2.com at the airport has given passengers more choice and has complemented the already strong network of European destinations offered by Ryanair, easyJet, TUI and others. As a result, passenger numbers in the first half of the year were 9.8% up on the same period last year.
During the first half of the year, we were delighted to have been able to announce two new airlines planning to launch services from London Stansted. Primera Air will offer direct flights to New York, Boston and Toronto on new A321neo aircraft, and WOW Air will offer flights to US destinations via their hub in Reykjavik. We believe these new routes will show the strength of demand for transatlantic flights in the London – Stansted – Cambridge corridor and the wider East Anglian region, and we look forward to working with Primera and other airlines to develop new services over the coming years. London Stansted continues to play a growing role in meeting demand for aviation capacity in London and we see long-haul expansion as a natural part of that growth.
To enable us to meet the growing demand from passengers and airlines, we have secured planning permission for a new arrivals building at London Stansted. This will allow us to turn the existing terminal building into a departures-only facility, with more space for security lanes, seating and retail facilities. Once complete, London Stansted will be the only UK airport to offer dedicated buildings for departures and arrivals and it will deliver a big improvement in passenger experience.
Alongside this, MAG also announced its intention to apply to raise the cap on the passenger numbers that London Stansted is permitted to serve. The feedback from an extensive consultation process clearly demonstrated that the local community supports ongoing growth and investment in the airport, and favours an increase in the cap from its existing limit of 35 million to 43 million. Stansted can achieve this without
increasing the limit on the number of flights or increasing the size of the noise footprint that has already been approved. Raising the cap will provide airlines with the ability to plan further at the airport over the next ten years.
In August, London Stansted and Harlow College received planning permission for a new £11m technical skills college at the airport. By partnering with Harlow College, London Stansted will be able to not only build up the skill base needed for its continued successful growth, but also benefit Uttlesford District and the wider region by offering more career and training opportunities to local people.
East Midlands Airport continues to grow, with passenger numbers growing by 3.2% in the first six months of the year. The airport has had a summer on a par with its busiest ever (2008) and has invested significantly in new facilities, including increased capacity in security and immigration halls, new outlets in the departure lounge, and improved access to car hire facilities.
Combined with an ever expanding cargo network, East Midlands Airport is now well placed to drive the ‘Midlands Engine’ in the years to come. The airport, like other MAG airports, prides itself on being a force for good in its community, and figures in its latest CSR report show that 80% of residents say the airport is a “good and trustworthy neighbour”, reflecting the attention the airport gives to reducing noise, emissions and disturbances from its operations.
Bournemouth Airport has continued to perform well, with passenger growth for the first six months of the year at 3.3%.
On 4 December 2017 the Group entered into an agreement to sell Bournemouth Airport and its subsiaries to Regional and City Airports, a subsidiary of Rigby Group plc. The Bournemouth operation represents less than 2% of total passenger volumes across the Group, and the sale allows us to focus on improving Manchester, London Stansted and East Midlands airports. We wish the new owners every success and are confident that the airport will continue to flourish.

9
Ov
ERv
IEw
STR
ATE
GIC
REp
ORT
FIN
AN
CIA
l ST
ATE
MEN
TS
Key performance indicatorsWe focus on a number of key performance measures to ensure we build value for our shareholders on a consistent basis over the long term.
Measure Aim Context Progress
Revenue Achieve long-term and steady growth in revenue
We aim to deliver sustainable growth across all areas of our business – aviation, car parking, retail and property
£544.6m2016: £482.3m
+12.9%
Adjusted EBITDA1 Generate a level of profit that allows re-investment in our infrastructure
We cover the cost of using our assets with income from our operations
£236.6m2016: £215.9m
+9.6%
Result from operations
Achieve steady and increasing profit from operations
We expect all our operations to positively contribute to the Group’s result
£159.9m2016: £145.5m
+9.9%
Adjusted cash generated from operations1
Convert our operating profits into cash
We focus on converting our operating profits into cash to fund further investment and returns to shareholders
£192.7m2016: £183.4m
+5.1%
Market share2 Grow our share of the market
Measures the performance of MAG compared to the UK market
28.3%2016: 28.5%
-0.7%
passengers (m) Maximise passenger volumes through our airports
Increasing the number of passengers contributes to growth in our aviation and commercial revenue streams
34.9m2016: 32.0m
+9.1%
1 As explained in the financial review on page 112 Market share excludes Heathrow Airport, and is based on the latest available CAA data, which is for the 12 months ended August 2017
Turning to our MAG USA business, we are adding a fourth common-use Escape Lounge to our line-up, with the new lounge at Reno-Tahoe joining our existing lounges at Minneapolis-St Paul, Oakland and Bradley. We are convinced that MAG’s well-proven model of maximising commercial opportunities from airports and developing them to their full potential will appeal to other airports in the years ahead.
Looking ahead to the UK’s exit from the European Union, we continue to work with the rest of our industry to urge the UK Government and the EU27 to prioritise an interim deal on aviation as soon as possible. Early clarity on the new framework for UK-EU aviation will provide airlines with the confidence to plan new services for the future and give passengers confidence to book travel for the period after March 2019.
September saw Ryanair announce the cancellation of a small proportion of their flights throughout their Autumn and Winter schedules. Ryanair continues to grow across MAG’s airports and at London Stansted, which is its biggest base by some distance. London Stansted still offers passengers the widest range of European destinations available from any UK airport, and we
expect to see continued growth for the foreseeable future with Ryanair, at London Stansted and elsewhere across our airports.
In October, Monarch Airlines, which was the seventh largest carrier at Manchester Airport, ceased trading. Our teams at Manchester worked with the CAA to ensure all Monarch passengers abroad got home safely and our focus is now on ensuring that other airlines are able to offer new routes to new destinations from Manchester and elsewhere. We have seen strong interest from carriers keen to take over slots vacated by Monarch, and where possible, we have also been trying to match former Monarch employees’ skills with new job opportunities at our airports.
Our latest set of financial results demonstrates that MAG is a robust and resilient business, with strong growth prospects over the coming years. As we leave the EU, it will be more important than ever for the UK to develop the best possible connections to global markets. MAG expects demand for air travel to and from the UK to remain buoyant and to continue growing. As MAG continues to grow we will work with Government to ensure the policy framework is in place to support our continued success.

10MAGInterim Report and Accounts 2018
Financial review
MAG has built on last year’s strong results with delivery of sustained growth in the first half of this financial year.
The strong half-year results are driven by continued implementation of MAG’s growth strategy, with increased passenger volumes, strong commercial performance and cash generation, together with continued focus on the effective management of our operating cost base.
We have also continued to invest significantly across all our airports to provide modern and customer-focused infrastructure and set the foundations to support our continuing long-term growth strategy.
With the continued growth we’ve achieved this year, together with the strong long-term prospects for the Group, we are pleased to continue to declare sustainable and growing dividends to our shareholders.
Neil ThompsonChief Financial Officer, MAG
Adjusted EBITDA*
£236.6m2016: £215.9m+£20.7m+9.6%
Result from operations
£159.9m2016: £145.5m+£14.4m+9.9%
Adjusted cash generated from operations*
£192.7m2016: £183.4m+£9.3m+5.1%
Cash generated from operations
£188.0m2016: £180.5m+£7.5m+4.2%
* As explained in the financial review on page 11
Revenue
£544.6m2016: £482.3m
+£62.3m+12.9%
Adjusted EBITDA*
£236.6m2016: £215.9m
+£20.7m+9.6%

11
Ov
ERv
IEw
STR
ATE
GIC
REp
ORT
FIN
AN
CIA
l ST
ATE
MEN
TS
Summary of the period’s results (£m)Six months ended
30 September 2017Six months ended
30 September 2016 Change % Year ended
31 March 2017
Passenger numbers (m) 34.9 32.0 9.1% 55.9
Revenue 544.6 482.3 12.9% 839.6
Adjusted EBITDA1 236.6 215.9 9.6% 343.2
Adjusted operating profit2 164.6 148.4 10.9% 205.5
Result from operations 159.9 145.5 9.9% 198.4
Result before taxation 132.3 108.0 22.5% 129.1
Adjusted cash generated from operations3 192.7 183.4 5.1% 327.7
Cash generated from operations 188.0 180.5 4.2% 320.6
Capital investment 128.1 65.2 96.5% 179.0
Dividends paid in the period 93.9 77.2 21.6% 124.2
Net debt (1,222.3) (1,163.4) 5.1% (1,171.9)
Equity shareholders’ funds 1,568.6 1,535.1 2.2% 1,542.0
NOTES1 Adjusted EBITDA is earnings before interest, tax, depreciation and amortisation, share of result of associate, gains and losses on sales and valuation of investment properties, and
before significant items2 Adjusted operating profit is operating profit before significant items3 Adjusted cash generated from operations is cash generated from operations before significant items
Reconciliation of adjusted EBITDA to adjusted operating profit and result from operations (£m)Six months ended
30 September 2017Six months ended
30 September 2016
Before significant
itemsSignificant
items
After significant
items
Before significant
itemsSignificant
items
After significant
items
Adjusted EBITDA 236.6 (4.7) 231.9 215.9 (2.9) 213.0
Depreciation and amortisation (72.0) – (72.0) (67.5) – (67.5)
Adjusted operating profit/result from operations 164.6 (4.7) 159.9 148.4 (2.9) 145.5
Measures used to assess performanceThe Group uses a number of measures to assess financial performance that are not defined within IFRS, and are widely referred to as ‘Alternative Performance Measures’ (‘APMs'). The directors use these measures to review the performance of the Group, as evidenced by performance targets being significantly based on adjusted EBITDA*. As such, these measures are important and should be considered alongside the IFRS performance measures. The adjustments from IFRS measures are separately disclosed and are items that are significant in size or non-recurring in nature, and where, in the directors’ view, their separate disclosure gives a more accurate indication of the Group’s underlying financial performance. For example, costs incurred on Group-wide restructuring programs, certain one-off costs associated with significant new systems implementations, and M&A activity, are considered one-off and presented within significant items as adjustments to the IFRS measures of financial performance. Alternative performance measures used within these statements are accompanied by a reference to the relevant IFRS measure and the adjustments made.
* As explained above
Summary trading performance The Group has delivered further growth in the first half of the financial year, with all the major divisions exceeding the prior period performance at both a revenue and adjusted EBITDA* level. This has been driven predominantly by an increase in passenger numbers of 9.1% to 34.9m, and improved commercial yields, which have translated into strong growth in adjusted EBITDA* of 9.6% to £236.6m.
The largest increases in passengers are at our two main airports, Manchester (growth of 9.2% on prior period) and London Stansted (growth of 9.8% on prior period), where airlines have increased capacity and introduced new destinations, largely driven through low cost carriers such as Ryanair and easyJet. The introduction of Jet2.com has contributed significantly to growth at London Stansted.
New long-haul routes with new and existing airlines have also been added, to increase the breadth of destinations across our airports, including the launch of new direct routes to Muscat (Oman Air), Houston (Singapore Airlines), Boston (Virgin Atlantic) and San Francisco (Thomas Cook and Virgin Atlantic) at Manchester.

12MAGInterim Report and Accounts 2018
Financial review continued
East Midlands Airport, which has an important dual role across passenger and freight aircraft, has performed strongly with passenger growth of 3.2% on prior period driven through improved load factors and increased flights with low cost carriers, predominantly Ryanair and Jet2.com.
Bournemouth Airport has seen growth in both scheduled and charter passengers from Ryanair and TUI Airways.
On 4 December 2017 the Group disposed of its entire shareholding in Bournemouth Airport and its subsidiaries. The funds generated from their sale will be used to fund the Group’s investments in its other UK airports.
The Group’s passenger growth has led to a 12.9% increase in total revenues to £544.6m, with the Group’s commercial strategy, and the impact of targeted investments across retail and car parking, driving improvements in the overall income per passenger.
Income analysis (£m)
Passenger traffic (m)Six months ended
30 September 2017
Six months ended30 September
2016 % change
Year ended 31 March
2017
Manchester Airport 16.6 15.2 9.2% 26.2
London Stansted Airport 14.6 13.3 9.8% 24.3
East Midlands Airport 3.2 3.1 3.2% 4.7
Bournemouth Airport 0.5 0.4 3.3% 0.7
Total passenger numbers 34.9 32.0 9.1% 55.9
Six months ended 30 September 2017
274.5 104.6 103.1 23.6 38.8 544.6
Six months ended 30 September 2016
238.2 92.2 91.0 24.8 36.1 482.3
Aviation Retail Car parking Property Other
Aviation income of £274.5m represents growth of 15.2% on the equivalent period in the prior year, reflecting the mix of traffic and increased low cost carrier traffic from additional capacity and higher load factors. Cargo income, which represents 4.4% of aviation income, has seen growth of 1.7% to £12.0m driven by a greater volume of express freight traffic from DHL and Amazon.
Retail income of £104.6m for the first six months of the year has grown by 13.4%, driven by increased passenger volumes, and a strong contribution following the investment in the food and beverage offering at Stansted.
Car parking has seen similar revenue growth over the first six months of the year, with revenues 13.3% higher than prior period, driven by additional capacity to serve the increased passenger volumes, and effective management of the customer trend of moving to pre-book channels.
Property income across the Group has decreased slightly by £1.2m (4.8%) to £23.6m, as a consequence of the Group’s strategy to realise the value of its investment property portfolio at London Stansted through managed portfolio disposals. Occupancy levels across the Group’s investment portfolio remain strong at 92.3%. Other income, which includes utilities recharges and fees for airline services and aviation fuel sales, has grown by £2.7m (7.5%) on prior period.
* As explained on page 11
Operating costs have increased by £41.0m (15.3%), largely driven by managed investment in security and customer service to support higher passenger volumes, together with marketing costs to support passenger growth and the development of new routes.
Depreciation and amortisation costs of £72.0m are £4.5m higher than the prior period, reflecting the continued investment in infrastructure across the Group.
The Group undertook various planned restructuring and organisational programmes during the period, with the majority of the costs relating to the commencement of the transformation programme at Manchester Airport, and the continuation of schemes that commenced in the previous financial period. In addition, the Group has invested significantly to improve the back-office finance, procurement and HR systems, resulting in one-off costs associated with the transition.
These schemes have resulted in a total of £4.7m being recognised as a significant item within the consolidated income statement.
After deducting the above depreciation, amortisation and significant items from adjusted EBITDA*, the result from operations for the period is £159.9m, an increase of £14.4m (9.9%) on the prior period.

13
Ov
ERv
IEw
STR
ATE
GIC
REp
ORT
FIN
AN
CIA
l ST
ATE
MEN
TS
property The MAG Property division manages the investment property portfolio comprising offices, hotels and cargo properties, in an overall investment property portfolio of £602.7m. MAG also holds a 50% interest in the Airport City development at Manchester Airport.
The property team continue to explore opportunities to maximise value across its property portfolio as part of MAG’s commitment to investing in and developing the property and land at our airports.
During the period Airport City completed the sale of 45 acres at its Global Logistics site, and the joint venture has a strong pipeline of deals that are expected to deliver significant returns in the next few periods as plots are developed and sold as part of the overall business plan.
Adjusted EBITDA* by division (£m)Six months ended
30 September 2017
Six months ended 30 September
2016 Change Change %
Manchester Airport 118.1 109.9 8.2 7.5%
London Stansted Airport 92.1 82.4 9.7 11.8%
East Midlands Airport 17.7 17.1 0.6 3.5%
MAG Property 10.9 10.3 0.6 5.8%
Bournemouth Airport 0.9 1.1 (0.2) (18.2%)
Group, consolidation and other (3.1) (4.9) 1.8 36.7%
236.6 215.9 20.7 9.6%
Result from operations by division (£m)Six months ended
30 September 2017
Six months ended 30 September
2016 Change Change %
Manchester Airport 80.7 77.6 3.1 4.0%
London Stansted Airport 61.9 53.2 8.7 16.4%
East Midlands Airport 11.9 12.7 (0.8) (6.3%)
MAG Property 10.5 8.7 1.8 20.7%
Bournemouth Airport 0.2 0.4 (0.2) (50.0%)
Group, consolidation and other (5.3) (7.1) 1.8 25.4%
159.9 145.5 14.4 9.9%
Cash flowAdjusted cash generated from operations* during the first six months of the year has increased on the prior year by £9.3m (5.1%). This increase is slightly lower than the increase in the result from operations for the same period due to the timing of cash collection from our summer trading peak, and this impact is expected to unwind over the remainder of the year.
Maximising the translation of profits into cash supports our long-term financing position and allows the Group to continue to invest in infrastructure and development opportunities.
Financing and interest Group net interest payable for the period, at £32.7m, is lower than the equivalent period in the prior year due to the capitalisation of £4.4m of borrowing costs relating to capital investment programmes, in line with the Group’s accounting policy.
* As explained on page 11
Underlying net interest payable however, at £37.1m, is consistent with the prior period, reflecting the stable debt profile of the Group, which is predominantly made up of fixed rate bonds and shareholder loans.
During the period, the Group extended the maturity of its revolving credit and liquidity facilities by a year to June 2022. Following the period end, in November the Group successfully issued a third bond of £300m as part of the financing strategy to fund the transformation programmes currently underway at both Manchester and London Stansted Airports.
Net debt has increased slightly from 31 March 2017 to £1,223.3m, but in light of the new facilities, and the recent bond issuance, the Group has significant headroom to support future investment in capital infrastructure and property developments.

14MAGInterim Report and Accounts 2018
Financial review continued
Capital investment The Group continues to invest in its infrastructure across all its airports, with expenditure totalling £128.1m during the first half of the year.
The Manchester Transformation Programme continues to be the largest individual project in the period, with construction work commencing during the Summer. Work has also started in the period on the initiative to transform the existing terminal building at London Stansted into a dedicated departures facility next year, in addition to a new arrivals section. The significant investments at both airports will both improve the experience for passengers and airlines using the airports, and provide the foundations to unlock their significant future growth potential.
pensions The accounting deficit for all Group schemes is calculated by independent scheme actuaries PricewaterhouseCoopers, who incorporate data taken from a number of markets in calculating the closing deficit position at the statement of financial position date.
During the six-month period the IAS 19 accounting deficit of the aggregate of the Group’s defined benefit schemes reduced from £104.6m to £77.2m. The reduction in the deficit reflects the positive asset returns over the period, and discount rates on corporate bond yields increased marginally (0.05%) over the same period.
Tax The tax charge for the six months ended 30 September is £37.0m (2016: £16.4m). The increase on the prior period is significantly impacted by the prior period’s remeasurement of the deferred tax balances as a result of the enacted change in the future rate of corporation tax to 17%, which resulted in a one-off deferred tax credit of £14.2m.
The effective tax rate for the period is higher than the actual corporation tax rate of 20%, predominantly due to the level of disallowable depreciation in excess of capital allowances, as has been the case since the abolition of industrial buildings allowances.
Equity shareholders’ funds and dividends Equity shareholders’ funds are £1,568.6m (31 March 2017: £1,542.0m). The movement comprises £95.3m profit after tax, remeasurement gains on pension liabilities (net of tax) of £25.2m recorded in reserves, and the payment of a dividend of £93.9m during the first half of the year, reflecting the final dividend for the year ended 31 March 2017.
In line with our dividend policy, in light of the growth achieved during the first six months of the financial year, and consistent with the strong long-term growth prospects, the directors have declared an interim dividend of £55.3m, which will be paid to the shareholders upon the signing of these financial statements.

15
STR
ATE
GIC
REp
ORT
FIN
AN
CIA
l ST
ATE
MEN
TSO
vER
vIE
wWe confirm that to the best of our knowledge:• the condensed set of financial statements has been prepared
in accordance with IAS 34 ‘Interim Financial Reporting’ as adopted by the EU; and
• the interim management report includes a fair review of the information required by:(a) DTR 4.2.7R of the Disclosure Guidance and Transparency
Rules, being an indication of important events that have occurred during the first six months of the financial year and their impact on the condensed set of financial statements, and a description of the principal risks and uncertainties for the remaining six months of the year; and
(b) DTR 4.2.8R of the Disclosure Guidance and Transparency Rules, being related party transactions that have taken place in the first six months of the current financial year and that have materially affected the financial position or performance of the entity during that period, and any changes in the related party transactions described in the last Annual Report that could do so.
By order of the Board
Charlie CornishChief ExecutiveMAG6 December 2017
Neil ThompsonChief Financial OfficerMAG6 December 2017
Responsibility statement of the directors in respect of the half-yearly financial report

16MAGInterim Report and Accounts 2018
Basis of accountingThis condensed consolidated interim financial information for the six months ended 30 September 2017 has been prepared on a going concern basis, and in accordance with the Disclosure Guidance and Transparency Rules of the Financial Conduct Authority and IAS 34 ‘Interim Financial Reporting’ as adopted by the European Union. The condensed consolidated interim financial information should be read in conjunction with the Annual Report and Accounts for the year ended 31 March 2017, which has been prepared in accordance with IFRS as adopted by the European Union. The historical cost convention is applicable to these financial statements with the exception of investment properties, financial instruments and employee benefit scheme assets and obligations, which are fair valued at each reporting date. The condensed set of interim financial statements has been prepared by the Group applying the same accounting policies and significant judgements as were applied by the Group in its published consolidated financial statements as at 31 March 2017, except for the following standards and interpretations, which are effective for the Group from 1 April 2017:
Effective for the year ending 31 March 2018 (not yet EU endorsed)• IAS 7 ‘Statement of Cash Flows’ – Amendments relating to the
Disclosure Initiative• IAS 12 ‘Income Taxes’ – Amendments relating to the
recognition of deferred tax assets for unrealised losses
The directors do not anticipate that the adoption of these standards will have a material impact on the Group’s financial statements.
Effective for the year ending 31 March 2019(EU endorsed)• IFRS 9 ‘Financial Instruments’ – Finalised version, incorporating
requirements for classification and measurement, impairment, general hedge accounting and derecognition.
The revised standard will replace IAS 39 ‘Financial
Instruments: Recognition and Measurement’, and introduces new guidance for classification and measurement, impairment of financial instruments, and hedge accounting. The directors do not anticipate that the adoption of this standard will have a material impact on the Group’s financial statements.
• IFRS 15 ‘Revenue from Contracts with Customers’
The standard will replace IAS 18 ‘Revenue’ and IFRIC 13 ‘Customer Loyalty Programmes’. The standard introduces a new revenue recognition model that recognises revenue either at a point in time or over time. The model features a contract-based five-step analysis of transactions to determine whether, how much and when revenue is recognised. We are assessing the impact of IFRS 15 and will conduct a systematic review to ensure that the impact of the new standard is fully understood in advance of the effective date. It is not currently practicable to quantify the impact of this standard.
Effective for the year ending 31 March 2020(not yet EU endorsed)• IFRS 16 ‘Leases’
The new standard fundamentally changes the accounting for leases by lessees. It eliminates the current IAS 17 dual accounting model, which distinguishes between on-balance sheet finance leases and off-balance sheet operating leases, and instead introduces a single, on-balance sheet accounting model that is similar to current finance lease accounting. In preparation for the adoption of IFRS 16 in the financial statements for the year ending 31 March 2020, the directors are in the process of assessing the potential impact, which is expected to be material.
The results for the six months to 30 September 2017 have not been audited, but at the Group’s request have been reviewed by the auditors, KPMG LLP, and a private review opinion has been issued to the Group.
The financial information for the full year ended 31 March 2017 is an abbreviated version of the Group’s Annual Report and Accounts for that year, which has been delivered to the Registrar of Companies. The report of the auditor was: (i) unqualified; (ii) did not include a reference to any matters to which the auditors drew attention by way of emphasis without qualifying their report; and (iii) did not contain a statement under section 498(2) or (3) of the Companies Act 2006.
The preparation of these financial statements in accordance with prevailing accounting practice requires the use of estimates and assumptions that affect the reported amounts of assets, liabilities, revenues and expenses. The assumptions and estimates are based on management’s best knowledge of the event or actions in question; however, actual results may ultimately differ from these estimates.
The accounting policies that the Group has adopted to determine the amounts included in respect of material items shown in the statement of financial position, and also to determine the profit or loss, are listed in full in the Group’s Annual Report and Accounts for the year ended 31 March 2017. Unless stated otherwise, these have been applied on a consistent basis.
Going concernThe current economic conditions create uncertainty, particularly over passenger numbers, which has a direct impact on income. The Group has demonstrated its ability to grow operating margins together with the ability to manage its investment programme according to affordability and business performance. At the interim period ended 30 September 2017, the Group had £1,546.9m (31 March 2017: £1,546.9m) of committed facilities and a net debt position of £1,222.3m (31 March 2017: £1,171.9m).
The Group had financial headroom in excess of £324m at 30 September 2017 (31 March 2017: £374m), and based on the Board approved five-year business plan, MAG is forecast to have available spare facilities throughout the next 12 months that
Accounting policies

17
Ov
ERv
IEw
STR
ATE
GIC
REp
ORT
FIN
AN
CIA
l ST
ATE
MEN
TS
are more than adequate for the Group’s financing requirements. The Group’s forecasts and projections, taking account of reasonably possible changes in trading performance, show that the Group should be able to operate within the level of its current facilities.
The Group is subject to two historical financial covenants: net debt/EBITDA and EBITDA less tax paid/net finance charges. The covenants are tested half yearly on 31 March and 30 September. As at 30 September 2017 the Group had complied with both of the covenants, and as a result of the Group’s prudent financial policy, there is significant covenant headroom.
The directors believe that the Group is well placed to manage its business risks successfully despite the current uncertain economic outlook. After making enquiries, the directors have a reasonable expectation that the Group has adequate resources to continue in operational existence for the foreseeable future. Accordingly, they continue to adopt the going concern basis in preparing the Interim Report and Accounts.
Risks and uncertaintiesThe principal strategic level risks and uncertainties affecting the Group, together with the approach to their mitigation, remain as set out on pages 33 to 37 in the 2017 Annual Report and Accounts, which is available on the Group’s website (www.magairports.com).
In summary the Group’s principal risks and uncertainties are: • Security breach• Material sustained disruption to operations• Major Health and Safety incident affecting our customers
or colleagues• Cyber security• Threat of a downturn in demand due to adverse global
economic factors• Regulatory risk• Delivering major programmes• Recruitment, development and retention of talented people
Forward-looking statementsThis condensed consolidated interim financial information contains forward-looking statements. Although the Group believes that the expectations reflected in these forward-looking statements are reasonable, it can give no assurance that these expectations will prove to be correct. Due to the inherent uncertainties, including both economic and business risk factors underlying such forward-looking information, actual results may differ materially from those expressed or implied by these forward-looking statements.
The Group undertakes no obligation to update any forward-looking statements, whether as a result of new information, future events or otherwise.

18MAGInterim Report and Accounts 2018
Condensed consolidated income statementfor the six months ended 30 September 2017
Six months ended
30 September 2017
£m
Six months ended
30 September 2017
£m
Six months ended
30 September 2017
£m
Six months ended
30 September 2016
£m
Six months ended
30 September 2016
£m
Six months ended
30 September 2016
£m
Year ended
31 March 2017
£m
Note
Total before significant
itemsSignificant
items
Total after significant
items
Total before significant
itemsSignificant
items
Total after significant
items
Total after significant
items
Continuing operations
Revenue 1 544.6 – 544.6 482.3 – 482.3 839.6
Result from operations before significant items 4 164.6 – 164.6 148.4 – 148.4 205.5
Significant items
Exceptional costs 3 – (4.7) (4.7) – (2.9) (2.9) (7.1)
Result from operations 164.6 (4.7) 159.9 148.4 (2.9) 145.5 198.4
Share of result of associate 9 4.3 – 4.3 (0.3) – (0.3) 0.1
Gains and losses on sales and valuation of investment properties 8 0.8 – 0.8 – – – 4.1
Finance income – – – 0.1 – 0.1 –
Finance costs (32.7) – (32.7) (37.3) – (37.3) (73.5)
Result before taxation 137.0 (4.7) 132.3 110.9 (2.9) 108.0 129.1
Taxation 5 (37.9) 0.9 (37.0) (17.0) 0.6 (16.4) (9.9)
Result from continuing operations 99.1 (3.8) 95.3 93.9 (2.3) 91.6 119.2
Earnings per share expressed in pence per share Continuing operations 30.09 28.92 37.64
The accompanying notes form an integral part of the financial statements.

19
Ov
ERv
IEw
STR
ATE
GIC
REp
ORT
FIN
AN
CIA
l ST
ATE
MEN
TS
Condensed consolidated statement of comprehensive incomefor the six months ended 30 September 2017
Note
Six months ended
30 September 2017
£m
Six months ended
30 September 2016
£m
Year ended
31 March 2017
£m
Result for the period 95.3 91.6 119.2
Other comprehensive income/(expense)
Items that will not be reclassified to profit or loss:
Remeasurement of retirement benefit liabilities 13 30.2 (81.7) (49.4)
Deferred tax on remeasurement of retirement benefit liabilities 5 (5.0) 13.9 8.4
Effect of change in rate of corporation tax on deferred tax 5 – (0.2) (0.7)
Other comprehensive income/(expense) for the period 25.2 (68.0) (41.7)
Total comprehensive income for the period 120.5 23.6 77.5
Condensed consolidated statement of changes in equityfor the six months ended 30 September 2017
Note
Attributable to equity holders of the Company
Total £m
Share capital
£m
Share premium
£m Reserves
£m
Balance at 1 April 2017 316.7 687.2 538.1 1,542.0
Total comprehensive income for the period
Result for the period – – 95.3 95.3
Remeasurement of retirement benefit liabilities, net of tax 5,13 – – 25.2 25.2
– – 120.5 120.5
Transactions with owners recorded directly in equity
Dividends paid to equity holders 6 – – (93.9) (93.9)
Balance at 30 September 2017 316.7 687.2 564.7 1,568.6
The accompanying notes form an integral part of the financial statements.

20MAGInterim Report and Accounts 2018
Condensed consolidated statement of changes in equityfor the six months ended 30 September 2016
Note
Attributable to equity holders of the Company
Total £m
Share capital
£m
Share premium
£m Reserves
£m
Balance at 1 April 2016 316.7 687.2 584.8 1,588.7
Total comprehensive income for the period
Result for the period – – 91.6 91.6
Remeasurement of retirement benefit liabilities, net of tax 5,13 – – (67.8) (67.8)
Effect of change in rate of corporation tax on deferred tax 5 – – (0.2) (0.2)
– – 23.6 23.6
Transactions with owners recorded directly in equity
Dividends paid to equity holders – – (77.2) (77.2)
Balance at 30 September 2016 316.7 687.2 531.2 1,535.1
Condensed consolidated statement of changes in equityfor the year ended 31 March 2017
Note
Attributable to equity holders of the Company
Total £m
Share capital
£m
Share premium
£m Reserves
£m
Balance at 1 April 2016 316.7 687.2 584.8 1,588.7
Total comprehensive income for the year
Result for the year – – 119.2 119.2
Remeasurement of retirement benefit liabilities net of tax 5,13 – – (41.0) (41.0)
Effect of change in rate of corporation tax on deferred tax 5 – – (0.7) (0.7)
– – 77.5 77.5
Transactions with owners recorded directly in equity
Dividends paid to equity holders – – (124.2) (124.2)
Balance at 31 March 2017 316.7 687.2 538.1 1,542.0
The accompanying notes form an integral part of the financial statements.

21
Ov
ERv
IEw
STR
ATE
GIC
REp
ORT
FIN
AN
CIA
l ST
ATE
MEN
TS
Condensed consolidated statement of financial positionas at 30 September 2017
Note
Six months ended
30 September 2017
£m
Six months ended
30 September 2016
£m
Year ended
31 March 2017
£m
ASSETS
Non-current assets
Goodwill 166.3 166.3 166.3
Property, plant and equipment 7 2,405.6 2,320.0 2,361.1
Investment properties 8 602.7 640.3 603.3
Intangible assets 43.1 45.7 44.5
Investment in associate 9 11.4 15.9 15.0
Deferred tax assets 14 14.0 23.6 18.5
3,243.1 3,211.8 3,208.7
CURRENT ASSETS
Inventories 2.5 2.3 2.1
Trade and other receivables 177.3 105.3 96.3
Cash and cash equivalents 36.4 34.6 16.7
216.2 142.2 115.1
lIABIlITIES
Current liabilities
Borrowings 10,11 (203.9) (143.7) (134.1)
Trade and other payables (240.2) (186.4) (196.1)
Deferred income (29.3) (14.3) (24.5)
Current tax liabilities (39.7) (28.4) (20.1)
(513.1) (372.8) (374.8)
NET CURRENT lIABIlITIES (296.9) (230.6) (259.7)
Non-current liabilities
Borrowings 10-12 (1,054.8) (1,054.3) (1,054.5)
Retirement benefit liabilities 13 (77.2) (136.1) (104.6)
Deferred tax liabilities 14 (233.2) (243.2) (235.7)
Other non-current liabilities (12.4) (12.5) (12.2)
(1,377.6) (1,446.1) (1,407.0)
NET ASSETS 1,568.6 1,535.1 1,542.0
Shareholders’ equity
Share capital 316.7 316.7 316.7
Share premium 687.2 687.2 687.2
Retained earnings 564.7 531.2 538.1
TOTAl EQUITY 1,568.6 1,535.1 1,542.0
The accompanying notes form an integral part of the financial statements.
The financial statements on pages 16 to 34 were approved by the Board of Directors on 6 December 2017 and signed on its behalf by:
Charlie CornishChief Executive, MAG

22MAGInterim Report and Accounts 2018
Condensed consolidated statement of cash flows for the six months ended 30 September 2017
Six months ended
30 September 2017
£m
Six months ended
30 September 2017
£m
Six months ended
30 September 2017
£m
Six months ended
30 September 2016
£m
Year ended
31 March 2017
£m
Note
Before significant
itemsSignificant
items
After significant
items
After significant
items
After significant
items
Cash flows from operating activities
Result before taxation – continuing operations 137.0 (4.7) 132.3 108.0 129.1
Gains and losses on sales and valuation of investment properties (0.8) – (0.8) – (4.1)
Share of result of associate (4.3) – (4.3) 0.3 (0.1)
Net finance income and expense 32.7 – 32.7 37.2 73.5
Depreciation and amortisation 72.0 – 72.0 67.5 137.7
Profit on sale of property, plant and equipment (1.3) – (1.3) (1.9) (7.0)
Increase in trade and other receivables and inventories (81.3) – (81.3) (29.5) (20.5)
Increase/(Decrease) in trade and other payables 35.6 – 35.6 (2.2) 10.2
Release of grants 0.3 – 0.3 (0.4) (0.5)
Increase in retirement benefits provision 2.8 – 2.8 1.5 2.3
Cash generated from operations 192.7 (4.7) 188.0 180.5 320.6
Interest paid (31.9) (35.7) (72.6)
Interest received – 0.1 –
Tax paid (19.9) (16.7) (35.2)
Net cash from operating activities 136.2 128.2 212.8
Cash flows from investing activities
Purchase of property, plant and equipment (115.2) (74.7) (171.9)
Distributions from/(Investment in) associate 8.0 (3.1) (1.9)
Proceeds (net of selling costs) from sale of property, plant, equipment and investment properties 14.8 7.6 57.5
Net cash used in investing activities (92.4) (70.2) (116.3)
Cash flows from financing activities
Increase in bank loan borrowings, net of debt issue costs 69.8 143.7 134.1
Repayment of loans and borrowings – (90.2) (90.0)
Dividends paid to shareholders (93.9) (77.2) (124.2)
Net cash used in financing activities (24.1) (23.7) (80.1)
Net increase in cash and cash equivalents 16 19.7 34.3 16.4
Cash and cash equivalents at beginning of the period 16.7 0.3 0.3
Cash and cash equivalents at end of the period 36.4 34.6 16.7
The accompanying notes form an integral part of the financial statements.

23
Ov
ERv
IEw
STR
ATE
GIC
REp
ORT
FIN
AN
CIA
l ST
ATE
MEN
TS
Notes to the financial statementsfor the period ended 30 September 2017
1. Revenue
An analysis of the Group’s revenue is as follows:
Six months ended
30 September 2017
£m
Six months ended
30 September 2016
£m
Year ended
31 March 2017
£m
Aviation income 274.5 238.2 407.0
Commercial income
Retail concessions 104.6 92.2 164.4
Car parking 103.1 91.0 152.1
Property and property-related income 23.6 24.8 49.1
Other 38.8 36.1 67.0
Total commercial income 270.1 244.1 432.6
Total income 544.6 482.3 839.6
Other income includes utility cost recharges, fees for airline services and aviation fuel sales.

24MAGInterim Report and Accounts 2018
Notes to the financial statements continuedfor the period ended 30 September 2017
2. Business and geographical segments
For management purposes, the Group is organised into five main operating divisions: Manchester Airport, London Stansted Airport, East Midlands Airport, MAG Property and Bournemouth Airport.
The reportable segments are consistent with how information is presented to the Group Chief Executive (Chief Operating Decision Maker) to report its primary information for the purpose of assessment of performance and allocation of resources.
The primary business of all of these operating divisions is the operation and development of airport facilities in the UK, and accordingly, no separate secondary segmental information is provided.
Six months ended 30 September 2017
Manchester Airport
£m
London Stansted Airport
£m
EastMidlands
Airport£m
MAG Property
£m
Bournemouth Airport
£m
Group, consolidation
and other3
£mConsolidated
£m
Revenue
External sales 296.8 184.6 41.6 15.3 5.5 0.8 544.6
Inter-segment sales4 (1.0) – – (0.7) – 1.7 –
Total revenue 295.8 184.6 41.6 14.6 5.5 2.5 544.6
Result
Segment operating profit/(loss) before significant items 83.0 61.9 11.9 10.9 0.2 (3.3) 164.6
Significant items (2.3) – – (0.4) – (2.0) (4.7)
Segment operating profit/(loss) after significant items 80.7 61.9 11.9 10.5 0.2 (5.3) 159.9
Share of result of associate 4.3
Gains and losses on sales and valuation of investment properties 0.8
Finance costs (32.7)
Result before taxation 132.3
Other information
Segment assets 1,497.1 982.9 247.5 Note 1 19.0 712.8 3,459.3
Segment liabilities (180.4) (168.1) (64.6) Note 1 (6.3) (1,471.3) (1,890.7)
Capital expenditure 99.6 24.6 3.8 Note 1 – 0.1 128.1
Depreciation 33.8 30.2 5.8 Note 1 0.7 0.2 70.7
Amortisation 1.3 – – Note 1 – – 1.3
Taxation 26.4 18.4 2.7 Note 1 0.1 (10.6) 37.0
Result – geographical location2
Segment operating profit/(loss) before significant items 93.9 61.9 11.9 Note 2 0.2 (3.3) 164.6

25
Ov
ERv
IEw
STR
ATE
GIC
REp
ORT
FIN
AN
CIA
l ST
ATE
MEN
TS
Six months ended 30 September 2016
Manchester Airport
£m
London Stansted Airport
£m
East MidlandsAirport
£m
MAGProperty
£m
Bournemouth Airport
£m
Group,consolidation
and other3
£mConsolidated
£m
Revenue
External sales 262.0 162.4 38.4 13.9 6.0 (0.4) 482.3
Inter-segment sales4 (0.2) – – (1.4) – 1.6 –
Total revenue 261.8 162.4 38.4 12.5 6.0 1.2 482.3
Result
Segment operating profit/(loss) before significant items 77.6 53.2 12.7 9.4 0.4 (4.9) 148.4
Significant items – – – (0.7) – (2.2) (2.9)
Segment operating profit/(loss) after significant items 77.6 53.2 12.7 8.7 0.4 (7.1) 145.5
Share of result of associate (0.3)
Finance income 0.1
Finance costs (37.3)
Result before taxation 108.0
Other information
Segment assets 1,226.6 1,021.5 336.7 Note 1 75.4 693.8 3,354.0
Segment liabilities (249.1) (181.3) (67.1) Note 1 (6.8) (1,314.6) (1,818.9)
Capital expenditure 41.4 17.8 5.7 Note 1 0.3 – 65.2
Depreciation 31.0 29.2 4.4 0.9 0.7 – 66.2
Amortisation 1.3 – – – – – 1.3
Taxation 14.0 6.8 (0.9) Note 1 (0.2) (3.3) 16.4
Result – geographical location2
Segment operating profit/(loss) before significant items 83.9 53.2 13.9 Note 2 2.3 (4.9) 148.4
NOTES1 The Group’s reporting structure is such that the assets and liabilities of MAG Property are included in the Manchester Airport statement of financial position.2 For management accounting purposes MAG reports property income and profit on sale of property assets (excluding London Stansted) within the MAG Property division.
For statutory purposes property income and profit on disposal of property assets is reported in the subsidiary companies depending on the geographical location of the investment properties and property, plant and equipment. The table shows how profit from operations would appear with property reported by geographical location.
3 Group consolidation and other includes Group, Head Office, MAG USA, and other subsidiary companies and balances arising on consolidation, which are not specific to the other main operating divisions. Assets include goodwill and fair value adjustments arising on consolidation. Liabilities include borrowings, further details of which can be found in note 10 Borrowings.
4 Sales between segments are at arm’s length.

26MAGInterim Report and Accounts 2018
Notes to the financial statements continuedfor the period ended 30 September 2017
3. Significant items
Six months ended
30 September2017
£m
Six monthsended
30 September2016
£m
Year ended
31 March 2017
£m
Recorded in result from operations
Exceptional costs1 4.7 2.9 7.1
Total significant items 4.7 2.9 7.1
NOTE1 Exceptional costs of £4.7m (2016: £2.9m) include the costs of a number of restructuring programmes across the Group, costs incurred on the implementation of new
systems that do not meet the criteria for capitalisation, M&A activity, and the loss recognised on writing off the carrying value of the West Pier of Terminal 2 of Manchester Airport, after its demolition as part of the Manchester Transformation Programme.
4. Result from operations
Six months ended
30 September 2017
£m
Six months ended
30 September 2016
£m
Year ended
31 March2017
£m
Turnover 544.6 482.3 839.6
Wages and salaries1 (91.7) (81.1) (159.1)
Social security costs (8.9) (7.4) (15.3)
Pension costs (9.0) (7.2) (13.4)
Employee benefit costs (109.6) (95.7) (187.8)
Depreciation and amortisation (72.0) (67.5) (137.7)
Profit on disposal of property, plant, equipment and investment property 1.3 1.9 7.0
Other operating charges2 (199.7) (172.6) (315.6)
Result from operations before significant items 164.6 148.4 205.5
NOTES1 Wages and salary costs are disclosed before exceptional costs amounting to £nil (2016: £0.5m), which are reported separately – see note 3.2 Other operating charges include maintenance, rent, rates, utility costs and other operating expenses.

27
Ov
ERv
IEw
STR
ATE
GIC
REp
ORT
FIN
AN
CIA
l ST
ATE
MEN
TS
5. Taxation
Analysis of charge in the period
Six months ended
30 September 2017
£m
Six months ended
30 September 2016
£m
Year ended
31 March 2017
£m
Current taxation
UK corporation tax on profits for the period 40.0 33.7 40.0
Adjustment in respect of prior period – (0.6) (5.2)
Total current taxation 40.0 33.1 34.8
Deferred taxation
Temporary differences arising in the period (2.7) (1.7) (6.4)
Adjustment in respect of prior period (0.3) (0.8) (4.2)
Effect of change in rate of corporation tax – (14.2) (14.3)
Total ordinary deferred taxation (3.0) (16.7) (24.9)
Total taxation charge 37.0 16.4 9.9
Taxation on items charged/(credited) to equitySix months
ended 30 September
2017£m
Six months ended
30 September 2016
£m
Year ended
31 March 2017
£m
Deferred taxation on remeasurement or retirement benefit liabilities 5.0 (13.9) (8.4)
Effect of change in rate of corporation tax – 0.2 0.7
Total taxation charge/(credit) 5.0 (13.7) (7.7)
The current taxation charge for the period has been calculated based on the forecast underlying effective tax rate for the full year of 27.5% (2016: 28.0%).
The March 2016 Budget included a reduction in the rate of Corporation tax from 1 April 2020 of 2% to 17%. This change was substantively enacted on 5 September 2016. Deferred tax balances at 30 September 2017 have therefore been calculated at 17%, unless they are expected to unwind earlier than 1 April 2020, in which case the deferred tax balances have been calculated at the prevailing rate at the time the unwind is expected.
28MAGInterim Report and Accounts 2018
6. DividendsSix months
ended 30 September
2017£m
Six months ended
30 September 2016
£m
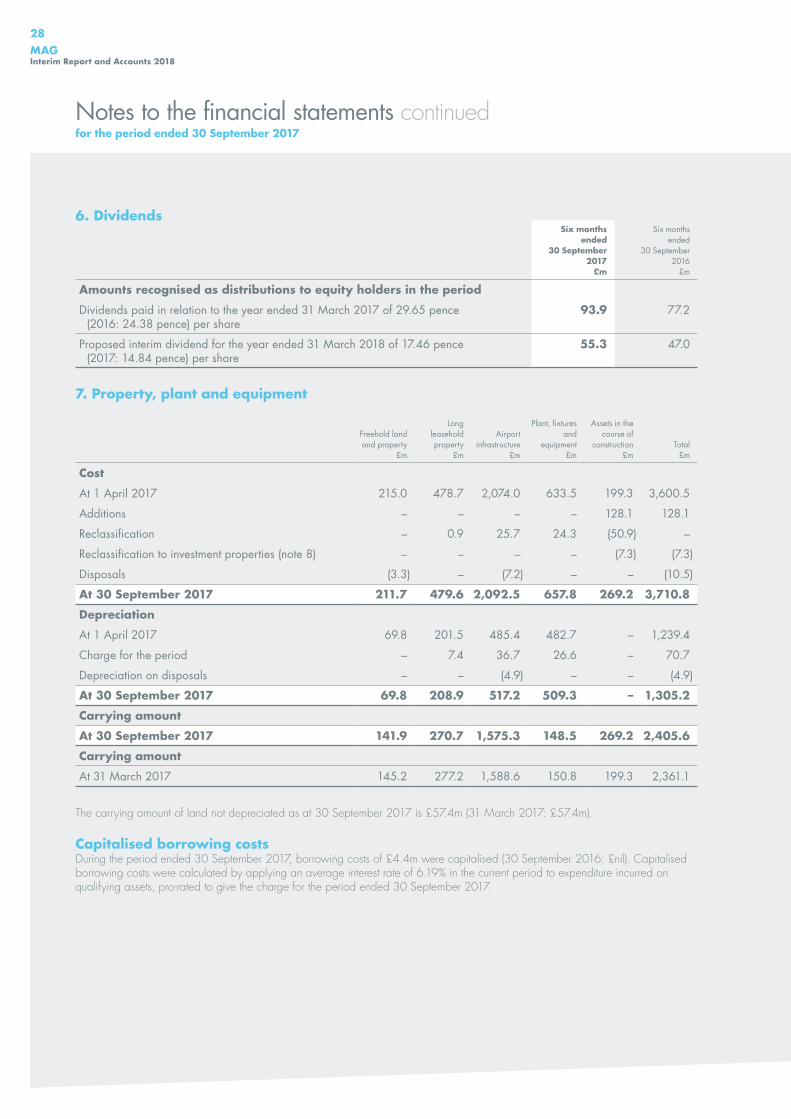
Amounts recognised as distributions to equity holders in the period
Dividends paid in relation to the year ended 31 March 2017 of 29.65 pence (2016: 24.38 pence) per share
93.9 77.2
Proposed interim dividend for the year ended 31 March 2018 of 17.46 pence (2017: 14.84 pence) per share
55.3 47.0
7. property, plant and equipment
Freehold land and property
£m
Long leasehold property
£m
Airport infrastructure
£m
Plant, fixtures and
equipment£m
Assets in the course of
construction£m
Total£m
Cost
At 1 April 2017 215.0 478.7 2,074.0 633.5 199.3 3,600.5
Additions – – – – 128.1 128.1
Reclassification – 0.9 25.7 24.3 (50.9) –
Reclassification to investment properties (note 8) – – – – (7.3) (7.3)
Disposals (3.3) – (7.2) – – (10.5)
At 30 September 2017 211.7 479.6 2,092.5 657.8 269.2 3,710.8
Depreciation
At 1 April 2017 69.8 201.5 485.4 482.7 – 1,239.4
Charge for the period – 7.4 36.7 26.6 – 70.7
Depreciation on disposals – – (4.9) – – (4.9)
At 30 September 2017 69.8 208.9 517.2 509.3 – 1,305.2
Carrying amount
At 30 September 2017 141.9 270.7 1,575.3 148.5 269.2 2,405.6
Carrying amount
At 31 March 2017 145.2 277.2 1,588.6 150.8 199.3 2,361.1
The carrying amount of land not depreciated as at 30 September 2017 is £57.4m (31 March 2017: £57.4m).
Capitalised borrowing costsDuring the period ended 30 September 2017, borrowing costs of £4.4m were capitalised (30 September 2016: £nil). Capitalised borrowing costs were calculated by applying an average interest rate of 6.19% in the current period to expenditure incurred on qualifying assets, pro-rated to give the charge for the period ended 30 September 2017.
Notes to the financial statements continuedfor the period ended 30 September 2017

29
Ov
ERv
IEw
STR
ATE
GIC
REp
ORT
FIN
AN
CIA
l ST
ATE
MEN
TS
8. Investment properties
Investment properties£m
valuation
At 1 April 2017 603.3
Reclassification from assets in the course of construction (note 7) 7.3
Disposals (7.9)
At 30 September 2017 602.7
Carrying amount
At 30 September 2017 602.7
At 31 March 2017 603.3
Investment propertiesThe fair value of the Group’s commercial property at 31 March 2017 was arrived at on the basis of a valuation carried out at that date by Deloitte LLP. Strutt & Parker carried out the valuation of the London Stansted residential portfolio, and Meller Braggins carried out the valuation of the Manchester residential portfolio at 31 March 2017. The valuers are independent and have appropriate, recognised professional qualifications, and recent experience in the locations and categories of the property being valued. The valuations, which conform to International Valuation Standards, were arrived at by reference to market evidence of transaction prices for similar properties, land valuations and discounted cash flow methods.
The fair value of the Group’s commercial property at 30 September 2017 was updated by Deloitte Chartered Surveyors as at the statement of financial position date. No fair value adjustment has been recognised at 30 September 2017 as the difference between the fair value and the carrying value of the commercial investment property at that date was immaterial.
Gains and losses on sales and valuation of investment properties reported in the consolidated income statement of £0.8m in the period (30 September 2016: £nil) comprise a gain on sale of £0.8m (30 September 2016: £nil).
9. Investment in associate
£m
Cost and carrying value
At 1 April 2017 15.0
Investment in associate (7.9)
Group’s share of associate’s result 4.3
At 30 September 2017 11.4
The investment in associate relates to the Group’s investment in Airport City.
Included within the investment in associate balance is an amount of £2.5m (31 March 2017: £3.3m) relating to MAG’s own costs incurred in the setting up of its share in Airport City. This will be released to the consolidated income statement on a proprtional basis on the sale of plots within the Airport City development.
Airport City, a partnership with three other partners to develop part of the land around Manchester Airport for hotels, offices and logistics and advanced manufacturing, was formally constituted on 8 October 2014. The directors have applied IFRS 10 ‘Consolidated Financial Statements’ and IAS 28 Revised ‘Investment in Associates’ in classifying the Group’s 50% share in Airport City as an associate, determining that MAG has significant influence over Airport City by virtue of its shareholding, but not control given that all key matters require a super-majority of more than 79.9%, such that MAG plus all but one other party must be in agreement to exercise control.

30MAGInterim Report and Accounts 2018
9. Investment in associate continuedAirport City’s year end date is coterminous with the Group’s year end, and the financial information detailed below is consistent with the Airport City financial statements prepared to the same date. Summarised financial information of the Group’s investment in Airport City is as follows:
Six months ended
30 September 2017
£m
Six months ended
30 September 2016
£m
Current assets 31.7 31.1
Current liabilities (13.9) (6.1)
Net assets 17.8 25.0
Group’s share of associate’s net assets 8.9 12.5
Revenue 28.4 –
Result for the period 10.5 (0.6)
Group’s share of associate’s result for the period 5.2 (0.3)
As part of its investment in Airport City, the Group has agreed to pay an equity contribution up to a maximum of £30m if required.
Airport City has no significant contingent liabilities to which the Group is exposed, and there are no restrictions that would prevent the transfer of funds to the Group (2016: none).
Notes to the financial statements continuedfor the period ended 30 September 2017

31
Ov
ERv
IEw
STR
ATE
GIC
REp
ORT
FIN
AN
CIA
l ST
ATE
MEN
TS
10. Borrowings
Note
30 September 2017
£m
30 September 2016
£m
31 March 2017
£m
Bank loans 11 203.9 143.7 134.1
Bonds 12 803.3 802.8 803.0
Other borrowings 251.5 251.5 251.5
1,258.7 1,198.0 1,188.6
Borrowings are repayable as follows:
In one year or less, or on demand
Bank loans 11 203.9 143.7 134.1
203.9 143.7 134.1
In more than one year, but no more than two years
Bank loans – – –
– – –
In more than two years, but no more than five years
Bank loans – – –
In more than five years – due other than by instalments
Bonds 12 803.3 802.8 803.0
Other borrowings 251.5 251.5 251.5
1,054.8 1,054.3 1,054.5
Non-current borrowings 1,054.8 1,054.3 1,054.5
Total borrowings 1,258.7 1,198.0 1,188.6
The Group is party to a Common Terms Agreement (‘CTA’) where bank and bond creditors benefit from the same suite of representations, warranties and covenants. The CTA was signed on 14 February 2014.
The CTA, together with a Master Definitions Agreement, covers inter alia, The Amended and Restated Initial Authorised Credit Facility Agreement (‘ACF’), The Amended and Restated Liquidity Facility Agreement (’LF’), and the Group’s issue of publicly listed fixed rate secured bonds in February 2014 and April 2014 respectively.
The ACF Agreement comprises a £500.0m Senior Secured Revolving Credit Facility.
The LF Agreement has total facilities of £60.0m and is sized to cover 12 months’ interest on secured debt. The LF Agreement is a 364-day revolving facility with a five-year term on each annual renewal.
Both the ACF Agreement and LF Agreement were extended in June 2017, resulting in a revised maturity of June 2022.
The Group issued a £450.0m publicly listed fixed rate secured bond on 14 February 2014 with a scheduled and legal maturity of 31 March 2034.
The Group issued a £360.0m publicly listed fixed rate secured bond on 16 April 2014 with a scheduled and legal maturity of 2 April 2024.
The Group’s borrowings are all secured by a fixed and floating charge over substantially all of the assets of the Group.

32MAGInterim Report and Accounts 2018
11. Bank loans 30 September
2017£m
30 September 2016
£m
31 March 2017
£m
Secured Revolving Credit Facility 207.0 147.0 137.0
Less: unamortised debt issue costs1 (3.1) (3.3) (2.9)
203.9 143.7 134.1
NOTE1. Issue costs arising in relation to obtaining finance are amortised over the duration of the financing as part of the effective interest rate.
At 30 September 2017 the Group had £278.0m (31 March 2017: £348.0m) undrawn committed borrowing facilities in respect of which all conditions precedent had been met at that date. The undrawn committed borrowing facilities consist of a £500.0m Secured Revolving Credit Facility (£207.0m drawn at 30 September 2017), less certain carve-outs in respect of ancillary facilities of £15.0m. The Group also had access to £10.0m of overdraft facilities.
Interest on the overdraft, Revolving Credit Facility and Liquidity Facility is linked to LIBOR plus a margin (dependent on facility).
See note 10 for further information on financial liabilities, including maturity analysis.
12. Bonds
30 September 2017
£m
30 September 2016
£m
31 March 2017
£m
Repayable other than by instalments
MAG bond 4.125% £360.0m due 2024 360.0 360.0 360.0
MAG bond 4.75% £450.0m due 2034 450.0 450.0 450.0
Less: discount on issue (1.9) (1.9) (1.9)
Less: unamortised debt issue costs (4.8) (5.3) (5.1)
803.3 802.8 803.0
13. Retirement benefits
30 September 2017
£m
30 September 2016
£m
31 March 2017
£m
Balance in scheme at start of the period (104.6) (52.9) (52.9)
Movement in period
Current service cost recognised in income statement (6.2) (5.3) (10.1)
Contributions 4.8 4.8 9.6
Net interest expense recognised in income statement (1.4) (1.0) (1.8)
Total remeasurements in statement of comprehensive income 30.2 (81.7) (49.4)
Balance in scheme at end of the period (77.2) (136.1) (104.6)
Related deferred tax assets on any pension deficits are reported separately under the requirements of IAS 12 ‘Income taxes’.
Notes to the financial statements continuedfor the period ended 30 September 2017

33
Ov
ERv
IEw
STR
ATE
GIC
REp
ORT
FIN
AN
CIA
l ST
ATE
MEN
TS
14. Deferred taxation
Deferred taxation
asset£m
Deferred taxation liability
£mTotal
£m
At 1 April 2017 18.5 (235.7) (217.2)
Credit to income 0.5 2.5 3.0
(Charge) to equity (5.0) – (5.0)
At 30 September 2017 14.0 (233.2) (219.2)
15. Related party transactionsThe ultimate parent entity is Manchester Airports Holdings Limited, a company registered in England and Wales. The ultimate controlling entity is Manchester Airports Holdings Limited.
Transactions involving The Council of the City of Manchester and the other council shareholdersThe Council of the City of Manchester (‘MCC’) is a related party to Manchester Airports Holdings Limited as MCC owns 35.5% of the share capital of the Company.
As at 30 September 2017 the amount of loans outstanding owed to MCC by the Group was £83.2m (30 September 2016: £83.2m). Manchester Airport Finance Holdings Limited made loan repayments of £nil (30 September 2016: £nil) to MCC during the year and paid interest of £5.0m (30 September 2016: £5.0m).
As at 30 September 2017 the amount of loans outstanding owed to the other nine councils (each of which is a related party to Manchester Airports Holdings Limited by virtue of its shareholding) by the Group was £79.4m (30 September 2016: £79.4m). Manchester Airport Finance Holdings Limited made loan repayments of £nil (2016: £nil) to the other nine councils during the year and paid interest of £4.8m (30 September 2016: £4.8m).
Included in external charges are charges for rent and rates amounting to £14.0m (30 September 2016: £13.8m) and other sundry charges of £0.4m (30 September 2016: £0.2m). The majoity of these amounts are due to MCC. The remainder are collected by MCC and distributed to other local authorities.
Transactions involving IFMIndustry Funds Management (‘IFM’), through its subsidiary, is a related party to Manchester Airports Holdings Limited as IFM owns 35.5% of the share capital of the Company. During the year, the Group was party to the following transactions with IFM.
As at 30 September 2017 the amount of loans outstanding owed to IFM by the Group was £89.4m (30 September 2016: £89.4m). Manchester Airport Finance Holdings Limited made loan repayments of £nil (30 September 2016: £nil) to IFM during the year and paid interest of £5.4m (30 September 2016: £5.4m).
Transactions involving associateAs at 30 September 2017 the amounts owing to the Group were £0.1m (30 September 2016: £1.5m) and amounts owed by the Group were £nil (30 September 2016: £0.1m). During the period the Group sold freehold land to the associate, generating proceeds of £4.7m (30 September 2016: £nil).

34MAGInterim Report and Accounts 2018
16. Reconciliation of net cash flow to movement in net debt
At 1 April
2017£m
Cash flow£m
Other non-cash
movements£m
At 30 September
2017£m
Cash at bank and in hand 16.7 19.7 – 36.4
Cash on short-term deposit – – – –
Cash and cash equivalents disclosed on the statement of financial position 16.7 19.7 – 36.4
Overdrafts – – – –
Total cash and cash equivalents (including overdrafts) 16.7 19.7 – 36.4
Current debt (134.1) (69.8) – (203.9)
Non-current debt (1,054.5) – (0.3) (1,054.8)
Net debt (1,171.9) (50.1) (0.3) (1,222.3)
17. Contingent liabilitiesA contingent liability exists under Part 1 of the Land Compensation Act 1973 relating to claims that may be made, and have already been made, by individual property owners in respect of alleged diminution in the value of their homes as a result of development works carried out at London Stansted Airport in the 1997–2007 period. Any claims made will raise complex matters of expert evidence in relation to historic noise levels and property values in the immediate vicinity of the airport and, accordingly, both the existence of any liability for the Group and, were such liability to be demonstrated, the extent of it, remain uncertain. In any event, it is the directors’ opinion, based on professional advice to date, that any liability incurred will not be material to the Group.
In addition, the Group has performance bonds and other items arising in the normal course of business amounting to £1.4m at 30 September 2017 (30 September 2016: £2.8m). As part of its investment in Airport City the Group has agreed to pay an equity contribution up to a maximum of £30m if required.
18. post balance sheet eventsOn 15 November 2017 the Group issued a £300m, 22-year bond, with an annual coupon of 2.875%. The Group will use the proceeds of the bond to fund the transformational capital investment programmes being undertaken at both Manchester and London Stansted Airports.
On 4 December 2017 the Group disposed of its entire shareholding in Bournemouth International Airport Limited and its subsidiaries: Bournemouth Airport Property Investments (Offices) Limited, Bournemouth Airport Property Investments (Industrial) Limited and Bournemouth Airport Core Property Investments Limited.
Notes to the financial statements continuedfor the period ended 30 September 2017

FSC LOGO TO GO HERE

magairports.com