interim management report for the half ... - food ingredients · and coatings applications grew...
TRANSCRIPT

Thursday, 10 August 2017
Interim Management Report for the half year ended 30 June 2017 Kerry, the global taste & nutrition and consumer foods group reports a solid underlying business performance for the half year ended 30 June 2017.
HIGHLIGHTS
• Group revenue increased by 4.8% to €3.2 billion reflecting 3.8% business volume growth
— Taste & Nutrition +4.2% volume growth
— Consumer Foods +2.3% volume growth
• Trading profit increased by 5.2% to €338m
• Group trading margin maintained at 10.6%
— Taste & Nutrition +20bps to 13%
— Consumer Foods -70bps to 7.6%
• Adjusted EPS* up 7.5% to 143.8 cent
• Basic EPS of 127.6 cent (H1 2016: 126.4 cent)
• Interim dividend per share increased by 11.9% to 18.8 cent
• Free cash flow of €357m (H1 2016: €379m)
* Before brand related intangible asset amortisation and non-trading items (net of related tax)
Commenting on the results Kerry Group Chief Executive Stan McCarthy said; “Against a background of significant adverse currency movements, we achieved a strong overall business performance in the first half of 2017, outperforming market growth rates and delivering a 7.5% increase in adjusted earnings per share. In February 2017 we guided growth in adjusted earnings per share of 5% to 9% at prevailing exchange rates. Taking into account increased currency translation headwinds of 4% and a 2% improvement in underlying performance at constant currency rates, we now expect to achieve growth in adjusted earnings per share of 3% to 7% on a reported basis to a range of 333.1 to 346 cent per share (2016: 323.4 cent).”
Contact Information
Media
Frank Hayes Director of Corporate Affairs +353 66 7182304 [email protected]
Investor Relations
Brian Mehigan Chief Financial Officer +353 66 7182292 [email protected]
Ronan Deasy Group Financial Controller +353 66 7182292 [email protected]
William Lynch Head of Investor Relations +353 66 7182292 [email protected]
Website
www.kerrygroup.com
KERRY GROUP PLC Interim Management Report - Page 1

INTERIM MANAGEMENT REPORT for the half year ended 30 June 2017
Kerry Group maintained a strong overall business performance in the first half of 2017 despite significant adverse currency movements and increased raw material pricing. Business volume growth rates outpaced industry levels, capitalising on Kerry’s unique taste & nutrition technologies and systems which are well positioned to deliver innovative solutions for the Group’s global, regional and local customers in response to ever-changing consumer requirements. Consumer trends favouring clean label, nutritious, tasteful, natural and convenient food and beverage offerings continue to drive a strong innovation pipeline across all end-use-markets in all regions. Growth in the foodservice channel continues to outpace growth in traditional retail outlets. E-tail and convenience channels also continue to grow strongly in selected consumer preferred categories.
The Group’s developing markets strategic growth model continues to achieve excellent results, particularly in Asia. Business performance in all regions continues to benefit from Group investments in its Technology & Innovation network, Development & Application Centres, and in its in-market commercial / technical support facilities through delivery of speedy innovative solutions to meet local taste preferences and consumer requirements.
Kerry Foods continues to perform well delivering sustained volume growth, despite the uncertainty following the UK electorate’s decision to leave the European Union and the significant devaluation of sterling. Retail fragmentation continues to drive marketplace competitiveness as growth through convenience formats, discounter chains and online grocery shopping outperforms traditional retail channel growth.
Business Performance Group revenue on a reported basis increased by 4.8% to €3.2 billion driven by strong organic growth offset by adverse currency movements. Business volumes grew by 3.8% in the period reflecting a good performance in American markets, an improved performance in the EMEA region and double digit growth in the Asia-Pacific region. Net pricing increased by 1.8%. Currency headwinds increased during Q2 contributing an adverse 1% translation impact and an adverse 0.4% transaction currency impact to revenue relative to H1 2016.
Taste & Nutrition delivered 4.2% growth in business volumes and pricing increased by 1.7%. Kerry Foods’ business volumes increased by 2.3% and divisional pricing increased by 1.9% across the half year.
The Group trading margin was maintained at 10.6% reflecting 20 basis points improvement in Taste & Nutrition, positive underlying margin improvement in Kerry Foods offset by adverse sterling exchange rates resulting in a 70 basis points margin reduction, and an increased spend on the Kerryconnect Programme.
Adjusted earnings per share increased by 7.5% to 143.8 cent (H1 2016: 133.8 cent). Basic earnings per share increased by 0.9% to 127.6 cent (H1 2016: 126.4 cent).
The interim dividend of 18.8 cent per share represents an increase of 11.9% over the 2016 interim dividend.
Net capital expenditure amounted to €102m (H1 2016: €63m). The Group achieved a strong free cash flow of €357m in the period (H1 2016: €379m).
KERRY GROUP PLC Interim Management Report - Page 2

Business Reviews Taste & Nutrition
H1 2017 Growth
Revenue €2,543m 4.2%*
Trading profit €331m +8.8%
Trading margin 13% +20bps
* Volume growth
Kerry provides the largest, most innovative portfolio of Taste & Nutrition Technologies and Systems, and Functional Ingredients & Actives for the global food, beverage and pharmaceutical industries.
The changing marketplace and consumer consumption trends continued to drive demand for Kerry’s globally connected Taste & Nutrition technologies and innovation capabilities, facilitated by the Group’s ‘in-market’ development & applications expertise and local customer service infrastructure. Retail and foodservice channel disruption and expansion, coupled with growth of ecommerce and demand for convenience plus localised taste preferences benefited Kerry’s unique Taste & Nutrition business model and differentiated consumer-led innovation network. Increased consumer demand for ‘better-for-you’, balanced nutrition and health offerings provided a strong platform for growth through Kerry’s market leading clean label solutions across all end-use-markets and foodservice channels. Growth in out-of-home consumption drove strong business development in the foodservice sector. The Group’s developing market strategies and investment again recorded excellent progress in all regions and double digit volume growth in Asia.
Taste & Nutrition reported revenue increased by 6.9% to €2.5 billion reflecting 4.2% volume growth. Net pricing increased by 1.7%. Trading profit grew by 8.8% to €331m, reflecting a 20 basis points improvement in divisional trading margin to 13%.
Americas Region
While consumer trends and increased market fragmentation impacted ‘centre of store’ branded offerings and industry growth rates, Kerry Taste & Nutrition ‘go-to-market’ strategies continued to deliver a strong innovation pipeline across core food & beverage end-use-markets, direct-to-retail and foodservice channels. Kerry’s taste and nutrition technologies are well positioned to meet increased consumer requirements for convenient, clean label, natural, organic, gluten-free, non-GMO and meat-free solutions, together with enhanced natural food preservation. Acquisitions completed in 2015 maintained a strong market development momentum across North and South American markets. Market conditions in Brazil improved relative to H1 2016 but Mexico and Central American markets were impacted by lower regional economic growth.
Sales revenue in the Americas region on a reported basis increased by 7.6% to €1,339m, reflecting 3.6% volume growth, a 1.5% increase in net pricing and a favourable translation currency impact of 2.5%.
Taste technologies achieved a solid performance throughout American markets in particular in the meat, bakery and beverage categories. Smoke & Grill technologies maintained excellent progress throughout retail and foodservice applications – benefiting from the Red Arrow acquisition completed in late 2015. Seasonings and coatings applications grew throughout the Latin American meat industry. Dairy & Culinary systems were impacted by challenging market conditions in North American prepared meals and side dish categories. However, dairy & culinary technologies achieved good growth in Latin America – particularly in foodservice solutions. Brazil based Ben Alimentos was acquired in June, expanding the Group’s dairy technology capability in the region.
The decline in the traditional R.T.E. cereals sector led to continued challenges in Cereal Systems. However, snacking trends provided solid growth opportunities in the nutritional bar sector in North America. The savoury snacks sector remains challenged due to consumer trends and industry issues in Mexico, Central America and the Caribbean region. Beverage systems grew well through R.T.D. coffee and all natural smoothie applications. Kerry’s branded beverage offerings, including Island Oasis, Da Vinci, Café D’Amore, Big Train and Oregon Chai continued to progress market development.
KERRY GROUP PLC Interim Management Report - Page 3

The Group’s core Functional Ingredients & Actives business continued to perform well. Solid growth was achieved through Food Preservation Systems and through cell nutrition applications in the pharmaceutical sector. Wellmune® branded food, beverage and supplement immune enhancing ingredients maintained strong growth, with successful market development in wider global nutritional and food product markets.
EMEA Region
Whilst the retail environment remained challenging across European markets, the continued growth of out-of-home consumption and channel diversification provided good opportunities for growth and market development. Kerry’s increased focus on commercial effectiveness and ‘in market’ customer engagement achieved good progress – contributing to a strong performance relative to H1 2016.
Demand for enhanced nutrition, clean label, authentic, sustainably produced offerings provided a strong platform for growth through Kerry Taste & Nutrition Technologies & Systems supported by the Group’s Technology & Innovation Centre network.
Sales revenue in the EMEA region on a reported basis increased by 2.3% to €750m, reflecting 2.3% business volume growth, 2.2% increase in net pricing, a 3.1% adverse translation currency impact and an adverse 0.3% transaction currency impact. Underlying business momentum improved across regional end-use-markets and channels in particular in Q2. Kerry performed well in the UK market despite food and beverage inflationary trends and the uncertainty following the UK electorate decision to leave the European Union.
Kerry’s taste technologies and systems grew solidly, in particular in the meat sector through foodservice applications. Good progress was achieved in Italy, Spain, Russia and the MENAT region. Establishment of a new manufacturing facility commenced near Moscow to meet customer requirements in the meat and savoury snack sectors. Dairy & Culinary systems benefited from snacking trends with a strong performance reported through Kerry’s unique ‘infused oil’ applications. Innovation in the sweet sector improved with good growth in nutritional applications, yoghurt and the premium ice cream sector. Clean label trends in the bakery sector also provided a solid platform for growth. Market conditions in Sub-Saharan Africa stabilised.
Sugar reduction continued to drive innovation in the beverage sector. Beverage systems performed well in the foodservice and c-store channels, supported by market development through the recently acquired Island Oasis and Vendin beverage solutions businesses. Kerry’s branded beverage offerings continued to perform well through the major chains and convenience channels.
Dairy based nutritional technologies continued to grow through infant and adult life-stage applications, in particular in Asian markets. Returns from primary dairy markets progressively improved due to lower production year-to-date in some exporting countries and to improved butterfat market demand.
Asia-Pacific Region
Kerry’s strong market development and business performance momentum was maintained throughout Asia-Pacific markets in the half year. Business volumes grew by 10.3% and net pricing increased by 1.7%. Reported revenue in the region grew by 14.2% to €419m.
Solid growth was achieved through all Kerry’s core technologies, end-use-markets and geographic markets in the region. In particular foodservice growth remains highly favourable – providing excellent innovation opportunities for Kerry technologies and a strong impetus for product diversification in competing channels. Strategic expansion of Kerry’s Asian footprint to meet customer requirements was maintained throughout the region through organic investment in Group facilities and completion of a number of acquisitions. The acquisition of Tianning Flavours was completed in April strengthening Kerry’s savoury and sweet flavour development capabilities in China. In March, Taste Master was acquired in Australia providing a significant boost to the Group’s taste capabilities in the beverage, snack, meat and culinary industries in Australia and New Zealand. New production facilities were established in Batangas, the Philippines and in Cikarang, Indonesia. In India, establishment of a new production facility to support taste and clean-label technology delivery commenced. The Group has also reached agreement to acquire Hangzhou, China based Hangman Flavours – a leading producer of sweet and savoury flavours.
KERRY GROUP PLC Interim Management Report - Page 4

Kerry’s Taste, Nutrition & General Wellness technologies all performed well throughout the Asia-Pacific region. Dry beverage applications grew strongly in Thailand and China. Liquid beverage systems achieved solid growth in particular in the foodservice and convenience channels in Japan, China and Thailand. Branded beverage systems including DaVinci continued to successfully progress market development throughout the region. The snack and bakery categories provided strong development opportunities for Kerry dairy technologies & systems in Indonesia, Japan, China and Malaysia. Culinary systems also benefited from foodservice trends in Australia, New Zealand, China and Malaysia. Similarly, the meat sector provided good development opportunities in the latter geographies and in Thailand.
Nutritional applications including specialised proteins and enzyme technologies maintained solid growth. Wellmune® achieved strong growth in the regional nutritional beverage sector.
Consumer Foods
H1 2017 Growth
Revenue €677m 2.3%*
Trading profit €51m (11.1%)
Trading margin 7.6% (70bps)
* Volume growth
Kerry Foods is an industry-leading manufacturer of added-value branded and customer branded chilled food products to the Irish, UK and selected international markets.
The consumer foods marketplace in the UK and Ireland remained highly competitive due to increasing inflationary pressures in the UK and overall competitiveness in a more fragmented market landscape. The decline in retailer promotional activity continued as the major chains responded through EDLP strategies to the growth in convenience outlets, channel proliferation and expansion of discounter chains. ‘Food-to-go’, foodservice and e-tail channels continue to grow at the expense of traditional outlets.
Kerry Foods’ business volumes grew by 2.3% and net pricing increased by 1.9%. Reported revenue at €677m declined by 2.8% due to significant adverse currency movements. The divisional trading profit margin decreased by 70 basis points to 7.6% as the underlying margin improvement was more than offset by adverse sterling exchange rate movements. This resulted in a trading profit decrease of 11.1% to €51m.
Demand for nutritional tasteful convenience products continued to drive good growth through meat and dairy snacking lines. ‘Mattessons’ performed well in meat snacking. ‘Cheestrings’ grew market share in the UK children’s cheese snack sector. ‘Cheestrings Scoffies’ extended the division’s cheese snack offering into the after-school segment and ‘Go-Go’s’ achieved encouraging results in the adults’ snack sector. ‘Cheestrings’ continued to develop its market positioning in mainland Europe. ‘Attack-A-Snack’ achieved double digit growth in the light snacks category. ‘Yollies’ maintained solid growth in the children’s yoghurt snack sector.
Conditions in the UK sausage sector stabilised. The relaunched ‘Richmond’ brand performed satisfactorily and the ‘Walls’ fresh sausage portfolio achieved good market penetration. ‘Fire & Smoke’ maintained good development momentum in the UK and Irish sliced cooked meats categories. ‘Denny’ branded lines performed satisfactorily in Ireland. In May ‘Henry Denny’s Meat Masters’ was launched successfully in the premium meats sub-category.
Premiumisation and health trends contributed to a good performance in Kerry Foods’ chilled and frozen prepared meals. Foodservice and ‘direct-to-consumer’ channels also provided good growth opportunities.
Excellent progress was achieved in the UK private label spreads category through Kerry’s spreadable butter based offerings. ‘Dairygold’ maintained market share in the Irish spreads category assisted by successful new product introductions.
KERRY GROUP PLC Interim Management Report - Page 5

Financial Review
% H1 2017 H1 2016
Reconciliation of adjusted* earnings to profit after taxation change €’m €’m
Revenue 4.8% 3,181.3 3,036.6
Trading profit 5.2% 338.4 321.6 Trading margin 10.6% 10.6% Computer software amortisation (11.9) (11.4)
Finance costs (net) (34.4) (39.1)
Adjusted earnings before taxation 292.1 271.1
Income taxes (excluding non-trading items) (38.5) (35.7)
Adjusted earnings after taxation 7.7% 253.6 235.4
Brand related intangible asset amortisation (10.7) (10.2)
Non-trading items (net of related tax) (17.8) (2.8)
Profit after taxation 225.1 222.4
EPS EPS
Cent Cent
Adjusted EPS 7.5% 143.8 133.8 Brand related intangible asset amortisation (6.1) (5.8)
Non-trading items (net of related tax) (10.1) (1.6)
Basic EPS 0.9% 127.6 126.4 * Before brand related intangible asset amortisation and non-trading items (net of related tax)
Analysis of Results
Revenue On a reported basis Group revenue increased by 4.8% to €3.2 billion (H1 2016: €3.0 billion). Volumes grew by 3.8%, net product pricing increased by 1.8% and there was a negative transaction related currency impact of 0.4%. Business acquisitions contributed 0.6% and there was a negative translation currency impact of 1.0%.
In Taste & Nutrition, reported revenue increased by 6.9% to €2.5 billion (H1 2016: €2.4 billion). Volumes grew by 4.2%, product pricing increased by 1.7% and there was a negative transaction related currency impact of 0.1%. Business acquisitions contributed 0.7% and there was a positive translation currency impact of 0.4%.
In Consumer Foods, reported revenue decreased by 2.8% to €677m (H1 2016: €697m). Volumes increased by 2.3% and product pricing increased by 1.9%. There was a negative impact of 1.4% from transaction related currency and a negative translation currency impact of 5.6% due to weaker sterling.
Trading Profit & Margin Group trading profit increased by 5.2% to €338.4m (H1 2016: €321.6m). Group trading profit margin in the period was maintained at 10.6%. Underlying margin expansion attributable to improved product mix, operating leverage and efficiencies was offset by transaction currency headwinds, increased Kerryconnect investment and the denominator pricing effect.
Trading profit margin in Taste & Nutrition increased by 20 bps to 13.0%, due to the benefits of improved product mix, leverage and efficiencies, offset by the denominator pricing effect and currency headwinds.
Trading profit margin in Consumer Foods decreased by 70 bps to 7.6% due to significant transaction currency headwinds in the period, partly offset by underlying margin expansion.
KERRY GROUP PLC Interim Management Report - Page 6

Finance Costs (net) Finance costs (net) for the period decreased by €4.7m to €34.4m (H1 2016: €39.1m) due to strong cash generation in the period.
Taxation The tax charge for the period, before non-trading items was €38.5m (H1 2016: €35.7m) which represents an effective tax rate of 13.7% (H1 2016: 13.7%).
Acquisitions During the period, the Group completed three bolt-on acquisitions, Tianning Flavours was acquired in China, Taste Master was acquired in Australia, and Ben Alimentos was acquired in Brazil. The Group also reached agreement to acquire Hangman Flavours in China.
Non-Trading Items The Group recorded €17.8m of costs net of tax (H1 2016: €2.8m) primarily relating to costs associated with integrating the acquisitions completed since 2015.
Free Cash Flow The Group achieved free cash flow of €357.2m (H1 2016: €379.1m). This reflects improved profit, offset by higher capital expenditure relative to the prior period.
Free Cash Flow H1 2017 H1 2016
€’m €’m Trading profit 338.4 321.6
Depreciation (net) 68.6 66.9
Movement in average working capital 118.1 120.0
Pension contributions paid less pension expense (22.7) (20.0)
Cash flow from operations 502.4 488.5
Finance costs paid (net) (21.0) (23.9)
Income taxes paid (21.8) (22.6)
Purchase of non-current assets (102.4) (62.9)
Free cash flow 357.2 379.1
Balance Sheet A summary balance sheet as at 30 June 2017 is provided below:
H1 2017 H1 2016 FY 2016 €’m €’m €’m
Property, plant & equipment 1,430.1 1,385.1 1,451.9
Intangible assets 3,414.2 3,414.4 3,444.3
Other non-current assets 211.1 261.6 285.7
Current assets 2,159.8 1,989.0 2,240.0
Total assets 7,215.2 7,050.1 7,421.9
Current liabilities 1,546.8 1,581.8 1,693.4
Non-current liabilities 2,418.0 2,591.3 2,634.5
Total liabilities 3,964.8 4,173.1 4,327.9
Net Assets 3,250.4 2,877.0 3,094.0
Shareholders’ equity 3,250.4 2,877.0 3,094.0
Property, Plant & Equipment Property, plant & equipment decreased by €21.8m to €1,430.1m (Dec 2016: €1,451.9m, H1 2016: €1,385.1m), as additions made in the period were more than offset by foreign exchange translation movements and the depreciation charge.
KERRY GROUP PLC Interim Management Report - Page 7

Intangible Assets Intangible assets decreased by €30.1m to €3,414.2m (Dec 2016: €3,444.3m, H1 2016: €3,414.4m) as additions during the period were offset by foreign exchange movements and the amortisation charge.
Current Assets Current assets decreased by €80.2m to €2,159.8m (Dec 2016: €2,240.0m, H1 2016: €1,989.0m), primarily due to a decrease in cash in hand at 30 June 2017 arising from the repayment of US Senior Notes of $192m which matured on 20 January 2017.
Retirement Benefits At the balance sheet date, the net deficit for all defined benefit schemes (after deferred tax) was €186.4m (Dec 2016: €291.9m, H1 2016: €313.9m). The decrease in the net deficit from year end arises from good investment returns, a favourable movement in discount and inflation rates, and a liability management programme implemented in 2017.
Net Debt At 30 June 2017, net debt stood at €1,222m, a decrease of €102m relative to the December 2016 debt of €1,324m.
Key Financial Covenants
At 30 June the key financial ratios were as follows:
Covenant H1 2017
Times H1 2016
Times FY 2016
Times Net debt: EBITDA* Maximum 3.5 1.3 1.7 1.5 EBITDA: Net interest* Minimum 4.75 14.9 15.7 14.0
*Calculated in accordance with lenders facility agreements which take account of adjustments as outlined in the financial definitionsaccompanying the Interim Financial Statements.
The average maturity profile of net debt was 6.5 years at the end of the period (Dec 2016: 6.4 years). At the period end 60% of gross debt was carried at fixed rates and the weighted average period for which rates were fixed was 7.2 years. The Group’s balance sheet is in a healthy position. With a net debt to EBITDA* ratio of 1.3 times, the organisation has sufficient headroom to support its future growth plans.
Related Party Transactions There were no changes in related party transactions from the 2016 Annual Report that could have a material effect on the financial position or performance of the Group in the first half of the year.
Exchange Rates Group results are impacted by fluctuations in exchange rates year on year versus the euro. The table below details the movement in spot rates since February guidance for the principal exchange rates used to translate results of non-euro denominated subsidiaries.
KERRY GROUP PLC Interim Management Report - Page 8

Principal Risks & Uncertainties Details of the principal risks and uncertainties facing the Group can be found in the 2016 Annual Report on pages 62 to 67. These risks include but are not limited to; the identification and integration of acquisition targets, a slowdown in the rate of innovation, quality & food safety risks, failure to attract/retain key talent, systems implementation risks, unauthorised use of Group intellectual property, geopolitical risk and ongoing operational and compliance risks. However, risks with increased potential impact in the second half of the year include fluctuating raw materials together with volatile currencies. The Group actively manages these and all other risks through its control and risk management process.
Going Concern The Group Condensed Consolidated Interim Financial Statements have been prepared on the going concern basis. The Directors report that they have satisfied themselves that the Group is a going concern, having adequate resources to continue in operational existence for the foreseeable future. In forming this view, the Directors have reviewed the Group’s budget for a period not less than 12 months, the medium term plans as set out in the rolling five year plan, and have taken into account the cash flow implications of the plans, including proposed capital expenditure, and compared these with the Group’s committed borrowing facilities and projected gearing ratios.
Dividend The Board has declared an interim dividend of 18.8 cent per share (an increase of 11.9% on the 2016 interim dividend of 16.8 cent) payable on 10 November 2017 to shareholders registered on the record date 13 October 2017.
Board & Management Changes As announced in February, Mr Stan McCarthy, who became Chief Executive of the Group in January 2008, will retire as Chief Executive on 30 September 2017 and as Director of the Group at year end.
Mr Edmond Scanlon has been appointed Chief Executive Designate to succeed Mr McCarthy on his retirement. Having joined Kerry’s Graduate Development Programme in 1996, Mr Scanlon worked in Finance until his appointment as Vice President Finance, Supply Chain and Operations of Kerry’s Global Flavours Division in 2004. In 2007, he was appointed Vice President Mergers & Acquisitions, Kerry Americas region, before being appointed Global President Kerry Functional Ingredients & Actives in late 2008. In 2012, he was appointed President of Kerry China, prior to his appointment as President & CEO Kerry Asia Pacific region in November 2013.
Mr Flor Healy has retired as an Executive Director of the Board and signalled his intention to step down from his position as CEO of Kerry Foods, the Group’s consumer foods division, at year end. Over the coming months Mr Healy will assist the transition to a new CEO of Kerry Foods to be appointed by Mr Edmond Scanlon, Chief Executive Designate. Mr Healy joined Kerry’s Graduate Development Programme in 1984 and served in a number of key positions across the Group’s foods’ businesses prior to his appointment as CEO of Kerry Foods in 2004.
Future Prospects Notwithstanding significant currency headwinds, Group businesses are well positioned to meet customer and consumer needs in the changing marketplace and deliver sustained underlying growth. Kerry’s globally connected, localised Taste & Nutrition business model, supported by the Group’s Technology & Innovation Centre network, holds a strategic advantage in meeting customer requirements across all market channels in developed and developing markets. We continue to capitalise on out-of-home consumption trends and channel expansion. Prospects for sustained strong growth throughout Asian markets will be supported by deployment of increased resources. Organic and acquisition growth opportunities will continue to be pursued in all geographic regions.
KERRY GROUP PLC Interim Management Report - Page 9

Kerry Foods will continue to embrace meat and dairy snacking, meal solution and out-of-home channel growth opportunities.
In February 2017 we guided growth in adjusted earnings per share of 5% to 9% at prevailing exchange rates. Taking into account increased currency translation headwinds of 4% and a 2% improvement in underlying performance at constant currency rates, we now expect to achieve growth in adjusted earnings per share of 3% to 7% on a reported basis to a range of 333.1 to 346 cent per share (2016: 323.4 cent).
Responsibility Statement The Directors are responsible for preparing the Half Yearly Financial Report in accordance with the Transparency (Directive 2004/109/EC) Regulations 2007 of Ireland (S.I. No. 277 of 2007) (“the Regulations”), the Transparency Rules of the Central Bank of Ireland and with IAS 34 “Interim Financial Reporting” as adopted by the European Union.
The Directors confirm that to the best of their knowledge:
• the Group Condensed Consolidated Interim Financial Statements for the half year ended 30 June 2017have been prepared in accordance with the international accounting standard applicable to interimfinancial reporting adopted pursuant to the procedure provided for under Article 6 of the Regulation(EC) No. 1606/2002 of the European Parliament and of the Council of 19 July 2002;
• the Interim Management Report includes a fair review of the important events that have occurredduring the first six months of the financial year, and their impact on the Group CondensedConsolidated Interim Financial Statements for the half year ended 30 June 2017, and a description ofthe principal risks and uncertainties for the remaining six months;
• the Interim Management Report includes a fair review of the related party transactions that haveoccurred during the first six months of the current financial year and that have materially affected thefinancial position or the performance of the Group during that period, and any changes in the relatedparties’ transactions described in the last Annual Report that could have a material effect on thefinancial position or performance of the Group in the first six months of the current financial year.
Brian Mehigan Chief Financial Officer
On behalf of the board
Stan McCarthy Chief Executive
9 August 2017
Disclaimer Forward Looking Statements This Announcement contains forward looking statements which reflect management expectations based on currently available data. However actual results may differ materially from those expressed or implied by these forward looking statements. These forward looking statements speak only as of the date they were made and the Company undertakes no obligation to publicly update any forward looking statement, whether as a result of new information, future events or otherwise.
KERRY GROUP PLC Interim Management Report - Page 10

for the half year ended 30 June 2017
BeforeNon-Trading Non-Trading Half year Half year Year
Items Items ended ended ended30 June 2017 30 June 2017 30 June 2017 30 June 2016 31 Dec. 2016
Unaudited Unaudited Unaudited Unaudited AuditedNotes €'m €'m €'m €'m €'m
Revenue 2 3,181.3 - 3,181.3 3,036.6 6,130.6
Trading profit 2 338.4 - 338.4 321.6 749.6
Intangible asset amortisation (22.6) - (22.6) (21.6) (46.4)Non-trading items 3 - (24.8) (24.8) (4.8) (21.0)
Operating profit 315.8 (24.8) 291.0 295.2 682.2
Finance income 4 0.1 - 0.1 0.8 1.1Finance costs 4 (34.5) - (34.5) (39.9) (71.5)
281.4 (24.8) 256.6 256.1 611.8
Income taxes (38.5) 7.0 (31.5) (33.7) (78.7)
242.9 (17.8) 225.1 222.4 533.1
Earnings per A ordinary share Cent Cent Cent- basic 5 127.6 126.4 302.9
- diluted 5 127.5 126.2 302.0
Condensed Consolidated Income Statement
Continuing operations
Profit before taxation
Profit after taxation and attributable to owners of the parent
KERRY GROUP PLC Interim Management Report - Page 11
for the half year ended 30 June 2017
Half year Half year Yearended ended ended
30 June 2017 30 June 2016 31 Dec. 2016Unaudited Unaudited Audited
Note €'m €'m €'m
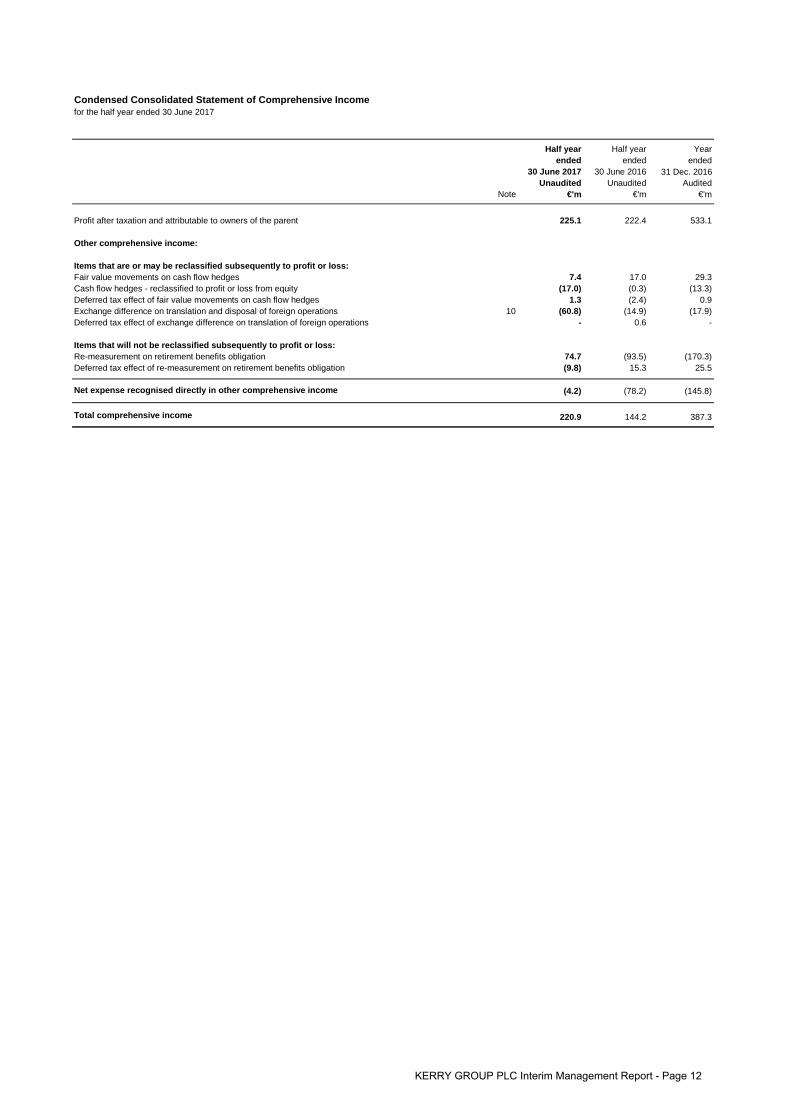
Profit after taxation and attributable to owners of the parent 225.1 222.4 533.1
Other comprehensive income:
Items that are or may be reclassified subsequently to profit or loss:Fair value movements on cash flow hedges 7.4 17.0 29.3Cash flow hedges - reclassified to profit or loss from equity (17.0) (0.3) (13.3)Deferred tax effect of fair value movements on cash flow hedges 1.3 (2.4) 0.9Exchange difference on translation and disposal of foreign operations 10 (60.8) (14.9) (17.9)Deferred tax effect of exchange difference on translation of foreign operations - 0.6 -
Items that will not be reclassified subsequently to profit or loss:Re-measurement on retirement benefits obligation 74.7 (93.5) (170.3)Deferred tax effect of re-measurement on retirement benefits obligation (9.8) 15.3 25.5
(4.2) (78.2) (145.8)
220.9 144.2 387.3
Condensed Consolidated Statement of Comprehensive Income
Total comprehensive income
Net expense recognised directly in other comprehensive income
KERRY GROUP PLC Interim Management Report - Page 12

as at 30 June 2017
30 June 2017 30 June 2016 31 Dec. 2016Unaudited Unaudited Audited
Notes €'m €'m €'m
Non-current assetsProperty, plant and equipment 1,430.1 1,385.1 1,451.9Intangible assets 3,414.2 3,414.4 3,444.3Financial asset investments 40.2 35.6 39.3Investment in associates 5.9 40.4 40.7Non-current financial instruments 111.7 142.3 153.0Deferred tax assets 53.3 43.3 52.7
5,055.4 5,061.1 5,181.9
Current assetsInventories 744.1 736.0 743.0Trade and other receivables 897.5 864.0 847.3Cash at bank and in hand 8 457.4 329.8 564.7Other current financial instruments 56.0 42.3 80.1Assets classified as held for sale 4.8 16.9 4.9
2,159.8 1,989.0 2,240.0
Total assets 7,215.2 7,050.1 7,421.9
Current liabilitiesTrade and other payables 1,383.1 1,234.2 1,351.6Borrowings and overdrafts 8 7.5 199.7 192.5Other current financial instruments 15.7 13.2 20.9Tax liabilities 99.2 102.3 95.2Provisions 36.9 28.1 30.4Deferred income 4.4 4.3 2.8
1,546.8 1,581.8 1,693.4
Non-current liabilitiesBorrowings 8 1,782.7 1,810.9 1,867.0Other non-current financial instruments 0.6 - 7.3Retirement benefits obligation 7 233.8 377.7 352.8Other non-current liabilities 89.1 93.6 95.1Deferred tax liabilities 250.4 230.4 247.2Provisions 40.1 57.0 40.8Deferred income 21.3 21.7 24.3
2,418.0 2,591.3 2,634.5
Total liabilities 3,964.8 4,173.1 4,327.9
Net assets 3,250.4 2,877.0 3,094.0
Issued capital and reserves attributable to owners of the parentShare capital 9 22.0 22.0 22.0Share premium 398.7 398.7 398.7Other reserves (163.9) (97.8) (98.0)Retained earnings 2,993.6 2,554.1 2,771.3
Shareholders' equity 3,250.4 2,877.0 3,094.0
Condensed Consolidated Balance Sheet
KERRY GROUP PLC Interim Management Report - Page 13
Share Capital
Share Premium
Other Reserves
Retained Earnings Total
Note €'m €'m €'m €'m €'m
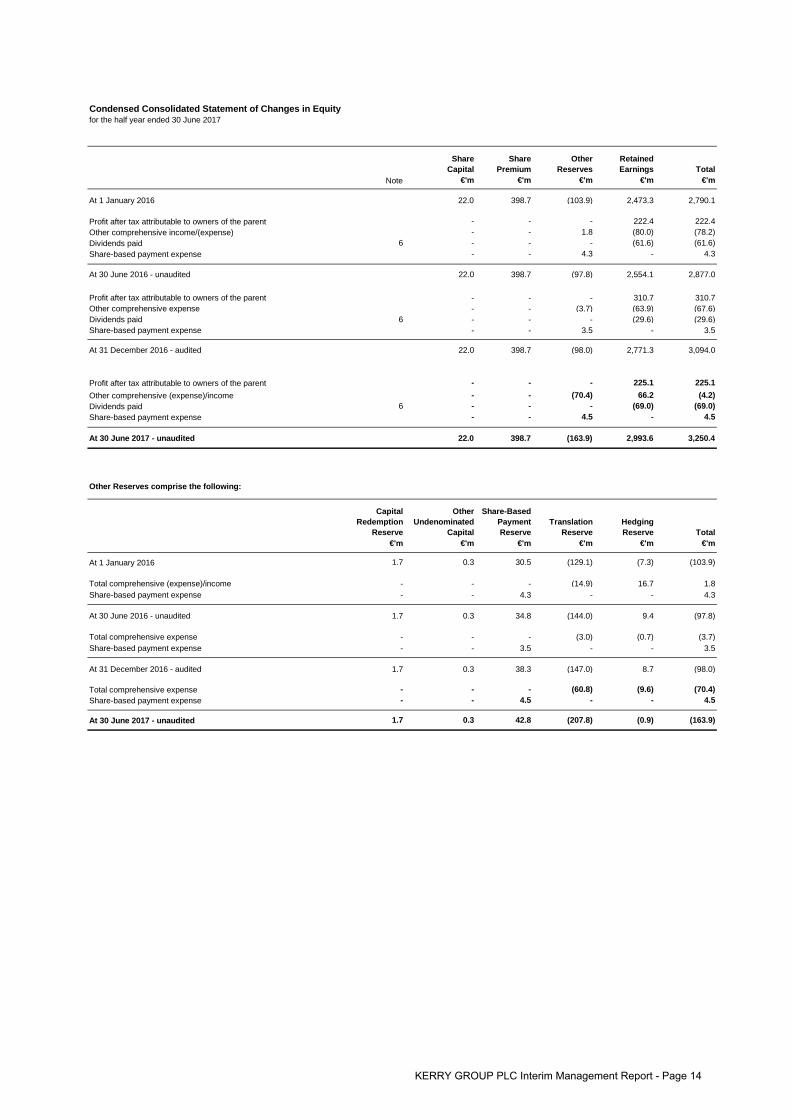
At 1 January 2016 22.0 398.7 (103.9) 2,473.3 2,790.1
Profit after tax attributable to owners of the parent - - - 222.4 222.4Other comprehensive income/(expense) - - 1.8 (80.0) (78.2)Dividends paid 6 - - - (61.6) (61.6)Share-based payment expense - - 4.3 - 4.3
At 30 June 2016 - unaudited 22.0 398.7 (97.8) 2,554.1 2,877.0
Profit after tax attributable to owners of the parent - - - 310.7 310.7Other comprehensive expense - - (3.7) (63.9) (67.6)Dividends paid 6 - - - (29.6) (29.6)Share-based payment expense - - 3.5 - 3.5
At 31 December 2016 - audited 22.0 398.7 (98.0) 2,771.3 3,094.0
Profit after tax attributable to owners of the parent - - - 225.1 225.1Other comprehensive (expense)/income - - (70.4) 66.2 (4.2)Dividends paid 6 - - - (69.0) (69.0)Share-based payment expense - - 4.5 - 4.5
At 30 June 2017 - unaudited 22.0 398.7 (163.9) 2,993.6 3,250.4
Other Reserves comprise the following:
Capital Redemption
Reserve
Other Undenominated
Capital
Share-Based Payment Reserve
Translation Reserve
Hedging Reserve Total
€'m €'m €'m €'m €'m €'m
At 1 January 2016 1.7 0.3 30.5 (129.1) (7.3) (103.9)
Total comprehensive (expense)/income - - - (14.9) 16.7 1.8Share-based payment expense - - 4.3 - - 4.3
At 30 June 2016 - unaudited 1.7 0.3 34.8 (144.0) 9.4 (97.8)
Total comprehensive expense - - - (3.0) (0.7) (3.7)Share-based payment expense - - 3.5 - - 3.5
At 31 December 2016 - audited 1.7 0.3 38.3 (147.0) 8.7 (98.0)
Total comprehensive expense - - - (60.8) (9.6) (70.4)Share-based payment expense - - 4.5 - - 4.5
At 30 June 2017 - unaudited 1.7 0.3 42.8 (207.8) (0.9) (163.9)
Condensed Consolidated Statement of Changes in Equityfor the half year ended 30 June 2017
KERRY GROUP PLC Interim Management Report - Page 14

for the half year ended 30 June 2017
Half year Half year Yearended ended ended
30 June 2017 30 June 2016 31 Dec. 2016Unaudited Unaudited Audited
Notes €'m €'m €'m
Operating activitiesTrading profit 338.4 321.6 749.6Adjustments for:Depreciation (net) 68.6 66.9 129.8Change in working capital (42.9) (58.8) 61.7Pension contributions paid less pension expense (22.7) (20.0) (118.2)Payments on acquisition integration and restructuring costs (12.5) (7.0) (21.2)Exchange translation adjustment 10 (1.8) (0.8) 0.1
Cash generated from operations 327.1 301.9 801.8Income taxes paid (21.8) (22.6) (57.3)Finance income received 0.1 0.8 1.1Finance costs paid (21.1) (24.7) (62.6)
Net cash from operating activities 284.3 255.4 683.0
Investing activitiesPurchase of assets (103.4) (73.5) (223.8)Proceeds from the sale of assets 0.9 10.6 12.1Capital grants received 0.1 - 1.5Purchase of businesses (net of cash acquired) 11 (89.1) (22.4) (22.2)Disposal/(purchase) of share in associates 30.1 - (6.7)Income received from associates - - 5.0Disposal of businesses - - (2.0)Payments relating to previous acquisitions (0.1) (7.2) (0.1)
Net cash used in investing activities (161.5) (92.5) (236.2)
Financing activitiesDividends paid 6 (69.0) (61.6) (91.2)Issue of share capital 9 - - -Repayment of borrowings (155.6) - (25.6)
Net cash movement due to financing activities (224.6) (61.6) (116.8)
Net (decrease)/increase in cash and cash equivalents (101.8) 101.3 330.0Cash and cash equivalents at beginning of period 561.1 231.2 231.2Exchange translation adjustment on cash and cash equivalents 10 (9.4) (2.7) (0.1)
Cash and cash equivalents at end of period 8 449.9 329.8 561.1
Reconciliation of Net Cash Flow to Movement in Net DebtNet (decrease)/increase in cash and cash equivalents (101.8) 101.3 330.0Cash inflow from debt financing 155.6 - 25.6
Changes in net debt resulting from cash flows 53.8 101.3 355.6Fair value movement on interest rate swaps (net of adjustment to borrowings) 0.9 (1.6) (5.4)Exchange translation adjustment on net debt 10 47.3 30.7 (23.8)
Movement in net debt in the period 102.0 130.4 326.4Net debt at beginning of period (1,323.7) (1,650.1) (1,650.1)
Net debt at end of period 8 (1,221.7) (1,519.7) (1,323.7)
Condensed Consolidated Statement of Cash Flows
KERRY GROUP PLC Interim Management Report - Page 15

Notes to the Condensed Consolidated Interim Financial Statementsfor the half year ended 30 June 2017
1. Accounting policies
- IAS 7 (amendments) Statement of Cash Flows- IAS 12 (amendments) Income Taxes
Effective Date
- IFRS 9 Financial Instruments 1 January 2018
- IFRS 15 Revenue from Contracts with Customers 1 January 2018
- IFRS 16 1 January 2019
These Condensed Consolidated Interim Financial Statements for the half year ended 30 June 2017 have been prepared in accordance with the requirements of IAS 34'Interim Financial Reporting' and using accounting policies consistent with International Financial Reporting Standards as adopted by the European Union. Theaccounting policies applied by the Group in these Condensed Consolidated Interim Financial Statements are the same as those detailed in the 2016 Annual Report.Some comparative information has been re-presented to align with the current half year presentation.
LeasesIFRS 16, published in January 2016, replaces the existing guidance in IAS 17 'Leases'. IFRS 16 eliminatesthe classification of leases as either operating leases or finance leases. It introduces a single lesseeaccounting model, which requires a lessee to recognise assets and liabilities for all leases with a term ofmore than 12 months and depreciation of lease assets separately from interest on lease liabilities in theincome statement. The Group is assessing the potential impact on its consolidated financial statementsresulting from the application of IFRS 16. Indications from our continued review of IFRS 16 are that this willresult in an increase in finance leased assets of approximately €58.0m, and a corresponding increase infinancial liabilities of the same amount, on the consolidated balance sheet of the Group's financialstatements.
The following standards and interpretations are effective for the Group from 1 January 2017 but do not have a material effect on the results or financial position of theGroup:
IFRS 9, published in July 2014, replaces the existing guidance in IAS 39 'Financial Instruments: Recognitionand Measurement'. IFRS 9 includes revised guidance on the classification and measurement of financialinstruments, including a new expected credit loss model for calculating impairment on financial assets, andthe new general hedge accounting requirements. It also carries forward the guidance on recognition andderecognition of financial instruments from IAS 39. The Group is continuing to assess the potential impacton its consolidated financial statements resulting from the application of IFRS 9. The vast majority offinancial assets held are trade receivables and cash, which are expected to continue to be accounted for atamortised cost. The majority of financial asset investments are expected to continue to be accounted for atfair value through profit or loss. On this basis, the classification and measurement changes are not expectedto have a material impact on the Group's consolidated financial statements. Given historic loss rates, normalreceivable ageing and the significant portion of trade receivables that are within agreed terms, the movefrom an incurred loss model to an expected loss model is not expected to have a material impact. The newhedging requirements of IFRS 9 will align hedge accounting more closely to the Group's risk managementpolicies, as well as making more hedging relationships eligible for hedge accounting. Current hedgingarrangements continue to be appropriate under IFRS with the only difference being a change to the cost ofhedging. This change to cost is not expected to be material. The Group's implementation plan for IFRS 9 isongoing and is expected to be complete by the end of quarter 3 2017.
IFRS 15, published in May 2014, was issued to establish a single comprehensive model for entities to use inaccounting for revenue arising from contracts with customers. The core principle of IFRS 15 is that an entityshould recognise revenue to depict the transfer of promised goods or services to customers in an amountthat reflects the consideration to which the entity expects to be entitled to in exchange for those goods orservices. Under IFRS 15, an entity recognises revenue when (or as) a performance obligation is satisfiedi.e. when 'control' of the goods or services underlying the particular performance obligation is transferred tothe customer. The Group is continuing to assess the potential impact on its consolidated financialstatements resulting from the application of IFRS 15. Findings from our initial review of IFRS 15 are that theimpact of this new standard on the Groups' results is unlikely to be material. Kerry do not supply servicesand generally legal title of goods sold is transferred on shipment. As a result, our impact analysis identifiesthat it is unlikely that the impact of moving from a risk and reward model to the IFRS 15 control model will bematerial. The Group's implementation plan for IFRS 15 is ongoing and is expected to be complete by theend of quarter 3 2017.
The following revised standards are not yet effective and the impact on Kerry Group is currently under review:
KERRY GROUP PLC Interim Management Report - Page 16
Notes to the Condensed Consolidated Interim Financial Statements (continued)for the half year ended 30 June 2017
2. Analysis by business segment
Half year Half year Yearended ended ended
30 June 2017 30 June 2016 31 Dec. 2016Unaudited Unaudited Audited
€'m €'m €'m
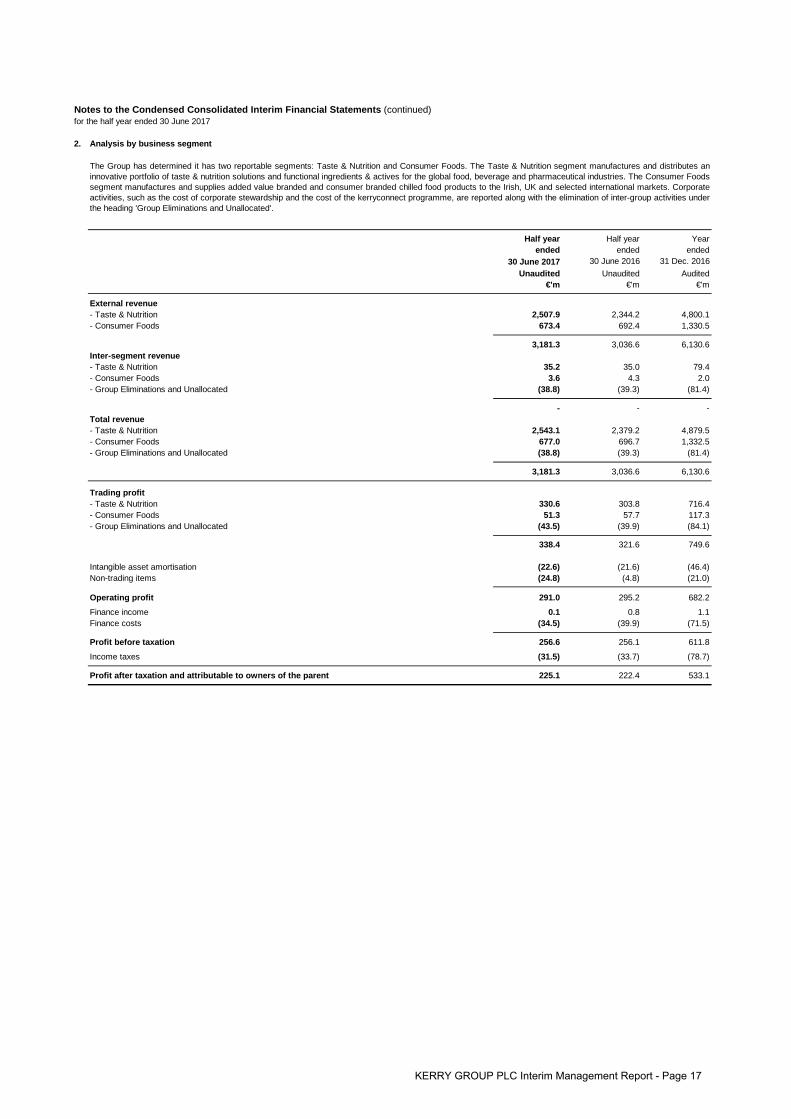
External revenue- Taste & Nutrition 2,507.9 2,344.2 4,800.1- Consumer Foods 673.4 692.4 1,330.5
3,181.3 3,036.6 6,130.6Inter-segment revenue- Taste & Nutrition 35.2 35.0 79.4- Consumer Foods 3.6 4.3 2.0- Group Eliminations and Unallocated (38.8) (39.3) (81.4)
- - -Total revenue- Taste & Nutrition 2,543.1 2,379.2 4,879.5- Consumer Foods 677.0 696.7 1,332.5- Group Eliminations and Unallocated (38.8) (39.3) (81.4)
3,181.3 3,036.6 6,130.6
Trading profit- Taste & Nutrition 330.6 303.8 716.4- Consumer Foods 51.3 57.7 117.3- Group Eliminations and Unallocated (43.5) (39.9) (84.1)
338.4 321.6 749.6
Intangible asset amortisation (22.6) (21.6) (46.4)Non-trading items (24.8) (4.8) (21.0)
Operating profit 291.0 295.2 682.2
Finance income 0.1 0.8 1.1Finance costs (34.5) (39.9) (71.5)
Profit before taxation 256.6 256.1 611.8
Income taxes (31.5) (33.7) (78.7)
Profit after taxation and attributable to owners of the parent 225.1 222.4 533.1
The Group has determined it has two reportable segments: Taste & Nutrition and Consumer Foods. The Taste & Nutrition segment manufactures and distributes aninnovative portfolio of taste & nutrition solutions and functional ingredients & actives for the global food, beverage and pharmaceutical industries. The Consumer Foodssegment manufactures and supplies added value branded and consumer branded chilled food products to the Irish, UK and selected international markets. Corporateactivities, such as the cost of corporate stewardship and the cost of the kerryconnect programme, are reported along with the elimination of inter-group activities underthe heading 'Group Eliminations and Unallocated'.
KERRY GROUP PLC Interim Management Report - Page 17

2. Analysis by business segment (continued)
Half year Half year Yearended ended ended
30 June 2017 30 June 2016 31 Dec. 2016Unaudited Unaudited Audited
€'m €'m €'m
Revenue by location of external customersEMEA 1,423.7 1,426.0 2,777.0Americas 1,338.8 1,243.8 2,588.5Asia Pacific 418.8 366.8 765.1
3,181.3 3,036.6 6,130.6
The accounting policies of the reportable segments are the same as those detailed in the Statement of Accounting Policies in the 2016 Annual Report.
3. Non-trading items
Half year Half year Yearended ended ended
30 June 2017 30 June 2016 31 Dec. 2016Unaudited Unaudited Audited
Notes €'m €'m €'m
(Loss)/profit on disposal of assets* and businesses (i) (4.9) 2.1 (1.3)Acquisition integration and restructuring costs (ii) (19.9) (6.9) (19.6)Impairment of assets held for sale (iii) - - (0.1)
(24.8) (4.8) (21.0)Tax 7.0 2.0 8.0
(17.8) (2.8) (13.0)*Assets represent non-current assets and assets classified as held for sale.
(i) (Loss)/profit on disposal of assets and businesses
4. Finance income and costs
Half year Half year Yearended ended ended
30 June 2017 30 June 2016 31 Dec. 2016Unaudited Unaudited Audited
€'m €'m €'m
0.1 0.8 1.1
(27.7) (30.7) (64.1)Interest rate derivative (2.7) (4.8) 0.5
(30.4) (35.5) (63.6)
(4.1) (4.4) (7.9)
(34.5) (39.9) (71.5)
Interest income on deposits
Notes to the Condensed Consolidated Interim Financial Statements (continued)for the half year ended 30 June 2017
Information about geographical areas
Finance costs:
During the period the Group disposed of property, plant and equipment primarily in Ireland and the UK and disposed of its 22.5% shareholding in Addo Food Group Limited for a total consideration of €31.0m. The investment in Addo Food Group Limited was disposed from the investment in associate line on the Condensed Consolidated Balance Sheet. In 2016, the Group disposed of property, plant and equipment and assets classified as held for sale primarily in Ireland and the UK and a small business in the Taste & Nutrition segment.
A net tax credit of €0.2m (30 June 2016: a tax charge of €0.4m; 31 December 2016: a tax credit of €1.0m) arose on the disposal of assets and businesses.
(ii) Acquisition integration and restructuring costsDuring the period, acquisition integration and restructuring costs of €19.9m (30 June 2016: €6.9m; 31 December 2016: €19.6m) primarily related to costs of integratingacquisitions completed since 2015, including Red Arrow and Island Oasis, into the Group's operations and transaction expenses incurred in completing current yearacquisitions. In the period ended 30 June 2017, a tax credit of €6.8m (30 June 2016: a tax credit of €2.4m; 31 December 2016: a tax credit of €7.0m) arose due to taxdeductions available on acquisition integration and restructuring costs.
(iii) Impairment of assets held for saleThere were no impairments of assets held for sale recorded in the period. In 2016, assets classified as held for sale were impaired to their value less costs to sell by€3.7m. In addition in 2016 it was determined that the value of the Group’s remaining businesses held for sale, would no longer be recovered principally through a sale. As a result, the assets were reclassified from 'Assets classified as held for sale' and a remeasurement gain of €3.6m was recorded in 'Non-trading items' to recognise the assets at their recoverable amount, which was determined using a value in use calculation.
Net interest cost on retirement benefits obligation
Finance costs
The interest rate derivative cost represents credit value adjustments to the fair values of derivative financial instruments designated in a hedge relationship of €2.7m (30 June 2016: €4.8m; 31 December 2016: a credit of €0.5m).
Finance income:
Interest payable
KERRY GROUP PLC Interim Management Report - Page 18

5. Earnings per A ordinary share
EPScent €'m
EPS cent €'m
EPS cent €'m
Basic earnings per shareProfit after taxation and attributable to owners of the parent 127.6 225.1 126.4 222.4 302.9 533.1Brand related intangible asset amortisation 6.1 10.7 5.8 10.2 13.1 23.0Non-trading items (net of related tax) 10.1 17.8 1.6 2.8 7.4 13.0
Adjusted earnings 143.8 253.6 133.8 235.4 323.4 569.1
Diluted earnings per share127.5 225.1 126.2 222.4 302.0 533.1
Adjusted earnings 143.7 253.6 133.6 235.4 322.4 569.1
Number of Number of Number ofShares Shares Shares
30 June 2017 30 June 2016 31 Dec. 2016Unaudited Unaudited Audited
Number of Shares m's m's m's
Basic weighted average number of shares 176.4 175.9 176.0Effect of dilutive potential shares 0.1 0.3 0.5
Diluted weighted average number of shares 176.5 176.2 176.5
6. Dividends
Half year Half year Yearended ended ended
30 June 2017 30 June 2016 31 Dec. 2016Unaudited Unaudited Audited
€'m €'m €'m
69.0 61.6 61.6
- - 29.6
69.0 61.6 91.2
7. Retirement benefits obligation
Half year Half year Yearended ended ended
30 June 2017 30 June 2016 31 Dec. 2016Unaudited Unaudited Audited
€'m €'m €'m
(233.8) (377.7) (352.8)Net related deferred tax asset 47.4 63.8 60.9
(186.4) (313.9) (291.9)
Since the end of the period, the Board has proposed an interim dividend of 18.80 cent per A ordinary share. The payment date for the interim dividend will be 10 November 2017 to shareholders registered on the record date as at 13 October 2017. These Condensed Consolidated Interim Financial Statements do not reflect this dividend.
Amounts recognised as distributions to equity shareholders in the periodFinal 2016 dividend of 39.20 cent per A ordinary share paid 19 May 2017(Final 2015 dividend of 35.00 cent per A ordinary share paid 13 May 2016)
Interim 2016 dividend of 16.80 cent per A ordinary share paid 18 November 2016
The net deficit recognised in the Condensed Consolidated Balance Sheet for the Group's defined benefit post retirement schemes was as follows:
Net recognised deficit in plans before deferred tax
Net recognised deficit in plans after deferred tax
At 30 June 2017, the net deficit before deferred tax for defined benefit post-retirement schemes was €233.8m (30 June 2016: €377.7m; 31 December 2016: €352.8m). This was calculated by rolling forward the defined benefit post-retirement schemes' liabilities at 31 December 2016 to reflect material movements in underlying assumptions over the period while the defined benefit post-retirement schemes' assets at 30 June 2017 are measured at market value. The decrease in the net deficit before deferred tax of €119.0m arises from good investment returns, favourable movements in discount and inflation rates and a liability management programme implemented in 2017.
Notes to the Condensed Consolidated Interim Financial Statements (continued)for the half year ended 30 June 2017
In addition to the basic and diluted earnings per share, an adjusted earnings per share is also provided as it is considered more reflective of the Group's underlying tradingperformance. Adjusted earnings is profit after taxation and attributable to owners of the parent before brand related intangible asset amortisation and non-trading items (net of relatedtax). These items are excluded in order to assist in the understanding of underlying earnings.
Profit after taxation and attributable to owners of the parent
Half year ended Half year ended Year ended 30 June 2017 30 June 2016 31 Dec. 2016
Unaudited Audited Unaudited
KERRY GROUP PLC Interim Management Report - Page 19
Notes to the Condensed Consolidated Interim Financial Statements (continued)for the half year ended 30 June 2017
8. Financial instruments
Loans & Other Financial
Assets/(Liabilities) at Amortised Cost
Liabilities at Fair Value
through Profit or Loss
Derivatives Designated as Hedging
InstrumentsTotal Net Debt
by Category€'m €'m €'m €'m
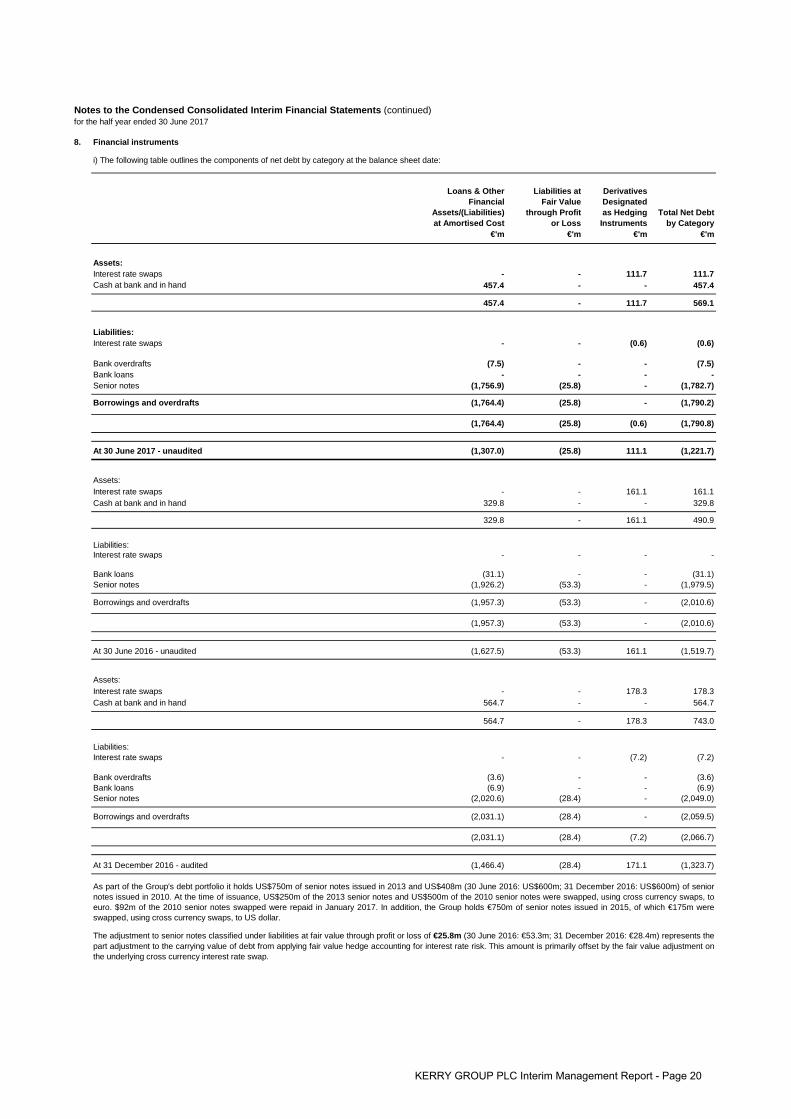
Assets:Interest rate swaps - - 111.7 111.7Cash at bank and in hand 457.4 - - 457.4
457.4 - 111.7 569.1
Liabilities:Interest rate swaps - - (0.6) (0.6)
Bank overdrafts (7.5) - - (7.5)Bank loans - - - -Senior notes (1,756.9) (25.8) - (1,782.7)
Borrowings and overdrafts (1,764.4) (25.8) - (1,790.2)
(1,764.4) (25.8) (0.6) (1,790.8)
At 30 June 2017 - unaudited (1,307.0) (25.8) 111.1 (1,221.7)
Assets:Interest rate swaps - - 161.1 161.1Cash at bank and in hand 329.8 - - 329.8
329.8 - 161.1 490.9
Liabilities:Interest rate swaps - - - -
Bank loans (31.1) - - (31.1)Senior notes (1,926.2) (53.3) - (1,979.5)
Borrowings and overdrafts (1,957.3) (53.3) - (2,010.6)
(1,957.3) (53.3) - (2,010.6)
At 30 June 2016 - unaudited (1,627.5) (53.3) 161.1 (1,519.7)
Assets:Interest rate swaps - - 178.3 178.3Cash at bank and in hand 564.7 - - 564.7
564.7 - 178.3 743.0
Liabilities:Interest rate swaps - - (7.2) (7.2)
Bank overdrafts (3.6) - - (3.6)Bank loans (6.9) - - (6.9)Senior notes (2,020.6) (28.4) - (2,049.0)
Borrowings and overdrafts (2,031.1) (28.4) - (2,059.5)
(2,031.1) (28.4) (7.2) (2,066.7)
At 31 December 2016 - audited (1,466.4) (28.4) 171.1 (1,323.7)
As part of the Group's debt portfolio it holds US$750m of senior notes issued in 2013 and US$408m (30 June 2016: US$600m; 31 December 2016: US$600m) of seniornotes issued in 2010. At the time of issuance, US$250m of the 2013 senior notes and US$500m of the 2010 senior notes were swapped, using cross currency swaps, toeuro. $92m of the 2010 senior notes swapped were repaid in January 2017. In addition, the Group holds €750m of senior notes issued in 2015, of which €175m wereswapped, using cross currency swaps, to US dollar.
The adjustment to senior notes classified under liabilities at fair value through profit or loss of €25.8m (30 June 2016: €53.3m; 31 December 2016: €28.4m) represents thepart adjustment to the carrying value of debt from applying fair value hedge accounting for interest rate risk. This amount is primarily offset by the fair value adjustment onthe underlying cross currency interest rate swap.
i) The following table outlines the components of net debt by category at the balance sheet date:
KERRY GROUP PLC Interim Management Report - Page 20

Notes to the Condensed Consolidated Interim Financial Statements (continued)for the half year ended 30 June 2017
8. Financial instruments (continued)
Pre CCS Notional CCS Post CCSHalf year ended Half year ended Half year ended Half year ended Year ended
30 June 2017 30 June 2017 30 June 2017 30 June 2016 31 Dec. 2016€'m €'m €'m €'m €'m
Euro (447.7) (401.9) (849.6) (960.4) (789.5)Sterling 165.8 - 165.8 62.1 116.8US Dollar (964.0) 401.9 (562.1) (681.6) (698.2)Other 24.2 - 24.2 60.2 47.2
(1,221.7) - (1,221.7) (1,519.7) (1,323.7)
On demand &up to 1 year Up to 2 years 2 - 5 years > 5 years Total
€'m €'m €'m €'m €'m
Cash at bank and in hand 457.4 - - - 457.4Interest rate swaps - - 76.6 34.5 111.1Bank overdrafts (7.5) - - - (7.5)Bank loans - - - - -Senior notes - - (307.5) (1,475.2) (1,782.7)
At 30 June 2017 - unaudited 449.9 - (230.9) (1,440.7) (1,221.7)
Cash at bank and in hand 329.8 - - - 329.8Interest rate swaps 19.8 - 56.8 84.5 161.1Bank loans (31.1) - - - (31.1)Senior notes (168.6) - (199.3) (1,611.6) (1,979.5)
At 30 June 2016 - unaudited 149.9 - (142.5) (1,527.1) (1,519.7)
Cash at bank and in hand 564.7 - - - 564.7Interest rate swaps 25.6 - 64.1 81.4 171.1Bank overdrafts (3.6) - - - (3.6)Bank loans (6.9) - - - (6.9)Senior notes (182.0) - (207.9) (1,659.1) (2,049.0)
At 31 December 2016 - audited 397.8 - (143.8) (1,577.7) (1,323.7)
a) Fair value of financial instruments carried at fair value
--
-
30 June 2017 30 June 2016 31 Dec. 2016Fair Value Unaudited Unaudited AuditedHierarchy €'m €'m €'m
Financial assetsInterest rate swaps Level 2 111.7 161.1 178.3Forward foreign exchange contracts Level 2 56.0 23.5 54.8Financial asset investments: Fair value through profit or loss Level 1 36.1 31.5 35.2
Available-for-sale Level 3 4.1 4.1 4.1
Financial liabilitiesInterest rate swaps Level 2 (0.6) - (7.2)Forward foreign exchange contracts Level 2 (15.7) (13.2) (21.0)
ii) The following table sets out the currency profile of the Group's net debt, highlighting the impact of cross currency swaps (CCS) on net debt:
iii) The following table details the maturity profile of the Group's net debt:
At 30 June 2017, the Group had undrawn committed bank facilities of €1,100m, comprising primarily of a revolving credit facility maturing in 2022.
iv) Fair value of financial instruments
Financial instruments recognised at fair value are analysed between those based on:quoted prices in active markets for identical assets or liabilities (Level 1);
those involving inputs for the assets or liabilities that are not based on observable market data (unobservable inputs) (Level 3).
There have been no transfers between levels and there was no movement for the financial asset investments categorised at Level 3 for the current period.
those involving inputs other than quoted prices included in Level 1 that are observable for the assets or liabilities, either directly (as prices) or indirectly (derived from prices) (Level 2); and
In April 2017, the Group exercised the second 1 year extension option on the 5 year €1,100m revolving credit facility as agreed in 2015.
KERRY GROUP PLC Interim Management Report - Page 21

Notes to the Condensed Consolidated Interim Financial Statements (continued)for the half year ended 30 June 2017
8. Financial instruments (continued)
b) Fair value of financial instruments carried at amortised cost
Carrying Fair Carrying Fair Carrying FairAmount Value Amount Value Amount Value
30 June 2017 30 June 2017 30 June 2016 30 June 2016 31 Dec. 2016 31 Dec. 2016Fair Value Unaudited Unaudited Unaudited Unaudited Audited AuditedHierarchy €'m €'m €'m €'m €'m €'m
Financial liabilitiesSenior notes - Public Level 2 (1,399.2) (1,425.0) (1,399.2) (1,481.5) (1,451.8) (1,471.0)Senior notes - Private Level 2 (357.7) (373.3) (527.0) (559.0) (568.8) (585.4)
(1,756.9) (1,798.3) (1,926.2) (2,040.5) (2,020.6) (2,056.4)
c) Valuation principles
The fair value of financial assets and liabilities are determined as follows:
--
-
9. Share capital
Half year Half year Yearended ended ended
30 June 2017 30 June 2016 31 Dec. 2016Unaudited Unaudited Audited
€'m €'m €'m
Authorised280,000,000 A ordinary shares of 12.50 cent each 35.0 35.0 35.0
Allotted, called-up and fully paid (A ordinary shares of 12.50 cent each)At beginning of the financial period 22.0 22.0 22.0Shares issued during the financial period - - -
At end of the financial period 22.0 22.0 22.0
Kerry Group plc has one class of ordinary share which carries no right to fixed income.
Shares issued during the periodDuring the period, a total of 103,175 A ordinary shares were issued at the nominal value of 12.50 cent per share under the Group's Long Term Incentive Plan and Short Term Incentive Plans.
The total number of shares in issue at 30 June 2017 was 176,114,006 (30 June 2016: 175,981,485; 31 December 2016: 176,010,831).
assets and liabilities with standard terms and conditions and traded on active liquid markets are determined with reference to quoted market prices;other financial assets and liabilities (excluding derivatives) are determined in accordance with generally accepted pricing models based on discounted cash flowanalysis using prices from observable current market transactions and dealer quotes for similar instruments; andderivative financial instruments are calculated using quoted prices. Where such prices are not available, a discounted cash flow analysis is performed using theapplicable yield curve for the duration of the instruments. Forward foreign exchange contracts are measured using quoted forward exchange rates and yieldcurves derived from quoted interest rates adjusted for counterparty credit risk, which is calculated based on credit default swaps of the respective counterparties.Interest rate swaps are measured at the present value of future cash flows estimated and discounted based on the applicable yield curves derived from quotedinterest rates adjusted for counterparty credit risk which is calculated based on credit default swaps of the respective counterparties.
Except as detailed in the following table, it is considered that the carrying amounts of financial assets and financial liabilities recognised at amortised cost in the Condensed Consolidated Interim Financial Statements approximate their fair values.
KERRY GROUP PLC Interim Management Report - Page 22

Notes to the Condensed Consolidated Interim Financial Statements (continued)for the half year ended 30 June 2017
10. Effect of exchange translation adjustments on the Condensed Consolidated Balance Sheet
Half year Half year Yearended ended ended
30 June 2017 30 June 2016 31 Dec. 2016Unaudited Unaudited Audited
€'m €'m €'m
(55.3) (33.2) (18.1)(94.5) (50.6) (28.9)
(2.7) (1.4) 0.8(31.4) (16.7) (3.4)(26.5) (13.0) (9.1)
(9.4) (2.7) (0.1)Assets classified as held for sale (0.1) (0.3) (1.0)Deferred tax assets (0.7) - 0.1
75.0 53.2 49.12.8 1.8 6.1
56.7 33.4 (23.7)7.7 5.9 12.9
10.0 5.0 (3.1)9.4 1.7 (6.4)
(0.3) 2.6 6.80.3 0.2 -
(1.8) (0.8) 0.1
(60.8) (14.9) (17.9)
11. Business combinations
12.
--
In March 2017 the Group acquired assets of Australia based Taste Master Limited, a leading flavours provider to the beverage, sweet & savoury snack and meat &culinary industries in Australia and New Zealand. In April 2017 the Group acquired China based Tianning Flavour & Fragrance Co. Ltd., which strengthens theGroup's sweet and savoury flavour development capability in the Chinese food and beverage industry. In June 2017 the Group acquired Brazil based BenAlimentos Ltda., which will allow the Group to serve increasing customer demand in the LATAM region, primarily through dry dairy technologies.
The total consideration for these acquisitions was €97.4m, including a deferred element of €8.3m. Transaction expenses related to these acquisitions were chargedagainst non-trading items in the Group's Condensed Consolidated Statement of Comprehensive Income during the period and represented less than one percentof the total consideration.
The provisional net assets acquired before combination were €37.0m and the Group recognised goodwill on these acquisitions of €60.4m. Given that the valuationof the fair value of assets and liabilities recently acquired is still in progress, these values are determined provisionally. The goodwill is attributable to the expectedprofitability, revenue growth, future market development and assembled workforce of the acquired businesses and the synergies expected to arise within the Groupafter the acquisitions. None of the goodwill is expected to be deductible for income tax purposes.
The acquisition method of accounting has been used to consolidate the businesses acquired in the Group's financial statements. Due to the fact that theseacquisitions were recently completed, the revenue and results included in the Group's reported figures are not material. For the acquisitions completed in 2016there have been no material revisions of the provisional fair value adjustments since the initial values were established.
The above exchange translation adjustments arise primarily on the retranslation of the Group's opening net investment in its foreign currency subsidiaries.
Retained earnings
Trade and other receivablesCash at bank and in hand
Decrease/(increase) in liabilitiesTrade and other payablesTax liabilitiesFinancial liabilitiesRetirement benefits obligationOther non-current liabilitiesDeferred tax liabilitiesProvisionsDeferred income
Inventories
(Decrease)/increase in assetsProperty, plant and equipmentIntangible assetsFinancial asset investments
There have been no other significant events, outside the ordinary course of business, affecting the Group since 30 June 2017.
progressed with the acquisition of the business of Hangman Flavours, based in Hangzhou, China - a leading producer of sweet and savoury flavours serving the beverage, ice cream, confectionery and snacks sectors in China.
Events after the balance sheet date
Since the period end, the Group has:proposed an interim dividend of 18.80 cent per A ordinary share (see note 6).
KERRY GROUP PLC Interim Management Report - Page 23

Notes to the Condensed Consolidated Interim Financial Statements (continued)for the half year ended 30 June 2017
13. General information
These unaudited Condensed Consolidated Interim Financial Statements for the half year ended 30 June 2017 are not full financial statements and were not reviewed by theauditors. The Board of Directors approved these Condensed Consolidated Interim Financial Statements on 9 August 2017. The figures disclosed relating to 31 December 2016have been derived from the consolidated financial statements which were audited, received an unqualified audit report and have been filed with the Registrar of Companies.
These unaudited Condensed Consolidated Interim Financial Statements have been prepared on the going concern basis. The Directors report that they have satisfiedthemselves that the Group is a going concern, having adequate resources to continue in operational existence for the foreseeable future. In forming this view, the Directorshave reviewed the Group’s budget for a period not less than 12 months, the medium term plans as set out in the rolling five year plan, and have taken into account the cashflow implications of the plans, including proposed capital expenditure, and compared these with the Group’s committed borrowing facilities and projected gearing ratios.
In relation to seasonality, trading profit is lower in the first half of the year due to the nature of the food business and stronger in December trading. While revenue is relativelyevenly spread, margin has traditionally been higher in the second half of the year due to product mix and the timing of promotional activity. There is also a material change tothe levels of working capital between December and June mainly due to the seasonal nature of the dairy and crop-based businesses.
As permitted by the Transparency (Directive 2004/109/EC) Regulations 2007 this Interim Report is available on www.kerrygroup.com. However, if a physical copy is required,please contact the Corporate Affairs department.
KERRY GROUP PLC Interim Management Report - Page 24

FINANCIAL DEFINITIONS
1. RevenueVolume growth
Revenue Reconciliation
Volume growth Price
Transaction currency
Translation currency
Acquisitions / Disposals
Reportedrevenue growth
Taste & Nutrition 4.2% 1.7% (0.1%) 0.4% 0.7% 6.9%Consumer Foods 2.3% 1.9% (1.4%) (5.6%) 0.0% (2.8%)Group 3.8% 1.8% (0.4%) (1.0%) 0.6% 4.8%
2. EBITDA
H1 2017 H1 2016€'m €'m
225.1 222.4 (0.1) (0.8)34.5 39.9 31.5 33.7 24.8 4.822.6 21.6
Depreciation (net) 68.6 66.9
EBITDA 407.0 388.5
3. Trading Profit
4. Trading Margin
5. Non-trading Items
6. Operating Profit
7. Adjusted Earnings Per Share
H1 2017 H1 2016EPS EPScent cent
Basic earnings per share 127.6 126.4Brand related intangible asset amortisation 6.1 5.8Non-trading items (net of related tax) 10.1 1.6
Adjusted earnings per share 143.8 133.8
8. Free Cash Flow
H1 2017 H1 2016€'m €'m
284.3 255.4161.0 178.8
12.5 7.0 (103.4) (73.5)
0.9 10.60.1 - 1.8 0.8
Free cash flow 357.2 379.1
9. Financial Ratios
Finance income
This represents the sales volume growth year-on-year from ongoing business, excluding volumes from acquisitions net of disposals.
Volume growth is an important metric as it is seen as the key driver of top-line business improvement. This is used as the key revenue metric, as Kerry operates a pass-through pricing model with its customers to cater for raw material price fluctuations. A full reconciliation to reported revenue growth is detailed in the revenue reconciliation below.
EBITDA represents profit after taxation and attributable to owners of the parent before finance income and costs, income taxes, depreciation (net), intangible asset amortisation and non-tradingitems.
Profit after taxation and attributable to owners of the parent
In addition to the basic and diluted earnings per share, an adjusted earnings per share is also provided as it is considered more reflective of the Group’s underlying trading performance. Adjustedearnings is profit after taxation and attributable to owners of the parent before brand related intangible asset amortisation and non-trading items (net of related tax). These items are excluded in orderto assist in the understanding of underlying earnings. A full reconciliation of adjusted earnings per share is provided in note 5 of these Condensed Consolidated Interim Financial Statements.
Finance costsIncome taxesNon-trading itemsIntangible asset amortisation
Trading Profit refers to the operating profit generated by the businesses before intangible asset amortisation and gains or losses generated from non-trading items. Trading Profit representsoperating profit before specific items that are not reflective of underlying trading performance and therefore hinder comparison of the trading performance of the Group’s businesses, either year-on-year or with other businesses.
Trading Margin represents trading profit, expressed as a percentage of revenue.
Non-trading items refers to gains or losses on the disposal of businesses, disposal of assets (non-current assets and assets classified as held for sale), costs in preparation of disposal of assets,material acquisition transaction costs and material acquisition integration and restructuring costs.
Operating profit is profit before income taxes, finance income and finance costs.
*Assets represent property, plant and equipment.
Free Cash Flow is trading profit plus depreciation, movement in average working capital, capital expenditure, pension costs less pension expense, finance costs paid (net) and income taxes paid.
Free Cash Flow is seen as an important indicator of the strength and quality of the business and of the availability to the Group of funds for reinvestment or for return to shareholders. Movement inaverage working capital is used when calculating free cash flow as management believes this provides a more accurate measure of the increase or decrease in working capital needed to supportthe business over the course of the period rather than at two distinct points in time. Movement in average working capital measures more accurately fluctuations caused by seasonality and othertiming factors. Below is a reconciliation of free cash flow to the nearest IFRS measure, which is 'Net cash from operating activities'.
Net cash from operating activitiesDifference between movement in average working capital and movement in the period end working capitalExpenditure on acquisition integration and restructuring costsPurchase of assetsProceeds from the sale of assets*Capital grants receivedExchange translation adjustment
The Net debt: EBITDA and EBITDA: Net interest ratios disclosed are calculated in accordance with lender's facility agreements using an adjusted EBITDA, adjusted finance costs (net of financeincome) and an adjusted net debt value to adjust for the impact of non-trading items, acquisitions net of disposals and deferred payments in relation to acquisitions. As outlined on page 8 theseratios are calculated in accordance with lender's facility agreements and these agreements specifically require these adjustments in the calculation.
KERRY GROUP PLC Interim Management Report - Page 25