interim management report at 300911 - en.bolzonigroup.com third quarter 2011 report.pdfbolzoni spa...
TRANSCRIPT

BBoollzzoonnii SSppAA IInntteerr iimm MMaannaaggeemmeenntt RReeppoorrtt aatt 3300..0099..22001111
1
Interim Management Report
for the Bolzoni Group
at 30 September 2011
BBoollzzoonnii SSppAA IInntteerr iimm MMaannaaggeemmeenntt RReeppoorrtt aatt 3300..0099..22001111
2
INDEX Corporate offices pg. 3 Group activity pg. 5 Group structure pg. 6 Comments of the Directors on the Company’s performance pg. 7 Accounting tables pg. 10 Explanatory notes on the Accounting Tables pg. 15 Declaration in compliance with art. 154-bis paragraph 2 of the Leg.Decree n° 58 of 24/02/2002 pg. 18

BBoollzzoonnii SSppAA IInntteerr iimm MMaannaaggeemmeenntt RReeppoorrtt aatt 3300..0099..22001111
3
Corporate offices
At the present date the assigned corporate offices are as follows:
Board of Directors:
Name and Surname Office Date appointed
Emilio Bolzoni Chairman (Executive) 21 April 2009
Roberto Scotti C.E.O. 21 April 2009
Luigi Pisani Non executive director 21 April 2009
Franco Bolzoni Non executive director 21 April 2009
Davide Turco Non executive director 21 April 2009
Karl-Peter Staack Non executive director 21 April 2009
Pier Luigi Magnelli Non executive director 21 April 2009
Paolo Mazzoni Non executive and independent director 21 April 2009
Raimondo Cinti Non executive and independent director 21 April 2009
Giovanni Salsi Non executive and independent director 21 April 2009
Board of Statutory Auditors:
Name and Surname Office Appointed on
Giorgio Picone Chairman 29 April 2010
Carlo Baldi Effective auditor 29 April 2010
Maria Gabriella Anelli Effective auditor 29 April 2010
Andrea Foschi Alternate auditor 29 April 2010
Guido Prati Alternate auditor 29 April 2010
Auditing Company:
Reconta Ernst & Young S.p.A. Appointment valid until the approval of financial report for 2011
Internal control committee:
Name and Surname Office Appointed on
Giovanni Salsi Chairman 21 April 2009
Raimondo Cinti Councillor 21 April 2009
Pier Luigi Magnelli Councillor 21 April 2009

BBoollzzoonnii SSppAA IInntteerr iimm MMaannaaggeemmeenntt RReeppoorrtt aatt 3300..0099..22001111
4
Remuneration Committee:
Name and Surname Office Appointed on
Pier Luigi Magnelli Chairman 21 April 2009
Giovanni Salsi Councillor 21 April 2009
Raimondo Cinti Councillor 21 April 2009
Supervisory Board ex. DLgs 231/01 :
Name and Surname Office Appointed on
Raimondo Cinti Chairman 21 April 2009
Pier Luigi Magnelli Councillor 21 April 2009
Giovanni Salsi Councillor 21 April 2009

BBoollzzoonnii SSppAA IInntteerr iimm MMaannaaggeemmeenntt RReeppoorrtt aatt 3300..0099..22001111
5
Group activity For over sixty years the Bolzoni Group has been active in the design, production and distribution of lift truck attachments and industrial material handling equipment.
The Company therefore operates in a segment with a close connection to logistics and to its global development.
Today Bolzoni is present in over forty countries worldwide. Its products hold the leading position in the European market for lift truck attachments and it is the second largest worldwide manufacturer in this sector.
The Group offers a wide range of products utilized in the industrial material handling and, in particular, lift truck attachments, lifting platforms and forks for lift trucks.
The following diagram shows the various locations of the Group companies throughout the world:
Indipendent distributor
Associated company
Commercial subsidiary
Production sites
ExclusiveDistributors
Meyer Group

BBoollzzoonnii SSppAA IInntteerr iimm MMaannaaggeemmeenntt RReeppoorrtt aatt 3300..0099..22001111
6
Group structure Bolzoni S.p.A. controls, either directly or indirectly, twenty-two companies, all included in the Group’s consolidation area, and located in various countries worldwide. Eight of these companies (including the Parent and the recently incorporated, but not yet operational, Bolzoni Huaxin China and Bolzoni Auramo Wuxi) are production plants situated in Italy, Germany, Finland, U.S.A. and China whereas fourteen companies have exclusively commercial and distributive activities, with the purpose of directly serving the principal logistics and material handling markets all over the world. Either through subsidiaries or associated companies, the Group is present in many countries which all together represent 80% of the specific world market.
Bolzoni Spa Headquarters
Italy
Auramo OY Finland 100%
Bolzoni Holding Hong Kong
80%
Meyer OOO Russia 80%
Meyer Ltd UK
100%
Bolzoni Auramo Wuxi China 100%
Meyer Sarl France 100%
Bolzoni Auramo Zoo Polska 60%
Auramo ZA South Africa
40%
Meyer Gmbh Germany 100%
Bolzoni Auramo
Shanghai China 60%
Bolzoni Auramo BV Holland 51%
Bolzoni Auramo GMBH Germany 100%
Bolzoni Auramo AB Sweden 100%
Bolzoni Auramo Ltd UK
100%
Bolzoni Auramo Sarl France 100%
Bolzoni Auramo Ltd Canada 100%
Bolzoni Auramo SL Spain 100%
Bolzoni Auramo Srl Italy 100%
Bolzoni Auramo Inc USA 100%
Bolzoni Auramo Pty Australia 100%
Meyer Srl Italy 100%
Eurolift Pty Australia 100%
Bolzoni Huaxin China 60%
Xin Huaxin China 20%
BBoollzzoonnii SSppAA IInntteerr iimm MMaannaaggeemmeenntt RReeppoorrtt aatt 3300..0099..22001111
7
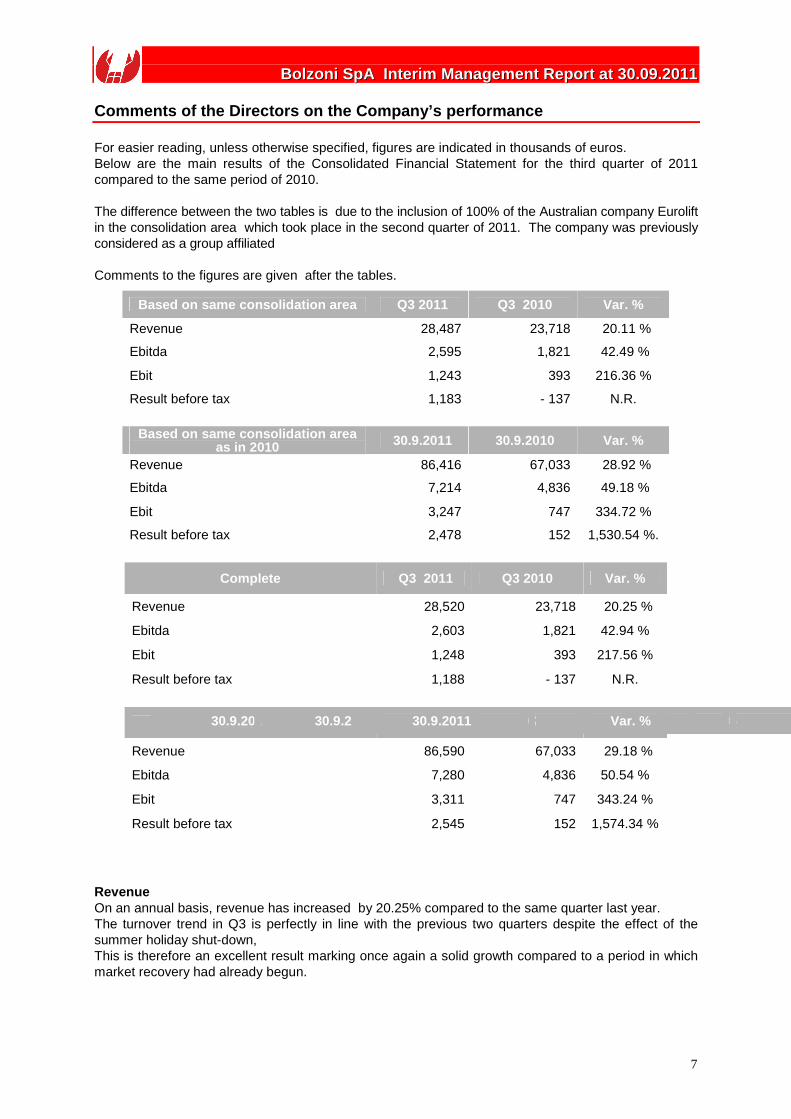
Comments of the Directors on the Company’s performa nce For easier reading, unless otherwise specified, figures are indicated in thousands of euros. Below are the main results of the Consolidated Financial Statement for the third quarter of 2011 compared to the same period of 2010. The difference between the two tables is due to the inclusion of 100% of the Australian company Eurolift in the consolidation area which took place in the second quarter of 2011. The company was previously considered as a group affiliated Comments to the figures are given after the tables.
Based on same consolidation area Q3 2011 Q3 2010 Var. %
Revenue 28,487 23,718 20.11 %
Ebitda 2,595 1,821 42.49 %
Ebit 1,243 393 216.36 %
Result before tax 1,183 - 137 N.R.
Based on same consolidation area
as in 2010 30.9.2011 30.9.2010 Var. %
Revenue 86,416 67,033 28.92 %
Ebitda 7,214 4,836 49.18 %
Ebit 3,247 747 334.72 %
Result before tax 2,478 152 1,530.54 %.
Complete Q3 2011 Q3 2010 Var. %
Revenue 28,520 23,718 20.25 %
Ebitda 2,603 1,821 42.94 %
Ebit 1,248 393 217.56 %
Result before tax 1,188 - 137 N.R.
Complete 30.9.2011 30.9.2011 Var. %
30.9.2011 30.9.2010 Var. %
30.9.2011 Var. %
Revenue 86,590 67,033 29.18 %
Ebitda 7,280 4,836 50.54 %
Ebit 3,311 747 343.24 %
Result before tax 2,545 152 1,574.34 %
Revenue On an annual basis, revenue has increased by 20.25% compared to the same quarter last year. The turnover trend in Q3 is perfectly in line with the previous two quarters despite the effect of the summer holiday shut-down, This is therefore an excellent result marking once again a solid growth compared to a period in which market recovery had already begun.

BBoollzzoonnii SSppAA IInntteerr iimm MMaannaaggeemmeenntt RReeppoorrtt aatt 3300..0099..22001111
8
Trends in the benchmark market To support the analysis on revenue, below we are presenting the trend recorded by our benchmark market, that is to say fork lift truck sales in various areas. The figures refer to sales in the first nine months of 2011 compared to the same period of the past year. - W. Europe + 35.11 % - N. America + 36.21 % - China + 24.28 % - World + 29.05 % Growth is therefore confirmed in our benchmark market both in Europe and in the other areas. Compared to the trend in the first semester a slowing down in growth has been noticed even if the percentages remain decidedly positive. Market Share The growth of our Group continues to be in line with that of our benchmark market. Dollar exchange rate The exact exchange rate of the Dollar against the Euro which on 31.12.2010 was 1.34 has decreased to 1.35 at 30.9.2011 with an average exchange rate of 1.41. At 30 September we have a positive result of 143,000 euros whereas for the same period in 2010 there was a negative fluctuation of 66,000 euros. EBITDA The following shows the trend in Ebitda during the two periods under examination:
Q 3 30.09
% Ebitda on turnover – 2010 7.68 % 7.21 %
% Ebitda based on same consolidation area - 2011 9.11 % 8.35 %
% Ebitda on turnover – 2011 9.13% 8.41 %
From a comparison of the two periods under examination , Ebitda has passed from 1,821,000 euros in third quarter 2010 to 2,603,000 euros in the third quarter 2011. This is a significant improvement. Most important is the percentage Ebitda value which has risen from 7.68% to 9.13%, even higher than the figure for the first semester which was 8.05% Result before tax The quarter closes with a profit before tax of 1,188,000 euros. In the third quarter of 2010 the loss before tax amounted to 137,000 euros. The improvement compared to the last financial year is evident but it is also evident that the situation has speeded up since the first semester where the result before tax for the entire semester amounted to 1,357,000 for a total at the end of the period of 2,545,000 euros.
BBoollzzoonnii SSppAA IInntteerr iimm MMaannaaggeemmeenntt RReeppoorrtt aatt 3300..0099..22001111
9
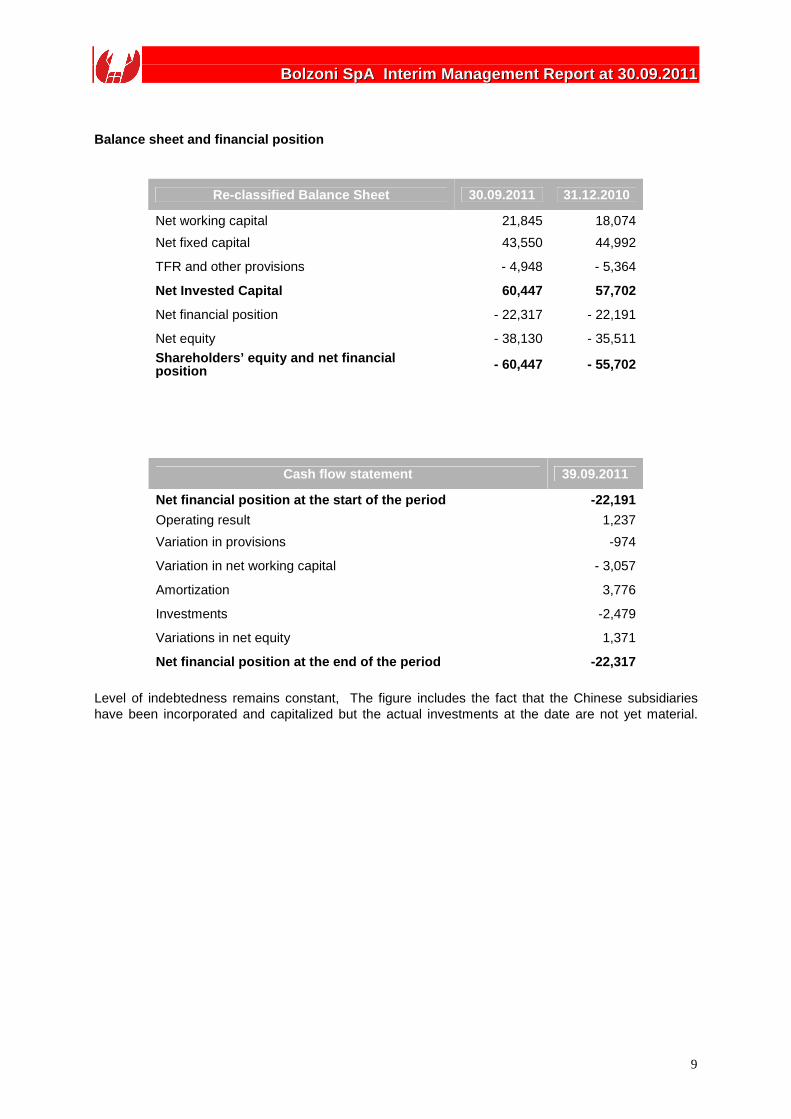
Balance sheet and financial position
Re-classified Balance Sheet 30.09.2011 31.12.2010
Net working capital 21,845 18,074
Net fixed capital 43,550 44,992
TFR and other provisions - 4,948 - 5,364
Net Invested Capital 60,447 57,702
Net financial position - 22,317 - 22,191
Net equity - 38,130 - 35,511
Shareholders’ equity and net financial position - 60,447 - 55,702
Cash flow statement 39.09.2011
Net financial position at the start of the period -22,191
Operating result 1,237
Variation in provisions -974
Variation in net working capital - 3,057
Amortization 3,776
Investments -2,479
Variations in net equity 1,371
Net financial position at the end of the period -22 ,317
Level of indebtedness remains constant, The figure includes the fact that the Chinese subsidiaries have been incorporated and capitalized but the actual investments at the date are not yet material.
BBoollzzoonnii SSppAA IInntteerr iimm MMaannaaggeemmeenntt RReeppoorrtt aatt 3300..0099..22001111
10
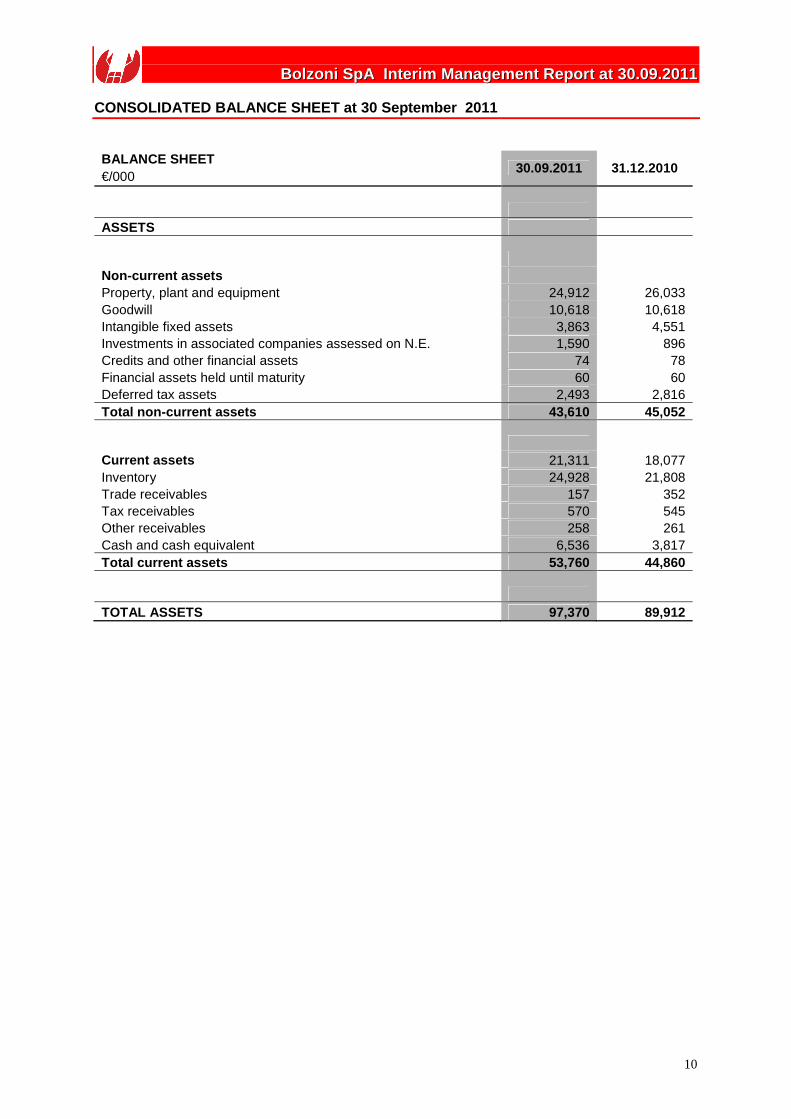
CONSOLIDATED BALANCE SHEET at 30 September 2011
BALANCE SHEET 30.09.2011 31.12.2010
€/000 ASSETS Non-current assets Property, plant and equipment 24,912 26,033 Goodwill 10,618 10,618 Intangible fixed assets 3,863 4,551 Investments in associated companies assessed on N.E. 1,590 896 Credits and other financial assets 74 78 Financial assets held until maturity 60 60 Deferred tax assets 2,493 2,816 Total non-current assets 43,610 45,052 Current assets 21,311 18,077 Inventory 24,928 21,808 Trade receivables 157 352 Tax receivables 570 545 Other receivables 258 261 Cash and cash equivalent 6,536 3,817 Total current assets 53,760 44,860 TOTAL ASSETS 97,370 89,912

BBoollzzoonnii SSppAA IInntteerr iimm MMaannaaggeemmeenntt RReeppoorrtt aatt 3300..0099..22001111
11
CONSOLIDATED BALANCE SHEET at 30 September 2011 BALANCE SHEET
30.09.2011 31.12.2010 €/000 GROUP NET EQUITY Share capital 6,498 6,498 Reserves 27,913 28,472 Result of the period 1,237 (438)
TOTAL GROUP NET EQUITY 35,648 34,532 NET THIRD PARTY EQUITY Capital, reserves and retained earnings 2,383 905 Result of the period 99 74 TOTAL NET GROUP AND THIRD PARTY EQUITY 38,130 35,511 LIABILITIES Non-current liabilities Long term loans 14,523 13,288 T.F.R. provision (retirement allowance) 2,881 3,033 Deferred tax liability 1,679 1,620 Contingency and expenses provisions 180 165 Other long-term liabilities 208 546
Total non-current liabilities 19,471 18,652 Current liabilities Trade payables 18,338 16,222 Payables to banks and current portion of long-term loans 14,648 13,041 Other payables 5,125 4,955 Tax payables 1,058 1,010 Current portion of contingency provision 600 521 Total current liabilities 39,769 35,749 TOTAL LIABILITIES 59,240 54,401 TOTAL NET EQUITY AND LIABILITIES 97,370 89,912

BBoollzzoonnii SSppAA IInntteerr iimm MMaannaaggeemmeenntt RReeppoorrtt aatt 3300..0099..22001111
12
CONSOLIDATED INCOME STATEMENT FOR THE THIRD QUARTER
INCOME STATEMENT Q3 2011 Q3 2010
Var % €/000 2011 vs 2010 Net sales 28,520 23,718 20.25% Other income 369 177 108.47% Total revenues 28,889 23,895 20,90% Cost of raw material and purchased goods (12,994) (9,846) 31.97% Cost of services (5,634) (4,963) 13.52% Personnel costs (7,429) (7,071) 5.06% Other operating costs (183) (208) (12.02%) Result of associates accounted for under N.E. (46) 14 N.R. EBITDA 2,603 1,821 42.94% Depreciation and amortization (1,288) (1,308) (1.53%) Accruals and impairment losses (67) (120) (44.17%) EBIT 1,248 393 217.56% Financial income and expenses (351) (123) 185.37% Gain or loss from foreign currency translation 291 (407) N.R. Result before income tax 1,188 (137) N.R. Income tax (474) (258) 83.72% Result for the period 714 (395) N.R.
CONSOLIDATED INCOME STATEMENT AT 30 SEPTEMBER
INCOME STATEMENT 30.09.2011 30.09.2010
Var % €/000 2011 vs 2010 Net sales 86,590 67,033 29.18% Other income 1,009 546 84.80% Total revenues 87,599 67,579 29,62% Cost of raw material and purchased goods (38,910) (27,302) 42.52% Cost of services (17,094) (13,945) 22.58% Personnel costs (23,562) (21,038) 12.00% Other operating costs (685) (567) 20.81% Result of associates accounted for under N.E. (68) 109 N.R. EBITDA 7,280 4,836 50.54% Depreciation and amortization (3,776) (3,836) (1.56%) Accruals and impairment losses (193) (253) (23.72%) EBIT 3,311 747 343.24% Financial income and expenses (909) (529) 71.83% Gain or loss from foreign currency translation 143 (66) N.R. Result before income tax 2,545 152 N.R. Income tax (1,209) (506) 138.93% Result for the period 1,336 (354) N.R.

BBoollzzoonnii SSppAA IInntteerr iimm MMaannaaggeemmeenntt RReeppoorrtt aatt 3300..0099..22001111
13
STATEMENT OF COMPREHENSIVE INCOME AT 30 SEPTEMBER STATEMENT OF COMPREHENSIVE INCOME 30.09.2011 30.09.2010 €/000 Result for the period before tax (A) 1,336 (354) Profit/(loss) resulting from the conversion of financial reports of foreign companies
(9) 70
Total Other profit/(loss) (B) (9) 70 Overall result before tax (A + B) 1,327 (284)
NET FINANCIAL POSITION at 30 September 2010, at 31 December 2010 and at 30 September 2011
NET FINANCIAL POSITION 30.09.2010 31.12.2010 31.09.2011
A. Cash on hand 12 9 8
B. Liquid funds 3,852 3,808 6,528
D. LIQUID ASSETS 3,864 3,817 6,536
E. Financial credits 0 261 258
F. Current bank debts (7,586) (8,196) (10,153)
G. Current part of non-current indebtedness (5,077) (4,845) (4,495)
I. CURRENT FINANCIAL INDEBTEDNESS (12,663) (12,780) (14,390)
J. CURRENT NET FINANCIAL POSITION (8,799) (8,963) (7,854)
Assets held to maturity 60 60 60
K. Non-current financial debts (14,532) (13,288) (14,523)
N. NON-CURRENT NET FINANCIAL POSITION (14,472) (13,228) (14,463)
NET FINANCIAL POSITION (NET FINANCIAL INDEBTEDNESS) (23,271) (22,191) (22,317)

BBoollzzoonnii SSppAA IInntteerr iimm MMaannaaggeemmeenntt RReeppoorrtt aatt 3300..0099..22001111
14
STATEMENT OF CHANGES IN CONSOLIDATED NET EQUITY for year ended 31 December 2010 and at 30 September 2011
Capital Share prem. res.
Legal Reserve
Retained earnings
Transl. diff.
Year result
Total N.E. for Group
Minority interests
Minor. Result
Total Net Equity
Balances as at 31.12.2009 6,498 17,544 1,284 18,942 -1,331 -8,312 34,625 906 -14 35,517
Result for the period - - - - - -405 -405 - 51 -354
Other overall profit/loss - - - - 70 - 70 - - 70
Total overall profit/loss - - - - 70 -405 -335 - 51 -284 Allocation of net income - - - -8,312 - 8,312 - -14 14 -
Variation in consolid.area - - - 136 - - 136 - - 136 Others - - - 5 327 - 332 37 - 369
Balances as at 30.09.2010 6,498 17,544 1,284 10,771 -934 -405 34,758 929 51 35,738
Balances as at 31.12.2010 6,498 17,544 1,284 10,497 -853 -438 34,532 905 74 35,511
Result for the period - - - - - 1,237 1,237 - 99 1,336
Other overall profit/loss - - - - -9 - -9 - - -9
Total overall profit/loss - - - - -9 1,237 1,228 - 99 1,327
Result allocation - - 21 -459 - 438 - 74 -74 -
Dividends - - - - - - - -30 - -30
Variation in consolid.area - - - -208 - - -208 1,396 - 1,188
Other movements - - - 122 -26 - 96 38 - 134
Balances as at 30.09.2011 6,498 17,544 1,305 9,952 -888 1,237 35,648 2,383 99 38,130
BBoollzzoonnii SSppAA IInntteerr iimm MMaannaaggeemmeenntt RReeppoorrtt aatt 3300..0099..22001111
15
EXPLANATORY NOTES SPECIFIC TO THIS INTERIM MANAGEME NT REPORT
1. Introduction
The consolidated interim management report at 30 September 2011 has been drawn up in accordance with the contents of Appendix 3D of the ‘Regolamento Emittenti’ (Italian regulations for Issuers). The same accounting standards adopted for the preparation of the consolidated financial statement for the Bolzoni Group at 31 December 2010 have also been applied, without any modification, to the preparation of this consolidated interim management report for quarter ended 30 September 2011. This report should be read together with the Consolidated Financial Statement for the Bolzoni Group at 31.12.2010. The result achieved at 30 September 2011 is not representative of the result the Group may achieve for the financial year ending 31 December 2011. The figures given in the following notes are expressed in thousands of euros, unless otherwise specified.
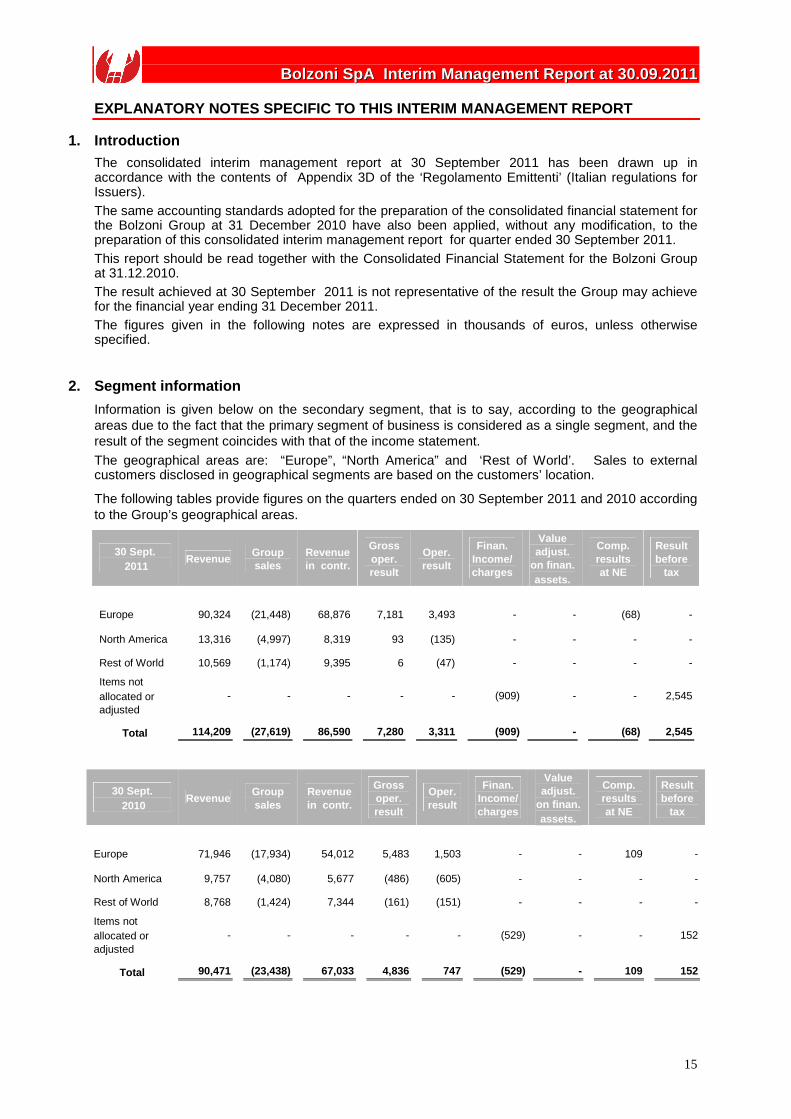
2. Segment information
Information is given below on the secondary segment, that is to say, according to the geographical areas due to the fact that the primary segment of business is considered as a single segment, and the result of the segment coincides with that of the income statement.
The geographical areas are: “Europe”, “North America” and ‘Rest of World’. Sales to external customers disclosed in geographical segments are based on the customers’ location.
The following tables provide figures on the quarters ended on 30 September 2011 and 2010 according to the Group’s geographical areas.
30 Sept. 2011
Revenue Group sales
Revenue in contr.
Gross oper. result
Oper. result
Finan. Income/charges
Value adjust.
on finan. assets.
Comp. results at NE
Result before
tax
Europe 90,324 (21,448) 68,876 7,181 3,493 - - (68) -
North America 13,316 (4,997) 8,319 93 (135) - - - -
Rest of World 10,569 (1,174) 9,395 6 (47) - - - -
Items not allocated or adjusted
- - - - - (909) - - 2,545
Total 114,209 (27,619) 86,590 7,280 3,311 (909) - (68) 2,545
30 Sept. 2010
Revenue Group sales
Revenue in contr.
Gross oper. result
Oper. result
Finan. Income/charges
Value adjust.
on finan. assets.
Comp. results at NE
Result before
tax
Europe 71,946 (17,934) 54,012 5,483 1,503 - - 109 -
North America 9,757 (4,080) 5,677 (486) (605) - - - -
Rest of World 8,768 (1,424) 7,344 (161) (151) - - - -
Items not allocated or adjusted
- - - - - (529) - - 152
Total 90,471 (23,438) 67,033 4,836 747 (529) - 109 152

BBoollzzoonnii SSppAA IInntteerr iimm MMaannaaggeemmeenntt RReeppoorrtt aatt 3300..0099..22001111
16
3. Interest bearing loans and borrowings
Actual interest rate % Maturity 30.09.2011 31.12.2010
Short term Bank overdrafts On request 140 95 Advance on collectable bills subject
to final payment and foreign adv. 30-90 days 4,801 2,246
Loans to subsidiaries 5,963 5,855 Euro 2,500,000 unsecured loan (1) Euribor +0.40 2011 - 978 Euro 8,500,000 unsecured loan (2) Euribor +0.30 2011 1,457 1,839 Euro 4,500,000 unsecured loan (3) Euribor +0.25 2011 656 1,125 Euro 8,000,000 unsecured loan (4) Euribor +1.30 2011 1,000 500 Euro 6,000,000 mortgage loan (5) Euribor +1.50 2011 631 403 14,648 13,041 Medium/long term Euro 3,000,000 unsecured loan (3) Euribor +0.25 2012 - 375 Euro 2,500,000 unsecured loan (2) Euribor +0.30 2012 - 954 Euro 1,500,000 unsecured loan (3) Euribor +0.25 2013 281 469 Euro 2,000,000 unsecured loan (4) Euribor +1.30 2014 1,250 1,500 Euro 2,000,000 unsecured loan (4) Euribor +1.30 2015 1,250 1,750 Euro 4,000,000 unsecured loan (4) Euribor +1.30 2016 3,969 - Euro 6,000,000 mortgage loan (5) Euribor +1.50 2019 4,745 5,174 Other loans 3,028 3,066 14,523 13,288
Bank overdrafts, advances subject to final payment and foreign advances
Bank overdrafts, advances subject to final payment and foreign advances refer mainly to the Parent and the Spanish subsidiary
Foreign subsidiary loans Short term loans to foreign subsidiaries are: • 0.4 million dollar loan obtained by the subsidiary Bolzoni Auramo Inc.; • 0.7 million euro loan obtained by the subsidiary Bolzoni Auramo GmbH; • 2.2 million euro loan obtained by the subsidiary Auramo OY; • 2.7 million euro loan obtained by the subsidiary Meyer GmbH.
2,500,000 euro unsecured loan (1) The loan was unsecured and has been totally repayed.
8,500,000 euro unsecured loans (2) The loans are unsecured and repayable in half-yearly instalments. Over the next 12 months all the loans will be completely repayed.
4,500,000 euro unsecured loans (3) The loans are unsecured and repayable in half-yearly instalments.
8,000,000 euro unsecured loans (4) The loans are unsecured and repayable in half-yearly instalments.
6,000,000 euro mortgage loans (5) The loans, secured by a mortgage on the property in Podenzano, are repayable in half-yearly instalments Other loans These consist of: • 2.7 million euro loan obtained by subsidiary Meyer GmbH; • 0.3 million euro loans obtained by other Group companies. All loans obtained by the subsidiary companies are secured by comfort letters given by the parent.
BBoollzzoonnii SSppAA IInntteerr iimm MMaannaaggeemmeenntt RReeppoorrtt aatt 3300..0099..22001111
17
4. Financial risk management The main risk factors have not undergone any significant changes since the information given in the Consolidated Financial Statement at 31 December 2010.
5. Events after 30 September 2011
The company structure of our Group in China has been completely defined with the Hong Kong holding owned by our Group for 80% and the other 20% share held by the Tiger Group and with two other investments in Joint Ventures with the Hauxin company resulting in a 20% share in Xin Hauaxin and 60% in Bolzoni Huaxin. A detailed description of the operation is available on our company web-site. Other than the above, since 30 September 2011 and up to the present day, no other important events have occurred with a significant impact on the figures contained in this interim management report.
Podenzano, November 11th, 2011 On behalf of the Board of Directors
The Chairman Emilio Bolzoni
