interfacial reaction studies of cr, ni, ti, and pt metallization on inp
TRANSCRIPT

Interfacial reaction studies of Cr, Ni, Ti, and Pt metallization on InPLeif Persson, Mohamed El Bouanani, Mikael Hult, Harry J. Whitlow, Margaretha Andersson et al. Citation: J. Appl. Phys. 80, 3346 (1996); doi: 10.1063/1.363246 View online: http://dx.doi.org/10.1063/1.363246 View Table of Contents: http://jap.aip.org/resource/1/JAPIAU/v80/i6 Published by the American Institute of Physics. Related ArticlesComposition dependent bilayer atomic ordering in AlxGa1−xN films examined by polarization-dependentextended x-ray absorption fine structure Appl. Phys. Lett. 100, 162105 (2012) Analysis of lattice site occupancy in kesterite structure of Cu2ZnSnS4 films using synchrotron radiation x-raydiffraction J. Appl. Phys. 110, 074511 (2011) Distribution of bismuth atoms in epitaxial GaAsBi Appl. Phys. Lett. 98, 101902 (2011) Growth kinetics and compositional analysis of silicon rich a-SiNx:H film: A soft x-ray reflectivity study Appl. Phys. Lett. 97, 151906 (2010) Epitaxial graphene on cubic SiC(111)/Si(111) substrate Appl. Phys. Lett. 96, 191910 (2010) Additional information on J. Appl. Phys.Journal Homepage: http://jap.aip.org/ Journal Information: http://jap.aip.org/about/about_the_journal Top downloads: http://jap.aip.org/features/most_downloaded Information for Authors: http://jap.aip.org/authors
Downloaded 08 Jun 2012 to 128.148.252.35. Redistribution subject to AIP license or copyright; see http://jap.aip.org/about/rights_and_permissions

Interfacial reaction studies of Cr, Ni, Ti, and Pt metallization on InPLeif Persson,a) Mohamed El Bouanani,b) Mikael Hult,a) and Harry J. WhitlowDepartment of Nuclear Physics, Lund Institute of Technology, Box 118, S-22100 Lund, Sweden
Margaretha AnderssonUppsala University, Department of Inorganic Chemistry, Box 531, S-751 21 Uppsala, Sweden
Ian F. Bubb, Peter N. Johnston, and Scott R. WalkerDepartment of Applied Physics, Royal Melbourne Institute of Technology, GPO Box 2476V, Melbourne3001, Australia
David D. Cohen and Nick DytlewskiAustralian Nuclear Science and Technology Organisation, PMB 1, Menai 2234, Lucas Heights, Australia
Carina Zaringc) and Mikael OstlingDepartment of Electronics, Solid State Electronics, Royal Institute of Technology, P.O. Box Electrum 229,S-164 40 Kista, Sweden
~Received 5 December 1995; accepted for publication 13 June 1996!
Interfacial reactions between~100! InP and thin films of the transition metals Cr, Ni, Pt, and Ti havebeen studied. A thin layer of metal was deposited onto the InP substrates usinge-beam evaporationand parts of the samples were then subjected to heat treatment in vacuum for 30 min at severaltemperatures up to 500 °C. Separate characterizations of the metal, In, and P depth distributionswere carried out using mass and energy dispersive recoil spectrometry. The different crystallinephases observed were determined using x-ray diffraction. The near-noble metals~Ni, Pt! formedternary phases, while Ti and Cr formed phosphides. The phases formed were generally stable up to500 °C with the major exception being Pt where the ternary phase decomposed to form PtIn2, PtP2,and Pt3In7. © 1996 American Institute of Physics.@S0021-8979~96!06418-3#
i
r
a
s
lib-ed.
ss.
yersl/nsle,ichtltglyy behaseof
din
en
by
es-forbed
le-
I. INTRODUCTION
The formation of ohmic and rectifying contacts on semconductor devices is a crucial step in their fabrication. Moof the work carried out on compound semiconductors upnow has been concentrated on GaAs devices but InPother III–V semiconductors have started to attract considable interest because of their electrical and optical propertUnlike the case for elemental semiconductors, most elemtal metals react readily with compound semiconductors.order to elucidate what compounds can be expected tostable one has to know how the behavior of the thin-filsystem differs from that predicted by the metal-III–V ternaphase diagram. The difference stems from the fact thatreactions of thin metal films with III–V semiconductors differ from the conditions under which equilibrium phase digrams are measured. Namely:
~i! The starting point for the phase formation is metplus III–V semiconductor rather than a single phaliquid solution or the pure elements, which is oftethe case when determining equilibrium phase digrams.
~ii ! The amount of metal is limited because of the etremely small mass of the metallic film while the supply of group III and V elements is essentially infinite
~iii ! In practical technological situations the system is n
a!Present address: CEC-JRC-IRMM, Retieseweg, B-2440 Geel, BelgiuElectronic mail: [email protected]
b!Dept. of Appl. Phys., RMIT, GPO Box 2476V, Melbourne, Australia.c!Ericsson Components AB, Opto and RF Power Products, Isafjordsga16, S-164 81 Kista-Stockholm, Sweden
3346 J. Appl. Phys. 80 (6), 15 September 1996 0021-8979
Downloaded 08 Jun 2012 to 128.148.252.35. Redistribution subject to AIP
i-sttoander-es.en-Inbemythe--
alena-
x--.ot
closed, unlike the case when determining the equirium phase diagram, but is open, or at best cappSome elements have a high vapor pressure~e.g., P,As, Sb! and so may be volatile and susceptible to lo
Using a metal on semiconductor starting system~i! it ispossible that metastable phases and formation of lawhich inhibit atomic transport across the metasemiconductor interface may lead to significant deviatiofrom the equilibrium phase diagram case. For exampgroup III and V elements may be bound in compounds whinhibit formation of metal-III or metal-V compounds thawould form on cooling from a liquid melt. The potentiaopenness of the system~iii ! is another source of significandifference. Unless in this case the phosphorous is stronbound in a stable ternary phase or metal-phosphide it malost, as is the case for Pd/InP where the stable ternary pis not found at 500 °C resulting in loss of P and formationa single layer of PdIn.1,2
It has been shown3 that a stable contact may be formeby depositing a metal-III or metal-V compound that isequilibrium with the underlying III–V semiconductor. Acomprehensive overview of GaAs metallization has bepresented by Palmstro”m and Morgan4 and recently the met-allurgical aspects of ohmic contacts to InP were reviewedIvey and Jian.5
This work was part of a systematic study aimed at invtigating the stability of planar nonalloyed contacts to InPoptoelectronic applications. The Pd/InP system is descriin a separate article.2 Three of the metals chosen, Cr,6,7
Ni,8–11 and Ti, are very reactive and readily form stabphosphides. The other metal, Pt,12,13 is generally not as reac
m;
tan
/96/80(6)/3346/9/$10.00 © 1996 American Institute of Physics
license or copyright; see http://jap.aip.org/about/rights_and_permissions

e
s
e
n
i
s
u
t
rd-erlti--
dtain-unt-unt-e in
RSfor
s inting
tive, and according to the binary equilibrium phase diagraforms PtP2 as well as a series of Pt-In intermetallic compounds.
II. EXPERIMENTAL METHODS
A. Sample preparation
The samples were prepared using single crystal~100!-InP substrates. Thin layers of metal were deposited usingelectron beam evaporation technique. Four transition mewere chosen for investigation, Cr, Ni, Pt, and Ti. The melayers were approximately 50 nm thick. The samples wsubsequently heat treated for 30 min in a resistance furnat a pressure of about 1.331025 Pa. The heat treatment temperatures were varied between 100 and 500 °C in step50 °C for the Cr and Ti samples, whereas, the Ni andsamples were heat treated at 250, 350, and 500 °C.
B. X-ray diffraction measurements
Chemical phase analysis was performed with a SiemKristalloflex D5000 diffractometer operating inu–2u modefor the Cr/InP and Ti/InP systems. For the Ni/InP and Pt/Isystems the diffractometer was operated in grazing incidemode. In view of the fact that the thin films can have cosiderable strain and preferential orientation, the intensitythe diffraction lines was disregarded and only the posit~interplanar spacing! information was used to identify thechemical phases in the films.
C. Recoil spectrometry measurements
The ANTARES ~Australian National Tandem for Ap-plied Research! Tandem Accelerator at Lucas Heights, Autralia, was employed to produce the ions for the recoil eperiments. Recoil spectrometry~RS!14 is an elemental depthprofiling technique that is quite similar to conventional Rtherford backscattering spectrometry~RBS! with the signifi-cant difference that the recoiling target atom is detecrather than the scattered ion. Since the detected particle is
FIG. 1. Layout of the two experimental setups used in the RS experimeThe incoming ion beam was a 77 MeV127I101 beam for the Ni and Ptsystems while a 84 MeV127I111 beam was used for Cr and Ti. The flighlengthL was 0.4375 and 0.495 m, respectively. T1 and T2 are the carbfoil time detectors while E is the silicon diode energy detector.
J. Appl. Phys., Vol. 80, No. 6, 15 September 1996
Downloaded 08 Jun 2012 to 128.148.252.35. Redistribution subject to AIP
ms-
antalstalreace-ofPt
ns
Pncen-ofon
-x-
-
edthe
recoiling target atom instead of the backscattered bombaing ion it is possible to separate the different recoils by eiththeir mass or their nuclear charge by using suitable mudispersive detectors.15,16Detection of the recoiling target at
nts.
ton-
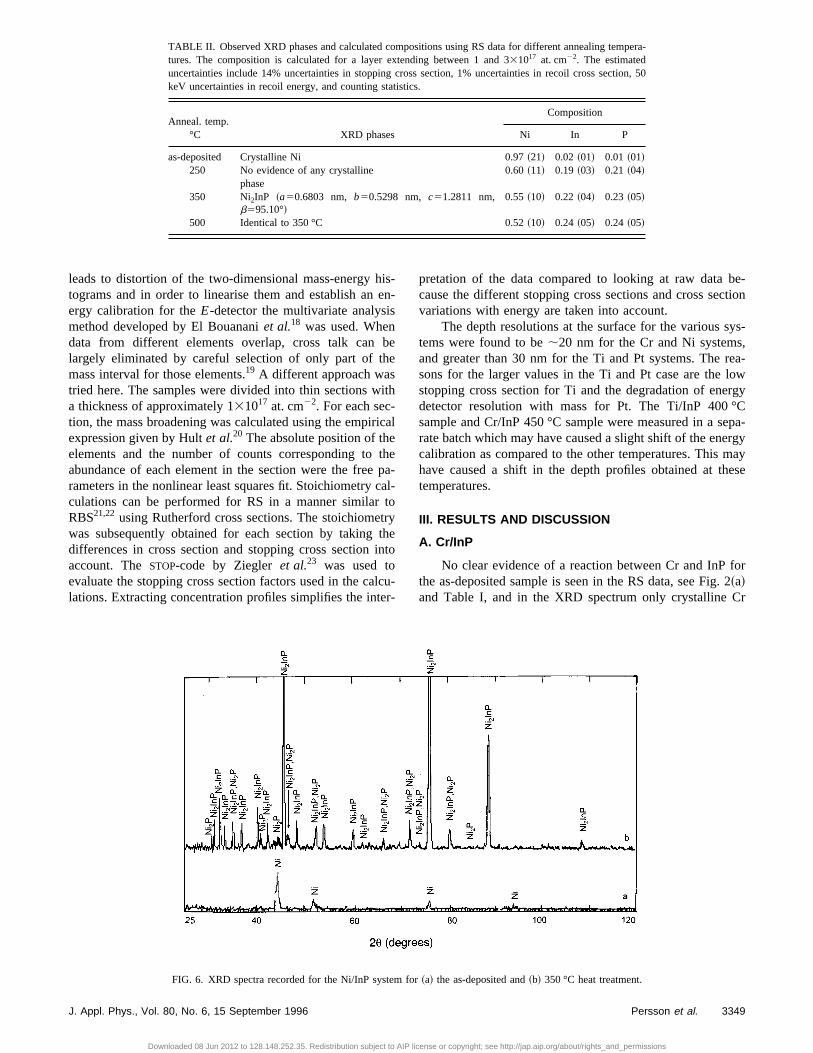
FIG. 2. The depth distributions for Cr, In, and P for:~a! as-deposited,~b!heat treated at 450 °C, and~c! 500 °C. The error bars for the as-depositesample include 14% uncertainties in stopping cross section, 1% uncerties in recoil cross section, 50 keV uncertainties in recoil energy, and coing statistics. The errors bars for the other temperatures only include coing statistics because the interesting information is the relative changstoichiometry with increasing temperature.
TABLE I. Observed XRD phases and calculated compositions usingdata for different annealing temperatures. The composition is calculateda layer extending between 1 and 331017 at. cm22. The estimated uncertain-ties include 14% uncertainties in stopping cross section, 1% uncertaintierecoil cross section, 50 keV uncertainties in recoil energy, and counstatistics.
Anneal temp.°C XRD phases
Composition
Cr In P
as-deposited Crystalline Cr 0.93~19! 0.03 ~01! 0.04 ~01!200 Cr, In 0.93~17! 0.03 ~01! 0.04 ~01!300 Cr, In, CrP, and Cr12P7 0.93 ~17! 0.04 ~01! 0.03 ~01!350 Cr, In, CrP, and Cr12P7 0.91 ~16! 0.03 ~01! 0.06 ~01!400 Cr, In, CrP 0.89~16! 0.03 ~01! 0.08 ~02!450 Cr, In, CrP 0.73~12! 0.05 ~01! 0.22 ~04!500 In, CrP 0.44~07! 0.24 ~04! 0.32 ~06!
3347Persson et al.
license or copyright; see http://jap.aip.org/about/rights_and_permissions
r
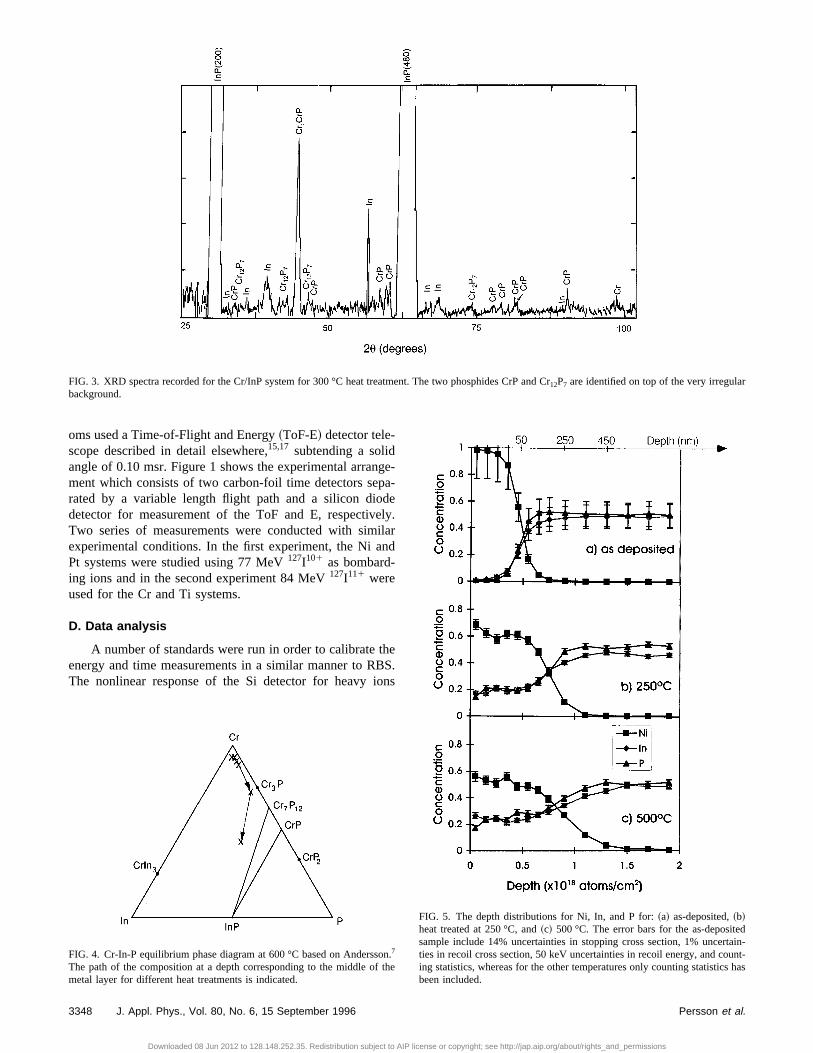
FIG. 3. XRD spectra recorded for the Cr/InP system for 300 °C heat treatment. The two phosphides CrP and Cr12P7 are identified on top of the very irregulabackground.dtain-unt-has
oms used a Time-of-Flight and Energy~ToF-E! detector tele-scope described in detail elsewhere,15,17 subtending a solidangle of 0.10 msr. Figure 1 shows the experimental arrangment which consists of two carbon-foil time detectors seprated by a variable length flight path and a silicon dioddetector for measurement of the ToF and E, respectiveTwo series of measurements were conducted with simiexperimental conditions. In the first experiment, the Ni anPt systems were studied using 77 MeV127I101 as bombard-ing ions and in the second experiment 84 MeV127I111 wereused for the Cr and Ti systems.
D. Data analysis
A number of standards were run in order to calibrate thenergy and time measurements in a similar manner to RBThe nonlinear response of the Si detector for heavy io
FIG. 4. Cr-In-P equilibrium phase diagram at 600 °C based on Andersso7
The path of the composition at a depth corresponding to the middle of tmetal layer for different heat treatments is indicated.
3348 J. Appl. Phys., Vol. 80, No. 6, 15 September 1996
Downloaded 08 Jun 2012 to 128.148.252.35. Redistribution subject to AIP
e-a-ely.lard
eS.ns
n.he
FIG. 5. The depth distributions for Ni, In, and P for:~a! as-deposited,~b!heat treated at 250 °C, and~c! 500 °C. The error bars for the as-depositesample include 14% uncertainties in stopping cross section, 1% uncerties in recoil cross section, 50 keV uncertainties in recoil energy, and coing statistics, whereas for the other temperatures only counting statisticsbeen included.
Persson et al.
license or copyright; see http://jap.aip.org/about/rights_and_permissions
era-
n, 50
J. Appl. Phys., Vo
D
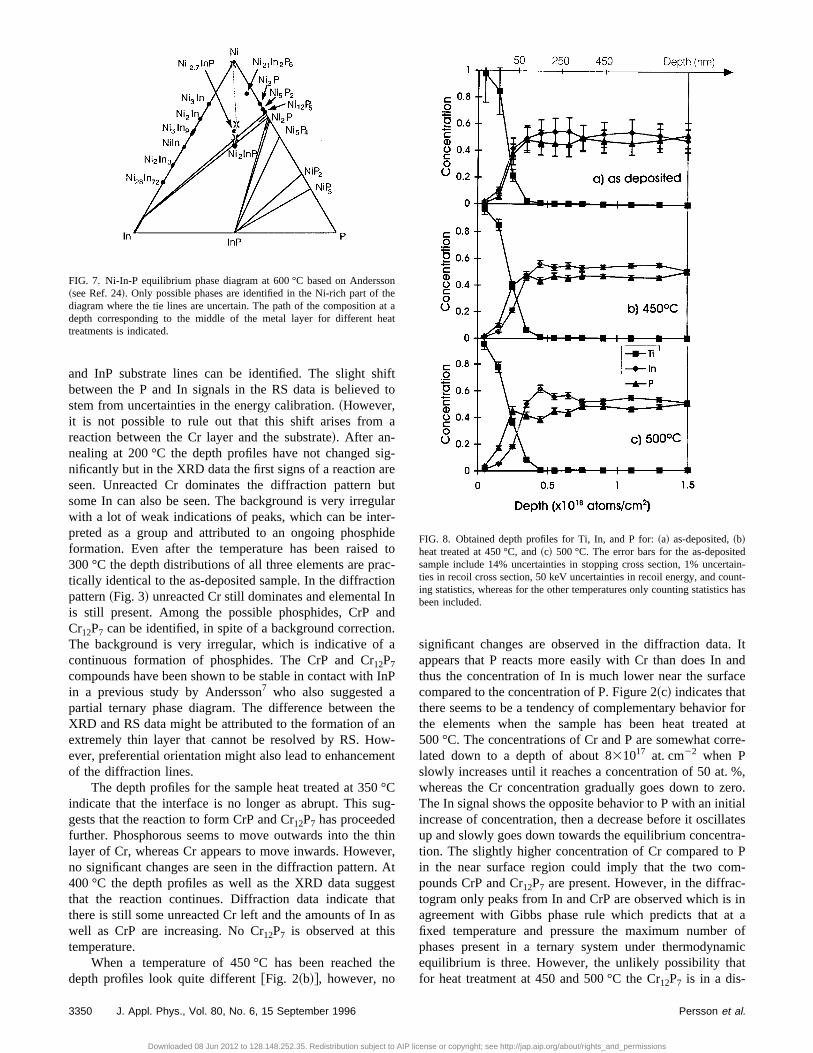
TABLE II. Observed XRD phases and calculated compositions using RS data for different annealing temptures. The composition is calculated for a layer extending between 1 and 331017 at. cm22. The estimateduncertainties include 14% uncertainties in stopping cross section, 1% uncertainties in recoil cross sectiokeV uncertainties in recoil energy, and counting statistics.
Anneal. temp.°C XRD phases
Composition
Ni In P
as-deposited Crystalline Ni 0.97~21! 0.02 ~01! 0.01 ~01!250 No evidence of any crystalline
phase0.60 ~11! 0.19 ~03! 0.21 ~04!
350 Ni2InP ~a50.6803 nm, b50.5298 nm, c51.2811 nm,b595.10°!
0.55 ~10! 0.22 ~04! 0.23 ~05!
500 Identical to 350 °C 0.52~10! 0.24 ~05! 0.24 ~05!
ie
e
t
r
n
l
e-tion
s-
a-wgy
pa-gyayse
r2r
leads to distortion of the two-dimensional mass-energy htograms and in order to linearise them and establish anergy calibration for theE-detector the multivariate analysismethod developed by El Bouananiet al.18 was used. Whendata from different elements overlap, cross talk can blargely eliminated by careful selection of only part of thmass interval for those elements.19 A different approach wastried here. The samples were divided into thin sections wia thickness of approximately 131017 at. cm22. For each sec-tion, the mass broadening was calculated using the empiriexpression given by Hultet al.20 The absolute position of theelements and the number of counts corresponding toabundance of each element in the section were the freerameters in the nonlinear least squares fit. Stoichiometry cculations can be performed for RS in a manner similarRBS21,22 using Rutherford cross sections. The stoichiometwas subsequently obtained for each section by taking tdifferences in cross section and stopping cross section iaccount. TheSTOP-code by Ziegleret al.23 was used toevaluate the stopping cross section factors used in the calations. Extracting concentration profiles simplifies the inte
l. 80, No. 6, 15 September 1996
ownloaded 08 Jun 2012 to 128.148.252.35. Redistribution subject to AIP
s-n-
e
th
cal
hepa-al-toyheto
cu-r-
pretation of the data compared to looking at raw data bcause the different stopping cross sections and cross secvariations with energy are taken into account.
The depth resolutions at the surface for the various sytems were found to be;20 nm for the Cr and Ni systems,and greater than 30 nm for the Ti and Pt systems. The resons for the larger values in the Ti and Pt case are the lostopping cross section for Ti and the degradation of enerdetector resolution with mass for Pt. The Ti/InP 400 °Csample and Cr/InP 450 °C sample were measured in a serate batch which may have caused a slight shift of the enercalibration as compared to the other temperatures. This mhave caused a shift in the depth profiles obtained at thetemperatures.
III. RESULTS AND DISCUSSION
A. Cr/InP
No clear evidence of a reaction between Cr and InP fothe as-deposited sample is seen in the RS data, see Fig.~a!and Table I, and in the XRD spectrum only crystalline C
FIG. 6. XRD spectra recorded for the Ni/InP system for~a! the as-deposited and~b! 350 °C heat treatment.
3349Persson et al.
license or copyright; see http://jap.aip.org/about/rights_and_permissions
Itndce
forat
re-
,ro.altesa-P-
inaofmict
in-nt-has
and InP substrate lines can be identified. The slight sbetween the P and In signals in the RS data is believedstem from uncertainties in the energy calibration.~However,it is not possible to rule out that this shift arises fromreaction between the Cr layer and the substrate!. After an-nealing at 200 °C the depth profiles have not changednificantly but in the XRD data the first signs of a reaction aseen. Unreacted Cr dominates the diffraction patternsome In can also be seen. The background is very irregwith a lot of weak indications of peaks, which can be intepreted as a group and attributed to an ongoing phosphformation. Even after the temperature has been raised300 °C the depth distributions of all three elements are prtically identical to the as-deposited sample. In the diffractipattern~Fig. 3! unreacted Cr still dominates and elementalis still present. Among the possible phosphides, CrP aCr12P7 can be identified, in spite of a background correctioThe background is very irregular, which is indicative ofcontinuous formation of phosphides. The CrP and Cr12P7compounds have been shown to be stable in contact within a previous study by Andersson7 who also suggested apartial ternary phase diagram. The difference betweenXRD and RS data might be attributed to the formation ofextremely thin layer that cannot be resolved by RS. Hoever, preferential orientation might also lead to enhancemof the diffraction lines.
The depth profiles for the sample heat treated at 350indicate that the interface is no longer as abrupt. This sgests that the reaction to form CrP and Cr12P7 has proceededfurther. Phosphorous seems to move outwards into thelayer of Cr, whereas Cr appears to move inwards. Howeno significant changes are seen in the diffraction pattern400 °C the depth profiles as well as the XRD data suggthat the reaction continues. Diffraction data indicate ththere is still some unreacted Cr left and the amounts of Inwell as CrP are increasing. No Cr12P7 is observed at thistemperature.
When a temperature of 450 °C has been reacheddepth profiles look quite different@Fig. 2~b!#, however, no
FIG. 7. Ni-In-P equilibrium phase diagram at 600 °C based on Anders~see Ref. 24!. Only possible phases are identified in the Ni-rich part of tdiagram where the tie lines are uncertain. The path of the compositiondepth corresponding to the middle of the metal layer for different htreatments is indicated.
3350 J. Appl. Phys., Vol. 80, No. 6, 15 September 1996
Downloaded 08 Jun 2012 to 128.148.252.35. Redistribution subject to A
hiftto
a
sig-rebutularr-ideto
ac-onInndn.a
InP
theanw-ent
°Cug-
thinver,. Atestatas
the
significant changes are observed in the diffraction data.appears that P reacts more easily with Cr than does In athus the concentration of In is much lower near the surfacompared to the concentration of P. Figure 2~c! indicates thatthere seems to be a tendency of complementary behaviorthe elements when the sample has been heat treated500 °C. The concentrations of Cr and P are somewhat corlated down to a depth of about 831017 at. cm22 when Pslowly increases until it reaches a concentration of 50 at. %whereas the Cr concentration gradually goes down to zeThe In signal shows the opposite behavior to P with an initiincrease of concentration, then a decrease before it oscillaup and slowly goes down towards the equilibrium concentrtion. The slightly higher concentration of Cr compared toin the near surface region could imply that the two compounds CrP and Cr12P7 are present. However, in the diffrac-togram only peaks from In and CrP are observed which isagreement with Gibbs phase rule which predicts that atfixed temperature and pressure the maximum numberphases present in a ternary system under thermodynaequilibrium is three. However, the unlikely possibility thafor heat treatment at 450 and 500 °C the Cr12P7 is in a dis-
sonheat aeat
FIG. 8. Obtained depth profiles for Ti, In, and P for:~a! as-deposited,~b!heat treated at 450 °C, and~c! 500 °C. The error bars for the as-depositedsample include 14% uncertainties in stopping cross section, 1% uncertaties in recoil cross section, 50 keV uncertainties in recoil energy, and couing statistics, whereas for the other temperatures only counting statisticsbeen included.
Persson et al.
IP license or copyright; see http://jap.aip.org/about/rights_and_permissions

J. Appl. Phys.,
FIG. 9. XRD spectra for the Ti/InP system for~a! as-deposited and~b! 400 °C heat treatment.
nt
bn
i
n
lynshp-
n-
nyig.
Sfor
s ining
ordered state cannot be ruled out. In Fig. 4, the route takby the thin-film reaction for a layer extending between 1 a331017 at. cm22 ~assuming bulk density this corresponds12–36 nm! is plotted in the ternary phase diagram forclosed system at a temperature of 600 °C.7
B. Ni/InP
The depth profiles for the reference sample and twothe heat treated samples are presented in Fig. 5 and theichiometries calculated from the RS data are shown in TaII. The composition for the layer extending between 1 a331017 at. cm2 for the as-deposited sample corresponds97 at. % Ni, 2% In, and 1% P. Assuming the density of buNi and the thin film are the same, this would correspond todepth of 11–33 nm. Within estimated errors includedTable II this indicates that only Ni is present at the surfacNo evidence of a reaction between the thin layer of Ni athe InP can be seen in the depth profiles and this is verifiby XRD measurements in which only elemental, crystallinNi can be seen@Fig. 6~a!#.
The elemental composition of the sample changed dmatically after heat treating the sample at 250 °C@Fig. 5~b!#.A reaction has clearly taken place and no elemental Ni dfraction lines are observed suggesting that all the Ni is cosumed. The In and P depth profiles suggest that both ements are present at the surface. The data indicate a fauniform reacted layer with a composition of Ni3InP extend-ing down to about 531017 at. cm22. The diffraction patternshows no evidence of any crystalline phase. This is constent with the study of Sandset al.8 who reported on an initialformation of an amorphous phase with the approximate coposition Ni2.7InP after annealing at 200 °C for 15 min.
Vol. 80, No. 6, 15 September 1996
Downloaded 08 Jun 2012 to 128.148.252.35. Redistribution subject to AIP
endoa
ofsto-ledtolkane.dede
ra-
if-n-le-irly
is-
m-
The composition of the buried layer changed onslightly for the sample heated to 350 °C with a compositiocloser to Ni2InP which is also in good agreement with Sandet al.8 The tail from Ni extends further into the sample whicsuggests that the reaction has continued with the consumtion of excess Ni as Ni2.7InP→Ni2InP. The diffraction pat-tern shown in Fig. 6~b! can be indexed using a monocliniccell proposed by Sandset al.8 which is attributed to a NixInPphase with a somewhat variable Ni content~x between 2 and3!. Least squares refinement of the monoclinic cell dimesions gives the following result:a50.6803 nm,b50.5297nm, c51.2811 nm, andb595.10° which should be the finalproduct according to Sandset al.8
Heating at a temperature of 500 °C did not lead to anoticeable change in the concentration profiles shown in F5~c!. Also the diffraction pattern is identical to the 350 °C
TABLE III. Observed XRD phases and calculated compositions using Rdata for different annealing temperatures. The composition is calculateda layer extending between 1 and 331017 at. cm22. The estimated uncertain-ties include 14% uncertainties in stopping cross section, 1% uncertaintierecoil cross section, 50 keV uncertainties in recoil energy, and countstatistics.
Anneal temp.°C XRD phases
Composition
Ti In P
as-deposited Crystalline Ti and some In 0.53~09! 0.26 ~04! 0.21 ~04!250 Identical to as-deposited 0.54~09! 0.25 ~04! 0.21 ~04!350 TiP, and some Ti 0.52~09! 0.23 ~04! 0.25 ~05!400 TiP and In 0.65~12! 0.16 ~03! 0.19 ~04!450 TiP and In 0.62~11! 0.13 ~02! 0.25 ~04!500 TiP and In 0.57~10! 0.12 ~02! 0.31 ~06!
3351Persson et al.
license or copyright; see http://jap.aip.org/about/rights_and_permissions

O
a
m
ta
a
e
ndthen
c-urethe
en.f athease.htaslt.in
%
e
dain-nt-has
case. Sandset al.8 pointed out that the Ni2InP phase is stableat temperatures up to 500 °C for samples capped with Si2.Notably, this phase is also present in our samples which wuncapped and heat treated in vacuum indicating the phasstable in this processing environment. It is possible, hoever, that P may be lost after some time. The compositionsthe buried layer for the different annealing temperaturesplotted on the 600 °C equilibrium ternary phase diagram24 inFig. 7.
C. Ti/InP
No evidence can be seen for a reaction between Ti athe InP substrate in the RS data for the as-deposited sam@Fig. 8~a!#. However the XRD suggest the reaction procestarts immediately during the deposition process becauseonly Ti but also some In can be found in the diffractiopattern shown in Fig. 9~a!. This is not unexpected since Ti isknown to be a very reactive metal. Table III shows the caculated stoichiometries from RS data for the various teperatures and the route taken by the buried layer is indicain Fig. 10. At 250 °C, the diffraction pattern appears idencal to the as-deposited sample, but at 350 °C strong diffrtion signals from TiP are observed. In the RS data, thereno apparent evidence of any reaction taking place. Tphases identified in the diffraction pattern at 400 °C are idetical to the ones identified in the 600 °C bulk equilibriumternary phase diagram, where TiP is the dominating phtogether with In@Fig. 9~b!#. This may indicate that the TiPlayer formed at low reaction temperatures inhibits furthreaction by acting as a diffusion barrier. When the tempeture is increased to 450 °C, the first clear indication ofreaction is seen in the RS data as Ti has moved intosample, whereas the concentration of In has decreasedthe surface@Fig. 8~b!#. Figure 8~c! shows the depth profilesat 500 °C which shows that the reaction has continued. TRS data suggests that the reaction is incomplete at this tperature.
FIG. 10. Ti-In-P phase diagram at 600 °C. In the absence of reliable datatie lines are shown. The binary phase data is from Massalski~see Ref. 25!.The path of the composition at a depth corresponding to the middle ofmetal layer for different heat treatments is indicated.
3352 J. Appl. Phys., Vol. 80, No. 6, 15 September 1996
Downloaded 08 Jun 2012 to 128.148.252.35. Redistribution subject to AIP
eree isw-ofre
ndplessnotn
l--
tedi-c-ishen-
se
erra-athenear
hem-
D. Pt/InP
For the Pt/InP system the reaction rate between Pt athe substrate appears to be considerably lower than inrelated Ni/InP and Pd/InP2 systems. Significant reactions cabe seen at rather low temperatures~100–200 °C!in both theNi/InP and Pd/InP systems but no clear indication of a reation is observed in the Pt/InP system even after a temperatof 250 °C has been reached. In the as-deposited sample,RS data show no clear signs of a reaction@Fig. 11~a!# and inthe XRD spectrum only elemental crystalline Pt can be seWhen the temperature is raised to 250 °C, weak signs oreaction are seen in the RS data and the interface edge onIn signal does not appear as sharp as in the unreacted cThe diffraction pattern is almost identical except for a sligbroadening of the peaks indicative that interdiffusion hprobably started with solid solutions of In and Pt as a resu
At a temperature of 350 °C, the concentration of Ptthe near surface region has dropped drastically@Fig. 11~b!#with concentrations of P and In of approximately 20 at.each~Table IV!. According to the diffraction pattern shownin Fig. 12~a! there is still some unreacted Pt left but th
no
the
FIG. 11. The elemental profiles for Pt, In, and P for:~a! as-deposited,~b!heat treated at 350 °C, and~c! 500 °C. The error bars for the as-depositesample include 14% uncertainties in stopping cross section, 1% uncertties in recoil cross section, 50 keV uncertainties in recoil energy, and couing statistics, whereas for the other temperatures only counting statisticsbeen included.
Persson et al.
license or copyright; see http://jap.aip.org/about/rights_and_permissions

pera-
on, 50
J. Appl. Phys., Vol
Do
TABLE IV. Observed XRD phases and calculated compositions using RS data for different annealing temtures. The composition is calculated for a layer extending between 1 and 331017 at. cm22. The estimateduncertainties include 14% uncertainties in stopping cross section, 1% uncertainties in recoil cross sectikeV uncertainties in recoil energy, and counting statistics.
Anneal temp.°C XRD phases
Composition
Pt In P
as-deposited Crystalline Pt 0.84~17! 0.10 ~02! 0.06 ~02!250 Identical to as-dep., slight
broadening of the peaks0.81 ~16! 0.09 ~02! 0.10 ~03!
350 Pt5InP ~a50.3984 nm,c50.6970 nm! plus some Pt 0.60~11! 0.20 ~04! 0.20 ~04!500 PtIn2 ~mainly!, PtP2, and
Pt3In7
0.36 ~06! 0.34 ~06! 0.30 ~06!
th
of
men,tilithed,
reaction zone is dominated by the ternary phase Pt5InP ~a50.39384 nm andc50.6970 nm! which also was identifiedby Mohney and Chang.12 This phase is tetragonal and leassquares refinement of the cell parameters indicates someregularities in thec-direction. Refinement was very difficultand the fit resulted in a poor standard deviation. The ternphase is reported to decompose to binary phases at temptures higher than 450 °C12 and at the highest temperaturused in this study, 500 °C, three binary phases could be idtified in the diffraction pattern, PtIn2, PtP2, and Pt3In7. Itcould be that the system has not reached equilibrium at ttemperature because more phases than predicted by Gphase rule are observed. RS data indicate that the ovestoichiometry is about PtInP down to a depth of abo631017 at. cm22 @Fig. 11~c!#. The In is quite evenly distrib-uted throughout the sample down to a depth of about 131018
at. cm22 when it gradually increases to reach 50 at. % in tunreacted substrate. The behavior of phosphorous is q
. 80, No. 6, 15 September 1996
wnloaded 08 Jun 2012 to 128.148.252.35. Redistribution subject to AIP
t-ir-
aryera-een-
hisibbsrallut
heuite
different with the concentration reaching 50 at. % at a depof 831017 at. cm22. Figure 12~b! shows the diffractogram inwhich the dominating phase is PtIn2, but there are also somePtP2 and small amounts of Pt3In7 present. The route taken bythe system at a layer extending from 1 to 331017 at. cm22
~15–45 nm for the as-deposited film assuming the densitythin film and bulk Pt are the same! is included in the ternaryphase diagram deduced at 600 °C,13 shown in Fig. 13.
IV. CONCLUSIONS
No evidence of a reaction is seen in the Cr/InP systeuntil a temperature of 200 °C is reached when In can be sein the diffraction pattern. Phosphides start to form at 300 °Cwhereas the depth profiles remain basically intact un350 °C when P moves outwards. The reaction continues wincreasing temperature and at the highest temperature us
FIG. 12. Diffractogram recorded for the Pt/InP system for~a! 350 °C heat treatment and~b! 500 °C heat treatment.
3353Persson et al.
license or copyright; see http://jap.aip.org/about/rights_and_permissions

-se-
r
D.
es
n,
J.
ds
s,
ds
.
.
.
.
500 °C, the concentrations of Cr and P appear correlatethe thin film. The final products are In and CrP as identifiin the diffractogram.
The Ni/InP system is in good agreement with the invetigation by Sandset al.8 At 250 °C, no crystalline phase isdetected even though the overall composition appears toNi;3InP. With increasing temperature up to 500 °C, the tnary phase crystallizes and the composition moves closeNi2InP. No evidence for loss of volatile phosphorous is sein this phase.
Ti appears to react with the InP substrate immediatupon deposition judging from XRD data. When a tempeture of 400 °C has been reached, only the final productsand In are observed in the diffraction pattern. The RS ddoes not show reaction until 450 °C. The reaction continwith increasing temperature and does not appear comple500 °C.
Weak signs of a reaction are seen at 250 °C for theInP system. The reaction has accelerated at 350 °C widramatic change in the depth profiles as a result and idefication of the ternary phase Pt5InP in the diffraction pattern.At 500 °C, the ternary phase has decomposed into the binphases PtIn2, PtP2, and Pt3In7 and the system has not reachethermodynamic equilibrium according to Gibbs phase rul
ACKNOWLEDGMENTS
The authors would like to express their gratitude to tANSTO staff who work on the ANTARES facility for theirhelp. The support of the Australian Institute of Nuclear Sence and Engineering~AINSE! and its staff, as well as the
FIG. 13. Pt-In-P equilibrium phase diagram at 600 °C, after Linet al. ~seeRef. 13! and Andersson~see Ref. 24!. The ternary phases T1 and T2 observed by Lin et al. have the Pt:In:P ratios of 50.7:40.7:8.6, an73.7:16.8:9.5, respectively. The dashed lines denote tie lines proposeLin et al.on the basis of Gibbs phase rule. The path of the compositiondepth corresponding to the middle of the metal layer for different htreatments is indicated.
3354 J. Appl. Phys., Vol. 80, No. 6, 15 September 1996
Downloaded 08 Jun 2012 to 128.148.252.35. Redistribution subject to AI
d ined
s-
beer-r toen
elyra-TiPataueste at
Pt/th anti-
aryde.
he
ci-
Australian Department of Industry, Technology, and Commerce ~DITAC! are gratefully acknowledged. The authorwould also like to thank Yanwen Zhang for preparing thXRD figures. The Swedish authors would also like to acknowledge the Swedish Institute~SI!, the Craaford Founda-tion, the Royal Swedish Academy of Sciences~especiallyLetterstedt’s resestipendiefond!, and Carl Trygger’s Founda-tion for financial support. This work was carried out undethe auspices of the NFR-NUTEK Nanometer Consortium.
1D. G. Ivey, P. Jian, and R. Bruce, J. Electron. Mater.21, 831 ~1992!.2L. Persson, M. El Bouanani, M. Hult, P. Jo¨nsson, H. J. Whitlow, M.Andersson, K. Georgsson, I. F. Bubb, P. N. Johnston, S. R. Walker, D.Cohen, N. Dytlewski, C. Zaring, and M. O¨ stling, J. Vac. Sci. Technol. A~to be published!.
3A. Appelbaum, M. Robbins, and F. Schrey, IEEE Trans. Electron DevicED-34, 1026~1987!.
4C. J. Palmstro”m and D. V. Morgan, inGallium Arsenide, Materials, De-vices and Circuits, edited by M. J. Howes and D. V. Morgan~Wiley, NewYork, 1986!, ISBN 0-471-90048-6, p. 195.
5D. G. Ivey and P. Jian, Can. Metall. Q.34, 85 ~1995!.6D. G. Ivey, R. Bruce, and G. R. Piercy, Solid-State Electron.31, 1251~1988!.
7M. Andersson, J. Alloys Compounds198, L15 ~1993!.8T. Sands, C. C. Chang, A. S. Kaplan, V. G. Keramidas, K. M. Krishnaand J. Washburn, Appl. Phys. Lett.50, 1346~1987!.
9N. S. Fatemi and V. G. Weizer, J. Appl. Phys.73, 289 ~1993!.10G. Stremsdoerfer, Y. Wang, D. Nguyen, P. Clechet, and J. R. Martin,Electrochem. Soc.140, 2022~1993!.
11M. Andersson-So¨derberg, J. Less-Common Met.171, 179 ~1991!.12S. E. Mohney and Y. A. Chang, J. Appl. Phys.74, 4403~1993!.13C. F. Lin, S. E. Mohney, and Y. A. Chang, J. Appl. Phys.74, 4398~1993!.14The technique is often termed ERD~Elastic Recoil Detection! or ERDA
~Elastic Recoil Detection Analysis!.15H. J. Whitlow, G. Possnert, and S. Petersson, Nucl. Instrum. MethoPhys. Res. B27, 448 ~1987!. @There is an error in Eq.~2! of this paper, itshould be replaced by Eq.~2! of Ref. 22#.
16R. Siegele, H. K. Haugen, J. A. Davies, J. S. Forster, and H. R. AndrewJ. Appl. Phys.76, 4524~1994!.
17H. J. Whitlow, B. Jacobsson, and L. Westerberg, Nucl. Instrum. MethoPhys. Res. A310, 636 ~1991!.
18M. El Bouanani, M. Hult, L. Persson, E. Swietlicki, M. Andersson, M.Ostling, N. Lundberg, C. Zaring, D. D. Cohen, N. Dytlewski, P. N.Johnston, S. R. Walker, I. F. Bubb, and H. J. Whitlow, Nucl. InstrumMethods Phys. Res. B94, 530 ~1994!.
19M. Hult, H. J. Whitlow, and M. Ostling, Appl. Phys. Lett.60, 219~1992!.20M. Hult, M. El Bouanani, L. Persson, H. J. Whitlow, M. Andersson, CZaring, M. Ostling, D. D. Cohen, N. Dytlewski, I. F. Bubb, P. N.Johnston, and S. R. Walker, Nucl. Instrum. Methods Phys. Res. B101,263 ~1995!.
21H. J. Whitlow, in Proceedings High Energy and Heavy Ion Beams inMaterials Analysis, Albuquerque, 1989, edited by J. R. Tesmer, C. JMaggiore, M. Nastasi, J. C. Barbour, and J. W. Mayer~Materials Re-search Society, Pittsburgh, PA, 1990!, p. 73.
22H. J. Whitlow, A. B. C. Andersson, and S. Petersson, Nucl. InstrumMethods Phys. Res. B36, 53 ~1989!.
23J. F. Ziegler, J. P. Biersack, and U. Littmark,The Stopping and Ranges ofIons in Solids 1, The Stopping and Ranges of Ions in Matter, edited by J.F. Ziegler~Pergamon, New York, 1985!.
24M. Andersson-So¨derberg, J. Alloys Compounds194, 67 ~1993!.25T. B. Massalski,Binary Alloy Phase Diagrams, Vol. 2 ~American Societyfor Metals, Metals Park, OH, 1986!.
-dd byat aeat
Persson et al.
P license or copyright; see http://jap.aip.org/about/rights_and_permissions