interactive travel modes: uber, transit and · pdf file15-11-2016 · davidson,...
TRANSCRIPT

Davidson, Peters & Brakewood 1
1
INTERACTIVE TRAVEL MODES:
UBER, TRANSIT AND MOBILITY IN NEW YORK CITY.
Word Count: 4,788 (text) + 250 * 7 (figures and tables) = 6,538
Revision Date: November 15, 2016
Adam Davidson (Corresponding Author)
CUNY Graduate Center
365 Fifth Avenue, Rm 4306
New York, NY 10016
Email: [email protected]
Jonathan Peters, PhD
The College of Staten Island
Room 3N-220, 2800 Victory Blvd., Staten Island, NY 10314
Email: [email protected]
Phone: 718-982-2958
Candace Brakewood, PhD
The City College of New York
160 Convent Avenue, New York, NY, 10031, USA
Email: [email protected]
Phone: 212-650-5217
Davidson, Peters & Brakewood 2
2
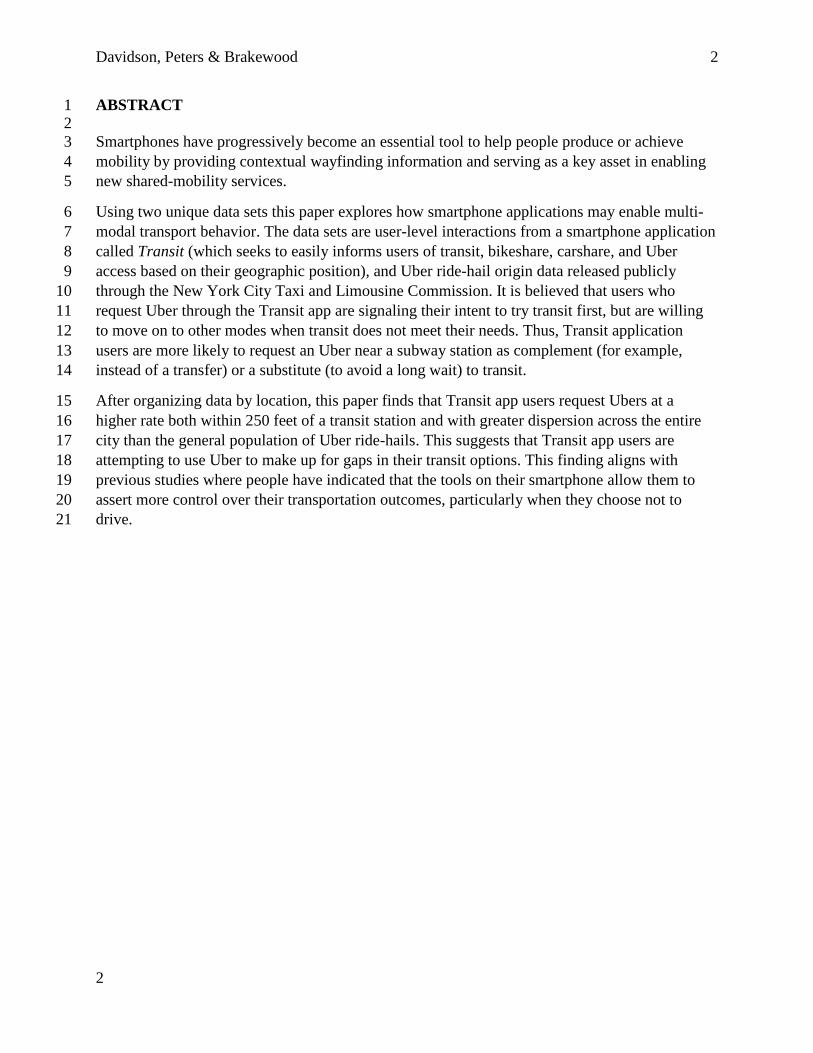
ABSTRACT 1 2
Smartphones have progressively become an essential tool to help people produce or achieve 3
mobility by providing contextual wayfinding information and serving as a key asset in enabling 4
new shared-mobility services. 5
Using two unique data sets this paper explores how smartphone applications may enable multi-6
modal transport behavior. The data sets are user-level interactions from a smartphone application 7
called Transit (which seeks to easily informs users of transit, bikeshare, carshare, and Uber 8
access based on their geographic position), and Uber ride-hail origin data released publicly 9
through the New York City Taxi and Limousine Commission. It is believed that users who 10
request Uber through the Transit app are signaling their intent to try transit first, but are willing 11
to move on to other modes when transit does not meet their needs. Thus, Transit application 12
users are more likely to request an Uber near a subway station as complement (for example, 13
instead of a transfer) or a substitute (to avoid a long wait) to transit. 14
After organizing data by location, this paper finds that Transit app users request Ubers at a 15
higher rate both within 250 feet of a transit station and with greater dispersion across the entire 16
city than the general population of Uber ride-hails. This suggests that Transit app users are 17
attempting to use Uber to make up for gaps in their transit options. This finding aligns with 18
previous studies where people have indicated that the tools on their smartphone allow them to 19
assert more control over their transportation outcomes, particularly when they choose not to 20
drive. 21

Davidson, Peters & Brakewood 3
3
INTRODUCTION 22
Smartphones have progressively become a tool to help people produce or achieve mobility. 23
Using increasingly robust, yet easily interpretable data about various transport options, 24
smartphone users can choose between a wide and growing number of transport services to plan 25
their journeys and make the process of mobility easier. This collection of services includes: 26
1. Interactive transit schedules and real-time public transit information; 27
2. Live traffic congestion data; 28
3. Shared-economy services – this includes new travel mode categories such as bike share 29
and car share; and new challengers in existing modes such as Uber and Lyft towards taxi 30
services. 31
Often, these transportation services are studied independently. However, a user of one of these 32
services is typically using a smartphone and can just as easily access information about the other 33
services by switching apps. Some apps, such as the Transit app1 – which will be a focus in this 34
paper – present much of that information in one interface known as a mobility aggregator. 35
Mobility aggregators have easy-to-follow information that makes it much easier and more 36
reasonable for a traveler to execute a multi-modal journey. 37
Despite the availability of mobility aggregators like the Transit app, the majority of these 38
services tend to operate independently. Further, most of the ‘shared-economy’ services described 39
above are run by private companies who have no obligation to make their data available to the 40
public. Therefore, very little is known about how these services interact with each other and 41
other mobility aggregators as travelers make their way from origin to destination with the 42
assistance of their smartphones. 43
44
RESEARCH QUESTION 45
This paper will use two unique data sets to explore how smartphone applications focused 46
on transport services encourage multi-modal transport behavior. The data sets consist of user-47
level interactions in the Transit application (a smartphone application that easily informs users of 48
transit, bikeshare, carshare, and Uber access based on their geographic position), and the general 49
population Uber ride-share origin data released publically through the New York Taxi and 50
Limousine Commission (TLC). This paper is based on the assumption that users who request 51
Uber through the Transit app are signaling their intent to try transit first, but are willing to move 52
on to other modes when transit does not meet their needs. Based on this assumption, we 53
hypothesize that Transit app users will request Ubers near transit stations at higher rates than the 54
general population of Uber users. If this hypothesis is correct, it would align with previous 55
studies in which travelers have indicated that the tools on their smartphone allowed them to 56
make more informed transportation decisions [1], particularly when they choose not to drive [2]. 57
58
1 Transit (the smartphone application) was originally called the Transit App. In order to avoid confusion between
Transit (the app) and transit (the general name for mass transport), this paper will refer to the smartphone
application as the ‘Transit app’ or the ‘Transit application.’

Davidson, Peters & Brakewood 4
4
LITERATURE REVIEW 59
The rise of Transportation Network Companies (TNC) such as Uber, and mobility 60
aggregators like Transit app is due to vast improvements in information and communication 61
technology (ICT), which are exemplified by the smartphone. Changes in transportation have long 62
been linked to changes in communication technology, as both activities are complimentary and 63
substitutable [3]. Increasingly, travelers are using digital information communicated via their 64
smartphones to achieve more reliable mobility outcomes. The rise of the mobile phone has 65
allowed users to communicate without remaining at fixed locations [4], which can then “permit 66
new practices and innovation in our relationship with space and travel” [5]. In fact, mobile 67
devices are purposefully meant to interact with the environment [6]. Ubiquitous computing 68
platforms like smartphones often have the ability to modify, control, utilize, and regulate space 69
(such as a surveillance system, digital thermostat, or traffic signal). Increasingly, with their 70
connected devices, people can now proactively manage their use of space and time. New digital 71
services allow people to use their personal ICT devices to plan a trip, find a ride, share bikes or 72
cars, or avoid traffic congestion in real-time [7][1]. 73
ICTs in particular have enabled significant new forms of travel at mass market scales [8]. 74
An overwhelming majority of these forms of travel are now shared transportation modes in 75
which users can utilize excess capacity of discrete goods/services for travel [9][10] . Unlike 76
traditional transportation systems that are publicly maintained, many new ICT-based 77
transportation services are often private start-ups. These ICTs include car share (ZipCar, 78
Car2Go), ride-sourcing (Uber, Lyft) and some bike-sharing services (CitiBike, Zagster). These 79
new travel options, combined with improved transit and road congestion information made 80
available by mobility aggregators, produce a curated travel experiences for users based on their 81
exact location, the time of day, and accessible transportation alternatives. 82
Yet, these new transport services are not without their controversy. For example, many 83
localities - even whole countries - have attempted to ban Uber, as most government entities were 84
not prepared for Uber’s meteoric rise [11]. Regulatory bodies and incumbent actors were 85
surprised and challenged by the new technology and did not have the necessary frameworks to 86
handle the Uber service [12]. While these agencies have more-or-less come to accept the new 87
challenges of TNCs, the costs and benefits of ride-sourcing are understood much more 88
anecdotally than quantitatively. The services are clearly well used and expanding every day, but 89
detailed data on ride-sharing’s tangible social costs and benefits are inconsistent and hard to 90
come by. 91
By contrast, the passenger benefits of real-time travel information, particularly in public 92
transportation, has been increasingly well-documented using widely available data. 93
Implementation of real-time arrival systems have led to increased ridership, satisfaction, and 94
perceptions of control [13][14][15]. In a series of focus groups conducted in late 2013, 95
smartphone users expressed an improved ability to travel to new parts of town, try different 96
travel modes, and manage their time more effectively due to newly available real-time travel 97
information. In fact, the users acknowledged an actual, and growing dependence on this [2]. 98

Davidson, Peters & Brakewood 5
5
Fueled by technology and information, people increasingly use their smartphones as their 99
primary source of mobility information. 100
Hence, it is logical that some travelers would combine shared mobility services with 101
transit information to better achieve their transport preferences for speed, convenience and costs. 102
103
DATA 104
This paper’s analysis utilizes two unique datasets related to Uber use in New York City. 105
The first data set, is a sample of Uber trip origins for a six-month period in 2014. The second is 106
comprised of Uber requests summoned through the Transit app. These datasets are described in 107
detail in the following paragraphs. 108
109
TLC Uber data 110
Rules about for-hire-vehicles (FHVs) in New York City require all FHV drivers to be 111
licensed by the Taxi and Limousine Commission and associated with a dispatch base. Uber is 112
considered one of these FHVs under New York law. As a result of evolving FHV reporting rules, 113
Uber origin data has been reported to the TLC from the dispatch bases since 2014. Since this 114
data was now in the hands of a public agency, it became a candidate for a Freedom of 115
Information Law (FOIL) request. The data-journalism blog FiveThirtyEight.com conducted a 116
FOIL request for the Uber origin data and was rewarded with six months (April through 117
September 2014) worth of Uber origin data by latitude/longitude, and six months (January – June 118
2015) of Uber origin data by ‘taxi zone’ (a TLC specific geographic unit a bit smaller than a zip 119
code). They used this data to examine several claims about Uber use and traffic congestion on 120
their popular blog [16][17]. 121
FiveThirtyEight then made this data accessible to the public along with the FOIL 122
documentation on a GitHub repository in 2015 [18]. Currently, the 2014 TLC dataset of Uber 123
origins published by FiveThirtyEight is the only publically available large scale view into Uber 124
origins at the fine resolution provided by latitude/longitude coordinates. Both the 2014 and 2015 125
data sets reveal only origin location and timestamp data. 126
127
Transit app Uber data 128
The Transit application agreed to disclose their data to this paper’s research team for academic 129
inquiry. As its name implies, Transit app primarily focuses on providing information about 130
transit services, but as of 2015 it also integrates several ‘shared’ mobility services including an 131
ability to reserve a Car2Go (car-share), Uber (ride-share/ride-source), and find availability on 132
most bike share systems. Because of these features, Transit app has become one the more 133
popular public transit related apps and concurrently one of the larger referrers to the Uber 134
system. Part of its popularity lies in the application’s ability to provide comprehensive mobility 135
information in an easy-to-read interface with minimum input from the user. 136
The Transit app works by sending the user’s GPS coordinates to a server, which then 137
returns schedule and real-time information for all nearby transit lines and supported mobility 138

Davidson, Peters & Brakewood 6
6
services. The results for the user are a series of tiles (an interactive list) of transit lines with the 139
next scheduled departure clearly displayed for each service, as well as a map of nearby car-share 140
and bike-share services. Embedded within the transit information is an Uber tile that displays an 141
estimated pickup time from the user’s location (see Figure 1). Tapping this tile launches the Uber 142
app and starts the process for a ride request. 143
144
Figure 1: Screenshots of the Transit app show the availability of multiple travel modes 145
146 147
The Transit app dataset analyzed for this paper contains records of user interactions with 148
the software interface and is considered a form of data exhaust [19]. This dataset is necessary for 149
the application to know what information to serve to which user at the transaction level, but can 150
be used for a secondary purpose to discern systemic patterns. The user interactions in the dataset 151
include opening the app, tapping a tile for more information, asking for directions, or reserving a 152
shared mobility service. To provide transportation information to the users, the application needs 153
to identify individual user devices and the locations of those devices. While the dataset is very 154
detailed in terms of activities and data queries, it is geared towards the operation of the 155
smartphone application, as opposed to answering research questions. Names or demographic 156
variables are not requested nor stored, which protects the anonymity of users. 157
158
DATA HARMONIZATION AND DESCRIPTIVE STATISTICS 159
While both representing Uber rides, the TLC and Transit app data sets have differences 160
that need to be addressed in order to make proper comparisons. 161
Probably the largest limiting factor is the restriction to New York City. Both the Transit 162
app and Uber operate globally, thus both companies have the potential to produce similar data 163
sets across jurisdictions. This parallel in itself can be valuable for transportation researchers who 164
are typically limited by data collected by government authorities serving specified geographies. 165
However, in this case, while the available Transit app data is global, the available Uber origin 166
data was filtered through the New York TLC. As a result, this paper’s analysis is limited to 167
comparing Uber trips against Transit app activity in New York City only. 168

Davidson, Peters & Brakewood 7
7
Further, while both the TLC and the Transit app have Uber data from 2015, the binning 169
of the more recent 2015 TLC data into taxi zones is a very rough spatial resolution, which results 170
in difficulty spatially assessing whether a trip was influenced by the transit system. Alternatively, 171
the raw latitude/longitude coordinates found in the 2014 TLC data allow us to look at the 172
dispersion of Uber origins with higher precision. Unfortunately, the Transit app did not offer the 173
Uber Request feature until 2015. Therefore, we are left comparing data from consecutive years 174
(TLC-Uber in 2014 to Transit app-Uber in 2015). While this would be nearly a non-issue for 175
established transport services, major differences might be present for these fast growing start-ups 176
in the span of one year. 177
To understand if the TLC data is spatially different in different years, the 2014 TLC data 178
was put into the same taxi zone bins as the 2015 data. The result was that even though the growth 179
in the total number of trips was substantial, the proportional change per taxi zone was small. By 180
broadly aggregating trips that originated inside the Central Business District (CBD) versus 181
outside of it, the percentage of trips outside the CBD increased by just 6.3% of total trips, even 182
though the total count of trips grew by nearly 225% system wide. 183
184
Table 1: Basic comparisons between data sources. 185
Year Time frame n Growth In CBD* %CBD Data type
TLC - Uber origins
2014 6-mo (Apr-Sept)
4,412,080 NA
3,360,280 76.2% Lat/Long
2015 6-mo (Jan-June)
14,271,895 223.5%
9,974,257 69.9% Binned by zones
Transit application - Uber
requests
2015 6-mo (Apr-Sept)
32,398 NA
4,205 13.0% Lat/Long
*CBD (Central Business District) is defined as Manhattan south of 110th St and is based on the exclusive service
area for Yellow Taxis
186
Viewing the table above, an immediate comparison between the TLC and the Transit app 187
data is apparent. It is clear that unlike the TLC population data set, the Transit app population is 188
strongly dispersed outside of the CBD. In the 2015 sample, nearly 87% of Transit app Uber 189
requests occurred outside of the CBD, while just 30% of total Uber trips occurred outside of the 190
CBD. Further confirming this dispersion is a GIS kernel density analysis. The maps in Figures 2 191
& 3 show the relative density of Uber origins for the TLC and Transit app samples. These maps 192
lay bare two observations: 1) that the TLC-Uber sample is highly concentrated into the 193
Manhattan CBD, and 2) that the Transit app-Uber sample shows a higher cluster of activity near 194
subway stations - especially outside the CBD. This observation is further confirmed with an 195
exploratory histogram of the two data sets (Figure 4). The Transit app has a much higher 196
percentage of trips within 250 feet of a transit station than the TLC data set. Additionally, the 197
entire dataset is more gradually distributed than the TLC data. Further exploration of these key 198
observations is the main focus of this paper. 199

Davidson, Peters & Brakewood 8
8
200
Figure 4: Histogram of Uber requests by data set and distance from the subway. 201
202 METHODOLOGY 203
In order to relate Uber trip origins to transit locations, both data sets needed to be 204
spatially related using a GIS system and then tabulated. This relationship allowed for a 205
calculation of the distance from each Uber origin point to the nearest transit station. Stations 206
were further designated as transfer stations (where users could change lines other than between 207
local and express), and end-of-line stations at the terminus. These designations added a 208
dimension that permitted evaluation of whether people were more likely to request an Uber near 209
transit where a transfer would also be likely due to the presence of other high frequency services. 210
Another important grouping of the data sets involved determining if an origin point 211
occurred in the Manhattan Central Business District. For the purposes of this paper, that area is 212
defined as Manhattan south of 110th Street, which is also the exclusive service territory for 213
Yellow taxis. (In 2013 the Green Taxi program was started to serve upper Manhattan and the 214
Boroughs as approximately 80% of all Yellow taxi trips began and ended south of Harlem. A 215
Green taxi ride must either begin or end outside of this zone.) The CBD designation is important 216
because the geography, density, and land-use of this area of Manhattan means that nearly all 217
Davidson, Peters & Brakewood 9
9
activities will occur near subway service, so it is more tenuous to connect Uber activity directly 218
to subway activity in this area rather than outside of it. For this reason, this paper evaluated the 219
data from the CBD separately from the other data points. To count the records, this paper 220
assigned each record in a 100% sample of the Transit app 2015 data (n=32,398) and a 5% 221
random sample of the much larger TLC 2014 data (n=220,604 of 4,412,080) with a subway, 222
transfer, and end-of line distance field as well as a CBD flag. Using these calculations, the 223
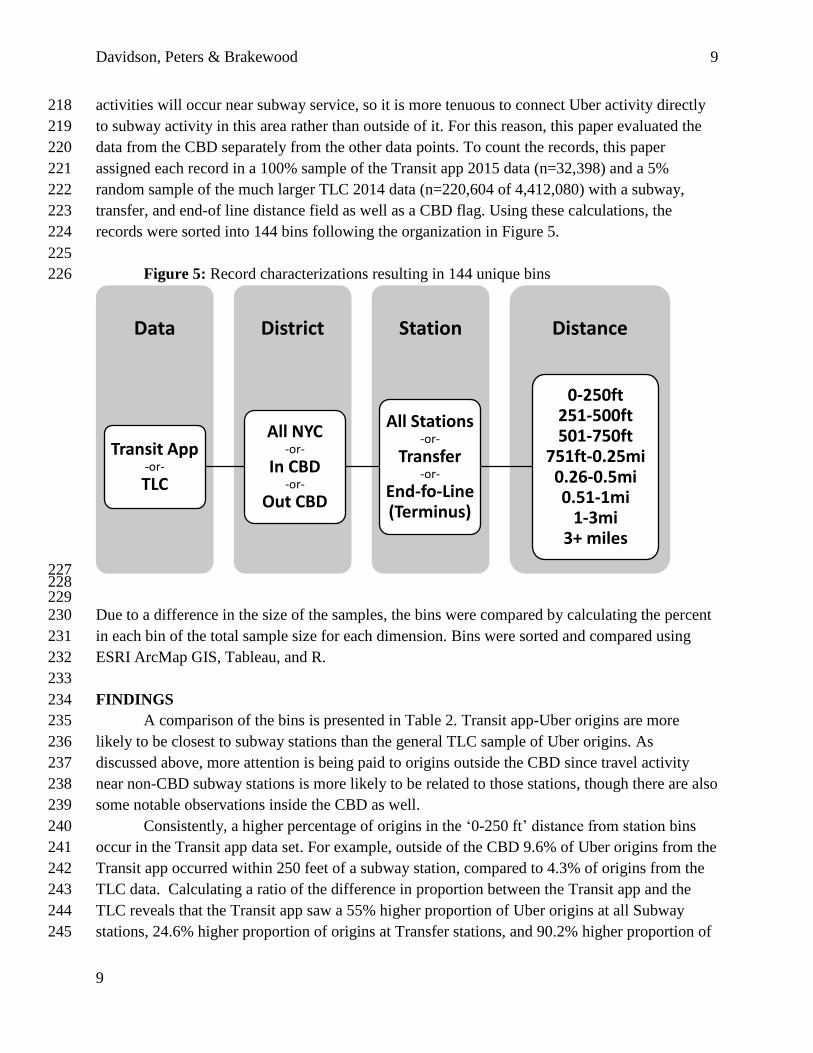
records were sorted into 144 bins following the organization in Figure 5. 224
225
Figure 5: Record characterizations resulting in 144 unique bins 226
227 228 229 Due to a difference in the size of the samples, the bins were compared by calculating the percent 230
in each bin of the total sample size for each dimension. Bins were sorted and compared using 231
ESRI ArcMap GIS, Tableau, and R. 232
233
FINDINGS 234
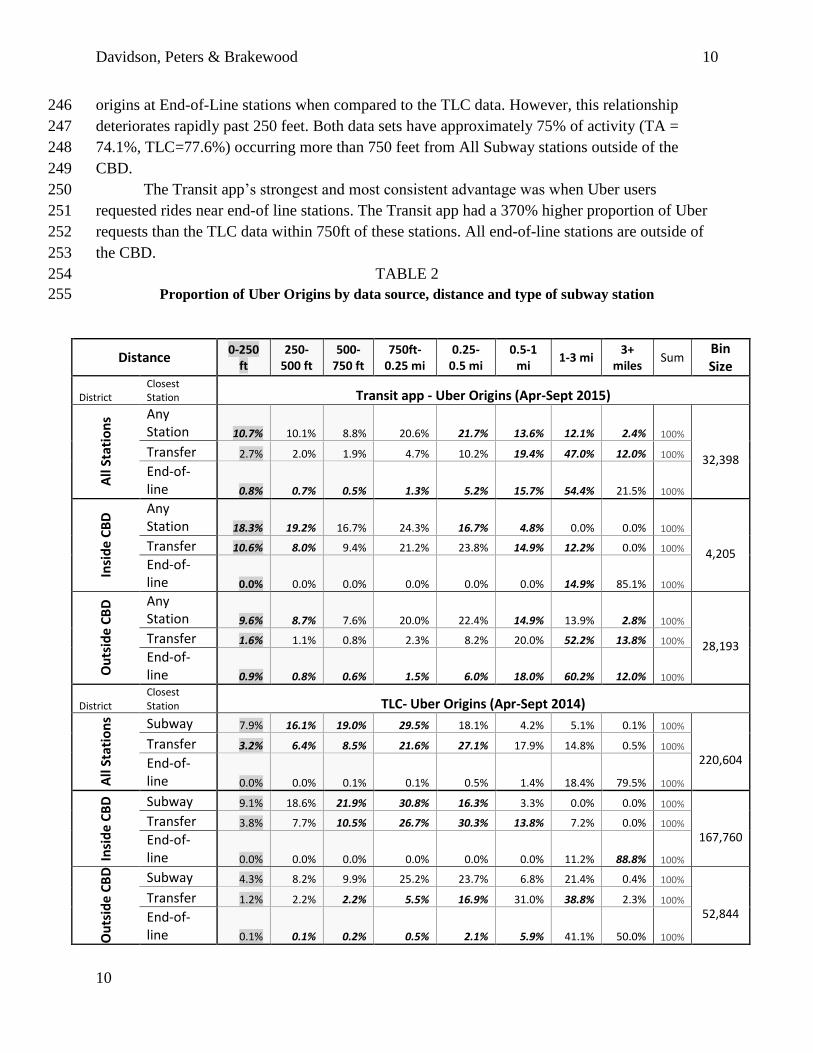
A comparison of the bins is presented in Table 2. Transit app-Uber origins are more 235
likely to be closest to subway stations than the general TLC sample of Uber origins. As 236
discussed above, more attention is being paid to origins outside the CBD since travel activity 237
near non-CBD subway stations is more likely to be related to those stations, though there are also 238
some notable observations inside the CBD as well. 239
Consistently, a higher percentage of origins in the ‘0-250 ft’ distance from station bins 240
occur in the Transit app data set. For example, outside of the CBD 9.6% of Uber origins from the 241
Transit app occurred within 250 feet of a subway station, compared to 4.3% of origins from the 242
TLC data. Calculating a ratio of the difference in proportion between the Transit app and the 243
TLC reveals that the Transit app saw a 55% higher proportion of Uber origins at all Subway 244
stations, 24.6% higher proportion of origins at Transfer stations, and 90.2% higher proportion of 245
DistanceStationDistrictData
Transit App-or-
TLC
All NYC-or-
In CBD-or-
Out CBD
All Stations-or-
Transfer-or-
End-fo-Line(Terminus)
0-250ft251-500ft501-750ft
751ft-0.25mi0.26-0.5mi0.51-1mi
1-3mi3+ miles
Davidson, Peters & Brakewood 10
10
origins at End-of-Line stations when compared to the TLC data. However, this relationship 246
deteriorates rapidly past 250 feet. Both data sets have approximately 75% of activity (TA = 247
74.1%, TLC=77.6%) occurring more than 750 feet from All Subway stations outside of the 248
CBD. 249
The Transit app’s strongest and most consistent advantage was when Uber users 250
requested rides near end-of line stations. The Transit app had a 370% higher proportion of Uber 251
requests than the TLC data within 750ft of these stations. All end-of-line stations are outside of 252
the CBD. 253
TABLE 2 254
Proportion of Uber Origins by data source, distance and type of subway station 255
Distance 0-250
ft 250-
500 ft 500-
750 ft 750ft-
0.25 mi 0.25-
0.5 mi 0.5-1
mi 1-3 mi
3+ miles
Sum Bin Size
District Closest Station Transit app - Uber Origins (Apr-Sept 2015)
All
Stat
ion
s Any Station 10.7% 10.1% 8.8% 20.6% 21.7% 13.6% 12.1% 2.4% 100%
32,398
Transfer 2.7% 2.0% 1.9% 4.7% 10.2% 19.4% 47.0% 12.0% 100%
End-of-line 0.8% 0.7% 0.5% 1.3% 5.2% 15.7% 54.4% 21.5% 100%
Insi
de
CB
D Any
Station 18.3% 19.2% 16.7% 24.3% 16.7% 4.8% 0.0% 0.0% 100%
4,205 Transfer 10.6% 8.0% 9.4% 21.2% 23.8% 14.9% 12.2% 0.0% 100%
End-of-line 0.0% 0.0% 0.0% 0.0% 0.0% 0.0% 14.9% 85.1% 100%
Ou
tsid
e C
BD
Any Station 9.6% 8.7% 7.6% 20.0% 22.4% 14.9% 13.9% 2.8% 100%
28,193
Transfer 1.6% 1.1% 0.8% 2.3% 8.2% 20.0% 52.2% 13.8% 100%
End-of-line 0.9% 0.8% 0.6% 1.5% 6.0% 18.0% 60.2% 12.0% 100%
District Closest Station TLC- Uber Origins (Apr-Sept 2014)
All
Stat
ion
s Subway 7.9% 16.1% 19.0% 29.5% 18.1% 4.2% 5.1% 0.1% 100%
220,604
Transfer 3.2% 6.4% 8.5% 21.6% 27.1% 17.9% 14.8% 0.5% 100%
End-of-line 0.0% 0.0% 0.1% 0.1% 0.5% 1.4% 18.4% 79.5% 100%
Insi
de
CB
D
Subway 9.1% 18.6% 21.9% 30.8% 16.3% 3.3% 0.0% 0.0% 100%
167,760
Transfer 3.8% 7.7% 10.5% 26.7% 30.3% 13.8% 7.2% 0.0% 100%
End-of-line 0.0% 0.0% 0.0% 0.0% 0.0% 0.0% 11.2% 88.8% 100%
Ou
tsid
e C
BD
Subway 4.3% 8.2% 9.9% 25.2% 23.7% 6.8% 21.4% 0.4% 100%
52,844
Transfer 1.2% 2.2% 2.2% 5.5% 16.9% 31.0% 38.8% 2.3% 100%
End-of-line 0.1% 0.1% 0.2% 0.5% 2.1% 5.9% 41.1% 50.0% 100%

Davidson, Peters & Brakewood 11
11
Bold figures in the Transit app data are greater than the equivalent cell in the TLC data, and vice-versa. Users of the Transit app were more likely to book an Uber within 250 feet of a subway station than the general (TLC) population of Uber users.
256
The TLC data has one small, but interesting advantage against the Transit app when 257
evaluating the proportion of trips for 0-250 feet from Transfer stations across the entire city 258
(2.7% of Transit app-Uber origins versus 3.2% of TLC-Uber origins). However, when this 259
proportion is broken into districts of inside and outside of the CBD, the Transit app has the 260
advantage in both categories. This advantage is due to the TLC data’s being heavily concentrated 261
in the dense CBD where many transfer stations are located, resulting in a closer median distance 262
to transfer stations for the entire TLC data set. However, when sorting into Inside and Outside 263
the CBD for both data sets, the Transit app actually reveals a higher concentration around 264
transfer stations in both districts compared to the TLC data. The kernel density map in Figures 2 265
& 3 explains this paradox: it shows that in the CBD, the Transit app has a high concentration of 266
trips near major transfer hubs such as Penn Station, Grand Central Terminal, Fulton St and the 267
Port Authority Bus Terminal, while the TLC data is most concentrated in commercial and office 268
districts such Midtown East and nighttime entertainment districts like the Meat Packing District 269
and the Lower East Side. Thus a higher proportion of origins in the CBD leads to a closer 270
median value for the entire TLC data, but the Transit app data is actually more concentrated near 271
major transfer points inside and outside the CBD. 272
273
DISCUSSION AND FUTURE RESEARCH 274
By combining the wealth of transportation options made visible by mobility aggregators 275
such as the Transit app, with TNCs such as Uber, travelers have more tools to enable them to 276
execute trips that match their preferences for speed, convenience, and cost. The Transit app in 277
particular is geared towards smartphone users who would like to consider transit options first, 278
while also helping them find other modes of transport as a part of their journeys. 279
The results of this specific analysis provide early evidence of the idea that utilizing 280
interactive, dynamic and contextual transport information about many modes on a modern 281
smartphone can result in multi-modal trips. Our key finding is that Transit app users have a 282
higher incidence of Uber requests immediately next to a subway station than the general 283
population of Uber users. If the user did not hope to take transit, it is unlikely that they would 284
have opened the Transit app just to request an Uber when the Uber app would still have to be 285
used to complete the transaction. The Transit app’s data suggests that for a Transit app user the 286
TNC acts as an accessible transit complement helping people if the user’s public transit option 287
was not suitable or desirable for that particular trip. For some trips, the TNC may act as a 288
substitute for transit after viewing options on the Transit app. However, this behavior still 289
complements a general habit of using transit. The improved ease of accessing the different 290
options may sustain the use of public transit in general, thus still behaving as a complement to 291
the transit system overall. 292

Davidson, Peters & Brakewood 12
12
The strength of the findings – both in its logic and in the data – is strongest for origins 293
closest to the transit stop, particularly outside of dense activity areas such as Manhattan’s Central 294
Business District. Continued research involving the evidence presented here is proceeding with 295
statistical analysis to quantify the significance of these findings. As research into this relationship 296
progresses into the future, new data should also be made available to researchers and 297
transportation departments to understand how these services can impact public infrastructure and 298
policy needs. Future qualitative research should include travel surveys to verify how people use 299
mobility aggregators to complete specific trips that may involve more than one travel mode. 300
The phenomenon of shared mobility and real-time transport information is evolving 301
quickly due to the transformations wrought by the prevalence of TNCs and mobility aggregators 302
worldwide. Both services were barely available 5-years ago, but have grown to be quite 303
prevalent in urban environments. As these services continue to evolve new transportation 304
behaviors will evolve around them. This area of research should grow in significance as the use 305
of TNCs and mobility aggregators continue to revolutionize users’ abilities to control their own 306
transportation outcomes. 307
308
ACKNOWLEDGEMENTS 309
The authors acknowledge the Transit application for sharing their data, and we are particularly 310
grateful to Jake Sion. This research was supported in part by a 2015 City University of New 311
York (CUNY) Collaborative Incentive Research Grant (CIRG) grant and a 2016 University 312
Transportation Research Center (UTRC) faculty-initiated grant. 313

Davidson, Peters & Brakewood 13
13
REFERENCES 314
315
1. Line, T., Jain, J., & Lyons, G. (2011, November). The role of ICTs in everyday mobile lives. 316
Journal of Transport Geography, 19(6), 1490-1499. 317
2. Davidson, A. (2014). The Role of Information Communication Technologies in Making 318
Transportation Decisions: An Exploratory Study. New York Metropolitan Transportation 319
Council, September 11th Memorial Fellowship Program, New York. 320
3. Allenby, B. (2008). Complexity in urban systems: ICT and transportation. IEEE International 321
Symposium on Electronics and the Environment, 1-3. 322
4. Hans, G. (2004, March). Towards a Sociological Theory of the Mobile Phone. Sociology in 323
Switzerland: Sociology of the Mobile Phone(Release 3.0). Zurich, Switzerland. Retrieved 324
from http://socio.ch/mobile/t_geser1.htm 325
5. Aguilera, A., Guillot, C., & Rallet, A. (2012). Mobile ICTs and physical mobility: Review and 326
research agenda. Transportation Research Part A, 664-672. 327
6. Thrift, N., & French, S. (2002). The Automatic Production of Space. Transactions of the 328
Institute of British Geographers, 27(3), 309-335. 329
7. Jain, J. C. (2006). Bypassing and WAPing: Reconfiguring Timetables for Real Time Mobility. 330
In M. Sheller, & J. Urry, Mobile Technologies of the City (pp. 79-101). London: 331
Routledge. 332
8. Taylor, B. D. (Chair) (2016). Between Public and Private Mobility: Examining the Rise of 333
Technology-Enabled Transportation Services. Washington, DC: Transportation Research 334
Board. Retrieved from http://onlinepubs.trb.org/onlinepubs/sr/sr319.pdf 335
9. Benkler, Y. (2004, November). Sharing Nicely: On Shareable Goods and the Emergence of 336
Sharing as a Modality of Economic Production. The Yale Law Journal, 114(2), 273-358. 337
10. Bottsman, R., & Woo, R. (2010). What's Mine is Yours: The Rise of Collaboartive 338
Consumption. New York: HarperCollins Publishers. 339
11. Bender, A. (2015, April 10). Uber's Astounding Rise: Overtaking Taxis In Key Markets. 340
Forbes. Retrieved from http://www.forbes.com/sites/andrewbender/2015/04/10/ubers-341
astounding-rise-overtaking-taxis-in-key-markets/ 342
12. Davidson, A., & Ames-Fischer, L. (2015). (Re)Producing Transport Systems: Uber, 343
Driverless Technology, and the Modern City. TRB 94th Annual Meeting Compendium of 344
Papers (p. 18p). Washington, DC: Transportation Research Board. 345
13. Brakewood, C., Barbeau, S., & Watkins, K. (2014). An experiment evaluating the impacts of 346
real-time transit information on bus riders in Tampa, Florida. Transportation Research 347
Part A: Policy and Practice, 69, pp. 409-422. 348

Davidson, Peters & Brakewood 14
14
14. Ferris, B., Watkins, K., & Borning, A. (2010). OneBusAway: Results from Providing Real-349
Time Arrival Information for Public Transit. Proceedings of the SIGCHI Conference on 350
Human Factors in Computing Systems (pp. 1807-1816). ACM. 351
15. Tang, L., & Thakuriah, P. (2012). Will the Psychological Effects of Real-time Transit 352
Information Systems Lead to Ridership Gain? Transportation Research Record, 2216, 353
67-74. 354
16. Bialik, C., Fischer-Baum, R., & Mehta, D. (2015, December 9). Is Uber Making NYC Rush-355
Hour Traffic Worse? Retrieved July 2016, from FiveThirtyEight.com: Is Uber Making 356
NYC Rush-Hour Traffic Worse? 357
17. Fischer-Baum, R. (2015, October 13). Uber Is Taking Millions Of Manhattan Rides Away 358
From Taxis. Retrieved July 2016, from FiveThirtyEight.com: 359
http://fivethirtyeight.com/features/uber-is-taking-millions-of-manhattan-rides-away-360
from-taxis/ 361
18. FiveThirtyEight.com. (2015, September 22). uber-tlc-foil-response. Retrieved July 2016, 362
from GitHub: https://github.com/fivethirtyeight/uber-tlc-foil-response 363
19. Transit app. (2015). 'uber-request' table. 364
365

Y
Y
Y
Y
Y
Y
Y
Y
YY
Y
Y
Y
YY
Y
YYYY
Y
Y
Y
Y
Y
YYY
Y
Y
YYY
YY
Y
Y
Y
Y
Y
YY
Y
YYY
Y
Y
Y
Y
Y
Y
Y
YYY
Y
Y
)
)
)
)
)
) )
)
)
)
)
)
)
)
)
)
)
)
)
)
)
)
Legend
Density of Uber OriginsValue
Central Business District) End-of-Line StationsY Transfer Stations
Subway routes
High : 8,000 per sq. mile
Low : 0
±
Density of Uber Originsreported by the TLC for 2014
(All other subway stationsremoved for clarity)
Source: New York City Taxi and Limousine Commission via FiveThirtyEight.com (2015)

Y
Y
Y
Y
Y
Y
Y
Y
YY
Y
Y
Y
YY
Y
YYYY
Y
Y
Y
Y
Y
YYY
Y
Y
YYY
YY
Y
Y
Y
Y
Y
YY
Y
YYY
Y
Y
Y
Y
Y
Y
Y
YYY
Y
Y
)
)
)
)
)
) )
)
)
)
)
)
)
)
)
)
)
)
)
)
)
)
Legend
Density of Uber OriginsValue
Central Business District) End-of-Line StationsY Transfer Stations
Subway routes
High : 8,000 per sq. mile
Low : 0
±
(All other subway stationsremoved for clarity)
Density of Uber Originsfrom the Transit App for 2015
Source: The Transit App (2016)