interaction design project - delhi metro
TRANSCRIPT

DELHI METRO
Design Project : Interfaces and Interactions
Karan Dudeja

MOTIVATION

Want to provide a solution for a comfortable ride.

I empathize with them
I empathize with them.

I empathize with them
Interaction design based on crowd behavior, with an inclusive approach.

IDEA

Making the metro ride comfortable by providing relevant information that would allow a hassle free journey.

PRECEDENT STUDY

X Ray Train Vision New York City Subway by Ahsayane Studio

USER RESEARCH

Primary research conducted in Delhi Metro in September 2013. Talking to the travellers was a revelation.

“..you never know when or where you’ll get a seat..” “..preparing myself to be lightning fast to grab a seat when a train is about to arrive..”

“..so if I ever get a seat, then its a great day for me & it makes me euphoric..” “..sometimes I don’t understand how many coaches the coming metro will have.”
Results of survey in secondary research phase revealed 73% people claiming they would have a better travelling experience with lesser crowded trains.

SYSTEM ARCHITECTURE

Train HUB
Central Network Station
Station HUB Train HUB
Data of Smart Cards and Tokens
Predictive Analysis Algorithm for Smart Cards
Analysis of Token data
Data from in-coach system and data from the station token counters
On platforms In the train coaches Smart Cards Tokens

CONCEPT

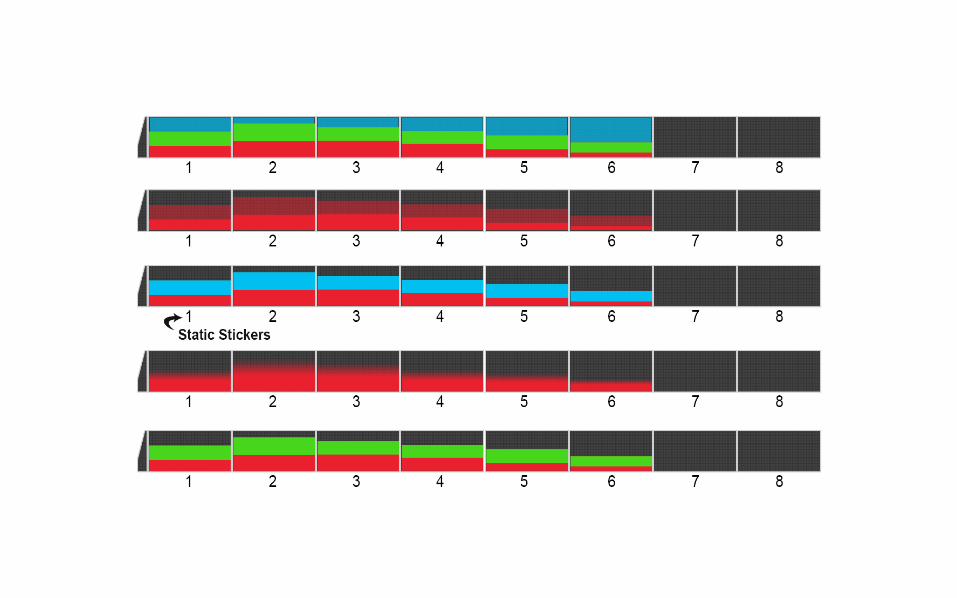
At the first level, there will be coach wise traffic density information provided inside the train for the travellers.

At the second level, coach wise traffic density will be displayed on the platforms for the waiting passengers to help them decide which coach to board.

CONCEPTUAL PROTOTYPES

a) Image Processing ; Background Subtraction Method

a) Image Processing ; Background Subtraction Method

b) Image Processing ; Blob Detection Method

b) Image Processing ; Blob Detection Method

EXPLORATIONS


DEMONSTRATION


The interactive display to exhibit redesign of already existing high intensity LED boards on the platforms, was simulated on an android device. It responded for two coaches as per the model, rest were extrapolated.

REFERENCES

Books: Mapping patterns of Information – Manuel Lima Interactive Data Visualisation – Mathew Ward & Daniel Kleim Data Flow: Visualizing Information in Graphic Design - R Klanten Wayfinding – Craig M. Berger Visual Thinking of Design – J Steele & Noah Iliinsky Designing Systems at a Scale – F Dust & Ilya Prokopoff Internet: www.visual.ly www.interaction-design.org

THANK YOU