interacting galaxies in the a901/902 supercluster …
TRANSCRIPT

Submission to the Astrophysical Journal on October 1, 2008
Preprint typeset using LATEX style emulateapj v. 25/04/01
INTERACTING GALAXIES IN THE A901/902 SUPERCLUSTER WITH STAGES
Amanda Heiderman1, Shardha Jogee1, Irina Marinova1, Eelco van Kampen9, MarcoBarden9, Chien Y. Peng5,6, Catherine Heymans12, Meghan E. Gray2, Eric F. Bell4, David
Bacon7, Michael Balogh8, Fabio D. Barazza3, Asmus Bohm10, John A.R. Caldwell16,Boris Haußler2, Knud Jahnke4, Kyle Lane2, Daniel H. McIntosh13, Klaus
Meisenheimer4, Sebastian F. Sanchez11, Rachel Somerville4, Andy Taylor12, LutzWisotzki10, Christian Wolf14, & Xianzhong Zheng15
Submission to the Astrophysical Journal on October 1, 2008
ABSTRACT
We present a study of interacting galaxies and the influence of environment in the Abell 901/902supercluster at z ∼ 0.165, based on 762 bright, intermediate mass (MV ≤ −18; M > 1 × 10⁹ M)galaxies. We use HST ACS F606W data from the STAGES survey, COMBO-17, Spitzer 24µm andXMM-Newton X-ray data. We use visual classification, as well as quantitative CAS parameters toestimate the fraction (fint) of interacting galaxies, which are likely candidates for interactions of stellarmass ratio M1/M2 > 1/10. Our results are: (1) We find, based on visual classification, that fint is5.0 ± 1.3%, with at least 1.6±0.6% being major interactions (1/4 < M1/M2 ≤ 1), at least 1.0 ± 0.4%being minor interactions (1/10 < M1/M2 ≤ 1/4), and 2.4±0.7% being ambiguous cases of major orminor interactions. (2) The interacting galaxies are found to lie outside the cluster core: this is likelydue to the large galaxy velocity dispersion in that region. Instead, they lie at 0.25 Mpc < R ≤ 1.2Mpc, between the core and viral radius. In this region, the estimated frequency and number densityof mergers are similar to those seen at typical group overdensities in N -body simulations of accretinggroups in the A901/902 clusters. (3) For interacting galaxies, the fraction of galaxies on the blue cloud is61±14% (23/38) versus 35±7% (251/720) for non-interacting galaxies, implying that interacting galaxiesare preferentially blue in A901/902. (4) The average SFR, based on UV or/and IR data, is enhanced bya factor of ∼ 1.2 to 3 in interacting galaxies compared to non-interacting galaxies. However, interactinggalaxies only contributes ∼ 20% of the total SFR density in the A901/902 clusters, while the rest of theSFR density comes from non-interacting galaxies.
Subject headings: Galaxies: Interactions, Galaxies: Evolution, Galaxies: Formation, Galaxies:Structure, Galaxies: Clusters: General, Galaxies: Clusters: Individual (A901, A902),Galaxies: Clusters: Individual: Alphanumeric: A901, Galaxies: Clusters: Individual:Alphanumeric: A902
1. introduction
Understanding how galaxies evolve in various environ-ments (field, groups, and clusters), and as a function ofredshift is a key step toward developing a coherent pictureof galaxy evolution. Present-day cluster and field galaxiesdiffer due to several factors, which are often grouped underthe umbrella of ‘nature’ versus ‘nurture’. Firstly, in colddark matter (CDM) cosmogonies, the first galaxies formed
and evolved early in cluster cores, as the higher initial over-densities led to faster gravitational collapse and more rapidmergers of proto-galaxies (e.g., Cole et et al. 2000; Stein-metz & Navarro 2002). Secondly, in the context of thebottom-up CDM assembly paradigm, the outer parts ofclusters and superclusters, grow at late times via merg-ers, smooth accretion, and discrete accretion of groupsand field galaxies. This idea is supported by observa-
1 Department of Astronomy, University of Texas at Austin, 1 University Station C1400, Austin, TX 78712-02592 School of Physics and Astronomy, The University of Nottingham, University Park, Nottingham NG7 2RD, UK3 Laboratoire d’Astrophysique, Ecole Polytechnique Federalede Lausanne (EPFL), Observatoire, CH-1290 Sauverny, Switzerland4 Max-Planck-Institut fur Astronomie, Konigstuhl 17, D-69117, Heidelberg, Germany5 NRC Herzberg Institute of Astrophysics, 5071 West Saanich Road, Victoria, V9E 2E7, Canada6 Space Telescope Science Institute, 3700 San Martin Drive, Baltimore, MD 21218, USA7 Institute of Cosmology and Gravitation, University of Portsmouth, Hampshire Terrace, Portsmouth, PO1 2EG, UK8 Department of Physics and Astronomy, University Of Waterloo, Waterloo, Ontario, N2L 3G1, Canada9 Institute for Astro- and Particle Physics, University of Innsbruck, Technikerstr. 25/8, A-6020 Innsbruck, Austria10 Astrophysikalisches Insitut Potsdam, An der Sternwarte 16, D-14482 Potsdam, Germany11 Centro Hispano Aleman de Calar Alto, C/Jesus Durban Remon 2-2, E-04004 Almeria, Spain12 The Scottish Universities Physics Alliance (SUPA), Institute for Astronomy, University of Edinburgh, Blackford Hill, Edinburgh, EH9 3HJ,UK13 Department of Astronomy, University of Massachusetts, 710 North Pleasant Street, Amherst, MA 01003, USA14 Department of Astrophysics, Denys Wilkinson Building, University of Oxford, Keble Road, Oxford, OX1 3RH, UK15 Purple Mountain Observatory, National Astronomical Observatories, Chinese Academy of Sciences, Nanjing 210008, PR China16 University of Texas, McDonald Observatory, Fort Davis, TX 79734, USA
1

2 Heiderman et al.
tional studies (e.g., Zabludoff & Franx 1993; Abraham etal. 1996a; Balogh, Navarro & Morris 2000), which sug-gest clusters continuously grew by the accretion of groups.Thirdly, the dominant physical processes affecting galax-ies differ in cluster and field environments due to the dif-ferent galaxy number density, galaxy velocity dispersion,and intracluster medium (ICM) density. Among these pro-cesses are close galaxy-galaxy interactions, such as strongtidal interactions and mergers (e.g., Barnes 1992; Moore etal. 1998) and galaxy harassment (e.g., Moore et al. 1996),which stems from the cumulative effect of weak interac-tions. Furthermore, in clusters where the hot ICM makesup as much as 15% of the total mass, galaxy-ICM interac-tions, such as ram pressure stripping (Gunn & Gott 1972;Larson et al. 1980; Quilis et al. 2000; Balogh, Navarro &Morris 2000), can play an important role in removing thediffuse gas from galaxies. The tidal field of the clusterpotential may also play a relevant role in the dynamicalevolution of cluster galaxies (Gnedin 2003).
Systematic studies of the differences between cluster,group, and field galaxies at different redshifts are neededto shed light on the relative importance of these differ-ent processes in different environments. Several differenceshave been observed between galaxies in the field and thosein the rich cluster environment, but the physical driversbehind these variations are still under investigation. Atz ∼ 0, the relative percent of massive early type (E+S0)galaxies to spirals rises from (10%+10%:80%) in the fieldto (40%+50%:10%) in the cores of very rich clusters, lead-ing to the so-called morphology density relation (Dressler1980; Dressler et al. 1997). However, recent Sloan Dig-ital Sky Survey (SDSS) studies suggest that masses andstar formation (SF) histories of galaxies are more closelyrelated to galaxy environment than are their structuralproperties (Blanton et al. 2005). The SF histories of galax-ies depend on both luminosity (Cole et al. 2001) andenvironment (Diaferio et al. 2001; Koopmann & Kenney2004). The fraction of blue galaxies in clusters appearsto rise with redshift, also know as the Butcher Oemlereffect (Butcher & Oemler 1978; Margoniner et al. 2001;de Propis et al. 2003). There is also evidence that SF inbright (Mv < -18) cluster galaxies is suppressed comparedto field galaxies (e.g., Balogh et al. 1998, 1999), for reasonsthat are not well understood.
Merging of cluster galaxies has been proposed as a mech-anism for the change in galaxy populations in clusters fromthat of the field (e.g., Toomre & Toomre 1972; Lavery& Henry 1988; Lavery Pierce, & McClure 1993). Under-standing the influence of the cluster environment on therate of galaxy interactions will allow us to set constraintson the importance of interactions. There have been variousstudies on the properties of galaxies (e.g., Dressler 1980,Postman & Geller 1984, Giovanelli, Haynes, & Chincarini,1986, Kennicutt 1983; Gavazzi & Jaffe 1985, Whitmore etal. 1993) and also on galaxy interactions (e.g., Lavery &Henry 1988; Lavery, Pierce, & Mclure 1992; Zepf 1993;Dressler et al. 1994; Couch et al. 1998; van Dokkum etal. 1998a, 1999; Tran et al. 2005b, 2008) in different envi-ronments. The former studies suggest that galaxy inter-actions may play a role in morphological transformationsof galaxies in clusters, but there have been few systematicstudies of interactions in clusters that utilized high reso-
lution HST images as well as Spitzer 24µm, and X-rayimages. With a resolution of 0.1′′ or 300 pc at z = 0.17,the HST images (Gray et al. 2008) allow for the iden-tification of interaction signatures such as double nuclei,arcs, and shells. Spitzer 24µm imaging (Bell et al. 2005,2007) enables for the study of the obscured star formationand X-ray maps (Gilmour et al. 2007; Grey et al. 2008, inprep) provide information of how the ICM densities changethroughout the cluster.
In this paper we present a study of the frequency, dis-tribution, color, and SF properties of strong galaxy inter-actions and the influence of environment in the A901/902supercluster at z ∼ 0.165. We use HST ACS F606W datataken as part of the Space Telescope A901/902 GalaxyEvolution Survey (STAGES; Gray et al. 2008), Spitzer24µm data (Bell et al. 2005, 2007), XMM-Newton X-ray data (Gilmour et al. 2007), dark matter (DM) massmeasurements from weak lensing (Heymans et al. 2008),and ground based COMBO-17 imaging data (Wolf etal. 2004). The dataset provides high resolution ACS-basedmorphologies, stellar masses, accurate spectrophotometricredshifts, gravitational lensing maps, and SF rates.
We present the data and sample selection in § 2. An out-line of the two different methods that we used to identifyinteracting galaxies: a physically motivated visual clas-sification system (Jogee et al. 2008a,b) complementedwith spectrophotometric redshifts, and the CAS criterion(A > 0.35 and A > S) based on CAS asymmetry A andclumpiness S parameters (Conselice et al. 2000) , are in§ 3.2 and § 3.3. In § 4.1 and 4.2, we explore the frequencyof interacting galaxies in A901/902 based on these twomethods and present one of the first systematic compar-isons to date between CAS-based and visual classificationresults in clusters. We set a lower limit on the fractionof major (those with mass ratio M1/M2 ≥ 1/4) merg-ers/interactions. In § 4.3, we examine the distributionof interacting galaxies in the A901/902 supercluster as afunction of clustocentric radius, galaxy number density,local galaxy surface density (Σ10), relative ICM density,and local DM mass surface density. In § 4.4, we compareour results to expectations based on analytical estimatesand simulations. In § 4.5, we compare our results on theA901/902 supercluster to groups and clusters at differentredshifts out to z ∼ 0.8. We investigate the fraction ofinteracting and non-interacting galaxies on the blue cloudand red sequence as a function of clustocentric radius in§ 4.6. Finally in § 4.7, we compare the star formation rate(SFR) of interacting and non-interacting cluster galaxies.The results of this work are summarized in § 5.
We assume a flat cosmology with Ωm = 1 - Ωλ = 0.3and H0 = 70 km s−1 Mpc−1 throughout this paper.
2. the a901/902 supercluster: dataset andsample selection
The A901/902 supercluster is composed of three clus-ters: A901a, A901b, and A902, and related groups (Grayet al. 2002; Heymans et al. 2008). This study utilizesdata from the STAGES survey (Gray et al. 2008), whichprovides high resolution F606W Hubble Space Telescope(HST ) Advanced Camera for Surveys (ACS) images over a0.5×0.5 field. Additional multi-wavelength data includeXMM-Newton (Gilmour et al. 2007, Gray et al. 2008b),

Interacting Galaxies in the A901/902 Supercluster 3
Spitzer 24µm data (Bell et al. 2005, 2007), and groundbased COMBO-17 imaging data (Wolf et al. 2004).
Accurate spectrophotometric redshifts and spectral en-ergy distributions, based on 5 broad bands (UBV RI) and12 medium band filters, are available from the COMBO-17project (Wolf et al. 2004). Stellar masses are taken fromBorch et al. (2006). They were derived by fitting the 17-band COMBO spectral energy distributions (SEDs) witha library of template SEDs, which were constructed usingthe PEGASE stellar population synthesis model, assum-ing different SF histories and a Kroupa (Kroupa, Tout,& Gilmore 1993) initial mass function (IMF) in the massregime 0.1–120 M. Such stellar masses are consistentwithin 10% with masses estimated using a Kroupa (2001)or Chabrier (2003) IMF17.
The ACS F606W images have an effective point spreadfunction (PSF) of ∼0.1′′, which corresponds to ∼280 pc atz ∼ 0.165 for our assumed cosmology. Thus, they providehigh resolution deep images enabling us to resolve struc-tural components such as disks, bars, bulges, spiral arms,and interaction features such as double nuclei, arcs, shells,tails, tidal debris, and accreting satellites.
Using the spectrophotometric redshifts (δz/(1+z)∼ 0.02 down to RVega of 23), we have a sample of 786bright (MV ≤ -18) galaxies. The estimated field contami-nation for this sample is ≤ 15%. We chose the cut of MV ≤-18 because E to Sd galaxies tend to dominate the clus-ter luminosity function in this luminosity range (Binggeli,Sandage, & Tammann 1988), while dwarf galaxies domi-nate at lower luminosities. We emphasize that these lu-minosity cuts are only meant to provide a separation be-tween regimes dominated by dwarf and non-dwarf galaxies,rather than a case-by-case identification of the two galaxytypes. We have also analyzed faint (-18 < MV ≤ −15.5)galaxies, but we only present the robust results for thebright sample for the following reasons. Many morpholog-ical properties (§ 3) can be more accurately characterizedin E to Sd galaxies than in smaller lower luminosity dwarfgalaxies, given the ACS PSF of ∼280 pc at the clusterredshift. Furthermore, a larger degree of contaminationfrom field galaxies arises at lower luminosities. We furtherrestrict our bright galaxy sample to include galaxies abovethe stellar mass completeness limit (M & 1× 10⁹M; 762galaxies) at the supercluster redshift. The magnitude dis-tribution of the final sample is shown in Fig. 1.
3. methodology and analysis
3.1. Interacting galaxies in this study
Before outlining the methods (§ 3.2 and § 3.3) that weuse to identify interacting galaxies, we briefly discuss thedifferent types of interactions that are of interest to ourstudy.
According to simulations, galaxy interactions of massratio M1/M2 > 1/10 tend to have a significant impacton galaxy evolution. They include major interactions,which are defined to be those with a mass ratio of 1/4< M1/M2 ≤ 1/1, as well as minor interactions with 1/10< M1/M2 ≤ 1/4. Simulations show that major mergersof stellar systems typically destroy the outer disks, trans-forming them via violent relaxation, into systems with anr1/4 de Vaucouleurs-type stellar profile, such as ellipti-
cals (e.g., Negroponte & White 1983; Barnes & Hernquist1991; Mihos & Hernquist 96; Struck 1997; Naab & Burk-ert 2001). However, it is to be noted that in some gas-rich major mergers, a disky component can form or sur-vive inside the resulting spheroidal component (Hopkinset al. 2008), producing a remnant whose overall profile isless steep than de Vaucouleurs. Irrespective of the details,the different simulations suggest that ongoing/recent ma-jor mergers are associated with arcs, shells, ripples, tidaltails, large tidal debris, extremely asymmetric light dis-tributions, double nuclei inside a common body, galax-ies linked via tidal bridges of light, and galaxies enclosedwithin the same distorted envelope of light.
Conversely, minor interactions involving a spiral and asmaller satellite will not destroy the outer disk of the spiral(e.g., Hernquist & Mihos 1995; Smith et al. 1997; Jogeeet al. 1999). Typically, the smaller companion sinks viadynamical friction, may excite warps, bars, spirals, andother non-axisymmetric perturbations, and leads to ver-tical heating, arcs, shells, ripples, tidal tails, tidal debris,warps, offset rings, and highly asymmetric light distribu-tions (e.g., Quinn et al. 1993; Hernquist & Mihos 1995; Mi-hos et al. 1995; Quinn, Hernquist, & Fullagar 1993; Smithet al. 1997; Jogee et al. 1999; Jogee 2006 and referencestherein).
In this paper, we identify interacting systems using theaforementioned morphological signatures seen in simula-tions. We consider such interacting systems to be likelycandidates for an ongoing or recent interaction of massratio M1/M2 > 1/10. We utilize two independent meth-ods to identify interacting galaxies. The first is a phys-ically motivated visual classification system (§ 3.2) sim-ilar to that developed in Jogee et al. (2008a,b). Thesecond method uses the CAS criterion (A > 0.35 andA > S), which is based on quantitative asymmetry (A),and clumpiness (S) parameters (§ 4.2) derived using theCAS code (Conselice et al. 2000).
3.2. Visual classification of interacting andnon-interacting galaxies
We visually classify F606W images of the sample of 762bright (MV ≤ -18), intermediate mass (M ≥ 1 × 10⁹M)galaxies in the A901/902 supercluster. A small fraction(below 1%) could not be classified due to image defects,low signal to noise, and a highly compact appearance.
Our visual classification scheme is illustrated in Fig. 2.We identify interacting galaxies using the morphologi-cal signatures suggested by the simulations of mass ratioM1/M2 > 1/10 outlined in § 3.1. The interacting galaxies(Fig. 2) are assigned the visual class ‘Int’, and fall in twogroups:
• ‘Int Type 1’: This first group is composed of 47%(18/38) of interacting systems that host externally-triggered distortions, similar to those identified inthe aforementioned simulations. These post-mergersignatures include tidal tails, shells, ripples, warps,strongly asymmetric tidal debris and distortions inthe disk, and double nuclei inside a common enve-lope. ‘Int Type 1’ galaxies are unambiguous cases of
17 We adopt a Chabrier (2003) IMF when exploring the contribution of mergers to the SFR (§ 4.7)

4 Heiderman et al.
interacting galaxies, since they exhibit the morpho-logical distortions induced by a strong gravitationaldisturbance. In particular, note that a strongly dis-torted galaxy is counted as ‘Int Type 1’, irrespectiveof whether it has a readily visible companion. Fur-thermore, most ’Int Type 1’ systems have morphol-ogy consistent with post-mergers such that thesesystems are counted as one galaxy merger (§ 4.4).
• ‘Int Type 2’: This class includes the rest of stronglyinteracting galaxies. A galaxy is assigned an ‘IntType 2’ class if it shows no strong morphologicaldistortions, but is indicative of late merger phasedue to having a companion which satisfies threecriteria: the companion is overlapping or in con-tact with the galaxy of interest, such that the twogalaxies share a common envelope of light; it hasthe same COMBO-17 spectrophotometric redshiftwithin the accuracy δz/(1 + z) ∼ 0.02 (§ 2); and itsstellar mass ratio satisfies M1/M2 > 1/10. Whilethe classification of a galaxy as ‘Int Type 2’ dependson spectrophotometric redshift, it is to be notedthat ‘Int Type 2’ systems are very unlikely to be beline-of-sight chance projection as the projected sep-aration d of the two galaxies is typically < 10 kpc.This is a smaller separation than that used in theidentification of close pairs, where d is <
∼20-30 kpc.Most ’Int Type 2’ systems are in the late phases ofan ongoing merger and both galaxies are counted asa single merger system when counting the numberof mergers (§ 4.4).
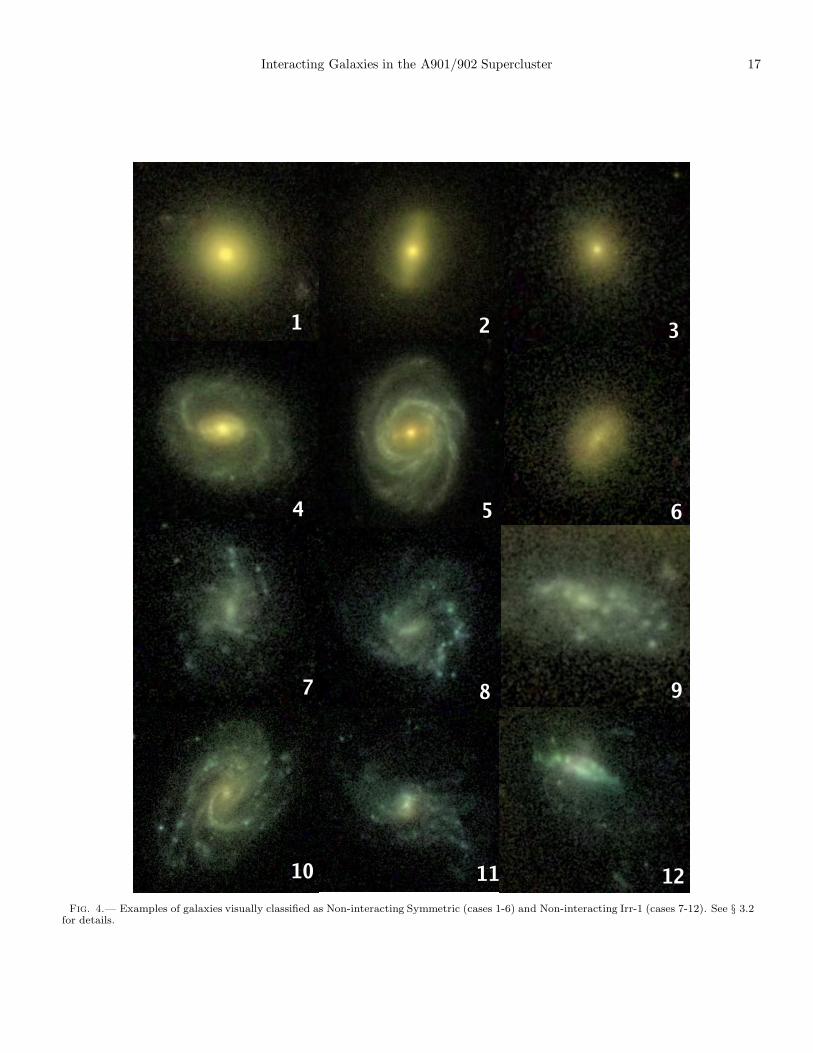
The remaining galaxies show no indication of a recentstrong interaction and are classified as non-interacting(Fig. 4). They are subdivided into two classes: Irr-1 andSymmetric:
• ‘Non-interacting Irr-1’ galaxies refer to galaxiesthat exhibit internally-triggered asymmetries, typ-ically on scales of a few hundred parsecs. Theseasymmetries are generally due to stochastic SFand/or low ratios of rotational to random velocities(Fig. 4). They can impart a clumpy morphologyto a galaxy and are different from externally-drivendistortions, such as tails and ripples, which are of-ten correlated on scales of several kpc.
• ‘Non-interacting symmetric’ galaxies are relativelyundistorted and are not associated with any over-lapping companion.
Several tests were performed on the visual classes. Thevisual classifications (VC) were calibrated by having threeclassifiers (AH, IM, SJ) train on a set of a few hundrednearby field and A901/902 cluster galaxies. The full su-percluster sample was then classified by AH and IM, withall ambiguous cases and interacting galaxies discussed byall three classifiers for final determination. Random checkson sub-samples of galaxies were performed by SJ. The dis-persion (D) between classifiers is taken to be the fractionaldifference between classifiers (δfVC/fVC), resulting in 4%,19%, 16% for Non-interacting Symmetric, Non-interactingIrr-1, and Interacting classes. We adopt a dispersion of
20% on the mean fVC, as a measure of the inherent sub-jectivity in the visual classification. All errors in fVC forour analysis are taken to be the addition of the dispersionbetween classifiers (fVC×D) and the binomial error in the
fraction (√
fVC(1 − fVC)/NVC).
3.3. CAS: Quantitative method for capturing interactinggalaxies
Using the CAS code (Conselice et al. 2000, Conselice2003a), quantitative structural parameters measuring theconcentration (C), asymmetry (A), and clumpiness (S)were derived for the supercluster galaxies. CAS was run onthe F606W images and the segmentation maps producedduring the original source extraction (Caldwell et al. 2008)were used to mask neighboring galaxies.
The concentration index (Bershady et al. 2000) corre-sponds to a measure of the ratio of 80 to 20 percent of thecurve of growth radii contained in 1.5 times the Petrosianinverted radius at r(η = 0.2) on five times the logarithmicscale:
C = 5 × log(r80%/r20%). (1)
The other two CAS parameters, asymmetry A and clumpi-ness S, are also measured within 1.5 × r(η = 0.2) radius.The asymmetry parameter is measured by subtracting agalaxy’s image from that image rotated 180 degrees fromthe galaxy’s center and normalizing by the summation ofthe absolute value of the residual intensity. The clumpi-ness parameter is a quantitative measure of the high spa-tial frequency patchiness of a galaxy. It is defined as thesummation of the difference of the galaxy’s original fluxand the flux of an image with the high frequency struc-tures muted by smoothing over a filter on order of theclumpiness, taking into account the background flux overthat same area. This measurement is then divided by thesummation of the original flux of the galaxy to obtain theclumpiness parameter (S).
Conselice et al. (2000) argue that the CAS merger cri-terion (A > S and A > 0.35) at λrest > 4500 A , can beused to capture galaxies which have have strong asymme-tries indicative of major mergers. However, calibrationsof the asymmetry value with N-body simulations (Con-selice 2006) have shown that for galaxies involved in ma-jor mergers of mass ratios 1:1 to 1:3, the asymmetries varyas a function of time during the interaction. The A valuereaches a peak near the midpoint of the interaction andfalls off both before and after this time to less than 0.35.The criterion A>0.35 is fulfilled only ∼1/3 of the timefor major mergers in these simulations while minor merg-ers of mass ratios below 1:5 have A values significantlylower than this criterion. In effect, in intermediate massfield galaxies at z ∼ 0.24 to 0.80, recent work (Jogee etal. 2008a,b; Miller et al. 2008) shows that the CAS crite-rion typically only picks up 50% to 70% of galaxies visuallytyped as being disturbed or interacting. Furthermore, atrest-frame wavelengths bluer than the B-band, A has asignificant contamination from non-interacting dusty star-forming galaxies. These results caution against using CASblindly without complementary visual classifications.
The effectiveness of the CAS criterion has not been ex-plored in cluster environments where the dominant galaxypopulation is gas-poor. In § 4.1, we present the interac-tion fraction (fCAS) from CAS and perform one of the first

Interacting Galaxies in the A901/902 Supercluster 5
systematic comparisons to date between CAS-based andvisual classification results in clusters. When citing fCAS,we adopt error bars computed by taking the systematicerrors in CAS A and S to obtain the high and low errorbars on the number of galaxies the CAS criterion picks up.
4. results and discussion
4.1. Frequency of interacting galaxies in A901/902 fromvisual classification
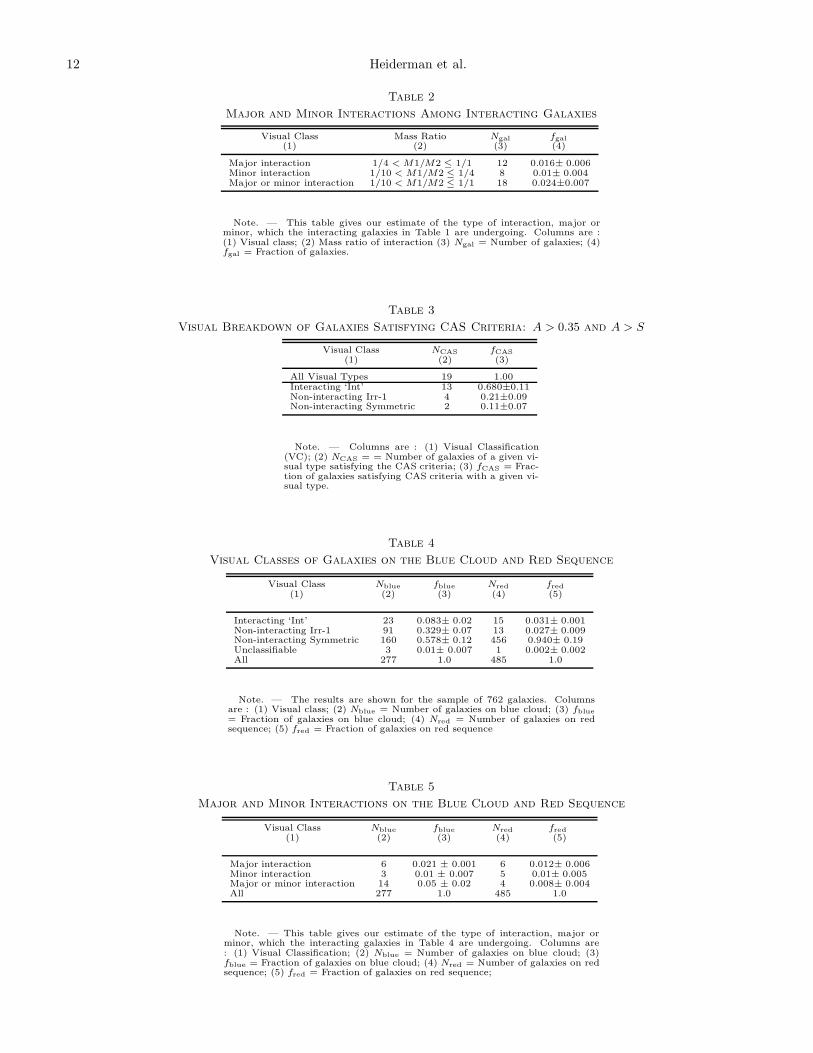
The results of the visual classifications are shown in Ta-ble 1, Fig. 3, and Fig. 4. The fraction in terms of percent ofinteracting galaxies is 38/762 or 5.0±1.3% among bright,intermediate mass (MV ≤ −18, M > 1× 10⁹ M) galaxiesin A901/902.
The systems visually classified as interacting galax-ies are likely candidates for interactions of mass ratioM1/M2 > 1/10 (§ 3.2). When comparing observationalresults to theoretical predictions or simulations, it is oftendesirable to separate interacting galaxies into major (1/4< M1/M2 ≤ 1/1) versus minor (1/10 < M1/M2 ≤ 1/4) in-teractions. But in practice, for many interacting galaxies,it is not possible to unambiguously make this distinction.since the exact level of morphological disturbances induceddepends not only on the mass ratio of the progenitors, butalso on the orbital geometry (prograde or retrograde), thegas mass fraction, and structural parameters (e.g., Mihos& Hernquist 1996; Struck 1997; Naab & Burkert 2001;Mihos et al. 1995, di Matteo et al. 2007).
In effect, many signatures could be caused by both ma-jor and minor interactions. Thus, we divide the inter-acting systems into three categories: major, minor, andmajor/minor interactions. The last category includes am-biguous cases that could be either major or minor, whilethe first two categories are clear cases of major and minorinteractions, respectively. They allow us to set lower limitsto the major and minor merger fraction.
We consider major interactions as those galaxies thatshow unique tell-tale morphological signatures or indica-tors. These include close pairs of galaxies, whose membershave a mass ratio 1/4 < M1/M2 ≤ 1, spectrophotometricredshifts match within the accuracy δz/(1 + z) ∼ 0.02,and are connected by a bridge or common envelope (Fig. 2,cases 9-11 & 13-16), and/or have a ‘train-wreck’ type mor-phology (Fig. 2, case 12).
For galaxies of class ‘Int Type 2’, we identify minor in-teractions using the same redshift criterion as above, butrestrict the mass ratios of the companion to 1/10 <M1/M2
≤ 1/4. We also include galaxies of class ‘Int Type 1’, whichhost an extended surviving disk with signs of a strong re-cent interaction, but do not have an overlapping compan-ion of mass ratio > 1/4 with similar photometric redshift.The latter condition ensures that we do not capture theearly phases of a major merger when the disks of the merg-ing galaxies are starting to get distorted before they merge.The signs of strong interactions in the outer disk includea warp, prominent tidal debris and tails, and strong large-scale asymmetries.
The results are shown in Table 2 and Fig. 3. We esti-mate that at least 1.6±0.6% of the galaxies in our sampleare undergoing a major interaction, at least 1.0±0.4% areundergoing minor interactions, and 2.4±0.7% are under-going major or minor interactions.
4.2. Frequency of interacting galaxies in A901/902 fromCAS
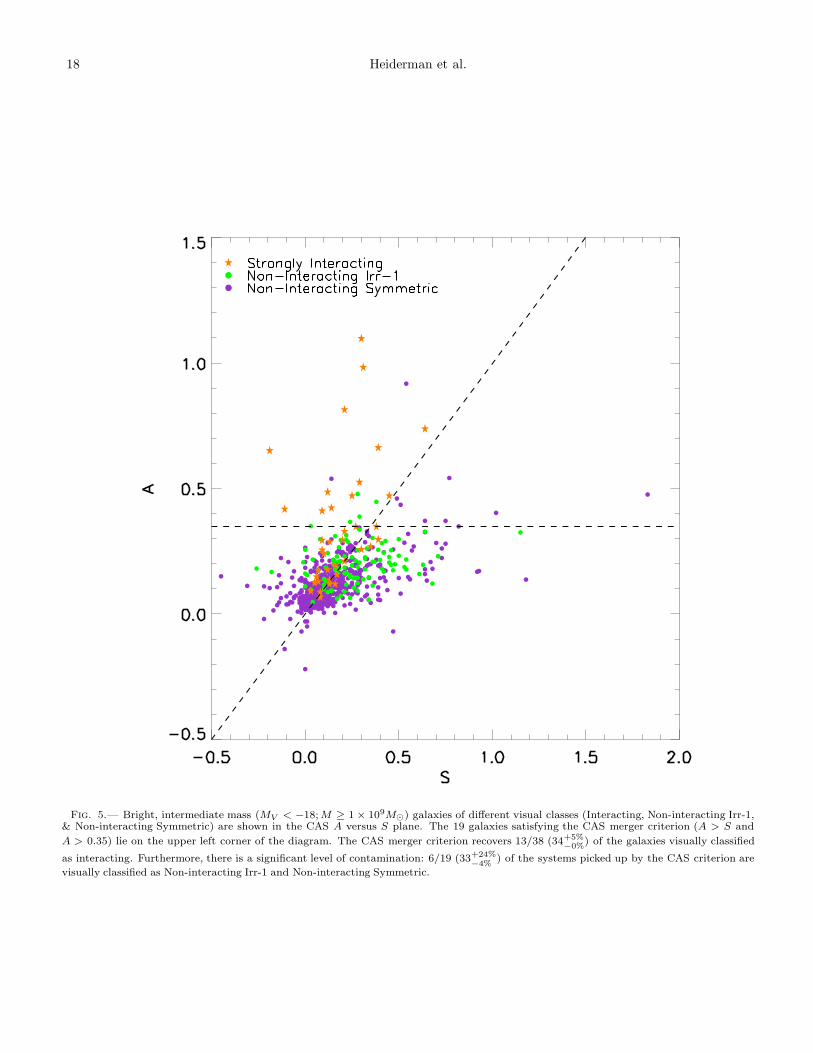
CAS results for the A901/902 supercluster sample areshown in Table 3 and Figures 5 and 6. If CAS, is used in-stead of visual classification, the fraction fCAS of stronglydistorted galaxies is 19/762 or 2.5+1.7%
−0.1%. This is a factor
of two lower than the visually-based interaction fractionfVC.
However, the comparisons of fCAS and fVC do not tellthe whole story, as the nature of the systems picked by thetwo methods can be quite different. The visual types ofthe 19 systems captured by the CAS criterion is shown in
Table 3. About 6/19 (33+24%−4% ) of the CAS mergers turn
out to be non-interacting systems, as shown by Fig. 5 andTable 3. Fig. 6 shows examples of these contaminants:they tend to be dusty highly inclined galaxies and systemswith low level asymmetries that seem to be caused by SF.The remaining 13 CAS mergers are visually classified asinteracting.
It is also useful to ask what fraction of the visually-identified interacting galaxies meet the CAS criterion. In
effect, the CAS criterion only captures 13 of the 38 (34+5%−0%)
visually-identified interacting galaxies (Fig. 5). Fig. 6shows examples of interacting galaxies missed by CAS :the missed systems include galaxies with fainter outer tidalfeatures, double nuclei where CAS puts the center betweenthe nuclei, and pairs of very close connected galaxies.
Since the CAS criterion is widely used to pick majormergers, it is interesting to ask if it has a significantlyhigher capture fraction for the interacting galaxies thatwe consider major mergers. This is not found to be thecase as the CAS merger criterion recovers 5/12 (42+0%
−0%) ofmajor interactions. It is also interesting to note that theCAS criterion recovers 0/8 (0%) of galaxies classified asminor interactions. The remaining systems that the CAScriterion recovers is 8/18 or 44+13%
−0% of the major/minorinteractions, which have no mass dependence.
4.3. Distribution of interacting galaxies
In order to define different regions of the A901a, A901b,and A902 clusters, we computed the projected brightgalaxy (MV < −18) number density n as a function ofclustocentric radius R (Fig. 7) by assuming a sphericaldistribution. Note here that each galaxy is assigned to thecluster closest to it, and R is measured from the center ofthat cluster. As shown by Table 6, the A901 clusters havecentral galaxy number densities n (1100 to 1800 galaxiesMpc−3), which are intermediate to that of the rich Comacluster and the more diffuse Virgo cluster.
We consider the cluster core to be at R ≤ 0.25 Mpc,as this is the region where the projected number densityn rises very steeply (Fig. 7). The cluster virial radii aretaken to be ∼ 1.2 Mpc, based on estimates from the darkmatter maps derived from gravitational lensing by Hey-mans et al. (2008). Throughout this paper, we refer tothe region which is located at 0.25 Mpc < R ≤ 1.2 Mpcbetween the cluster core and the cluster virial radius asthe ‘outer region of the cluster’. The region outside thevirial radius (1.2 Mpc < R ≤ 2.0 Mpc) is referred to as

6 Heiderman et al.
the ‘outskirt region of the cluster’. The core, outer region,and outskirt region are labeled on Fig. 7.
Fig. 8 shows the distribution of interacting galaxies inthe A901a, A901b, and A902 clusters. These galaxieslie outside the cluster core. Most (34/38 or 89±5%) arelocated in the outer region of the cluster (0.25 Mpc <R ≤ 1.2 Mpc), and 11±5% in the outskirt region (1.2Mpc < R ≤ 2.0 Mpc). Using the volume of the core re-gion, and a spherical shell of the outer region and outskirtof the cluster, the number density of interacting galaxies(nmerg) varies from 0 to 1.2 to 0.025 galaxies Mpc−3 (Ta-ble 7).
Fig. 9 show the values of various environmental param-eters for interacting and non-interacting galaxies at differ-ent clustocentric radii. Following Wolf et al. (2005) andGilmour et al. (2007), we define and compute the localgalaxy surface density (Σ10) as the number of galaxies per(Mpc/h)−2 that are in an area defined by a circle of ra-dius containing the average distance to the 9th and 10thnearest neighbor. The DM mass surface density κ is com-puted locally using the coordinates of each galaxy on theweak lensing map provided by Heymans et al. (2008). Therelative local ICM counts are measured at each galaxyposition using the X-ray map from Grey et al. (2008b)and Gilmour et al. (2007). Since the interacting galaxieslie preferentially in the outer region of the cluster (0.25Mpc < R ≤ 1.2 Mpc), they are associated with low val-ues of κ and intermediate values of Σ10, and ICM density(Fig. 9).
4.4. What accounts for the distribution of interactinggalaxies?
The timescale for collisions and close encounters is givenby:
tcoll =1
nσgalA, (2)
where n is the galaxy number density, σgal is thegalaxy velocity dispersion, A is the collisional cross sec-tion, πf(2rgal)
2, rgal is a typical galaxy radius, and f is thegravitational focusing factor (Binney & Tremaine, 1987).Since the average velocity dispersion in clusters is high,the value for f will be low and we will assume it to be onorder of unity. Thus,
tcoll ∼ 800 ×
(
n
1000 Mpc−3
)−1
×
(
σ
1000 km s−1
)−1
×
(
rgal
10 kpc
)−2
Myr.
(3)
We compute n using the same method as in § 4.3 forthe core, and use spherical shells to compute the n in theouter region, and cluster outskirt. The local galaxy veloc-ity dispersion profiles for A901a/b, A902, and SWG fromkinematic modeling using ∼ 300 2dF redshifts (Gray etal. in prep.) are shown in Fig. 10, and average velocitydispersions, σgal are shown in Table 6.
The central galaxy velocity dispersion within the cores(R < 0.25 Mpc) of A901a,b and A902 typically range from700 to 1000 km s−1. Outside the cluster core, in the outerregion (0.25 Mpc < R ≤ 1.2 Mpc), the small numberstatistics leads to large error bars on the galaxy veloc-ity dispersion, making it un-viable to determine whether
it remains high, drops, or rises. For the sake of estimat-ing timescales, we take the average σgal for A901/902 tobe ∼ 800 km s−1 in three regions of the cluster. Thetimescales (tcoll) for close encounters are shown in Table 7and range from 0.844 to 12.6 to 244 Gyrs from the core(R ≤ 0.25 Mpc), to the outer region (0.25 Mpc < R ≤ 1.2Mpc), and outskirt region (1.2 Mpc < R ≤ 2.0 Mpc) ofthe cluster.
It may at first seem surprising that interacting galaxiesdo not preferentially lie in the cluster core, where the prob-ability for close encounters is high due to the associatedshort value of the timescale tcoll for collisions and close en-counters. However, if the galaxy velocity dispersion (σgal)is large, a close encounter is unlikely to lead to a mergeror a large amount of tidal damage (i.e. to strong mor-phological and kinematical distortions). This is becausea large galaxy velocity dispersion will likely cause the en-ergy E of the reduced particle in a binary encounter to bepositive, causing the orbit to become unbound (Binney &Tremaine, 1987).
Most of the interacting galaxies lie at a projected clus-tocentric radius of 0.25 Mpc < R ≤ 1.2 Mpc, between thecore and viral radius although in this region the timescalefor collisions and close encounters is quite large. Wesuggest two possible reasons why strong interactions andmergers might populate this outer region. The first pos-sibility is that the velocity dispersion of galaxies falls be-tween the core and outer region, due to the intrinsic veloc-ity dispersion profile of the clusters. Many clusters showa flat velocity dispersion profile from 1 Mpc outward, butseveral also show a declining profile (den Hartog & Kat-gert 1996, Carlberg 1997). In the latter cases, the velocitydispersions can fall from 1500 to 100 km s−1 from thecluster core to outer region of the cluster. Since the ve-locity local dispersion profiles in the regions of interest inthe A901/902 (Fig. 10) are based on a small number ofgalaxies and therefore large errors in σgal, we cannot de-termine if the velocity dispersion profile falls or remainsflat. An additional difficulty is that the member galaxiesof the neighboring clusters influence σgal at ∼ 0.5 Mpc forA901a/b and ∼ 1 Mpc for A902.
The second possibility is that the interacting galaxiesare part of groups or field galaxies that are being accretedalong filaments by the A901/902 clusters. This would bein line with the idea that clusters continuously grow bymergers and accretion of groups (e.g., Zabludoff & Franx1993; Abraham et al. 1996a; Balogh, Navarro & Morris2000). Groups have lower galaxy velocity dispersion (typ-ically below 300 km s−1) than clusters, as shown in Ta-ble 7. Furthermore simulations show that merger ratesare highest as field galaxies and galaxies in groups accreteinto cluster along cosmological filaments (see below; vanKampen & Katgert 1997; Fig. 11).
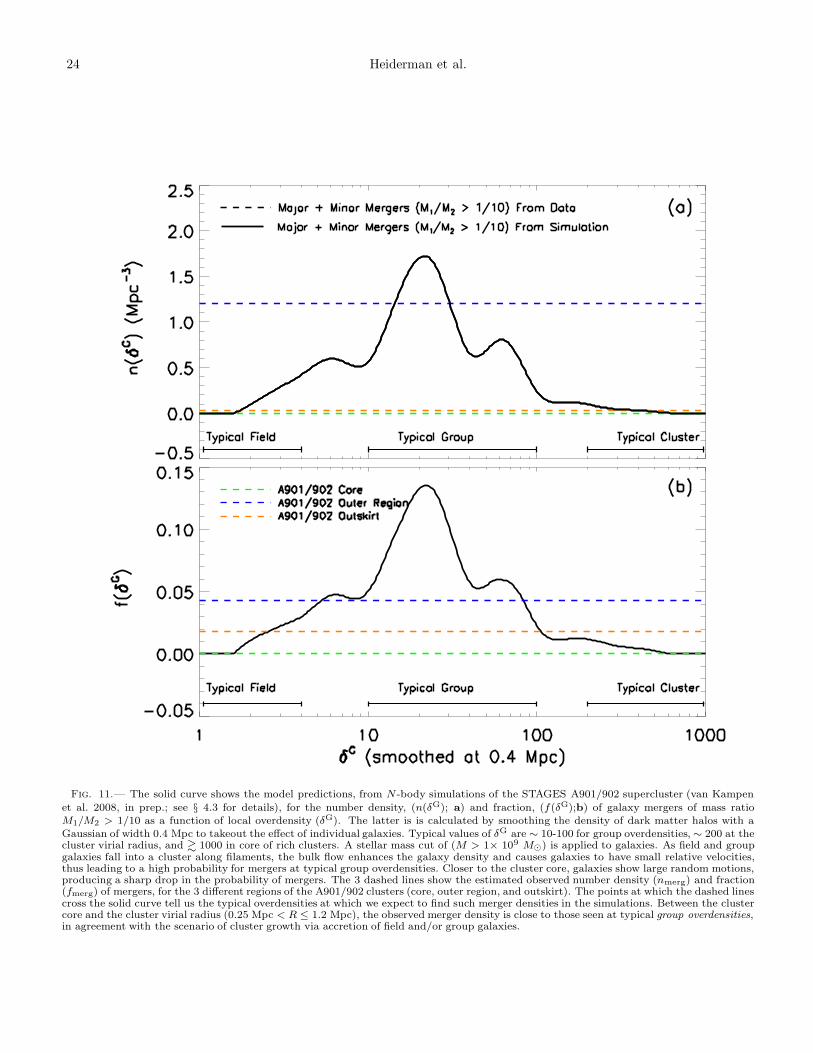
To further quantify the possibility of groups accret-ing into the A901/A902 clusters, we compare the datato model predictions from simulations of the STAGESA901/A902 supercluster (van Kampen et al. 2008, inprep). The simulation aims to reproduce the environ-ment as observed for A901/A902 by using constrained ini-tial conditions that produce clusters with similar overallproperties like A901, A902, and the neighboring A907 andA868. The simulation box is large enough to contain all

Interacting Galaxies in the A901/902 Supercluster 7
these, and hence reproduce the overall large-scale densityand velocity fields similar to what is observed. A phe-nomenological galaxy formation model is then used to sim-ulate the galaxy population in the same box, allowing usto select mock galaxies on luminosity and stellar mass asdone in the observed dataset. A stellar mass cut of (M >1× 10⁹ M) is applied in the simulations, correspondingto the observational sample mass cut. The solid lines inFig. 11 shows the predicted number density (n) and frac-tion (f) of galaxy mergers with mass ratio M1/M2 > 1/10,as a function of environment, as characterized by the localoverdensity (δG). The latter is is calculated by smoothingthe density of dark matter halos with a Gaussian of width0.4 Mpc to take out the effect of individual galaxies. Typi-cal values of δG are ∼ 10-100 for group overdensities, ∼ 200at the cluster virial radius, and & 1000 in the core of richclusters.
Typically, in the simulations, as field and group galaxiesfall into a cluster along filaments, the coherent bulk flowenhances the galaxy density and causes galaxies to havesmall relative velocities, thus leading to a high probabilityfor mergers at typical group overdensities. Closer to thecluster core, galaxies show large random motions ratherthan bulk flow motion, leading to a large galaxy velocitydispersion, and a sharp drop in the probability of mergers.Hence, as shown in Fig. 11, the highest number density ofmergers is found at group overdensities, while at overden-sities typical of the cluster core, the number density andfraction of mergers drop sharply.
In order to compare the data to simulation results, wefirst compute the number of mergers (Nmerg) using theformula:
Nmerg = NInt Type 1 +NInt Type 2
2, (4)
where we adapt the division by two in the class ‘Int Type2’ in order to be consistent with the simulations and countthe two galaxies involved in the interaction as a singlemerger system. Unlike ‘Int Type 1’ systems, where the in-teraction involves galaxies whose individual mass is at least1×109 M, ‘Int Type 2’ systems have M1 +M2 > 2×10⁹
M.The solid curve in Fig. 11 shows the merger fraction and
number density predicted by the simulations as a functionof overdensity. The dashed lines in Fig. 11 show the esti-mated range in the observational number density (nmerg)and fraction (fmerg) of mergers, for the 3 different regionsof the A901/902 clusters. The points at which the dashedlines cross the solid curve tell us the typical overdensitiesat which we expect to find such merger fraction or densi-ties in the simulations. It can be seen that the low mergerdensity seen in the core region of the cluster correspond tothose expected at typical cluster core overdensities. On theother hand, the larger merger density we observe betweenthe cluster core and the virial radius (0.25 Mpc < R ≤ 1.2Mpc) is close to those seen in typical group overdensities.This is in agreement with the above scenario, whereby theaccretion of field and/or group galaxies along filaments,where they have low relative velocities and enhanced over-densities, leads to enhanced merger rates.
We note, however, several caveats in the comparison. Incomparing our data to simulations, we directly compare
projected values of number density or fraction of merg-ers from two dimensional observations, to the predictednumber density of mergers from three dimensional simu-lations. The projection effect can introduce uncertaintiesin our observational estimate. Another caveat is that wedo not have a more complete suite of simulations.
A further indirect evidence for group accretion stemsfrom comparing semi-analytic galaxy catalogs to STAGESobservations. Rhodes et al. (in prep.) finds an overabun-dance in galaxies in A902 compared to its mass. This couldbe explained by two or more galaxy groups in projection,providing further evidence for group accretion.
4.5. Comparison with groups and clusters at differentepochs
We first recapitulate the results of this study (§ 4.1).In the A901/902 clusters, we find the fraction of inter-acting galaxies is 38/762 or 5.0±1.3% and most of thesesystems have MV ∼ -19 to -22 and L ≤ L∗. We es-timate that at least 1.6±0.6% being major interactions(1/4 < M1/M2 ≤ 1), at least 1.0±0.4% being minor in-teractions (1/10 < M1/M2 ≤ 1/4), and 2.4±0.7% beingambiguous cases of major or minor interactions.
Next, we compare our observed fraction of interactinggalaxies with studies of other clusters and group galaxiesout to z ∼ 0.8, over the last 7 Gyr (Fig. 12). These com-parisons are difficult to make as different studies employdifferent luminosity or mass cutoffs. Furthermore, somestudies consider only major mergers, while others considerall interacting galaxies, which are likely candidate for bothmajor and minor interactions.
The variation in galaxy populations sampled at differentepochs must also be kept in mind when comparing resultsat lower redshift with those at out to z ∼ 0.8. Samplesof galaxies at low redshift will contain a representativeamounts of both faint (L ≤ L∗) and luminous (L > L∗)galaxies. Higher redshift samples, on the other hand, willcontain an over-representative number of L > L∗ galax-ies due to sampling a larger volume and detection limitsundersampling the fainter galaxy population.
There have been several studies of galaxy interactions atintermediate redshift clusters (Lavery & Henry 1988; Lav-ery, Pierce, & Mclure 1992; Dressler et al. 1994; Oemler,Dressler, & Butcher 1997; Couch et al. 1998), but onlyfew to date with high resolution HST imaging. Couchet al. (1998) used WFPC/WFPC2 observations and spec-troscopy of two clusters at z ∼0.3 and ∼ 0.4 (R∼22.5;L < L∗ galaxies). In this study they classified ∼7/200or ∼ 3.5% galaxies to be merging based on separationsand visible distortions. The interacting systems in thesetwo intermediate redshift clusters are found to be typi-cally blue. These points are shown on Fig. 12. We notethat the interacting galaxies in these two clusters are quitesimilar to those in A901/902. In both cases, they tend tobe blue and preferentially in the outskirts. Furthermore,for the absolute magnitude range (MV ∼-19 to -22) of theA901/902 sample, the fraction of blue interacting galax-ies is ∼ 60% (§ 4.6). This is comparable to the fraction(∼ 60%) of blue interacting galaxies in the L < L∗ sampleof these the A901/902 clusters.
A study by Dressler et al. (1994) of a z ∼ 0.4 clusterand was observed using the WFPC camera and the frac-

8 Heiderman et al.
tion of bright (MV < −18.5) galaxies identified as mergerproducts or possible tidal interactions, respectively, was10/135 and 14/135. Another study of four clusters atz = 0.37 − 0.41 by Oemler, Dressler, & Butcher (1997)placed a lower limit of 5% on the fraction of interactingor merging galaxies with MV < −19 or L ≤ L∗ also usingWFPC.
A high redshift (z = 0.83) cluster was studied by vanDokkum et al. (1999) HST WFPC2 images and spectro-scopic redshifts with 80 confirmed members. They founda high number (17%) of luminous (MB ∼ −22; L ∼ 2L∗)systems that exhibit signatures of merging systems. Thesemergers were found to be red, bulge dominated, and arelocated in the outskirts of the cluster. A later study byTran et al. (2005b) used spectroscopic followup to confirmthat 15.7±3.6% of these mergers were bound pairs withseparations <
∼30h−1 kpc and relative velocities <∼300 km
s−1. While these systems are located outside the clustercenters similar to that of interacting systems in A901/902,the galaxy sample at high redshift are dominated by moreluminous galaxies (MB ∼ -22; L ∼ 2L∗) than galaxiesin the A901/902 sample where most galaxies have MV ∼-19.5 to -22 (Fig. 1). The number statistics for bright(∼ 2L∗) interacting galaxies in A901/902 are not robustenough to allow for comparison with the van Dokkum etal. (1999) fraction of interacting galaxies.
Finally, we look at the fraction of interacting galaxiesin groups. A study by McIntosh et al. (2007) finds that∼1.5% of massive (M ≥ 5 × 10¹⁰M) galaxies in SDSSgroups (with Mhalo > 2.5 × 10¹³ M) are major merg-ers at z of 0.01 to 0.12. Most of the systems are mergersbetween two red sequence galaxies and are found to liebetween 0.2-0.5 Mpc from the group center. A study byMcGee et al. (2008) also find an enhancement in asym-metric bulge-dominated group galaxies, consistent with ahigher probability for merging in the group environment.Additional evidence for mergers in groups is shown in astudy of a supergroup at z ∼ 0.37 by Tran et al. (2008),which they finds dry dissipationless mergers and signaturesthereof in 3 of 4 brightest group galaxies.
A merger fraction of of 6% was found by Zepf (1993)in Hickson compact groups at z < 0.05, which have aluminosities that are L ≤ L∗. The merger fraction is sig-nificantly higher than that in SDSS groups. The increasedmerger fraction is expected as Hickson compact groupsare different from loose groups because compact groupshave high number densities comparable to those in clustercores, but low galaxy velocity dispersions. These two con-ditions provide an environment most favorable to strongtidal interactions and mergers, as argued in § 4.4.
More systematic, high resolution, studies of galaxy in-teractions in both high and low redshift clusters with spec-troscopically confirmed members are needed to better un-derstand differences in the fraction of interacting galaxiesthroughout time. Increased merger rate at higher red-shifts (z ∼1) may be due to clusters being in the processof formation. Also, mergers may have been more impor-tant in the evolution of cluster galaxies at earlier times.The low fraction of interacting galaxies among the inter-mediate mass range of ( M = 1× 10⁹ to a few ×1010M)or intermediate luminosities (L < L∗) of galaxies seen inthe A901/902 supercluster and other intermediate redshift
clusters suggests that in the later stages of cluster evolu-tion, interactions may play a less important role in thetransformation of cluster galaxies.
4.6. Galaxies on the blue cloud and red sequence
Fig. 13 shows the rest-frame U −V color plotted againststellar masses for galaxies of different visual classes: Inter-acting, Non-interacting Irr-1, and Non-interacting Sym-metric. For visually classified galaxies in our sample, wefind that 274 lie on the blue cloud. Out of the 38 visuallyclassified interacting systems, 23/38 or 61 ± 14% (23/38)lie on the blue cloud. Conversely, out of 720 visually clas-sified non-interacting galaxies, 251/720 or 35± 7% are onthe blue cloud. The fraction of interacting galaxies on theblue cloud (fint−BC) is about two times larger than thefraction of non-interacting galaxies (fnon−int−BC) on theblue cloud, implying that interacting galaxies are prefer-entially blue compared to non-interacting ones. The dis-tribution of non-interacting galaxies on the blue cloud in-creases from 9±4% to 37±7% to 40±9% (Table 7; Fig. 13)from the cluster core (R ≤ 0.25 Mpc), to the outer region(0.25 Mpc < R ≤ 1.2 Mpc), and to the outskirt region(1.2 Mpc < R ≤ 2.0 Mpc). Correspondingly, the fractionof interacting galaxies on the blue cloud from core to outerregion to the cluster outskirt is 0% to 62±15% to 50±25%(Table 7). This large fraction of blue interacting galaxiesin these regions may be due to the enhanced SFR in inter-acting galaxies (see § 4.7). It may also be the result of theinteracting galaxies being part of accreted groups (§ 4.4)that are bluer than the average cluster galaxy.
Out of the 38 interacting galaxies, 23 lie on the bluecloud and 15 are on the red sequence. What is the na-ture of the interacting galaxies on the red sequence? Wefind that 4/15 interacting galaxies on the red sequence arecandidates for ‘dry’ tidal interactions and mergers, with asmooth appearance, suggestive of gas-poor systems (e.g.,case 16 in Figure 3). The remainder of interacting systemson the red sequence are dusty red galaxies (e.g., cases 6and 14 Figure 3). We note that Wolf et al. (2008) re-ports a significant population ∼ 180 red dusty galaxies inA901/902 and the dusty red interacting galaxies here onlyaccount for only ∼ 3% (6/180) of this population.
4.7. SF properties of interacting galaxies
This work uses SFRs based on UV from COMBO-17(Wolf et al. 2004) and Spitzer 24µm derived by Bell etal. (2005, 2007). The unobscured SFRUV is derived usingthe 2800 A rest frame luminosity (LUV = 1.5νlν,2800) asdescribed in Bell et al. (2005, 2007). The UV spectrum isdominated by continuum emission from massive stars andprovides a good estimate of the integrated SFR from theyounger stellar population in the wavelength range of 1216-3000 A. The SFRIR is derived using the 24µm flux to con-struct the integrated IR luminosity (LIR) over 8-1000µmfollowing the methods of Papovich & Bell (2002). Thetotal SFR is derived using identical assumptions of Kenni-cutt (1998) from PEGASE assuming a 100 Myr old stellarpopulation with constant SFR and a Chabrier (2003) IMF:
SFRUV+IR = 9.8× 10⁻¹¹(LIR + 2.2LUV). (5)
The factor of 2.2 on the UV luminosity accounts for lightbeing emitted longward of 3000 A and shortward of 1216 A

Interacting Galaxies in the A901/902 Supercluster 9
by young stars. The total SFR accounts for both the dust-reprocessed (IR) and unobscured (UV) star formation. Allof our 762 sample galaxies with M ≥ 1×10⁹M have UV-based SFR from COMBO-17 observations. Of this sample,∼ 10% (78/762) were not observed with Spitzer, ∼ 27%(204/762) were observed and detected at 24µm, while therest had no detection at the ∼4σ depth of 83 µJy.
The UV-based SFR (SFRUV) is plotted versus stellarmass in Fig. 14 for all 762 galaxies in our sample. TheSFRUV ranges from ∼ 0.01 to to 4 M yr−1. The UV-based SFR represents a lower limit to the total SFR forgalaxies on the blue cloud and most star-forming galaxieson the red sequence. However, for some old red galaxies,the SFRUV may overestimate the true SFR as the UV lightfrom such systems may not trace massive OB stars, butrather low to intermediate mass stars.
Fig. 15 shows the UV+IR-based SFR (SFRUV+IR). Forgalaxies with a 24µm detection, we plot SFRUV+IR. TheUV+IR-based SFR (Fig. 15) ranges from ∼ 0.1 to to 10M yr−1. For the 480 galaxies that are observed but un-detected, with Spitzer, we use the 24µm detection limit asan upper limit on the 24µm flux. These points are shownas inverted triangles. Galaxies without any Spitzer cov-erage are not included in this figure.
In a cluster environment, the competition between pro-cesses that enhance the SFR and those that depress theSFR, ultimately determine the average SFR of clustergalaxies. The first class of processes are strong close inter-actions: tidal and mergers (e.g., Toomre & Toomre 1972),and harassment (e.g., Moore et al. 1996), which refers tothe cumulative effect of weak interactions. The secondclass of processes include ram pressure stripping of coldgas out of the galaxy by the hot ICM (e.g., Gunn & Gott1972), and strangulation (e.g., Larson et al. 1980; Baloghet al. 2000).
For the few interacting galaxies (orange line) present,the average SFRUV is typically enhanced by a modest fac-tor of only 1.2–2.2 compared to the Non-interacting Sym-metric galaxies (purple line) and to all Non-interactinggalaxies (i.e Symmetric + Irr-1; black line). Similarly, theUV+IR-based SFR (SFRUV+IR; and Fig. 15) of interact-ing galaxies is typically enhanced by only a factor of ∼ 2to 3 compared to the Non-interacting Symmetric galax-ies (purple line) and to all Non-interacting galaxies (i.eSymmetric + Irr-1; black line). We note that a similarenhancement in the average SFR, by a factor of 1.5 to 2from visual classification, and 1.4 to 2.1 with CAS is alsofound in interacting field galaxies over z ∼ 0.24–0.80 byJogee et al. (2008a,b).
SFR enhancements are also seen in galaxy pair stud-ies in the field (Robaina et al. in prep; Ellison et al. 2008)and in different environments (Alonso 2004). An enhancedSFR in strong galaxy interactions is expected, since inter-actions lead to large supercritical gas surface densities viashocks and via gravitational torques, which drive and pilegas into the central regions. This modest enhancement isconsistent with that found by di Matteo et al. (2007; seetheir Fig. 10), based on a recent statistical study of severalhundred galaxy collisions.
While galaxy interactions in the A901/902 clusters en-hance the SFR of individual galaxies, it is clear that theydo not contribute much to the total SFR of the cluster.
This minimal contribution to the total cluster SFR is dueto the low number of interacting galaxies in A901/902,and the fact that these interactions only cause a modestSFR enhancement. In effect, only 20% of the total UVand UV+IR SFR density of the A901/902 clusters comesfrom interacting galaxies.
5. summary
We present a study of interacting galaxies and theinfluence of environment in the A901/902 superclusterat z ∼ 0.165 based on 762 bright , intermediate mass(MV ≤ -18; M > 1 × 10⁹ M) galaxies. We use HSTACS F606W data from the STAGES survey, COMBO-17,Spitzer 24µm and XMM-Newton X-ray data. We use vi-sual classification, as well as quantitative CAS parametersto estimate the fraction (fint) of interacting galaxies, whichare likely candidates for interactions of stellar mass ratioM1/M2 > 1/10. Our findings are:
• The fraction of interacting galaxies (§ 4.1) is38/762 or 5.0±1.3% among bright, intermediatemass (MV ≤ -18; M ≥ 1× 10⁹ M) cluster galaxiesin A901/902. We estimate that at least 1.6±0.6%are major interactions (1/4 < M1/M2 ≤ 1), at least1.0±0.4 are minor interactions (1/10 < M1/M2 ≤1/4), and 2.4±0.7% are ambiguous cases of majoror minor interactions.
• If CAS is used (§ 4.3) instead of visual classifi-cation, the fraction of highly distorted galaxies is19/762 or 2.5+1.7%
−0.1%(Fig. 5). However, the nature
of the systems captured by CAS and visual classifi-cation can be quite different. CAS only captures
13/38 (34+5%−0%) of the visually-identified interact-
ing galaxies, and the missed systems include galax-ies with double nuclei, or fainter outer tidal fea-
tures. Furthermore, the remaining 6/19 (33+24%−4% )
of the systems captured by CAS turn out to be non-interacting systems ( Table 3). These contaminantstend to be dusty highly inclined galaxies and sys-tems with low level asymmetries that are probablydue to star formation.
• Throughout this paper, we consider the core of eachcluster to be at a projected clustocentric radius ofR ≤ 0.25 Mpc. We refer to the region between thecluster core and the virial radius as the outer re-gion of the clusters (0.25 Mpc < R ≤ 1.2 Mpc).We refer to the region outside the virial radius (1.2Mpc < R ≤ 2.0 Mpc) as the outskirt region of theclusters. The interacting galaxies are found to lieoutside the cluster core although the timescale forcollisions and close encounters is shortest in the core(< 1 Gyr). We suggest that this is due to the largevelocity dispersion (700 to 900 km/s) of galaxies inthe core. Such a dispersion makes it less likely thata close encounter between two galaxies culminatesinto a merger or a disruptive interaction associatedwith a lot of tidal heating.
Most of the interacting and mer=ging galaxies liein the outer region (0.25 Mpc < R ≤ 1.2 Mpc),between the core and viral radius, although thetimescale for collisions and close encounters is quite

10 Heiderman et al.
large ( 1 Gyr) in this region. One possible expla-nation might be that the galaxy velocity dispersiondrops in the outer region, hence favoring mergers.However, limited number statistics of current spec-troscopic data do not allow us to assess this possibil-ity. Another possible scenario is that the interact-ing galaxies in the outer region are part of groups orfield galaxies that are being accreted along cosmo-logical filaments by the A901/902 clusters. We findthat our estimated frequency and number densityof mergers are similar to those seen at typical groupoverdensities in N -body simulations of groups andfield galaxies accreting into A901/902 clusters.
• We compare of our observed fraction of interactinggalaxies with studies of other clusters and groupgalaxies out to z ∼ 0.8 (§ 4.5). We find no evidencefor significant evolution between z ∼ 0.17 to 0.40 inthe fraction of interactions among L ≤ L∗ clustergalaxies.
• Out of the 38 interacting galaxies, 23 lie on the bluecloud and 15 are on the red sequence (§ 4.6). Thefraction of interacting galaxies on the blue cloud isis 61±14% (23/38), which is about twice as high asthe fraction of 35±7% (251/720) for non-interactinggalaxies. This suggests that interacting galaxiesare preferentially blue compared to non-interactingones. This excess of blue galaxies among interact-ing systems may be due to the enhanced recent SFRin interacting galaxies and/or due to the possibil-ity that the interacting galaxies are part of field orgroup galaxies, which are accreting into the cluster.Of the remaining 15 interacting galaxies, which lieon the red sequence, we find that 4 are candidatesto be ‘dry’ tidal interactions and mergers, with asmooth appearance, while 6 are dusty red galaxies.
• For the few interacting galaxies present, the aver-age SFRUV and SFRUV+IR are typically enhanced
by only a modest factor of ∼ 1.2-2 and ∼ 2 to 3,respectively, compared to the Non-interacting Sym-metric galaxies and to all the Non-interacting galax-ies (i.e., Symmetric + Irr-1). This modest enhance-ment is consistent with that found by di Matteo etal. (2007), based on a recent statistical study of sev-eral hundred galaxy collisions. However, since only20% of the total SFR density of the A901/902 clus-ters comes from interacting galaxies, interactions donot contribute much to the total SFR output of thecluster. A similar SFR enhancement in galaxy in-teractions is also found in z ∼ 0.24−0.8 field galax-ies (Jogee et al. 2008a,b) and in pairs by Robainaet al. (in prep.).
A.H. and S.J. gratefully acknowledge support fromNSF grant AST-0607748, LTSA grant NAG5-13063, andHST-GO-10861 and HST-GO-10395 from STScI, whichis operated by AURA, Inc., for NASA, under NAS5-26555. We would like to thank Christopher Conselicefor his assistance with CAS. E.vK. and M.B. were sup-ported by the Austrian Science Foundation FWF undergrant P18416,C.Y.P. by STScI and NRC-HIA Fellowshipprogrammes, C.H. by European Commission ProgrammeSixth Framework Marie Curie Outgoing International Fel-lowship under contract MOIF-CT-2006-21891 and a CITANational fellowship, M.E.G by an Anne McLaren Re-search Fellowship, E.F.B. and K.J. by the DFG’s EmmyNoether Programme, A.B. by the DLR (50 OR 0404),S.F.S. by the Spanish MEC grants AYA2005-09413-C02-02and the PAI of the Junta de Andaluc a as research groupFQM322, L.V.W. by NSERC, CIfAR and CFI, C.W. bya PPARC Advanced Fellowship, and D.H.M. by NASAunder LTSA Grant NAG5-13102. The STAGES teamthanks Hans-Walter Rix for providing essential supportcontributing to the success of the STAGES project. Thisresearch made use of NASA’s Astrophysics Data Systemand NASA/IPAC Extragalactic Database.
REFERENCES
Abraham, R. G., et al. , 1996a, ApJS, 107, 1Alonso, M. S., et al. , 2004, MNRAS, 352, 1081Balogh, M. L., et al. , 1998, ApJ, 504, 75Balogh M. L., et al. , 1999, ApJ, 527, 54Balogh, M. L., Navarro, J. F., & Morris, S. L. 2000, ApJ, 540,
113Balogh, M. L., & Morris, S. L., 2000, MNRAS, 318, 703Barnes, J. E., & Hernquist, L. E., 1991, ApJ, 370, 65Barnes, J. E., 1992, ApJ, 393, 484Bell, E., et al. , 2005, ApJ, 625, 23Bell, E., et al. 2007, ApJ, 663, 834Bershady, M. A., Jangren, J. A., & Conselice, C. J, 2000, AJ,
119, 2645Binggeli, B., Tammann, G. A.,& Sandage, A. 1987,AJ, 94, 251Binggeli, B., Sandage, A., & Tammann, G.A., 1988, ARAA,26,
509Binney J., Tremaine S., 1987, Galactic Dynamics, Princeton Univ.
Press, PrincetonBlanton, M. R., et al. 2005, ApJ, 629, 143Borch, A., et al. 2006, A&A, 453, 869Butcher, H., & Oemler, A. Jr., 1978,ApJ, 219, 18Caldwell, J. A. R., et al. , 2008, ApJS, 174, 136Chabrier, G., 2003, PASP,115, 763Carlberg, R., G., et al. , 1997, ApJ, 476L, 7CCole, S., et al. , 2000, MNRAS, 319, 168Cole, S., et al. , 2001, MNRAS, 326, 255Conselice, C. J., Bershady, M. A., & Jangren, A. 2000, 529, 886Conselice, C. J., 2003, AJ, 126, 1183
Conselice, C. J., 2006, ApJ, 638, 686Couch, W., et al. 1998, ApJ, 497,188Diaferio, A., et al. , 2001, MNRAS, 323, 999Dressler, A., 1980, ApJ, 236, 351Dressler, A., et al. 1994,, ApJ, 435, 23Dressler, A., et al. , 1997, ApJ, 490, 577Ellison, S., L., et al. , 2008, AJ, 135, 1877Gavazzi, G. & Jaffe, W., 1985, ApJ, 294, 89Gilmour, R., et al. 2007, MNRAS, 380, 1467Gilmour et al. 2008, in prep.Giovanelli, R., Haynes, M. P., & Chincarini, G. L., 1986, ApJ,
300, 77Gnedin, O. Y. 2003, ApJ, 582, 141Gray, M. E. , et al. 2002, ApJ, 568, 141Gray, M. E. , et al. 2008, in preparation.Gunn, J.E., & Gott, J.R., III, 1972, ApJ, 176, 1den Hartog, R., & Katgert, P., 1996, MNRAS, 279, 349Hernquist, L. E.,& Mihos, 1995Heymans, C. et al. 2008, MNRAS, 385, 1431Hopkins, P. F., Cox, T. J., Younger, J. D., Hernquist, L., ApJ,
submitted (arXiv:0806.1739), 806Jogee et al. , 1999, ApJ, 526, 665Jogee, S. 2006, in Physics of Active Galactic Nuclei at all Scales,
Lecture Notes in Physics, Vol. 693, Eds. D. Alloin, R. Johnson,and P. Lira (Springer: Berlin Heidelberg), 143 (astro-ph/0408383)
Jogee, S., et al. , 2008a, in Formation and Evolution of Galaxy Disks,ed. J. G. Funes, S. J., & E. M. Corsini (San Francisco: ASP), inpress (arXiv:0802.3901)

Interacting Galaxies in the A901/902 Supercluster 11
Jogee, S., Miller, S., Penner, K., Skelton, R. E., Conselice, C.J., Somerville, R. S., and the GEMS collaboration, 2008b, ApJ,submitted
Kennicutt, R. C. Jr., 1983, AJ, 88, 1094Kennicutt, R. C. Jr., 1998, ARAA, 36, 189Koopmann, R. A., & Kenney, J. D. P. 2004, ApJ, 613, 866Kroupa, P. Tout, C. A., & Gilmore, G., 1993, MNRAS, 262, 545Larson, R. B., Tinsley, B. M., Caldwell, C. N., 1980, ApJ, 237,
692Lavery, R. J., & Henry, J. P., 1988, ApJ, 330, 596Lavery, R. J., Pierce, M. J.,& McClure, R. D., ApJ, 1993, 418,
43McGee, L., M., et al. , 2008, astroph/0804.2693Naab, T., & Burkert, A., 2001, ApJ, 555, 91Negroponte, J., & White, S. D. M., 1983, MNRAS, 205, 1009Margoniner, V. E., et al. , 2001,ApJ, 548, 143di Matteo, P., et al. , 2007, A&A, 468, 61McIntosh, D. H., et al. 2008, MNRAS, 388, 1537Mihos, J. C.,& Hernquist, L., 1996, ApJ, 464, 641Mihos, J. C., et al. , 1995, ApJ, 438, 75Miller, S., et al. , 2008, ASP conference proceedings of the “Frank
N. Bash Symposium 2007: New Horizons in Astronomy”, ed. A.,Frebel, J. Maund, J. Shen, M. Siegel, (San Francisco: ASP),393,235
Moore, B., et al. 1996, Nature, 379, 613Moore, B., Lake, G., Katz, N., et al. 1998, ApJ, 495, 139
Papovich, C., & Bell, E. F., 2002, ApJ, 579, L1Postman, M., & Geller, M. J., 1984, ApJ, 281, 95de Propis, R., et al. , 2003, MNRAS, 345, 725Quilis, V., Moore, B.,Bower, R., 2000, Science, 288, 1617Quinn, P. J., Hernquist, L., & Fullagar, D. P., 1993, 403, 74Rhodes, R., et al. , 2008, in prep.Robaina, A., et al. , in prep.Smith, B. J., Curtis, S., Kenney, J. D. P., & Jogee, S. 1999,
AJ, 117, 1237Steinmetz, M., & Navarro, J. F., 2002, New Astronomy, 7, 155Struck, C., 1997, ApJS, 113, 269Tago, E. et al. , 2008, A&A, 479,927The, L., S., & White, S. D. M. , 1986, AJ, 92, 1248Toomre, A., & Toomre, J., 1972, ApJ, 178, 623Tran, K.-V., H., et al. , 2005b, ApJL, 627, 25Tran, K.-V., H., et al. , 2008, astroph/0806.4387van Dokkum, P. G., et al. 1998a, ApJ, 500, 714van Dokkum, P. G., et al. 1999, ApJL, 520, 95van Kampen, E., & Katgert, P., 1997, MNRAS, 289, 327van Kampen, E., et al. , 2008, in prep.Whitmore, B., et al. , 1993 ApJ, 407, 489Wolf, C., et al. 2004, A&A, 421, 913Wolf, C., Gray, M. E., Meisenheimer, K. 2005, A&A, 443 435Wolf et al. , 2008, in prep.Zabludoff , A. I., & Franx, M., 1993, AJ, 106, 1314Zepf, S. E., et al. 1993, ApJ, 407, 448
Table 1
Results Based On Visual Classifications
Visual Class Ngal fgal
(1) (2) (3)
Interacting ‘Int’ 38 0.050±0.01Non-interacting Irr-1 104 0.14±0.03Non-interacting Symmetric 616 0.81±0.16Unclassifiable 4 0.005±0.003
Note. — The results are shown for the sample of762 bright (MV ≤ -18; M∗ ≤ 1 × 10⁹M) galaxies.Columns are : (1) Visual class (VC); (2) Ngal = Numberof galaxies with a given VC.; (3) fgal = Fraction ofbright galaxies with a given VC.
12 Heiderman et al.
Table 2
Major and Minor Interactions Among Interacting Galaxies
Visual Class Mass Ratio Ngal fgal
(1) (2) (3) (4)
Major interaction 1/4 < M1/M2 ≤ 1/1 12 0.016± 0.006Minor interaction 1/10 < M1/M2 ≤ 1/4 8 0.01± 0.004Major or minor interaction 1/10 < M1/M2 ≤ 1/1 18 0.024±0.007
Note. — This table gives our estimate of the type of interaction, major orminor, which the interacting galaxies in Table 1 are undergoing. Columns are :(1) Visual class; (2) Mass ratio of interaction (3) Ngal = Number of galaxies; (4)fgal = Fraction of galaxies.
Table 3
Visual Breakdown of Galaxies Satisfying CAS Criteria: A > 0.35 and A > S
Visual Class NCAS fCAS
(1) (2) (3)
All Visual Types 19 1.00Interacting ‘Int’ 13 0.680±0.11Non-interacting Irr-1 4 0.21±0.09Non-interacting Symmetric 2 0.11±0.07
Note. — Columns are : (1) Visual Classification(VC); (2) NCAS = = Number of galaxies of a given vi-sual type satisfying the CAS criteria; (3) fCAS = Frac-tion of galaxies satisfying CAS criteria with a given vi-sual type.
Table 4
Visual Classes of Galaxies on the Blue Cloud and Red Sequence
Visual Class Nblue fblue Nred fred
(1) (2) (3) (4) (5)
Interacting ‘Int’ 23 0.083± 0.02 15 0.031± 0.001Non-interacting Irr-1 91 0.329± 0.07 13 0.027± 0.009Non-interacting Symmetric 160 0.578± 0.12 456 0.940± 0.19Unclassifiable 3 0.01± 0.007 1 0.002± 0.002All 277 1.0 485 1.0
Note. — The results are shown for the sample of 762 galaxies. Columnsare : (1) Visual class; (2) Nblue = Number of galaxies on blue cloud; (3) fblue
= Fraction of galaxies on blue cloud; (4) Nred = Number of galaxies on redsequence; (5) fred = Fraction of galaxies on red sequence
Table 5
Major and Minor Interactions on the Blue Cloud and Red Sequence
Visual Class Nblue fblue Nred fred
(1) (2) (3) (4) (5)
Major interaction 6 0.021 ± 0.001 6 0.012± 0.006Minor interaction 3 0.01 ± 0.007 5 0.01± 0.005Major or minor interaction 14 0.05 ± 0.02 4 0.008± 0.004All 277 1.0 485 1.0
Note. — This table gives our estimate of the type of interaction, major orminor, which the interacting galaxies in Table 4 are undergoing. Columns are: (1) Visual Classification; (2) Nblue = Number of galaxies on blue cloud; (3)fblue = Fraction of galaxies on blue cloud; (4) Nred = Number of galaxies on redsequence; (5) fred = Fraction of galaxies on red sequence;

Interacting Galaxies in the A901/902 Supercluster 13
Table 6
Comparison of Projected Galaxy Number Densities n and σgal
System Core Outskirt σgal
R ≤ 0.25 Mpc R > 1.2 Mpc(galaxies Mpc−3) (galaxies Mpc−3) (km s−1)
Virgoa 360 75 400-750Comab 10000 400 ∼ 900A901ac 1800 230 890±182A901bc 1100 240 1189±266A902c 1300 170 792±176Groupsd ∼ 0.01 ∼ 100
Note. — References for the values cited: a = Binggeli,Tammann, &Sandage (1987); b = The & White (1986); c = number densities fromthis work, average local velocity dispersions from Gray et al. (2008);d = Tago et al. (2008)
Table 7
Properties in Core, Outer Region, and Outskirt of A901/902 Clusters
Cluster Core Cluster Outer Region Outskirt(R ≤ 0.25 Mpc) (0.25 Mpc < R ≤ 1.2 Mpc) (1.2 Mpc < R ≤ 2.0 Mpc)
(1) N 77 570 107(2) Nnon−int 77 536 103(3) Nint 0 34 4(4) Volume V (Mpc3) 0.065 7.17 26.3(5) n (gal Mpc−3) 1185 79.5 4.1(6) 〈B − V 〉 0.852 0.759 0.756(7) 〈U − V 〉 1.29 1.08 1.07(8) tcoll (Gyr) 0.844 12.6 244(9) Nmerg 0 25 2(10) nmerg (gal Mpc−3) 0 1.2 0.025(11) fmerg 0 0.043 0.018(12) Nmajor−merg 0 6 0(13) nmajor−merg (gal Mpc−3) 0 0.28 0(14) fmajor−merg 0 0.01 0(15) Nminor−merg 0 3 1(16) nminor−merg (gal Mpc−3) 0 0.14 0.01(17) fminor−merg 0 0.005 0.009(18) Nnon−int−BC 7 199 41(19) fnon−int−BC 0.09 0.37 0.40(20) Nint−BC 0 21 2(21) fint−BC 0 0.62 0.5
Note. — This table shows galaxy properties and timescales in three different regions of the cluster: the core(R ≤ 0.25 Mpc), the outer region (0.25 Mpc < R ≤ 1.2 Mpc) between the core and the cluster, and the outskirt
region (1.2 Mpc < R ≤ 2.0 Mpc). Only bright (MV ≤ −18) intermediate mass (M > 1× 10⁹ M) galaxiesare considered. See § 4.3 for details. The rows are : (1) N : No. of galaxies ; (2) Nnon−int : No. of non-interactinggalaxies; (3) Nint : No. of interacting galaxies; (4) V : Projected Volume; (5) n: Projected number density of galaxies;(6) B −V : Mean B −V rest frame color; (7) U −V : Mean U −V rest frame color; (8) tcoll: Timescale for collisionsor close encounters; (9) Nmerg : No. of mergers from Equation 4 (10) nmerg: Projected number density of interactinggalaxies (11) fmerg: Fraction of interacting galaxies. (12)-(14): same as (9)-(11), but for major mergers with a massratio (1/4 < M1/M2 ≤ 1/1); (15)-(17): same as (9)-(11), but for minor mergers with a mass ratio (1/10 < M1/M2 ≤1/4); (18) Nnon−int−BC : No. of non-interacting galaxies on blue cloud; (19) fnon−int−BC : Fraction of non-interactinggalaxies on blue cloud; (20) Nint−BC : No. of interacting galaxies on blue cloud; (21) fint−BC : Fraction of interactinggalaxies on blue cloud;

14 Heiderman et al.
Fig. 1.— Absolute magnitude distribution of the A901/902 supercluster sample of bright (MV < −18), intermediate mass (M > 1×10⁹M)galaxies (N=762 galaxies).

Interacting Galaxies in the A901/902 Supercluster 15
Visual Class
Strongly Interacting Galaxies ’Int’
Int Type 1
Non-Interacting Galaxies
Int Type 2 Irr-1 Symmetric
Fig. 2.— In our visual classification scheme (§ 3.2), galaxies are classified as interacting (‘Int’), non-interacting, or unclassifiable. Theinteracting galaxies (‘Int’) consists of ‘Type 1’ and ‘Type 2’ systems (see Fig. 3). ‘Int Type 1’ systems host strong externally-triggeredmorphological distortions, such as tidal tails, shells, ripples, warps, asymmetric tidal debris and distortions in the disk, and double nuclei insidea common envelope. In contrast, ‘Int Type 2’ galaxies do not have strong morphological distortions, but they are considered to be interacting
because they have a companion which satisfies 3 criteria: it has project separation d<∼10 kpc, the same COMBO-17 spectrophotometric
redshift, and gives a stellar mass ratio M1/M2 > 1/10. The non-interacting galaxies consists of ‘Irr-1’ and ‘Symmetric’ systems. Irr-1 exhibitinternally-triggered asymmetries, due to SF typically on scales of a few hundred parsecs. ‘Symmetric’ systems are relatively undistorted andare not associated with any overlapping companion.

16 Heiderman et al.
Fig. 3.— Examples of galaxies visually classified as interacting (‘Int’), divided into ‘Type 1’ and ‘Type 2’ (§ 3.2). ‘Int Type 1’ systems(cases 1-8) host strong externally-triggered morphological distortions, such as tidal tails, arcs, shells, ripples, warps, tidal debris in body ofgalaxy, offset rings, extremely asymmetric star formation, spiral arms on only one side of the disk, and double nuclei. In contrast, ‘Int Type2’ galaxies do not have strong morphological distortions (cases 9-11, 13-16), but they are considered to be interacting because they have a
companion which satisfies 3 criteria: it has project separation d<∼10 kpc, the same COMBO-17 spectrophotometric redshift, and gives a stellar
mass ratio M1/M2 > 1/10. Among these interacting systems, note potential major (9, 12, 13, 14, 15) and minor (10, 11, 16) interactions, aswell as more ambiguous cases (1-8) that could be either major or minor (§ 4.1).
Interacting Galaxies in the A901/902 Supercluster 17
Fig. 4.— Examples of galaxies visually classified as Non-interacting Symmetric (cases 1-6) and Non-interacting Irr-1 (cases 7-12). See § 3.2for details.
18 Heiderman et al.
Fig. 5.— Bright, intermediate mass (MV < −18; M ≥ 1 × 10⁹M) galaxies of different visual classes (Interacting, Non-interacting Irr-1,& Non-interacting Symmetric) are shown in the CAS A versus S plane. The 19 galaxies satisfying the CAS merger criterion (A > S and
A > 0.35) lie on the upper left corner of the diagram. The CAS merger criterion recovers 13/38 (34+5%−0%
) of the galaxies visually classified
as interacting. Furthermore, there is a significant level of contamination: 6/19 (33+24%−4%
) of the systems picked up by the CAS criterion are
visually classified as Non-interacting Irr-1 and Non-interacting Symmetric.

Interacting Galaxies in the A901/902 Supercluster 19
Fig. 6.— The top panel shows examples of interacting missed by CAS criterion (A > S and A > 0.35). Features of these systems includedouble nuclei, tidal bridges, and tidal debris. The lower panel show some ‘Non-Interacting’ contaminants CAS picked up due to small-scaleasymmetries from SF, large dust lanes, and the absence of a clear center, all leading to a larger A value.

20 Heiderman et al.
Fig. 7.— The azimuthally averaged projected number density n of bright (MV < −18) galaxies as a function of clustocentric radius isshown for each cluster A901a/b and A902. We consider the cluster core to be at R ≤ 0.25 Mpc, as this is the region where the projectednumber density n rises very steeply. We refer to the region which is located at 0.25 Mpc < R ≤ 1.2 Mpc between the cluster core and thecluster virial radius as the ‘outer region of the cluster’. The region outside the virial radius (1.2 Mpc < R ≤ 2.0 Mpc) is referred to as the‘outskirt region of the cluster’. The core, outer region, and outskirt region are labeled.

Interacting Galaxies in the A901/902 Supercluster 21
Fig. 8.— The distribution of interacting galaxies (coded as yellow diamonds, ’+’, and circles) is overlaid on the ICM density map (yellow-orange scale). Following Heymans et al. (2008), we show DM masses in terms of the signal-to-noise of the weak lensing detection. The cyanand green contours enclose roughly 6h−11013M and 3.5h−11013M for A901a and A901b, and roughly 3h−11013M and 1.5h−11013M
for the lower mass A902 and South West Group (SWG). The different symbols represent our best attempt to separate the interacting galaxiesinto ‘major’ (circles), ‘minor’ (diamonds), and ‘major or minor’ (+) interactions (§ 4.3). Interacting galaxies are located in the outer regionof each cluster (0.25 Mpc < R ≤ 1.2 Mpc).

22 Heiderman et al.
Fig. 9.— The distribution of local galaxy surface density Σ10 (top) local DM mass surface density κ (middle), and relative local ICMdensity (bottom) is shown as a function of the minimum distance from the nearest cluster center (A901a, A901b, A902, SWG), for brightgalaxies of different visual classes : Interacting, Non-interacting Irr-1, and Non-interacting Symmetric. Since the interacting galaxies liepreferentially in the outer region of the cluster (0.25 Mpc < R ≤ 1.2 Mpc), they are associated with low values of κ and intermediate valuesof Σ10 , and ICM density.

Interacting Galaxies in the A901/902 Supercluster 23
Fig. 10.— Local velocity dispersion profiles for A901a, b and A902 clusters, and associated SWG from kinematic modeling using the ∼ 3002dF redshifts (Gray et al. in prep.). The central galaxy velocity dispersion within the cores (R < 0.25 Mpc) of A901a,b and A902 typicallyrange from 700 to 1000 km s−1. Outside the cluster core, in the outer region (0.25 Mpc < R ≤ 1.2 Mpc), the small number statistics leadsto large error bars on the galaxy velocity dispersion, making it un-viable to determine whether it remains high or drops.
24 Heiderman et al.
Fig. 11.— The solid curve shows the model predictions, from N -body simulations of the STAGES A901/902 supercluster (van Kampen
et al. 2008, in prep.; see § 4.3 for details), for the number density, (n(δG); a) and fraction, (f(δG);b) of galaxy mergers of mass ratioM1/M2 > 1/10 as a function of local overdensity (δG). The latter is is calculated by smoothing the density of dark matter halos with aGaussian of width 0.4 Mpc to takeout the effect of individual galaxies. Typical values of δG are ∼ 10-100 for group overdensities, ∼ 200 at thecluster virial radius, and & 1000 in core of rich clusters. A stellar mass cut of (M > 1× 10⁹ M) is applied to galaxies. As field and groupgalaxies fall into a cluster along filaments, the bulk flow enhances the galaxy density and causes galaxies to have small relative velocities,thus leading to a high probability for mergers at typical group overdensities. Closer to the cluster core, galaxies show large random motions,producing a sharp drop in the probability of mergers. The 3 dashed lines show the estimated observed number density (nmerg) and fraction(fmerg) of mergers, for the 3 different regions of the A901/902 clusters (core, outer region, and outskirt). The points at which the dashed linescross the solid curve tell us the typical overdensities at which we expect to find such merger densities in the simulations. Between the clustercore and the cluster virial radius (0.25 Mpc < R ≤ 1.2 Mpc), the observed merger density is close to those seen at typical group overdensities,in agreement with the scenario of cluster growth via accretion of field and/or group galaxies.

Interacting Galaxies in the A901/902 Supercluster 25
Fig. 12.— Comparisons of our observed fraction of interacting galaxies with other studies of clusters, groups, and field galaxies. Filledcircles are for cluster data points of intermediate luminosity (L < L∗ and/or M = 1 × 10⁹ to a few ×1010M), and the cluster data pointsare in order of increasing redshift: this study of A901/902 (most systems have MV ∼ − 19 to -22 and M∗ = 1 × 10⁹ to a few ×1010M);Couch et al. (1998; L < 2L∗), Oemler et al. (1997; lower limit of f for MV < −19), Dressler et al. (1994; MV < −18.5). The van Dokkumet al. (1999) point at z = 0.83 (open circle) is for a cluster sample of luminous (MB ∼ −22 and L ∼ 2L∗) galaxies. The group point (filledsquare) is from McIntosh et al. (2007) for galaxy masses above 5 × 10¹⁰M. The Hickson compact group point (open triangle) is from Zepfet al. (1993) and is for galaxies of luminosities L ≤ L∗.

26 Heiderman et al.
Fig. 13.— Top Left: The rest-frame U − V color of galaxies is plotted against their minimum distance from the nearest cluster center.Top Right: The rest-frame U − V color is plotted against stellar masses for galaxies of different visual classes (Interacting, Non-interactingIrr-1, and Non-interacting Symmetric). The black solid lines separate the blue cloud and red sequence. For M ≥ 1 × 10⁹M systems, wefind that 61 ± 14% (23/38) of the interacting galaxies lie on the blue cloud, compared to 35 ± 7% (251/720) for non-interacting galaxies.There is an excess of blue galaxies among interacting systems. Bottom Left: The fraction of all galaxies on the blue cloud (solid line), andthe fraction of interacting galaxies on the blue cloud (dotted line) both rise as a function of clustocentric radius (Table 7). The increase ismore pronounced for the fraction of blue interacting galaxies, which rises from 0 to 0.62± 0.15 to 0.50± 0.25% (Table 7) in the cluster core(R ≤ 0.25 Mpc) to the outer region (0.25 Mpc < R ≤ 1.2 Mpc) to the outskirt region (1.2 Mpc < R ≤ 2 Mpc).
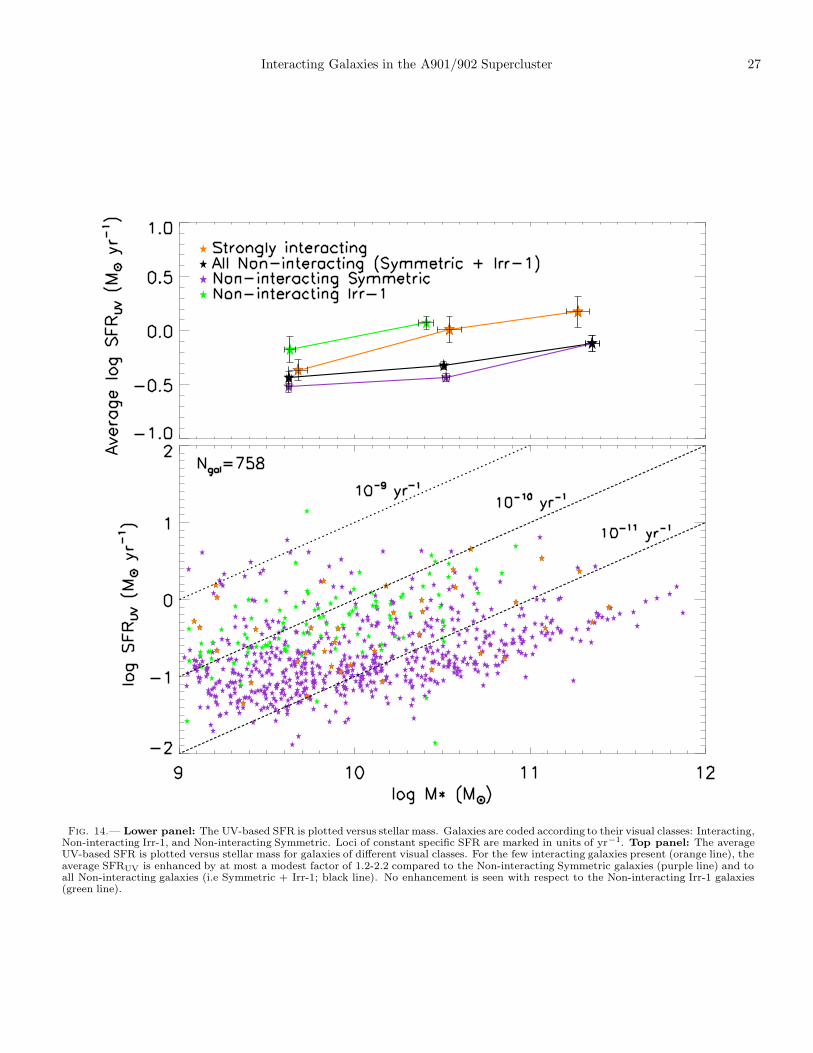
Interacting Galaxies in the A901/902 Supercluster 27
Fig. 14.— Lower panel: The UV-based SFR is plotted versus stellar mass. Galaxies are coded according to their visual classes: Interacting,Non-interacting Irr-1, and Non-interacting Symmetric. Loci of constant specific SFR are marked in units of yr−1. Top panel: The averageUV-based SFR is plotted versus stellar mass for galaxies of different visual classes. For the few interacting galaxies present (orange line), theaverage SFRUV is enhanced by at most a modest factor of 1.2-2.2 compared to the Non-interacting Symmetric galaxies (purple line) and toall Non-interacting galaxies (i.e Symmetric + Irr-1; black line). No enhancement is seen with respect to the Non-interacting Irr-1 galaxies(green line).

28 Heiderman et al.
Fig. 15.— Bottom panel: The UV+IR-based SFR is plotted versus stellar mass. Galaxies are coded according to their visual classes:Interacting, Non-interacting Irr-1, and Non-interacting Symmetric. Loci of constant specific SFR are marked in units of yr−1. The invertedtriangles denote upper limits on the UV+IR-based SFR for galaxies for which there was no 24µm detection and we used the detection limit.Middle panel: The average UV+IR-based SFR is plotted versus stellar mass for galaxies of different visual classes. We include galaxies witha 24µm detection, as well as those with only upper limits on the 24µm flux. Top panel: Same as middle panel, except that we only includegalaxies with a 24µm detection and exclude those with upper limits. In both top and middle panel, we find that for the few interactinggalaxies present (orange line), the average SFRUV+IR is typically enhanced by only a factor of ∼ 2 to 3 compared to the Non-interactingSymmetric galaxies (purple line) and to all Non-interacting galaxies (i.e Symmetric + Irr-1; black line).