intensive monitoring of spawning … · des routines de prélèvement et de traitement d ......
TRANSCRIPT

INTENSIVE MONITORING OF SPAWNING
POPULATIONS OF THE BALTIC HERRING
(Clupea harengus membras L.) FINAL REPORT of the study project ref. No 96-068, 1997-1999
Rajasilta, M. Jönsson, N. Eklund, J. Lorenz, T. Laine, P. Archipelago Research Institute Department of Biology University of Turku University of Rostock Finland Germany
Contact person: M. Rajasilta e-mail:[email protected]
SEILI Archipelago Research Institute Publications 3 Turku 2006

This report does not necessarily reflect the views of the European Commission and in no way anticipates any future opinion of the Commission. The contents of this report may not be reproduced unless the source of the material is indicated. The study has been carried out with the financial assistance of the European Commission. Key words: Baltic herring, biological monitoring, reproduction, population parameters, genetic structure (annexes not included) Saaristomeren tutkimuslaitos Turun yliopiston ympäristöntutkimuskeskus Turku 2006 ISBN 951-29-3047-1 ISSN 1456-4548
Abstract The purpose of the study reported here was to design a monitoring programme, a database and the appropriate sampling and handling routines specifically adapted to monitoring spawning populations of the Baltic herring (Clupea harengus membras). The emphasis on spawning fish and reproductive parameters was intended to supplement the monitoring and stock assessment procedures routinely implemented for the species. Herring populations were sampled annually in two spawning areas, the Greifswalder Bodden in the southern Baltic (Rügen herring), and the Archipelago Sea in the northern Baltic (Airisto herring). Random samples of 100-200 fish were taken from commercial trap net catches throughout the spawning season lasting 2-3 months in both areas. Basic population parameters determined for males and females separately were fish length, weight, age, condition and gonad weight, but also the genetic structure and other characteristics of the populations were investigated. The database consists of basic information of ca 12 300 herrings from the Archipelago Sea and ca 10 000 herrings from the Greifwswalder Bodden, collected in 1997-1998, and samples describing the genetic structure of the two spawning populations. The study also utilised data collected previously, especially in the statistical analyses of parameter variation. Genetic analyses, using mitochondrial DNA and allozyme data indicated high diversity in the herring at individual level, but no differentiation was found among the sampling locations within the spawning areas, or between the southern and northern populations. High variation was characteristic also of the population parameters of the Airisto herring, which complicated the statistical analyses. The parameters were tested with two-way analysis of covariance, using two alternative models; an individual-based model where all individual observations were included and a shoal average model, where only sample means were used. In Airisto, the models indicated that population structure was independent of sampling location. Instead, temporal factors (sampling year and day) accounted for most of the variation explained by the models. The relation of sampling day with the examined variables varied annually from negative to positive, but variation was unpredictable on an annual basis. In Rügen, all variables were affected by sampling day, but the regression was always negative. Additionally, the analysis suggested that population structure is dependent on spatial factors. It was concluded that in both areas, sampling has to cover the spawning season sufficiently and a weekly sampling over the season is therefore recommended. In Airisto, herring samples can be taken from any location in the spawning area, while in the Greifswalder Bodden samples representative of the population may be obtained only in given locations. The population data and other results of the study suggested, that salinity conditions strongly modify herring characteristics in the northern Baltic Sea. In the Airisto population, results indicate a trade-off between fish growth and reproduction at low salinity. The reproductive strategy of the Baltic herring, it seems, is to reduce body size while maintaining reproductive output. For this reason, herring growth may not indicate fishing pressure in the northern Baltic Sea. In the Rügen herring, the growth rates, among other data, suggested a high fishing pressure outside the spawning area. In both areas, herring spawning has continued uninterruptedly over the years, in spite of the strong anthropogenic influence. The tendency to spawn in river estuaries makes herring reproduction highly vulnerable to environmental disturbances, as these accumulate in estuarine areas. High egg mortalities were found in both spawning areas, and the spawning beds are progressively reducing in number and area, due to disappearance of aquatic vegetation. This process is connected with increased water turbidity, caused by high load of nutrients and increased sedimentation in the coastal areas.
SEILI Archipelago Research Institute Publications 3
Résumé L'objectif de cette étude a été d'élaborer un programme de côntrole, une base de données et des routines de prélèvement et de traitement d'échantillons adéquates, particulièrement adaptées à surveiller des populations frayant de harengs de la Baltique (Clupea harengus membras). L'importance particulière mise sur des poissons frayant et sur des paramètres de reproduction était destinée à compléter les procédures normales de surveillance et d'évaluation des populations de poissons mises en pratique pour l'espèce. Des échantillons de populations de harengs de la Baltique étaient prélevés tous les ans dans deux frayères, Greifswalder Bodden dans la Baltique du Sud (harengs de Rugen), et la mer de l'Archipel dans la Baltique du Nord (harengs d'Airisto). Des échantillons de 100-200 poissons étaient prélevés au hasard dans des prises à verveux commerciales pendant le temps du frai, comprenant 2-3 mois dans les deux régions. Les paramètres fondamentaux pour les populations, détérminés séparément pour mâles et femelles, étaient longeur, poids, condition et poids de gonade, ainsi que structure génétique et autres caractéristiques des populations examinées. La base de données comprend des données fondamentales d'environ 12 300 harengs de la mer de l'Archipel et d'environ 10 000 harengs de Greifswalder Bodden, tous ramassées en 1997-1998, et des échantillons representant la structure génétique des deux populations frayant. Nous avons aussi utilisé des données prélevées antérieurement, notamment pour les analyses statistiques des variations des paramètres. L'analyse génétique, appliquant des données d'ADN mitochondrial et d'allozymes, a indiqué une grande diversité chez les harengs sur un niveau individuel, mais nous n'avons pas trouvé des différences entre diverses échantillons dans les frayères, ni entre les populations méridionale et septentrionale. De grandes variations ont aussi caracterisé les paramètres des populations de harengs d'Airisto, un fait qui a compliqué l'analyse statistique. Les paramètres étaient testés par analyse de covariance à deux facteurs en pratiquant deux modèles alternatifs. L'un était individuel includant tous les observations individuelles et l'autre était basé sur les valeurs moyens d'echantillons seulement. À Airisto, les modèles ont indiqué que la structure des populations était independante de la locations de prélèvement. Plutôt, c'étaient des facteurs temporels (l'an et le jour de prélèvement) qui ont été responsable de la plupart des variations expliquées par les modèles. La relation de la date de prélèvement avec les variables examinés a varié annuellement du négatif au positif, mais la variation était imprévisible sur une base annuelle. À Rugen, tous les variables étaient influencés par l'an et le jour, mais la regression était toujours négative. En plus, l'analyse a laissé supposer que la structure des populations était dépendante des facteurs spatiaux. Nous sommes arrivés à la conclusion que dans les deux régions le prélèvement doit couvrir suffisamment la saison du frai et nous recommandons un prélèvement par semaine pendant tout le frai. À Airisto les échantillons de harengs peuvent être prélevés n'importe où dans la frayère, pendant que dans Greifswalder Bodden des échantillons représentatifs de la population peuvent être prélevés seulement à des endroits précis. Les données de populations et les autres résultats de l'étude ont laissé supposer que les conditions de salinité modifient beaucoup les caracteristiques du hareng dans le nord de la Baltique. Pour la population d'Airisto, les résultats indique un compromis entre la croissance de poisson et la reproduction dans des conditions de salinité basse. Il semble que la stratégie de reproduction du hareng de la Baltique soit de réduire sa taille en conservant la capacité de reproduction. C'est la raison pour laquelle la croissance de hareng, n'indique pas peut-être de pression de pêche dans la Baltique du Nord. Pour le hareng de Rugen le taux de croissance, entre autres données, a laissé supposer une grande pression de pêche hors de la frayère. Dans les deux régions le frai a continué sans interruption pendant les années, malgré l'influence anthropogenique considerable. La tendance du hareng de frayer dans des embouchures fait que la reproduction du hareng est très vulnérable aux disturbances environmentaux, comme ceux-ci s'accumulent dans les embouchures. Mortalité élevée des oeufs de hareng a été constaté dans les deux frayères et le nombre et l'étendue des frayères sont diminués succesivement à cause d'une disparition de la végétation aquatique. Ce processus a un rapport avec la turbidité élevée de l'eau, provoquée par la charge de substances nutritives augmentée et la sédimentation en progression dans les régions littorales.
SEILI Archipelago Research Institute Publications 3
Summary Herring (Baltic herring, Clupea harengus membras) is the dominant fish species in the Baltic fisheries as well as in the Baltic ecosystem. The herring catch of up to 400 000 metric tons per year makes up about half of the total fish catch in the Baltic. In the ecosystem, the herring is one of the main grazers on zooplankton, the prime prey for cod and salmon and a major food competitor to sprat and many other species. Compared to the marine environment, the Baltic ecosystem is by nature variable and vulnerable to human impact. The Baltic Sea is one of the most heavily loaded sea areas of the world (nutrients, harmful substances). Human impact accumulates in the coastal area, where herring spawn. Monitoring of fish stocks is necessary in order to manage the fisheries properly and also aids in monitoring environmental change. The Baltic herring stocks are monitored by the Baltic countries, and stock assessments and management advice are given by the ICES. Fisheries management relies largely on age-structured stock assessments putting little weight on reproductive parameters and individual fish parameters. Correct assessment of the Baltic herring stock is imperative in view of the species' importance to fishery and ecosystem alike. In this study, we report on population parameters of spawning herring in two areas of the Baltic, the Greifswalder Bodden on the NE coast of Germany and the Archipelago Sea in SW Finland. By analysing parameter variation between sampling occasions, sites and years, we arrive at suggestions for a monitoring programme for spawning herring, designed to implement the monitoring and assessment procedures already in operation. We also summarize our own, earlier studies of herring spawning and reproduction and preliminarily report new results on the genetical structure of the Baltic herring and on the accuracy of herring ageing, as these things have important bearings on monitoring, stock assessment and management. Study areas Greifswalder Bodden is the main spawning area of southern Baltic herring migrating between feeding grounds in the North Sea and spawning and nursery areas in the Baltic. Spawning shoals arrive in February and spawn mainly in March-April, and are fished with gill nets and trap nets. The Archipelago Sea is a spawning and nursery area for herring feeding in the northern Baltic and the Bothnian Sea. The fish spawn in April-July and are then fished with trap nets. In both areas, herring spawn on vegetation in shallow water. The same spawning beds have been used since 1981, when diving surveys of the spawning commenced. Egg mortality increases towards the end of the spawning season and appears to have increased overall, which may be a result of high anthropogenic input of metals and other harmful substances. In Greifswalder Bodden, eutrophication due to nutrient input from the river Oder has brought about a strong decrease in macrophyte cover of the seabed. In the Archipelago Sea, increased nutrient and sediment input from rivers and dredging operations have led to hard bottom habitats with perennial algae being replaced by soft bottom and annual plants. These changes decrease the area potentially available for herring spawning and also impair development of the eggs. In both areas, thus, human activities threaten the spawning of herring. Methods and material Herring were sampled from the catches in trap nets set on the spawning grounds. Samples were taken throughout the spawning season (roughly March -April in Germany and April - July in Finland). Both data obtained in this study (1997-1998) and other data (1976-1998) are reported. Samples consisted of 100-200 fish taken at random. Fish were measured for total length (0.1 cm), total weight (0.1 g) and gonad weight (0.01 g). Sex (male/female) and gonad stage (1-8) were determined. For some of the fish, age was read from the otoliths, fecundity was determined and / or the fat content of the dorsal muscle was analysed. Genetical variation was studied by mitochondrial DNA analysis and by allozyme electrophoresis. With juvenile herring, an experiment was made to determine the effect of salinity on growth. The fish were
SEILI Archipelago Research Institute Publications 3
kept in tanks at four different salinities, radioactive glycine (14C-glycine) added and incorporation of glycine in the scales (indicating growth rate) recorded with a radioactivity counter. The variation between sampling dates, sites and years was analysed by two-way analysis of covariance using individual fish data and by a linear regression model using sample means. Data were grouped according to year, date, area and sex. Results Herring from the two study areas expectedly differed in size (length, weight and related parameters): southern Baltic herring grow bigger than herring from the northern Baltic. In the Greifswalder Bodden, the age distribution of the spawning fish is narrow and the shoals consist mainly of ages 2 - 6. In the Archipelago Sea, spawning shoals consist of ages 2 - 12. Within study areas, fish length varied between sampling date and between years. In the Archipelago Sea, mean length of the spawning fish has decreased significantly during 1988-1998. Fish weight varied accordingly and also declined during the period. The GSI (gonad weight as a percentage of body weight, indicating reproductive input) varied between years, but there was no trend. Fish condition varied between years without any trend over spawning season or years. Fish age varied between years but not between subareas and in 1988 - 1998, there was a slight increase in the mean age of spawning fish. In Greifswalder Bodden, analysing only 1997-1998 data, there was a decrease in fish length and weight from 1997 to 1998. The modal age was 3 years in 1997 and 5 years in 1998. The genetical analysis showed that, between different areas of the Baltic (Gulf of Bothnia, Archipelago Sea, Greifswalder Bodden), there is no difference between populations. Instead, the variation between individuals is very high and there are fish of the same maternal lineage spawning at different times in the same area and even in different parts of the Baltic. Comparisons of age determinations made by different readers from herring scales and otoliths showed high variation between readers and between subsequent readings by the same person. Scale and otolith ages are linearly related, but scale age falls below otolith age for older fish. Salinity experiments showed, not very conclusively, that fish kept at low salinity (5.7 or 8 PSU) had less growth than at high salinities (12 and 15 PSU). Implications for monitoring Parameters of the spawning populations vary seasonally and there also is short-term variation between sampling sites and days. The pattern of variation is unpredictable. Over years, there are trends in fish size. Trends in fish size over time and the uncertainty of ageing make age and size less suitable as monitoring parameters for stock assessment. On the other hand, there is high genetic variation, but no genetic segregation between spawnings shoals or between areas. We conclude that spawning herring should be sampled annually with frequent samples over the spawning season, which after mild winters starts earlier than after cold ones. Commercial trap net catches are preferable for sampling. In the Archipelago Sea samples can be taken on any trap net location in the inner part of the area, in Greifswalder Bodden, a trap net catching incoming, unspawned fish should be chosen. Samples should consist of at least 200 fish. For monitoring Baltic herring, we suggest sampling in 5-6 areas (Bothnian Bay, Bothnian Sea, Archipelago Sea, Gulf of Finland, Baltic Proper, Southern Baltic).
SEILI Archipelago Research Institute Publications 3

Contents I. Introduction .............................................................................................................................. 1 II. Environmental conditions in the study areas ............................................................................ 2 III. Herring of the study areas........................................................................................................ 6
3.1. Spawning grounds ............................................................................................... 6 3.2. Characteristics of spawning................................................................................. 7 3.3. Herring fishery ..................................................................................................... 7
IV. Background data, materials and methods............................................................................. 11 4.1. Population studies ............................................................................................. 11
4.1.1. Fish sampling .............................................................................................. 11 4.1.2. Measurements and determination of population parameters ...................... 12 4.1.3. Age reading................................................................................................. 12 4.1.4. Fecundity..................................................................................................... 12
4.2. Fat content of herring......................................................................................... 13 4.3. Genetic studies .................................................................................................. 14
4.3.2. Allozyme electrophoresis ............................................................................ 14 4.3.3. DNA methodology ....................................................................................... 15
4.4. Herring growth in different salinity conditions .................................................... 15 4.5. Herring spawning grounds and mortality of the eggs......................................... 17 4.6. Catch statistics................................................................................................... 19 4.7. Statistical analyses of the population data......................................................... 19
4.7.1. Outlines of the monitoring programme........................................................ 19 V. Results .................................................................................................................................... 23
5.1. Description of populations ................................................................................. 23 5.2. The effect of sampling site and time on estimated properties of spawning populations ............................................................................................................... 27
5.2.1. Heterogeneity within spawning area (Airisto and Rügen) ........................... 27 5.2.3. Comparison between two nearby spawning areas (Airisto – Mynälahti)..... 46 5.2.2. Effect of the trap net on population data ..................................................... 49
5.3. Seasonal effects in population parameters........................................................ 50 5.4. Herring spawning time and intensity of spawning.............................................. 50 5.5 Spawning beds and egg mortality....................................................................... 53
5.5.1. Use of spawning beds................................................................................. 53 5.5.2. Egg mortality ............................................................................................... 54 5.5.3. State of spawning beds............................................................................... 56
5.6. Genetic studies .................................................................................................. 57 5.6.1. MtDNA......................................................................................................... 57 5.6.2. Allozymes.................................................................................................... 58
5.7. Studies on age and growth ................................................................................ 60 5.7.1. Comparison of otolith and scale age........................................................... 60 5.7.2. Feeding and growth of herring in different salinities.................................... 60
VI. Applications of monitoring data ............................................................................................. 62 6.1. Population parameters: long-term data.............................................................. 62 6.2. Changes in the energy reserves of the herring.................................................. 65 6.3. Herring fat content in 1998 ................................................................................ 66
VII. Proposal for the monitoring programme............................................................................... 68 VIII. Current state of the herring stock and spawning grounds.................................................. 69 IX. Organisation of the study..................................................................................................... 70
Participants and cooperation .................................................................................... 70 Project meetings ....................................................................................................... 70
List of publications....................................................................................................................... 71 List of references......................................................................................................................... 71 Annexes ...................................................................................................................................... 75
SEILI Archipelago Research Institute Publications 3

1
I. Introduction The annual landings (300 000 - 400 000 tons a-1) of herring (Clupea harengus membras) represent ca 50% of the total fish catch in the Baltic Sea, giving the species a dominant position in the Baltic fisheries and fish processing industry. Although the fisheries sector is of only modest significance in the economies of the Baltic countries, on a local and regional level the fishery plays an important socio-economic role. In many areas, herring is one of the main species caught, contributing decisively to the profitability of fishing. The Baltic ecosystem has considerably changed during the past years, partly because of natural processes, but also due to human activities. Increased river runoff and reduced inflow of water from the North Sea have caused a decrease in water salinity (Vuorinen et al. 1998) and eutrophication, which earlier was a problem of coastal waters only, is nowadays observable also in the open sea (Wulff et al. 1994, Bonsdorff et al. 1997). Industrial and agricultural activity has released an array of chemicals into the Baltic Sea, where many of these environmental contaminants have become a permanent problem of the food webs. Massive blooms of blue-green algae occur frequently in the central and northern basins of the Baltic Sea, posing a threat of unknown, but possibly large-scale, changes to the ecosystem. For the first time in the history of the Baltic Sea, herring fisheries are carried out at high intensity in a situation where salinity of the sea water is exceptionally low and human influence high, especially in the coastal waters where herring spawn. The economical importance of the fishery and the key role of the species in the Baltic ecosystem put high demands on the monitoring of the herring stocks. The Baltic countries are obliged to monitor the herring stocks of the Baltic Sea, but the monitoring programmes currently used are based on stock assessment procedures, which put little emphasis on the reproduction of the species. Information collected from reproducing fish improves the chances of explaining and forecasting long-term changes in the stock. To supplement the monitoring programmes already in operation, therefore, additional monitoring of the reproducing fish is needed. In this study we present the results of spawning herring monitoring from two Baltic areas, analyse population trends on the basis of these data and, finally, propose a monitoring programme to be implemented. The main objectives of the study were: (1) to develop a cost-efficient, scientifically competent sampling system for the biological
monitoring of spawning herring; (2) to establish a common database for the population parameters of the spawners; (3) to find the key ecological variables for detecting and describing the state of the spawning
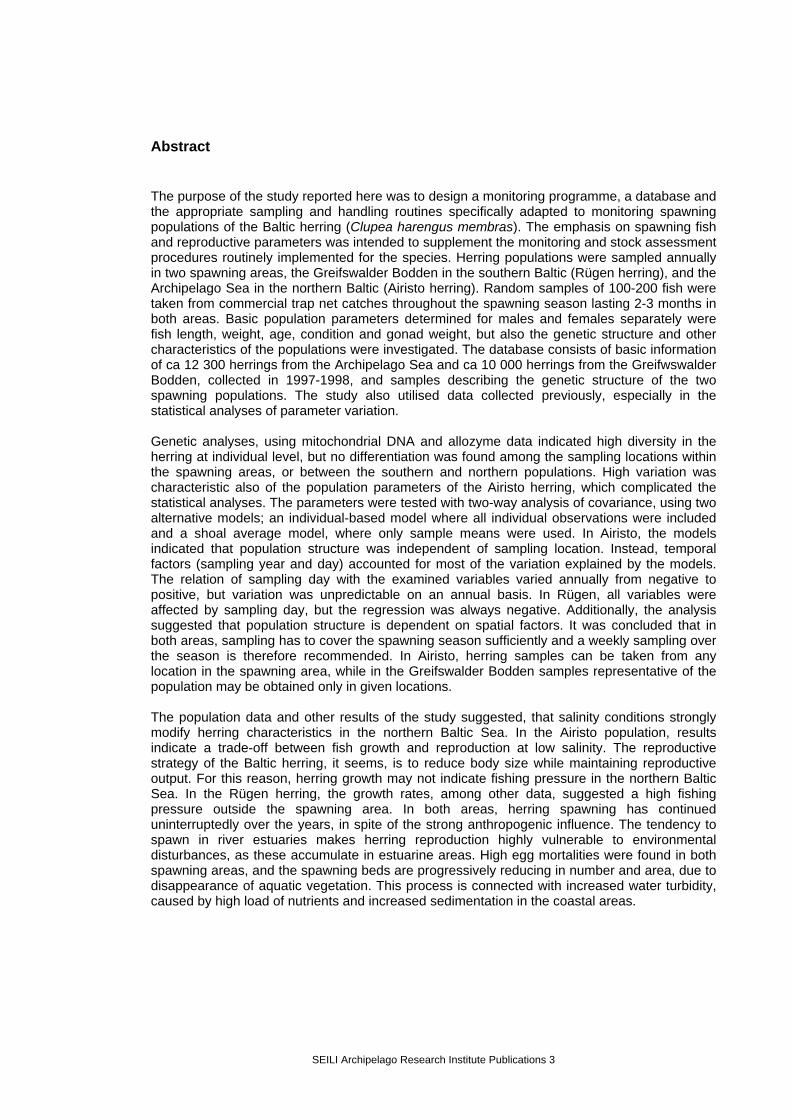
populations, with respect to changes in environmental conditions and fisheries; and (4) to present an overview of the present state of the herring populations in the study areas. In the study, herring from two spawning areas were investigated. In the Archipelago Sea of the northern Baltic (ICES subdivision 29; Figure 1), the Airisto Inlet is an important spawning area for herring, while the Greifswalder Bodden on the coast of Germany (ICES 24; Figure 1) represents a main spawning area for the southern herring population. In both areas, samples of spawning herring have been collected over relatively long periods and also the spawning beds have been investigated for several years. This project utilised the extensive data collected previously, but also collected new data during the study period 1997-1998.
SEILI Archipelago Research Institute Publications 3

2
Figure 1. The study areas (Archipelago Sea and Greifswalder Bodden) and the ICES subdivisions 24-32 in the Baltic Sea. The annual herring sampling in the Airisto was initiated in 1984, when salinity of the Baltic Sea was close to the long-time average, due to the major inflow of North Sea water in 1976. Since then, salinity has gradually decreased and, consequently, the central and northern basins of the Baltic Sea have become more limnic (Vuorinen et al. 1998). The response of the herring stock to this situation has been a strong decrease in fish growth (Anonymous 1994), which causes problems for the herring fishery and fish processing industry. The
material collected during the salinity decrease gave an opportunity to examine the reasons for the decrease of growth, and also to test the applicability of the monitoring data in detecting and explaining the changes in the biological properties of the herring. Sustainable use of fish stocks requires that fish genomes and genes are identified and monitored (The Convention on Biological Diversity; Rio de Janeiro, 5th of June 1992). So far, regular monitoring of the level of genetic variation has been recommended for aquacultural use only to check that breeding programmes do no cause erosion of genetic variability (Ward & Grewe 1995). Potentially, the genetic structure of natural fish populations may change as a response to environmental changes or fisheries in a long time run. Although it is unlikely that fishing affects the level of genetic variation in herring, environmental disturbances or pollutants can bring about a ‘bottle-neck’ effect in the genetic variability of herring or any other fish species in the Baltic Sea. To be able to detect the possible changes in the genetic structure of the Baltic herring in the future, a sample of genetic markers (allozymes, mitochondrial DNA) were included in the database containing the population parameters of spawning fish. In this report, the results of the study project are presented. The basic data, including the analyses of population structure made in order to generate the monitoring programme, are presented in chapters V-VI. The applications of the monitoring data and other studies made under the theme are reported in detail as scientific articles or study reports at the end of the report. II. Environmental conditions in the study areas The Airisto The Airisto basin (area 250 km2) is a relatively shallow archipelago area with a mean depth of 20 m and a maximum depth of ca 90 m. In the main basin, the bottom sediment consists of Ancylus clay (Heino 1973). The shores are mainly rocky or stony, but also sand and clay shores are found. In the littoral zone, the dominant plants are filamentous green and brown algae (Cladophora, Pilayella, and Ectocarpus), bladder wrack (Fucus vesiculosus), and red algae (Furcellaria and Phyllophora). Fresh water species like Potamogeton, Myriophyllum,
SEILI Archipelago Research Institute Publications 3

3
Ranunculus, and Zannichellia grow in many places. In sheltered areas, Phragmites australis forms vast monotypic stands. The largest river discharging into the area is the river Aurajoki (Figure 2). Water salinity is ca. 5-6 psu at sea surface in the central basin but decreases to 0-2 psu in the river mouth. There is a short-term fluctuation in salinity due to river runoff and a long-term fluctuation depending on the general trends of salinity in the Baltic Sea. Since the last major salt water inflow in 1976, salinity has decreased from 7.8 psu to 6.9 psu in the Baltic Proper (Gotland deep; 20 m), and this trend is observable also in the Airisto basin (Figure 3). Temperature conditions vary from year to year, but the annual sum of sea water temperature shows no changes during the past 20 years (Figure 3). The Airisto is under heavy anthropogenic influence from many sources (Table 1). The rivers, towns and industry load the sea with phosphorus and nitrogen compounds which cause eutrophication especially in the northern part of the area. Due to the ship traffic to the harbours of Turku and Naantali, the shores close to the fairways are exposed to a continuous wave action which results in erosion of the shore material. The dredging activities of the harbours cause increased sedimentation in the area as large masses of harbour sediments are dumped into the sea (100 000 - 1000 000 m3 a-1). Airisto is a highly turbulent system where the sedimentation of the dredging spoils is incomplete. The dumped masses, which are mainly composed of soft, fine-grained sediments, are transported by water currents far from the dumping area. The sediments contain high amounts of heavy metals and PCB, which accumulate in the local food-webs (Kohonen 1999). Table 1. Annual load of phosphorus and nitrogen in the study area by (A) point load sources and (B) by rivers Aurajoki and Paimionjoki (Figure 2). Values in (A) are means of years 1989-94 (Anttalainen & Kolehmainen 1995); in (B) means of 1986-90 (Pitkänen 1994). (C) Volume (1000 m3) of harbour sediments dumped annually in the northern Airisto (1994-97); and the concentrations of Cu, Zn, Cd, Pb (ppm) and PCB (µg kg-1) in the material collected with sediment traps in the surroundings of the dumping location (Wright et al 1995; Kauppila et al. 1997; Itkonen al. 1998; Kohonen et al. 1999). n.d. = not determined. Source Mean annual
flow (m3 s-1 ) Total P (t a-1)
Total N (t a-1)
(A) Municipalities 22 832 Industry 1 136 TOTAL 23 968 (B) River Aurajoki 9.0 56 640 River Paimionjoki 10.5 78 810 (C) Year Volume 1000
m3a-1Cu
ppm Zn
ppm Cd
ppm Pb
ppm PCB µgkg-1
1994 101 39 428 3.1 29 n.d. 1995 155 35 116 1.1 37 n.d. 1996 209 49 231 0.3 25 n.d. 1997 375 42 197 0.3 30 74 1998 1112 43 165 0.3 31 35
SEILI Archipelago Research Institute Publications 3

4
Figure 2. The main spawning areas of the herring (Airisto, Mynälahti and Paimionlahti) in the Archipelago Sea, SW Finland, and the two main freshwater sources in the area.
SEILI Archipelago Research Institute Publications 3

5
Figure 3. Salinity (measured at 20 m in the Gotland deep and in the Archipelago Sea) and annual sum of daily temperatures in the surface water in the Archipelago Sea (measuring point in southern Airisto) in 1977-1998. On the map, the sampling locations of fish in genetic analyses are shown. BS= Bothnian Sea; AS= Archipelago Sea and RU= Rügen. The Greifswalder Bodden The Greifswalder Bodden in the estuary of the river Oder is a flat and shallow bay with a wide connection to the Baltic Sea (Figure 4). The area of the bay is 510 km2 but the mean depth is only 5.8 m. Salinity of the bay varies between 5 and 9 psu. The anthropogenic influence is mainly of industrial and agricultural origin (Table 2), but also tourism has caused disturbances in the aquatic ecosystem. The human influence has decreased since the beginning of the 1990’s, but no significant improvement in the state of the area has taken place so far. Table 2. Annual load of phosphorus and nitrogen in the Greifswalder Bodden. (A) shows the direct input into the study area; and (B) the anthropogenic activities such as industry, shipping, trade, agriculture and tourism in the river catchment areas (values are means of 1994/95; Meyer et al. 1998). (C) Concentration of heavy metals (Cu, Zn, Cd, Pb) in the sediment and suspended particles in the Greifswalder Bodden in 1994/95 (Eidam et al. 1998). Number of samples analysed is given in parenthesis.
Table 2. Annual load of phosphorus and nitrogen in the Greifswalder Bodden. (A) shows the direct input into the study area; and (B) the anthropogenic activities such as industry, shipping, trade, agriculture and tourism in the river catchment areas (values are means of 1994/95; Meyer et al. 1998). (C) Concentration of heavy metals (Cu, Zn, Cd, Pb) in the sediment and suspended particles in the Greifswalder Bodden in 1994/95 (Eidam et al. 1998). Number of samples analysed is given in parenthesis. Source Source Mean annual
flow (m3 s-1) Mean annual flow (m
Total P Total P (t a-1) (t a
Total N Total N (t a-1) (t a3 s-1) -1) -1)
(A) Municipalities 14 282Wet deposition 2 400(B) River Oder 76.1 830 13 100River Peene 28.1 125 5 050TOTAL A+B 971 18 832 (C) Material
Cuppm
Znppm
Cdppm
Pbppm
Sediment (57) 29 189 1.6 49Suspended particles (5) 59 769 1.5 115
SEILI Archipelago Research Institute Publications 3
6
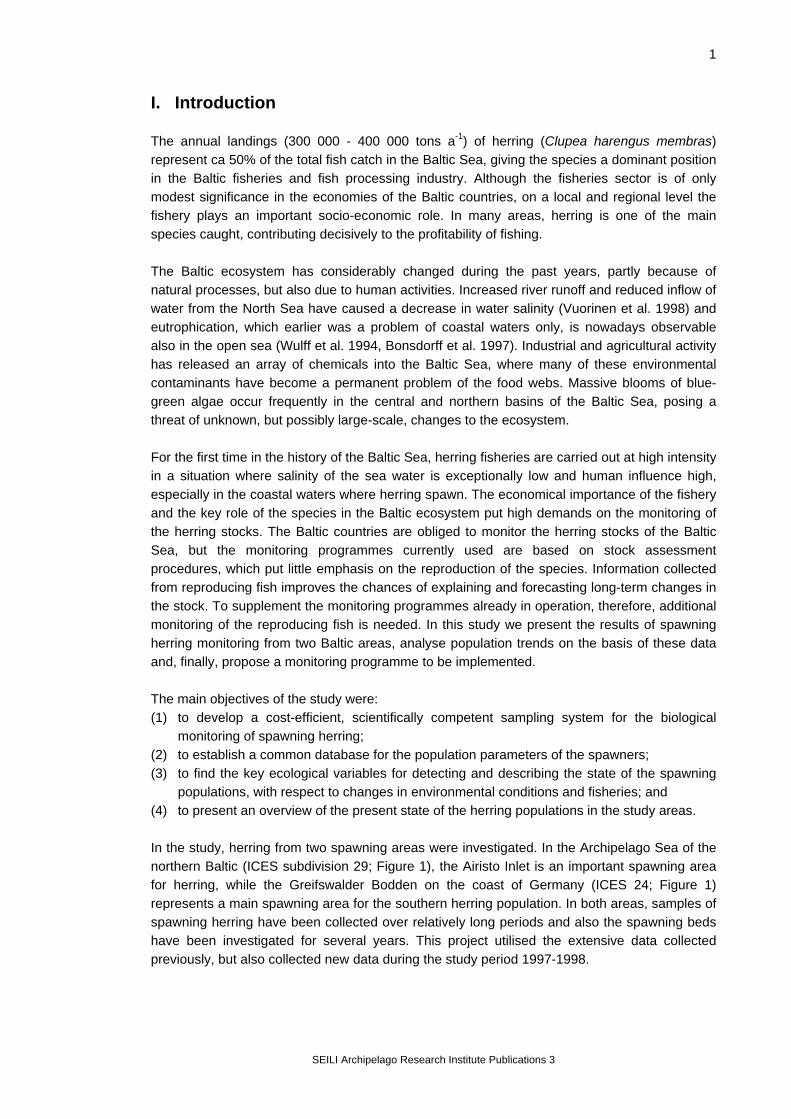
Figure 4. The Greifswalder Bodden in the southern Baltic.
III. Herring of the study areas 3.1. Spawning grounds The innermost parts of the Archipelago Sea (Figure 2) are widely used by the herring for reproduction. Herring spawning in this area migrate to the north or south for feeding and overwintering periods (Parmanne 1990; Kääriä et al. 1999), although part of the population may also overwinter within the Archipelago Sea, as shown by trawl catches in winter (Rajasilta 1992). Although herring is known to spawn also in the outer and middle archipelago, the spawning grounds are mostly situated in the river estuaries. In the Archipelago Sea, there are three large bays or inlets where herring spawn, all with a freshwater input from small or medium-sized rivers. The bays are, from north to south, the bays of Mynälahti, Airisto and Paimionlahti (Figure 2). There is no information on the proportion of each bay in the total production of larvae, but if the area of potential spawning grounds is taken as a measure of this, the bays of Mynälahti and Airisto are the most important spawning and nursery areas of the species in the Archipelago Sea. In the southern Baltic, the herring spawns on a more or less continuous belt which starts from Denmark and extends to Poland. On the coast of Germany, Greifswalder Bodden (Figure 4) is the main spawning area of the population which has its feeding and overwintering areas outside the Baltic Sea. The taggings carried out around the Island of Rügen in 1975-1989 show that after spawning the herrings migrate through the Danish sounds to feeding areas in the Skagerrak and Kattegat region (Jönsson & Biester 1981a, b; Jönsson & Richter 1993). This is indicated also by the high frequency of infections by parasitic nematodes (Anisakis sp.) in the Rügen herring. This nematode, common in the North Sea, is not found in the Baltic Sea. Diving surveys were made in 1981-1989 in the Airisto (Rajasilta & Ranta-aho 1982; Rajasilta & Kääriä 1985; Kääriä et al. 1987; Rajasilta et al. 1993; Kääriä et al. 1997) and in 1982-1989 in the Greifswalder Bodden (Scabell 1988; Geisel & Messner 1989; Scabell & Jönsson 1989), in order to locate the spawning beds of the herring. These studies have also given information on
SEILI Archipelago Research Institute Publications 3
7
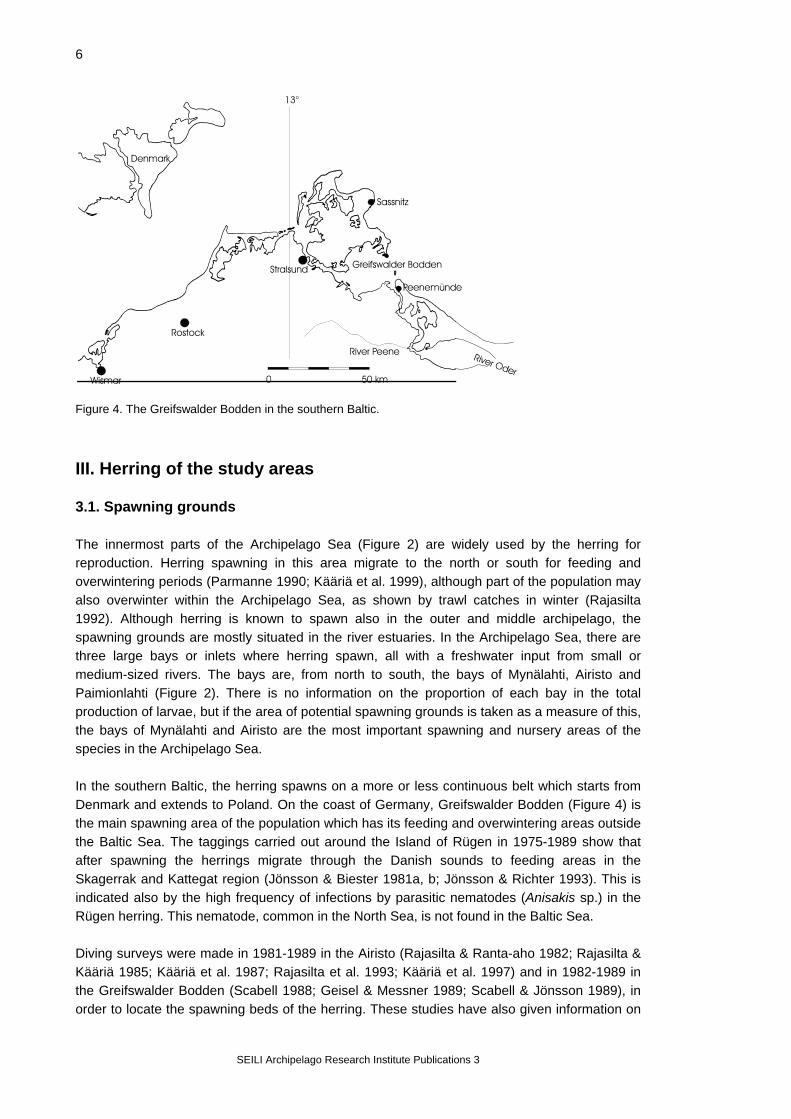
the general characteristics of spawning beds. In both study areas, herring seems to spawn on given locations only, in spite of most shores being potentially suitable for spawning as to their environmental characteristics. Herring obviously selects the spawning locations by some means, but it is not known why it prefers some shores to all others potentially suitable for spawning (Kääriä et al. 1997). 3.2. Characteristics of spawning In the Baltic Sea, herring spawns over a relatively long time period. The onset of spawning follows the latitudinal zones so that spawning starts earlier in the south than in the north. In the Greifswalder Bodden, herring normally spawns between the end of February and end of May (Busch et al. 1996). In the Archipelago Sea, the first spawn is usually found in the beginning of May and the spawning continues to the middle of July or even to August (Table 3). During the spawning period, herring schools arrive at their spawning grounds, spawn there, and migrate back to the open sea. Herring spawning is a continuum in time, obviously because individuals in the population mature at different times (Aneer 1985, Rajasilta 1992). The Baltic herring is a littoral spawner. Spawning takes place at a depth of 0-8 m, with maximum egg densities at 1-4 m. The eggs are deposited on aquatic vegetation (Scabell & Jönsson 1984; Rajasilta et al. 1993; Kääriä et al. 1997). Table 3. Characteristics of spawning in the Baltic herring in the Greifswalder Bodden and in the Archipelago Sea. Characteristics of spawning Greifswalder Bodden Archipelago Sea Time - average March - May May - July - max. observed February - June April - August Depth (m) 0.5 - 6 0.2 - 8 Temperature (oC) 1 - 15 2 - 20 Substrate aquatic vegetation aquatic vegetation 3.3. Herring fishery Trap net fishery Spawning herring are mainly caught by trap nets (Figure 5), which are placed on the spawning beds or in their vicinity early in spring. Trap net fishery largely follows the natural rhythm and behaviour of spawning: the trap nets are set when the herring is expected to start spawning, and the fisheries are continued as long as there is fish enough to make fishing profitable. Because the shores are different as to the bottom profile, quality, depth etc., the trap nets are usually made to measure for a specific location and are used in the same place over years. Traditionally, herring trap nets are fixed to the bottom with long wooden stakes, but recently also floating trap nets have been brought into use in the Airisto area. The largest trap nets used in Airisto may hold 15-20 tons of herring at a time, but most nets are smaller. In the Greifswalder Bodden, the maximum trap net volume is 18-20 tons.
SEILI Archipelago Research Institute Publications 3
8
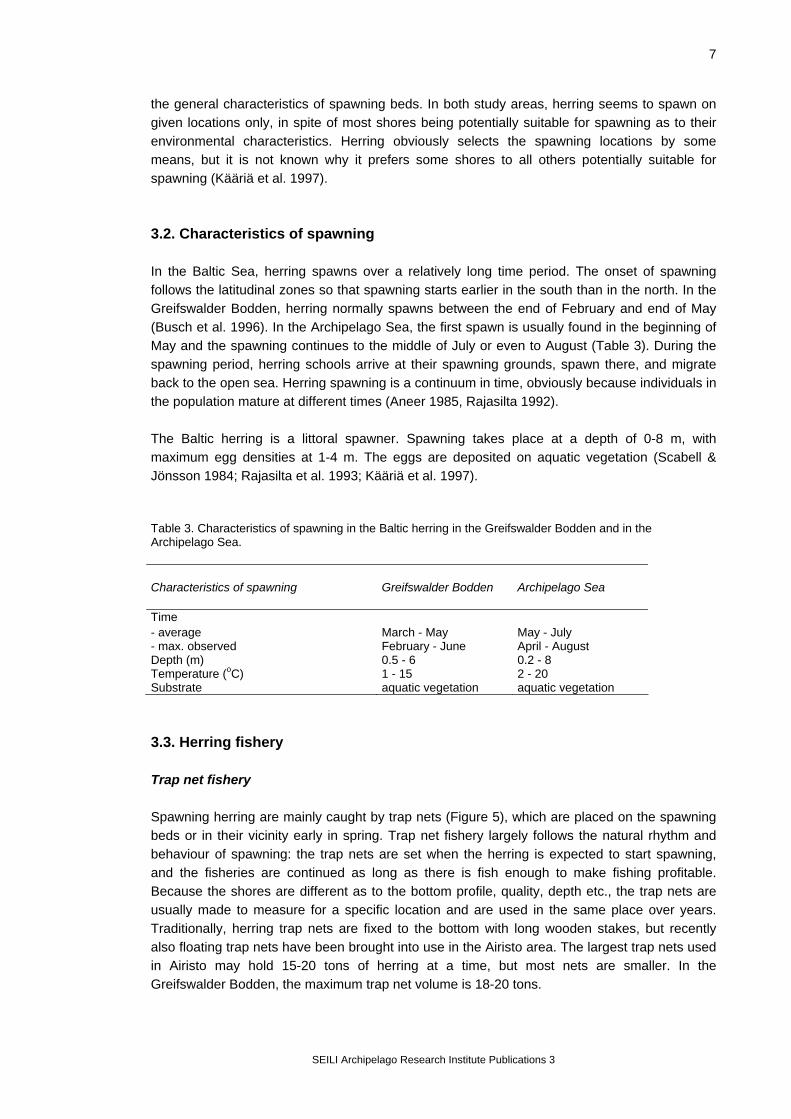
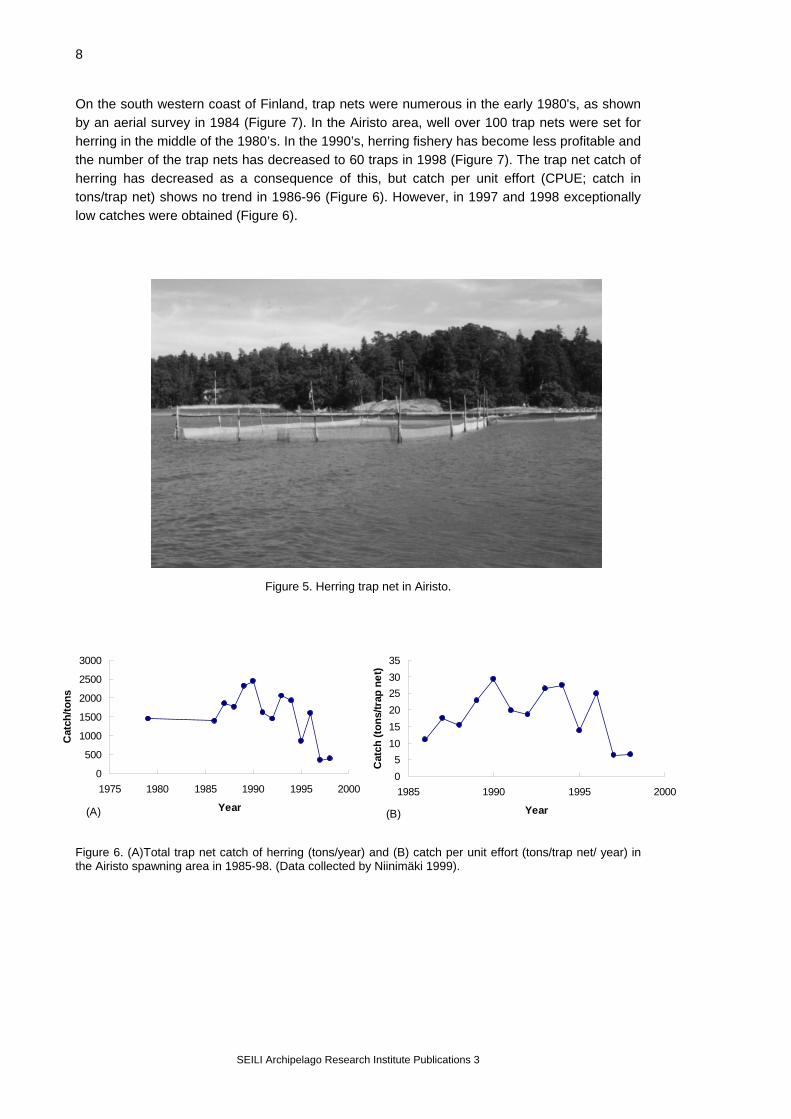
On the south western coast of Finland, trap nets were numerous in the early 1980's, as shown by an aerial survey in 1984 (Figure 7). In the Airisto area, well over 100 trap nets were set for herring in the middle of the 1980’s. In the 1990’s, herring fishery has become less profitable and the number of the trap nets has decreased to 60 traps in 1998 (Figure 7). The trap net catch of herring has decreased as a consequence of this, but catch per unit effort (CPUE; catch in tons/trap net) shows no trend in 1986-96 (Figure 6). However, in 1997 and 1998 exceptionally low catches were obtained (Figure 6).
Figure 5. Herring trap net in Airisto.
0
500
1000
1500
2000
2500
3000
1975 1980 1985 1990 1995 2000
Year
Cat
ch/to
ns
(A)
05
101520253035
1985 1990 1995 2000
Year
Cat
ch (t
ons/
trap
net
)
(B)
Figure 6. (A)Total trap net catch of herring (tons/year) and (B) catch per unit effort (tons/trap net/ year) in the Airisto spawning area in 1985-98. (Data collected by Niinimäki 1999).
SEILI Archipelago Research Institute Publications 3

9
Figure 7. Herring trap nets on the SW coast of Finland in 1984 (based on aerial photograph; Varsinais-Suomen T&E-Keskus, Employment and economic development centre of the Southwest Finland) and the present situation in the Airisto.
SEILI Archipelago Research Institute Publications 3

10
In the Greifswalder Bodden, total annual catch has also varied considerably in 1967-1997 (Figure 8). At present, gill nets are used in the herring fisheries more than trap nets. In 1990, there were 139 herring trap nets in the Greifswalder Bodden, but only 29 in 1998 (Table 4).
Figure 8. Total catch of herring (tons a-1) by gill nets and trap nets in the Greifswalder Bodden in 1967-97.
0
5000
10000
15000
20000
25000
1965 1970 1975 1980 1985 1990 1995 2000Year
Cat
ch (t
ons)
Table 4. Number of herring trap nets in the Greifswalder Bodden in 1929-1999.
Year Trap nets 1929 34 1952 110 1990 139 1998 29 1999 26
Herring trawl catches in the northern Baltic Sea The Finnish fishing fleet operates mainly in the ICES subdivisions 29-32. The total catch of herring in the Finnish professional fisheries varied between 52 000 tons and 98 000 tons in 1986-1997 (Figure 9). Herring landings in Finland were relatively stable in the 1980’s, but at the turn of the decade problems in the herring market led to a catch decrease by almost 50% in the areas, which are mostly fished by the Finnish fishing fleet. Due to increasing demand, herring fishery has recovered and is now continued with approximately the same landings as earlier (statistics of the Finnish Game and Fisheries Research Institute; FGFRI).
Figure 9. Total annual catch of herring in the professional fisheries in Finland (ICES subdivisions 29-32) in 1986-1997. (Statistics of the Finnish Game and Fisheries Research Institute).
0
20
40
60
80
100
1984 1986 1988 1990 1992 1994 1996 1998
Year
x 1000 tons
SEILI Archipelago Research Institute Publications 3

11
IV. Background data, materials and methods 4.1. Population studies 4.1.1. Fish sampling In both study areas, herring samples were collected from commercial trap nets. The sampling method has been similar over the years (1984-98 in Airisto and 1976-98 in the Greifswalder Bodden), but the number of trap nets sampled and number of samples taken annually have varied from year to year, depending on the resources. Altogether 38 trap net sites have been sampled in the Airisto area over the years. During the present study (1997-98), herring samples were obtained from 20 trap nets in 1997 and 18 trap nets in 1998. In 1998, fish were also collected with a small-sized (non-commercial) trap net, which was constructed for the experimental use. This was placed near a commercial trap net (within 100 meters distance) in Airisto, in order to examine the possibility to use other gear than commercial trap nets for fish sampling. There is a minimum mesh size of 16 mm in gear used for herring in the ICES subdivisions 29 (north of 59° 30’ N), 30, 31 and 32. In the trap nets in the Airisto, the mesh size is 12-13 mm (knot-to-knot measure). There are no studies on the selectivity of the herring trap nets, but unlike gill-nets or trawls, commercial trap nets are considered as non-selective gear. They seem to catch herring irrespective of the size, sex and reproductive stage of fishes in the spawning school. Due to small mesh size in the trap netting, even small herrings (12-13 cm in length) are retained inside the trap. In the Airisto, samples have been taken by the project personnel in all study years, when the trap net was small enough to be handled. When the trap nets were large, the fishermen helped in sampling or took the samples, according to orders given, before they emptied the gear. When taking a sample, fish were led into one corner of the trap net by lifting one of its sides until the trap net volume was small enough to concentrate the fish. From the mass of fishes, 4-5 random samples were taken with a dip net (mesh size the same as in the trap nets), which was emptied in a plastic container. The sample consisting of 100-200 fish was then transported to the laboratory and stored at -18°C. In the Greifswalder Bodden, where the herring trap nets are too large to be handled by sampling personnel, fish samples were obtained from the fishermen who collected them while emptying the trap nets. Most samples from the Greifswalder Bodden have been analysed fresh, but some were stored at -18°C and analysed later. Due to the spawning pattern of the herring, the trap nets collect fish more or less continuously after they have been placed in the sea. If sampling is not made within one — two days after fish were caught, the number of ripe and running individuals may be low in the sample and most fish are spent, because the fish spawn in the trap net if left there for a longer period. The optimal date for sampling is when a new shoal has just arrived at the spawning grounds and entered in the trap net. This information is obtained from the fishermen, who check the trap nets daily, usually early in the morning. The trap net is emptied if there is plenty of fish but small amounts are left in the trap net.
SEILI Archipelago Research Institute Publications 3

12
The samples have not always been taken at the optimal date. This is usually due to weather conditions, but also other occasional events may postpone the sampling. In such cases, samples have been taken in the next possible day. When necessary, diving observations were used to date the spawning. By comparing diving records made of the appearance of spawn with the trap net catches, it is possible to deduce whether a sample is representative of a new spawn or not. A summary of the data collected in Airisto (1984-1998) and in the Greifswalder Bodden (1976-1998) is presented in Table 5. 4.1.2. Measurements and determination of population parameters A detailed description of the measurements and determinations of population parameters is presented in Annex 1 (Notes on fish treatment and data input). This document was composed at the beginning of the study to ensure the using of similar methods by the both participants. The basic treatment of fish samples (see Table 5) has been constant in annual samplings in both areas, with some minor modifications. If frozen, fish were allowed to thaw before measuring them or they were analysed fresh. Fish were measured for total length (mm), weight (0.1 g accuracy), and gonad weight (0.01 g accuracy); sex and the developmental stage of gonads were determined according to Kesteven (1960; stages 1-8), and otoliths (sagittae) were removed for age determinations. Otoliths were stored either dry or as fixed onto special otolith plates with Euparal (ASCO Laboratories, 52 Levenshulme Rd, Gorton, Manchester M18 7NN) or clear varnish (any commercial grade of boat or furniture varnish). Condition factor [(100*Wt.)/Le.3] and gonadosomatic index (gonad Wt. / total Wt.) were calculated using fish total or somatic weight. From the standard samples, material was also collected for fat (both ovarian and muscle fat) and fecundity determinations. Only spawning females were selected for fat analyses, and only ripe fish for fecundity sampling. 4.1.3. Age reading Age determinations were made under the microscope at 16 - 40x magnification in reflected light on a black background. Otoliths were viewed from the concave (outer) side. In reflected light, the growth zones of the otolith appear as alternating broad opaque zones (bright) and narrow translucent zones (dark). An opaque zone and the following translucent zone were together regarded as a year’s growth, and the age was determined as the number of translucent zones. Ages were read by two experienced otolith readers, Christine Kleimeier (German samples) and Jan Eklund (Finnish samples). Upon reading, the age and edge status of the otolith (growing/resting) were marked on a pre-printed protocol together with the fish number and sampling date. Each sample was read a second time at least one day later (usually within 1-7 days) and possible corrections made in the protocol. From the age protocol, the age data were written onto a data file by the reader. 4.1.4. Fecundity See Annex 3.
SEILI Archipelago Research Institute Publications 3
13
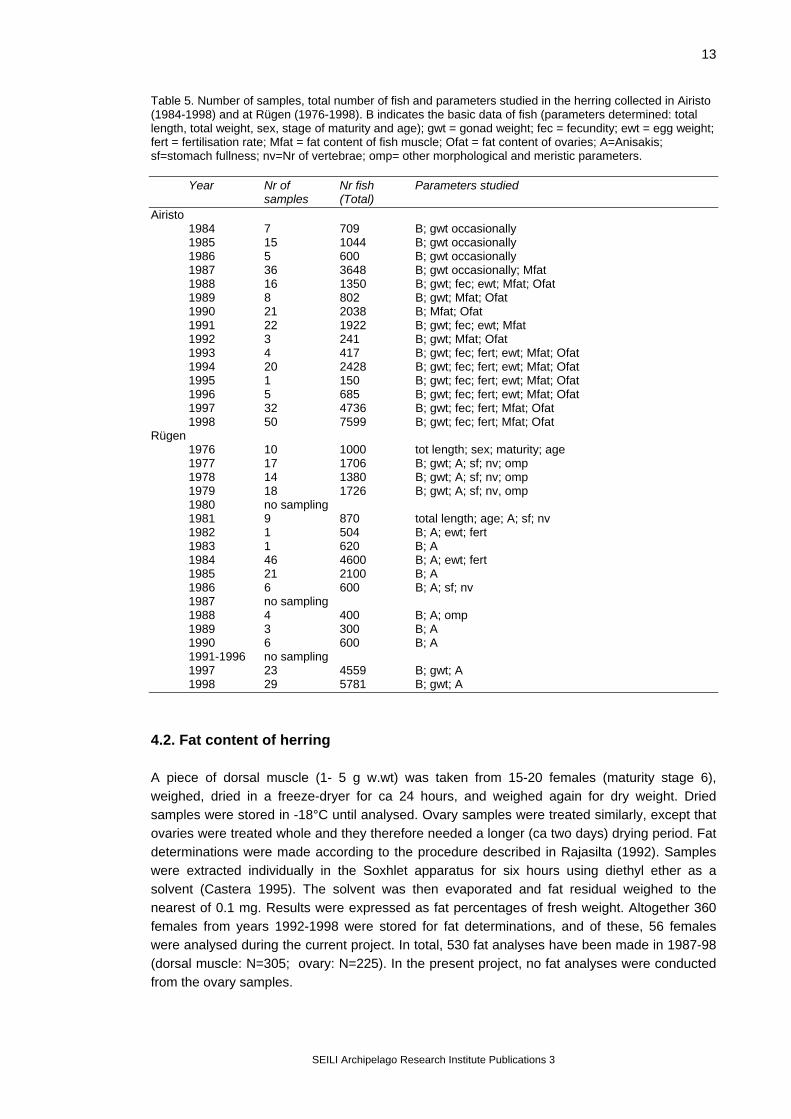
Table 5. Number of samples, total number of fish and parameters studied in the herring collected in Airisto (1984-1998) and at Rügen (1976-1998). B indicates the basic data of fish (parameters determined: total length, total weight, sex, stage of maturity and age); gwt = gonad weight; fec = fecundity; ewt = egg weight; fert = fertilisation rate; Mfat = fat content of fish muscle; Ofat = fat content of ovaries; A=Anisakis; sf=stomach fullness; nv=Nr of vertebrae; omp= other morphological and meristic parameters.
Year Nr of Nr fish Parameters studied samples (Total) Airisto 1984 7 709 B; gwt occasionally 1985 15 1044 B; gwt occasionally 1986 5 600 B; gwt occasionally 1987 36 3648 B; gwt occasionally; Mfat 1988 16 1350 B; gwt; fec; ewt; Mfat; Ofat 1989 8 802 B; gwt; Mfat; Ofat 1990 21 2038 B; Mfat; Ofat 1991 22 1922 B; gwt; fec; ewt; Mfat 1992 3 241 B; gwt; Mfat; Ofat 1993 4 417 B; gwt; fec; fert; ewt; Mfat; Ofat 1994 20 2428 B; gwt; fec; fert; ewt; Mfat; Ofat 1995 1 150 B; gwt; fec; fert; ewt; Mfat; Ofat 1996 5 685 B; gwt; fec; fert; ewt; Mfat; Ofat 1997 32 4736 B; gwt; fec; fert; Mfat; Ofat 1998 50 7599 B; gwt; fec; fert; Mfat; Ofat Rügen 1976 10 1000 tot length; sex; maturity; age 1977 17 1706 B; gwt; A; sf; nv; omp 1978 14 1380 B; gwt; A; sf; nv; omp 1979 18 1726 B; gwt; A; sf; nv, omp 1980 no sampling 1981 9 870 total length; age; A; sf; nv 1982 1 504 B; A; ewt; fert 1983 1 620 B; A 1984 46 4600 B; A; ewt; fert 1985 21 2100 B; A 1986 6 600 B; A; sf; nv 1987 no sampling 1988 4 400 B; A; omp 1989 3 300 B; A 1990 6 600 B; A 1991-1996 no sampling 1997 23 4559 B; gwt; A 1998 29 5781 B; gwt; A 4.2. Fat content of herring A piece of dorsal muscle (1- 5 g w.wt) was taken from 15-20 females (maturity stage 6), weighed, dried in a freeze-dryer for ca 24 hours, and weighed again for dry weight. Dried samples were stored in -18°C until analysed. Ovary samples were treated similarly, except that ovaries were treated whole and they therefore needed a longer (ca two days) drying period. Fat determinations were made according to the procedure described in Rajasilta (1992). Samples were extracted individually in the Soxhlet apparatus for six hours using diethyl ether as a solvent (Castera 1995). The solvent was then evaporated and fat residual weighed to the nearest of 0.1 mg. Results were expressed as fat percentages of fresh weight. Altogether 360 females from years 1992-1998 were stored for fat determinations, and of these, 56 females were analysed during the current project. In total, 530 fat analyses have been made in 1987-98 (dorsal muscle: N=305; ovary: N=225). In the present project, no fat analyses were conducted from the ovary samples.
SEILI Archipelago Research Institute Publications 3
14
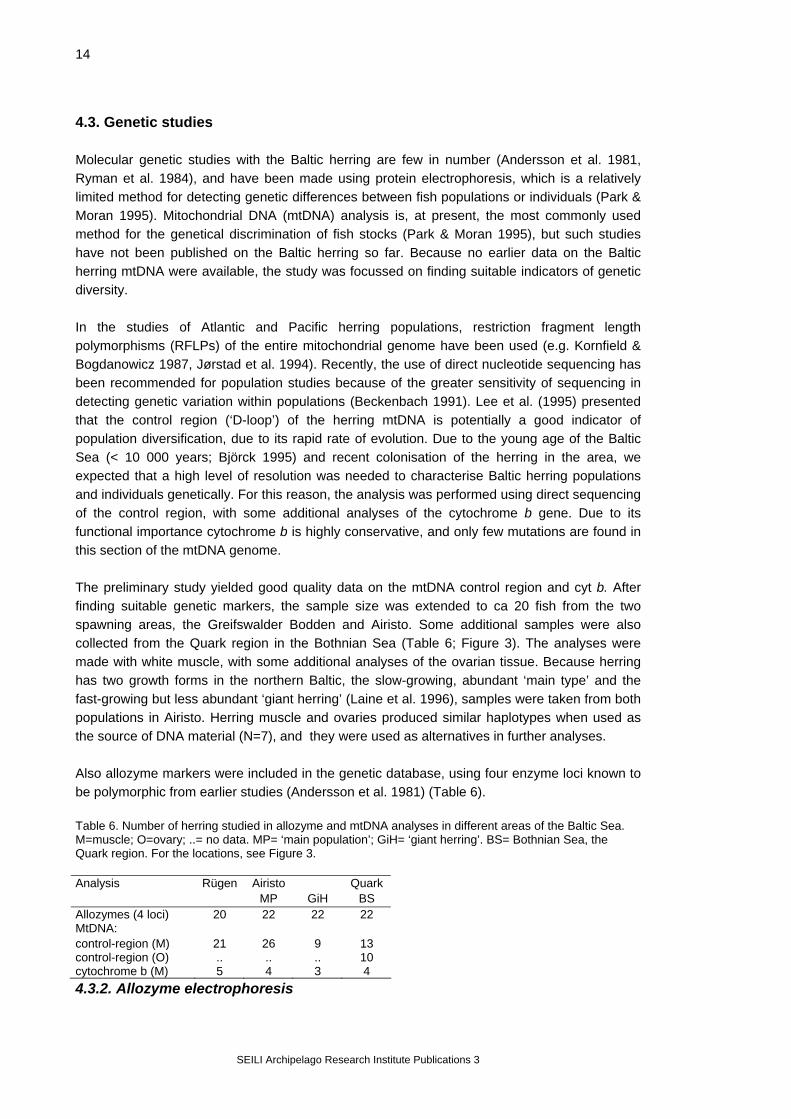
4.3. Genetic studies Molecular genetic studies with the Baltic herring are few in number (Andersson et al. 1981, Ryman et al. 1984), and have been made using protein electrophoresis, which is a relatively limited method for detecting genetic differences between fish populations or individuals (Park & Moran 1995). Mitochondrial DNA (mtDNA) analysis is, at present, the most commonly used method for the genetical discrimination of fish stocks (Park & Moran 1995), but such studies have not been published on the Baltic herring so far. Because no earlier data on the Baltic herring mtDNA were available, the study was focussed on finding suitable indicators of genetic diversity. In the studies of Atlantic and Pacific herring populations, restriction fragment length polymorphisms (RFLPs) of the entire mitochondrial genome have been used (e.g. Kornfield & Bogdanowicz 1987, Jørstad et al. 1994). Recently, the use of direct nucleotide sequencing has been recommended for population studies because of the greater sensitivity of sequencing in detecting genetic variation within populations (Beckenbach 1991). Lee et al. (1995) presented that the control region (‘D-loop’) of the herring mtDNA is potentially a good indicator of population diversification, due to its rapid rate of evolution. Due to the young age of the Baltic Sea (< 10 000 years; Björck 1995) and recent colonisation of the herring in the area, we expected that a high level of resolution was needed to characterise Baltic herring populations and individuals genetically. For this reason, the analysis was performed using direct sequencing of the control region, with some additional analyses of the cytochrome b gene. Due to its functional importance cytochrome b is highly conservative, and only few mutations are found in this section of the mtDNA genome. The preliminary study yielded good quality data on the mtDNA control region and cyt b. After finding suitable genetic markers, the sample size was extended to ca 20 fish from the two spawning areas, the Greifswalder Bodden and Airisto. Some additional samples were also collected from the Quark region in the Bothnian Sea (Table 6; Figure 3). The analyses were made with white muscle, with some additional analyses of the ovarian tissue. Because herring has two growth forms in the northern Baltic, the slow-growing, abundant ‘main type’ and the fast-growing but less abundant ‘giant herring’ (Laine et al. 1996), samples were taken from both populations in Airisto. Herring muscle and ovaries produced similar haplotypes when used as the source of DNA material (N=7), and they were used as alternatives in further analyses. Also allozyme markers were included in the genetic database, using four enzyme loci known to be polymorphic from earlier studies (Andersson et al. 1981) (Table 6). Table 6. Number of herring studied in allozyme and mtDNA analyses in different areas of the Baltic Sea. M=muscle; O=ovary; ..= no data. MP= ‘main population’; GiH= ‘giant herring’. BS= Bothnian Sea, the Quark region. For the locations, see Figure 3. Analysis Rügen Airisto Quark MP GiH BS Allozymes (4 loci) 20 22 22 22 MtDNA: control-region (M) 21 26 9 13 control-region (O) .. .. .. 10 cytochrome b (M) 5 4 3 4 4.3.2. Allozyme electrophoresis
SEILI Archipelago Research Institute Publications 3

15
The enzymes investigated were Lactate Dehydrogenase (LDH; EC 1.1.1.27), Malate Dehydrogenase (MDH; EC 1.1.1.37), Phosphoglucomutase (PGM, EC 5.4.2.2) and Glucosephosphate Isomerase (GPI, EC 5.3.1.9). The electrophoresis was run on Titan III cellulose acetate plates (Helena Laboratories, Texas, USA) as described by Hebert & Beaton (1989). A small sample (about 3 mm in diameter) of herring white muscle was mechanically centrifuged at 12 000 x g for 5 min. Tris-glysine buffer (25 and 192 mM) pH 8.5 was used both as gel and electrode buffer. The gels were run at 200 V at room temperature for 30 min. The enzymes were selectively visualised according to Hebert and Beaton (1989), with minor modifications in some reagent concentrations. Isoenzymes and alleles were named according to the uniform system of nomenclature (Allendorf et al. 1979). In the case of GPI-2 and PGM-1 the value 0 was given for the most common allele, due to very low mobility under the electrophoresis conditions used. 4.3.3. DNA methodology Total DNA was extracted from the dorsal muscle of spawning herring with QIAamp Tissue Kit (QiagenTM Cat. No 29304). Approximately 740 bp (base pair) fragment of mtDNA was amplified with 35 cycle PCR (polymerase chain reaction) with primers Q and B (Lee et al. 1995). Thermal profile for PCR was: 94°C 45 sec, 53°C 45 sec and 72°C 1 min. PCR products were purified with QIAquick (QiagenTM Cat. No 28106) purification columns. Sequencing reactions were performed with primer H 16498 (Meyer et al. 1990) and Applied Biosystems BigDye Terminator Cycle Sequencing Kit (Part No. 4303153). Sequencing analyses were made with Applied Biosystems 377 Automated Sequencer and resulted in 492 bp segment of mtDNA including the left domain of the control region, part of the threonine tRNA gene (tRNAtrh) and the proline tRNA gene (tRNApro). Alignment of mtDNA sequences was done with clustal W21A alignment program with default settings. The analysis of cyt b followed the same procedure, except that in the PCR reactions annealing was performed at 50°C. The primers were H 15149 (Kocher et al. 1989) and L 14724 (Pääbo et al. 1990). 4.4. Herring growth in different salinity conditions In the Airisto herring, a strong decline of growth was observed during 1984-98 (see chapter 6.1.). The fat content data collected during 1987-1997 showed no changes in the energy reserves of the herring, which contradicted the hypothesis presented by several authors (e.g. Anonymous 1994), that the present decrease of growth in the Baltic herring is caused by starvation. The parallel trends of herring growth and Baltic salinity suggested that salinity could have a direct influence on the herring growth (see chapter 6.1. below). The effect of salinity on herring growth was examined experimentally in 1997-98. A direct way to examine fish growth in experimental conditions is to measure the change of length or body mass of fish during the experiment. Direct measurements imply, however, that fish have to be handled before the experiment is started, and this usually leads to increased mortality during the experiment. As herring is known to be highly sensitive to handling (Holliday & Blaxter 1961), direct measurements could not be used in the study of growth.
SEILI Archipelago Research Institute Publications 3

16
The uptake of 14C-glycine by scales has been shown to be an indicator of growth rate in fish (Goolish & Adelman 1983; Adelman 1987; Busacker & Adelman 1987). Although the method is subject to several errors, it has been used in fish studies where the rate of protein synthesis is determined (Negatu & Meier 1993). As the method requires only little a priori handling of fish, we applied this method for the determination of herring growth rates at different salinities. Experimental procedure For the experiment, juvenile herrings were obtained from a fish farm in Airisto, where juvenile whitefish were reared in floating net pens (mesh size 2-4 mm) in the sea. In spring/summer 1997, herring larvae were occasionally entrapped in the net pens, where they grew in a mixed school with whitefish juveniles. Fish were fed daily with dry pellets (standard feed for juvenile rainbow trout) until autumn. The herrings (500-600 individuals) were then transferred to a large tank at the laboratory where they were kept at constant conditions (ambient temperature and salinity, regular feeding) for several weeks before the experiment. After this period, a random sample of ca 200 individuals was drawn and placed in four experimental tanks, 40-50 fish in each tank. At this stage, the fish were approximately 5 months old. Square tanks with rounded edges (area 1 m2; height 0.5 m; water volume 300 litres) were used. The salinites in the tanks were 5.7 psu, 8 psu, 12 psu and 15 psu, of which the lowest corresponds to the ambient salinity in the study area at the time of the experiment. The fish were fed daily with dry pellets, to which they already were accustomed. In the daily rearing routines, part of the water (ca 10 % of the total volume) was changed and temperature and salinity in the tanks were measured. Dead individuals were removed from the tanks and the behaviour of the fish was recorded. The experiment was carried out twice (1st experiment 16.12.1997 - 4.2.1998; 2nd experiment 4.3.1998 - 19.4.1998) but the second experiment failed, due to a sudden increase in fish mortality. At the end of the experiment the fish were anaesthetised and a sample of scales was removed (see below), after which they were killed and measured for total length (in mm) and total weight (in g). The fish were opened ventrally and the amount of visceral fat was evaluated visually on a scale of 0-3 (0= no fat; 1-2 an increasing amount of fat; and 3= rich deposits of fat around the intestine). Measurement of the growth rate Several tens of scales were put into Eppendorf tubes containing physiological teleost saline buffered with HEPES (pH 7.5) and freshly added unlabeled glycine (3.2 mg/ml) and 2 µl 14C-glycine with specific activity of 47.30 mCi/mmol (Amersham). The scales were incubated in the buffer for 2 hrs at 25°C and rinsed thoroughly with the unlabeled buffer. From each tube, the surface area of 10 scales was measured individually, after which the rinsed scales were solubilised in 200 µl volumes of Luma Solve by incubating at first at 55°C for 12 hours and then manually homogenised with a glass homogeniser. After adding 1 ml scintillation medium (OpthiPhase Supermix, Wallac, Finland), radioactivity of the samples was recorded with the Microbeta Plus Liquid Scintillation Counter (Wallac, Finland). Counting time was 2 minutes. The radioactivity (scale growth) was expressed as counts / mm2.
SEILI Archipelago Research Institute Publications 3
17
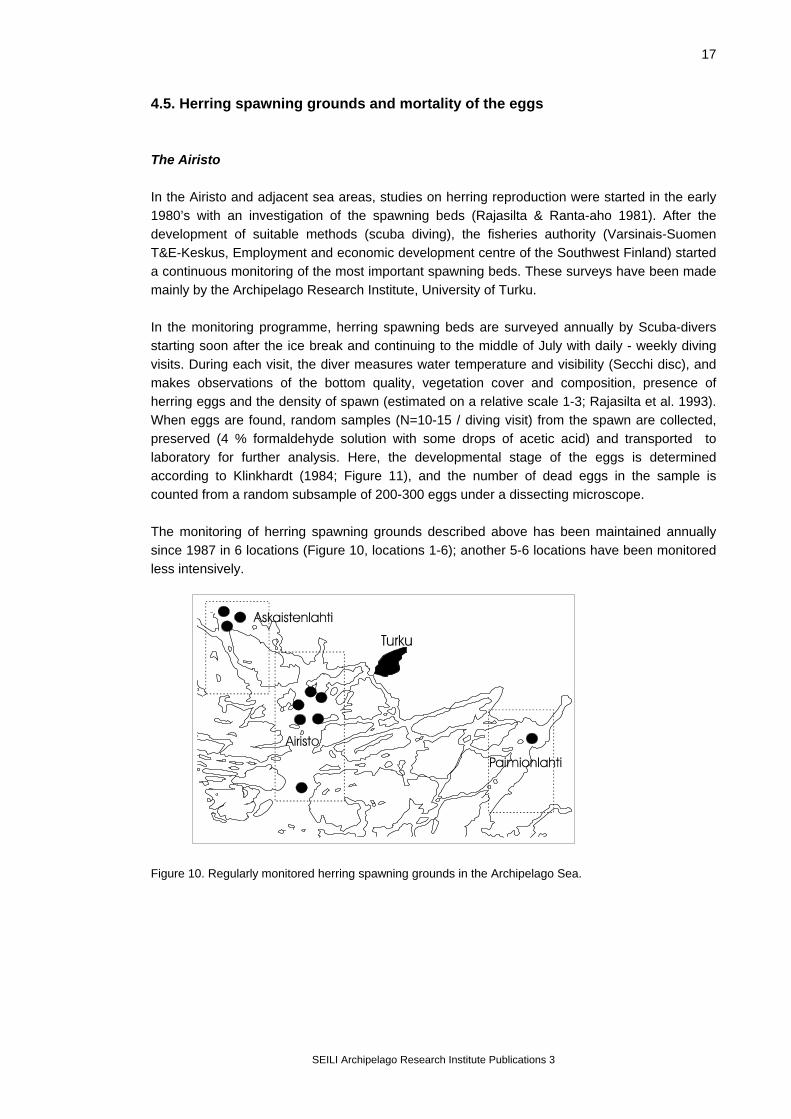
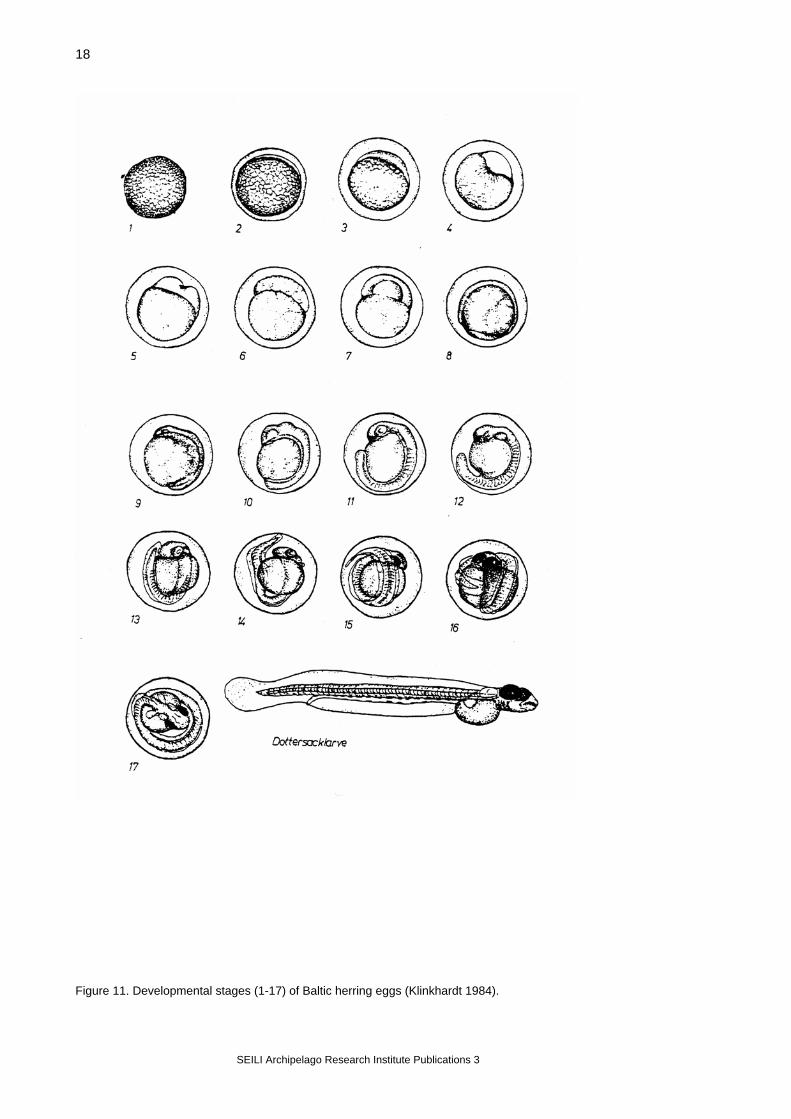
4.5. Herring spawning grounds and mortality of the eggs The Airisto In the Airisto and adjacent sea areas, studies on herring reproduction were started in the early 1980’s with an investigation of the spawning beds (Rajasilta & Ranta-aho 1981). After the development of suitable methods (scuba diving), the fisheries authority (Varsinais-Suomen T&E-Keskus, Employment and economic development centre of the Southwest Finland) started a continuous monitoring of the most important spawning beds. These surveys have been made mainly by the Archipelago Research Institute, University of Turku. In the monitoring programme, herring spawning beds are surveyed annually by Scuba-divers starting soon after the ice break and continuing to the middle of July with daily - weekly diving visits. During each visit, the diver measures water temperature and visibility (Secchi disc), and makes observations of the bottom quality, vegetation cover and composition, presence of herring eggs and the density of spawn (estimated on a relative scale 1-3; Rajasilta et al. 1993). When eggs are found, random samples (N=10-15 / diving visit) from the spawn are collected, preserved (4 % formaldehyde solution with some drops of acetic acid) and transported to laboratory for further analysis. Here, the developmental stage of the eggs is determined according to Klinkhardt (1984; Figure 11), and the number of dead eggs in the sample is counted from a random subsample of 200-300 eggs under a dissecting microscope. The monitoring of herring spawning grounds described above has been maintained annually since 1987 in 6 locations (Figure 10, locations 1-6); another 5-6 locations have been monitored less intensively.
Figure 10. Regularly monitored herring spawning grounds in the Archipelago Sea.
SEILI Archipelago Research Institute Publications 3
18
Figure 11. Developmental stages (1-17) of Baltic herring eggs (Klinkhardt 1984).
SEILI Archipelago Research Institute Publications 3

19
The Greifswalder Bodden In the Greifswalder Bodden, herring spawning grounds have been monitored by the University of Rostock since 1981 (Scabell 1988, Geisel & Messner 1989; Scabell & Jönsson 1989). The methods used have been largely the same as in the investigations in the Airisto area. 4.6. Catch statistics Northern Baltic Sea and Airisto Herring trap net catches in Airisto have been monitored by the state fisheries authorities annually since 1986. The catch statistics are based on the operation logs of local fishermen, who record daily catches through the fishing season. The total catches in the area are reported annually to fisheries authorities along with the number and type of gear used each year. These data were used to estimate the amount of spawning herring in the Airisto area during the study period. Daily catch data for individual trap nets (N = 6-17) were available for the years 1982-1993 in Airisto. The catches represented 10 - 20 % of the total amount of herring caught in the area with trap nets during the spawning season. Total annual catches of professional fisheries in Finland are published by the Finnish Game and Fisheries Research Institute (FGFRI) by ICES subdivisions and months for each calendar year. In the subdivisions 29, 30 and 31, 70-95 % of the total herring catch is taken by the Finnish fishing fleet. 4.7. Statistical analyses of the population data 4.7.1. Outlines of the monitoring programme Principally, the population data should meet the requirements of time-series analyses, and be sufficient to detect both long-term and short-term (seasonal) trends in the populations. Due to the relatively large spawning area and the long duration of the spawning, temporal and spatial variation in population parameters should be taken into account in fish sampling. To obtain representative samples of the spawning populations, sampling should cover both the temporal and spatial variation of the parameters monitored. General linear models were used in analysing the population data in order to determine the effect of sampling site and time on the estimated properties of the spawning shoals. The analysis was first made on the Airisto data, where the shoals are known to be heterogeneous. For the analysis, the area of Airisto was divided into three parts on south-north axis (Figure 12. ) across a gradient of decreasing eutrophication and river runoff influence and increasing exposure to winds and wave action. The composition of herring spawning shoals in these three regions or subareas (variable ‘Region’) was then compared by means of a two-way analysis of covariance.
SEILI Archipelago Research Institute Publications 3

20
Figure 12. Airisto sampling sites (black dots) and analysis regions. Two different models were used: an individual model, where all individual observations were included in the analysis (SAS® System, MIXED-procedure, Littell et al. 1996), and a shoal average model, where sample means were used (GLM-procedure, SAS Institute Inc. 1989). Earlier data were used together with data from this project. In the primary analysis, the years 1987, 1988, 1990, 1991, 1994 and 1997 were included, and the number of samples taken per year varied from 16 to 27 (Figure 13). The treatment of samples has not always included all measurements, and so the number of usable observations per variable varied (Table 7). The database consisted of
128 samples with a total number of observations being 13 685. In both models, the statistical null hypothesis (H0) was that the class variables do not affect the values of the analysis variable. Catching year and region were used as class variables in the models. The objective was to estimate how much of the variation in population samples can be explained by the selected class variables. In all tests, the sampling date (day-of-the-year; DOY) was used as a covariate because temporal variation in a variable can mask the differences among the compared regions. Also, testing the slopes for the covariate can be used to detect potential time-dependent effects. The equation between the covariate and the test variable was calculated allowing for the heterogeneity of slopes (i.e. the relationship was calculated separately for each year). Based on the ANCOVA results, the variance components were calculated for the model effects according to Lindman (1992). If ANCOVA indicated statistically significant variation (p<0.05), the group means for this level were tested with Tukey’s test (Day and Quinn 1989, Lindman 1992). The fish parameters analysed were total length, somatic weight (total weight – gonad weight), gonadosomatic index (gsi = gonad weight/[total weight – gonad weight] ), and fish condition. Instead of total weight, somatic weight was used to eliminate the effect of different developmental stages of gonads on fish weight. Additionally, gonadosomatic index was analysed using ripe fish only. Condition was analysed using somatic weight as an analysis variable and fish length as an additional covariate. After these primary analyses, the data from the year 1998 were added to the data set, and further tests were carried out based on the primary results. The statistical models used in the secondary analyses are explained in the sections describing the results for each variable. Similar methods were used in analysing the Rügen database. Data from two years only were available, and the spatial comparison was made not on wider regions but on separate trap net sites (which is also called variable ‘region’ in the analysis). Rügen data were tested with the individual model only.
SEILI Archipelago Research Institute Publications 3

21
Table 7. Number of Airisto herring samples used for the analyses. Reg. = Region. Year Reg. 1 Reg. 2 Reg. 3 samples n samples n samples n 1987 length 7 660 9 877 11 1108 somatic weight 5 53 5 97 9 311 gsi 0 0 0 0 0 0 condition 5 53 5 97 9 311 1988 length 2 157 6 463 8 719 somatic weight 2 157 6 425 8 716 gsi 2 29 5 315 8 348 condition 2 157 6 425 8 716 1990 length 5 499 5 498 10 937 somatic weight 5 495 5 496 10 932 gsi 5 412 5 394 10 804 condition 5 495 5 496 10 932 1991 length 3 229 10 938 9 731 somatic weight 3 227 10 924 9 714 gsi 3 175 10 618 8 487 condition 3 227 10 924 9 714 1994 length 2 298 8 916 8 1048 somatic weight 2 298 8 916 8 1048 gsi 1 24 7 301 8 440 condition 2 298 8 916 8 1048 1997 length 4 578 14 2063 7 964 somatic weight 4 578 14 2063 7 964 gsi 3 110 13 536 6 346 condition 4 578 14 2062 7 964 1998 length 3 289 33 5046 13 1949 somatic weight 3 285 33 5010 13 1938 gsi 3 285 33 5010 13 1938 condition 3 285 33 5010 13 1938
Figure 13. Number of Airisto samples per year.
SEILI Archipelago Research Institute Publications 3

22
Test details In the shoal average model, the variables length, somatic weight and gonadosomatic index (= gonad wt. / somatic wt) were tested using ‘year’, ‘region’ and ‘sex’ as class variables and running date (DOY) as a covariate. In individual model variables were tested using class variables ‘year’, ‘region’ and ‘sex’ and variable ‘sample’, which was nested within region and year. The nested variable was defined as a random effect. Fish condition was tested otherwise similarly as somatic weight, but fish length was used as an additional covariate. The normality of the ANCOVA’s residuals was tested with Kolmogorov-Smirnoff method. The test is conservative when the number of observations is high. Therefore, the data were also checked visually, and if the distribution seemed close to normal, ANCOVA’s result was accepted even if the Kolmogorov-Smirnoff test statistic indicated non-normality. The heterogeneity of variances in the data was tested with Levene’s test after each analysis. In some cases, the variances were heteroscedastic, which was taken into account in interpreting the results. If the assumptions for normality or homoscedasticity were violated, this is mentioned in the text. In the analyses it was presumed that the effect of the covariate ‘DOY’ on the response variable was linear. When testing fish condition, logarithmic values (natural logarithm, ln) of fish length were used to obtain linearity between the additional covariate ‘length’ and the response variable (somatic weight). With Airisto data, to meet the requirement of normality and homoscedasticity, fish length and somatic weight were analysed using logarithmic values (ln). With Rügen data, logarithmic (ln) transformation was always applied to response variables. Fish age was not used as a class variable in the analyses, because the number of age determinations was too small. The age groups present in Airisto samples usually range from 2 to 12 or even 15. Age, therefore, was used only as a response variable in the secondary analysis.
SEILI Archipelago Research Institute Publications 3
23
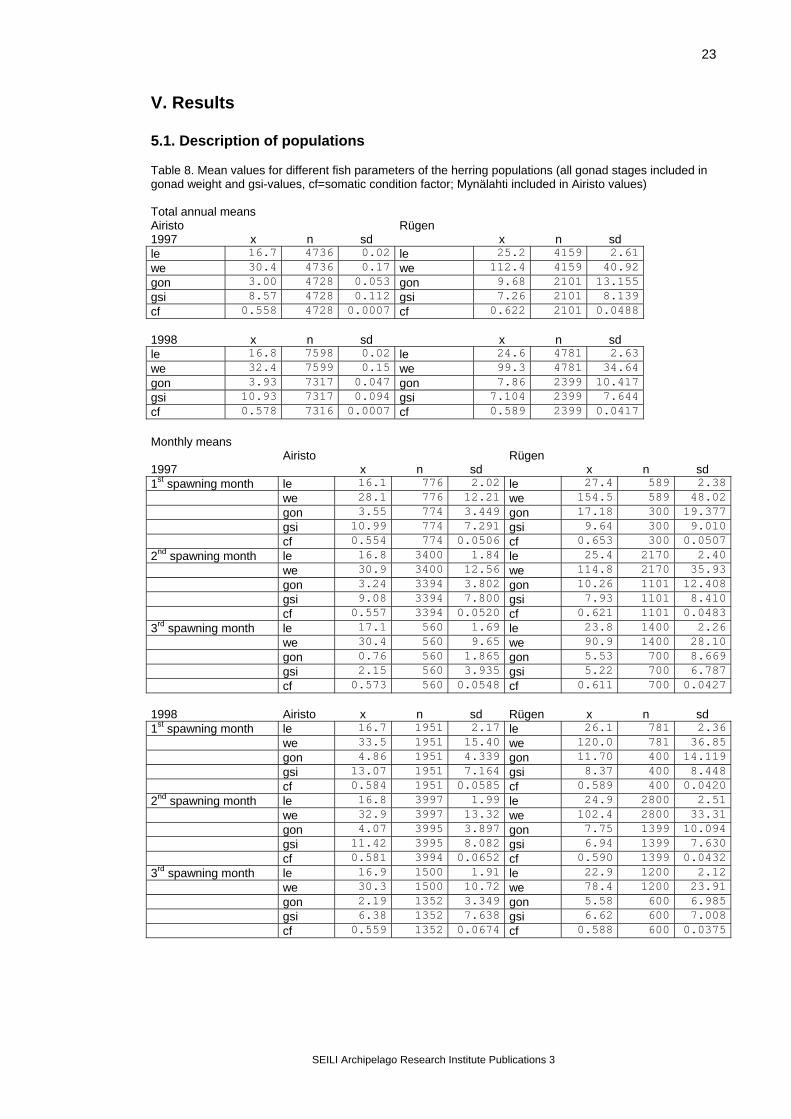
V. Results 5.1. Description of populations Table 8. Mean values for different fish parameters of the herring populations (all gonad stages included in gonad weight and gsi-values, cf=somatic condition factor; Mynälahti included in Airisto values) Total annual means Airisto Rügen 1997 x n sd x n sd le 16.7 4736 0.02 le 25.2 4159 2.61 we 30.4 4736 0.17 we 112.4 4159 40.92 gon 3.00 4728 0.053 gon 9.68 2101 13.155 gsi 8.57 4728 0.112 gsi 7.26 2101 8.139 cf 0.558 4728 0.0007 cf 0.622 2101 0.0488 1998 x n sd x n sd le 16.8 7598 0.02 le 24.6 4781 2.63 we 32.4 7599 0.15 we 99.3 4781 34.64 gon 3.93 7317 0.047 gon 7.86 2399 10.417 gsi 10.93 7317 0.094 gsi 7.104 2399 7.644 cf 0.578 7316 0.0007 cf 0.589 2399 0.0417
Monthly means Airisto Rügen 1997 x n sd x n sd 1st spawning month le 16.1 776 2.02 le 27.4 589 2.38 we 28.1 776 12.21 we 154.5 589 48.02 gon 3.55 774 3.449 gon 17.18 300 19.377 gsi 10.99 774 7.291 gsi 9.64 300 9.010 cf 0.554 774 0.0506 cf 0.653 300 0.05072nd spawning month le 16.8 3400 1.84 le 25.4 2170 2.40 we 30.9 3400 12.56 we 114.8 2170 35.93 gon 3.24 3394 3.802 gon 10.26 1101 12.408 gsi 9.08 3394 7.800 gsi 7.93 1101 8.410 cf 0.557 3394 0.0520 cf 0.621 1101 0.04833rd spawning month le 17.1 560 1.69 le 23.8 1400 2.26 we 30.4 560 9.65 we 90.9 1400 28.10 gon 0.76 560 1.865 gon 5.53 700 8.669 gsi 2.15 560 3.935 gsi 5.22 700 6.787 cf 0.573 560 0.0548 cf 0.611 700 0.0427 1998 Airisto x n sd Rügen x n sd 1st spawning month le 16.7 1951 2.17 le 26.1 781 2.36 we 33.5 1951 15.40 we 120.0 781 36.85 gon 4.86 1951 4.339 gon 11.70 400 14.119 gsi 13.07 1951 7.164 gsi 8.37 400 8.448 cf 0.584 1951 0.0585 cf 0.589 400 0.04202nd spawning month le 16.8 3997 1.99 le 24.9 2800 2.51 we 32.9 3997 13.32 we 102.4 2800 33.31 gon 4.07 3995 3.897 gon 7.75 1399 10.094 gsi 11.42 3995 8.082 gsi 6.94 1399 7.630 cf 0.581 3994 0.0652 cf 0.590 1399 0.04323rd spawning month le 16.9 1500 1.91 le 22.9 1200 2.12 we 30.3 1500 10.72 we 78.4 1200 23.91 gon 2.19 1352 3.349 gon 5.58 600 6.985 gsi 6.38 1352 7.638 gsi 6.62 600 7.008 cf 0.559 1352 0.0674 cf 0.588 600 0.0375
SEILI Archipelago Research Institute Publications 3
24
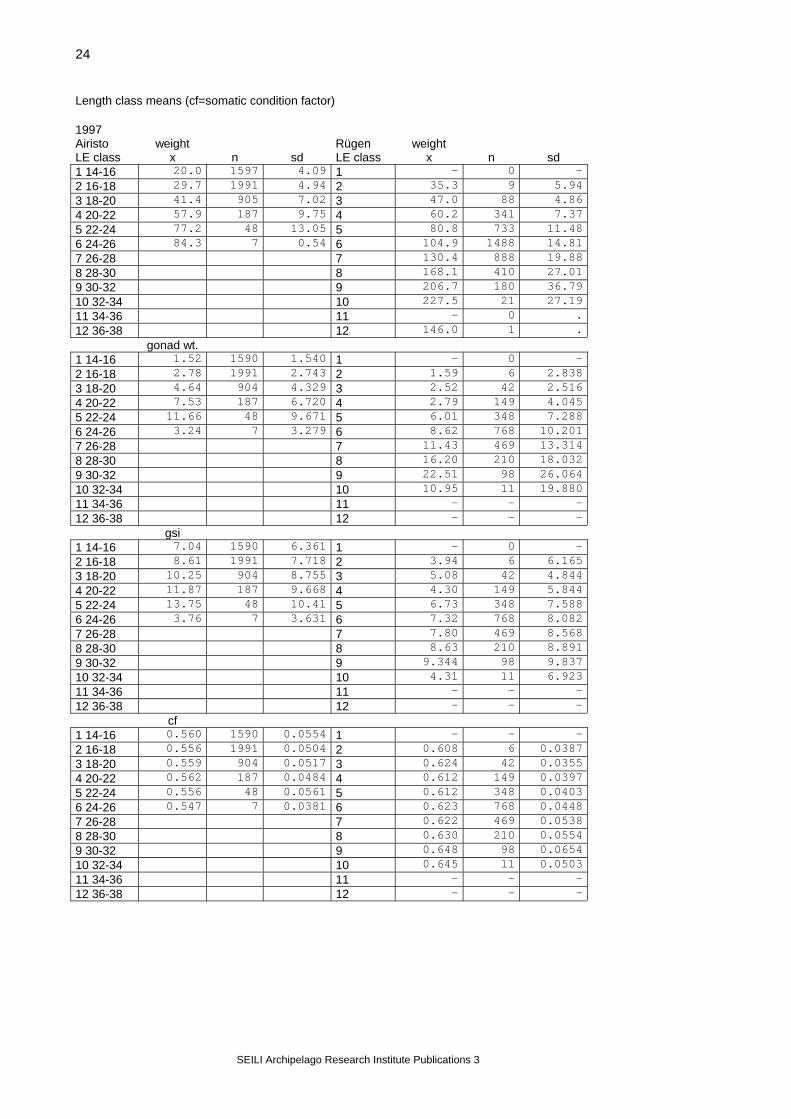
Length class means (cf=somatic condition factor) 1997 Airisto weight Rügen weight LE class x n sd LE class x n sd 1 14-16 20.0 1597 4.09 1 - 0 - 2 16-18 29.7 1991 4.94 2 35.3 9 5.94 3 18-20 41.4 905 7.02 3 47.0 88 4.86 4 20-22 57.9 187 9.75 4 60.2 341 7.37 5 22-24 77.2 48 13.05 5 80.8 733 11.48 6 24-26 84.3 7 0.54 6 104.9 1488 14.81 7 26-28 7 130.4 888 19.88 8 28-30 8 168.1 410 27.01 9 30-32 9 206.7 180 36.79 10 32-34 10 227.5 21 27.19 11 34-36 11 - 0 . 12 36-38 12 146.0 1 . gonad wt. 1 14-16 1.52 1590 1.540 1 - 0 - 2 16-18 2.78 1991 2.743 2 1.59 6 2.838 3 18-20 4.64 904 4.329 3 2.52 42 2.516 4 20-22 7.53 187 6.720 4 2.79 149 4.045 5 22-24 11.66 48 9.671 5 6.01 348 7.288 6 24-26 3.24 7 3.279 6 8.62 768 10.201 7 26-28 7 11.43 469 13.314 8 28-30 8 16.20 210 18.032 9 30-32 9 22.51 98 26.064 10 32-34 10 10.95 11 19.880 11 34-36 11 - - - 12 36-38 12 - - - gsi 1 14-16 7.04 1590 6.361 1 - 0 - 2 16-18 8.61 1991 7.718 2 3.94 6 6.165 3 18-20 10.25 904 8.755 3 5.08 42 4.844 4 20-22 11.87 187 9.668 4 4.30 149 5.844 5 22-24 13.75 48 10.41 5 6.73 348 7.588 6 24-26 3.76 7 3.631 6 7.32 768 8.082 7 26-28 7 7.80 469 8.568 8 28-30 8 8.63 210 8.891 9 30-32 9 9.344 98 9.837 10 32-34 10 4.31 11 6.923 11 34-36 11 - - - 12 36-38 12 - - - cf 1 14-16 0.560 1590 0.0554 1 - - - 2 16-18 0.556 1991 0.0504 2 0.608 6 0.0387 3 18-20 0.559 904 0.0517 3 0.624 42 0.0355 4 20-22 0.562 187 0.0484 4 0.612 149 0.0397 5 22-24 0.556 48 0.0561 5 0.612 348 0.0403 6 24-26 0.547 7 0.0381 6 0.623 768 0.0448 7 26-28 7 0.622 469 0.0538 8 28-30 8 0.630 210 0.0554 9 30-32 9 0.648 98 0.0654 10 32-34 10 0.645 11 0.0503 11 34-36 11 - - - 12 36-38 12 - - -
SEILI Archipelago Research Institute Publications 3

25
1998 Airisto weight Rügen LE class x n sd LE class x n sd 1 14-16 21.9 2649 3.88 1 - - -2 16-18 30.9 2905 4.70 2 35.6 3 1.413 18-20 42.3 1535 7.14 3 46.5 105 4.874 20-22 58.6 368 9.96 4 59.9 673 6.825 22-24 78.6 111 15.66 5 76.4 1196 10.326 24-26 105.4 30 14.14 6 98.4 1236 13.257 26- 7 126.3 1039 16.438 28-30 8 153.0 421 19.369 30-32 9 187.4 95 24.0810 32-34 10 216.0 13 12.8311 34-36 11 - - -12 36-38 12 - - - gonad wt. 1 14-16 2.19 2490 1.825 1 - - -2 16-18 3.48 2819 2.763 2 5.15 1 .3 18-20 5.57 1535 4.179 3 2.81 52 2.7704 20-22 8.43 368 6.083 4 4.65 329 4.5055 22-24 13.31 111 9.084 5 5.90 561 6.4366 24-26 19.44 30 9.873 6 7.00 611 8.7107 26-28 7 9.99 552 11.7878 28-30 8 12.98 236 16.0979 30-32 9 19.35 51 21.64810 32-34 10 4.92 6 0.73311 34-36 11 - - -12 36-38 12 - - - gsi 1 14-16 9.70 2490 7.650 1 - - -2 16-18 10.67 2819 7.843 2 14.14 1 .3 18-20 12.33 1501 8.411 3 5.79 52 5.5054 20-22 13.41 368 8.739 4 7.27 329 6.5775 22-24 15.80 111 9.871 5 7.29 561 7.5146 24-26 17.73 30 7.908 6 6.52 611 7.5647 26-28 7 7.21 552 7.9428 28-30 8 7.58 236 8.6859 30-32 9 9.19 51 9.57310 32-34 10 2.25 6 0.28411 34-36 11 - - -12 36-38 12 - - - cf 1 14-16 0.602 2489 0.0654 1 - - -2 16-18 0.568 2819 0.0587 2 0.614 1 .3 18-20 0.560 1501 0.0610 3 0.602 52 0.03674 20-22 0.564 364 0.0625 4 0.587 329 0.03185 22-24 0.558 111 0.0796 5 0.578 561 0.04106 24-26 0.581 30 0.0495 6 0.591 611 0.04747 26-28 7 0.597 552 0.04218 28-30 8 0.593 236 0.03429 30-32 9 0.596 51 0.038310 32-34 10 0.612 6 0.026911 34-36 11 - - -12 36-38 12 - - -
SEILI Archipelago Research Institute Publications 3
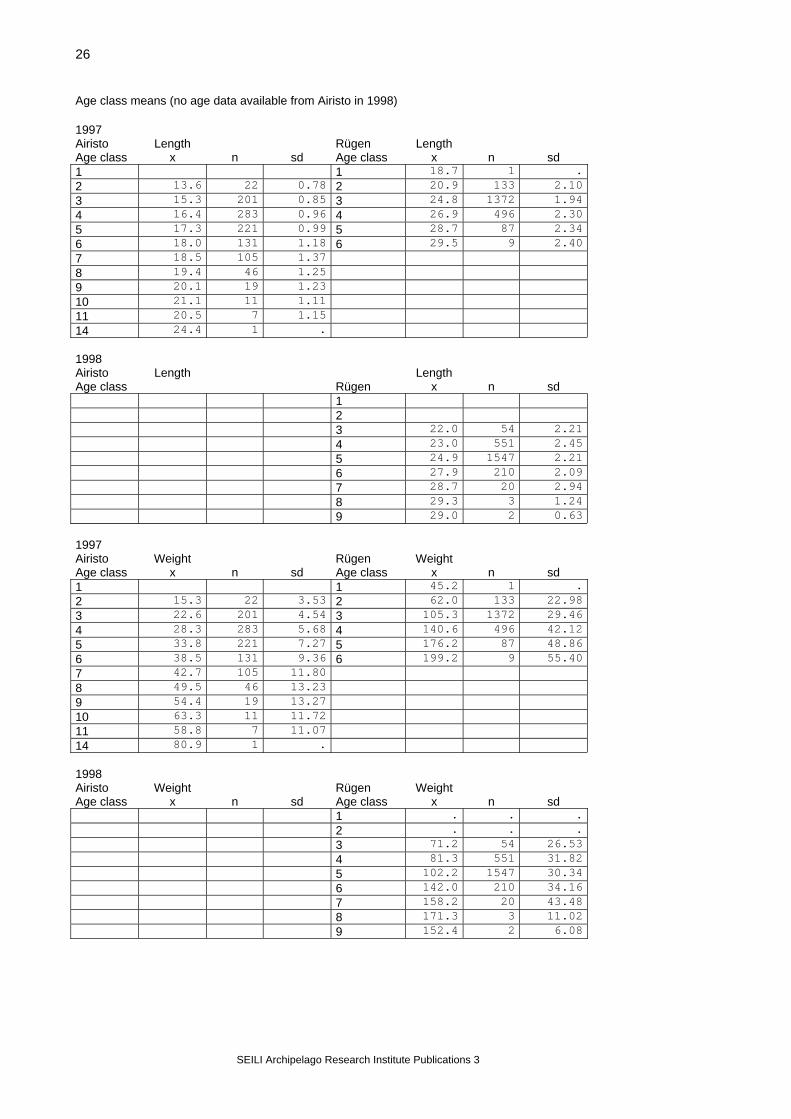
26
Age class means (no age data available from Airisto in 1998) 1997 Airisto Length Rügen Length Age class x n sd Age class x n sd 1 1 18.7 1 . 2 13.6 22 0.78 2 20.9 133 2.10 3 15.3 201 0.85 3 24.8 1372 1.94 4 16.4 283 0.96 4 26.9 496 2.30 5 17.3 221 0.99 5 28.7 87 2.34 6 18.0 131 1.18 6 29.5 9 2.40 7 18.5 105 1.37 8 19.4 46 1.25 9 20.1 19 1.23 10 21.1 11 1.11 11 20.5 7 1.15 14 24.4 1 . 1998 Airisto Length Length Age class Rügen x n sd 1 2 3 22.0 54 2.21 4 23.0 551 2.45 5 24.9 1547 2.21 6 27.9 210 2.09 7 28.7 20 2.94 8 29.3 3 1.24 9 29.0 2 0.63 1997 Airisto Weight Rügen Weight Age class x n sd Age class x n sd 1 1 45.2 1 . 2 15.3 22 3.53 2 62.0 133 22.98 3 22.6 201 4.54 3 105.3 1372 29.46 4 28.3 283 5.68 4 140.6 496 42.12 5 33.8 221 7.27 5 176.2 87 48.86 6 38.5 131 9.36 6 199.2 9 55.40 7 42.7 105 11.80 8 49.5 46 13.23 9 54.4 19 13.27 10 63.3 11 11.72 11 58.8 7 11.07 14 80.9 1 . 1998 Airisto Weight Rügen Weight Age class x n sd Age class x n sd 1 . . . 2 . . . 3 71.2 54 26.53 4 81.3 551 31.82 5 102.2 1547 30.34 6 142.0 210 34.16 7 158.2 20 43.48 8 171.3 3 11.02 9 152.4 2 6.08
SEILI Archipelago Research Institute Publications 3
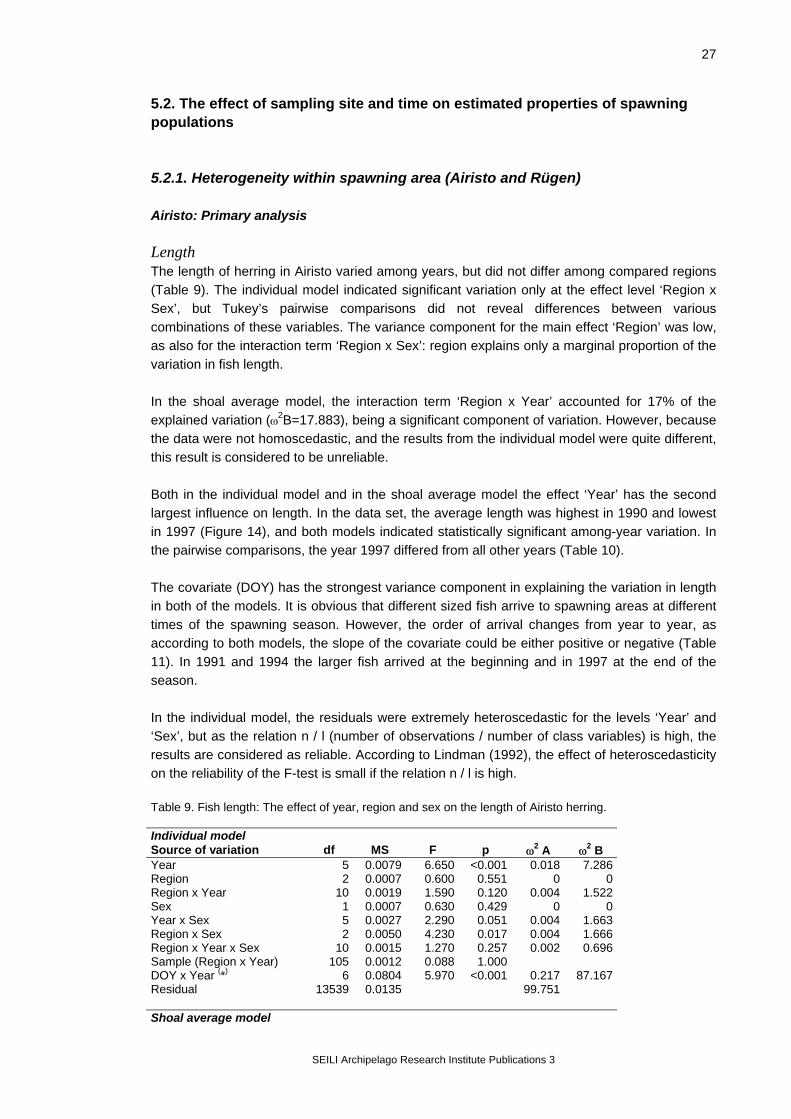
27
5.2. The effect of sampling site and time on estimated properties of spawning populations 5.2.1. Heterogeneity within spawning area (Airisto and Rügen) Airisto: Primary analysis Length The length of herring in Airisto varied among years, but did not differ among compared regions (Table 9). The individual model indicated significant variation only at the effect level ‘Region x Sex’, but Tukey’s pairwise comparisons did not reveal differences between various combinations of these variables. The variance component for the main effect ‘Region’ was low, as also for the interaction term ‘Region x Sex’: region explains only a marginal proportion of the variation in fish length. In the shoal average model, the interaction term ‘Region x Year’ accounted for 17% of the explained variation (ω2B=17.883), being a significant component of variation. However, because the data were not homoscedastic, and the results from the individual model were quite different, this result is considered to be unreliable. Both in the individual model and in the shoal average model the effect ‘Year’ has the second largest influence on length. In the data set, the average length was highest in 1990 and lowest in 1997 (Figure 14), and both models indicated statistically significant among-year variation. In the pairwise comparisons, the year 1997 differed from all other years (Table 10). The covariate (DOY) has the strongest variance component in explaining the variation in length in both of the models. It is obvious that different sized fish arrive to spawning areas at different times of the spawning season. However, the order of arrival changes from year to year, as according to both models, the slope of the covariate could be either positive or negative (Table 11). In 1991 and 1994 the larger fish arrived at the beginning and in 1997 at the end of the season. In the individual model, the residuals were extremely heteroscedastic for the levels ‘Year’ and ‘Sex’, but as the relation n / l (number of observations / number of class variables) is high, the results are considered as reliable. According to Lindman (1992), the effect of heteroscedasticity on the reliability of the F-test is small if the relation n / l is high. Table 9. Fish length: The effect of year, region and sex on the length of Airisto herring. Individual model Source of variation df MS F p ω2 A ω2 B Year 5 0.0079 6.650 <0.001 0.018 7.286 Region 2 0.0007 0.600 0.551 0 0 Region x Year 10 0.0019 1.590 0.120 0.004 1.522 Sex 1 0.0007 0.630 0.429 0 0 Year x Sex 5 0.0027 2.290 0.051 0.004 1.663 Region x Sex 2 0.0050 4.230 0.017 0.004 1.666 Region x Year x Sex 10 0.0015 1.270 0.257 0.002 0.696 Sample (Region x Year) 105 0.0012 0.088 1.000 DOY x Year (*) 6 0.0804 5.970 <0.001 0.217 87.167 Residual 13539 0.0135 99.751 Shoal average model
SEILI Archipelago Research Institute Publications 3
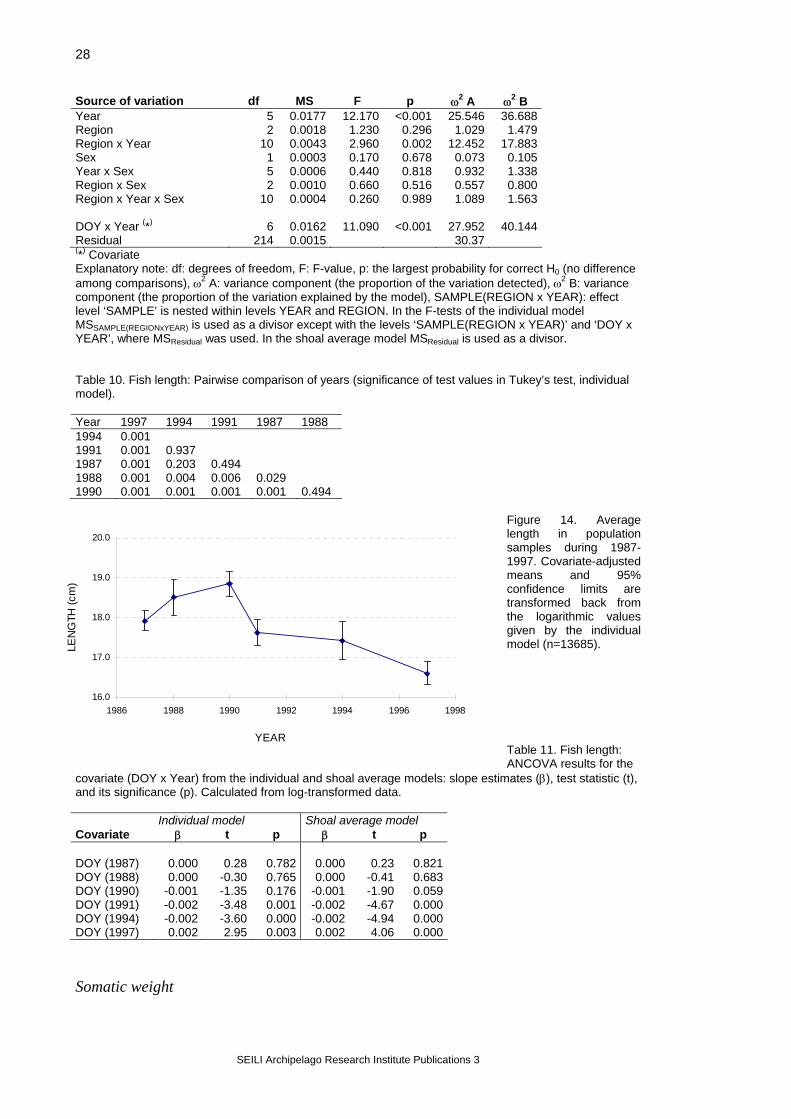
28
Source of variation df MS F p ω2 A ω2 B Year 5 0.0177 12.170 <0.001 25.546 36.688Region 2 0.0018 1.230 0.296 1.029 1.479Region x Year 10 0.0043 2.960 0.002 12.452 17.883Sex 1 0.0003 0.170 0.678 0.073 0.105Year x Sex 5 0.0006 0.440 0.818 0.932 1.338Region x Sex 2 0.0010 0.660 0.516 0.557 0.800Region x Year x Sex 10 0.0004 0.260 0.989 1.089 1.563 DOY x Year (*) 6 0.0162 11.090 <0.001 27.952 40.144Residual 214 0.0015 30.37(*) Covariate Explanatory note: df: degrees of freedom, F: F-value, p: the largest probability for correct H0 (no difference among comparisons), ω2 A: variance component (the proportion of the variation detected), ω2 B: variance component (the proportion of the variation explained by the model), SAMPLE(REGION x YEAR): effect level ‘SAMPLE’ is nested within levels YEAR and REGION. In the F-tests of the individual model MSSAMPLE(REGIONxYEAR) is used as a divisor except with the levels ‘SAMPLE(REGION x YEAR)’ and ‘DOY x YEAR’, where MSResidual was used. In the shoal average model MSResidual is used as a divisor. Table 10. Fish length: Pairwise comparison of years (significance of test values in Tukey’s test, individual model). Year 1997 1994 1991 1987 1988 1994 0.001 1991 0.001 0.937 1987 0.001 0.203 0.494 1988 0.001 0.004 0.006 0.029 1990 0.001 0.001 0.001 0.001 0.494
Figure 14. Average length in population samples during 1987-1997. Covariate-adjusted means and 95% confidence limits are transformed back from the logarithmic values given by the individual model (n=13685). Table 11. Fish length: ANCOVA results for the
covariate (DOY x Year) from the individual and shoal average models: slope estimates (β), test statistic (t), and its significance (p). Calculated from log-transformed data.
16.0
17.0
18.0
19.0
20.0
1986 1988 1990 1992 1994 1996 1998
LEN
GTH
(cm
)
YEAR
Individual model Shoal average model Covariate β t p β t p DOY (1987) 0.000 0.28 0.782 0.000 0.23 0.821DOY (1988) 0.000 -0.30 0.765 0.000 -0.41 0.683DOY (1990) -0.001 -1.35 0.176 -0.001 -1.90 0.059DOY (1991) -0.002 -3.48 0.001 -0.002 -4.67 0.000DOY (1994) -0.002 -3.60 0.000 -0.002 -4.94 0.000DOY (1997) 0.002 2.95 0.003 0.002 4.06 0.000 Somatic weight
SEILI Archipelago Research Institute Publications 3
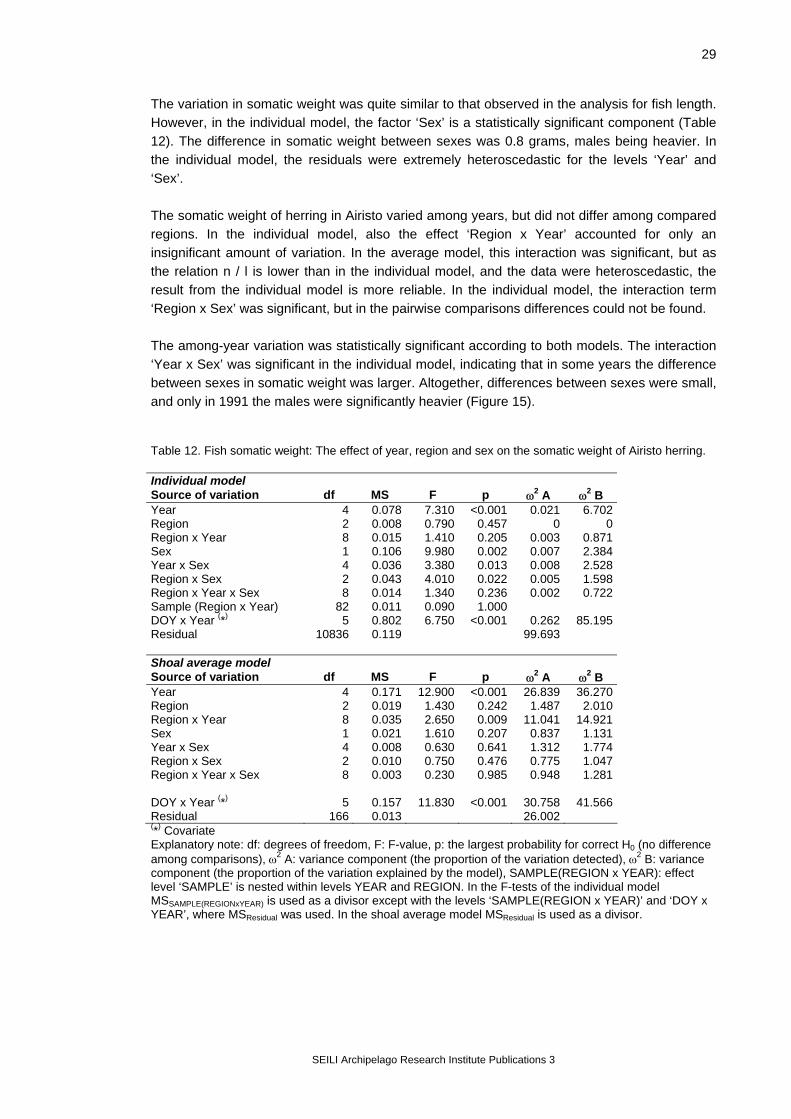
29
The variation in somatic weight was quite similar to that observed in the analysis for fish length. However, in the individual model, the factor ‘Sex’ is a statistically significant component (Table 12). The difference in somatic weight between sexes was 0.8 grams, males being heavier. In the individual model, the residuals were extremely heteroscedastic for the levels ‘Year’ and ‘Sex’. The somatic weight of herring in Airisto varied among years, but did not differ among compared regions. In the individual model, also the effect ‘Region x Year’ accounted for only an insignificant amount of variation. In the average model, this interaction was significant, but as the relation n / l is lower than in the individual model, and the data were heteroscedastic, the result from the individual model is more reliable. In the individual model, the interaction term ‘Region x Sex’ was significant, but in the pairwise comparisons differences could not be found. The among-year variation was statistically significant according to both models. The interaction ‘Year x Sex’ was significant in the individual model, indicating that in some years the difference between sexes in somatic weight was larger. Altogether, differences between sexes were small, and only in 1991 the males were significantly heavier (Figure 15). Table 12. Fish somatic weight: The effect of year, region and sex on the somatic weight of Airisto herring. Individual model Source of variation df MS F p ω2 A ω2 B Year 4 0.078 7.310 <0.001 0.021 6.702 Region 2 0.008 0.790 0.457 0 0 Region x Year 8 0.015 1.410 0.205 0.003 0.871 Sex 1 0.106 9.980 0.002 0.007 2.384 Year x Sex 4 0.036 3.380 0.013 0.008 2.528 Region x Sex 2 0.043 4.010 0.022 0.005 1.598 Region x Year x Sex 8 0.014 1.340 0.236 0.002 0.722 Sample (Region x Year) 82 0.011 0.090 1.000 DOY x Year (*) 5 0.802 6.750 <0.001 0.262 85.195 Residual 10836 0.119 99.693 Shoal average model Source of variation df MS F p ω2 A ω2 B Year 4 0.171 12.900 <0.001 26.839 36.270 Region 2 0.019 1.430 0.242 1.487 2.010 Region x Year 8 0.035 2.650 0.009 11.041 14.921 Sex 1 0.021 1.610 0.207 0.837 1.131 Year x Sex 4 0.008 0.630 0.641 1.312 1.774 Region x Sex 2 0.010 0.750 0.476 0.775 1.047 Region x Year x Sex 8 0.003 0.230 0.985 0.948 1.281 DOY x Year (*) 5 0.157 11.830 <0.001 30.758 41.566 Residual 166 0.013 26.002 (*) Covariate Explanatory note: df: degrees of freedom, F: F-value, p: the largest probability for correct H0 (no difference among comparisons), ω2 A: variance component (the proportion of the variation detected), ω2 B: variance component (the proportion of the variation explained by the model), SAMPLE(REGION x YEAR): effect level ‘SAMPLE’ is nested within levels YEAR and REGION. In the F-tests of the individual model MSSAMPLE(REGIONxYEAR) is used as a divisor except with the levels ‘SAMPLE(REGION x YEAR)’ and ‘DOY x YEAR’, where MSResidual was used. In the shoal average model MSResidual is used as a divisor.
SEILI Archipelago Research Institute Publications 3

30
Figure 15. Average somatic weight of females and males in population samples during 1987-1997. Covariate-adjusted means and 95% confidence limits are transformed back from the logarithmic averages obtained from the individual model.
20.00
25.00
30.00
35.00
40.00
45.00
1987 1988 1989 1990 1991 1992 1993 1994 1995 1996 1997 1998
Males
Females
YEAR
3
SO
MA
TIC
WE
IGH
T (g
)
In both models, the covariate included the most of the variation explained by the model. The among-year variation in the slopes was similar to that in the length analysis: in 1991 and 1994 fish size decreased during the spawning season, whereas in 1997 the trend was inverse. In other years the slope did not significantly deviate from zero (Table 13). Table 13. Fish somatic weight: ANCOVA results for the covariate (DOY x Year) from the individual and shoal average models: slope estimates (β), test statistic (t), and its significance (p). Calculated from log-transformed data. Individual model Shoal average model Covariate β t p β t p DOY (1988) -0.001 -0.5 0.614 -0.001 -0.8 0.437DOY (1990) -0.001 -1.2 0.232 -0.002 -1.7 0.100DOY (1991) -0.005 -2.7 0.007 -0.005 -3.9 0.000DOY (1994) -0.007 -3.9 0.000 -0.009 -5.0 0.000DOY (1997) 0.006 3.1 0.002 0.007 3.80 0.000 Gonadosomatic index (GSI) On the average, GSI was 14.1% in males and 22.5% in females. Most of the variation in GSI was explained by sex. In the individual model, 77% of the explained variation was caused by difference between sexes; in the average model the proportion vas 70%. There were no independent spatial differences in GSI, although in some years there were regional differences (Figure 16). Also the third level interaction ‘Year x Region x Sex’ was significant. The variation in GSI was higher in region 1, southern Airisto, which is partly caused by the lower amount of samples from that area. When sexes are viewed separately, there are significant differences in GSI among years (Table 14). GSI varies more from year to year in females than in males: there were significant differences between years 1988 and 1990, and between years 1990 and 1991 in females, but not in males. The interannual variation in GSI was irregular without any trend (Figure 17). In both models, the covariate included statistically significant variation. With the exception of year 1994 the slopes of the covariate were negative, nevertheless, only in 1991 the slope of the covariate was statistically significant (Table 15). In the individual model, the residuals were heteroscedastic for the level ‘Sex’.
SEILI Archipelago Research Institute Publications 3
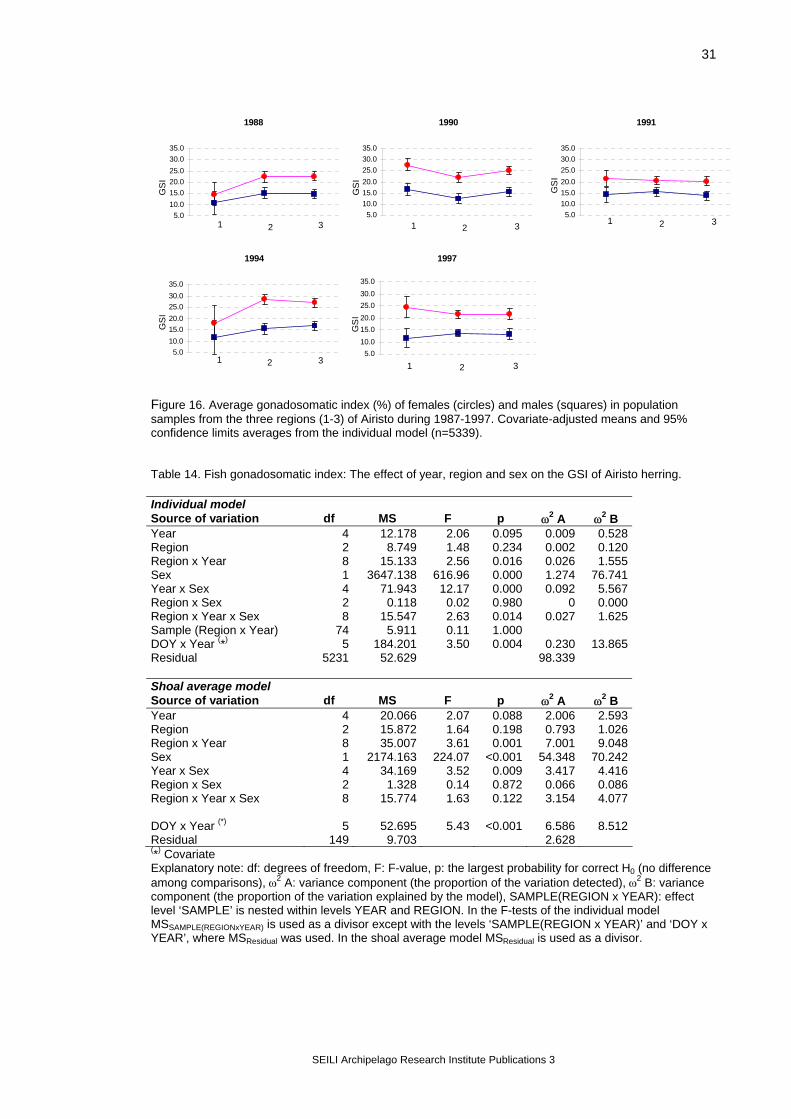
31
1988
5.010.015.020.025.030.035.0
1 2 3
GS
I
1990
5.010.015.020.025.030.035.0
1 2 3
GS
I
1991
5.010.015.020.025.030.035.0
1 2 3
GS
I
1994
5.010.015.020.025.030.035.0
1 2 3
GS
I
1997
5.010.015.020.025.030.035.0
1 2 3G
SI
Figure 16. Average gonadosomatic index (%) of females (circles) and males (squares) in population samples from the three regions (1-3) of Airisto during 1987-1997. Covariate-adjusted means and 95% confidence limits averages from the individual model (n=5339). Table 14. Fish gonadosomatic index: The effect of year, region and sex on the GSI of Airisto herring. Individual model Source of variation df MS F p ω2 A ω2 B Year 4 12.178 2.06 0.095 0.009 0.528 Region 2 8.749 1.48 0.234 0.002 0.120 Region x Year 8 15.133 2.56 0.016 0.026 1.555 Sex 1 3647.138 616.96 0.000 1.274 76.741 Year x Sex 4 71.943 12.17 0.000 0.092 5.567 Region x Sex 2 0.118 0.02 0.980 0 0.000 Region x Year x Sex 8 15.547 2.63 0.014 0.027 1.625 Sample (Region x Year) 74 5.911 0.11 1.000 DOY x Year (*) 5 184.201 3.50 0.004 0.230 13.865 Residual 5231 52.629 98.339 Shoal average model Source of variation df MS F p ω2 A ω2 B Year 4 20.066 2.07 0.088 2.006 2.593 Region 2 15.872 1.64 0.198 0.793 1.026 Region x Year 8 35.007 3.61 0.001 7.001 9.048 Sex 1 2174.163 224.07 <0.001 54.348 70.242 Year x Sex 4 34.169 3.52 0.009 3.417 4.416 Region x Sex 2 1.328 0.14 0.872 0.066 0.086 Region x Year x Sex 8 15.774 1.63 0.122 3.154 4.077 DOY x Year (*) 5 52.695 5.43 <0.001 6.586 8.512 Residual 149 9.703 2.628 (*) Covariate Explanatory note: df: degrees of freedom, F: F-value, p: the largest probability for correct H0 (no difference among comparisons), ω2 A: variance component (the proportion of the variation detected), ω2 B: variance component (the proportion of the variation explained by the model), SAMPLE(REGION x YEAR): effect level ‘SAMPLE’ is nested within levels YEAR and REGION. In the F-tests of the individual model MSSAMPLE(REGIONxYEAR) is used as a divisor except with the levels ‘SAMPLE(REGION x YEAR)’ and ‘DOY x YEAR’, where MSResidual was used. In the shoal average model MSResidual is used as a divisor.
SEILI Archipelago Research Institute Publications 3

32
Figure 17. Average gonado-somatic index (%) of females and males in population samples during 1987-1997. Covariate-adjusted means and 95% confidence limits averages from the individual model (n=5339).
5
10
15
20
25
30
1987 1988 1989 1990 1991 1992 1993 1994 1995 1996 1997 1998
Males
Females
YEAR
GS
I
Table 15. Fish gonadosomatic index: ANCOVA results for the covariate (DOY x Year) from the individual and shoal average models: slope estimates (β), test statistic (t), and its significance (p). Individual model Shoal average model Covariate β t p β t p DOY (1988) -0.051 -1.23 0.221 -0.041 -1.1 0.286DOY (1990) -0.031 -1.07 0.285 -0.048 -1.7 0.095DOY (1991) -0.159 -3.65 0.000 -0.136 -3.6 0.000DOY (1994) 0.053 1.02 0.309 -0.048 -1.1 0.280DOY (1997) -0.046 -0.71 0.478 -0.039 -0.7 0.473 Fish Condition The condition of fish was tested using somatic weight as a response variable and fish length as an additional covariate. In both models, length covered the most part of the variation in somatic weight (Table 16). Males were significantly heavier in all years (Figure 18); on the average, the difference was 0.8 g. There were no spatial differences in the condition of fish. The interaction term ‘Year x Region x Sex’ had a statistically significant variance component in the individual model, but the variation in the averages lacks any reasonable trend (Figure 19). According to the individual model also interannual differences are negligible, although the average model indicates statistically significant variation. Because the individual model utilises the data more efficiently, its result can be considered to be more reliable. In the results, the covariate ‘DOY’, sampling time, had very little effect on the differences in fish condition. It is obvious that condition does not change noticeably during the spawning season; the slope of this covariate was significant only in 1991 in the average model, when the later fish were in a poorer condition (Table 17). Again, because the individual model utilises the data more efficiently, its result is considered to be more reliable. The residuals from the individual model were not normally distributed and on the level ‘Year’ the residuals were heteroscedastic.
SEILI Archipelago Research Institute Publications 3
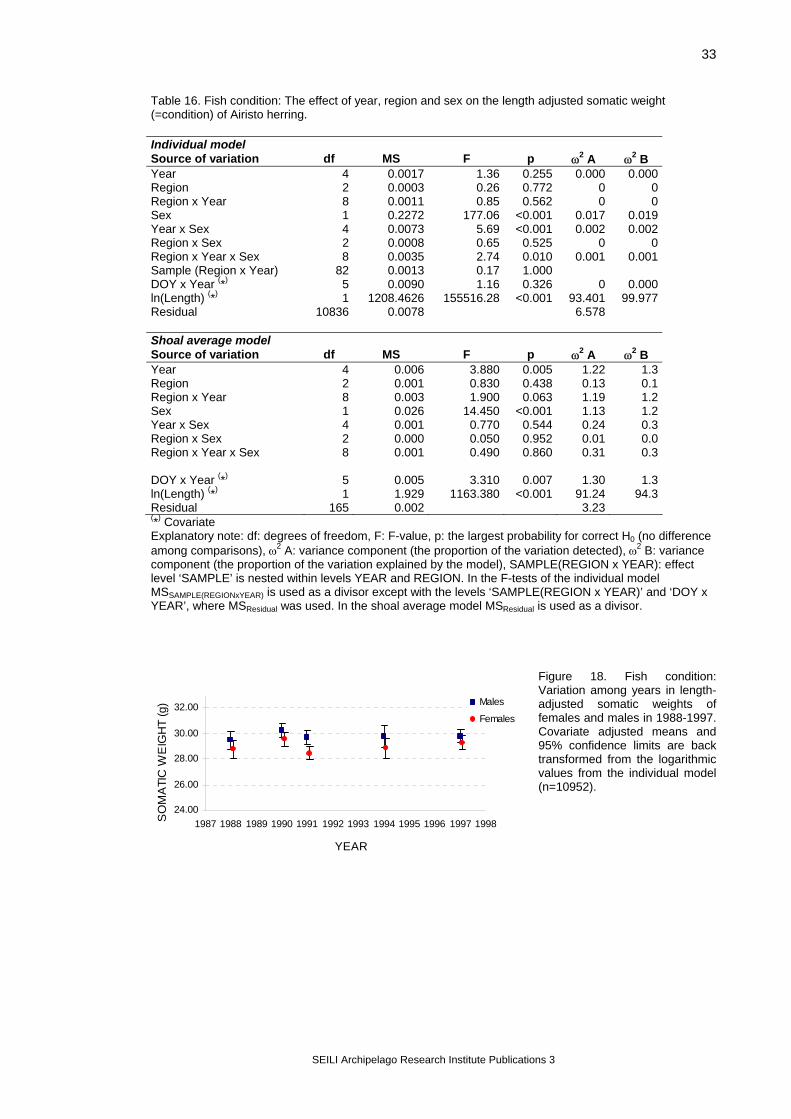
33
Table 16. Fish condition: The effect of year, region and sex on the length adjusted somatic weight (=condition) of Airisto herring. Individual model Source of variation df MS F p ω2 A ω2 B Year 4 0.0017 1.36 0.255 0.000 0.000Region 2 0.0003 0.26 0.772 0 0Region x Year 8 0.0011 0.85 0.562 0 0Sex 1 0.2272 177.06 <0.001 0.017 0.019Year x Sex 4 0.0073 5.69 <0.001 0.002 0.002Region x Sex 2 0.0008 0.65 0.525 0 0Region x Year x Sex 8 0.0035 2.74 0.010 0.001 0.001Sample (Region x Year) 82 0.0013 0.17 1.000 DOY x Year (*) 5 0.0090 1.16 0.326 0 0.000ln(Length) (*) 1 1208.4626 155516.28 <0.001 93.401 99.977Residual 10836 0.0078 6.578 Shoal average model Source of variation df MS F p ω2 A ω2 B Year 4 0.006 3.880 0.005 1.22 1.3Region 2 0.001 0.830 0.438 0.13 0.1Region x Year 8 0.003 1.900 0.063 1.19 1.2Sex 1 0.026 14.450 <0.001 1.13 1.2Year x Sex 4 0.001 0.770 0.544 0.24 0.3Region x Sex 2 0.000 0.050 0.952 0.01 0.0Region x Year x Sex 8 0.001 0.490 0.860 0.31 0.3 DOY x Year (*) 5 0.005 3.310 0.007 1.30 1.3ln(Length) (*) 1 1.929 1163.380 <0.001 91.24 94.3Residual 165 0.002 3.23 (*) Covariate Explanatory note: df: degrees of freedom, F: F-value, p: the largest probability for correct H0 (no difference among comparisons), ω2 A: variance component (the proportion of the variation detected), ω2 B: variance component (the proportion of the variation explained by the model), SAMPLE(REGION x YEAR): effect level ‘SAMPLE’ is nested within levels YEAR and REGION. In the F-tests of the individual model MSSAMPLE(REGIONxYEAR) is used as a divisor except with the levels ‘SAMPLE(REGION x YEAR)’ and ‘DOY x YEAR’, where MSResidual was used. In the shoal average model MSResidual is used as a divisor.
Figure 18. Fish condition: Variation among years in length-adjusted somatic weights of females and males in 1988-1997. Covariate adjusted means and 95% confidence limits are back transformed from the logarithmic values from the individual model (n=10952).
24.00
26.00
28.00
30.00
32.00
1987 1988 1989 1990 1991 1992 1993 1994 1995 1996 1997 1998
Males
Females
YEAR
SO
MA
TIC
WE
IGH
T (g
)
SEILI Archipelago Research Institute Publications 3
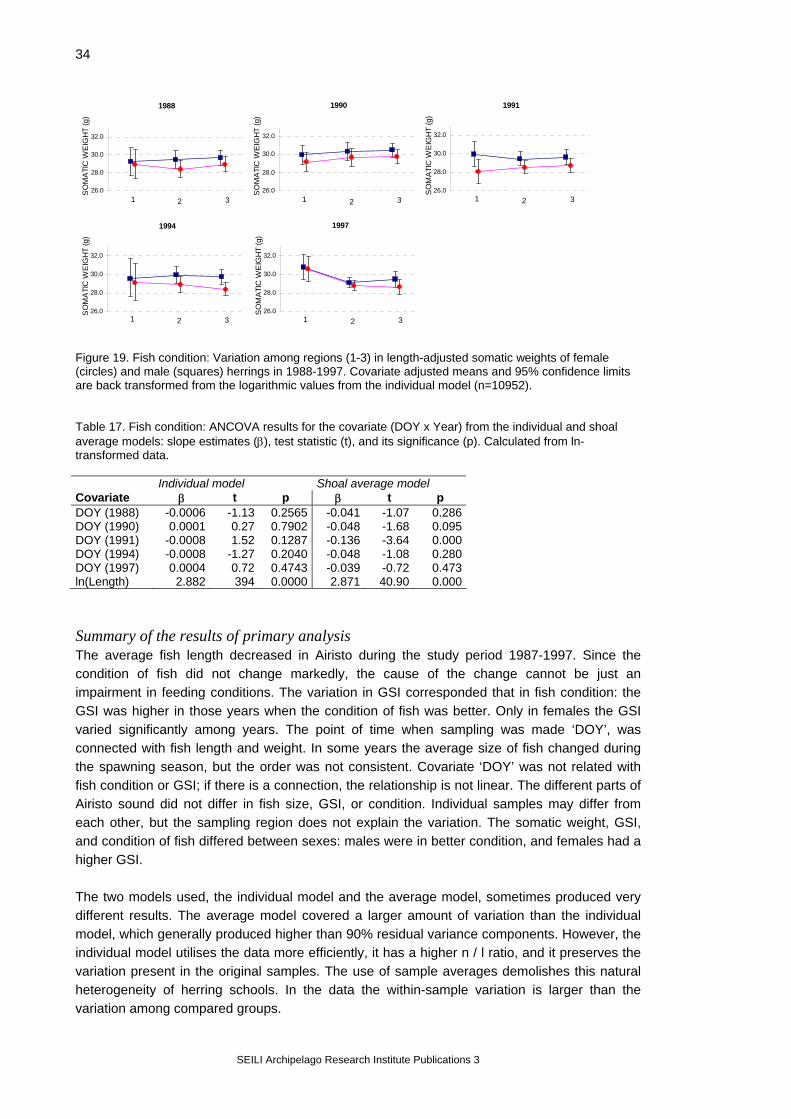
34
1997
26.0
28.0
30.0
32.0
1 2 3
SO
MA
TIC
WE
IGH
T (g
)
1994
26.0
28.0
30.0
32.0
1 2 3
SO
MA
TIC
WE
IGH
T (g
)
1991
26.0
28.0
30.0
32.0
1 2 3
SO
MA
TIC
WE
IGH
T (g
)
1990
26.0
28.0
30.0
32.0
1 2 3
SO
MA
TIC
WE
IGH
T (g
)
1988
26.0
28.0
30.0
32.0
1 2 3
SO
MA
TIC
WE
IGH
T (g
)
Figure 19. Fish condition: Variation among regions (1-3) in length-adjusted somatic weights of female (circles) and male (squares) herrings in 1988-1997. Covariate adjusted means and 95% confidence limits are back transformed from the logarithmic values from the individual model (n=10952). Table 17. Fish condition: ANCOVA results for the covariate (DOY x Year) from the individual and shoal average models: slope estimates (β), test statistic (t), and its significance (p). Calculated from ln-transformed data. Individual model Shoal average model Covariate β t p β t p DOY (1988) -0.0006 -1.13 0.2565 -0.041 -1.07 0.286DOY (1990) 0.0001 0.27 0.7902 -0.048 -1.68 0.095DOY (1991) -0.0008 1.52 0.1287 -0.136 -3.64 0.000DOY (1994) -0.0008 -1.27 0.2040 -0.048 -1.08 0.280DOY (1997) 0.0004 0.72 0.4743 -0.039 -0.72 0.473ln(Length) 2.882 394 0.0000 2.871 40.90 0.000 Summary of the results of primary analysis The average fish length decreased in Airisto during the study period 1987-1997. Since the condition of fish did not change markedly, the cause of the change cannot be just an impairment in feeding conditions. The variation in GSI corresponded that in fish condition: the GSI was higher in those years when the condition of fish was better. Only in females the GSI varied significantly among years. The point of time when sampling was made ‘DOY’, was connected with fish length and weight. In some years the average size of fish changed during the spawning season, but the order was not consistent. Covariate ‘DOY’ was not related with fish condition or GSI; if there is a connection, the relationship is not linear. The different parts of Airisto sound did not differ in fish size, GSI, or condition. Individual samples may differ from each other, but the sampling region does not explain the variation. The somatic weight, GSI, and condition of fish differed between sexes: males were in better condition, and females had a higher GSI. The two models used, the individual model and the average model, sometimes produced very different results. The average model covered a larger amount of variation than the individual model, which generally produced higher than 90% residual variance components. However, the individual model utilises the data more efficiently, it has a higher n / l ratio, and it preserves the variation present in the original samples. The use of sample averages demolishes this natural heterogeneity of herring schools. In the data the within-sample variation is larger than the variation among compared groups.
SEILI Archipelago Research Institute Publications 3

35
Airisto: Secondary analysis Based on the primary results, the updated data, now including the year 1998, were re-analysed using the individual model (MIXED-procedure, Littell et al. 1996). In the model, ’Year’, ’Region’, ’Sex’ were used as main effects. ’Sample’ was nested within ‘Region’ and ‘Year’, and defined as a random effect. Sampling date (day-of-the-year; ’DOY’) was used as a covariate. Statistical null hypothesis (H0) was that the class variables do not affect the values of the analysis variable. Analysed fish properties were total length, somatic weight, age, and fish condition. Fish condition was analysed using somatic weight as an analysis variable and fish length (ln(length)) as an additional covariate. Logarithmic transformation (ln) was applied to response variables. Normality and the heterogeneity of variances were tested as in the primary analysis. Based on the results of ANCOVA, the variance components were calculated for the levels of class variables according to Lindman (1992). If the result of ANCOVA indicated statistically significant variation (p<0.05), group means for this level were tested with Tukey’s test (Day and Quinn 1989, Lindman 1992). Length Seven years, three regions and 177 samples were included in the analysis; the number of individual fish was 20838. Years 1987, 1988, 1990, 1991, 1994, 1997, and 1998 were included. The analysis was performed without class variable ’Sex’, because the primary analysis indicated that there was no significant length difference between sexes. The residuals were heteroscedastic for the levels ’Year’ and ’Region’, so the probability values should be viewed critically. However, since the relation n / l is high, the results are considered reliable (Lindman 1992). According to the results, there was statistically significant variation in fish length among years, (Table 18), although most of the variation explained by the model was due to the covariate. In pairwise comparisons, the years 1988-1990, 1991-1994 and 1997-1998 are similar, and the year 1990 differs from all others except from 1988 (Table 19). The mean length of herring was highest in 1990 and lowest in 1997 (Figure 20). For some years, the slope for the covariate was significant (Table 20): in 1990 and 1994 mean length decreased during the spawning season, whereas in 1997 and 1998 it increased. The variance components of other effect levels were less than 1%: sampling region did not seriously affect length estimates. Table 18. Fish length: The effect of year and region on the length of Airisto herring. Individual model Source of variation df MS F p ω2 A ω2 B Year 6 0.0093 9.63 0.000 0.0174 7.68 Region 2 0.0013 1.32 0.270 0.0002 0.09 Region x Year 12 0.0015 1.51 0.126 0.0020 0.90 Sample (Region x Year) 151 0.0010 0.07 1.000 DOY x Year (*) 7 0.0967 7.17 0.000 0.2067 91.30 Residual 20837 281.06 99.773 (*) Covariate Explanatory note: df: degrees of freedom, F: F-value, p: the largest probability for correct H0 (no difference among comparisons), ω2 A: variance component (the proportion of the variation detected), ω2 B: variance component (the proportion of the variation explained by the model), SAMPLE(REGION x YEAR): effect level ‘SAMPLE’ is nested within levels YEAR and REGION. In the F-tests MSSAMPLE(REGIONxYEAR) is used as a divisor except with the levels ‘SAMPLE(REGION x YEAR)’ and ‘DOY x YEAR’, where MSResidual was used.
SEILI Archipelago Research Institute Publications 3
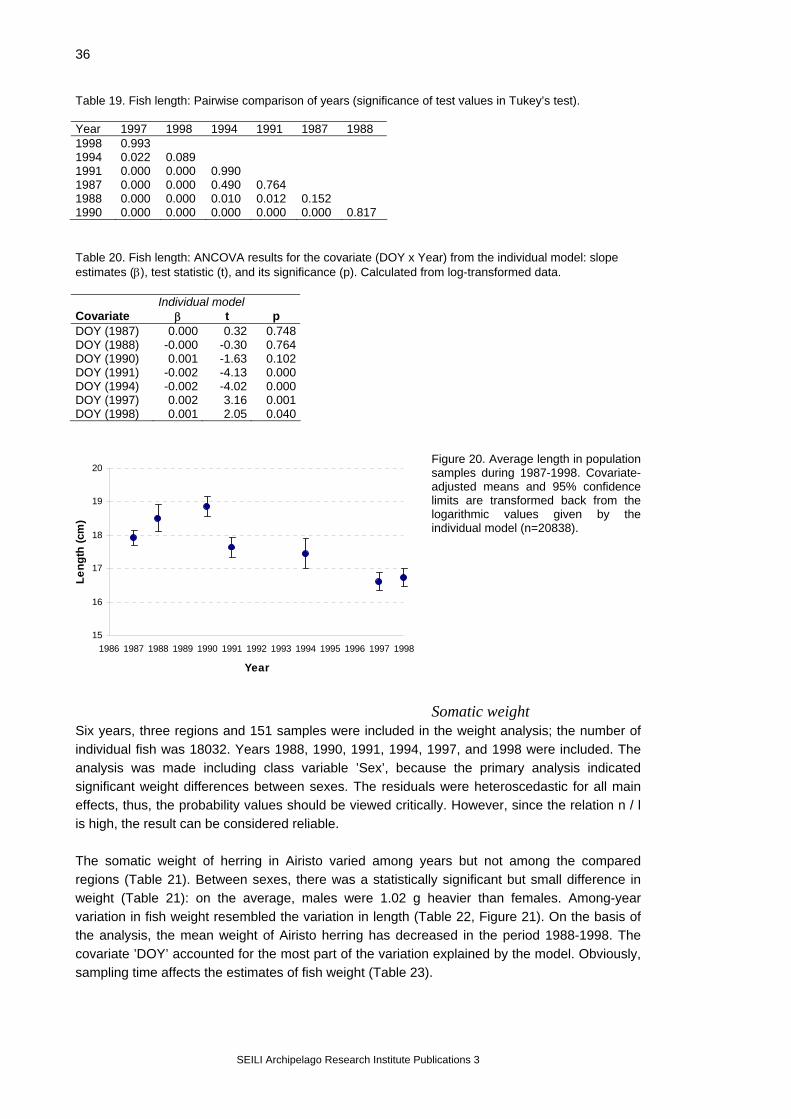
36
Table 19. Fish length: Pairwise comparison of years (significance of test values in Tukey’s test). Year 1997 1998 1994 1991 1987 1988 1998 0.993 1994 0.022 0.089 1991 0.000 0.000 0.990 1987 0.000 0.000 0.490 0.764 1988 0.000 0.000 0.010 0.012 0.152 1990 0.000 0.000 0.000 0.000 0.000 0.817 Table 20. Fish length: ANCOVA results for the covariate (DOY x Year) from the individual model: slope estimates (β), test statistic (t), and its significance (p). Calculated from log-transformed data. Individual model Covariate β t p DOY (1987) 0.000 0.32 0.748 DOY (1988) -0.000 -0.30 0.764 DOY (1990) 0.001 -1.63 0.102 DOY (1991) -0.002 -4.13 0.000 DOY (1994) -0.002 -4.02 0.000 DOY (1997) 0.002 3.16 0.001 DOY (1998) 0.001 2.05 0.040
Figure 20. Average length in population samples during 1987-1998. Covariate-adjusted means and 95% confidence limits are transformed back from the logarithmic values given by the individual model (n=20838).
15
16
17
18
19
20
1986 1987 1988 1989 1990 1991 1992 1993 1994 1995 1996 1997 1998
Year
Leng
th (c
m)
Somatic weight
Six years, three regions and 151 samples were included in the weight analysis; the number of individual fish was 18032. Years 1988, 1990, 1991, 1994, 1997, and 1998 were included. The analysis was made including class variable ’Sex’, because the primary analysis indicated significant weight differences between sexes. The residuals were heteroscedastic for all main effects, thus, the probability values should be viewed critically. However, since the relation n / l is high, the result can be considered reliable. The somatic weight of herring in Airisto varied among years but not among the compared regions (Table 21). Between sexes, there was a statistically significant but small difference in weight (Table 21): on the average, males were 1.02 g heavier than females. Among-year variation in fish weight resembled the variation in length (Table 22, Figure 21). On the basis of the analysis, the mean weight of Airisto herring has decreased in the period 1988-1998. The covariate ’DOY’ accounted for the most part of the variation explained by the model. Obviously, sampling time affects the estimates of fish weight (Table 23).
SEILI Archipelago Research Institute Publications 3

37
Table 21. Fish weight: The effect of year and region on the somatic weight of Airisto herring. Individual model Source of variation df MS F p ω2 A ω2 B Year 5 0.081 9.39 0.000 0.0175 7.48 Region 2 0.007 0.81 0.447 0 0 Region x Year 10 0.011 1.28 0.248 0.0011 0.49 Sex 1 0.071 8.21 0.005 0.0036 1.54 Year x Sex 5 0.019 2.20 0.058 0.0025 1.07 Region x Sex 2 0.015 1.77 0.174 0.0001 0.27 Year x Region x Sex 10 0.012 1.38 0.197 0.0016 0.67 Sample (Region x Year) 128 0.009 0.08 1.000 DOY x Year (*) 6 0.830 7.24 0.000 0.2071 88.44 Residual 17863 0.115 99.772 (*) Covariate Explanatory note: df: degrees of freedom, F: F-value, p: the largest probability for correct H0 (no difference among comparisons), ω2 A: variance component (the proportion of the variation detected), ω2 B: variance component (the proportion of the variation explained by the model), SAMPLE(REGION x YEAR): effect level ‘SAMPLE’ is nested within levels YEAR and REGION. In the F-tests MSSAMPLE(REGIONxYEAR) is used as a divisor except with the levels ‘SAMPLE(REGION x YEAR)’ and ‘DOY x YEAR’, where MSResidual was used. Table 22. Fish weight: Pairwise comparison of years (significance of test values in Tukey’s test). Year 1997 1998 1994 1991 1988 1998 0.605 1994 0.060 0.577 1991 0.000 0.042 0.986 1988 0.000 0.000 0.010 0.011 1990 0.000 0.000 0.000 0.000 0.364 Table 23. Fish weight: ANCOVA results for the covariate (DOY x Year) from the individual model: slope estimates (β), test statistic (t), and its significance (p). Calculated from log-transformed data. Individual model Covariate β t p DOY (1988) -0.001 -0.61 0.544DOY (1990) -0.002 -1.51 0.131DOY (1991) -0.005 -3.27 0.001DOY (1994) -0.007 -4.21 0.000DOY (1997) 0.006 3.38 0.001DOY (1998) 0.001 0.96 0.336
Figure 21. Average somatic weight of herring females and males in Airisto population samples in 1988-1998. Covariate-adjusted means and 95% confidence limits are transformed back from the logarithmic values given by the individual model (n=18032). Age Six years, three regions and 90 samples were included in age
analysis; the number of individual fish was 7820. Years 1987, 1988, 1990, 1991, 1994, and
22
26
30
34
38
42
1987 1988 1989 1990 1991 1992 1993 1994 1995 1996 1997 1998 1999
Year
Som
atic
wei
ght (
g)
Males
Females
SEILI Archipelago Research Institute Publications 3
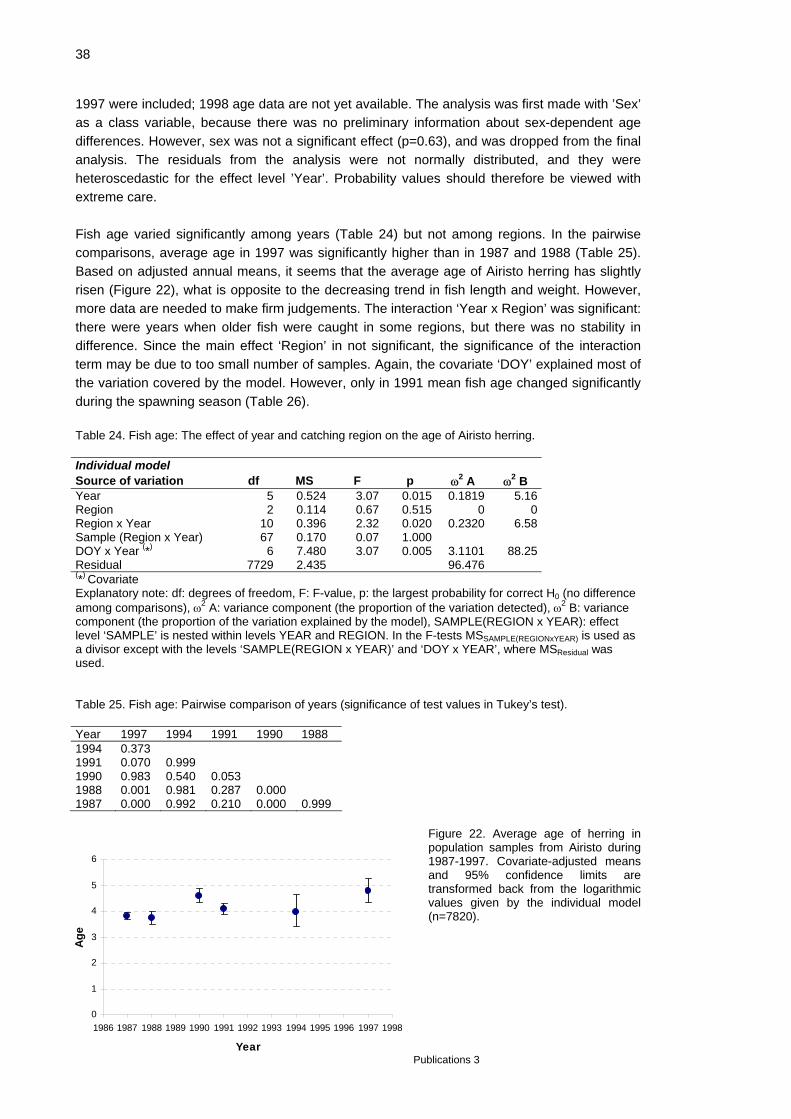
38
1997 were included; 1998 age data are not yet available. The analysis was first made with ’Sex’ as a class variable, because there was no preliminary information about sex-dependent age differences. However, sex was not a significant effect (p=0.63), and was dropped from the final analysis. The residuals from the analysis were not normally distributed, and they were heteroscedastic for the effect level ’Year’. Probability values should therefore be viewed with extreme care. Fish age varied significantly among years (Table 24) but not among regions. In the pairwise comparisons, average age in 1997 was significantly higher than in 1987 and 1988 (Table 25). Based on adjusted annual means, it seems that the average age of Airisto herring has slightly risen (Figure 22), what is opposite to the decreasing trend in fish length and weight. However, more data are needed to make firm judgements. The interaction ‘Year x Region’ was significant: there were years when older fish were caught in some regions, but there was no stability in difference. Since the main effect ‘Region’ in not significant, the significance of the interaction term may be due to too small number of samples. Again, the covariate ‘DOY’ explained most of the variation covered by the model. However, only in 1991 mean fish age changed significantly during the spawning season (Table 26). Table 24. Fish age: The effect of year and catching region on the age of Airisto herring. Individual model Source of variation df MS F p ω2 A ω2 B Year 5 0.524 3.07 0.015 0.1819 5.16Region 2 0.114 0.67 0.515 0 0Region x Year 10 0.396 2.32 0.020 0.2320 6.58Sample (Region x Year) 67 0.170 0.07 1.000DOY x Year (*) 6 7.480 3.07 0.005 3.1101 88.25Residual 7729 2.435 96.476(*) Covariate Explanatory note: df: degrees of freedom, F: F-value, p: the largest probability for correct H0 (no difference among comparisons), ω2 A: variance component (the proportion of the variation detected), ω2 B: variance component (the proportion of the variation explained by the model), SAMPLE(REGION x YEAR): effect level ‘SAMPLE’ is nested within levels YEAR and REGION. In the F-tests MSSAMPLE(REGIONxYEAR) is used as a divisor except with the levels ‘SAMPLE(REGION x YEAR)’ and ‘DOY x YEAR’, where MSResidual was used. Table 25. Fish age: Pairwise comparison of years (significance of test values in Tukey’s test). Year 1997 1994 1991 1990 1988 1994 0.373 1991 0.070 0.999 1990 0.983 0.540 0.053 1988 0.001 0.981 0.287 0.000 1987 0.000 0.992 0.210 0.000 0.999
Figure 22. Average age of herring in population samples from Airisto during 1987-1997. Covariate-adjusted means and 95% confidence limits are transformed back from the logarithmic values given by the individual model (n=7820).
SEILI Archipelago Research Institute Publications 3
0
1
2
3
4
5
6
1986 1987 1988 1989 1990 1991 1992 1993 1994 1995 1996 1997 1998
Year
Age
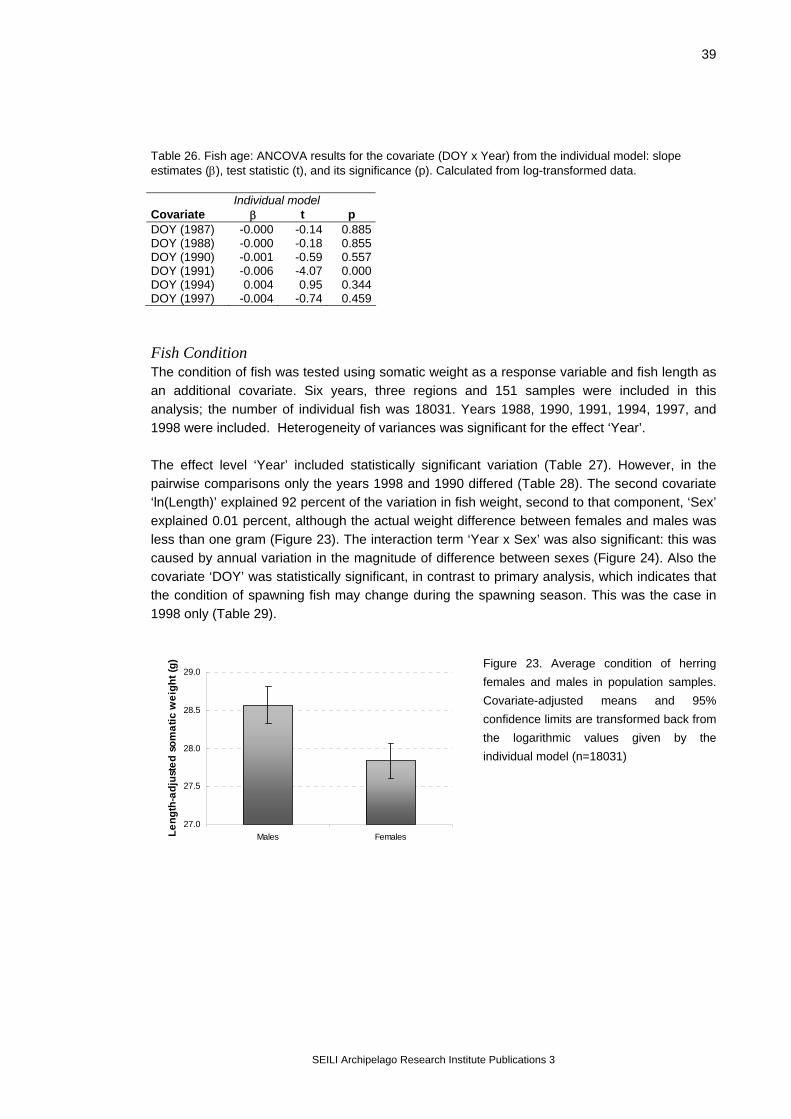
39
Table 26. Fish age: ANCOVA results for the covariate (DOY x Year) from the individual model: slope estimates (β), test statistic (t), and its significance (p). Calculated from log-transformed data. Individual model Covariate β t p DOY (1987) -0.000 -0.14 0.885DOY (1988) -0.000 -0.18 0.855DOY (1990) -0.001 -0.59 0.557DOY (1991) -0.006 -4.07 0.000DOY (1994) 0.004 0.95 0.344DOY (1997) -0.004 -0.74 0.459 Fish Condition The condition of fish was tested using somatic weight as a response variable and fish length as an additional covariate. Six years, three regions and 151 samples were included in this analysis; the number of individual fish was 18031. Years 1988, 1990, 1991, 1994, 1997, and 1998 were included. Heterogeneity of variances was significant for the effect ‘Year’. The effect level ‘Year’ included statistically significant variation (Table 27). However, in the pairwise comparisons only the years 1998 and 1990 differed (Table 28). The second covariate ‘ln(Length)’ explained 92 percent of the variation in fish weight, second to that component, ‘Sex’ explained 0.01 percent, although the actual weight difference between females and males was less than one gram (Figure 23). The interaction term ‘Year x Sex’ was also significant: this was caused by annual variation in the magnitude of difference between sexes (Figure 24). Also the covariate ‘DOY’ was statistically significant, in contrast to primary analysis, which indicates that the condition of spawning fish may change during the spawning season. This was the case in 1998 only (Table 29).
Figure 23. Average condition of herring females and males in population samples. Covariate-adjusted means and 95% confidence limits are transformed back from the logarithmic values given by the individual model (n=18031)
27.0
27.5
28.0
28.5
29.0
Males FemalesLeng
th-a
djus
ted
som
atic
wei
ght (
g)
SEILI Archipelago Research Institute Publications 3
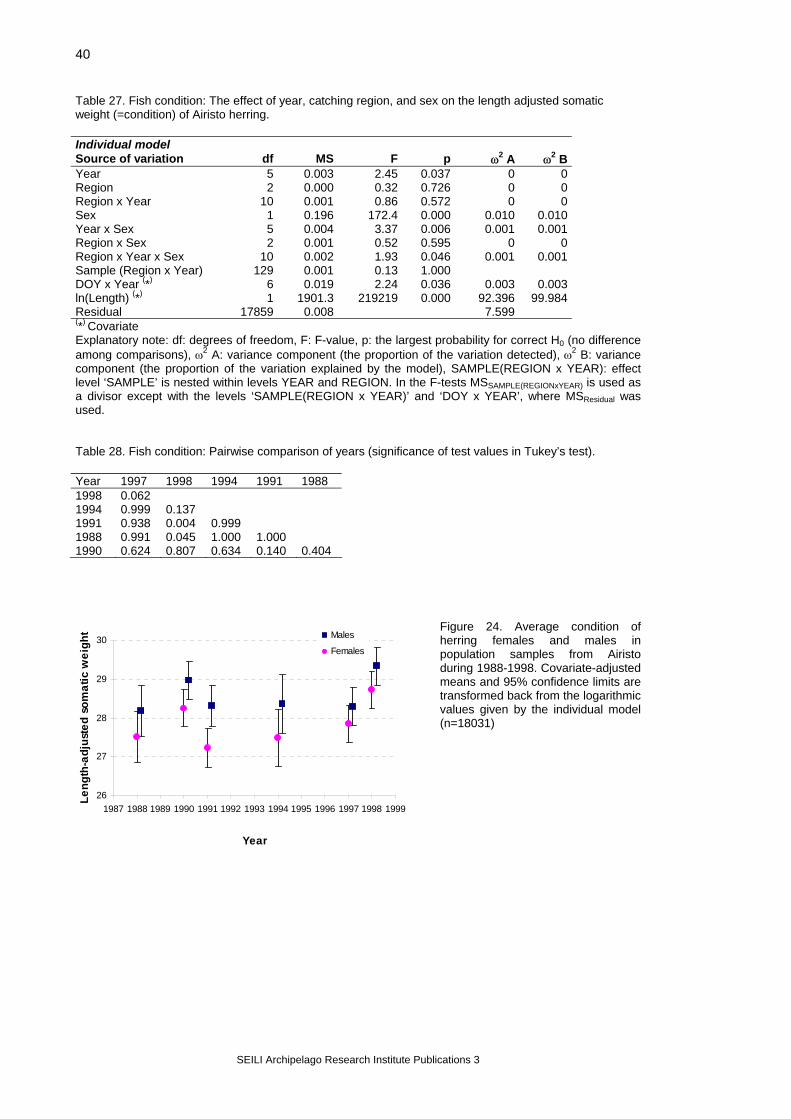
40
Table 27. Fish condition: The effect of year, catching region, and sex on the length adjusted somatic weight (=condition) of Airisto herring. Individual model Source of variation df MS F p ω2 A ω2 B Year 5 0.003 2.45 0.037 0 0 Region 2 0.000 0.32 0.726 0 0 Region x Year 10 0.001 0.86 0.572 0 0 Sex 1 0.196 172.4 0.000 0.010 0.010 Year x Sex 5 0.004 3.37 0.006 0.001 0.001 Region x Sex 2 0.001 0.52 0.595 0 0 Region x Year x Sex 10 0.002 1.93 0.046 0.001 0.001 Sample (Region x Year) 129 0.001 0.13 1.000 DOY x Year (*) 6 0.019 2.24 0.036 0.003 0.003 ln(Length) (*) 1 1901.3 219219 0.000 92.396 99.984 Residual 17859 0.008 7.599 (*) Covariate Explanatory note: df: degrees of freedom, F: F-value, p: the largest probability for correct H0 (no difference among comparisons), ω2 A: variance component (the proportion of the variation detected), ω2 B: variance component (the proportion of the variation explained by the model), SAMPLE(REGION x YEAR): effect level ‘SAMPLE’ is nested within levels YEAR and REGION. In the F-tests MSSAMPLE(REGIONxYEAR) is used as a divisor except with the levels ‘SAMPLE(REGION x YEAR)’ and ‘DOY x YEAR’, where MSResidual was used. Table 28. Fish condition: Pairwise comparison of years (significance of test values in Tukey’s test). Year 1997 1998 1994 1991 1988 1998 0.062 1994 0.999 0.137 1991 0.938 0.004 0.999 1988 0.991 0.045 1.000 1.000 1990 0.624 0.807 0.634 0.140 0.404
Figure 24. Average condition of herring females and males in population samples from Airisto during 1988-1998. Covariate-adjusted means and 95% confidence limits are transformed back from the logarithmic values given by the individual model (n=18031)
26
27
28
29
30
1987 1988 1989 1990 1991 1992 1993 1994 1995 1996 1997 1998 1999
Year
Leng
th-a
djus
ted
som
atic
wei
ght Males
Females
SEILI Archipelago Research Institute Publications 3
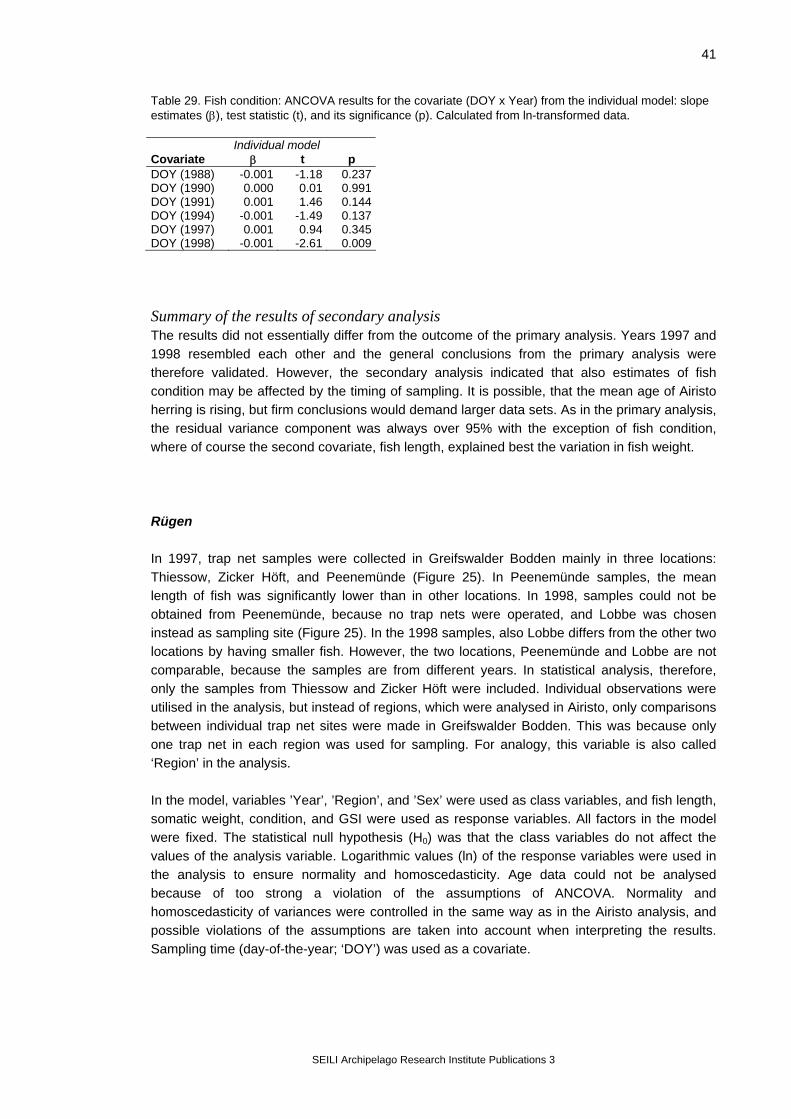
41
Table 29. Fish condition: ANCOVA results for the covariate (DOY x Year) from the individual model: slope estimates (β), test statistic (t), and its significance (p). Calculated from ln-transformed data. Individual model Covariate β t p DOY (1988) -0.001 -1.18 0.237DOY (1990) 0.000 0.01 0.991DOY (1991) 0.001 1.46 0.144DOY (1994) -0.001 -1.49 0.137DOY (1997) 0.001 0.94 0.345DOY (1998) -0.001 -2.61 0.009 Summary of the results of secondary analysis The results did not essentially differ from the outcome of the primary analysis. Years 1997 and 1998 resembled each other and the general conclusions from the primary analysis were therefore validated. However, the secondary analysis indicated that also estimates of fish condition may be affected by the timing of sampling. It is possible, that the mean age of Airisto herring is rising, but firm conclusions would demand larger data sets. As in the primary analysis, the residual variance component was always over 95% with the exception of fish condition, where of course the second covariate, fish length, explained best the variation in fish weight. Rügen In 1997, trap net samples were collected in Greifswalder Bodden mainly in three locations: Thiessow, Zicker Höft, and Peenemünde (Figure 25). In Peenemünde samples, the mean length of fish was significantly lower than in other locations. In 1998, samples could not be obtained from Peenemünde, because no trap nets were operated, and Lobbe was chosen instead as sampling site (Figure 25). In the 1998 samples, also Lobbe differs from the other two locations by having smaller fish. However, the two locations, Peenemünde and Lobbe are not comparable, because the samples are from different years. In statistical analysis, therefore, only the samples from Thiessow and Zicker Höft were included. Individual observations were utilised in the analysis, but instead of regions, which were analysed in Airisto, only comparisons between individual trap net sites were made in Greifswalder Bodden. This was because only one trap net in each region was used for sampling. For analogy, this variable is also called ‘Region’ in the analysis. In the model, variables ’Year’, ’Region’, and ’Sex’ were used as class variables, and fish length, somatic weight, condition, and GSI were used as response variables. All factors in the model were fixed. The statistical null hypothesis (H0) was that the class variables do not affect the values of the analysis variable. Logarithmic values (ln) of the response variables were used in the analysis to ensure normality and homoscedasticity. Age data could not be analysed because of too strong a violation of the assumptions of ANCOVA. Normality and homoscedasticity of variances were controlled in the same way as in the Airisto analysis, and possible violations of the assumptions are taken into account when interpreting the results. Sampling time (day-of-the-year; ‘DOY’) was used as a covariate.
SEILI Archipelago Research Institute Publications 3

42
Figure 25. Location of the trap nets sampled in 1997-98 in the Greifswalder Bodden. Fish length The data consisted of samples from two years and two trap nets; the number of individual observations was 3000. According to the F-test of ANCOVA, the only statistically significant level in the model was the interaction term ‘Year x Region’ (Table 30), and even this factor accounted for less than 0.1 % of the total variation. However, pairwise comparisons indicated that the between-year variation in fish length was significant (t=8.08, p=0.0001). The significant interaction is caused by a small change in the relation of locations: in 1997 Thiessow had larger fish and in 1998 smaller, but the difference between trap net sites was not significant (Figure 26). The proportion of residual variation was high: the variation within is higher than between sampling sites. The covariate ‘DOY’ accounted for 99 % of the explained variation. The slope of the covariate was negative and statistically significant in both years: the mean length of fish diminishes as the spawning season proceeds (Table 31). Table 30. Fish length: The effect of year, region, and sex on the length of Rügen herring. Individual model Source of variation df MS F p ω2 A ω2 B Year 1 0.012 1.53 0.217 0.013 0.056Region 1 0.003 0.31 0.578 0 0Region x Year 1 0.036 4.38 0.036 0.086 0.361Sex 1 0.026 3.16 0.076 0.054 0.230Year x Sex 1 0.002 0.35 0.557 0 0Region x Sex 1 0.000 0.01 0.913 0 0Region x Year x Sex 1 0.002 0.20 0.651 0 0DOY x Year (*) 2 3.881 466.5 0.000 23.658 99.352Residual 2990 0.008 76.242 (*) Covariate Explanatory note: df: degrees of freedom, F: F-value, p: the largest probability for correct H0 (no difference among comparisons), ω2 A: variance component (the proportion of the variation detected), ω2 B: variance component (the proportion of the variation explained by the model).
SEILI Archipelago Research Institute Publications 3
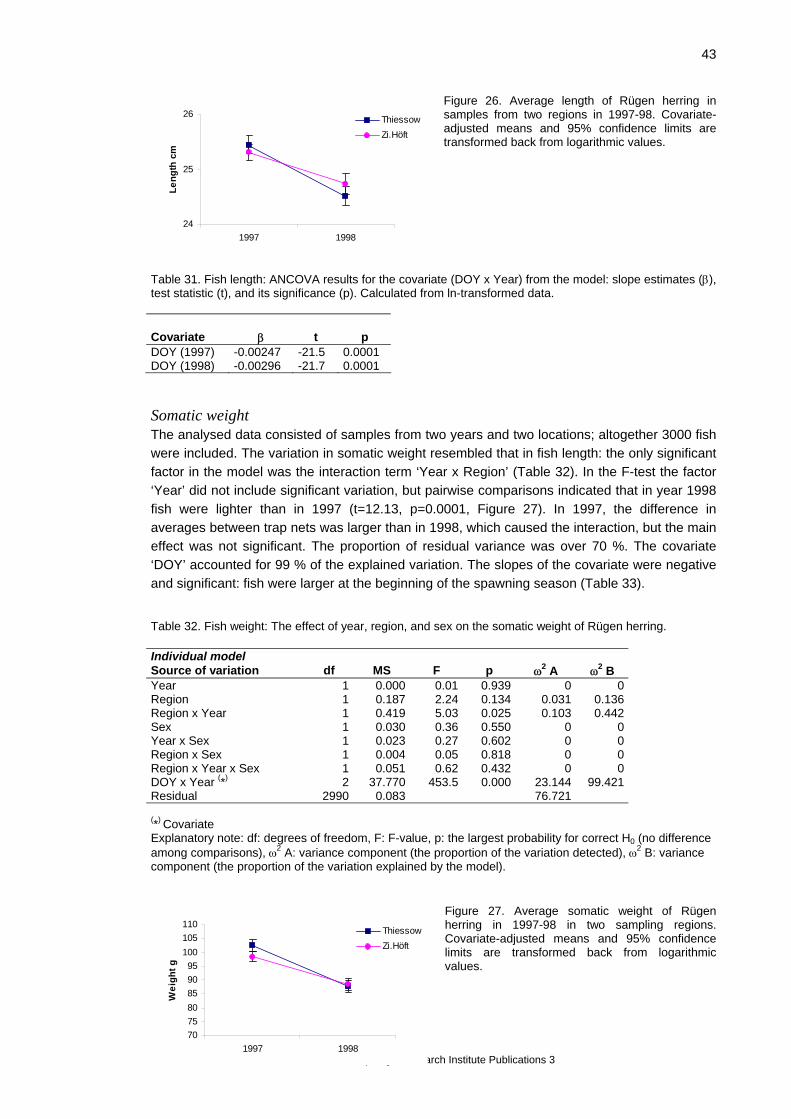
43
Figure 26. Average length of Rügen herring in samples from two regions in 1997-98. Covariate-adjusted means and 95% confidence limits are transformed back from logarithmic values.
24
25
26
1997 1998
Leng
th c
m
ThiessowZi.Höft
Table 31. Fish length: ANCOVA results for the covariate (DOY x Year) from the model: slope estimates (β), test statistic (t), and its significance (p). Calculated from ln-transformed data. Covariate β t p DOY (1997) -0.00247 -21.5 0.0001 DOY (1998) -0.00296 -21.7 0.0001 Somatic weight The analysed data consisted of samples from two years and two locations; altogether 3000 fish were included. The variation in somatic weight resembled that in fish length: the only significant factor in the model was the interaction term ‘Year x Region’ (Table 32). In the F-test the factor ‘Year’ did not include significant variation, but pairwise comparisons indicated that in year 1998 fish were lighter than in 1997 (t=12.13, p=0.0001, Figure 27). In 1997, the difference in averages between trap nets was larger than in 1998, which caused the interaction, but the main effect was not significant. The proportion of residual variance was over 70 %. The covariate ‘DOY’ accounted for 99 % of the explained variation. The slopes of the covariate were negative and significant: fish were larger at the beginning of the spawning season (Table 33). Table 32. Fish weight: The effect of year, region, and sex on the somatic weight of Rügen herring. Individual model Source of variation df MS F p ω2 A ω2 B Year 1 0.000 0.01 0.939 0 0 Region 1 0.187 2.24 0.134 0.031 0.136 Region x Year 1 0.419 5.03 0.025 0.103 0.442 Sex 1 0.030 0.36 0.550 0 0 Year x Sex 1 0.023 0.27 0.602 0 0 Region x Sex 1 0.004 0.05 0.818 0 0 Region x Year x Sex 1 0.051 0.62 0.432 0 0 DOY x Year (*) 2 37.770 453.5 0.000 23.144 99.421 Residual 2990 0.083 76.721 (*) Covariate Explanatory note: df: degrees of freedom, F: F-value, p: the largest probability for correct H0 (no difference among comparisons), ω2 A: variance component (the proportion of the variation detected), ω2 B: variance component (the proportion of the variation explained by the model).
Figure 27. Average somatic weight of Rügen herring in 1997-98 in two sampling regions. Covariate-adjusted means and 95% confidence limits are transformed back from logarithmic values.
SEILI Archipelago Research Institute Publications 3
707580859095
100105110
1997 1998
Wei
ght g
ThiessowZi.Höft
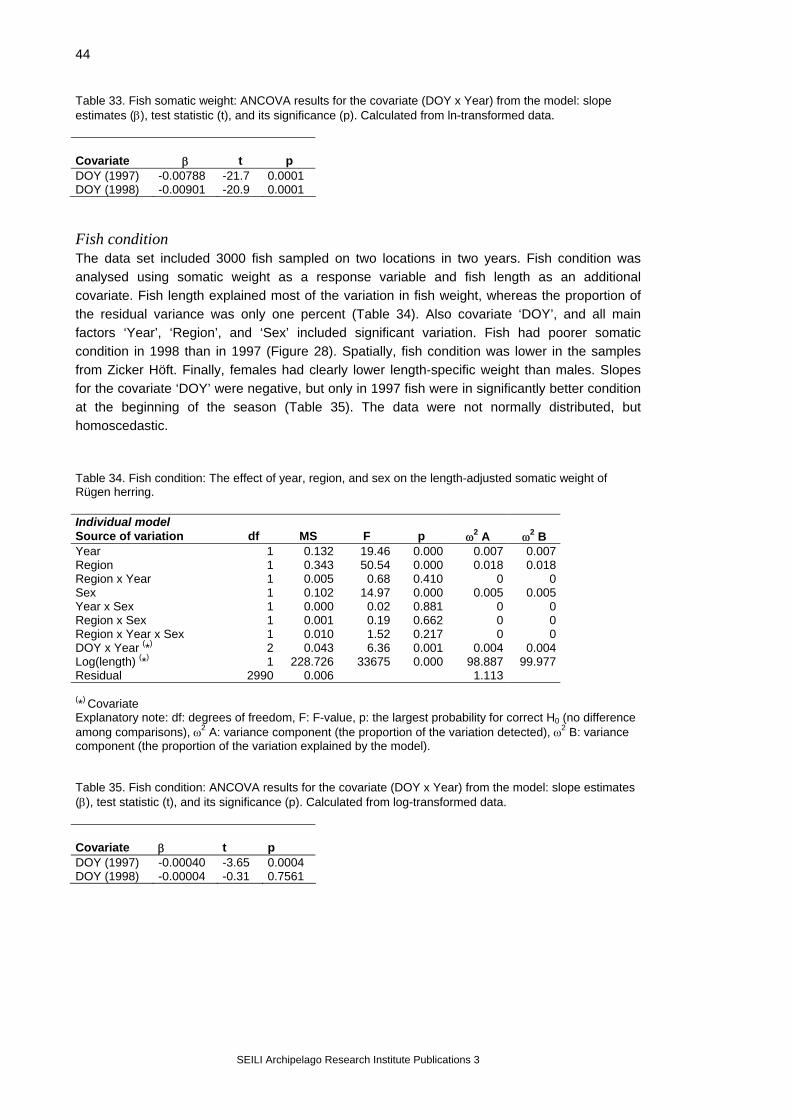
44
Table 33. Fish somatic weight: ANCOVA results for the covariate (DOY x Year) from the model: slope estimates (β), test statistic (t), and its significance (p). Calculated from ln-transformed data. Covariate β t p DOY (1997) -0.00788 -21.7 0.0001 DOY (1998) -0.00901 -20.9 0.0001 Fish condition The data set included 3000 fish sampled on two locations in two years. Fish condition was analysed using somatic weight as a response variable and fish length as an additional covariate. Fish length explained most of the variation in fish weight, whereas the proportion of the residual variance was only one percent (Table 34). Also covariate ‘DOY’, and all main factors ‘Year’, ‘Region’, and ‘Sex’ included significant variation. Fish had poorer somatic condition in 1998 than in 1997 (Figure 28). Spatially, fish condition was lower in the samples from Zicker Höft. Finally, females had clearly lower length-specific weight than males. Slopes for the covariate ‘DOY’ were negative, but only in 1997 fish were in significantly better condition at the beginning of the season (Table 35). The data were not normally distributed, but homoscedastic. Table 34. Fish condition: The effect of year, region, and sex on the length-adjusted somatic weight of Rügen herring. Individual model Source of variation df MS F p ω2 A ω2 B Year 1 0.132 19.46 0.000 0.007 0.007Region 1 0.343 50.54 0.000 0.018 0.018Region x Year 1 0.005 0.68 0.410 0 0Sex 1 0.102 14.97 0.000 0.005 0.005Year x Sex 1 0.000 0.02 0.881 0 0Region x Sex 1 0.001 0.19 0.662 0 0Region x Year x Sex 1 0.010 1.52 0.217 0 0DOY x Year (*) 2 0.043 6.36 0.001 0.004 0.004Log(length) (*) 1 228.726 33675 0.000 98.887 99.977Residual 2990 0.006 1.113 (*) Covariate Explanatory note: df: degrees of freedom, F: F-value, p: the largest probability for correct H0 (no difference among comparisons), ω2 A: variance component (the proportion of the variation detected), ω2 B: variance component (the proportion of the variation explained by the model). Table 35. Fish condition: ANCOVA results for the covariate (DOY x Year) from the model: slope estimates (β), test statistic (t), and its significance (p). Calculated from log-transformed data. Covariate β t p DOY (1997) -0.00040 -3.65 0.0004 DOY (1998) -0.00004 -0.31 0.7561
SEILI Archipelago Research Institute Publications 3

45
899091929394959697
1997 1998
Wei
ght g
(A)
899091929394959697
Thiessow Zi.Höft
Wei
ght g
(B)
899091929394959697
Males Females
Wei
ght g
(C)
Figure 28. Condition (length-adjusted somatic weight) of Rügen herring. (A) Comparison between years; (B) comparison between sampling regions; (C) comparison between sexes. Covariate-adjusted means and 95% confidence limits are transformed back from logarithmic values. Gonadosomatic index (GSI) The data consisted of fish from two years and two locations, and only developmental stages 4-6 were included in the analysis. The number of individual observations was 420. In addition to the covariate ‘DOY’, ‘Sex’ was the only factor which significantly contributed to the total variation (Table 36). Females had clearly higher GSI than males (Figure 29). The analysis was distorted by non-normality and the residuals were heteroscedastic, which make the probability values unreliable. However, the difference between sexes was rather well distinguishable. Slopes for the covariate were negative and significant: the GSI was higher at the beginning of the season (Table 37). Table 36. Fish gonadosomatic index: The effect of year, region, and sex on the GSI of Rügen herring. Individual model Source of variation df MS F p ω2 A ω2 B Year 1 0.340 2.28 0.132 0.227 0.878 Region 1 0.011 0.08 0.783 0 0 Region x Year 1 0.003 0.02 0.894 0 0 Sex 1 17.904 120.07 0.000 21.093 81.675 Year x Sex 1 0.093 0.62 0.431 0 0 Region x Sex 1 0.002 0.01 0.914 0 0 Region x Year x Sex 1 0.001 0.01 0.936 0 0 DOY x Year (*) 2 2.045 13.72 0.000 4.506 17.447 Residual 410 0.149 74.401 (*) Covariate
Explanatory note: df: degrees of freedom, F: F-value, p: the largest probability for correct H0 (no difference among comparisons), ω2 A: variance component (the proportion of the variation detected), ω2 B: variance component (the proportion of the variation explained by the model).
SEILI Archipelago Research Institute Publications 3

46
Figure 29. Somatic GSI (%) of Rügen herring males and females. Covariate-adjusted means and 95% confidence limits are transformed back from logarithmic values.
Table 37. Fish somatic GSI: ANCOVA results for the covariate (DOY x Year) from the model: slope estimates (β), test statistic (t), and its significance (p). Calculated from log-transformed data.
0
5
10
15
20
25
30
Males Females
Som
atic
GSI
%
Covariate β t p DOY (1997) -0.003 -2.49 0.0133 DOY (1998) -0.008 -4.61 0.0001 Summary The results from Greifswalder Bodden differ from the Airisto results. It is possible that there are spatial differences in fish parameters in Greifswalder Bodden, but a larger data set, with more or less simultaneous sampling from several trap net locations, would be needed to confirm this. There was interannual variation in fish size and condition, but not in the reproductive effort. Two years, however, is too short a period to make firm conclusions. The condition and reproductive effort of females differed from those of males, so in basic fish sampling also sex should be recorded. The covariate ‘DOY’ (time of sampling), had a strong effect in all analyses. It is therefore important that fish sampling is timed correctly and sampling is continued through the spawning season. 5.2.3. Comparison between two nearby spawning areas (Airisto – Mynälahti) Two nearby areas, Airisto and Mynälahti Bay (see Figure 2), were compared to estimate the magnitude of variation in fish parameters between these two localities, which both are important reproductive areas for herring. The data were collected in 1997 and consisted of 32 samples and 4653 fish, of which 7 samples and 1048 fish originated from the Mynälahti Bay. Age determinations were available from only 1043 fish; five samples from Airisto and two from Mynälahti. For the analysis, Airisto was divided into three regions (see Figure 12), and Mynälahti was treated as the fourth region. The analysis was made with the individual-based model introduced in the previous section for four response variables: length, somatic weight, age and gonadosomatic index. ‘Region’ was used as a main effect, and ‘Sample’ was defined as a random effect and nested within ‘Region’. When analysing somatic weight and GSI, also effect ‘Sex’ was included in the model, because the Airisto analysis had suggested sex-dependent differences in those parameters. Logarithmic transformation (natural logarithm, ln) was applied to response variables, with the exception of somatic GSI, to meet the prerequisites of ANOVA. Normality and homogeneity of variances were tested as described in the section 4.7.1. If the assumptions were violated, this mentioned in the results.
SEILI Archipelago Research Institute Publications 3

47
Length Fish length was analysed with sampling date, ‘DOY’, as a covariate in the model. The results indicated no differences in fish length among regions (Table 38). The largest difference in covariate-adjusted fish length was between northern Airisto and Mynälahti (ca 0.2 cm longer fish in Mynälahti), but this was not statistically significant. Table 38. Fish length: The effect of region. Results from ANCOVA.
Individual model
Source of variation
df
MS
F
p Region 3 0.0010 2.45 0.078Sample(Region) 27 0.04DOY
0.0004 1.0001 0.2448 22.34 0.000
Residual 4621 0.0109 Age
Table 39. Fish age: The effect of region. Results from ANOVA.
Source of variation
Fish age was tested without the covariate ‘DOY’, because the Airisto analysis had indicated that ‘DOY’ was insignificant with regard to fish age in 1997. As with fish length, there were no significant differences among regions in fish age (Table 39). The largest deviation, again, was between northern Airisto and Mynälahti; fish were 0.5 years older in Mynälahti Bay.
Individual model
df
MS
F
p Region 0.0773 0.0074 4.23Sample(Region) 5
0.11660.0018 0.02 1.000
Residual 1034 Somatic weight Somatic fish weight was analysed using ‘DOY’ as a covariate. The analysis indicated significant regional differences (Table 40): the average somatic weight was less in northern and central Airisto than in Mynälahti (Figure 30). The residuals were not normally distributed, but the variances were homogeneous.
Table 40. Fish somatic weight: The effect of region. Results from ANCOVA.
Individual model Source of variation
df
MS
F
p
Region 3 0.0312 5.49 0.004Sex 1 0.0132 2.32 0.128Region x Sex 3
1.0000.0043 0.76 0.518
Sample(Region) 27 0.0057 0.06DOY 1 2.0503 20.38 0.000Residual 4616 0.1006
SEILI Archipelago Research Institute Publications 3

48
20
22
24
26
28
30
32
Airisto (S) Airisto (C) Airisto (N) Mynä
Region
Som
atic
wei
ght (
g)
Figure 30. Average somatic weight in analysed four regions: southern, central and northern Airisto (S, C, and N), and Mynälahti Bay (Mynä). Covariate-adjusted mean and 95 % confidence interval presented.
Only gonad stages 4-6 were included in the analysis, which was made without the covariate ‘DOY’. The data consisted of 30 samples and 2233 fish. Test results did not indicate regional differences (Table 41), but GSI was considerably higher in females than in males (Figure 31). The interaction ‘Region x Sex’ was also significant (Table 41): the magnitude of the difference between sexes varied among regions, although it was always significant.
Table 41. Fish somatic GSI: The effect of region. Results from ANOVA.
GSI
Individual model Source of variation
df
MS
F
p
Region 3 0.0337 0.03 0.993Sex 1 1299.3 1155 0.000Region x Sex 3 10.499 9.34 0.000Sample(Region) 27 1.1241 0.98 0.497Residual 2196 1.5022
Figure 31. Average somatic GSI of spawning (gonad stage 4-6) male and female herring in southern, central and northern Airisto (S, C, and N) and Mynälahti Bay. Mean and 95% confidence interval presented.
5
10
15
20
25
30
Region
Som
atic
GSI
%
MalesFemales
Airisto (S) Airisto (C) Airisto (N) Mynälahti
Summary The spawning herring in Mynälahti Bay resemble the fish of Airisto in length, age, and GSI. Somatic weight, however, is significantly greater in Mynälahti, which implicates that the fish spawning in Mynälahti have higher somatic condition. These results, however, should be considered only preliminary. More data is needed to obtain accurate description about the reproductive parameters of herring from Mynälahti Bay.
SEILI Archipelago Research Institute Publications 3
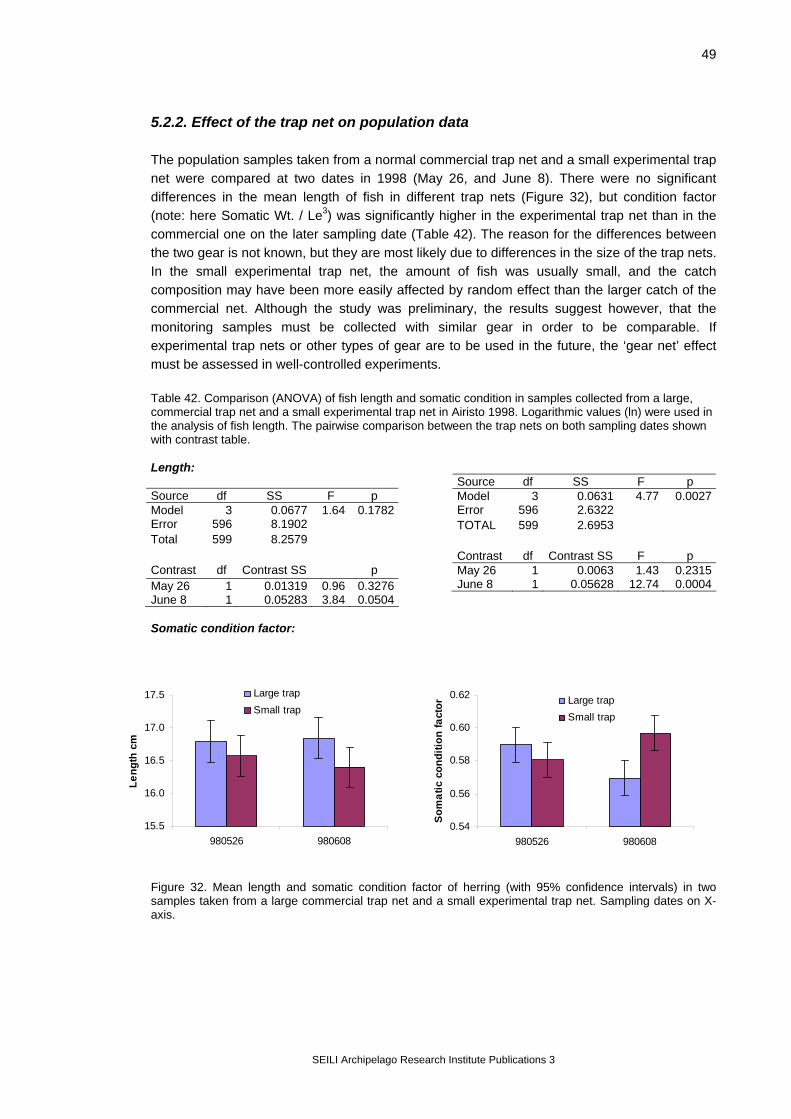
49
5.2.2. Effect of the trap net on population data The population samples taken from a normal commercial trap net and a small experimental trap net were compared at two dates in 1998 (May 26, and June 8). There were no significant differences in the mean length of fish in different trap nets (Figure 32), but condition factor (note: here Somatic Wt. / Le3) was significantly higher in the experimental trap net than in the commercial one on the later sampling date (Table 42). The reason for the differences between the two gear is not known, but they are most likely due to differences in the size of the trap nets. In the small experimental trap net, the amount of fish was usually small, and the catch composition may have been more easily affected by random effect than the larger catch of the commercial net. Although the study was preliminary, the results suggest however, that the monitoring samples must be collected with similar gear in order to be comparable. If experimental trap nets or other types of gear are to be used in the future, the ‘gear net’ effect must be assessed in well-controlled experiments.
Table 42. Comparison (ANOVA) of fish length and somatic condition in samples collected from a large, commercial trap net and a small experimental trap net in Airisto 1998. Logarithmic values (ln) were used in the analysis of fish length. The pairwise comparison between the trap nets on both sampling dates shown with contrast table.
Length:
Source df SS F p Model 3 0.0677 1.64 0.1782Error 596 8.1902 Total 599 8.2579 Contrast df Contrast SS p May 26 1 0.01319 0.96 0.3276June 8 1 0.05283 3.84 0.0504 Somatic condition factor:
Source df SS F p Model 3 0.0631 4.77 0.0027Error 596 2.6322 TOTAL 599 2.6953
Contrast df Contrast SS F p May 26 1 0.0063 1.43 0.2315June 8 1 0.05628 12.74 0.0004
15.5
16.0
16.5
17.0
17.5
980526 980608
Leng
th c
m
Large trapSmall trap
0.54
0.56
0.58
0.60
0.62
980526 980608
Som
atic
con
ditio
n fa
ctor Large trap
Small trap
Figure 32. Mean length and somatic condition factor of herring (with 95% confidence intervals) in two samples taken from a large commercial trap net and a small experimental trap net. Sampling dates on X-axis.
SEILI Archipelago Research Institute Publications 3

50
5.3. Seasonal effects in population parameters The statistical analysis of Airisto herring (see chapter 5.2. above) showed that spawning time (covariate 'DOY' in the analyses) explained best the variation in the population parameters. This indicates that parameters, e.g., reproductive characteristics may vary during the spawning season. To design a sampling scheme and to interpret the data collected, knowledge of the pattern of variation is essential and, therefore, the seasonal effect in reproductive properties was investigated in males and females separately. The results are presented as separate study reports in the Annexes 4-7:
Annex 4 : Rajasilta et al. (1997). Reproductive characteristics of the male herring in the northern Baltic Sea. - J. Fish. Biol. 51: 978-988 Annex 5: Laine & Rajasilta (1998). Changes in the reproductive properties of Baltic herring females during the spawning season. - Fisheries Research 36: 67-73. Annex 6: Rajasilta et al. Ovarian weight of the Baltic herring (Clupea harengus membras) in relation to spawning time in the Archipelago Sea, northern Baltic. (submitted) Annex 7. Laine, P. & Rajasilta, M. (1999) The hatching success of Baltic herring eggs and its relation to female condition. - J. Exp. Mar. Biol. Ecol. 237: 61-73.
In female herring, relative fecundity (fecundity / fish weight), fecundity index (100 x fecundity / length 3) and egg weight did not vary significantly during the spawning season. The quality of the sexual products varied between years and between individuals in the females, and between season in both sexes. The variation was connected with fish condition and temperature of the sea water at time of spawning.
In some years, the gonad fresh weight decreased towards the end of the spawning season in both sexes. However, e.g. in 1990, the ovarian weight first decreased with female length, but at the end of June (DOY 178) it started to increase again, although fish length further decreased (Figure 33). In the population data from the years 1988-91 and 1998, the piecewise regression analysis (described in Annex 5) suggested a breakpoint date for the ovarian weight between the dates June 14 and June 30. The ovarian pattern was connected with the temperature conditions of the season and onset of zooplankton production.
Figure 33. Ovarian weight and length of herring females (mean in the sample) during the spawning season in 1990 in Airisto (DOY = day-of-the-year). Lines fitted according to linear regression (length) or piecewise regression analysis (gonad wt).
Females
0
5
10
15
20
25
100 120 140 160 180 200 220 240
DOY
Length (cm)
Gonw t (g)
5.4. Herring spawning time and intensity of spawning
SEILI Archipelago Research Institute Publications 3

51
In 1987-93, herring spawning started on the average on DOY 126 (day-of-the-year; running date from January 1; about May 6) in Airisto, as could be concluded from the diving observations and the developmental stage of eggs collected in the area. The first spawning date was not constant over the years, however, as there was a difference of almost three weeks between the earliest date (April 24 = DOY 114) and the latest date (May 13 = DOY 133) when spawning started. Earlier observations (Rajasilta et al. 1996) suggest that spawning is postponed when the spawning season is preceded by a cold winter and vice versa. This was supported by a positive correlation between the severity of the winter and the date of first spawning in Airisto (Spearman rank correlation coefficient rs= 0.635; p<0.05; see Figure 34). High variation in the first spawning date after mild winters (Figure 34) shows that winter severity is not the only factor affecting the onset of spawning. However, the relationship between the two parameters suggests, that all sampling of herring which aims at covering the whole spawning season should be started earlier after a mild winter than after a severe one.
Figure 34. Relationship between onset of spawning (DOY=day-of-the-year) and severity of winter (expressed as the maximum extent of ice cover in the Baltic Sea; statistics of the Finnish Institute of Marine Research, FIMR) in 1987-1997. rs=Spearman rank correlation coefficient.
Cumulative trap net catches of herring from 1982-93 in Airisto indicate that, once begun, spawning is relatively continuous (Figure 35). There may be some bias in the catch values, due to varying intervals of emptying the gear, but as the diving observations show a similar pattern (Rajasilta et al. 1993) the catches obviously indicate spawning quite well. Herring spawning thus makes a temporal continuum, but the number of fish in the schools is not constant over the season. In some years, peak spawning takes place in May, while in others, the peak is in June (Rajasilta et al. 1993). Also this pattern is influenced by the severity of the winter preceding the spawning season, as shown by the relationship between ice conditions and herring trap net catches in spring and early summer in 1982-93 in Airisto (Figure 36). The correlation was negative and significant (rs= -0.883; p<0.001; N=11), indicating that a more herring spawn early after a mild winter than after a normal or cold one. The division into early (May 1 - June 16) and late (from June 16 onwards) spawning was made according to the breakpoint date suggested by the piecewise regression analysis for the ovarian weight (between June 14 and June 30; see Figure 33 and Annex 6).
110
115
120
125
130
135
140
0 100 200 300 400 500
Max. extent of ice cover x 1000 km²
DOY
rs = 0.635; p<0.05
SEILI Archipelago Research Institute Publications 3
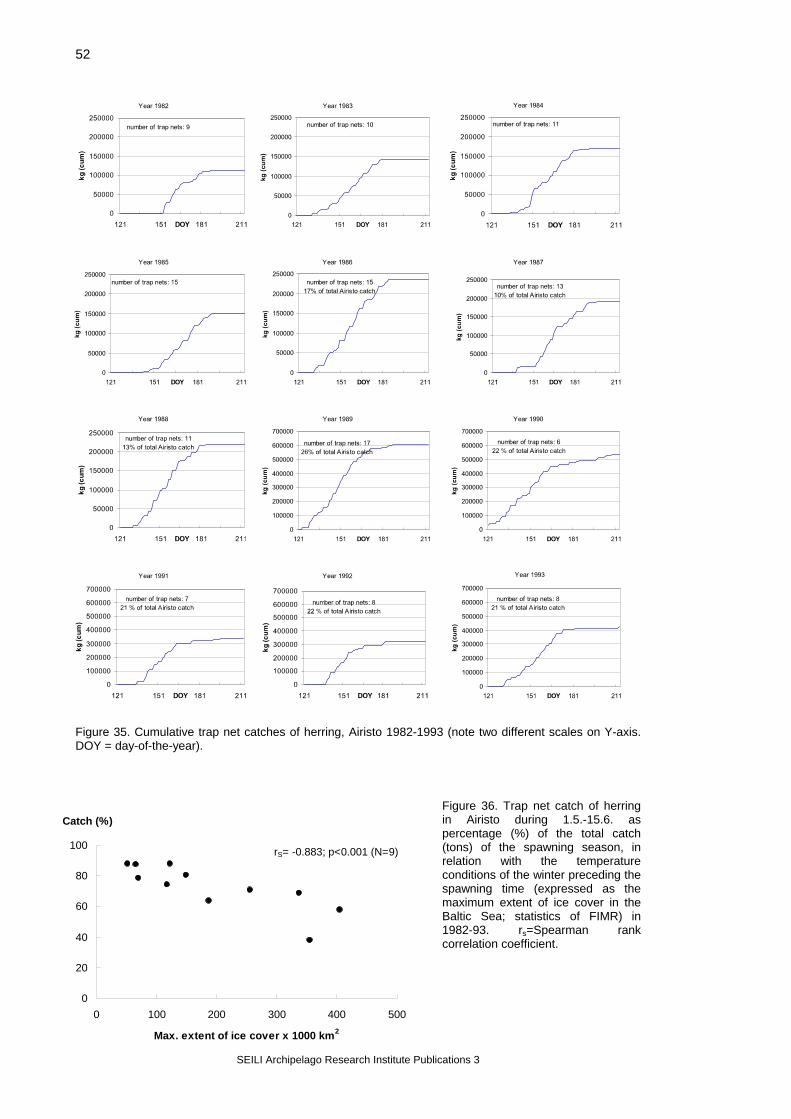
SEILI Archipelago Research Institute Publications 3
52
Figure 35. Cumulative trap net catches of herring, Airisto 1982-1993 (note two different scales on Y-axis. DOY = day-of-the-year).
Figure 36. Trap net catch of herring in Airisto during 1.5.-15.6. as percentage (%) of the total catch (tons) of the spawning season, in relation with the temperature conditions of the winter preceding the spawning time (expressed as the maximum extent of ice cover in the Baltic Sea; statistics of FIMR) in 1982-93. rs=Spearman rank correlation coefficient.
Catch (%)
0
20
40
60
80
100
0 100 200 300 400 500
Max. extent of ice cover x 1000 km2
rS= -0.883; p<0.001 (N=9)

53
5.5 Spawning beds and egg mortality 5.5.1. Use of spawning beds
Annex 8. Rajasilta, M., Eklund, J., Jönsson, N., Laine, P. & Lorenz, T. 1998. Present state of the spawning populations and spawning beds of the Baltic herring in a southern (Greifswalder Bodden) and a northern (Archipelago Sea) spawning area. ICES symposium “Brackish Water Ecology”, Helsinki, 1998.
Diving surveys have shown that in the Airisto, herring have used the same spawning beds continuously since the monitoring started in 1981 (Figure 37). In 1981-1998, eggs were found in most places investigated each year, which indicates that the spawning sites of herring have remained constant, in spite of the strong anthropogenic influence in the area.
4 x ..
Year 1 2 3 5 6 7 8 9 10 1981 .. .. .. .. .. .. .. .. 1982 x .. .. .. x x .. .. .. .. 1983 not sampled 1984 x .. .. ..
.. ..
x x x x
x 1997 x x
x x .. .. .. .. 1985 x x .. .. x x x .. .. .. 1986 .. .. .. .. .. x .. .. x 1987 x - .. .. x x x .. .. 1988 x .. .. .. .. x x .. .. .. 1989 x (-) x x x .. x 1990 x .. .. .. x .. .. .. .. 1991 x x x x .. .. .. .. .. .. 1992 x x x x x .. .. .. .. .. 1993 x x x x x .. .. .. .. .. 1994 x x x x x .. x x x x 1995 x x x x x .. .. .. .. .. 1996 x x x x .. .. .. .. x
x x x x x .. .. .. 1998 x x x x x (-) .. .. .. x Figure 37. Diving surveys 1981-1998 of herring spawning beds in Airisto (locations 1-6), Askaistenlahti (7-9) and Paimionlahti (10). Symbols: (x) = eggs found; (..) = not studied; (-) = no eggs found.
In the Greifswalder Bodden, herring eggs have been found in 16 locations (Figure 38). Annual surveys in two of these (3= Zicker Höft; 2= Neu-Reddevitz) have shown that herring has spawned regularly in the same places since 1984.
SEILI Archipelago Research Institute Publications 3
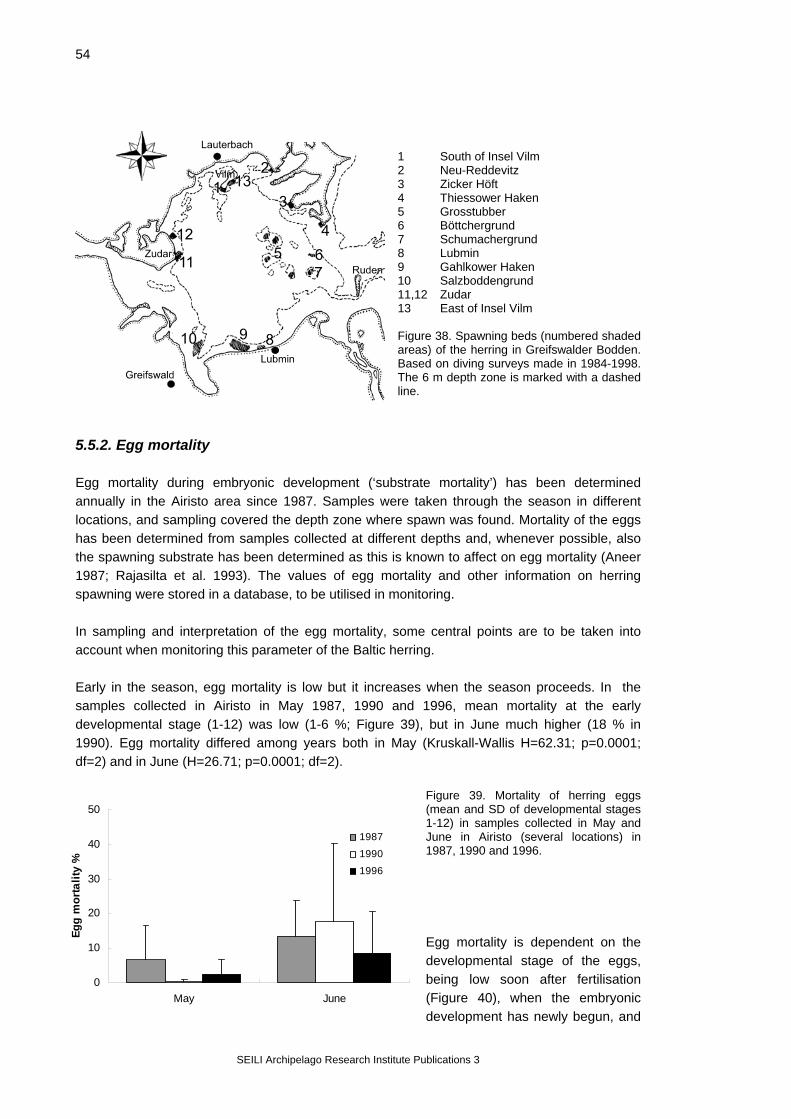
54
1 South of Insel Vilm 2 Neu-Reddevitz 3 Zicker Höft 4 Thiessower Haken 5 Grosstubber 6 Böttchergrund 7 Schumachergrund 8 Lubmin 9 Gahlkower Haken 10 Salzboddengrund 11,12 Zudar 13 East of Insel Vilm Figure 38. Spawning beds (numbered shaded areas) of the herring in Greifswalder Bodden. Based on diving surveys made in 1984-1998. The 6 m depth zone is marked with a dashed line.
Early in the season, egg mortality is low but it increases when the season proceeds. In the samples collected in Airisto in May 1987, 1990 and 1996, mean mortality at the early developmental stage (1-12) was low (1-6 %; Figure 39), but in June much higher (18 % in 1990). Egg mortality differed among years both in May (Kruskall-Wallis H=62.31; p=0.0001; df=2) and in June (H=26.71; p=0.0001; df=2).
Figure 39. Mortality of herring eggs (mean and SD of developmental stages 1-12) in samples collected in May and June in Airisto (several locations) in 1987, 1990 and 1996. Egg mortality is dependent on the developmental stage of the eggs, being low soon after fertilisation (Figure 40), when the embryonic development has newly begun, and
5.5.2. Egg mortality Egg mortality during embryonic development (‘substrate mortality’) has been determined annually in the Airisto area since 1987. Samples were taken through the season in different locations, and sampling covered the depth zone where spawn was found. Mortality of the eggs has been determined from samples collected at different depths and, whenever possible, also the spawning substrate has been determined as this is known to affect on egg mortality (Aneer 1987; Rajasilta et al. 1993). The values of egg mortality and other information on herring spawning were stored in a database, to be utilised in monitoring. In sampling and interpretation of the egg mortality, some central points are to be taken into account when monitoring this parameter of the Baltic herring.
0
10
20
30
40
50
May June
Egg
mor
talit
y %
1987
1990
1996
SEILI Archipelago Research Institute Publications 3

55
increasing with the progress of the embryonic development (Figure 41). Sometimes, however, high mortalities are found already in the beginning of the embryonic development. For instance, in 1998, such a situation was observed in the Paimionlahti bay (Location 10; see Figure 37) and in the Greifswalder Bodden, in both cases late in the spawning season (Figure 42 and Figure 43). Quite obviously, egg mortality indicates both direct and indirect effects of the environment, depending on the developmental stage of the embryo. In samples collected within some days after fertilisation, when eggs have been exposed to environmental disturbances for only a short time, low mortality due to direct environmental influence is expected - especially if the water temperature is low and the embryo metabolism consequently slow. However, the reproductive success of fish can be affected also by indirect environmental influence, through contamination of females by toxic substances such as heavy metals or PCB. High egg mortality in the early phases of embryonic development is probably due to a maternal effect. For instance, PCB compounds of the female are transferred to eggs with lipids, which are deposited into ovarian mass during gonadal development. When utilising the lipid reserves of the yolk mass, the embryo may receive a dose of PCB which impedes its normal development. If the concentration of PCB in females is high, also egg mortality is likely to increase. In our samples, high early stage mortality in the Paimionlahti bay (> 70 % at DOY 157 and 165 Figure 42) and the Greifswalder Bodden (100 % at DOY 118 Figure 43) could be due to a high contamination of the herring females, by PCB or other toxic substances.
Figure 40. Airisto: Mortality of herring eggs (mean and SD in the samples from Location 1 see Figure 37) during early embryonic stage (2-12) in the depth zone of 2-3 m between May 7 (=DOY 127) and June 28 (=DOY 179) in 1998. DOY= day-of-the-year. (Kohonen et al. 1999).
It should be noted, moreover, that the apparent egg mortality in samples collected on the spawning beds does not accurately reflect the total mortality of eggs in the spawning area. After the embryo has died, the egg is detached from the substrate and easily washed away by waves and water currents, and eggs are also eliminated by predation. The observations made in Airisto over the years suggest that the majority of herring eggs deposited in this area are eliminated before hatching. Total mortality has apparently increased during 1987-1998, being ca 100 % in some spawning locations at present (Kohonen et al. 1999). As the diving surveys and determinations of egg mortality have been carried out only in such places which are heavily loaded by human activities, it is not known if this situation is found also in areas where environmental pollution is smaller. Quite obviously, reproduction of the Baltic herring is seriously threatened by contamination of the environment, which acts both directly and indirectly.
0
10
20
30
40
50
127 129 149 151 163 177 179
DOY
Egg
mor
talit
y %
SEILI Archipelago Research Institute Publications 3

56
Figure 41. Airisto: Mortality of herring eggs (mean and SD in the samples from Location1, see Figure 37) during late embryonic stage (>14) in the depth zone of 2-3 m between 15 May (=DOY 135) and 8 June (=DOY 159) in 1998. DOY= day-of-the-year. (Kohonen et al. 1999).
Figure 42. Paimionlahti Bay: Mortality of herring eggs during early embryonic stage (2-8) in depth zone 2-3 m between May 7 (=DOY 127) and June 14 (=DOY 165) in 1998. DOY= day-of-the-year. (Kohonen et al. 1999).
Figure 43. Greifswalder Bodden: Mortality of herring eggs (mean and SD in the samples) during early embryonic stage (2-12) between March 24 (=DOY 83) and April 24 (=DOY 118) in 1998. Egg samples were collected from the same depth zone (3.5-4 m) from Fucus vesiculosus. DOY=day-of-the-year.
0
20
40
60
80
100
135 141 153 155 159
DOY
Egg
mor
talit
y %
0
20
40
60
80
100
127 129 147 157 165
DOY
Egg
mor
talit
y %
0
20
40
60
80
100
83 83 83 90 97 118DOY
Egg
mor
talit
y %
5.5.3. State of spawning beds The Baltic herring deposits its eggs predominantly on aquatic vegetation. Herring shows no particular preferences in the choice of spawning substrates, but eggs have been found on most plant species occurring in the Baltic Sea (Aneer 1989). The plant species growing on the bottom do not determine whether herring spawns in a given location or not (Kääriä et al. 1998). Instead, the availability of bottom area covered by vegetation plays a major role in herring spawning. In the innermost parts of the Archipelago Sea, the original hard bottoms with rich algal vegetation have been replaced by soft sediments and monotypic stands of Phragmites. In these areas, herring spawning has strongly decreased or ceased (Kääriä et al. 1988), demonstrating that increasing sedimentation is a severe risk to herring reproduction. With reducing vegetation, the bottoms suitable for spawning decrease which forces herring to change their spawning area. In the beginning of the sedimentation process, fish may seek for suitable bottoms in other
SEILI Archipelago Research Institute Publications 3

57
parts of the spawning area, where reproduction then continues with an increasing intensity. Later, when the spawning beds are permanently covered by soft sediments, the spawning tradition is discontinued. In the trap net fishery, this causes a decrease of herring catch in the disturbed area and an increase of it in the less disturbed one (Kääriä et al. 1988). This brings problems for the fishery, if the new spawning areas are not available or suitable for trap net fishery. The change of spawning from the innermost parts of river estuaries to the outer parts may also have adverse effects on the reproductive success of the species e.g. at the larval phase, but these effects are largely unknown. In both spawning areas, Airisto and the Greifswalder Bodden, increasing sedimentation makes a current risk for herring reproduction. In the Greifswalder Bodden, the macrophyte cover of the bottoms has decreased during the past 20 years, being only 5-10 % of the total bottom area at present. High load of nutrients especially from the river Oder increases the primary production which leads to high water turbidity in the area. This, in turn, prevents penetration of light into water so that vegetation disappears from the deeper bottoms. In Airisto, a high load of clay particles, largely originating from the dumping of dredging spoils into the sea, increase the water turbidity and decrease visibility in the water. Because of this, the area covered by macroscopic vegetation has decreased during the past ten years (Kohonen et al. 1999). In some of the herring spawning beds, clay particles have accumulated on the bottoms so that original hard bottoms are now covered by soft sediments. Concurrently, the species composition of the plant community has changed so that perennial algae are replaced by ephemeral fresh water plants like Potamogeton perfoliatus. This process leads also to reduction of the area of the spawning beds, as most fresh water plants start to grow only in July, when herring spawning is mostly over. In such bottoms, fish find no spawning substrate at that time of the season when they spawn.
In the phylogenetic tree constructed on the basis of mtDNA control region sequencing, the individuals from different areas of the Baltic Sea were scattered between different branches of the tree, without any internal hierarchy (Figure 44). The analysis of molecular variance (AMOVA; Schneider et al. 1997) between Rügen and Airisto populations showed, that 100 % of the variation in the mtDNA control region was explained by differences among individuals, and no differentiation between the sampling locations could be found. Although the number of haplotypes was high, some individuals were found which originated from the same maternal lineage (Table 43). They came in the same year from different parts of the Baltic Sea (Rügen and Airisto/1998), from the same spawning area but in different years (1990 and 1998/Airisto) and in the same spawning area in the same year but from different spawning locations (J and K in Airisto/1990). Fish were also different in length, despite that they originated from the same maternal lineage and were similar in age. For instance, the fish collected in the Airisto in 1990 (June 5 and June 8) were both 4 years old but they differed in length by 1.3 cm.
Table 43. The haplotypes (maternal lineages) shared by two or more individuals of Baltic herring by sampling date and location (J, K, and S). N of fish analysed = 77.
5.6. Genetic studies 5.6.1. MtDNA
SEILI Archipelago Research Institute Publications 3
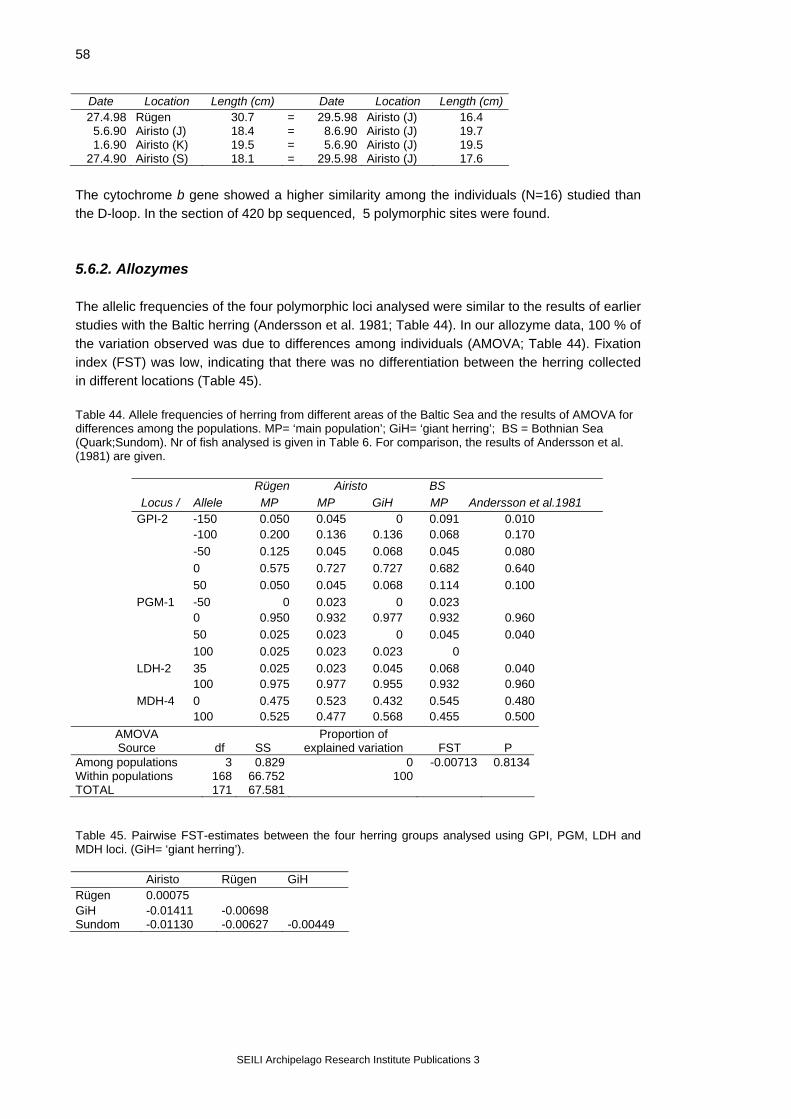
58
Date Location Length (cm) Date Location Length (cm)27.4.98 Rügen 30.7 = 29.5.98 Airisto (J) 16.4 5.6.90 Airisto (J) 18.4 = 8.6.90 Airisto (J) 19.7 1.6.90 Airisto (K) 19.5 = 5.6.90
Airisto (J) Airisto (J) 19.5
27.4.90 Airisto (S) 18.1 = 29.5.98 17.6 The cytochrome b gene showed a higher similarity among the individuals (N=16) studied than the D-loop. In the section of 420 bp sequenced, 5 polymorphic sites were found. 5.6.2. Allozymes The allelic frequencies of the four polymorphic loci analysed were similar to the results of earlier studies with the Baltic herring (Andersson et al. 1981; Table 44). In our allozyme data, 100 % of the variation observed was due to differences among individuals (AMOVA; Table 44). Fixation index (FST) was low, indicating that there was no differentiation between the herring collected in different locations (Table 45). Table 44. Allele frequencies of herring from different areas of the Baltic Sea and the results of AMOVA for differences among the populations. MP= ‘main population’; GiH= ‘giant herring’; BS = Bothnian Sea (Quark;Sundom). Nr of fish analysed is given in Table 6. For comparison, the results of Andersson et al. (1981) are given.
Rügen Airisto BS Locus / Allele MP MP GiH MP Andersson et al.1981
GPI-2 -150 0.050 0.045 0 0.091 0.010 -100 0.200 0.136 0.136 0.068 0.170 -50
0
00.0230.045
explained variation
0.125 0.045 0.068 0.045 0.080 0 0.575 0.727 0.727 0.682 0.640
50 0.050 0.045 0.068 0.114 0.100 PGM-1 -50 0 0.023 0.023 0 0.950 0.932 0.977 0.932 0.960 50 0.025 0.023 0.045 0.040 100 0.025 0.023 0 LDH-2 35 0.025 0.023 0.068 0.040 100 0.975 0.977 0.955 0.932 0.960 MDH-4 0 0.475 0.523 0.432 0.545 0.480 100 0.525 0.477 0.568 0.455 0.500
AMOVA Source
df
SS
Proportion of FST
P
Among populations 3 0.829 0 -0.00713 0.8134Within populations 168 66.752 100TOTAL 171 67.581 Table 45. Pairwise FST-estimates between the four herring groups analysed using GPI, PGM, LDH and MDH loci. (GiH= ‘giant herring’).
GiH Airisto Rügen Rügen 0.00075 GiH -0.01411 -0.00698 Sundom -0.01130 -0.00627 -0.00449
SEILI Archipelago Research Institute Publications 3

59
Figure 44. Phylogenetic 'tree' of the Baltic herring, constructed by the mtDNA control region, and rooted with a sequence of Atlantic herring (Lee et al. 1995). RU= Rügen; JAR= Airisto 1998; GRO= Airisto 1990; GIH= 'giant herring’ from Airisto; SUN= Quark, Bothnian Sea; OVA= ovary.
SEILI Archipelago Research Institute Publications 3

60
The relationship between otolith radius length and fish length was linear, although the relationship between otolith length and height (otolith shape) did change with fish length. Linear growth of otolith dimensions support the supposed validity of age and growth estimates from the otoliths. The high variation between age estimates and the lack of validation limit the usefulness of age estimates for population monitoring.
5.7.2. Feeding and growth of herring in different salinities
The density of fish in the test tanks varied slightly in the beginning of the experiment, because fish number could only be estimated when fish were transferred to the test tanks, in order to avoid handling stress. During the experiment, different mortality rates among the tanks changed the situation so that the highest terminal density was found in the highest salinity (Figure 45). Mortality was high (75 %) in the lowest salinity, but clearly lower in the most saline tank (48 %; Figure 45). This difference could not be due to overcrowding, however, as the water volume was relatively high with respect to estimated fish biomass in all tanks in the beginning of the
5.7. Studies on age and growth 5.7.1. Comparison of otolith and scale age A comparison of otolith and scale age estimates showed linear relationship between the estimates. However, mean scale age was smaller than the nominal otolith age for fish older than about 5 years and confidence limits were wide both for old fish (nominal age>8) and the youngest age group (nominal age 2). The variation and degree of bias varied between geographical areas. The results agree with those presented by Kornilovs & Fetter (1996) for Baltic herring scale and otolith ages. In contrast, Messieh & Tibbo (1970) reported that, in Atlantic herring, scale ages were higher than those from the otolith. Otolith age estimates by different readers were also linearly related, as were consecutive estimates by the same reader. There was, however, bias between readers, bias between consecutive readings, and in both cases, variation between readings was high – indeed of the same magnitude as between otolith and scale ages. The high variation between readers has been documented also in the ICES Baltic herring age-reading study group (ICES 1998).
Results are presented more fully in the study reports in Annexes 9-10:
Annex 9: Eklund, J., Aneer, G. & Parmanne, R. 1998: Between-reader variation in herring otolith ages and effects on estimated population parameters. 2nd International Symposium on Fish Otolith Research and Application, Bergen, 1998 Annex 10: Eklund, J. 1999. Herring growth and age estimation from otoliths and scales.
Feeding and behaviour Salinity clearly affected the schooling behaviour of the herring juveniles in the test tanks. At low salinity (5.7 and 8 psu), the fish were scattered around the tank, they were timid and sought for shadowed areas in the tank. At higher salinity (12 and 15 psu), the fish formed a dense school immediately upon being introduced into the tank, and kept swimming around the tank in the same formation during the experiment. It appeared, that the fish did also not respond to movement or lights in the laboratory hall.
SEILI Archipelago Research Institute Publications 3

61
experiment (ca 400-600 g /100 l), and the biomass further declined with time, being 200-300 g /100 l at the end of the experiment.
In all test tanks, fish were feeding, as shown by the amount of fat in the body cavity at the end of the experiment (Table 46). Significant differences in the amount of intestinal fat were, however, found among salinites (Kruskall-Wallis' H= 20.822; p= 0.037; df=3). The fat values were similar in the two lowest (5.7 and 8 psu; Mann-Whitney's z= 1.3; p=0.194) and the two highest (12 and 15 psu; z= 1.508; p=0.132) salinity tanks. In the low salinity group (groups 5.7 and 8 combined), most individuals (52 %) had a small amount of fat (1 on a relative scale) on the surface of the intestine, and rich deposits (3 on a relative scale) were found only in 24 % of the surviving fish (Figure 45). In the high salinities (groups 12 and 15 combined), a majority of the fish (77 %) had rich fat deposits in the body cavity. The amount of fat was significantly lower in fish kept at low salinity (mean=1.7; SD=0.9; N=19) than in those kept at high salinity (mean=2.7; SD=0.5; N=35; z= 3.275; p=0.001). Variation in visceral fat among individuals was higher at low salinities than at high salinities (Figure 45). Table 46. Mean length, weight, condition factor, amount of visceral fat (relative scale 0-3) and scale growth (counts/mm2) of the herring juveniles in different salinties at the end of the experiment 1.
S A L I N I T Y psu Parameter 5.7 8 12 15 Length (mm) 83.1 89.1 89.4 91.8Weight (g) 34.5 41.1 46.8 47.6Condition factor 0.577 0.564 0.650 0.597Visceral fat 1.6 1.7 3.0 2.6Scale growth 3.487 5.356 5.001 2.578
0
20
40
60
80
100
0 1 2 3Amount of fat
%
LOW
HIGH
LOW: x = 1.7; SD = 0.9; N = 19HIGH: x = 2.7; SD = 0.5; N = 35
0
20
40
60
5.7 8 12 15
N1N2
Nr fish
Salinity
Figure 45. Left panel: the number of fish at the start (N1) and end (N2) of the experiment. Right panel: amount of visceral fat (relative scale 0-3) in herring juveniles reared in low (5.7-8 psu) and high (12-15 psu) salinity with equal amount of food; for each fat class and salinity, the percentage of fish is given.
The scale growth (measured as the amount of incorporated radioactive glycine, counts/mm2) increased with increasing salinity, being 3.5 counts/mm2 in 5.7 psu and 5.0 counts/mm2 in 12 psu (Table 46). In the highest salinity (15 psu) it decreased again to 2.6 counts/mm2. Because fish were clearly larger in this salinity (mean 92 mm), it is obvious that their scale growth
Growth
SEILI Archipelago Research Institute Publications 3
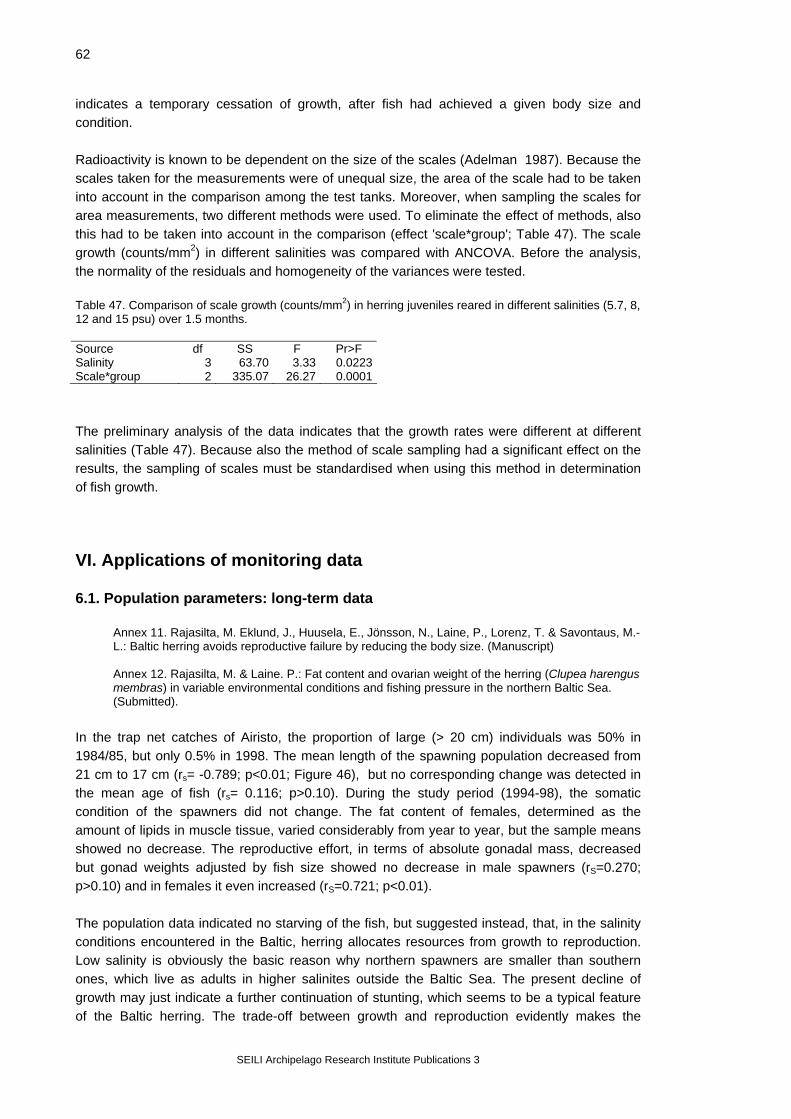
62
indicates a temporary cessation of growth, after fish had achieved a given body size and condition. Radioactivity is known to be dependent on the size of the scales (Adelman 1987). Because the scales taken for the measurements were of unequal size, the area of the scale had to be taken into account in the comparison among the test tanks. Moreover, when sampling the scales for area measurements, two different methods were used. To eliminate the effect of methods, also this had to be taken into account in the comparison (effect 'scale*group'; Table 47). The scale growth (counts/mm2) in different salinities was compared with ANCOVA. Before the analysis, the normality of the residuals and homogeneity of the variances were tested. Table 47. Comparison of scale growth (counts/mm2) in herring juveniles reared in different salinities (5.7, 8, 12 and 15 psu) over 1.5 months. Source df SS F Pr>F Salinity 3 63.70 3.33 0.0223Scale*group 2 335.07 26.27 0.0001 The preliminary analysis of the data indicates that the growth rates were different at different salinities (Table 47). Because also the method of scale sampling had a significant effect on the results, the sampling of scales must be standardised when using this method in determination of fish growth.
VI. Applications of monitoring data
In the trap net catches of Airisto, the proportion of large (> 20 cm) individuals was 50% in 1984/85, but only 0.5% in 1998. The mean length of the spawning population decreased from 21 cm to 17 cm (rs= -0.789; p<0.01; Figure 46), but no corresponding change was detected in the mean age of fish (rs= 0.116; p>0.10). During the study period (1994-98), the somatic condition of the spawners did not change. The fat content of females, determined as the amount of lipids in muscle tissue, varied considerably from year to year, but the sample means showed no decrease. The reproductive effort, in terms of absolute gonadal mass, decreased but gonad weights adjusted by fish size showed no decrease in male spawners (rS=0.270; p>0.10) and in females it even increased (rS=0.721; p<0.01).
6.1. Population parameters: long-term data
Annex 11. Rajasilta, M. Eklund, J., Huusela, E., Jönsson, N., Laine, P., Lorenz, T. & Savontaus, M.-L.: Baltic herring avoids reproductive failure by reducing the body size. (Manuscript) Annex 12. Rajasilta, M. & Laine. P.: Fat content and ovarian weight of the herring (Clupea harengus membras) in variable environmental conditions and fishing pressure in the northern Baltic Sea. (Submitted).
The population data indicated no starving of the fish, but suggested instead, that, in the salinity conditions encountered in the Baltic, herring allocates resources from growth to reproduction. Low salinity is obviously the basic reason why northern spawners are smaller than southern ones, which live as adults in higher salinites outside the Baltic Sea. The present decline of growth may just indicate a further continuation of stunting, which seems to be a typical feature of the Baltic herring. The trade-off between growth and reproduction evidently makes the
SEILI Archipelago Research Institute Publications 3

63
herring's reproductive strategy in low and variable salinity conditions, but it may be that the feature is found only in those herring populations which live or spawn in brackish water. The results of this study, along with other evidence, suggest that herring growth in the Baltic Sea is not dependent on the trophic conditions only as assumed, but primarily on the ambient salinity conditions.
Figure 46. Average length and age of the herring populations in the Archipelago Sea (AS) and Rügen (RU) in 1984-98; long-term variation in the salinity of the Baltic Sea (measuring points Gotland deep GOT, 20 m depth, and Archipelago Sea, AS, 20 m depth) and the sea surface temperature in AS (temperature sum of daily recordings). Gonad weight, weight-adjusted gonad weight and somatic condition of spawning herring females and males and fat content of dorsal muscle in females in the Archipelago Sea. Values based on less than five samples in the population data are marked with dashed circles; total number of fish is given in parenthesis.
SEILI Archipelago Research Institute Publications 3
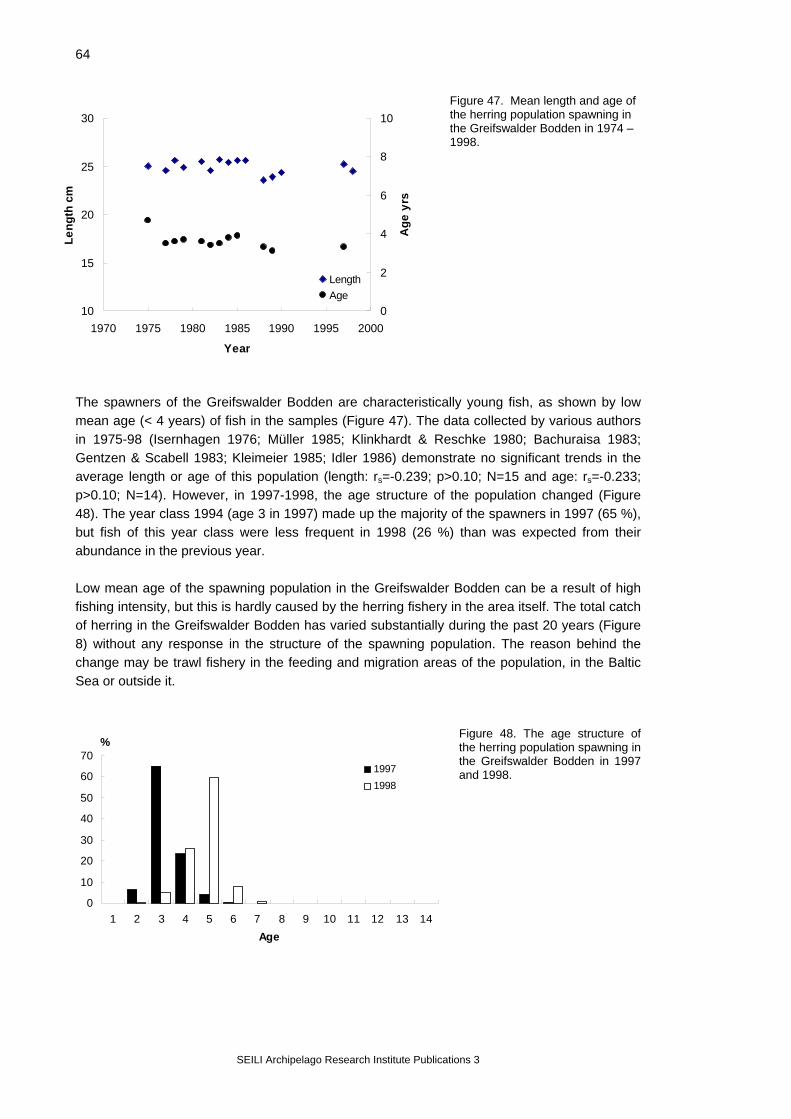
64
Figure 47. Mean length and age of the herring population spawning in the Greifswalder Bodden in 1974 – 1998.
The spawners of the Greifswalder Bodden are characteristically young fish, as shown by low mean age (< 4 years) of fish in the samples (Figure 47). The data collected by various authors in 1975-98 (Isernhagen 1976; Müller 1985; Klinkhardt & Reschke 1980; Bachuraisa 1983; Gentzen & Scabell 1983; Kleimeier 1985; Idler 1986) demonstrate no significant trends in the average length or age of this population (length: rs=-0.239; p>0.10; N=15 and age: rs=-0.233; p>0.10; N=14). However, in 1997-1998, the age structure of the population changed (Figure 48). The year class 1994 (age 3 in 1997) made up the majority of the spawners in 1997 (65 %), but fish of this year class were less frequent in 1998 (26 %) than was expected from their abundance in the previous year.
Low mean age of the spawning population in the Greifswalder Bodden can be a result of high fishing intensity, but this is hardly caused by the herring fishery in the area itself. The total catch of herring in the Greifswalder Bodden has varied substantially during the past 20 years (Figure 8) without any response in the structure of the spawning population. The reason behind the change may be trawl fishery in the feeding and migration areas of the population, in the Baltic Sea or outside it.
Figure 48. The age structure of the herring population spawning in the Greifswalder Bodden in 1997 and 1998.
10
15
20
25
30
1970 1975 1980 1985 1990 1995 2000
Year
Leng
th c
m
0
2
4
6
8
10
Age
yrs
LengthAge
0
10
20
30
40
50
60
70
1 2 3 4 5 6 7 8 9 10 11 12 13 14Age
%
19971998
SEILI Archipelago Research Institute Publications 3

65
6.2. Changes in the energy reserves of the herring In commercially exploited fish species, growth is often routinely monitored to obtain information on the state of the stocks. It is assumed that growth indicates the size of the stock in relation to available food resources so, that high growth rates are expected in situations where plenty of food is available for fish, and vice versa. In the Baltic herring, growth is used as a management tool accordingly, and the present decline of growth is thought to indicate low abundance and poor quality of the herring's prey in the Baltic Sea (Anonymous 1994). If the growth of herring varies according to salinity conditions (Annex 11 and 12) in the northern Baltic Sea, it will not be a valid indicator of the prey/stock -ratio in area, where salinity is low and fluctuates irregularly through time. Instead of growth, other population parameters more directly connected with feeding, might indicate the condition of the stock better than growth. This possibility was examined using data on muscle fat content, which has been determined annually from the Airisto herring in 1987-97. Like many other fish species in strongly fluctuating environments, herring collects energy when food is available and stores it as lipids in muscles and internal organs, to be used for the build-up and maturation of gonads during times of poor feeding opportunities. The energy reserves in fish tissues thus indicate the feeding conditions experienced by the fish, being high when there is plenty of food available, and low when food is scarce (Wood 1958; Wilkins 1967). In the Airisto herring, we found no signs of fish starvation during the study period 1987-97, but the results suggested, that during the study period (1987-97), herring fishery in the northern Baltic Sea has been intensive enough to affect the partitioning of food resources within the herring population (Annex 12). In the years of high herring catches, large fish had significantly more fat in the muscle tissue than in those years when catches were low (Figure 50). Large and old fish clearly benefited from increased harvesting but despite that, their growth did not improve. For instance in 1987 and 1997 the herring catches in the ICES subdivisions 29-32 were equally high, but fish growth slowed down substantially in all age classes (Figure 49).
Figure 49. Archipelago Sea: Total length at age (2-10 years) of spawning herring in 1987 (N= 569) and 1997 (N=299).
0
5
10
15
20
25
30
1 2 3 4 5 6 7 8 9 10 11 12
Age (years)
Leng
th c
m
Length-87Length-97
SEILI Archipelago Research Institute Publications 3

66
Fi (catch ≤ 66 t a-
1) and high (catch e). Logarithmic values
(natural the comparison of r further information, see
Annex 12.
The fat analyses were usually made of 15-20 individuals taken from one spawning school in May (early spawners) or at the end of June (later spawners) in Airisto. This procedure was adopted on the basis of earlier studies (Rajasilta 1992), which showed that the herring fat content varies depending on the spawning time. Because the annual fat values in our data represent one spawning school in both months only, we analysed the difference among schools with data collected in 1992 and 1998. In 1992, samples were taken within two weeks (May 14 and June 2) in the same spawning location. As shown by Figure 51, the two samples analysed in 1992 could not be separated from each other by the muscle fat content.
Figure 51. Relationship between muscle fat content (% w.wt.) and fish length in spawning herring females in Airisto 1992.
slope se t p>tCatch<66 0.248 0.5121 -2.73 0.007Catch>85 1.992 0.3806
mean se t p>tCatch<66 1.316 0.0655 -0.49 0.624Catch>85 1.356 0.0485
0.0
0.5
1.0
1.5
2.0
2.5
2.5 2.7 2.9 3.1 3.3
Log (length cm)
Log
(mus
cle
fat)
Catch<66Catch>85
(A)
0.0
1.0
2.0
3.0
4.0
5.0
Catch<66 Catch>85
Mus
cle
fat %
N=59 N=106
(B)
gure 50. (A) Dependence of muscle fat content on female length (May spawners) in low ≥ 85 t a-1 ) fishing pressure, and (B) the adjusted means for muscle fat at female length
18.6 cm (from unequal slopes model ANCOVA using fish length as a covariatlogarithm) were used for length and muscle fat in the analysis. The tables show
slopes and adjusted means (at female length 18.6 cm) between the groups. Fo
6.3. Herring fat content in 1998
05
1015202530
10 15 20 25Fish length (cm)
Fat content % (w.wt.)
May 14June 2
SEILI Archipelago Research Institute Publications 3

67
In 1998, when the samples were collected within one week (May 27 and June 4) in Airisto, the two groups could be separated from each other by the muscle fat content (Figure 52). Fish spawning in June had significantly more fat in muscle tissue (mean=5.2 % w.wt.; SD=0.6; N=8) than those spawning some days earlier in May (mean=2.0; SD=3.6; N=11), and their fat content had no relationship with fish length, which was exceptional during the 11 years' study period. The muscle fat content of the Rügen herring was positively correlated with fish length in 1998 (rs = 0.629; p<0.05; N=11; Figure 52), in a similar way as in the Airisto herring in the years of high fishing intensity.
Figure 52. Relationship between muscle fat content (% w.wt) and fish length in spawning herring females in Airisto (AS) and Rügen (RU) in 1998. In the Airisto samples, the symbols denote the sampling dates May 27 and June 4.
In the southern feeding areas (Baltic Proper and Archipelago Sea) of the Airisto herring, a massive and exceptional bloom of blue-green algae occurred in the summer of 1997. The consequences of this bloom for the Baltic food webs are poorly known, but this may cause a decrease in the fat content of zooplankton and, consequently, in herring. In summer 1998, blue-green algae were exceptionally abundant also in Airisto and the fat content of zooplankton during the algal bloom was clearly below the average of the season (Annex 12). Low fat content (1-1.5 % in muscle tissue) in the herring has been reported in the Baltic Proper in 1996 by Bignert & Olsson (1997), which also suggests that the spawning school having a low fat content in May 1998 came from the southern feeding area.
02468
101214
0 10 20 30 40Fish length (cm)
Fat content % (w.wt.)
AS/May27RUAS/June4
Difference in the fat content between the schools in Airisto 1998 may be due to the small sample size, but may also be a result of different feeding conditions experienced by fish in the two spawning schools. As shown by herring taggings, the spawners of Airisto and adjacent spawning areas migrate either to the Gulf of Bothnia or to the Baltic Proper after spawning (Parmanne 1990, Kääriä et al. 1999). In the two basins, herring growth rates differ, reflecting different feeding and growth conditions. In both areas, herring growth has declined but the change has been weaker in the Bothnian Sea than in the Archipelago Sea and Gulf of Finland (Parmanne 1990; Parmanne et al. 1997). A possible explanation is that feeding conditions are better in the Bothnian Sea than elsewhere and that the herring with a high fat content found in the Airisto originate from this area. So far, the fat content of Bothnian Sea herring has not been analysed.
SEILI Archipelago Research Institute Publications 3

68
VII. Proposal for the monitoring programme In the Airisto herring, the following were observed: • long-term changes in the population parameters (especially length) of the spawning
population; • seasonal trends and short-time variation in population parameters; pattern unpredictable • spawning time and intensity of spawning are affected by the temperature
conditions of the preceding winter;
In the sampling strategy, the following points should be included:
• large sample size recommended (see Annex 15)
In the Greifswalder Bodden, a similar sampling strategy could be followed, with exception of the sampling locations. For sampling, trap nets catching spawning fish should be selected; i.e. the trap nets should be situated on the route which herring uses when migrating into the area. This ensures that data on reproductive parameters of fish are also obtained.
• no spatial sub-structuring was found in the spawning population within spawning area; • spawning starts in the northern part of the Airisto spawning area; • trap net size and type affect the estimates of population parameters; • high variation in population parameters • high genetic diversity, no genetic separation from other areas
• annual sampling from the spawning grounds; • frequent sampling over the spawning season; • start of sampling earlier after mild winters than after cold ones • sampling in any location within the spawning area, with exception of the southern part; • commercial trap nets preferable in sampling;
Although the Baltic herring seems not to be genetically differentiated into local sub-populations, the herring from different areas reflect the environmental conditions and fisheries in the adult feeding and overwintering areas. Thus, if the biological monitoring designed by the present project is implemented in the Baltic Sea, more than two sampling locations should be included in the programme. Continuous sampling in 5-6 spawning areas would obviously cover the Baltic stock sufficiently, if the spawning areas represent the main basins of the Baltic Sea from north to south and have at least one sampling location each. The suggested areas are the Bothnian Bay, Bothnian Sea, Archipelago Sea; Gulf of Finland; Baltic Proper and southern Baltic (the Greifswalder Bodden / Rügen). The results of the present study can be used as a basis when planning the monitoring in other areas, but the cases of Airisto and Greifswalder Bodden suggest that e.g. there may be spatial differences in population structure in one area, although they are not found in another. Spatial and temporal variation should therefore be determined in all areas, before the monitoring is started.
SEILI Archipelago Research Institute Publications 3

69
VIII. Current state of the herring stock and spawning grounds In the genetic analyses, no differentiation was found between separate populations of the herring, despite that fish were sampled from geographically distant spawning areas in the Baltic Sea. The spawning behaviour and other reproductive characteristics also support the view that the Baltic herring forms one large sympatric population, where the fish share the same reproductive properties. The Airisto data show that the reproductive strategy of the herring is based on a trade-off between growth and reproduction. This strategy we see as an adaptation to the low-saline environment of the Baltic Sea. The data suggest that in the Baltic Sea, reproduction and growth parameters of the herring are to a high degree determined by salinity. Salinity seems to affect the body size and many other characteristics connected, which may mask the effect of fishing or environmental changes on the population. The reproductive output of the herring, however, is less strongly influenced by salinity than body size, due to the trade-off mentioned above. Thus, decreasing fish size does not necessarily involve a corresponding reduction of reproductive output, because small size of the females may be compensated by higher size-specific fecundity. The southern herring are not affected by the salinity conditions of the Baltic Sea as adults, as the fish migrate outside the Baltic into the higher salinities of the Skagerrak and Kattegat for feeding and growth. In the Rügen herring, the narrow age structure suggests that this population is under heavy fishing pressure. In the Greifswalder Bodden, catches of spawning herring have strongly decreased during the 1990's and are presently on the same level as before the year 1970. There has been no increase in the fishing effort in the Greifswalder Bodden itself during the period. As population parameters other than the narrow age distribution have remained relatively constant, the fishing effort is likely to come from other areas than the spawning grounds. Low and fluctuating salinity has been characteristic to the Baltic Sea since the basin was formed ca 12 000 years ago. The present herring population spawning in the Baltic Sea is evidently composed of such elements of the original, immigrant herring population which have successfully adapted to the variability of the Baltic environment. Decreasing salinity is not a threat to herring reproduction, but may have other effects on the Baltic herring population, such as an increase of natural mortality at adult stage. High variation in all population parameters of the Archipelago Sea herring suggests that the individuals of the herring population are not equally adapted to Baltic conditions. In that case, the less adapted component may eventually be eliminated from the population by low salinity conditions, which results to a decrease in the stock size. Monitoring of egg mortality and state of the spawning beds indicate that the present state of eutrophication, environmental pollutants and other human activities seriously threaten herring reproduction in the Baltic Sea. The tendency to spawn in river estuaries makes the Baltic herring highly vulnerable to environmental disturbances, which accumulate in estuarine areas. In both spawning areas studied, herring spawning has continued uninterruptedly in spite of high load of nutrients, high sedimentation rates, chemical pollution and disturbances caused by ship and boat traffic. Continuation of spawning in conditions which are less favourable for normal development of the embryos, may turn to be fatal to the stock on a long time span. Fish reproduce on their traditional spawning beds despite that the eggs deposited die during the embryonic development. In the study areas, a total destruction of spawn may take place in
SEILI Archipelago Research Institute Publications 3

70
some spawning locations every year, and for instance in Airisto, production of herring larvae is extremely low at present. It is not known how widespread this phenomenon is in the Baltic Sea, and what consequences it has for the stock. Quite obviously, small size of the herring causes problems for herring fishery and fish processing industry in the Baltic Sea as long as salinity is low. In the present situation, continuation of herring trap net fishery is uncertain on the south-western coast of Finland. In the season 1999, most of the fishermen in the Airisto area gave up herring fishery and only one fishing company continued. Herring catches were exceptionally low in the Airisto spawning area in 1997-98, as was the situation also in 1999. The strong decrease of catches indicates that either herring have changed their spawning area or the spawning stock has collapsed. Low profitability of herring fishery, if continued further, probably leads to discontinuation of trap net fishery in the coming years. This means the disappearance of a local tradition, which will have many cultural and socio-economic consequences. In the fisheries sector, this will increase the need for financial aid from the fisheries administration. IX. Organisation of the study Participants and cooperation The study project was carried out by two universities, University of Turku (Finland) and University of Rostock (Germany). Archipelago Research Institute at the University of Turku was the coordinator of the project. State fisheries authorities in both countries were also involved in the project (Landesamt für Fischerei, MV in Germany and Varsinais-Suomen TE-Keskus in Finland). Dr. Ilppo Vuorinen (Archipelago Research Institute, University of Turku) was the leader of the project. At both universities, the study groups employed two scientists in 1997-1999: Dr. Marjut Rajasilta (responsible scientist and coordinator of the project) and M.Sc. Päivi Laine (scientist) at the University of Turku, and Dr. Nils Jönsson (responsible scientist) and M.Sc. Thomas Lorenz (scientist) at the University of Rostock. For Finnish samples, Jan Eklund made the age reading, and Petri Rannikko partly analysed the trap net data. Additionally, technical assistance was employed for fish sampling and treatment. Genetic analyses were made in the Laboratory of Animal Physiology and Genetics (Department of Biology) at the University of Turku, in co-operation with Prof. Marja-Liisa Savontaus and M.Sc. Esa Huusela. The experimental study on herring growth was collaborated with Dr. Jorma Paranko at the University of Turku (Department of Biology). Statistical advice was obtained from M.Sc. Mika Kurkilahti (Department of Biology, University of Turku and Finnish Game and Fisheries Institute). Project meetings During the study, 4 project meetings were held
April 1997, Rostock January 1998, Turku April 1998, Rostock (Rügen) June/July 1998, Turku (Seili)
SEILI Archipelago Research Institute Publications 3

71
List of publications 1. Rajasilta, M., Paranko, J. & Laine, P. 1997. Reproductive characteristics of the male herring
in the northern Baltic Sea. Journal of Fish Biology 51: 978-988. 2. Laine, P. & Rajasilta, M. 1998. Changes in the reproductive properties of Baltic herring
females during the spawning season. Fisheries Research 36: 67-73. 3. Laine, P., Eklund, J., Soikkeli, M. 1998. Reproduction and growth of Baltic herring after
dissimilar growth and overwintering seasons. Ophelia 48: 155-165. 4. Laine, P. & Rajasilta, M. 1999. The hatching success of Baltic herring eggs and its relation to
female condition. Journal of Experimental Marine Biology and Ecology 237: 61-73. 5. Eklund, J., Aneer, G. & Parmanne, R. On the uncertainty of herring otolith ages. Presentation
in 2nd International Symposium on Fish Otolith Research and Application, Bergen, 1998 (Will be published in Fisheries Research).
6. Rajasilta, M., Eklund, J., Jönsson, N., Laine, P., Lorenz, T. Present state of the spawning populations and spawning beds of the Baltic herring in a southern (Greifswalder Bodden) and a northern (Archipelago Sea) spawning area. Presentation in the ICES symposium Brackish Water Ecology, Helsinki, 1998.
7. Laine, P. Paternal effects on the hatching success of Baltic herring eggs. Presentation in the ICES symposium Brackish Water Ecology, Helsinki, 1998. (Will be published in the ICES Journal of Marine Science).
8. Rajasilta, M. & Laine, P. Fat content and ovarian weight of the herring (Clupea harengus membras) in variable environmental conditions and fishing pressure in the northern Baltic Sea. Submitted manuscript.
9. Rajasilta, M., Eklund, J., Huusela, E., Jönsson, N., Laine, P., Lorenz, R., Raijola, T. & Savontaus, M-L. Baltic herring avoids reproductive failure in low-salinity conditions by reducing body size. Submitted manuscript.
10. Rajasilta, M., Laine, P. & Hänninen, J. Ovarian weight of the Baltic herring (Clupea harengus membras) in relation to spawning time in the Archipelago Sea, northern Baltic. Submitted manuscript.
11. Eklund, J. Herring growth and age estimates from otolith and scales. Manuscript. 12. Rannikko, P. Pyyntiajan ja –paikan merkitys silakan ominaisuuksien vaihtelussa Airiston
alueella (The influence of catching site and time on the properties of Baltic herring in the Airisto area). MSc. thesis, Department of Biology , University of Turku. 43 pp.
List of references Adelman, I. R.1987. Uptake of radioactive amino acids as indices of current growth rate of fish: a review.
In: The age and growth of fishes (eds. R.C. Summerfelt & G.E. Hall). The Iowa State University Press. Iowa.
Allendorf, F.W. & Utter, F.M. 1979. Population genetics. In Fish Physiology 8 (eds. Hoar, W.S., Randall, D.J. & Brett, J.R.) Acad. Press. New York. p 407-454.
Andersson, L., Ryman, N., Rosenberg, R. & Ståhl, G. 1981. Genetic variability in Atlantic herring (Clupea harengus harengus): description of protein loci and populaiton data. Hereditas 95: 69-78.
Aneer, G. 1985. Some speculations about the Baltic herring (Clupea harengus membras) in connection with the eutrophication of the Baltic Sea. Can. J. Fish. Aquat. Sci. 42: 83-90.
Aneer, G. 1987. High natural mortality of Baltic herring (Clupea harengus) eggs caused by algal exudates? Marine Biology 94: 163-169.
Aneer, G. 1989. Herring (Clupea harengus L.) spawning and spawning ground characteristics in the Baltic Sea. Fisheries Research 8: 169-195.
Anonymous 1994. Growth changes of herring in the Baltic. TemaNord 1994:532. Nordic Council of Ministers, Copenhagen.
Anttalainen, M. & Tuomisto, P. 1995. Vesistökuormittajat vv. 1989-1994. Lounais-Suomen ympäristökeskus. Report 2: 1995.
SEILI Archipelago Research Institute Publications 3

72
Bachuraisa, A. 1983. Untersuchungen zur Bestandszusammensetzung des laichenden Rügensche Frühjahrsherings durch eine zeitgleiche, aber räumlich getrennte Probennahme im April 1981. MSci-thesis. University of Rostock.
Beckenbach, A. T. 1991. Rapid mtDNA sequence analysis of fish populations using the polymerase chain reaction (PCR). Can. J. Fish. Aquat. Sci. 48 (Suppl. 1): 95-98.
Busch, A., Jönsson, N., Lorenz, T., Suchau, A. & Holst, A. 1996. Mortality in successive cohorts of young Baltic herring larvae. Rostock Meeresbiolog. Beitr. 4: 17-31.
Day, R.W. & Quinn, G.P. 1989. Comparisons of treatments after analysis of variance in ecology. Ecol. Monogr. 59, 433-463.
Eidam, J., Lehmann, J. & Puff, T. 1998. Einfluss des Phasenbestandes von Schwebstoffen und Sedimenten des Odermündungsgebietes auf die Bindung und Mobilisierung von Schwermetallen - ein Beitrag zur Bilanzierung von Stoffaustauschprozessen. Greifswalder Gepgraphische Arbeiten 16: 130-168.
Geisel, T. & Messner, U. 1989. Flora und Fauna des Bodens im Greifswalder Bodden. Meer und Museum 5: 44-51.
Holliday, F.G.T. & Blaxter, J.H.S. 1961. The effects of salinity on herring after metamorphosis. J. mar. biol. Ass. U.K. 41, 37-48.
Isernhagen, J. 1976. Untersuchungen zur Fischerei und zur Bestandszusammensetzung des Rügenschen Frühjahrsherings. MSci-thesis, University of Rostock.
Kleimeier, C. 1985. Regionale Unterschiede im Laicherbestand des Frühjahrsherings im Greifswalder Bodden. M.Sci.-thesis. University of Rostock.
Klinkhardt, M. 1984. Zum Einfluss des Salzgehaltes auf die Befruchtungsfähigkeit des Laiches der Rügenischen Frühjahrsheringe. Fischerei-Forschung Wissenschaftliche Schriftenreihe 22, 73-75.
Bignert, A. & Olsson, M. 1997. Oroande om stömmingen. Östersjö '97: 24. (In Swedish; English summary). Björck, S. 1998.A review of the history of the Baltic Sea, 13.0-8.0 ka Bp. Quaternary International 27: 19-
40. Bonsdorff, E., Blomqvist, E.M., Mattila, J. & Norkko, A. 1997. Coastal eutrophication: causes,
consequences and perspectives in the Archipelago areas of the northern Baltic Sea. Estuarine, Coastal and Shelf Science 44 (Suppl. A): 63-72.
Busacker, G.P. & Adelman, I.R. 1987. Uptake of 14C-glycine by fish scales (in vitro) as a n index of current growth rate. In: The age and growth of fish (eds. R.C. Summerfelt & G.E. Hall). The Iowa State University Press. Iowa.
Castera, A. 1995. Extraction of lipids for analytical purposes. In: Sebedio, J.-L.- & Perkins, E.G. (eds.). New trends in lipid and lipoprotein analyses. AOCS Oress, Champaign, Illinois, p. 10-37.
Gentzen, B. & Scabell, J. 1983. Praxisorientierte Verhaltenuntersuchungen am Rügenschen Frühjahrshering (Clupea harengus L.) mit Hilfe der leichten Taucherei. MSci-thesis, University of Rostock.
Goolish, E.M. & Adelman, I.R. 1983. Effects of fish growth rate, acclimation temperature and incubation temperature on in vitro glycine uptake by fish scales. Comp. Biochem. Physiol. 76A, 127-134.
Hebert, P.D.N. & Beaton, M.J. 1989. Methodologies for allozyme analysis using cellulose acetate electrophoresis. Educational Service of Helena Laboratories, Beaumont, Texas, USA.
Heino, A. 1979. The pattern of organic content and some heavy metals in the bottom sediments of Airisto, SW-Finland. Turun yliopiston maantieteen laitoksen julkaisuja 89. 52 p
ICES 1998. Report on the Baltic herring age-reading study group. Riga, Latvia 23-27 February 1998. ICES CM 1998/H:2. Mimeograph, 86 pp.
Idler, F. 1987. Fischereibiologische Untersuchungen am Hering (Clupea harengus L.) 1985/86. MSci-thesis, University of Rostock.
Itkonen, A., Vahteri, P. & Wright, J. 1998. Ruoppausmassojen läjittämisen vaikutukset vesistöön ja kalatalouteen Pohjois-Airistolla. Raportti vuonna 1997 tehdyistä tutkimuksista. (Effects of dumping of the dredged spoils on the environment and fisheries in the Northern Airisto in 1997). Archipelago Research Institute 1997. Study report, 62 pp. In Finnish.
Jönsson, N. & Biester, E. 1981a. Herring - tagging experiments 1980/81 along the coast of GDR. ICES, C.M. 1981/J:29.
Jönsson, N. & Biester, E.1981b. Wanderbewegungen des Rügenschen Frühjahrsherings in den Küsten- und Boddengewässern der DDR. Fischerei-Forschung (Rostock) 19: 47-51
Jönsson, N. & Richter, T. 1993. Fangststatistik von Heringsreusen - eine unterstützende Methode und Analyse des Wanderverhaltens des Rügenschen Frühjahrsherings (Clupea harengus L.). Rostocker Meeresbiologische Beiträge 1: 77-86.
Jørstad, K. E., Dahle, G. & Paulsen, O.I. 1994. Genetic comparison between Pacific herring (Clupea pallasi) and a Norwegian fjord stock of Atlantic herring (Clupea harengus). Can. J. Fish. Aquat. Sci. 51 (Suppl. 1): 233-239.
Kauppila, T. & Wright, J. 1997. Ruoppausmassojen läjittämisen vaikutukset vesistöön ja kalatalouteen Pohjois-Airistolla. Raportti vuonna 1996 tehdyistä tutkimuksista. (Effects of dumping of the dredged spoils on the environment and fisheries in the Northern Airisto in 1996). Archipelago Research Institute 1997. Study report, 45 pp. In Finnish.
Kesteven, G.L. 1960. Manual of field methods in fisheries biology. FAO Man Fish. Sci. No 1, 152 p.
SEILI Archipelago Research Institute Publications 3
73
Klinkhardt, M. & Reschke, B.1980. Bestandszusammensetzung und Bestandsverbreitung des Herings südlich und westlich Rügens. MSci-thesis, University of Rostock.
Ryman, N., Lagercrantz, U., Andersson, L., Chakraborty, R. & Rosenberg, R. 1984. Lack of correspondence between genetic and morphologic variability patterns in Atlantic herring (Clupea harengus). Heredity 53: 687-704.
Kocher, T.D., Thomas, W.K., Meyer, A., Edwards, S.V., Pääbo, S., Villablanca, F.X. & Wilson, A.C. 1989. Dynamics of mitochondrial DNA evolution in animals: amplification and sequencing with conserved primers. Proc. Natl. Acad. Sci. USA. 86: 6196-6200.
Kohonen, T., Vahteri, P., Suominen, T. Helminen, U. & Vuorinen, I. 1999: Ruoppausmassojen läjittämisen vaikutukset vesistöön ja kalatalouteen Pohjois-Airistolla. Raportti vuonna 1998 tehdyistä tutkimuksista. (Effects of dumping of the dredged spoils on the environment and fisheries in the Northern Airisto in 1998). Archipelago Research Institute 1999. Study report, 120 pp. In Finnish.
Kornfield, I. & Bogdanowicz, S. M. 1987. Differentiation of mitochondrial DNA in Atlantic herring, Clupea harengus. Fishery Bulletin 85: 561-568.
Kornilovs, G. & Fetter, M. 1996. The comparison of Baltic herring age determinatoin from scales and otoliths. ICES CM 1996/J:21. Mimeograph, 8 pp.
Kääriä, J., Eklund, J., Hallikainen, S., Kääriä, R., Rajasilta, M., Ranta-aho, K. & Soikkeli, M. 1988. Effects of coastal eutrophication on the spawning grounds of the Baltic herring in the SW Archipelago of Finland. Kieler Meeresforsch., Sonderh. 6: 348-356.
Kääriä, J., Rajasilta, M., Kurkilahti, M. & Soikkeli, M. 1998. Spawning bed selection by the Baltic herring (Clupea harengus membras) in the Archipelago of SW Finland. ICES J. Mar. Sci. 54: 917-923.
Kääriä, J., Eklund, J., Jönsson, N., Naarminen, M. & Rajasilta, M. 1999. A tagging experiment on spring-spawning Baltic herring (Clupea harengus membras L.) in SW Finland in 1990-1995. (Manuscript).
Laine, P., Pajunen, I. & Soikkeli, M. 1996. Giant herrings in the Archipelago Sea – a group of fast-growing cannibals. In: A. Andrushaitis (Ed.) Proceedings of the 13th Baltic Marine Biologists Symposium.
Lee, W.-J., Conroy, J., Howell, W.H. & Kocher, T. D. 1995. Structure and evolution of teleost mitochondrial control regions. J. Mol. Evol. 41: 54-66.
Lindman, H.R. 1992. Analysis of variance in experimental design. Springer-Verlag, New York. 538 pp. Littell, R.C, Milliken, G.A, Stroup, W.W & Wolfinger, R.D. 1996. SAS System for Mixed Models. SAS
Institute Inc. Cary, NC. Messieh, S.N. & Tibbo, S. N. 1970. A critique on the use of otoliths for ageing of St. Lawrence herring
(Clupea harengus L.). J. Cons. int. Explor. Mer. 33: 181-191. Meyer, A., Kocher, T.D., Basasibwaki, P. & Wilson, A. C. 1990. Monophyletic origin of Lake Victoria cichlid
fishes suggested by mitochondrial DNA sequences. Nature (Lond.) 347: 550-553. Meyer, H., Lampe, R., Jonas, P. & Buckmann K. 1998. Nährstoffe im Oderästuar - Transporte und
Inventare. Greifswalder Gepgraphische Arbeiten 16: 99-129. Müller, W. 1985. Das Fangaufkommen des Rügenschen Frühjahrsherings im Fischerei-Aufsichtsbereich
Lauterbach der Jahre 1984/85 (Fangstatistik von 84 Heringsfrühjahrsreusen). MSc-thesis, University of Rostock.
Negatu, Z. & Meier, A.H. 1993. Daily variation of protein synthesis in several tissues of the Gulf killfish Fundulus grandis Baird and Girard. Comp Biochem Physiol 106 A: 251-255.
Niinimäki, J. 1997. Turun ja Naantalin edustan merialueen ammatti- ja kirjanpitokalastus vuonna 1996. Lounais-Suomen vesiensuojeluyhdistys r.y. tutkimusselosteita 126. (In Finnish).
Parmanne, R. 1990.Growth, morphological variation and migrations of herring (Clupea harengus L.) in the northern Baltic Sea. Finn. Fish. Res. 10: 1-48.
Parmanne, R., Popov, A. & Raid, T. 1997. Fishery and biology of herring (Clupea harengus L.) in the Gulf of Finland: a review. Boreal Env. Res. 2: 217-227.
Pitkänen, H. 1994. Eutrophication of the Finnish coastal water: origin, fate and effects of riverine nutrient fluxes. Publications of Water and Environment Research Institute of Finland 18: 1-44.
Pääbo, S., Irwin, D.M., and Wilson, A.C. 1990. Enzymatic amplification from modified DNA templates. J. Biol. Chem. 265: 4718-4721.
Rajasilta, M. & Ranta-aho, K. 1982: Alustavia tuloksia silakan mätitiheydestä, mädin esiintymissyvyydestä ja kehityksestä pohjoisella Airistolla. (Preliminary results on the density and occurrence of herring spawn and development of the eggs in the northern Airisto). Suomen Kalastuslehti 8: 232-234. (In Finnish).
Rajasilta, M. 1992: Relationship between food, fat, sexual maturation and spawning time of Baltic herring (Clupea harengus membras) in the Archipelago Sea. Can. J. Fish. Aquat. Sci. 49: 644-654.
Rajasilta, M. & Kääriä, J. 1985. The spawning grounds of the Baltic herring (Clupea harengus membras L.) in the sea area of Turku: occurrence and mortality of the eggs and the quality of the bottoms in 1984 and 1985. Lounais-Suomen vesiensuojeluyhdistys r.y., julkaisu 63: 83-107. (In Finnish; English summary).
Rajasilta, M., Eklund, J. Hänninen, J. Kurkilahti, M., Kääriä, J. Rannikko, P. & Soikkeli, M. 1993. Spawning of herring (Clupea harengus membras L.) in the Archipelago Sea. ICES J. Mar. Sci. 50: 233-246.
Rajasilta, M., Kääriä, J. Laine, P., Pajunen, I. & Soikkeli, M. 1996. Is the spawning of the herring in the northern Baltic influnenced by mild winters? In: A. Andrushaitis (Ed.) Proceedings of the 13th Baltic Marine Biologists Symposium.
SAS Institute Inc. 1989. SAS/STAT User’s Guide Version 6, Fourth Edition. SAS Institute Inc., Cary, NC.
SEILI Archipelago Research Institute Publications 3

74
Scabell, J. & N. Jönsson 1984. A quantitative method for obtaining defined samples of spawn bearing substrate. ICES, C.M. 1984/L:40.
Scabell, J. 1988. Der Rügensche Frühjahrshering - das Laichgeschehen. Ph.D.-Thesis, University of Rostock. 117 pp.
Scabell, J. & Jönsson, N. 1989. Spawning behaviour of Rügen spring herring. Rapp. P.-v. Réun. Cons. Int. Explor. Mer 190: 113-116.
Schneider, S., Kueffer, J.-M., Roessli, D. & Excoffier, L. 1997. Arlequin ver. 1.1: A software for population genetic data analysis. Genetics and Biometry Laboratory, University of Geneva, Switzerland.
Vuorinen, I., Hänninen, J., Viitasalo, M., Helminen, U. & Kuosa, H. 1998: Proportion of copepod biomass declines with decreasing salinity in the Baltic Sea. ICES J. Mar. Sci. 55: 767-774.
Ward, R.D. & Grewe, P.M. 1995. Appraisal of molecular genetic techniques in fisheries. In: Molecular Genetics in Fisheries. (Eds. G.R. Carvalho & T. J. Pitcher). Chapman & Hall, London.
Wood, R.J. 1958. Fat cycles of North sea herring. J. Cons. Perm. int. Explor. Mer, 23 391-398. Wilkins, N. P. 1967. Starvation of the herring, Clupea harengus L.: survival and some gross biochemical
changes. Comp. Biochem. Physiol. 23: 503-518. Wright, J., Mäkinen, A. & Erkkola, P. 1995: Ruoppausmassojen läjittämisen vaikutukset vesistöön ja
kalatalouteen Pohjois-Airistolla. Raportti vuonna 1994 tehdyistä tutkimuksista. (Effects of dumping of the dredged spoils on the environment and fisheries in the Northern Airisto in 1994). Archipelago Research Institute 1995. Study report, 45 pp. In Finnish.
Wulff, F., Rahm, L. & Rodriguez-Medina, M. 1994: Long-term and regional variations of nutrients in the Baltic Sea; 1972-1991. Finnish Marine Research 262: 35-50.
SEILI Archipelago Research Institute Publications 3
75
Annexes
Annex 1. Notes on fish treatment and data input Annex 2. File forms Annex 3. Studies on fecundity Annex 4. Rajasilta, M., Paranko, J. & Laine, P. 1997. Reproductive characteristics of the male
herring in the northern Baltic Sea. (not included) Annex 5. Laine, P. & Rajasilta, M. 1998. Changes in the reproductive properties of Baltic herring
females during the spawning season. (not included) Annex 6. Rajasilta, M., Laine, P. & Hänninen, J. Ovarian weight of the Baltic herring (Clupea
harengus membras) in relation to spawning time in the Archipelago Sea, northern Baltic. (not included)
Annex 7. Laine, P. & Rajasilta, M. 1999. The hatching success of Baltic herring eggs and its relation to female condition. (not included)
Annex 8. Rajasilta, M., Eklund, J., Jönsson, N., Laine, P., Lorenz, T. Present state of the spawning populations and spawning beds of the Baltic herring in a southern (Greifswalder Bodden) and a northern (Archipelago Sea) spawning area. Presentation in the ICES symposium Brackish Water Ecology, Helsinki, 1998. (not included)
Annex 9. Eklund, J., Aneer, G. & Parmanne, R. On the uncertainty of herring otolith ages. Presentation in 2nd International Symposium on Fish Otolith Research and Application, Bergen, 1998. (not included)
Annex 10. Eklund, J. Herring growth and age estimates from otolith and scales. (not included) Annex 11. Rajasilta et al. Baltic herring avoids reproductive failure in low-salinity conditions by
reducing body size. (not included) Annex 12. Rajasilta, M. & Laine, P. Fat content and ovarian weight of the herring (Clupea
harengus membras) in variable environmental conditions and fishing pressure in the northern Baltic Sea. (not included)
Annex 13. Laine, P. Paternal effects on the hatching success of Baltic herring eggs. Presentation in the ICES symposium Brackish Water Ecology, Helsinki, 1998. (not included)
Annex 14. Laine, P., Eklund, J., Soikeli, M. 1998. Reproduction and growth of Baltic herring after dissimilar growth and overwintering seasons. (not included)
Annex 15. Sample size estimates for different herring parameters in Archipelago Sea and Greifswalder Bodden. (not included)
SEILI Archipelago Research Institute Publications 3