intensification of north american ... - columbia university
TRANSCRIPT

Intensification of North American Megadroughts through Surface and DustAerosol Forcing*
BENJAMIN I. COOK
NASA Goddard Institute for Space Studies, New York, and Lamont-Doherty Earth Observatory, Palisades, New York
RICHARD SEAGER
Lamont-Doherty Earth Observatory, Palisades, New York
RON L. MILLER
NASA Goddard Institute for Space Studies, and Department of Applied Physics and Applied Math,
Columbia University, New York, New York
JOSEPH A. MASON
University of Wisconsin—Madison, Madison, Wisconsin
(Manuscript received 29 December 2011, in final form 25 September 2012)
ABSTRACT
Tree-ring-based reconstructions of the Palmer drought severity index (PDSI) indicate that, during the
Medieval Climate Anomaly (MCA), the central plains of North America experienced recurrent periods of
drought spanning decades or longer. These megadroughts had exceptional persistence compared to more
recent events, but the causes remain uncertain. The authors conducted a suite of general circulation model
experiments to test the impact of sea surface temperature (SST) and land surface forcing on the MCA
megadroughts over the central plains. The land surface forcing is represented as a set of dune mobilization
boundary conditions, derived from available geomorphological evidence and modeled as increased bare soil
area and a dust aerosol source (328–448N, 1058–958W). In the experiments, cold tropical Pacific SST forcing
suppresses precipitation over the central plains but cannot reproduce the overall drying or persistence seen in
the PDSI reconstruction. Droughts in the scenario with dust aerosols, however, are amplified and have sig-
nificantly longer persistence than in othermodel experiments, more closelymatching the reconstructed PDSI.
This additional drying occurs because the dust increases the shortwave planetary albedo, reducing energy
inputs to the surface and boundary layer. The energy deficit increases atmospheric stability, inhibiting con-
vection and reducing cloud cover and precipitation over the central plains. Results from this study provide the
first model-based evidence that dust aerosol forcing and land surface changes could have contributed to the
intensity and persistence of the central plainsmegadroughts, although uncertainties remain in the formulation
of the boundary conditions and the future importance of these feedbacks.
1. Introduction
During the late Medieval Climate Anomaly (MCA),
hydroclimate in western North America and the central
plains was defined largely by episodic droughts that
typically persisted for multiple decades or longer (Cook
et al. 2004, 2007, 2010; Herweijer et al. 2007; Stahle et al.
2007; Woodhouse and Overpeck 1998). These droughts
had significant ecological and societal consequences,
causing major disruptions in regional civilizations (e.g.,
Benson et al. 2007a,b; Douglass 1929) and leading to
widespread vegetation mortality and dune mobilization
(Forman et al. 2001; Hanson et al. 2010; Miao et al.
2007). These so-called megadroughts are not only un-
precedented in the instrumental record but are also
*Lamont-Doherty EarthObservatory Contribution Number 7692.
Corresponding author address: Benjamin I. Cook, NASA God-
dard Institute for SpaceStudies, 2880Broadway,NewYork,NY10025.
E-mail: [email protected]
4414 JOURNAL OF CL IMATE VOLUME 26
DOI: 10.1175/JCLI-D-12-00022.1
largely absent in climate reconstructions of the last
500 years. With modern droughts already exacting sig-
nificant societal costs (Cook et al. 2007), there is much
interest in understanding the processes that drive the
persistence of the MCA megadroughts and assessing
the possibility of such droughts occurring in the future
(Cook et al. 2010).
Investigations into the forcing of the megadroughts
have focused primarily on the role of sea surface tem-
perature (SST) forcing during the MCA, especially
shifts in the tropical Pacific (Burgman et al. 2010; Seager
et al. 2008a), the Atlantic (Oglesby et al. 2012), or both
(Conroy et al. 2009a; Feng et al. 2008). Drought condi-
tions in the southern United States and central plains
regions are favored by cold phases of the El Ni~no–
Southern Oscillation (ENSO) (i.e., La Ni~na conditions)
and warm SSTs in the tropical Atlantic (e.g., Kushnir
et al. 2010; Nigam et al. 2011; Schubert et al. 2009;
Seager et al. 2005), and there is evidence in the paleo-
record for cooler tropical Pacific SSTs during much of
the MCA (Cobb et al. 2003; Conroy et al. 2009b). More
recently, Graham et al. (2011) have suggested that an
anomalously warm Indian Ocean and enhanced zonal
SST gradient across the Indo-Pacific region may have
also contributed to the megadroughts and other cli-
mate anomalies during the MCA. General circulation
models (GCM), forced by either idealized (Feng et al.
2008) or reconstructed (Burgman et al. 2010; Seager
et al. 2008a) SST fields, can stimulate some drying
over North America but still have difficulty reproducing
the magnitude and persistence of theMCAmegadroughts.
Aside from remote SST-forced teleconnections, land
surface feedbacks also play a critical role in modulat-
ing drought and hydroclimatic variability over North
America. For example, the central plains has long been
considered a ‘‘hot spot’’ for positive soil moisture–
precipitation feedbacks (e.g., Findell et al. 2011; Koster
et al. 2004; Meng and Quiring 2010). More recently,
work on the Dust Bowl drought of the 1930s demon-
strated that land degradation, in the form of vegetation
mortality, wind erosion, and dust aerosols, could amplify
regional drought over the central plains when these
processes were included in a suite of climate model ex-
periments (Cook et al. 2008, 2009). Specifically, these two
studies found that dust aerosols and reduced vegetation
cover caused significant warming and drying, increasing
the fidelity of their simulatedDust Bowl temperature and
precipitation anomalies. The warming was driven by in-
creases in the Bowen ratio, as reduced vegetative cover
caused significant declines in evapotranspiration, shifting
the surface energy balance to favor sensible over latent
heating. Dust aerosols suppressed precipitation via the
well-established ‘‘Charney’’ mechanism (Charney 1975;
Charney et al. 1977), increasing the albedo and shortwave
reflectance and reducing net radiative fluxes at the surface
and top of the atmosphere. With less energy available to
drive vertical movement of the atmosphere, convection,
and precipitation were subsequently reduced. These
feedbacks may be especially important to consider for the
MCAmegadroughts that occurred over the central plains,
given the large-scale vegetation mortality, wind erosion,
and dust aerosol transport that occurred during this in-
terval, as inferred from records of paleo dunes (Forman
et al. 2001; Hanson et al. 2010; Miao et al. 2007).
To date, however, the impact of the dune mobiliza-
tion, vegetation mortality, and dust aerosols on the
MCA megadroughts is understudied. While several pa-
pers have speculated that these landscape changes may
have amplified these droughts (Feng et al. 2008; Seager
et al. 2008b), only one study to date has explicitly tested
surface impacts on the megadroughts within a modeling
framework (Cook et al. 2011). They found that vege-
tation mortality alone (i.e., without wind erosion or
dust feedbacks) was insufficient to amplify the model-
simulated droughts or reproduce the drought persis-
tence seen in the paleorecord. Here, we expand on the
experiments of Cook et al. (2011), presenting a new en-
semble of simulations including wind erosion and dust
aerosol forcing. We frame our analysis around two
questions: 1) can forcing from dune mobilization, con-
ceptualized as reduced vegetation coverage and a dust
aerosol source, intensify simulated megadroughts over
the central plains and 2) does inclusion of these surface
factors increase the simulated persistence of these mega-
droughts?
2. Methods and data
a. North American Drought Atlas
We use information on drought history in North
America from the North American Drought Atlas
(NADA) version 2a (Cook et al. 2004, 2007), a gridded
(2.58 3 2.58) tree-ring-based reconstruction of the Palmer
drought severity index (PDSI) (Palmer 1965) for boreal
summer [June–August (JJA)]. The PDSI is a locally
normalized index of drought that incorporates both
moisture supply (precipitation) and demand (evapo-
ration as a function of temperature) in its calculation.
Positive values of the PDSI indicate wetter than normal
conditions and negative values indicate drier than
normal conditions. Despite the JJA focus of the NADA,
PDSI has a memory time scale of about 12–18 months
(Guttman 1998; Vicente-Serrano et al. 2010), allowing it
to incorporate information on temperature and preci-
pitation throughout the year. PDSI from the NADA has
1 JULY 2013 COOK ET AL . 4415

been used with good success to validate and inform a
variety of modeling studies investigating historical and
paleo-droughts over North America (e.g., Cook et al.
2011; Herweijer et al. 2006, 2007; Oglesby et al. 2012;
Seager et al. 2008a).
b. Model description
For our experiments, we used a version of the God-
dard Institute for Space Studies (GISS) atmospheric
GCM ‘‘ModelE’’ (Schmidt et al. 2006), extensively up-
dated in preparation for experiments as part of the Fifth
Assessment Report of the Intergovernmental Panel on
Climate Change (G. A. Schmidt et al. 2013, unpublished
manuscript). This current version has a horizontal res-
olution of 28 3 2.58 latitude/longitude with 40 vertical
layers in the atmosphere. Each land cell is divided into
vegetated and bare soil columns with six vertical layers
that extend to a maximum depth of 3.5m (heat and
moisture budgets are calculated separately for each
soil column). Vegetation is prescribed using Matthews
(1983), and photosynthesis and stomatal conductance
parameterizations are based on Farquhar et al. (1980)
and Ball et al. (1987), respectively. Included within
ModelE is a mineral dust aerosol model (Miller et al.
2006). In the default setup, dust aerosols are emitted to
the atmosphere as a function of soil moisture and wind
speed from regions identified by the source map of
Ginoux et al. (2001), representing sediment filled topo-
graphic depressions that persist over geologic time
scales. Once airborne, dust aerosols alter the radiative
budget within the atmosphere, increasing shortwave
reflection and longwave absorption. In the current ver-
sion of the model, dust aerosols have no microphysical
interactions. Studies using the immediately preceding
Fourth Assessment Report version of the model have
demonstrated the ability of ModelE to produce high-
fidelity simulations of the modern-day climate, in-
cluding historical trends and variability (Hansen et al.
2007; Schmidt et al. 2006). Over North America, SST
teleconnections are well resolved, and a variety of
studies have successfully used ModelE to investigate
twentieth-century hydroclimate variability over this
region (e.g., Cook et al. 2008, 2009; Ruiz-Barradas and
Nigam 2006).
c. Boundary conditions
For our historical ensemble (1857–2005 CE, described
below), we used SST forcing from the Kaplan et al.
(1998) dataset. For our MCA ensembles (1321–1461
CE), the SST forcing was prescribed using a coral-based
SST reconstruction for the tropical Pacific (308S–308N)
(Cobb et al. 2003). Oxygen isotope anomalies for the
MCA portion of the Cobb et al. coral record were
calculated relative to the monthly climatology for 1886–
1998CE and converted to SST anomalies for low ($6 yr)
and high (,6 yr) frequency components of the record
separately, based on regressions against theKaplan et al.
dataset. Outside the tropical Pacific, SSTs were taken
from the model runs of Seager et al. (2008a). In their
experiments, Seager et al. (2008a) prescribed the Cobb
et al. (2003) reconstruction in the tropical Pacific, cou-
pling these SSTs elsewhere to a thermodynamic mixed
layer ocean. SSTs outside the tropical Pacific there-
fore reflect the influence of tropical Pacific variability
communicated primarily through atmospheric tele-
connections. Annual SST anomalies in the Ni~no-3.4 re-
gion, calculated relative to the 1857–2005 CEmean from
Kaplan et al. (1998), indicate a cooler than normal
ENSO state during the late MCA (Fig. 1a). The tropical
Pacific SSTs and ENSO variability reconstructed from
the Cobb et al. (2003) coral records are generally sup-
ported by independent evidence for anomalously warm
SSTs in the western tropical Pacific (Newton et al. 2006)
and cool SSTs in the eastern tropical Pacific (Conroy
et al. 2009b; Graham et al. 2007; Seager et al. 2007a)
FIG. 1. (a) Ni~no-3.4 SST anomalies and (b) dune mobilization
region (328–448N, 1058–958W) for the Medieval Climate Anomaly
experiments. All MCA experiments (SST-Only, SST1BSOIL, and
SST1BSOIL1DUST) use the same SST forcing, based on a coral
reconstruction of SSTs in the tropical Pacific. Anomalies are relative
to the 1856–2005 mean SSTs in the Ni~no-3.4 region from the Kaplan
SST dataset. Dune mobilization region is used to define the 50%
bare soil area in the SST1BSOIL and SST1BSOIL1DUST ex-
periments and the dust source region in the SST1BSOIL1DUST
experiment.
4416 JOURNAL OF CL IMATE VOLUME 26

during the MCA. Indirect evidence from regional hy-
droclimate records during the MCA also supports such
a SST pattern (e.g., Graham et al. 2007, 2011; Seager
et al. 2007a). However, some regional proxies indicate
hydroclimate anomalies during the MCA that may be
inconsistent with La Ni~na–like conditions (Moy et al.
2002; Thompson et al. 1984), suggesting remaining un-
certainty in our understanding of tropical SSTs during
the MCA. Further information and the details of the
SST reconstruction and calculation can be found in
Seager et al. (2008a), Burgman et al. (2010), and the
supplemental material of Cook et al. (2011).
The geologic record provides evidence for widespread
and recurrent dunemobilization events during theMCA
(Forman et al. 2001; Hanson et al. 2010; Miao et al.
2007), with the most recent events likely occurring
during the fourteenth and fifteenth centuries. These
events were driven primarily by megadrought-induced
vegetation mortality and reductions in vegetation cover.
In the Nebraska Sand Hills, stratigraphic evidence
shows that aeolian sand mobilization coincided with
water table drawdown during the MCA (Mason et al.
2004). More generally, moisture availability for vegeta-
tion is likely to be the predominant control on dune
mobility in the central plains. The sand-transporting
potential of modern winds is high by global standards,
but the dunes are largely stable at present because
precipitation is sufficient to maintain vegetation cover
(Muhs and Maat 1993). Large uncertainties remain,
however, regarding the specific timing, duration, and
extent of the vegetation mortality and associated wind
erosion and dust aerosol forcing, making it difficult to
develop quantitative boundary forcings for our model
experiments. The fractional area of reduced vegetation
cover in our model experiments should therefore be
viewed primarily as a sensitivity test, and not as an at-
tempt at fully reconstructing the actual area of vegeta-
tion mortality. For our MCA runs, we prescribed our
dune mobilization region (Fig. 1b) over the central
plains (328–448N, 1058–958W), based qualitatively on
maps and evidence from geomorphological analyses
(Forman et al. 2001; Hanson et al. 2010; Miao et al.
2007). For the model, we translated this to 1) a 50%
reduction in vegetation cover (simulating the vegetation
mortality) and 2) a new dust aerosol emission source
coincident with the region of reduced vegetation cover
and added to the default source map of Ginoux et al.
(2001).
To validate wind erosion and dust aerosol emis-
sions from this new source, we estimated aeolian de-
position in two areas: 408–428N, 988–1008W (area 1) and
408–428N, 968–988W (area 2). Application of optically
stimulated luminescence dating to thick source-proximal
loess sections with high resolution has demonstrated
that major intervals of rapid Holocene loess accumu-
lation were synchronous across the central plains (Miao
et al. 2007). A discrete increment of loess deposited
between 1100 and 1400 CE is consistently present,
forming about 5%–13% of the total Holocene loess
thickness. Thinner Holocene loess forms a relatively
uniform mantle over uplands in the areas chosen for
validation [30–60 cm thick in area 1 and 24–36 cm thick
in area 2, based on observations by Jacobs and Mason
(2007) and soil surveys], allowing estimation of de-
position rates at spatial scales comparable to model
resolution. We assumed that the loess in those areas
was preserved with minimal resuspension after depo-
sition. Taking into account the ranges of total thickness
and assuming 5%–13% of that total was deposited be-
tween 1100 and 1400 CE, we derived average aeolian
deposition rates over the period 1100–1400 CE of 80–
380 and 60–230 gm22 yr21 for areas 1 and 2, respec-
tively. We used these deposition rates to validate the
dust emissions from the new central plains source in
our model scenario. We note, however, that, because of
the paucity of available data on dust emissions and at-
mospheric loadings, there are still large uncertainties in
the timing, provenance, and spatial extent of the wind
erosion during the MCA. Our validation of the dust
fluxes therefore represents a first attempt at reproducing
MCA dust forcing in the model. Additionally, because of
time uncertainties in our boundary conditions, including
the SST reconstruction, we cannot directly compare our
simulated droughts against specific drought events in the
record. Instead, we compare our simulated droughts
(1321–1461 CE) against general drought statistics from
TABLE 1. Summary of model experiments conducted as part of this study. All experiments represent five-member ensembles, with each
ensemble initialized using a unique set of starting conditions. For each simulation, the table indicates the years over which the ensembles
were run, the source of the SST forcing, and if bare soil (BSOIL) or dust source (DUST) boundary conditions were included.
Expt Years SSTs Dune, bare soil Dune, dust
SST-MOD 1857–2005 Kaplan et al. 1998 — —
SST-Only 1321–1461 Cobb et al. 2003 — —
SST1BSOIL 1321–1461 Cobb et al. 2003 1 —
SST1BSOIL1DUST 1321–1461 Cobb et al. 2003 1 1
1 JULY 2013 COOK ET AL . 4417

the NADA for the MCA (1100–1500 CE) and the post-
MCA (1501–2000 CE) periods.
d. Model experiments
Our experiments comprise four 5-member ensemble
simulations usingModelE (Table 1). Each experiment is
based on a set of unique forcing, land surface, and SST
boundary conditions, and each ensemble member is
initialized using different initial states for the atmo-
sphere and land surface. Our base run is SST-MOD,
a historical (1857–2005 CE) control run forced with
observational period solar (Wang et al. 2005), volcanic
(Hansen et al. 2002; Sato et al. 1993), and greenhouse
gas forcings (Hansen and Sato 2004), as well as SSTs
prescribed according to Kaplan et al. (1998). Unless
otherwise indicated, all anomalies for the MCA model
ensembles are calculated relative to the ensemble
mean for 1857–2005 CE from SST-MOD. All MCA
model ensembles are forced with transient, recon-
structed estimates of forcing from greenhouse gas
concentrations (Schmidt et al. 2011), solar variability
(Delaygue and Bard 2011), and the reconstructed tropi-
cal Pacific SSTs from 1321 to 1461 CE. In SST-Only, we
use the default land surface and MCA SST forcing only.
FIG. 2. Monthly (a) temperature and (b) precipitation climatology (1961–90) for the central plains region (328–448N,
1058–958W), calculated from our modern-day SST-forced ensemble and the CRU 2.1 climate grids (green line).
FIG. 3. Summer season (JJA) PDSI anomalies from the North American Drought Atlas
(NADA), averaged over the central plains region (328–448N, 1058–958W). Droughts in this
region (a) during the late Medieval Climate Anomaly (MCA) were generally more persis-
tent than (b) droughts after 1500 CE. Both time series were smoothed with a 5-yr low-pass
(lowess spline) filter.
4418 JOURNAL OF CL IMATE VOLUME 26

In SST1BSOIL, we use the MCA SST forcing and our
50%bare soil boundary condition over the central plains
but with no central plains dust aerosol source, following
Cook et al. (2011). Our final full-effect ensemble,
SST1BSOIL1DUST, includes the SST forcing, central
plains bare soil, and the new central plains dust source.
We focus the bulk of our model and paleoclimate
analyses on the central plains region where we pre-
scribed theMCA land surface boundary conditions (i.e.,
the bare soil fraction and dust source). All significance
testing is based on a two-sided Student’s t test with
a significance threshold of p # 0.05.
3. Results
a. Model validation
For the central plains region, we compare themonthly
climatology (1961–90 CE) of temperature and pre-
cipitation from the ensemble mean of our SST-MOD
experiment against observations (1961–90 CE) from
the Climate Research Unit (CRU) climate grids ver-
sion 2.1 (Mitchell and Jones 2005) (Fig. 2). ModelE
reproduces the amplitude and seasonality of climate
over this region, including the seasonal peak in pre-
cipitation during the late spring and early summer (May–
August). Major biases only occur in two months: April
(positive) and September (negative).
Ensemble average annual average dust deposition
from the SST1BSOIL1DUST experiment is 152 (635
std dev) and 82 (619 std dev) gm22 yr21 for areas 1
and 2, respectively. This places our dust source emis-
sions at the low end of our observed range but within the
same order of magnitude, suggesting that the simulated
climate impact of dust in our SST1BSOIL1DUST en-
semble is conservative. Given the uncertainties inherent
in estimating these boundary conditions, we consider this
a reasonable first-order estimate of the dust forcing dur-
ing the MCA.
FIG. 4. Autocorrelation function (ACF) for central plains PDSI from the NADA. (a) Droughts during the MCA
have significant persistence (gray line, p # 0.05) out to a lag of 9 yr. (b) Post-MCA drought persistence is signif-
icantly reduced, with significant persistence only at a lag of 1 yr. Even after standardizing to zero mean, (c) the
MCA PDSI retains significant persistence at lags of 1, 2, 3, and 8 yr, while (d) the post-MCA PDSI is relatively
unchanged.
1 JULY 2013 COOK ET AL . 4419

b. PDSI in the North American Drought Atlas
During the MCA (Fig. 3a), the central plains expe-
rienced multiple decadal or longer periods of drought
that were largely absent in the post-MCA time period
(Fig. 3b). This persistence is clearly seen in the auto-
correlation of the PDSI calculated in the NADA, which
shows significant autocorrelation of theMCAPDSI out
to lags of 9 yr (Fig. 4a). In contrast, persistence in
the post-MCA PDSI is significant only at a lag of 1 yr
(Fig. 4b). To remove the impact of changes in the mean
PDSI on the persistence calculation, we recalculated
the autocorrelation functions for the MCA (Fig. 4c)
and post-MCA PDSI (Fig. 4d) after adjusting the
means of both time series to zero. Even with this ad-
justment, MCA PDSI retains significant persistence at
time lags of 1, 2, 3, and 8 yr, supporting the contention
that, relative to recent periods, droughts during the
MCAwere largely unprecedented in their duration and
persistence.
c. PDSI in the MCA model simulations
To evaluate the drought response in our MCA simu-
lations and to facilitate comparisons with the NADA,
we calculated PDSI using model surface temperature
and precipitation.We calculated the PDSI for every grid
cell over the central plains region separately, standard-
izing against the normal period defined by our SST-
MOD ensemble (1857–2005) and then averaging over
the central plains. Soil moisture capacity for the top and
bottom layers was set to 25.4mm (1 in.) and 127mm
(5 in.). Evapotranspiration was calculated as a function
of temperature based on Thornthwaite (1948), the same
method used to derive the PDSI that forms the foun-
dation of the NADA reconstruction.
Averaged across all five ensemble members and
all simulation years (1321–1461 CE), the three MCA
simulations show enhanced drought (negative PDSI)
relative to the SST-MOD historical scenario (Fig. 5).
The drying in all three simulations is generally largest
during the summer months (June–September) and
lowest during spring (April–May). The SST-Only and
SST1BSOIL scenarios simulate similar levels of dry-
ing, except during winter and spring (January–May)
when the magnitude of the negative PDSI anomalies in
the SST1BSOIL scenario are reduced or, in the case of
April–May, actually positive. With the addition of dust
aerosols in SST1BSOIL1DUST, the drought inten-
sity is amplified beyond SST-Only and SST1BSOIL,
especially during the warm season. Averaged across
JJA, the same season for which PDSI data are avail-
able from the NADA, the ensemble average PDSI
values from the MCA runs are20.33 (SST-Only),20.30
(SST1BSOIL), and 20.74 (SST1BSOIL1DUST).
The NADA, by comparison, has an average value
during the MCA (1100–1500 CE) of20.52. From these
simulations, dust aerosol forcing appears to be neces-
sary in order to amplify plains drought beyond the
SST forcing during the MCA, while increased bare
soil area is unable, by itself, to contribute additional
drought forcing [consistent with results from Cook
et al. (2011)].
FIG. 5. Ensemble mean monthly PDSI over the central plains
region (328–448N, 1058–958W) in our SST-Only (blue bars),
SST1BSOIL (green bars), and SST1BSOIL1DUST (brown bars)
experiments, relative to SST-MOD.
FIG. 6. (a) Ensemble mean monthly temperature (K) and (b)
precipitation (mmday21) anomalies over the central plains region
(328–448N, 1058–958W), in our SST-Only (blue bars), SST1BSOIL
(green bars), and SST1BSOIL1DUST (brown bars) experiments,
relative to SST-MOD. Anomalies significantly different from SST-
MOD (two-sided Student’s t test; p # 0.05) are indicated with an
asterisk.
4420 JOURNAL OF CL IMATE VOLUME 26

d. Model precipitation and temperature response
To determine the primary drivers of the PDSI anom-
alies in the MCA scenarios, we analyzed model pre-
cipitation and surface temperature anomalies over the
central plains region. All three MCA model scenarios
show significantly warmer and drier conditions over the
central plains, relative to the SST-MOD ensemble
(Fig. 6). In SST-Only (blue bars), these anomalies are
largest during summer and fall (June–November). The
winter responses in SST-Only are muted and largely
insignificant, an expected result because our central
plains region is on the northeast edge of the main SST-
teleconnection response during this season. This same
region does have a small but significant warm season
teleconnection with La Ni~na (Bunkers et al. 1996), and
this is reflected in the modest drying during the summer
and fall. Notably, our winter and summer precipitation
anomalies are similar in magnitude and spatial extent
when compared to a recent millennium run of the Com-
munity Climate System Model forced with solar, volca-
nic, and greenhouse gas forcing estimates and a coupled
ocean (Landrum et al. 2012). This suggests that the back-
ground drying during summer may be, to some extent,
forced by changes at the top of the atmosphere during the
MCA or other, forced, SST variability.
Warming in SST1BSOIL (green bars) is significantly
increased beyond the SST forcing in May–October; dust
FIG. 7. (a),(c),(e) Ensemblemeanmonthly surface temperature (JJA; K) and (b),(d),(f) precipitation (June; mmday21) anomalies over
North America in our MCA model runs. The central plains region (328–448N, 1058–958W) is outlined in the black dashes. Cells with
insignificant (p $ 0.05) differences between the MCA runs and SST-MOD have been masked out.
1 JULY 2013 COOK ET AL . 4421

aerosols in SST1BSOIL1DUST (brown bars) further
enhance the warming inMarch–April and June–August.
SST1BSOIL leads to a minor reduction of precipitation
during July, but the impact of the increased bare soil on
precipitation beyond the SST forcing is insignificant
otherwise. Dust aerosol forcing in June, however, causes
significant additional precipitation reductions, nearly
doubling the precipitation anomaly of SST-Only. In the
case of SST1BSOIL1DUST, it therefore appears that
the drought amplification indicated by the model PDSI
(Fig. 5) is driven primarily by enhanced evapotranspi-
ration from warming during the summer (JJA) and
precipitation reductions during June. To isolate and
describe the underlying physical mechanisms for the
drought amplification, we therefore focus our analyses
on the temperature response during JJA and the pre-
cipitation response during June.
Spatially, SST-Only shows significant surface warming
and drying over the central plains and much of eastern
North America (Figs. 7a,b). This warming is enhanced
over the central plains in SST1BSOIL (Fig. 7c), but the
June precipitation response (Fig. 7d) is similar to SST-
Only. Dust aerosol forcing in SST1BSOIL1DUST
further enhances the warming over the central plains
(Fig. 7e) and leads to moderate increases in temperature
over a wider region. The dust aerosols intensify the
drying over the central plains (Fig. 7f) and also lead to
some moderate drying in the southern plains and Texas.
The wider spatial scale of the climate response to the
dust aerosols compared to the change in source extent is
likely due to the response to the dust aerosol forcing
spreading out spatially over at least a Rossby radius of
deformation. All three scenarios show substantial tem-
poral variability in the temperature and precipitation
response over the central plains (Fig. 8). Temperatures
in SST1BSOIL and SST1BSOIL1DUST are, in general,
consistently warmer than SST-Only (Fig. 8a). Qualitatively,
summer temperature responses in our MCA simulations
are consistent with a recent Midwest temperature recon-
struction (Wahl et al. 2012), which also suggests warmer
JJA temperatures during the MCA (1100–1500 CE), rel-
ative to the Little Ice Age (1500–1900 CE). Mean surface
temperatures in SST1BSOIL and SST1BSOIL1DUST
are significantly warmer than SST-Only by 10.53 and
10.79K, respectively (Fig. 9a). Maximum temperature in-
creases are largest in the SST1BSOIL scenarios (Fig. 9c),
FIG. 8. Ensemble mean time series of (a) mean monthly surface temperature (JJA; K) and
(b) precipitation (June; mmday21) anomalies over North America in our MCA model runs,
averaged over the central plains region (328–448N, 1058–958W). All time series have been
smoothed with a 5-yr low-pass (lowess) filter.
4422 JOURNAL OF CL IMATE VOLUME 26

but dust aerosol forcing leads to significant increases in
minimum temperatures beyond either SST-Only or
SST1BSOIL (Fig. 9d) owing to dust inhibition of in-
frared cooling by the surface at night (see next section).
Precipitation in SST1BSOIL1DUST is generally lower
than in the other MCA simulations (Fig. 8b), but periods
of near-normal precipitation are interspersed with ex-
ceptionally dry intervals. The very dry intervals generally
coincide with especially cold SST forcing (Fig. 1a) (e.g.,
1350–70 CE, 1380–1410 CE), implying that the dust
aerosols amplify externally forced drought conditions.
Precipitation in SST1BSOIL1DUST during June is
significantly suppressed, on average, by an additional
20.16mmday21 over SST-Only; the SST1BSOIL dif-
ference is insignificant (Fig. 9b).
e. Surface fluxes (JJA)
Increases in maximum temperatures are driven pri-
marily by shifts in the surface energy balance from latent
(Fig. 10a) to sensible heating (Fig. 10b). Reduced vege-
tation cover in SST1BSOIL and SST1BSOIL1DUST
reduces transpiration, the flux of moisture from the land
surface to the atmosphere through the leaves of plants.
This leads to an overall decline in evapotranspiration
and latent heat flux that is largely balanced by increases
in sensible heating. Sensible heat flux anomalies in the
SST1BSOIL1DUST experiment are muted compared
to SST1BSOIL: the addition of the dust aerosols re-
duces surface heating through increased shortwave re-
flection, reducing incident solar inputs at the surface
(Fig. 10c). Maximum temperature still increases, how-
ever, because the latent heat flux reduction is still large
relative to the sensible heat flux anomaly. Because dust
aerosols are effective absorbers of infrared radiation,
they trap outgoing longwave radiation at night (Fig. 10d),
insulating the surface and increasing minimum tempera-
tures (Fig. 9d).
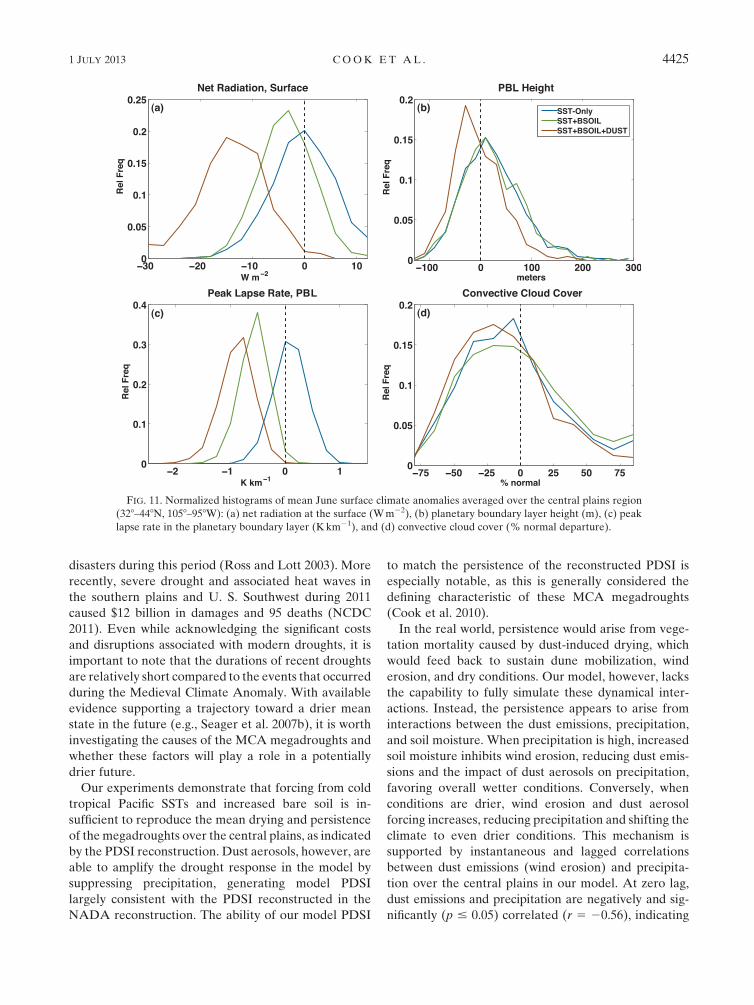
f. Surface responses (June)
Owing to increases in albedo and shortwave reflection,
both SST1BSOIL and SST1BSOIL1DUST have
reduced net radiation at the surface (Fig. 11a). For
FIG. 9. Normalized histograms of (a) mean monthly surface temperature (JJA, K), (b) precipitation (June,
mmday21), (c) mean monthly maximum surface temperature (JJA, K), and (d) mean monthly minimum surface
temperature (JJA, K) anomalies over North America in our MCA model runs, averaged over the central plains
region (328–448N, 1058–958W).
1 JULY 2013 COOK ET AL . 4423

SST1BSOIL, the albedo increase comes from the in-
creased bare soil coverage, which tends to have a higher
shortwave albedo than vegetation. In SST1BSOIL1DUST, the albedo increase is from a combination of in-
creased surface albedo from the bare soil and increased
shortwave reflection from the dust aerosols. The energy
deficit at the surface reduces planetary boundary layer
heights (Fig. 11b) and decreases the daytime peak
boundary-layer lapse rate (Fig. 11c). The boundary
layer responses lead to increased stability, inhibiting
vertical motion of air parcels and significantly reducing
convective cloud cover (Fig. 11d) and precipitation.
The radiative perturbation is only large enough to re-
duce precipitation beyond SST-Only forcing in the
SST1BSOIL1DUST experiment.
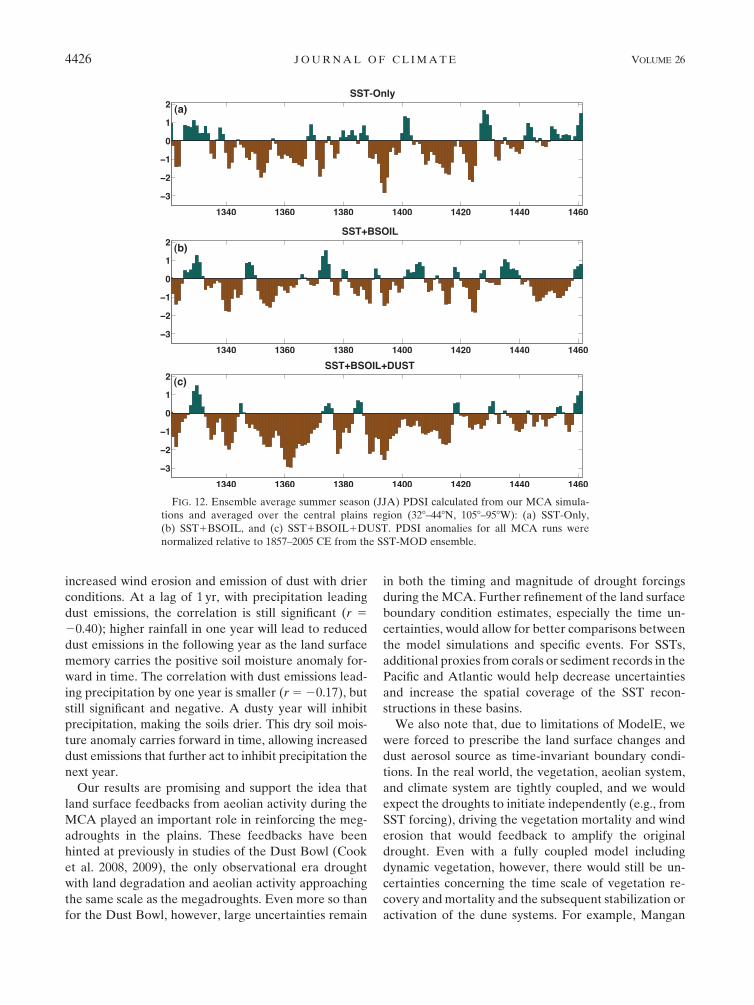
g. Drought persistence in the MCA simulations
Ensemble-mean central plains PDSI time series for
JJA are shown in Fig. 12, the same season represented
by the NADA. All three model experiments produce
recurrent periods of summer drought, but only the
SST1BSOIL1DUST ensemble is able to simulate
droughts with similar durations to the droughts in the
NADA (Fig. 3a). This apparent increased persistence
is confirmed by calculating the autocorrelation function
of these model PDSI time series (Fig. 13). Based on
the unadjusted PDSI (Figs. 13a–c), the SST1BSOIL1DUST scenario is the only run that simulates significant
persistence out to a period of 10 yr, although it may be
overestimated relative to the NADA. If the PDSI time
series are adjusted to a zero mean (Figs. 13d–f), the
SST1BSOIL1DUST autocorrelation function aligns
quite closely with the NADA function and is the only
one of our three MCA scenarios with significant per-
sistence at time lags of 1, 2, and 3 yr.
4. Discussion and conclusions
Drought is a recurrent and societally relevant cli-
mate phenomenon in much of North America, espe-
cially in the western half of the continent. From 1980 to
2003, droughts caused $144 billion in damages and lost
production (Cook et al. 2007; Ross and Lott 2003), ac-
counting for 41% of the total cost of all weather-related
FIG. 10. Normalized histograms of JJA surface flux (Wm22) anomalies averaged over the central plains region
(328–448N, 1058–958W): (a) latent heat flux, (b) sensible heat flux, (c) incident shortwave flux at the surface, and
(d) downwelling longwave flux at the surface.
4424 JOURNAL OF CL IMATE VOLUME 26
disasters during this period (Ross and Lott 2003). More
recently, severe drought and associated heat waves in
the southern plains and U. S. Southwest during 2011
caused $12 billion in damages and 95 deaths (NCDC
2011). Even while acknowledging the significant costs
and disruptions associated with modern droughts, it is
important to note that the durations of recent droughts
are relatively short compared to the events that occurred
during the Medieval Climate Anomaly. With available
evidence supporting a trajectory toward a drier mean
state in the future (e.g., Seager et al. 2007b), it is worth
investigating the causes of the MCA megadroughts and
whether these factors will play a role in a potentially
drier future.
Our experiments demonstrate that forcing from cold
tropical Pacific SSTs and increased bare soil is in-
sufficient to reproduce the mean drying and persistence
of themegadroughts over the central plains, as indicated
by the PDSI reconstruction. Dust aerosols, however, are
able to amplify the drought response in the model by
suppressing precipitation, generating model PDSI
largely consistent with the PDSI reconstructed in the
NADA reconstruction. The ability of our model PDSI
to match the persistence of the reconstructed PDSI is
especially notable, as this is generally considered the
defining characteristic of these MCA megadroughts
(Cook et al. 2010).
In the real world, persistence would arise from vege-
tation mortality caused by dust-induced drying, which
would feed back to sustain dune mobilization, wind
erosion, and dry conditions. Our model, however, lacks
the capability to fully simulate these dynamical inter-
actions. Instead, the persistence appears to arise from
interactions between the dust emissions, precipitation,
and soil moisture. When precipitation is high, increased
soil moisture inhibits wind erosion, reducing dust emis-
sions and the impact of dust aerosols on precipitation,
favoring overall wetter conditions. Conversely, when
conditions are drier, wind erosion and dust aerosol
forcing increases, reducing precipitation and shifting the
climate to even drier conditions. This mechanism is
supported by instantaneous and lagged correlations
between dust emissions (wind erosion) and precipita-
tion over the central plains in our model. At zero lag,
dust emissions and precipitation are negatively and sig-
nificantly (p # 0.05) correlated (r 5 20.56), indicating
FIG. 11. Normalized histograms of mean June surface climate anomalies averaged over the central plains region
(328–448N, 1058–958W): (a) net radiation at the surface (Wm22), (b) planetary boundary layer height (m), (c) peak
lapse rate in the planetary boundary layer (Kkm21), and (d) convective cloud cover (% normal departure).
1 JULY 2013 COOK ET AL . 4425
increased wind erosion and emission of dust with drier
conditions. At a lag of 1 yr, with precipitation leading
dust emissions, the correlation is still significant (r 520.40); higher rainfall in one year will lead to reduced
dust emissions in the following year as the land surface
memory carries the positive soil moisture anomaly for-
ward in time. The correlation with dust emissions lead-
ing precipitation by one year is smaller (r520.17), but
still significant and negative. A dusty year will inhibit
precipitation, making the soils drier. This dry soil mois-
ture anomaly carries forward in time, allowing increased
dust emissions that further act to inhibit precipitation the
next year.
Our results are promising and support the idea that
land surface feedbacks from aeolian activity during the
MCA played an important role in reinforcing the meg-
adroughts in the plains. These feedbacks have been
hinted at previously in studies of the Dust Bowl (Cook
et al. 2008, 2009), the only observational era drought
with land degradation and aeolian activity approaching
the same scale as the megadroughts. Even more so than
for the Dust Bowl, however, large uncertainties remain
in both the timing and magnitude of drought forcings
during the MCA. Further refinement of the land surface
boundary condition estimates, especially the time un-
certainties, would allow for better comparisons between
the model simulations and specific events. For SSTs,
additional proxies from corals or sediment records in the
Pacific and Atlantic would help decrease uncertainties
and increase the spatial coverage of the SST recon-
structions in these basins.
We also note that, due to limitations of ModelE, we
were forced to prescribe the land surface changes and
dust aerosol source as time-invariant boundary condi-
tions. In the real world, the vegetation, aeolian system,
and climate system are tightly coupled, and we would
expect the droughts to initiate independently (e.g., from
SST forcing), driving the vegetation mortality and wind
erosion that would feedback to amplify the original
drought. Even with a fully coupled model including
dynamic vegetation, however, there would still be un-
certainties concerning the time scale of vegetation re-
covery andmortality and the subsequent stabilization or
activation of the dune systems. For example, Mangan
FIG. 12. Ensemble average summer season (JJA) PDSI calculated from our MCA simula-
tions and averaged over the central plains region (328–448N, 1058–958W): (a) SST-Only,
(b) SST1BSOIL, and (c) SST1BSOIL1DUST. PDSI anomalies for all MCA runs were
normalized relative to 1857–2005 CE from the SST-MOD ensemble.
4426 JOURNAL OF CL IMATE VOLUME 26

et al. (2004) used a model of nutrient cycling and eco-
system dynamics to demonstrate that vegetation on dune
systems can respond rapidly to interannual precipita-
tion changes. Conversely, geomorphological studies
suggest that vegetation recovery and dune stabilization
may take decades to a century or more in some regions
(Hugenholtz and Wolfe 2005; Wolfe and Hugenholtz
2009). Interestingly, the major reduction in precipita-
tion (June) and increase in drought intensity (JJA)
in our SST1BSOIL1DUST ensemble occurs during
what would be the primary growing season for the warm
season grasses that populate the central plains. The tim-
ing of the drying in our forced runs is therefore consistent
with the drying that would be needed to drive the vege-
tation mortality and land degradation response in a cou-
pled model. Accurately simulating the time scale of these
interactions is a critical modeling challenge and will be
necessary in order to estimate the full capacity of dune
and vegetation feedbacks to amplify and sustain droughts
in this region.
Our experiments provide support for the idea that
surface factors, especially the dust aerosols, can explain
the persistence of the medieval megadroughts over the
central plains. Regions outside the central plains also
experienced persistent megadroughts during the MCA,
but with no evidence for additional forcing from local
land degradation. Examples include megadroughts that
occurred in California (Cook et al. 2010; Stine 1994),
Colorado (Gray et al. 2011; Meko et al. 2007; Routson
et al. 2011), and the U. S. Southwest (Woodhouse et al.
2010) and some droughts with a near-continental scale
(Herweijer et al. 2007; Stahle et al. 2007). While our
study provides support for the importance of the land
surface and dust aerosols during the central plains
megadroughts, we do not suggest that this is an impor-
tant feedback in, for example, the Southwest. Instead, it
is likely that the relative roles of ocean forcing, atmo-
spheric variability, and land surface feedbacks in gen-
erating megadroughts vary across the continent.
In the short term, the land surface dynamics that
amplified the megadroughts and Dust Bowl are unlikely
to play a major role in the intensification of future
droughts. During the Dust Bowl, much of the dust storm
activity originated from small farms with few erosion
control measures and annual crops that were extremely
vulnerable to moisture deficits. The initiation of this
drought, forced by cold SSTs in the tropical Pacific
(Schubert et al. 2004; Seager et al. 2008b), caused
widespread crop failures over the central and southern
plains, exposing highly erodible top soil. In response, the
FIG. 13. ACF for the ensemble average JJA central plains PDSI (328–448N, 1058–958W) from the (a) SST-Only, (b) SST1BSOIL, and
(c) SST1BSOIL1DUST model runs. PDSI in the SST1BSOIL1DUST ensemble, driven by the dust aerosol–forced drying, is the only
scenario that can generate significant persistence at time scales similar to the MCA PDSI from the NADA. (d),(e),(f) Even after the
adjustment to zero mean, SST1BSOIL1DUST is the only the scenario with significant persistence at lags of 2 and 3 yr, similar to the
autocorrelation of the adjusted NADA PDSI.
1 JULY 2013 COOK ET AL . 4427

U. S. government formed the Soil Conservation Service
with the goal of preventing the same level of land deg-
radation from occurring again (Hansen and Libecap
2004) and subsequent droughts (e.g., 1948–57, 1998–
2004) avoided the same levels of wind erosion and dust
storm activity, despite severe moisture deficits. Besides
erosion measures, irrigation in the west has also ex-
panded rapidly since the 1950s (Wisser et al. 2010),
providing additional sources of water that have enabled
farmers to be more resistant to drought events. Other
than farmlands, much of the region is composed of
pastures and grasslands that host perennial grasses
evolutionarily adapted to the hydroclimatic variability
in the region and capable of surviving at least short-term
droughts. There is evidence, though, that grasslands in
some regions will degrade in response to longer-term
droughts (Evans et al. 2011) and that livestock graz-
ing activities may make these systems more vulnerable
(Van Auken 2000). As the twenty-first century prog-
resses, various factors will affect the resilience of agri-
cultural and natural systems in the region, and the
potential for landscape feedbacks to drought. On one
side, both greenhouse-gas-forced drying trends (Seager
et al. 2007b) and the continued depletion of nonrenew-
able groundwater resources (e.g., Sophocleous 2010)
will increase drought stress on natural ecosystems and
agricultural systems. Conversely, the direct effect of
increased atmospheric carbon dioxide concentrations
on plant physiology may serve to actually increase plant
resistance to water stress and drought (e.g., Morgan et al.
2011). The future of hydroclimate and landscape pro-
cesses in the central plains and western North America
will thus likely depend on the complex interplay of cli-
mate dynamics, ecosystem responses, and direct human
management.
Acknowledgments. Resources supporting this work
were provided by the National Aeronautics and Space
Administration (NASA) High-End Computing (HEC)
Program through the NASA Center for Climate Simu-
lation (NCCS) at Goddard Space Flight Center. The
authors acknowledge the support of NSF Grant
ATMO9-02716; NOAAGrant NA100AR-4310137; NSF
Grant ATM-06-20066; the NASA Atmospheric Compo-
sition Program; and the NASA Modeling, Analysis and
Prediction (MAP) Program. JonathanOverpeck and one
anonymous reviewer provided feedback that greatly im-
proved the quality of this manuscript.
REFERENCES
Ball, J. T., I. E. Woodrow, and J. A. Berry, 1987: A model pre-
dicting stomatal conductance and its application to the control
of photosynthesis under different environmental conditions.
Progress in Photosynthesis, I. Biggins, Ed., Martinus Nijhoff
Publishers, 221–224.
Benson, L. V.,M. S. Berry, E. A. Jolie, J. D. Spangler,D.W. Stahle,
and E. M. Hattori, 2007a: Possible impacts of early-11th-,
middle-12th-, and late-13th-century droughts on western Na-
tive Americans and the Mississippian Cahokians. Quat. Sci.
Rev., 26 (3–4), 336–350.
——, K. Petersen, and J. Stein, 2007b: Anasazi (pre-Columbian
Native-American) migrations during the middle-12th and
late-13th centuries—Were they drought induced? Climatic
Change, 83, 187–213.
Bunkers, M. J., J. R. Miller Jr., and A. T. DeGaetano, 1996: An
examination of El Ni~no–La Ni~na-related precipitation and
temperature anomalies across the northern Plains. J. Climate,
9, 147–160.Burgman, R., R. Seager, A. Clement, and C. Herweijer, 2010: Role
of tropical Pacific SSTs in global medieval hydroclimate: A
modeling study. Geophys. Res. Lett., 37, L06705, doi:10.1029/
2009GL042239.
Charney, J. G., 1975: Dynamics of deserts and drought in the Sahel.
Quart. J. Roy. Meteor. Soc., 101, 193–202.
——, W. J. Quirk, S. H. Chow, and J. Kornfield, 1977: A compar-
ative study of the effects of albedo change on drought in semi-
arid regions. J. Atmos. Sci., 34, 1366–1385.
Cobb, K. M., C. D. Charles, H. Cheng, and R. L. Edwards, 2003:
El Ni~no/Southern Oscillation and tropical Pacific climate
during the last millennium. Nature, 424, 271–276.
Conroy, J. L., J. T. Overpeck, J. E. Cole, and M. Steinitz-Kannan,
2009a: Variable oceanic influences on western North Ameri-
can drought over the last 1200 years. Geophys. Res. Lett., 36,
L17703, doi:10.1029/2009GL039558.
——, A. Restrepo, J. T. Overpeck, M. Steinitz-Kannan, J. E. Cole,
M. B. Bush, and P. A. Colinvaux, 2009b: Unprecedented re-
cent warming of surface temperatures in the eastern tropical
Pacific Ocean. Nat. Geosci., 2, 46–50, doi:10.1038/ngeo390.
Cook, B. I., R. L. Miller, and R. Seager, 2008: Dust and sea surface
temperature forcing of the 1930s ‘‘Dust Bowl’’drought. Geo-
phys. Res. Lett., 35, L08710, doi:10.1029/2008GL033486.
——, ——, and ——, 2009: Amplification of the North American
‘‘Dust Bowl’’ drought through human-induced land degrada-
tion. Proc. Natl. Acad. Sci. USA, 106, 4997–5001.——, R. Seager, and R. L. Miller, 2011: The impact of devegetated
dune fields on North American climate during the late Me-
dieval Climate Anomaly. Geophys. Res. Lett., 38, L14704,
doi:10.1029/2011GL047566.
Cook, E. R., C. A. Woodhouse, C. M. Eakin, D. M. Meko, and
D. W. Stahle, 2004: Long-term aridity changes in the western
United States. Science, 306, 1015–1018.
——, R. Seager, M. A. Cane, and D. W. Stahle, 2007: North
American drought: Reconstructions, causes, and consequences.
Earth Sci. Rev., 81 (1–2), 93–134.
——, ——, R. R. Heim Jr., R. S. Vose, C. Herweijer, and
C. Woodhouse, 2010: Megadroughts in North America:
Placing IPCC projections of hydroclimatic change in a long-
term palaeoclimate context. J. Quat. Sci., 25, 48–61.
Delaygue, G., and E. Bard, 2011: An Antarctic view of beryllium-
10 and solar activity for the past millennium.Climate Dyn., 36,
2201–2218, doi:10.1007/s00382-010-0795-1.
Douglass, A., 1929: The secret of the southwest solved by talkative
tree rings. Natl. Geogr. Mag., 56, 736–770.Evans, S. E., K. M. Byrne, W. K. Lauenroth, and I. C. Burke, 2011:
Defining the limit to resistance in a drought-tolerant grassland:
Long-term severe drought significantly reduces the dominant
4428 JOURNAL OF CL IMATE VOLUME 26

species and increases ruderals. J. Ecol., 99, 1500–1507,
doi:10.1111/j.1365-2745.2011.01864.x.
Farquhar, G. D., S. Caemmerer, and J. A. Berry, 1980: A bio-
chemical model of photosynthetic CO2 assimilation in leaves
of C3 species. Planta, 149, 78–90.
Feng, S., R. J. Oglesby, C. M. Rowe, D. B. Loope, and Q. Hu,
2008: Atlantic and Pacific SST influences on medieval
drought in North America simulated by the Community At-
mospheric Model. J. Geophys. Res., 113, D11101, doi:10.1029/
2007JD009347.
Findell, K. L., P. Gentine, B. R. Lintner, and C. Kerr, 2011:
Probability of afternoon precipitation in easternUnited States
and Mexico enhanced by high evaporation. Nat. Geosci., 4,
434–439.
Forman, S. L., R. Oglesby, and R. S. Webb, 2001: Temporal and
spatial patterns of Holocene dune activity on the Great Plains
of North America: Megadroughts and climate links. Global
Planet. Change, 29 (1–2), 1–29.
Ginoux, P., M. Chin, I. Tegen, J. M. Prospero, B. Holben,
O. Dubovik, and S. J. Lin, 2001: Sources and distributions
of dust aerosols simulated with the GOCART model.
J. Geophys. Res., 106, 20 255–20 273.
Graham, N. E., and Coauthors, 2007: Tropical Pacific–mid-latitude
teleconnections in medieval times. Climatic Change, 83, 241–
285, doi:10.1007/s10584-007-9239-2.
——, C. M. Ammann, D. Fleitmann, K. M. Cobb, and J. Luterbacher,
2011: Support for global climate reorganization during the
‘‘Medieval Climate Anomaly.’’ Climate Dyn., 37, 1217–1245,
doi:10.1007/s00382-010-0914-z.
Gray, S. T., J. J. Lukas, and C. A. Woodhouse, 2011: Millennial-
length records of streamflow from three major upper Colorado
River tributaries. J. Amer. Water Res. Assoc., 47, 702–712,
doi:10.1111/j.1752-1688.2011.00535.x.
Guttman, N. B., 1998: Comparing the Palmer drought index and
the standardized precipitation index. J. Amer. Water Resour.
Assoc., 34, 113–121.
Hansen, J., and M. Sato, 2004: Greenhouse gas growth rates.
Proc. Nat. Acad. Sci. USA, 101, 16 109–16 114, doi:10.1073/
pnas.0406982101.
——, and Coauthors, 2002: Climate forcings in Goddard Institute
for Space Studies SI2000 simulations. J. Geophys. Res., 107,
4347, doi:10.1029/2001JD001143.
——, and Coauthors, 2007: Climate simulations for 1880–2003 with
GISS ModelE. Climate Dyn., 29, 661–696.
Hansen, Z. K., and G. D. Libecap, 2004: Small farms, externali-
ties, and the Dust Bowl of the 1930s. J. Polit. Econ., 112, 665–
694.
Hanson, P. R., A. F. Arbogast, W. C. Johnson, R. Joeckel, and
A. Young, 2010: Megadroughts and late Holocene dune acti-
vation at the eastern margin of the Great Plains, north-central
Kansas, USA. Aeolian Res., 1 (3–4), 101–110.
Herweijer, C., R. Seager, and E. R. Cook, 2006: North American
droughts of the mid to late nineteenth century: A history,
simulation and implication for mediaeval drought. Holocene,
16, 159–171.
——, ——, ——, and J. Emile-Geay, 2007: North American
droughts of the last millennium from a gridded network of
tree-ring data. J. Climate, 20, 1353–1376.
Hugenholtz, C. H., and S. A. Wolfe, 2005: Recent stabilization of
active sand dunes on the Canadian prairies and relation to
recent climate variations. Geomorphology, 68, 131–147.
Jacobs, P. M., and J. A. Mason, 2007: Late quaternary climate
change, loess sedimentation, and soil profile development in
the central Great Plains: A pedosedimentary model. Geol.
Soc. Amer. Bull., 119 (3–4), 462–475.
Kaplan, A., M. A. Cane, Y. Kushnir, A. C. Clement, M. B.
Blumenthal, and B. Rajagopalan, 1998: Analyses of global
sea surface temperature 1856–1991. J. Geophys. Res., 103,
18567–18 589.
Koster, R. D., and Coauthors, 2004: Regions of strong coupling
between soil moisture and precipitation. Science, 305, 1138–
1141.
Kushnir, Y., R. Seager, M. Ting, N. Naik, and J. Nakamura, 2010:
Mechanisms of tropical Atlantic SST influence on North
American hydroclimate variability. J. Climate, 23, 5610–5628.
Landrum, L., B.Otto-Bliesner, E. R.Wahl, A. Conley, P. J. Lawrence,
and H. Teng, 2012: Last millennium climate and its variability in
CCSM4. J. Climate, 25, 4817–4838.
Mangan, J. M., J. T. Overpeck, R. S. Webb, C. Wessman, and A. F.
H. Goetz, 2004: Response of Nebraska Sand Hills natural
vegetation to drought, fire, grazing, and plant functional type
shifts as simulated by the CENTURY model. Climatic
Change, 63, 49–90.
Mason, J. A., J. B. Swinehart, R. J. Goble, and D. B. Loope, 2004:
Late-Holocene dune activity linked to hydrological drought,
Nebraska Sand Hills, USA. Holocene, 14, 209–217.
Matthews, E., 1983: Global vegetation and land use: New high-
resolution databases for climate studies. J. Climate Appl.
Meteor., 22, 474–487.
Meko, D. M., C. A. Woodhouse, C. A. Baisan, T. Knight, J. J.
Lukas, M. K. Hughes, and M. W. Salzer, 2007: Medieval
drought in the upper Colorado River basin. Geophys. Res.
Lett., 34, L10705, doi:10.1029/2007GL029988.
Meng, L., and S. M. Quiring, 2010: Observational relationship of
sea surface temperatures and precedent soil moisture with
summer precipitation in the US Great Plains. Int. J. Climatol.,
30, 884–893.Miao, X., J. A. Mason, J. B. Swinehart, D. B. Loope, P. R. Hanson,
R. J. Goble, and X. Liu, 2007: A 10,000 year record of dune
activity, dust storms, and severe drought in the central Great
Plains. Geology, 35, 119–122.
Miller, R. L., and Coauthors, 2006: Mineral dust aerosols in the
NASA Goddard Institute for Space Sciences ModelE atmo-
spheric general circulation model. J. Geophys. Res., 111,
doi:10.1029/2005JD005796.
Mitchell, T. D., and P. D. Jones, 2005: An improved method of
constructing a database of monthly climate observations and
associated high-resolution grids. Int. J. Climatol., 25, 693–712.
Morgan, J. A., and Coauthors, 2011: C4 grasses prosper as carbon
dioxide eliminates desiccation in warmed semi-arid grassland.
Nature, 476, 202–205.
Moy, C. M., G. O. Seltzer, D. T. Rodbell, and D. M. Anderson,
2002: Variability of El Ni~no/Southern Oscillation activity at
millennial timescales during the Holocene epoch.Nature, 420,
162–165, doi:10.1038/nature01194.
Muhs, D. R., and P. B.Maat, 1993: The potential response of eolian
sands to greenhouse warming and precipitation reduction on
the Great Plains of the U.S.A. J. Arid Environ., 25, 351–361.
NCDC, 2011: Billion dollar U.S. weather/climate disasters 1980-
2011. National Climatic Data Center Tech. Rep., 6 pp.
[Available online at http://www.ncdc.noaa.gov/billions/events.
pdf.]
Newton, A., R. Thunell, and L. Stott, 2006: Climate and hydro-
graphic variability in the Indo-Pacific warm pool during the
last millennium. Geophys. Res. Lett., 33, L19710, doi:10.1029/
2006GL027234.
1 JULY 2013 COOK ET AL . 4429

Nigam, S., B. Guan, and A. Ruiz-Barradas, 2011: Key role of the
Atlantic multidecadal oscillation in 20th century drought and
wet periods over the Great Plains. Geophys. Res. Lett., 38,
L16713, doi:10.1029/2011GL048650.
Oglesby, R., S. Feng, Q. Hu, and C. Rowe, 2012: The role of
the Atlantic multidecadal oscillation on medieval drought
in North America: Synthesizing results from proxy data
and climate models. Global Planet. Change, 84–85, 56–65,doi:10.1016/j.gloplacha.2011.07.005.
Palmer, W., 1965: Meteorological drought. U.S. Weather Bureau
Research Paper 45, 58 pp.
Ross, T., and N. Lott, 2003: A climatology of 1980-2003 extreme
weather and climate events. NOAA/NESDIS/National Cli-
matic Data Center Tech. Rep., 14 pp.
Routson, C. C., C. A. Woodhouse, and J. T. Overpeck, 2011: Sec-
ond century megadrought in the Rio Grande headwaters,
Colorado: How unusual wasmedieval drought?Geophys. Res.
Lett., 38, L22703, doi:10.1029/2011GL050015.
Ruiz-Barradas, A., and S. Nigam, 2006: IPCC’s twentieth-century
climate simulations: Varied representations of North Ameri-
can hydroclimate variability. J. Climate, 19, 4041–4058.
Sato, M., J. E. Hansen, M. P. McCormick, and J. B. Pollack, 1993:
Stratospheric aerosol optical depths, 1850–1990. J. Geophys.
Res., 98, 22 987–22 994.
Schmidt, G. A., and Coauthors, 2006: Present-day atmospheric
simulations using GISS ModelE: Comparison to in situ, sat-
ellite, and reanalysis data. J. Climate, 19, 153–192.
——, and Coauthors, 2011: Climate forcing reconstructions for use
in PMIP simulations of the last millennium (v1.0). Geosci.
Model Dev. 4, 33–45, doi:10.5194/gmd-4-33-2011.
Schubert, S. D., M. J. Suarez, P. J. Pegion, R. D. Koster, and J. T.
Bacmeister, 2004: On the cause of the 1930s Dust Bowl. Sci-
ence, 303, 1855–1859.
——, and Coauthors, 2009: A U.S. CLIVAR project to assess and
compare the responses of global climate models to drought-
related SST forcing patterns: Overview and results. J. Climate,
22, 5251–5272.Seager, R., Y. Kushnir, C. Herweijer, N. Naik, and J. Velez, 2005:
Modeling of tropical forcing of persistent droughts and plu-
vials over western North America: 1856–2000. J. Climate, 18,
4065–4088.
——, N. Graham, C. Herweijer, A. L. Gordon, Y. Kushnir, and
E. Cook, 2007a: Blueprints for medieval hydroclimate. Quat.
Sci. Rev., 26 (19–21), 2322–2336.
——, and Coauthors, 2007b: Model projections of an imminent
transition to a more arid climate in southwestern North
America. Science, 316, 1181–1184, doi:10.1126/science.1139601.
——, R. Burgman, Y. Kushnir, A. Clement, E. Cook, N. Naik, and
J. Miller, 2008a: Tropical Pacific forcing of North American
medieval megadroughts: Testing the concept with an
atmosphere model forced by coral-reconstructed SSTs.
J. Climate, 21, 6175–6190.
——, Y. Kushnir, M. Ting, M. Cane, N. Naik, and J. Miller, 2008b:
Would advance knowledge of 1930s SSTs have allowed pre-
diction of the Dust Bowl drought? J. Climate, 21, 3261–3281.
Sophocleous, M., 2010: Review: Groundwater management prac-
tices, challenges, and innovations in the high plains aquifer,
USA—Lessons and recommended actions. Hydrogeol. J., 18,559–575.
Stahle, D. W., F. K. Fye, E. R. Cook, and R. D. Griffin, 2007: Tree-
ring reconstructed megadroughts over North America since
AD 1300. Climatic Change, 83, 133–149.Stine, S., 1994: Extreme and persistent drought in California and
Patagonia during mediaeval time. Nature, 369, 546–549,
doi:10.1038/369546a0.
Thompson, L. G., E. Mosley-Thompson, and B. M. Arnao, 1984:
El Ni~no-Southern Oscillation events recorded in the stratig-
raphy of the tropical Quelccaya Ice Cap, Peru. Science, 226,
50–53, doi:10.1126/science.226.4670.50.
Thornthwaite, C., 1948: An approach toward a rational classifica-
tion of climate. Geogr. Rev., 38, 55–94.
Van Auken, O. W., 2000: Shrub invasions of North American
semiarid grasslands. Annu. Rev. Ecol. Syst., 31, 197–215.Vicente-Serrano, S. M., S. Beguer�ıa, J. I. L�opez-Moreno,
M. Angulo, and A. El Kenawy, 2010: A new global 0.5 gridded
dataset (1901-2006) of a multiscalar drought index: Compari-
son with current drought index datasets based on the Palmer
drought severity index. J. Hydrometeor., 11, 1033–1043.
Wahl, E. R., H. F. Diaz, and C. Ohlwein, 2012: A pollen-based
reconstruction of summer temperature in central North
America and implications for circulation patterns during me-
dieval times.Global Planet. Change, 84–85, 66–74, doi:10.1016/
j.gloplacha.2011.10.005.
Wang, Y.-M., J. L. Lean, and J. N. R. Sheeley, 2005: Modeling the
sun’s magnetic field and irradiance since 1713. Astrophys. J.,
625, 522, doi:10.1086/429689.
Wisser, D., B. M. Fekete, C. J. Vorosmarty, and A. Schumann,
2010: Reconstructing 20th century global hydrography:
A contribution to the Global Terrestrial Network-Hydrology
(GTN-H). Hydrol. Earth Syst. Sci., 14, 1–24.
Wolfe, S. A., and C. H.Hugenholtz, 2009: Barchan dunes stabilized
under recent climate warming on the northern Great Plains.
Geology, 37, 1039–1042.
Woodhouse, C. A., and J. T. Overpeck, 1998: 2000 years of drought
variability in the central United States. Bull. Amer. Meteor.
Soc., 79, 2693–2714.
——, D. M. Meko, G. M. MacDonald, D. W. Stahle, and E. R.
Cook, 2010: A 1,200-year perspective of 21st century drought
in southwestern North America. Proc. Nat. Acad. Sci. USA,
107, 21 283–21 288, doi:10.1073/pnas.0911197107.
4430 JOURNAL OF CL IMATE VOLUME 26