intelligence and corruption - uni konstanz · besides having a direct positive effect on economic...
TRANSCRIPT

http://www.wiwi.uni-konstanz.de/workingpaperseries
U n i v e r s i t y o f K o n s t a n zD e p a r t m e n t o f E c o n o m i c s
Intelligence and Corruption
Niklas Potrafke
Working Paper Series 2011-37

Intelligence and corruption
Niklas Potrafke∗∗∗∗ University of Konstanz
26 September, 2011
Abstract
This study finds that countries with high-IQ populations enjoy less corruption. I propose
that this is because intelligent people have longer time horizons.
Keywords: Intelligence, corruption, institutions
JEL Classification: D73, I2
∗ Niklas Potrafke, University of Konstanz, Department of Economics, Box 138, D-78457 Konstanz, Germany, Phone: + 49 7531 88 2137, Fax: + 49 7531 88 3130. Email: [email protected] I thank Christian Bjørnskov, Arye Hillman, Garett Jones, Heinrich Ursprung, and one anonymous referee for helpful hints and suggestions. Carl Maier and Felix Weber provided excellent research assistance.

1
1. Introduction
Most specialists agree that corruption reduces economic growth (Méon and Sekkat 2005).
Research has recently focused on the determinants of corruption which include political
institutions, global economic integration, the size of the shadow economy, business cycles,
legal origin, and social trust (Dreher and Siemers 2009, Dreher and Schneider 2010,
Goksecus and Suzuki 2011, Bjørnskov 2011). Using cross-sectional data for 125 countries,
I show that countries with high IQ-populations enjoy less corruption.
Because corruption is individually rational, but socially inefficient, agents
contemplating corrupt activities find themselves in a prisoner’s dilemma. The dilemma can
be overcome when the same players interact in an infinitely repeated game, but cooperation
can also arise in circumstances in which different participants interact under a finite time
horizon. Experimental evidence shows that cooperation is more prevalent among intelligent
players (Jones 2008). Corruption of the especially inefficient roving-bandit type (Olson
2000) results under a short time-horizon. People with longer time horizons internalize the
deleterious future effects of contemporary corruption. I propose that there is less corruption
in societies with high-IQ populations because more intelligent people have longer time
horizons, a common finding in psychology and economics (Shamosh and Gray 2008, Jones
and Podemska 2010). Besides having a direct positive effect on economic growth (Jones
and Schneider 2006, Weede and Kämpf 2002), intelligence also has an indirect beneficial
effect on growth through less corruption (Figure 1).

2
Figure 1: The nexus between intelligence, corruption, and growth
2. Data and estimation strategy
To measure corruption, I use the reversed Transparency International’s Perception of
Corruption Index (CPI) for the year 2010. The reversed index assumes values between 0
(no corruption) and 10 (extreme corruption). The CPI has often been used in empirical
research on corruption (see the studies mentioned in section 1).
I measure intelligence using the IQ data by Lynn and coauthors (2002, 2006 and 2010).
In the base-line model, I use the data by Lynn and Vanhanen (2006), which has also been
used by Jones and Schneider (2010). The data by Lynn and Vanhanen and Lynn and
Meisenberg (2002, 2010) are used in the robustness tests section.1 The IQ data in the
sample have values between 64 and 108.
To illustrate the association between IQ and corruption, I present correlations
between TI’s reversed CPI and the IQ. Figure 2 shows that IQ is negatively associated with
1 Jones and Podemska (2010) elaborate on the quality of the data by Lynn and coauthors (2002, 2006, 2010).
(-)
(-)
(+)
Intelligence
Corruption
Growth
3
corruption. The correlation coefficient between CPI and IQ is -0.63. Countries with high-
IQ populations and low corruption include Hong Kong, Singapore and Japan.
The base-line econometric model has the following form:
Corruptioni = α IQi +Σk δk Continentik + Σl ζl xil +Σm γm Legal Originim + ui
with i = 1,...,125; k=1,...,4; l=1,...,3;m=1,...,4. (1)
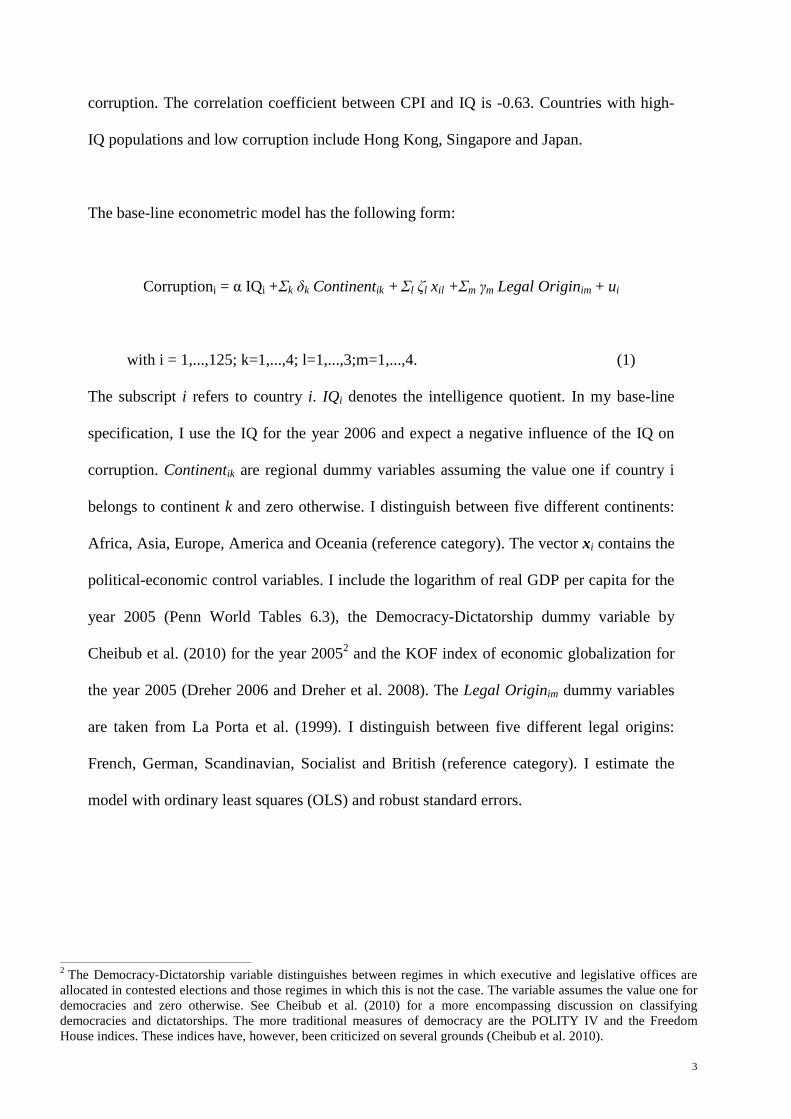
The subscript i refers to country i. IQi denotes the intelligence quotient. In my base-line
specification, I use the IQ for the year 2006 and expect a negative influence of the IQ on
corruption. Continentik are regional dummy variables assuming the value one if country i
belongs to continent k and zero otherwise. I distinguish between five different continents:
Africa, Asia, Europe, America and Oceania (reference category). The vector xi contains the
political-economic control variables. I include the logarithm of real GDP per capita for the
year 2005 (Penn World Tables 6.3), the Democracy-Dictatorship dummy variable by
Cheibub et al. (2010) for the year 20052 and the KOF index of economic globalization for
the year 2005 (Dreher 2006 and Dreher et al. 2008). The Legal Originim dummy variables
are taken from La Porta et al. (1999). I distinguish between five different legal origins:
French, German, Scandinavian, Socialist and British (reference category). I estimate the
model with ordinary least squares (OLS) and robust standard errors.
2 The Democracy-Dictatorship variable distinguishes between regimes in which executive and legislative offices are
allocated in contested elections and those regimes in which this is not the case. The variable assumes the value one for democracies and zero otherwise. See Cheibub et al. (2010) for a more encompassing discussion on classifying democracies and dictatorships. The more traditional measures of democracy are the POLITY IV and the Freedom House indices. These indices have, however, been criticized on several grounds (Cheibub et al. 2010).
4
3. Results
3.1 Basic results
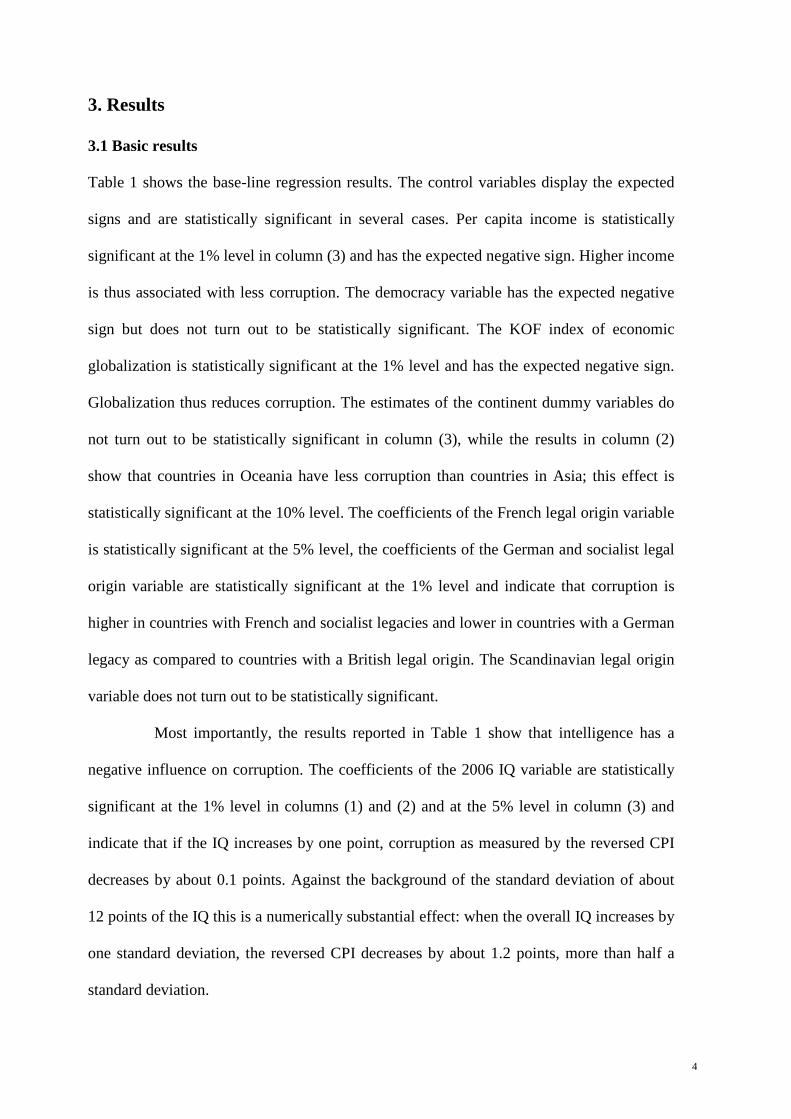
Table 1 shows the base-line regression results. The control variables display the expected
signs and are statistically significant in several cases. Per capita income is statistically
significant at the 1% level in column (3) and has the expected negative sign. Higher income
is thus associated with less corruption. The democracy variable has the expected negative
sign but does not turn out to be statistically significant. The KOF index of economic
globalization is statistically significant at the 1% level and has the expected negative sign.
Globalization thus reduces corruption. The estimates of the continent dummy variables do
not turn out to be statistically significant in column (3), while the results in column (2)
show that countries in Oceania have less corruption than countries in Asia; this effect is
statistically significant at the 10% level. The coefficients of the French legal origin variable
is statistically significant at the 5% level, the coefficients of the German and socialist legal
origin variable are statistically significant at the 1% level and indicate that corruption is
higher in countries with French and socialist legacies and lower in countries with a German
legacy as compared to countries with a British legal origin. The Scandinavian legal origin
variable does not turn out to be statistically significant.
Most importantly, the results reported in Table 1 show that intelligence has a
negative influence on corruption. The coefficients of the 2006 IQ variable are statistically
significant at the 1% level in columns (1) and (2) and at the 5% level in column (3) and
indicate that if the IQ increases by one point, corruption as measured by the reversed CPI
decreases by about 0.1 points. Against the background of the standard deviation of about
12 points of the IQ this is a numerically substantial effect: when the overall IQ increases by
one standard deviation, the reversed CPI decreases by about 1.2 points, more than half a
standard deviation.

5
3.2 Robustness checks
I have checked the robustness of the results in several ways. I have replaced the IQ data by
Lynn and Vanhanen (2006) by the IQ data by Lynn and Vanhanen (2002) and (2010).
When using the data by Lynn and Vanhanen (2002) I have also replaced the political
economic control variables referring to the year 2005 by the political economic control
variables referring to the year 2000. The results reported in Table 2 suggest that using the
data by Lynn and Vanhanen and Lynn and Meisenberg (2002 and 2010) does not change
the base-line estimates.
I have also included further control variables to address possible concerns on omitted
variable bias: average years of schooling (Barro and Lee 2010), social trust (Bjørnskov
2011), size of the shadow economy (Dreher and Schneider 2010), an OECD dummy
variable, trade openness (Penn World Tables 6.3) instead of the KOF index of economic
globalization. Including these variables and also estimating the model with clustered
standard errors by continent does not change the estimates regarding IQ. In particular, IQ
outperforms average years of schooling (all results and descriptive statistics are shown in
the working paper version).
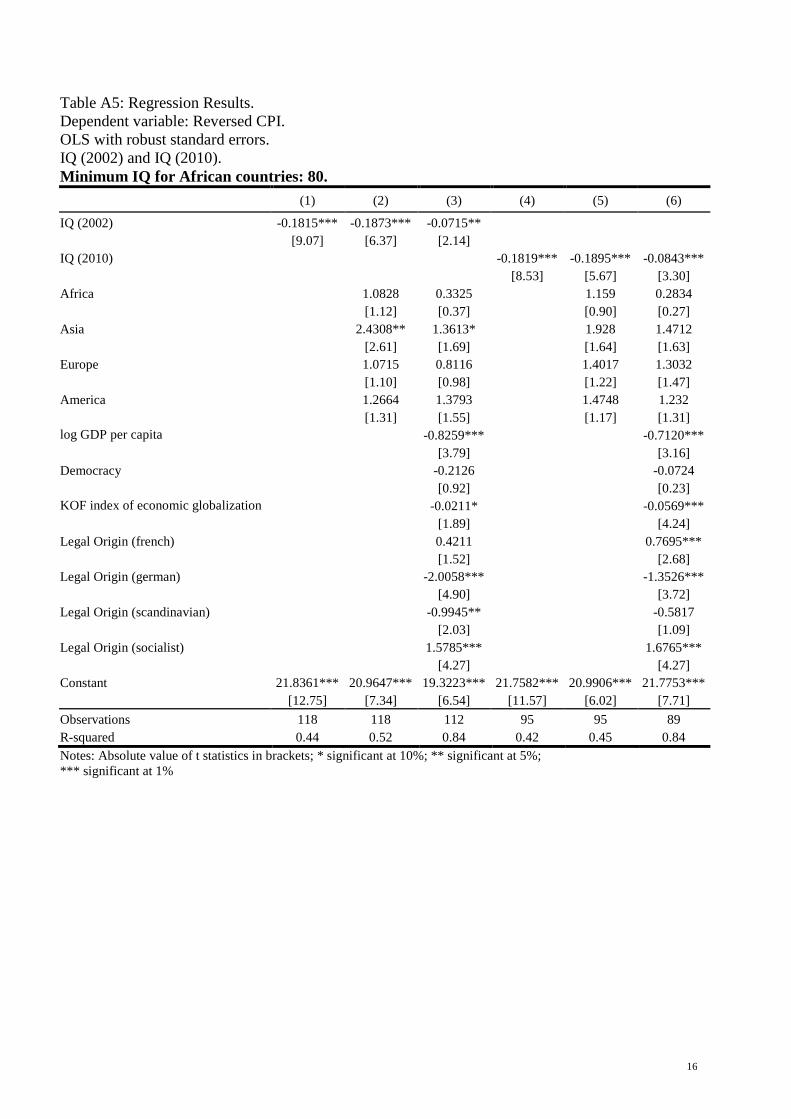
Wicherts et al. have claimed that the African IQ scores in the Lynn/Vanhanen database are
too low. I have therefore raised the lowest scores to 76 (Wicherts et al. 2010a) and 80
(Wicherts et al. 2010b). The results show that winsorizing the data at the levels suggested by
Wicherts et al. increases the influence of IQ on corruption (all results are shown in the working
paper version).
4. Conclusion
The results show that countries with high-IQ populations enjoy less corruption. This
finding corresponds, for example, with the study by Rindermann and Thompson (2011),

6
who find that IQ influences economic freedom, and with the study by Jones (2011)
showing that IQ influences political institutions.
The direct positive effect of intelligence on economic growth (Jones and Schneider
2006, Weede and Kämpf 2002) is thus accompanied by an indirect effect working through
the reduction of corruption.
References Barro, R.J., Lee, J.-W., 2010. A new data set of educational attainment in the world.
1950-2010. NBER Working Paper 15902.
Bjørnskov, C., 2011. Combatting corruption: on the interplay between institutional quality
and trust. Journal of Law and Economics, forthcoming.
Cheibub, J., Gandhi, J., Vreeland, J.R., 2010. Democracy and dictatorship revisited.
Public Choice 143, 67-101.
Dreher, A., 2006. Does globalization affect growth? Evidence from a new index of
globalization. Applied Economics 38, 1091-1110.
Dreher, A., Gaston, N., Martens, P., 2008. Measuring globalization – Gauging its
consequences. Springer, Berlin.
Dreher, A., Schneider, F., 2010. Corruption and the shadow economy: an empirical
analysis. Public Choice 144, 215-238.
Dreher, A., Siemers, L.H., 2009. The nexus between corruption and account
restrictions. Public Choice 140, 245-265.
Gokcekus, O., Suzuki, Y., 2011. Business cycle and corruption.
Economics Letters 111, 138-140.
Jones, G., 2008. Are smarter groups more cooperative? Evidence from Prisoner’s Dilemma
experiments, 1959-2003. Journal of Economic Behavior and Organization 68, 489-497.
Jones, G., 2011. National IQ and national productivity: The hive mind across Asia.
Asian Development Review 28, 58-71.
Jones, G., Podemska, M., 2010. IQ in the utility function: cognitive skills, time preference
and cross-country differences in savings rates. Working Paper, GMU, Virginia.
Jones, G., Schneider, W.J., 2006. Intelligence, human capital and economic growth:
A Bayesian averaging of classical estimates (BACE) approach.
Journal of Economic Growth 11, 71-93.

7
Jones, G., Schneider, W.J., 2010. IQ in the production function: evidence from immigrant
earnings. Economic Inquiry 48, 743-755.
La Porta, R., Lopez-di-Silanes, F., Shleifer, A., Vishny, R., 1999. The quality of
government. Journal of Law, Economics and Organization 15, 222-279.
Lynn, R., Meisenberg, G., 2010. National IQs calculated and validated for 108 nations.
Intelligence 38, 353-360.
Lynn, R., Vanhanen, T., 2002. IQ and the wealth of nations.
Westport, CT: Praeger Publishers.
Lynn, R., Vanhanen, T., 2006. IQ and global inequality.
Augusta, GA: Washington Summit Publishers.
Méon, P.-G., Sekkat, K., 2005. Does corruption grease or sand the wheels of growth?
Public Choice 122, 69-97.
Rindermann, H., Thompson, J., 2011. Cognitive capitalism: the effect of cognitive
ability on wealth, as mediated through scientific achievement and economic freedom.
Psychological Science 22, 754-763.
Olson, M.C., 2000. Power and prosperity. Basic Books, New York.
Shamosh, N., Gray, R., 2008. Delay discounting and intelligence: A
meta-analysis. Intelligence 36, 289-305.
Weede, E., Kämpf, S., 2002. The impact of intelligence and institutional improvements
on economic growth. Kyklos 55, 361-380.
Wicherts, J.M., Dolan, C.V., Carlson, J.S., van der Maas, H.L.J., 2010a. Another failure
to replicate Lynn´s estimate of the average IQ of sub-Saharan Africans.
Learning and Individual Differences 20, 155-157.
Wicherts, J.M., Dolan, C.V., Carlson, J.S., van der Maas, H.L.J., 2010b. Raven´s test
performance of sub-Saharan Africans: Average performance, psychometric properties,
and the Flynn effect. Learning and Individual Differences 20, 135-151.

8
Figure 2: Corruption (2010) and IQ (2006).
ALB
AGO
ARGARM
AUS
AUT
AZEBGD
BRB
BEL
BEN BOLBIH
BWA
BRA BGR
BFA
BDICMR
CAN
CAFTCD
CHL
CHNCOL
ZAR
CRI
CIV
HRV
CYP
CZE
DNK
DOM
ECU
EGY
SLV
EST
ETH
FIN
FRA
GEO
GER
GHA
GRCGTM
GNB
GUY
HTIHND
HKG
HUN
ISL
IND
IDN
IRL
ISR
ITA
JAM
JPN
JOR
KAZ
KEN KGZ
LVA
LSO
LTU
LUX
MDG
MWI
MYS
MLI
MLT
MRT
MUS
MEXMNG
MAR
MOZ
NAM
NPL
NLD
NZL
NICNER
NOR
PAK
PAN
PNGPRY
PER
PHL
POL
PRT
KOR
MDA
ROM
RUS
RWA
SEN
SLE
SGP
SVKZAF
ESP
LKA
SWE
CHE
SYR
TWN
THA
TGO
TTO
TUN TUR
UGA UKR
GBR
TZA
URY
VEN
VNMZMB
ZWE LBN
02
46
8C
orru
ptio
n
60 70 80 90 100 110IQ
Correlation coefficient: -0.63. Source: Transparency International (2010) and Lynn and Vanhanen (2006)

9
Table 1: Regression Results. Dependent variable: Reversed CPI. OLS with robust standard errors. IQ 2006.
(1) (2) (3)
IQ -0.1140*** -0.1501*** -0.0526** [9.34] [6.53] [2.23] Africa 0.3996 -0.0138 [0.27] [0.01] Asia 2.5606* 1.4762 [1.94] [1.35] Europe 1.3238 1.0565 [1.01] [0.98] America 1.5556 1.385 [1.13] [1.19] log GDP per capita -0.7479*** [3.07] Democracy -0.2007 [0.88] KOF index of economic globalization -0.0336** [2.50] Legal Origin (french) 0.6677** [2.45] Legal Origin (german) -1.6493*** [4.08] Legal Origin (scandinavian) -0.7854 [1.44] Legal Origin (socialist) 1.7243*** [5.07] Constant 15.5498*** 17.3074*** 17.7084*** [15.96] [6.49] [7.30]
Observations 125 125 119 R-squared 0.40 0.49 0.8
Notes: Absolute value of t statistics in brackets; * significant at 10%; ** significant at 5%; *** significant at 1%

10
Table 2: Regression Results. Dependent variable: Reversed CPI. OLS with robust standard errors. IQ (2002) and IQ (2010).
(1) (2) (3) (4) (5) (6)
IQ (2002) -0.1224*** -0.1558*** -0.0491*
[8.73] [6.23] [1.84]
IQ (2010) -0.1246*** -0.1422*** -0.0531**
[7.13] [4.72] [2.30]
Africa 0.0585 0.1007 0.725 0.0518
[0.05] [0.10] [0.46] [0.04]
Asia 2.4408** 1.4169* 1.9912 1.4669
[2.35] [1.67] [1.45] ,[1.48]
Europe 0.8894 0.8415 1.2457 1.2394
[0.82] [0.96] [0.92] [1.29]
America 1.4639 1.5617* 1.6247 1.2467
[1.37] [1.72] [1.12] [1.20]
log GDP per capita -0.8324*** -0.7607***
[3.51] [3.01]
Democracy -0.2496 -0.1702
[1.09] [0.51]
KOF index of economic globalization -0.0244** -0.0591***
[2.20] [4.35]
Legal Origin (french) 0.3551 0.8841***
[1.28] [2.85]
Legal Origin (german) -2.0966*** -1.3906***
[5.34] [3.72]
Legal Origin (scandinavian) -1.2145*** -0.7661
[2.90] [1.43]
Legal Origin (socialist) 1.4623*** 1.6533***
[4.05] [3.97]
Constant 16.3133*** 18.0778*** 17.5763*** 16.3458*** 16.5724*** 19.5600***
[14.27] [7.18] [7.14] [10.69] [5.02] [7.29]
Observations 118 118 112 95 95 89
R-squared 0.38 0.50 0.83 0.34 0.39 0.83
Notes: Absolute value of t statistics in brackets; * significant at 10%; ** significant at 5%; *** significant at 1%

11
Additional Tables
12
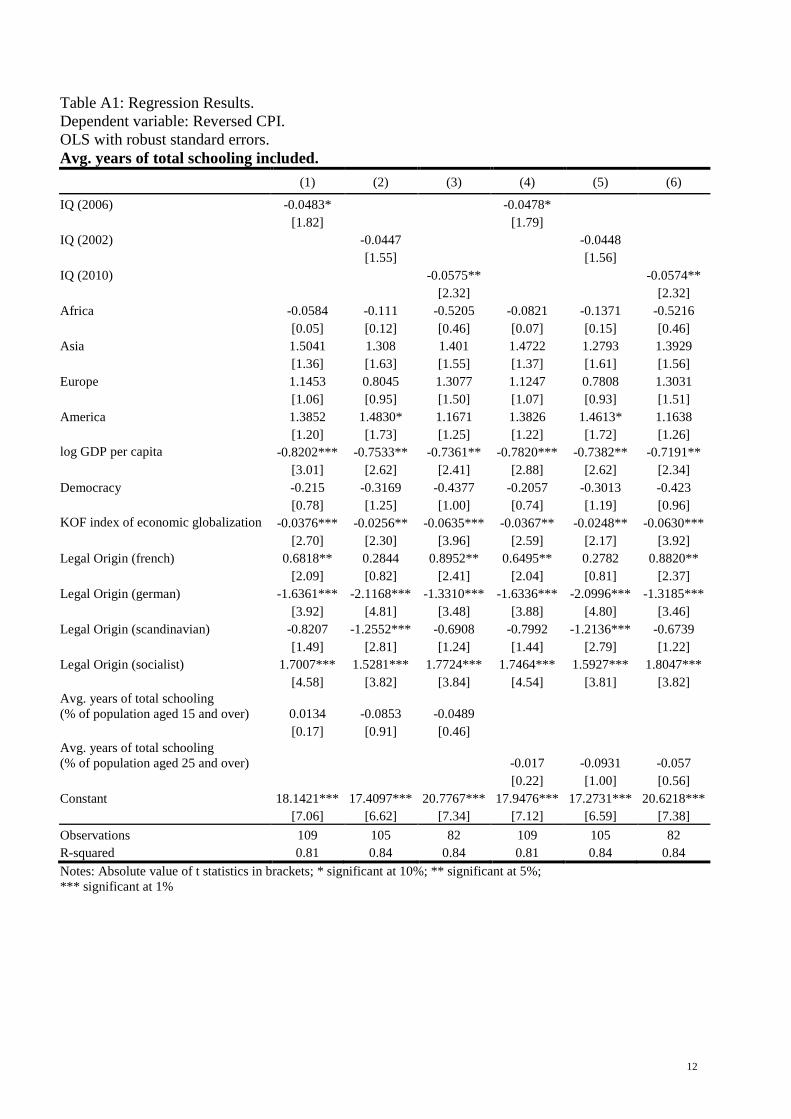
Table A1: Regression Results. Dependent variable: Reversed CPI. OLS with robust standard errors. Avg. years of total schooling included.
(1) (2) (3) (4) (5) (6)
IQ (2006) -0.0483* -0.0478* [1.82] [1.79] IQ (2002) -0.0447 -0.0448 [1.55] [1.56] IQ (2010) -0.0575** -0.0574** [2.32] [2.32] Africa -0.0584 -0.111 -0.5205 -0.0821 -0.1371 -0.5216 [0.05] [0.12] [0.46] [0.07] [0.15] [0.46] Asia 1.5041 1.308 1.401 1.4722 1.2793 1.3929 [1.36] [1.63] [1.55] [1.37] [1.61] [1.56] Europe 1.1453 0.8045 1.3077 1.1247 0.7808 1.3031 [1.06] [0.95] [1.50] [1.07] [0.93] [1.51] America 1.3852 1.4830* 1.1671 1.3826 1.4613* 1.1638 [1.20] [1.73] [1.25] [1.22] [1.72] [1.26] log GDP per capita -0.8202*** -0.7533** -0.7361** -0.7820*** -0.7382** -0.7191** [3.01] [2.62] [2.41] [2.88] [2.62] [2.34] Democracy -0.215 -0.3169 -0.4377 -0.2057 -0.3013 -0.423 [0.78] [1.25] [1.00] [0.74] [1.19] [0.96] KOF index of economic globalization -0.0376*** -0.0256** -0.0635*** -0.0367** -0.0248** -0.0630*** [2.70] [2.30] [3.96] [2.59] [2.17] [3.92] Legal Origin (french) 0.6818** 0.2844 0.8952** 0.6495** 0.2782 0.8820** [2.09] [0.82] [2.41] [2.04] [0.81] [2.37] Legal Origin (german) -1.6361*** -2.1168*** -1.3310*** -1.6336*** -2.0996*** -1.3185*** [3.92] [4.81] [3.48] [3.88] [4.80] [3.46] Legal Origin (scandinavian) -0.8207 -1.2552*** -0.6908 -0.7992 -1.2136*** -0.6739 [1.49] [2.81] [1.24] [1.44] [2.79] [1.22] Legal Origin (socialist) 1.7007*** 1.5281*** 1.7724*** 1.7464*** 1.5927*** 1.8047*** [4.58] [3.82] [3.84] [4.54] [3.81] [3.82] Avg. years of total schooling (% of population aged 15 and over) 0.0134 -0.0853 -0.0489
[0.17] [0.91] [0.46] Avg. years of total schooling (% of population aged 25 and over) -0.017 -0.0931 -0.057 [0.22] [1.00] [0.56] Constant 18.1421*** 17.4097*** 20.7767*** 17.9476*** 17.2731*** 20.6218*** [7.06] [6.62] [7.34] [7.12] [6.59] [7.38]
Observations 109 105 82 109 105 82 R-squared 0.81 0.84 0.84 0.81 0.84 0.84 Notes: Absolute value of t statistics in brackets; * significant at 10%; ** significant at 5%; *** significant at 1%

13
Table A2: Regression Results. Dependent variable: Reversed CPI. OLS with robust standard errors. IQ 2006. Minimum IQ for African countries: 76.
(1) (2) (3)
IQ -0.1507*** -0.1781*** -0.0731** [9.41] [6.61] [2.51] Africa 0.8835 0.0725 [0.68] [0.06] Asia 2.5293** 1.4154 [2.11] [1.36] Europe 1.4247 0.9984 [1.19] [0.96] America 1.3143 1.1975 [1.04] [1.06] log GDP per capita -0.7067*** [2.93] Democracy -0.174 [0.75] KOF index of economic globalization -0.0321** [2.37] Legal Origin (french) 0.7156*** [2.64] Legal Origin (german) -1.5363*** [3.65] Legal Origin (scandinavian) -0.5881 [1.02] Legal Origin (socialist) 1.8344*** [5.25] Constant 18.9744*** 19.9184*** 19.1000*** [14.21] [6.81] [7.16]
Observations 125 125 119 R-squared 0.44 0.51 0.81 Notes: Absolute value of t statistics in brackets; * significant at 10%; ** significant at 5%; *** significant at 1%

14
Table A3: Regression Results. Dependent variable: Reversed CPI. OLS with robust standard errors. IQ (2002) and IQ (2010). Minimum IQ for African countries: 76.
(1) (2) (3) (4) (5) (6)
IQ (2002) -0.1585*** -0.1817*** -0.0698**
[9.09] [6.41] [2.08]
IQ (2010) -0.1590*** -0.1765*** -0.0778*** [8.15] [5.46] [3.14] Africa 0.5422 0.1232 0.8325 0.1003 [0.53] [0.13] [0.60] [0.09] Asia 2.4326** 1.3600* 1.9454 1.4354 [2.56] [1.66] [1.58] [1.53] Europe 1.0393 0.7843 1.3588 1.232 [1.04] [0.93] [1.13] [1.35] America 1.3013 1.3782 1.516 1.1855 [1.32] [1.53] [1.16] [1.21] log GDP per capita -0.8002*** -0.7026*** [3.47] [2.97] Democracy -0.2102 -0.0883 [0.91] [0.28] KOF index of economic globalization -0.0221** -0.0577*** [1.99] [4.28] Legal Origin (french) 0.4432 0.8574*** [1.56] [2.94] Legal Origin (german) -1.9982*** -1.3189*** [4.86] [3.61] Legal Origin (scandinavian) -1.0098** -0.5882 [2.09] [1.10] Legal Origin (socialist) 1.6018*** 1.7296*** [4.17] [4.29] Constant 19.6565*** 20.4545*** 18.9965*** 19.5760*** 19.7744*** 21.1385*** [13.43] [7.38] [6.67] [11.43] [5.79] [7.71]
Observations 118 118 112 95 95 89 R-squared 0.42 0.51 0.84 0.39 0.43 0.84 Notes: Absolute value of t statistics in brackets; * significant at 10%; ** significant at 5%; *** significant at 1%

15
Table A4: Regression Results. Dependent variable: Reversed CPI. OLS with robust standard errors. IQ 2006. Minimum IQ for African countries: 80.
(1) (2) (3)
IQ -0.1719*** -0.1843*** -0.0752** [9.15] [6.50] [2.56] Africa 1.3977 0.2877 [1.12] [0.25] Asia 2.5224** 1.4133 [2.15] [1.38] Europe 1.4472 1.0241 [1.24] [1.01] America 1.2606 1.1935 [1.01] [1.08] log GDP per capita -0.7335*** [3.21] Democracy -0.1719 [0.74] KOF index of economic globalization -0.0310** [2.28] Legal Origin (french) 0.6846** [2.58] Legal Origin (german) -1.5385*** [3.64] Legal Origin (scandinavian) -0.5643 [0.97] Legal Origin (socialist) 1.8095*** [5.34] Constant 21.0025*** 20.4993*** 19.4794*** [13.10] [6.76] [7.03]
Observations 125 125 119 R-squared 0.46 0.51 0.81 Notes: Absolute value of t statistics in brackets; * significant at 10%; ** significant at 5%; *** significant at 1%
16
Table A5: Regression Results. Dependent variable: Reversed CPI. OLS with robust standard errors. IQ (2002) and IQ (2010). Minimum IQ for African countries: 80.
(1) (2) (3) (4) (5) (6)
IQ (2002) -0.1815*** -0.1873*** -0.0715**
[9.07] [6.37] [2.14]
IQ (2010) -0.1819*** -0.1895*** -0.0843*** [8.53] [5.67] [3.30] Africa 1.0828 0.3325 1.159 0.2834 [1.12] [0.37] [0.90] [0.27] Asia 2.4308** 1.3613* 1.928 1.4712 [2.61] [1.69] [1.64] [1.63] Europe 1.0715 0.8116 1.4017 1.3032 [1.10] [0.98] [1.22] [1.47] America 1.2664 1.3793 1.4748 1.232 [1.31] [1.55] [1.17] [1.31] log GDP per capita -0.8259*** -0.7120*** [3.79] [3.16] Democracy -0.2126 -0.0724 [0.92] [0.23] KOF index of economic globalization -0.0211* -0.0569*** [1.89] [4.24] Legal Origin (french) 0.4211 0.7695*** [1.52] [2.68] Legal Origin (german) -2.0058*** -1.3526*** [4.90] [3.72] Legal Origin (scandinavian) -0.9945** -0.5817 [2.03] [1.09] Legal Origin (socialist) 1.5785*** 1.6765*** [4.27] [4.27] Constant 21.8361*** 20.9647*** 19.3223*** 21.7582*** 20.9906*** 21.7753*** [12.75] [7.34] [6.54] [11.57] [6.02] [7.71]
Observations 118 118 112 95 95 89 R-squared 0.44 0.52 0.84 0.42 0.45 0.84 Notes: Absolute value of t statistics in brackets; * significant at 10%; ** significant at 5%; *** significant at 1%

17
Table A6: Regression Results. Dependent variable: Reversed CPI. OLS with robust standard errors. Avg. years of total schooling included. Minimum IQ for African countries: 76.
(1) (2) (3) (4) (5) (6)
IQ (2006) -0.0659** -0.0655** [2.11] [2.09] IQ (2002) -0.0606* -0.0607* [1.79] [1.80] IQ (2010) -0.0865*** -0.0865*** [3.36] [3.37] Africa 0.0275 -0.0613 -0.5052 0.004 -0.0872 -0.5079 [0.02] [0.07] [0.49] [0.00] [0.10] [0.49] Asia 1.4608 1.2659 1.3596 1.4328 1.2369 1.3517 [1.38] [1.63] [1.65] [1.39] [1.61] [1.66] Europe 1.0953 0.7507 1.279 1.0767 0.7268 1.2756 [1.05] [0.92] [1.59] [1.05] [0.90] [1.60] America 1.2291 1.3416 1.0788 1.2264 1.3194 1.0755 [1.09] [1.58] [1.27] [1.11] [1.57] [1.29] log GDP per capita -0.7823*** -0.7256** -0.6480** -0.7483*** -0.7105** -0.6333** [2.87] [2.58] [2.14] [2.78] [2.59] [2.09] Democracy -0.1862 -0.2633 -0.3478 -0.1782 -0.2472 -0.334 [0.66] [1.04] [0.85] [0.63] [0.98] [0.81] KOF index of economic globalization -0.0361** -0.0237** -0.0617*** -0.0353** -0.0229* -0.0612*** [2.58] [2.11] [3.84] [2.49] [1.98] [3.80] Legal Origin (french) 0.7147** 0.3441 0.8672** 0.6868** 0.3382 0.8561** [2.22] [0.97] [2.53] [2.17] [0.97] [2.50] Legal Origin (german) -1.5414*** -2.0428*** -1.2349*** -1.5389*** -2.0249*** -1.2198*** [3.55] [4.50] [3.35] [3.53] [4.50] [3.33] Legal Origin (scandinavian) -0.6551 -1.1012** -0.4731 -0.636 -1.0583** -0.4534 [1.13] [2.23] [0.86] [1.09] [2.20] [0.83] Legal Origin (socialist) 1.8026*** 1.6457*** 1.8872*** 1.8433*** 1.7115*** 1.9211*** [4.67] [4.06] [4.17] [4.66] [4.10] [4.15] Avg. years of total schooling (% of population aged 15 and over) 0.0116 -0.0877 -0.0608
[0.15] [0.93] [0.60] Avg. years of total schooling (% of population aged 25 and over) -0.015 -0.0954 -0.0667 [0.20] [1.04] [0.69] Constant 19.3230*** 18.4757*** 22.5621*** 19.1516*** 18.3387*** 22.4090*** [6.88] [6.31] [7.93] [6.91] [6.27] [7.97]
Observations 109 105 82 109 105 82 R-squared 0.81 0.85 0.85 0.81 0.85 0.85 Notes: Absolute value of t statistics in brackets; * significant at 10%; ** significant at 5%; *** significant at 1%

18
Table A7: Regression Results. Dependent variable: Reversed CPI. OLS with robust standard errors. Avg. years of total schooling included. Minimum IQ for African countries: 80.
(1) (2) (3) (4) (5) (6)
IQ (2006) -0.0689** -0.0684** [2.24] [2.21] IQ (2002) -0.0629* -0.0629* [1.87] [1.87] IQ (2010) -0.0938*** -0.0936*** [3.58] [3.59] Africa 0.2215 0.1218 -0.3146 0.1991 0.0985 -0.3163 [0.19] [0.14] [0.32] [0.17] [0.12] [0.32] Asia 1.4628 1.2699 1.4007* 1.4372 1.2425 1.3944* [1.41] [1.66] [1.78] [1.42] [1.64] [1.79] Europe 1.1203 0.7751 1.3681* 1.1031 0.7527 1.3658* [1.09] [0.97] [1.75] [1.10] [0.95] [1.77] America 1.2172 1.3359 1.1338 1.2161 1.3157 1.1317 [1.10] [1.59] [1.40] [1.12] [1.58] [1.41] log GDP per capita -0.8100*** -0.7508*** -0.6718** -0.7786*** -0.7368*** -0.6604** [3.13] [2.78] [2.28] [3.06] [2.81] [2.25] Democracy -0.1725 -0.2566 -0.3446 -0.1656 -0.2411 -0.3332 [0.62] [1.01] [0.85] [0.59] [0.95] [0.82] KOF index of economic globalization -0.0352** -0.0228** -0.0611*** -0.0344** -0.0221* -0.0606*** [2.50] [2.01] [3.81] [2.41] [1.90] [3.78] Legal Origin (french) 0.6913** 0.3326 0.7755** 0.6650** 0.3266 0.7665** [2.18] [0.95] [2.29] [2.14] [0.95] [2.26] Legal Origin (german) -1.5385*** -2.0429*** -1.2733*** -1.5377*** -2.0261*** -1.2606*** [3.55] [4.51] [3.47] [3.52] [4.51] [3.46] Legal Origin (scandinavian) -0.6271 -1.0784** -0.4675 -0.6113 -1.0382** -0.4514 [1.07] [2.14] [0.85] [1.04] [2.12] [0.83] Legal Origin (socialist) 1.7813*** 1.6266*** 1.8174*** 1.8175*** 1.6887*** 1.8459*** [4.79] [4.18] [4.11] [4.77] [4.21] [4.09] Avg. years of total schooling (% of population aged 15 and over) 0.0145 -0.0848 -0.0543
[0.19] [0.90] [0.54] Avg. years of total schooling (% of population aged 25 and over) -0.0104 -0.0921 -0.0588 [0.14] [1.00] [0.62] Constant 19.7546*** 18.8312*** 23.3503*** 19.5918*** 18.6922*** 23.2122*** [6.81] [6.17] [7.97] [6.82] [6.13] [8.01]
Observations 109 105 82 109 105 82 R-squared 0.81 0.85 0.85 0.81 0.85 0.85 Notes: Absolute value of t statistics in brackets; * significant at 10%; ** significant at 5%; *** significant at 1%

19
Table A8: Regression Results. Dependent variable: Reversed CPI. OLS with robust standard errors clustered by continent. IQ 2006.
(1) (2) (3)
IQ -0.1140*** -0.1501** -0.0526*** [4.67] [4.36] [4.64] Africa 0.3996 -0.0138 [0.52] [0.03] Asia 2.5606*** 1.4762*** [66.52] [12.39] Europe 1.3238*** 1.0565*** [10.67] [7.51] America 1.5556*** 1.3850*** [5.24] [6.92] log GDP per capita -0.7479** [2.99] Democracy -0.2007 [0.79] KOF index of economic globalization -0.0336* [2.17] Legal Origin (french) 0.6677** [4.42] Legal Origin (german) -1.6493*** [9.53] Legal Origin (scandinavian) -0.7854* [2.31] Legal Origin (socialist) 1.7243*** [16.41] Constant 15.5498*** 17.3074*** 17.7084*** [7.47] [5.39] [7.58]
Observations 125 125 119 R-squared 0.40 0.49 0.8 Notes: Absolute value of t statistics in brackets; * significant at 10%; ** significant at 5%; *** significant at 1%

20
Table A9: Regression Results. Dependent variable: Reversed CPI. OLS with robust standard errors clustered by continent. IQ (2002) and IQ (2010).
(1) (2) (3) (4) (5) (6)
IQ (2002) -0.1224** -0.1558** -0.0491***
[3.52] [3.58] [5.30]
IQ (2010) -0.1246** -0.1422* -0.0531 [3.70] [2.42] [1.88] Africa 0.0585 0.1007 0.725 0.0518 [0.07] [0.16] [0.65] [0.07] Asia 2.4408*** 1.4169*** 1.9912*** 1.4669*** [177.94] [5.43] [25.37] [7.72] Europe 0.8894** 0.8415*** 1.2457*** 1.2394*** [3.54] [4.65] [6.42] [4.72] America 1.4639*** 1.5617*** 1.6247*** 1.2467*** [5.37] [6.00] [8.72] [5.99] log GDP per capita -0.8324* -0.7607** [2.73] [3.16] Democracy -0.2496 -0.1702 [1.74] [0.70] KOF index of economic globalization -0.0244 -0.0591** [1.71] [3.48] Legal Origin (french) 0.3551 0.8841** [1.62] [3.16] Legal Origin (german) -2.0966*** -1.3906*** [5.97] [7.72] Legal Origin (scandinavian) -1.2145** -0.7661** [2.98] [3.99] Legal Origin (socialist) 1.4623*** 1.6533*** [5.08] [7.25] Constant 16.3133*** 18.0778** 17.5763*** 16.3458*** 16.5724** 19.5600*** [5.51] [4.53] [6.06] [5.38] [3.02] [5.72]
Observations 118 118 112 95 95 89 R-squared 0.38 0.5 0.83 0.34 0.39 0.83 Notes: Absolute value of t statistics in brackets; * significant at 10%; ** significant at 5%; *** significant at 1%

21
Table A10: Regression Results. Dependent variable: Reversed CPI. OLS with robust standard errors. KOF index replaced by trade openness, trust, size of the shadow economy, OECD dummy all together included. Most conservative estimates.
(1) (2) (3)
IQ (2006) -0.0468* [1.70] IQ (2002) -0.0477* [1.86] IQ (2010) -0.0264 [0.92] Africa 0.4513 0.6984 0.6224 [0.47] [0.72] [0.75] Asia 2.3436*** 2.5684*** 2.0994*** [3.77] [4.15] [4.04] Europe 1.8834*** 1.8288*** 1.6084*** [3.29] [3.09] [3.23] America 1.9613** 2.3442*** 1.5000** [2.37] [2.97] [2.48] log GDP per capita -0.8675*** -0.9749*** -0.8297*** [4.38] [5.34] [3.32] Democracy -0.2483 -0.0362 -0.6712* [0.85] [0.13] [1.91] Trade openness -0.0057*** -0.0011 -0.0081*** [2.96] [0.32] [4.34] Legal Origin (french) 0.4006 0.0944 0.8220** [1.34] [0.34] [2.52] Legal Origin (german) -1.3358** -1.6223*** -0.9474 [2.03] [2.74] [1.54] Legal Origin (scandinavian) -0.2971 -0.6486 -0.1568 [0.52] [1.22] [0.32] Legal Origin (socialist) 1.2554*** 1.1030*** 1.1109** [3.37] [2.99] [2.23] Trust -0.0194 -0.0212** -0.0269* [1.56] [2.27] [1.71] Shadow economy 0.0215 0.0188* 0.0264 [1.59] [1.68] [1.34] OECD -0.2267 -0.1502 -0.3408 [0.50] [0.34] [0.74] Constant 15.9613*** 16.2734*** 14.5290*** [4.92] [5.33] [4.30]
Observations 98 94 82 R-squared 0.83 0.87 0.83 Notes: Absolute value of t statistics in brackets; * significant at 10%; ** significant at 5%; *** significant at 1%

22
Table A11. Descriptive statistics and data sources.
Variable Observations Mean Std. Dev. Min Max Source
reversed CPI (2010) 125 5.75 2.23 0.70 8.6 Transparency International reversed CPI (2005) 119 5.69 2.26 0.30 8.3 Transparency International IQ (2006) 128 85.95 12.15 64 108 Lynn and Vanhanen (2006) IQ (2002) 127 86.09 11.76 63 107 Lynn and Vanhanen (2002) IQ (2010) 85 90.41 10.72 60 108 Lynn and Meisenberg (2010)
IQ (2006) African minimum 76 128 87.70 9.70 67 108 Lynn and Vanhanen (2006), own calculations
IQ (2002) African minimum 76 127 87.65 9.54 72 107 Lynn and Vanhanen (2002) own calculations
IQ (2010) African minimum 76 85 91.29 8.98 76 108 Lynn and Meisenberg (2010) own calculations
IQ (2006) African minimum 80 128 88.63 8.66 67 108 Lynn and Vanhanen (2006), own calculations
IQ (2002) African minimum 80 127 88.60 8.48 72 107 Lynn and Vanhanen (2002) own calculations
IQ (2010) African minimum 80 85 91.86 8.07 79 108 Lynn and Meisenberg (2010) own calculations
GDP per capita (real) 2005 126 12284.30 12664.17 366.13 71209.27 Penn World Tables 6.3
GDP per capita (real) 2000 126 9459.83 9976.68 352.83 54108.91 Penn World Tables 6.3
KOF index of economic globalization 2005 123 63.56 16.18 30.38 96.34
Dreher (2006) and Dreher et al. (2008)
KOF index of economic globalization 2000 123 60.57 18.23 23.01 97.33
Dreher (2006) and Dreher et al. (2008)
Democracy 2005 126 0.68 0.47 0 1 Cheibub et al. (2010) Democracy 2000 126 0.66 0.48 0 1 Cheibub et al. (2010) Africa 128 0.28 0.45 0 1 own calculation Asia 128 0.20 0.40 0 1 own calculation Europe 128 0.22 0.42 0 1 own calculation Americas 128 0.27 0.44 0 1 own calculation Oceania 128 0.03 0.17 0 1 own calculation Legal Origin (UK) 127 0.28 0.45 0 1 La Porta et al. (1999) Legal Origin (french) 127 0.45 0.50 0 1 La Porta et al. (1999) Legal Origin (german) 127 0.04 0.20 0 1 La Porta et al. (1999) Legal Origin (scandinvian) 127 0.05 0.21 0 1 La Porta et al. (1999) Legal Origin (socialist) 127 0.18 0.39 0 1 La Porta et al. (1999) Avg. years of total schooling (% of population aged 15 and over) 2005 116 7.96 2.70 1.24 12.75 Barro and Lee (2010) Avg. years of total schooling (% of population aged 15 and over) 2000 116 7.51 2.70 1.05 12.16 Barro and Lee (2010) Avg. years of total schooling (% of population aged 25 and over) 2005 116 7.65 2.94 1.07 13.09 Barro and Lee (2010) Avg. years of total schooling (% of population aged 15 and over) 2000 116 7.19 2.92 0.89 12.04 Barro and Lee (2010) Social trust 101 25.88 13.61 3.79 68.08 Bjørnskov (2011) Trade openness 2005 126 94.91 58.78 26.65 446.06 Penn World Tables 6.3 Trade openness 2000 126 86.76 52.89 13.28 377.68 Penn World Tables 6.3 Shadow Economy 2005 126 32.64 12.98 8.5 65.1 Dreher and Schneider (2010) Shadow Economy 2000 126 33.85 13.46 8.6 67.3 Dreher and Schneider (2010) OECD 128 0.23 0.42 0 1 own calculation