integrity of data in a mobile crowdsensing campaign: a ... · integrity of data in a mobile...
TRANSCRIPT
Integrity of Data in a Mobile Crowdsensing Campaign: A CaseStudy
Heng ZhangPurdue University
West Lafayette, [email protected]
Saurabh BagchiPurdue University
West Lafayette, [email protected]
He WangPurdue University
West Lafayette, [email protected]
ABSTRACT
Mobile crowdsensing (MCS) has a huge potential to provide soci-etal benefits by effectively utilizing the sensing, computing, andnetworking capability of mobile devices, which have become ubiqui-tous especially in the developed world. However, many challengescome along with MCS such as energy cost, privacy issues, andthe data integrity of crowd-sensed data. In this paper, we focus onanalyzing the data integrity of mobile crowdsensed data in a userstudy of 60 people who participate in a crowdsensing campaign thatcollects barometric pressure data from various parts of our campus.Each set of 20 users runs one of the three different crowdsensingframeworks, one of which, called Sense-Aid, is an energy-efficientframework designed by us. We analyze the characteristics of thedata with respect to their integrity. From our analysis, we find thatfor 90 MCS tasks there is a surprisingly high number of outliervalues (close to 20%), only about 10% of the participants reportdata for the entire duration of 7 days of the MCS campaign, andusing a reputation system to filter out spurious data values helpsin getting within 0.8% of the ground truth barometric pressure,whereas not using the reputation system leads to a discrepancy ofabout 20%. We hope our analysis will provide a useful reference toMCS researchers and developers in their future work running MCScampaigns.
KEYWORDS
Mobile Crowdsensing, Data integrity, Data analysisACM Reference format:
Heng Zhang, Saurabh Bagchi, and He Wang. 2017. Integrity of Data ina Mobile Crowdsensing Campaign: A Case Study. In Proceedings of ACMWorkshop, Delft, The Netherlands, November 2017 (CrowdSense’17), 6 pages.https://doi.org/10.475/123_4
1 INTRODUCTION
Mobile Crowdsensing (MCS) refers to an activity where data issensed and generated by multitudes of people using devices thatthey carry with them, typically mobile cellular devices, and thedata is consumed by a MCS server. The MCS server synthesizesthe sensed data time and space to determine some information ofrelevance to the MCS campaign organizers. MCS has become a
Permission to make digital or hard copies of part or all of this work for personal orclassroom use is granted without fee provided that copies are not made or distributedfor profit or commercial advantage and that copies bear this notice and the full citationon the first page. Copyrights for third-party components of this work must be honored.For all other uses, contact the owner/author(s).CrowdSense’17, November 2017, Delft, The Netherlands© 2017 Copyright held by the owner/author(s).ACM ISBN 123-4567-24-567/08/06. . . $15.00https://doi.org/10.475/123_4
popular way to collect information about some phenomenon thathappens over a period of time or a spread out geographical region(or both). For example, the data contributed from participants canbe used to improve noise pollution [17], or to provide gas priceinformation [5]. There are two main categories in MCS which areparticipatory crowdsensing and opportunistic crowdsensing. Theformer requires a user’s active involvement such us taking a photoat a specific location and sending it to server. The latter relies onlyon the devices without a user’s active involvement. For example, anMCS application for determining noise pollution level can periodi-cally sample the noise level through the microphone sensor. MCSis beneficial in many areas because of its flexibility and wide uti-lization of the powerful resources on millions of mobile devices tocollaboratively serve a common purpose. For example, to broadcasta real-time and reliable weather map of an approaching tornado,rather than relying on traditional air pressure measurement sta-tions across the city, MCS can be used by sampling the barometricreading from barometer sensors on smartphones. However, manychallenges exist in designing an MCS campaign and they have tobe addressed before MCS can be widely adapted into our daily lives.For example, ensuring the integrity of the collected ata is a big chal-lenge. During an MCS campaign, the data provided by users maybe misleading (e.g. intentionally falsified data, hardware/softwarefailure, network issues) and therefore results in inaccuracy or evenwrong conclusion. There are other challenges such as user privacy,energy cost, users’ incentives. To motivate more participants andto provide confidence in the results of an MCS campaign, thesechallenges have to be resolved.
Our focus in this paper is on the data integrity challenge in aMCS campaign. A variety of factors that threaten data integrity inan MCS activity are discussed in [8, 9]. Because MCS requires theinvolvement of unpredictable participants, the MCS server can geterroneous or malicious data input. Intentionally, MCS participantsmay submit fake data. For example, in a transportation MCS cam-paign, participants may report wrong traffic condition informationbecause they do not want other people to choose a route that goesnear their homes. Unintentionally, there may be environmental rea-sons such as uncertainty in GPS location when participants moveindoors. There are other natural reasons leading to faulty data, suchas hardware failures on mobile sensing devices, network congestionaffecting data transmission, noise in sensed data, etc. Besides evenif each participant contributes accurate data, the overall aggregatedata may not be accurate because of lack of enough temporal orspatial granularity.
In this paper, we describe a user study for an MCS campaignthat we conducted on our campus and the data integrity issuesthat arose. The user study was conducted to evaluate the energy
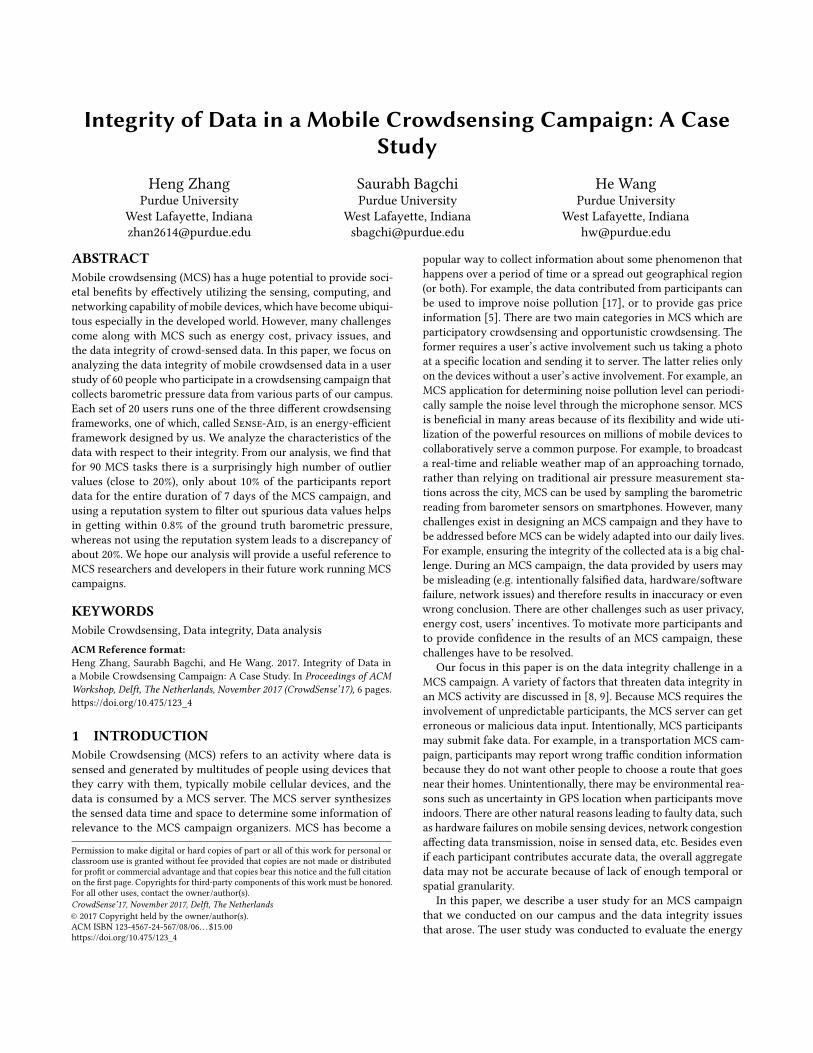
efficiency of Sense-Aid, a MCS energy-saving framework proposedby us. Figure 1 shows the architecture of it and details are describedin Section 2.2. Specifically, we look into the three characteristicsof MCS data related to integrity. First, what is the proportion ofoutlier data among all themeasurements collected at theMCS server.Second, what is the extent of participation by different users over theduration of the 7-day campaign. Third, can a reputation system beused at the MCS server to increase the integrity of the synthesizeddata. Specifically, our study comprises an MCS campaign where60 volunteer students go about their daily business on campusand use the barometer sensor on their smartphones to collect andsend atmospheric pressure data. We divide the volunteers into 3groups, corresponding to 3 different MCS frameworks, Sense-Aid,Piggyback Crowdsensing [14], and a baseline Periodic framework,which simply uploads data periodically.
Figure 1: Sense-Aid deployed on a cellular LTE network,
showing the three major components: Sense-Aid server,
Sense-Aid clients, and Sense-Aid application servers. CAS:
Crowdsensing application server. eNodeBs communicate
with the cellular core network through path 2 if its incom-
ing traffic from UEs includes crowdsensing data. Otherwise,
eNodeBs use path 1.
There are some prior works [3, 6, 7, 11, 15, 16] that have tackledthe data integrity problem in the face of unreliable users or unreli-able environment. Broadly speaking, these papers can be dividedinto two categories. One category develops or uses a reputationsystem to evaluate each participant’s sensed value and adjusts thatscore every time the participant reports MCS data. The secondcategory introduces a third party referee to decide on the reliabilityof the users. However, none of these approaches can fulfill differenttypes of the MCS campaigns and their performances vary with thedifferences in the characteristics of MCS campaigns and resourceavailabilities. There may not exist a generic way to cover all typesof MCS activities and provide the data integrity guarantee nor isthis paper aimed at discussing such a generic approach. Rather weadopt the reputation systems from [10] to show the importanceand benefits of the first category of solutions in a real-life MCScampaign.
The rest of the paper is organized as follows. Section 2 talksabout the reputation system and gives background of the Sense-Aid framework. Section 3.1 gives the details of our user study.Characteristics of MCS data and the effect of reputation system areevaluated in Section 4. Section 5 gives our conclusions and potentialfuture work to improve MCS data integrity.
2 BACKGROUND
2.1 Reputation System
A reputation system is used to help filter out unreliable participantsand reduce the noise that affects data integrity in an MCS campaign.The state-of-the-art Beta reputation system [13], for example, usesbeta probability density functions to combine feedback and derivereputation ratings. The crowdsensing server will maintain reputa-tion scores for all participants and keep updating each participant’sscore anytime that participant sends back crowdsensed data. A highreputation score means that data from that participant has been reli-able in the past and the server will tend to weight that participant’scontribution higher in synthesizing the final output. We choose toadopt the reputation system from [10] for our user study. It has twomodules: a watchdog module and a synthesis module. The watch-dog module generates a confidence score between 0 and 1 from thereadings submitted by a user. Confidence score is defined as howconfident the MCS server is to choose the data sent from that par-ticipant. The input of watchdog module is a vector of sensor values.The confidence score is computed in an iterative way for each dataupload as shown in Algo. 1. The convergence relies on progressiveidentification and elimination of outlier data points. There are twocategories of outlier detection algorithms. One is model-based [16]and the other is consensus-based [7]. Model-based outlier detectionalgorithm relies on the prior knowledge of the physical process thatis being sensed, such as, how the amplitude falls off with distance.The consensus-based outlier detection approach reaches consensusfrom the data sent in by a group of nodes and eliminates outlier datapoints. In our evaluation, we take the consensus-based approachto detect outliers because there is a natural density of nodes (ourstudy participants) sensing the same physical measure (atmosphericpressure) in geographic proximity.
The second module of the reputation system, the synthesis mod-ule is fundamentally a function to generate the reputation score,based on each participant’s confidence score from watchdog mod-ule. The reason that the confidence score is not directly used isthat it has been found useful for the reputation score to have someproperties [7, 10]. The first property is a smooth bonus growthwith correct behavior and the second property is a severe penaltyupon inaccurate data upload. The general idea of these properties isthat if a participant contributes a trustworthy value, its weight willgradually increase but if the contribution is faulty data, its weightwill significantly drop because failure behavior tends to be burstyeither because of environmental constraints (e.g., the participant isin a GPS-starved region) or user motivation (e.g., the user is incen-tivized to provide inaccurate data). We use the Gompertz functionto provide the smooth-bonus property while the severe-penaltyproperty is achieved by quadratically downgrading the reputation.Gompertz function is a mathematical model for time series whichhas slow growth rate at the start and end time period as well as a
2
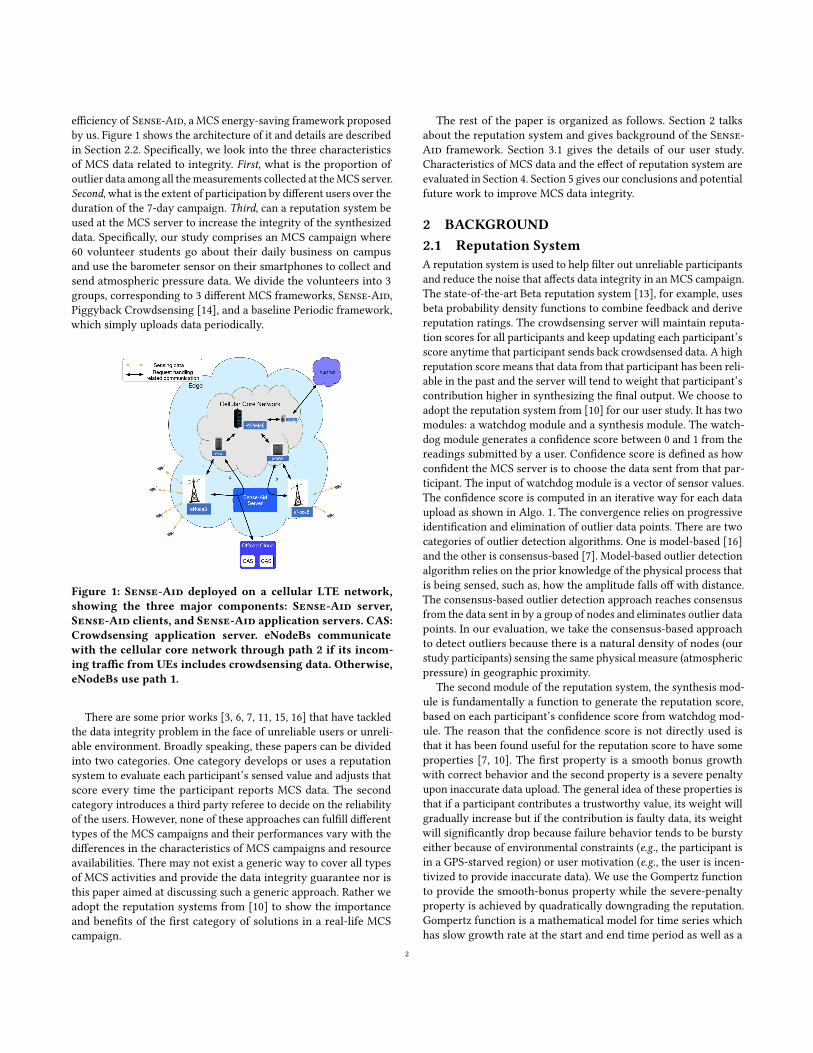
gradual growth rate in between. The representation of Gompertzfunction is as follows:
R(i)(p′(i)) = a expb expcp′(i ) (1)
where R(i) is the reputation score, i is the participant index, p′(i) isthe normalized confidence score for participant i (normalization isdiscussed in Section 3.1), a, b, c are control variables that representupper asymptote, X-axis displacement, and growth rate respectively.An illustrative plot of Gompertz functions with different choices ofcontrol variables is shown in Figure 2. We choose a = 1 to maintaina [0,1] reputation score range, b = −2.5 to make sure the X-axis isnot too detoured from the origin, and c = −0.85 to have a smoothgrowth rate.
Figure 2: Gompertz functionwith different control variables
2.2 Sense-Aid: Energy-efficient MCS
framework
Sense-Aid is an MCS framework to save mobile device energyconsumption. It achieves the goal through cooperation betweenthe cellular network and the mobile device, with parts of its frame-work code installed at these two elements. There are three keyinnovations in Sense-Aid. It runs an orchestration and schedulingalgorithm on the cellular network edge to select the appropriatedevices to task with uploading data at any point in time. It does thisso as to suppress redundant data collection and communication.Second, it understands the state of each device (radio state, batterystate, etc.) and this helps it to decide which devices should be se-lected for crowdsensing activities at any point in time. It can thusensure that there are enough devices queried to satisfy the temporaland spatial requirement, while not causing excessive energy drainon any one device and ensuring some degree of fairness of usageacross devices. Finally, Sense-Aid has a predictive component toestimate when some devices will be in a geographical location so asto be tasked in the near future. It can therefore delay a data collec-tion for some bounded time period when there is the possibility ofa near-future, high fidelity MCS data collection. The schematic forSense-Aid is shown in Figure 1. The Sense-Aid server resides inthe cellular edge while the crowd-sensing application server (CAS)can exist on any compute environment, such as, a cloud computingenvironment. The different cellular devices act as the clients in theMCS campaign.
Previous work from Carrol et al. [2] has shown that the majorityof power consumption can be attributed to the GSMmodule and the
display. We posit that if the crowdsensing task were made aware ofthe state of the radio, it could do its job in a more energy efficientmanner. For example, the framework can prioritize a device whoseradio is already active over a device whose radio is in sleep state,considering that there is a big energy spike in moving from thesleep to the active state.
3 USER STUDY
3.1 Setup
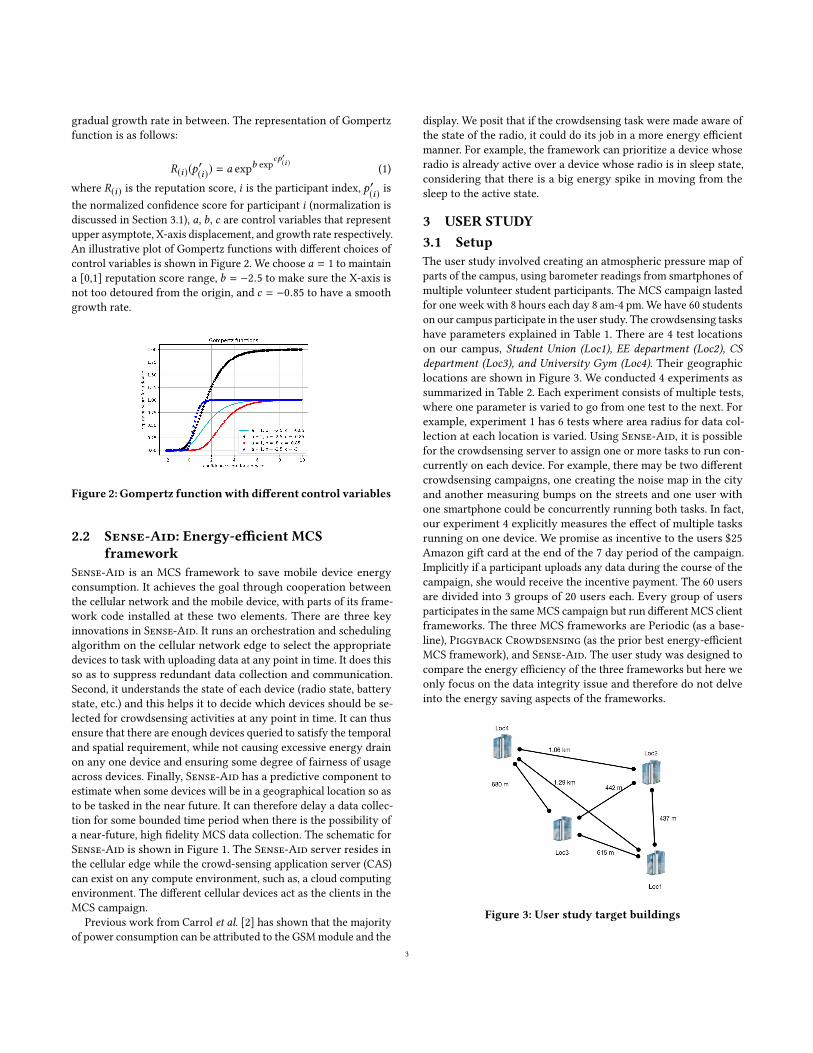
The user study involved creating an atmospheric pressure map ofparts of the campus, using barometer readings from smartphones ofmultiple volunteer student participants. The MCS campaign lastedfor one week with 8 hours each day 8 am-4 pm.We have 60 studentson our campus participate in the user study. The crowdsensing taskshave parameters explained in Table 1. There are 4 test locationson our campus, Student Union (Loc1), EE department (Loc2), CSdepartment (Loc3), and University Gym (Loc4). Their geographiclocations are shown in Figure 3. We conducted 4 experiments assummarized in Table 2. Each experiment consists of multiple tests,where one parameter is varied to go from one test to the next. Forexample, experiment 1 has 6 tests where area radius for data col-lection at each location is varied. Using Sense-Aid, it is possiblefor the crowdsensing server to assign one or more tasks to run con-currently on each device. For example, there may be two differentcrowdsensing campaigns, one creating the noise map in the cityand another measuring bumps on the streets and one user withone smartphone could be concurrently running both tasks. In fact,our experiment 4 explicitly measures the effect of multiple tasksrunning on one device. We promise as incentive to the users $25Amazon gift card at the end of the 7 day period of the campaign.Implicitly if a participant uploads any data during the course of thecampaign, she would receive the incentive payment. The 60 usersare divided into 3 groups of 20 users each. Every group of usersparticipates in the sameMCS campaign but run different MCS clientframeworks. The three MCS frameworks are Periodic (as a base-line), Piggyback Crowdsensing (as the prior best energy-efficientMCS framework), and Sense-Aid. The user study was designed tocompare the energy efficiency of the three frameworks but here weonly focus on the data integrity issue and therefore do not delveinto the energy saving aspects of the frameworks.
Figure 3: User study target buildings
3
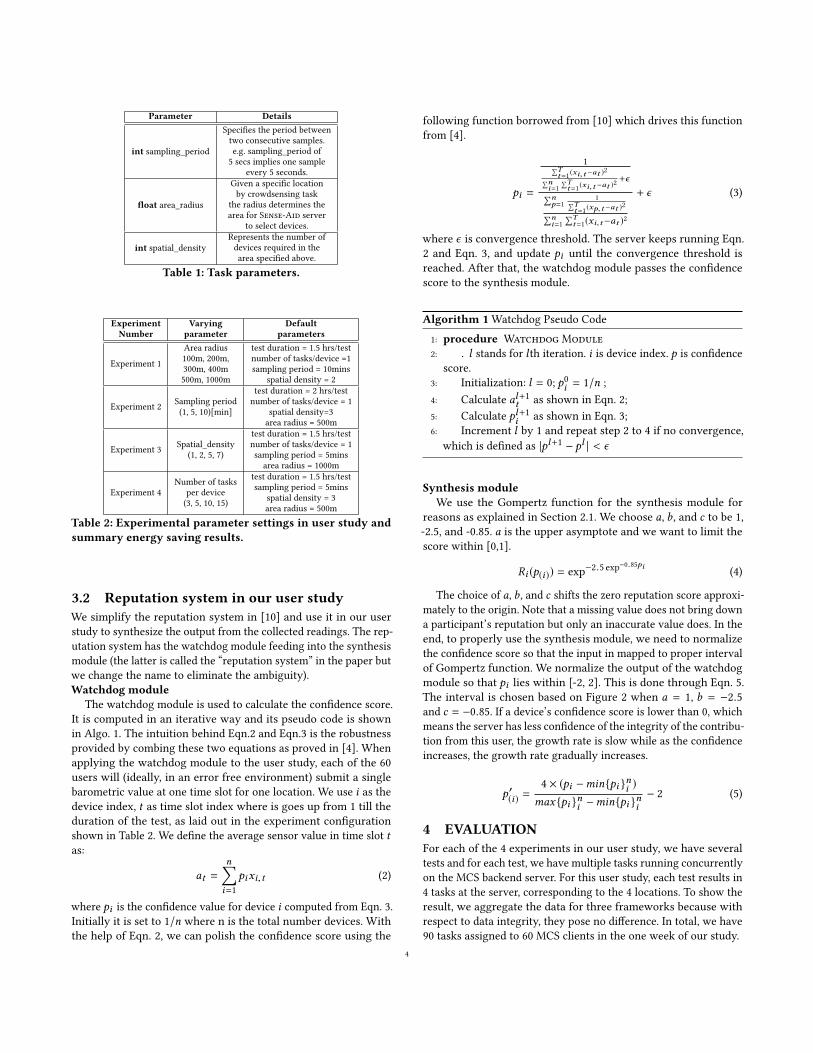
Parameter Details
int sampling_period
Specifies the period betweentwo consecutive samples.e.g. sampling_period of5 secs implies one sample
every 5 seconds.
float area_radius
Given a specific locationby crowdsensing task
the radius determines thearea for Sense-Aid server
to select devices.
int spatial_densityRepresents the number ofdevices required in thearea specified above.
Table 1: Task parameters.
Experiment
Number
Varying
parameter
Default
parameters
Experiment 1
Area radius100m, 200m,300m, 400m500m, 1000m
test duration = 1.5 hrs/testnumber of tasks/device =1sampling period = 10mins
spatial density = 2
Experiment 2 Sampling period(1, 5, 10)[min]
test duration = 2 hrs/testnumber of tasks/device = 1
spatial density=3area radius = 500m
Experiment 3 Spatial_density(1, 2, 5, 7)
test duration = 1.5 hrs/testnumber of tasks/device = 1sampling period = 5minsarea radius = 1000m
Experiment 4Number of tasks
per device(3, 5, 10, 15)
test duration = 1.5 hrs/testsampling period = 5mins
spatial density = 3area radius = 500m
Table 2: Experimental parameter settings in user study and
summary energy saving results.
3.2 Reputation system in our user study
We simplify the reputation system in [10] and use it in our userstudy to synthesize the output from the collected readings. The rep-utation system has the watchdog module feeding into the synthesismodule (the latter is called the “reputation system” in the paper butwe change the name to eliminate the ambiguity).Watchdog module
The watchdog module is used to calculate the confidence score.It is computed in an iterative way and its pseudo code is shownin Algo. 1. The intuition behind Eqn.2 and Eqn.3 is the robustnessprovided by combing these two equations as proved in [4]. Whenapplying the watchdog module to the user study, each of the 60users will (ideally, in an error free environment) submit a singlebarometric value at one time slot for one location. We use i as thedevice index, t as time slot index where is goes up from 1 till theduration of the test, as laid out in the experiment configurationshown in Table 2. We define the average sensor value in time slot tas:
at =n∑i=1
pixi,t (2)
where pi is the confidence value for device i computed from Eqn. 3.Initially it is set to 1/n where n is the total number devices. Withthe help of Eqn. 2, we can polish the confidence score using the
following function borrowed from [10] which drives this functionfrom [4].
pi =
1∑Tt=1(xi,t −at )
2∑ni=1
∑Tt=1(xi,t −at )
2 +ϵ∑np=1
1∑Tt=1(xp,t −at )
2∑ni=1
∑Tt=1(xi,t−at )2
+ ϵ (3)
where ϵ is convergence threshold. The server keeps running Eqn.2 and Eqn. 3, and update pi until the convergence threshold isreached. After that, the watchdog module passes the confidencescore to the synthesis module.
Algorithm 1 Watchdog Pseudo Code
1: procedure Watchdog Module2: ▷ l stands for lth iteration. i is device index. p is confidence
score.3: Initialization: l = 0; p0i = 1/n ;4: Calculate al+1t as shown in Eqn. 2;5: Calculate pl+1i as shown in Eqn. 3;6: Increment l by 1 and repeat step 2 to 4 if no convergence,
which is defined as |pl+1 − pl | < ϵ
Synthesis module
We use the Gompertz function for the synthesis module forreasons as explained in Section 2.1. We choose a, b, and c to be 1,-2.5, and -0.85. a is the upper asymptote and we want to limit thescore within [0,1].
Ri (p(i)) = exp−2.5 exp−0.85pi (4)
The choice of a, b, and c shifts the zero reputation score approxi-mately to the origin. Note that a missing value does not bring downa participant’s reputation but only an inaccurate value does. In theend, to properly use the synthesis module, we need to normalizethe confidence score so that the input in mapped to proper intervalof Gompertz function. We normalize the output of the watchdogmodule so that pi lies within [-2, 2]. This is done through Eqn. 5.The interval is chosen based on Figure 2 when a = 1, b = −2.5and c = −0.85. If a device’s confidence score is lower than 0, whichmeans the server has less confidence of the integrity of the contribu-tion from this user, the growth rate is slow while as the confidenceincreases, the growth rate gradually increases.
p′(i) =4 × (pi −min{pi }ni )
max{pi }ni −min{pi }ni− 2 (5)
4 EVALUATION
For each of the 4 experiments in our user study, we have severaltests and for each test, we have multiple tasks running concurrentlyon the MCS backend server. For this user study, each test results in4 tasks at the server, corresponding to the 4 locations. To show theresult, we aggregate the data for three frameworks because withrespect to data integrity, they pose no difference. In total, we have90 tasks assigned to 60 MCS clients in the one week of our study.
4
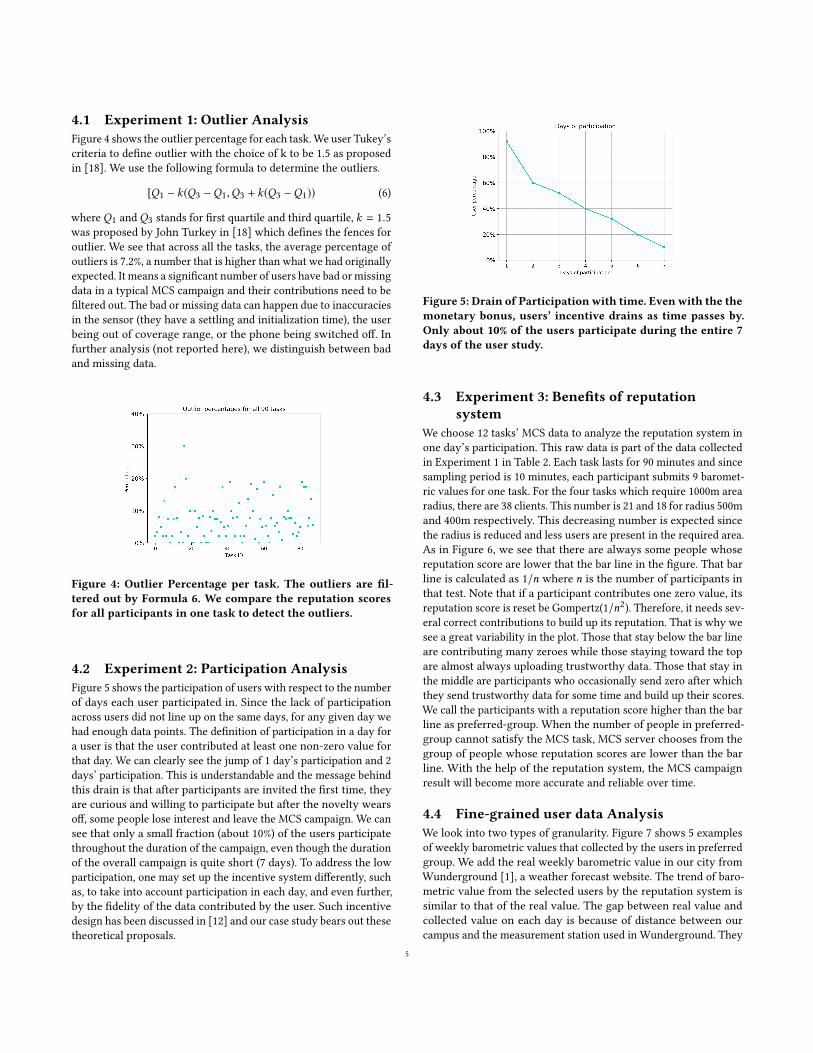
4.1 Experiment 1: Outlier Analysis
Figure 4 shows the outlier percentage for each task.We user Tukey’scriteria to define outlier with the choice of k to be 1.5 as proposedin [18]. We use the following formula to determine the outliers.
[Q1 − k(Q3 −Q1,Q3 + k(Q3 −Q1)) (6)
whereQ1 andQ3 stands for first quartile and third quartile, k = 1.5was proposed by John Turkey in [18] which defines the fences foroutlier. We see that across all the tasks, the average percentage ofoutliers is 7.2%, a number that is higher than what we had originallyexpected. It means a significant number of users have bad ormissingdata in a typical MCS campaign and their contributions need to befiltered out. The bad or missing data can happen due to inaccuraciesin the sensor (they have a settling and initialization time), the userbeing out of coverage range, or the phone being switched off. Infurther analysis (not reported here), we distinguish between badand missing data.
Figure 4: Outlier Percentage per task. The outliers are fil-
tered out by Formula 6. We compare the reputation scores
for all participants in one task to detect the outliers.
4.2 Experiment 2: Participation Analysis
Figure 5 shows the participation of users with respect to the numberof days each user participated in. Since the lack of participationacross users did not line up on the same days, for any given day wehad enough data points. The definition of participation in a day fora user is that the user contributed at least one non-zero value forthat day. We can clearly see the jump of 1 day’s participation and 2days’ participation. This is understandable and the message behindthis drain is that after participants are invited the first time, theyare curious and willing to participate but after the novelty wearsoff, some people lose interest and leave the MCS campaign. We cansee that only a small fraction (about 10%) of the users participatethroughout the duration of the campaign, even though the durationof the overall campaign is quite short (7 days). To address the lowparticipation, one may set up the incentive system differently, suchas, to take into account participation in each day, and even further,by the fidelity of the data contributed by the user. Such incentivedesign has been discussed in [12] and our case study bears out thesetheoretical proposals.
Figure 5: Drain of Participation with time. Even with the the
monetary bonus, users’ incentive drains as time passes by.
Only about 10% of the users participate during the entire 7
days of the user study.
4.3 Experiment 3: Benefits of reputation
system
We choose 12 tasks’ MCS data to analyze the reputation system inone day’s participation. This raw data is part of the data collectedin Experiment 1 in Table 2. Each task lasts for 90 minutes and sincesampling period is 10 minutes, each participant submits 9 baromet-ric values for one task. For the four tasks which require 1000m arearadius, there are 38 clients. This number is 21 and 18 for radius 500mand 400m respectively. This decreasing number is expected sincethe radius is reduced and less users are present in the required area.As in Figure 6, we see that there are always some people whosereputation score are lower that the bar line in the figure. That barline is calculated as 1/n where n is the number of participants inthat test. Note that if a participant contributes one zero value, itsreputation score is reset be Gompertz(1/n2). Therefore, it needs sev-eral correct contributions to build up its reputation. That is why wesee a great variability in the plot. Those that stay below the bar lineare contributing many zeroes while those staying toward the topare almost always uploading trustworthy data. Those that stay inthe middle are participants who occasionally send zero after whichthey send trustworthy data for some time and build up their scores.We call the participants with a reputation score higher than the barline as preferred-group. When the number of people in preferred-group cannot satisfy the MCS task, MCS server chooses from thegroup of people whose reputation scores are lower than the barline. With the help of the reputation system, the MCS campaignresult will become more accurate and reliable over time.
4.4 Fine-grained user data Analysis
We look into two types of granularity. Figure 7 shows 5 examplesof weekly barometric values that collected by the users in preferredgroup. We add the real weekly barometric value in our city fromWunderground [1], a weather forecast website. The trend of baro-metric value from the selected users by the reputation system issimilar to that of the real value. The gap between real value andcollected value on each day is because of distance between ourcampus and the measurement station used in Wunderground. They
5
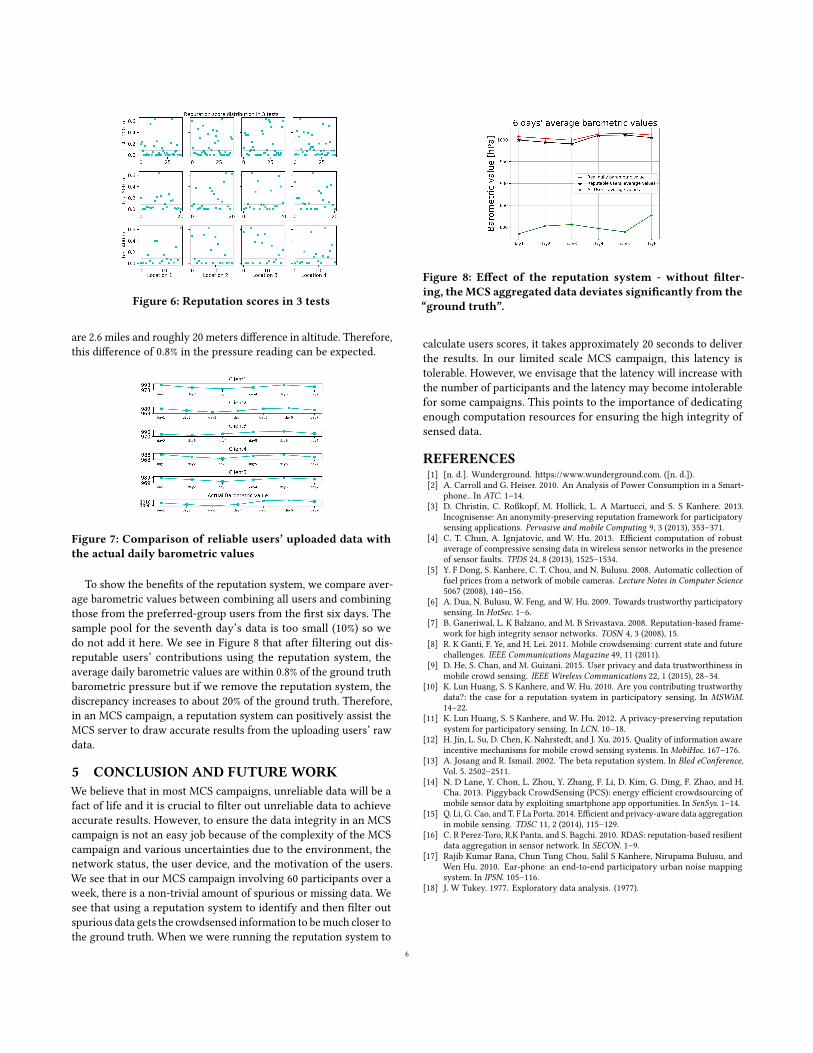
Figure 6: Reputation scores in 3 tests
are 2.6 miles and roughly 20 meters difference in altitude. Therefore,this difference of 0.8% in the pressure reading can be expected.
Figure 7: Comparison of reliable users’ uploaded data with
the actual daily barometric values
To show the benefits of the reputation system, we compare aver-age barometric values between combining all users and combiningthose from the preferred-group users from the first six days. Thesample pool for the seventh day’s data is too small (10%) so wedo not add it here. We see in Figure 8 that after filtering out dis-reputable users’ contributions using the reputation system, theaverage daily barometric values are within 0.8% of the ground truthbarometric pressure but if we remove the reputation system, thediscrepancy increases to about 20% of the ground truth. Therefore,in an MCS campaign, a reputation system can positively assist theMCS server to draw accurate results from the uploading users’ rawdata.
5 CONCLUSION AND FUTUREWORK
We believe that in most MCS campaigns, unreliable data will be afact of life and it is crucial to filter out unreliable data to achieveaccurate results. However, to ensure the data integrity in an MCScampaign is not an easy job because of the complexity of the MCScampaign and various uncertainties due to the environment, thenetwork status, the user device, and the motivation of the users.We see that in our MCS campaign involving 60 participants over aweek, there is a non-trivial amount of spurious or missing data. Wesee that using a reputation system to identify and then filter outspurious data gets the crowdsensed information to bemuch closer tothe ground truth. When we were running the reputation system to
Figure 8: Effect of the reputation system - without filter-
ing, theMCS aggregated data deviates significantly from the
“ground truth”.
calculate users scores, it takes approximately 20 seconds to deliverthe results. In our limited scale MCS campaign, this latency istolerable. However, we envisage that the latency will increase withthe number of participants and the latency may become intolerablefor some campaigns. This points to the importance of dedicatingenough computation resources for ensuring the high integrity ofsensed data.
REFERENCES
[1] [n. d.]. Wunderground. https://www.wunderground.com. ([n. d.]).[2] A. Carroll and G. Heiser. 2010. An Analysis of Power Consumption in a Smart-
phone.. In ATC. 1–14.[3] D. Christin, C. Roßkopf, M. Hollick, L. A Martucci, and S. S Kanhere. 2013.
Incognisense: An anonymity-preserving reputation framework for participatorysensing applications. Pervasive and mobile Computing 9, 3 (2013), 353–371.
[4] C. T. Chun, A. Ignjatovic, and W. Hu. 2013. Efficient computation of robustaverage of compressive sensing data in wireless sensor networks in the presenceof sensor faults. TPDS 24, 8 (2013), 1525–1534.
[5] Y. F Dong, S. Kanhere, C. T. Chou, and N. Bulusu. 2008. Automatic collection offuel prices from a network of mobile cameras. Lecture Notes in Computer Science5067 (2008), 140–156.
[6] A. Dua, N. Bulusu, W. Feng, and W. Hu. 2009. Towards trustworthy participatorysensing. In HotSec. 1–6.
[7] B. Ganeriwal, L. K Balzano, and M. B Srivastava. 2008. Reputation-based frame-work for high integrity sensor networks. TOSN 4, 3 (2008), 15.
[8] R. K Ganti, F. Ye, and H. Lei. 2011. Mobile crowdsensing: current state and futurechallenges. IEEE Communications Magazine 49, 11 (2011).
[9] D. He, S. Chan, and M. Guizani. 2015. User privacy and data trustworthiness inmobile crowd sensing. IEEE Wireless Communications 22, 1 (2015), 28–34.
[10] K. Lun Huang, S. S Kanhere, and W. Hu. 2010. Are you contributing trustworthydata?: the case for a reputation system in participatory sensing. In MSWiM.14–22.
[11] K. Lun Huang, S. S Kanhere, and W. Hu. 2012. A privacy-preserving reputationsystem for participatory sensing. In LCN. 10–18.
[12] H. Jin, L. Su, D. Chen, K. Nahrstedt, and J. Xu. 2015. Quality of information awareincentive mechanisms for mobile crowd sensing systems. In MobiHoc. 167–176.
[13] A. Josang and R. Ismail. 2002. The beta reputation system. In Bled eConference,Vol. 5. 2502–2511.
[14] N. D Lane, Y. Chon, L. Zhou, Y. Zhang, F. Li, D. Kim, G. Ding, F. Zhao, and H.Cha. 2013. Piggyback CrowdSensing (PCS): energy efficient crowdsourcing ofmobile sensor data by exploiting smartphone app opportunities. In SenSys. 1–14.
[15] Q. Li, G. Cao, and T. F La Porta. 2014. Efficient and privacy-aware data aggregationin mobile sensing. TDSC 11, 2 (2014), 115–129.
[16] C. R Perez-Toro, R.K Panta, and S. Bagchi. 2010. RDAS: reputation-based resilientdata aggregation in sensor network. In SECON. 1–9.
[17] Rajib Kumar Rana, Chun Tung Chou, Salil S Kanhere, Nirupama Bulusu, andWen Hu. 2010. Ear-phone: an end-to-end participatory urban noise mappingsystem. In IPSN. 105–116.
[18] J. W Tukey. 1977. Exploratory data analysis. (1977).
6