integration of online and offline channels in retail: the
TRANSCRIPT

University of Pennsylvania University of Pennsylvania
ScholarlyCommons ScholarlyCommons
Finance Papers Wharton Faculty Research
6-2014
Integration of Online and Offline Channels in Retail: The Impact of Integration of Online and Offline Channels in Retail: The Impact of
Sharing Reliable Inventory Availability Information Sharing Reliable Inventory Availability Information
Santiago Gallino
Antonio Moreno
Follow this and additional works at: https://repository.upenn.edu/fnce_papers
Part of the Business Administration, Management, and Operations Commons, E-Commerce
Commons, and the Finance and Financial Management Commons
Recommended Citation Recommended Citation Gallino, S., & Moreno, A. (2014). Integration of Online and Offline Channels in Retail: The Impact of Sharing Reliable Inventory Availability Information. Management Science, 60 (6), 1434-1451. http://dx.doi.org/10.1287/mnsc.2014.1951
This paper is posted at ScholarlyCommons. https://repository.upenn.edu/fnce_papers/101 For more information, please contact [email protected].

Integration of Online and Offline Channels in Retail: The Impact of Sharing Integration of Online and Offline Channels in Retail: The Impact of Sharing Reliable Inventory Availability Information Reliable Inventory Availability Information
Abstract Abstract Using a proprietary data set, we analyze the impact of the implementation of a “buy-online, pick-up-in-store” (BOPS) project. The implementation of this project is associated with a reduction in online sales and an increase in store sales and traffic. These results can be explained by two simultaneous phenomena: (1) additional store sales from customers who use the BOPS functionality and buy additional products in the stores (cross-selling effect) and (2) the shift of some customers from the online to the brick-and-mortar channel and the conversion of noncustomers into store customers (channel-shift effect). We explain these channel-shift patterns as an increase in “research online, purchase offline” behavior enabled by BOPS implementation, and we validate this explanation with evidence from the change of cart abandonment and conversion rates of the brick-and-mortar and online channels. We interpret these results in light of recent operations management literature that analyzes the impact of sharing inventory availability information. Our analysis illustrates the limitations of drawing conclusions about complex interventions using single-channel data.
Keywords Keywords retail operations, inventory availability, empirical operations management, business analytics, online retail, ecommerce
Disciplines Disciplines Business | Business Administration, Management, and Operations | E-Commerce | Finance and Financial Management
This journal article is available at ScholarlyCommons: https://repository.upenn.edu/fnce_papers/101

Electronic copy available at: http://ssrn.com/abstract=2149095
Submitted to Management Sciencemanuscript MS-12-01440
Integration of Online and Offline Channels in Retail:The Impact of Sharing Reliable Inventory
Availability Information
Santiago GallinoTuck School of Business, Dartmouth College, Hanover, NH 03755, [email protected]
Antonio MorenoManagerial Economics and Decision Sciences, Kellogg School of Management, Northwestern University, Evanston, IL 60208,
Using a proprietary dataset, we analyze the impact of the implementation of a “buy-online, pickup-in-store”
(BOPS) project. The implementation of this project is associated with a reduction in online sales and an
increase in store sales and traffic. These results can be explained by two simultaneous phenomena: (1)
additional store sales from customers who use the BOPS functionality and buy additional products in the
stores (cross-selling effect) and (2) the shift of some customers from the online to the brick-and-mortar
channel and the conversion of noncustomers into store customers (channel-shift effect). We explain these
channel shift patterns as an increase in “research online, purchase offline” (ROPO) behavior enabled by
BOPS implementation, and we validate this explanation with evidence from the change of cart abandonment
and conversion rates of the brick-and-mortar and online channels. We interpret these results in light of recent
operations management literature that analyzes the impact of sharing inventory availability information. Our
analysis illustrates the limitations of drawing conclusions about complex interventions using single-channel
data.
Key words : retail operations, inventory availability, empirical operations management, business analytics,
online retail
History : Revised January 31, 2014
1

Electronic copy available at: http://ssrn.com/abstract=2149095
Gallino and Moreno: Integration of Online and Offline Channels in Retail2 Article submitted to Management Science; manuscript no. MS-12-01440
1. Introduction
Online retailing has grown steadily over the last few years. Some retailers operate exclusively
through online channels, and traditional brick and mortar (B&M) retailers have incorporated
online sales channels since the early stages of the commercial Internet (e.g., the Barnes & Noble
website launched in May 1997). Today, retailers’ online channels no longer are an experiment but
a relevant and growing part of their business. Originally, most B&M retailers decided to separate
traditional and online-channel operations. Now, some B&M retailers are exploring integration
strategies for their online and B&M channels to enrich the customer value proposition and/or reduce
costs. Online–offline integration efforts can occur in a variety of configurations. For example, B&M
retailers often show in-store inventory availability information online. More advanced integration
includes shipping the product ordered from the store closest to its destination or offering the option
to buy products online and pick them up in the store.
In particular, a number of traditional B&M retailers across different categories (e.g., The Home
Depot, Apple, Crate & Barrel, Toys “R” Us, among others) have implemented the “buy-online,
pickup-in-store” (BOPS) functionality. With this functionality, the retailer shows online viewers the
locations at which the items are available and gives customers the option to close the transaction
online and then pick up the products at one of the retailer’s locations shortly after closing the
purchase.1
Besides being an interesting trend in itself, the integration of online and offline channels provides
an opportunity to empirically study issues that have been the subject of theoretical research in
operations management. In this paper, we use an online–offline integration project that implements
the BOPS functionality as a quasi-experiment to study the impact of sharing reliable inventory
availability information with customers. Implementing a BOPS project provides an exogenous
shock to the reliability of the inventory information that the firm shows its customers; because the
inventory information becomes more credible, the risk customers face when deciding whether to
visit the store is reduced.
We have collected a novel proprietary data set from a nationwide retailer that has been among the
pioneers in implementing BOPS functionality. Using this data set and a series of quasi-experiments,
we make the following contributions:
First, we evaluate the impact of BOPS implementation on company sales and customer behavior
in what constitutes the first academic analysis of this emerging trend in retailing.2 We study the
1 Most retailers announce that they need a two-hour window to have the item ready for pick up. In some cases thistime can be less, but two hours is representative of a typical commitment. The short lead time means the retailermust fulfill the order with in-store inventory rather than from a warehouse.
2 See, for example, http://operationsroom.wordpress.com/2012/05/16/macys-warehouse-at-the-mall/ andhttp://operationsroom.wordpress.com/2010/08/25/pooling-inventory-at-nordstrom/ .

Gallino and Moreno: Integration of Online and Offline Channels in RetailArticle submitted to Management Science; manuscript no. MS-12-01440 3
impact of deploying a BOPS project on both the online and brick-and-mortar channels. It is not
clear a priori how BOPS would affect each these channels. BOPS orders will potentially result in
additional foot traffic to the stores and additional store sales due to cross-selling opportunities,
but stores potentially could also see how some of their sales shift to the BOPS channel and it is an
empirical question what the direction and magnitude of the net effect are. Conventional wisdom
within the industry (supported by interviews with executives of the focal company and other leading
retail chains) suggests that offering the BOPS functionality will improve online-channel revenue
(since BOPS transactions are considered online revenue). As we will describe in detail, a series of
quasi-experiments leads us to conclude that these assumptions present an incomplete picture, and
a more subtle pattern emerges. Our results show that B&M sales and traffic increase when the
BOPS functionality is deployed but the amount of sales transacted online actually decreases.
Second, we present an explanation consistent with the empirical evidence we observe regarding
the impact of the BOPS functionality: providing the BOPS functionality results in an increase in
the number of customers visiting the stores to purchase items after checking the product availability
online (a behavior consistent with what is known as “Research Online, Purchase Offline,” or ROPO
— see Ebeltoft Group 2012). We further check the validity of this explanation by presenting
evidence from shopping-cart abandonment behavior by the online customers and revenue per visitor
in each channel before and after the deployment of BOPS. While several factors may help explain
the increase in ROPO behavior after BOPS implementation, we discuss how BOPS can provide
a shock to the reliability of the stores’ inventory availability information shown online. In order
to implement the BOPS functionality, the online system must have access to accurate real-time
information about the availability of in-store inventory. If the retailer offers the option to pick up
an online order at a particular store, the customer knows with very high certainty that the item
ordered is available at that store. Therefore, inventory availability information is perceived as more
reliable by customers interacting with the site, increasing the probability they will visit the store to
purchase a product they have researched online. While the impact of availability information and
its reliability on customer behavior has been the subject of recent modeling research in the field of
operations management (e.g., Allon and Bassamboo 2011, Su and Zhang 2009), to our knowledge,
no empirical results on these issues have been described in the literature.
Finally, we use this project as an example of the evaluation of an online–offline strategy, illus-
trating the complex interactions between the online and offline channels and the challenges of
relying on single-channel data to evaluate the impact of interventions that affect multiple channels.
Retailers often run experiments on their online channels (e.g., A/B testing) to evaluate the impact
of interventions on their conversion rates or other measures of interest. In our case, an isolated
evaluation of the online channel would have considered the impact of BOPS implementation to be

Gallino and Moreno: Integration of Online and Offline Channels in Retail4 Article submitted to Management Science; manuscript no. MS-12-01440
negative. Only by closing the loop and looking at the effects in the B&M channel we can quantify
the net effects of BOPS implementation, which are positive in this case.
The rest of the document is organized as follows: Section 2 reviews the literature related to
our problem of interest. Section 3 describes the empirical setting and data. Section 4 shows the
impact of deploying the BOPS functionality on the online and brick-and-mortar channels. Section 5
interprets the results based on cross-selling arising from BOPS visits and channel shift of customers
who research online, purchase offline, and tests the validity of this interpretation with additional
analyses. Section 6 concludes our analysis, discusses the managerial implications of our findings
and points at potential future research.
2. Online–Offline Channel Integration and Related Literature
Integration of online and offline retail channels is a very recent phenomenon. In the early stages
of online business, many traditional B&M retailers developed online branches of their traditional
businesses. In some cases, they saw in online stores a new version of their traditional catalog channel
since there were, and still are, several similarities.
Today, the online channel has developed characteristics of its own. The relevance of this channel
in the retail sector and the pressure from customers who want to interact with the company in
a cohesive way have pushed B&M retailers to consider channel-integration efforts with varying
characteristics. Integration is not always evident to the customer, as, for example, when a retailer
ships an online purchase from a store rather than a warehouse. In other cases, integration is
driven by the need to offer a homogenous and more rewarding online–offline customer experience.
Examples include offering customers the options of returning to a store items that were bought
online; placing online orders from the store and having the products shipped to the customer’s
address; buying items online and picking them up later at the store in which they are stocked; or
buying an item online and picking it up at the store once it has been delivered to the store.
Online–offline integration efforts are challenging for companies. The retailer must integrate inven-
tory systems, warehouses, marketing campaigns, pricing strategies, etc. Even before these integra-
tion attempts are made, retailers often struggle to discern what is really available at their stores
or warehouses, as has been studied in previous empirical research documenting substantial inven-
tory record inaccuracy (DeHoratius and Raman 2008). Another challenge in the implementation of
some of these integration efforts is an increased complexity in store execution (Fisher et al. 2006).
Store processes are designed to sell merchandise and not necessarily to support the quick delivery
or shipment of goods, activities that these integration strategies allocate to physical stores.
Given that online–offline integration is a recent phenomenon, it is not surprising there is limited
literature that studies it. Some recent work in marketing and information systems has explored

Gallino and Moreno: Integration of Online and Offline Channels in RetailArticle submitted to Management Science; manuscript no. MS-12-01440 5
related issues, such as customer channel migration (Ansari et al. 2008), the choice between online
and offline channels in grocery stores (Chintagunta et al. 2012), the impact of product returns on
a multichannel retailer (Ofek et al. 2011), or customer behavior in multichannel customer service
(Jerath et al. 2012). Competition between brick-and-mortar and online channels has been studied
by Brynjolfsson et al. (2009) and Forman et al. (2009), among others. To our knowledge, no previous
work has considered a buy-online, pickup-at-store channel.
In operations management, some work has examined fulfillment and supply-chain choice on the
Internet. For example, Netessine and Rudi (2006) studied the effects of inventory ownership in
online channels, and Randall et al. (2006) empirically studied the decision to invest in fulfillment
capabilities. Some recent work (Huang and Van Mieghem 2014) has studied the value of using
clickstream information from the online channel to improve the performance of brick-and-mortar
operations, but we are not aware of any work that has explored the integration of online and offline
channels. We contribute to the literature by studying the impact of implementing an online–offline
integration strategy, namely, the “buy online, pick up in store” functionality on the performance
of the online and brick-and-mortar channels.
When consumers decide to visit a physical store to buy a product, they face the risk that the
product is out of stock. Fitzsimons (2000) and Anderson et al. (2006) studied how customers
respond to stockouts and how to measure and mitigate stockout costs. When customers face a
stockout, they may substitute their desired product by another product in the same category. This
has been studied in papers by, for example, Kok and Fisher (2007) and Musalem et al. (2012).
There are examples of models in operations management that consider the costs of visiting a
store (Dana and Petruzzi 2001, Chen et al. 2008). Recent work has modeled the impact of inventory
availability information on attracting consumer demand. In this stream, Su and Zhang (2009)
studied the value of commitment and availability guarantees when selling to strategic consumers. In
a related work, Allon and Bassamboo (2011) explored the issue of cheap talk when the information
shared is not verifiable. Despite the attention that sharing availability information has received from
the modeling community in operations management, there are no empirical results showing how
customers react to this information. We find that implementing the BOPS functionality increases
the value that customers derive from the inventory information shown online. One interpretation is
that offering BOPS can be interpreted as providing a stronger commitment device to the inventory
availability information, which may be perceived by some customers as more credible.
3. Empirical Setting and Data
We have partnered with one of the leading nationwide retailers in the US that has implemented
buy online, pick up at store (BOPS) capabilities. This retailer specializes in housewares, furniture

Gallino and Moreno: Integration of Online and Offline Channels in Retail6 Article submitted to Management Science; manuscript no. MS-12-01440
(indoor and outdoor), and home accessories and has more than 80 B&M stores in the US and
Canada. In addition to traditional B&M stores, this retailer has an online store that ships from a
central warehouse to anywhere in the US.
We have obtained data spanning April 2011 to April 2012. Throughout this period, the online
store offered customers information about the availability of inventory at each of the stores. After
October 11, 2011, the retailer offered the option of placing orders online and picking them up at a
B&M store where those products were available. Under the BOPS mode of interaction, customers
pay for the items through the online store (and therefore those sales are considered online sales), but
the order is fulfilled using inventory from the store. The pick-up option was available simultaneously
for every store in the US, but was not implemented for stores in Canada. The period considered in
our analysis covers six months before the store pick-up implementation (starting April 11, 2011)
and extends six months after the implementation (ending April 11, 2012).
The information used in our analysis comes from two main data streams one related to the online
channel and the other related to the brick-and-mortar channel.
Data related to the online channel
We obtained weekly data from the online channel at the designated-market-area (DMA)3 level.
For our main analysis of the impact of BOPS, we used data on the total number of transactions,
total dollar sales, and total number of unique visitors in the US for each week. Our data includes a
total of 210 DMAs, which completely cover the US populated areas. Table 1 shows the main sum-
mary statistics for these variables. We also obtained data about online shopping-cart abandonment
behavior for each DMA and week, using this information in Section 5 to validate our interpretation
of the findings.
Data related to the brick-and-mortar channel
We obtained weekly data for each of the stores in the US and Canada. During the period of
analysis, the retailer had a total of 83 stores in the US and Canada. For our analysis of the impact of
BOPS implementation on the B&M channel, we collected data on the total number of transactions,
total dollar sales, and total visitors for each week and store in the US and Canada. Table 1 shows
the relevant summary statistics for these variables.
In addition, we collected data specifically related to the BOPS orders. We obtained information
on the date each BOPS order was placed online and the date and store at which each one of these
pick-up purchases was collected by the customer. Finally, we also obtained department-level data
with higher granularity, which we describe and use in Section 4.3.
3 A designated market area (DMA) is a region where the population can receive the same (or similar) television andradio-station offerings and may also include other types of media such as newspapers and Internet content. DMAscan coincide or overlap with one or more metropolitan areas, though rural regions with few significant populationcenters can also be designated as markets. They are widely used in audience measurements, which are compiled inthe United States by Nielsen Media Research (television) and Arbitron (radio) (from Wikipedia).

Gallino and Moreno: Integration of Online and Offline Channels in RetailArticle submitted to Management Science; manuscript no. MS-12-01440 7
4. Evaluating the Impact of BOPS
A naıve approach to evaluating the impact of BOPS would be to look at the difference in the
variables of interest between the pre-implementation period and the post-implementation period.
Clearly, this approach would not necessarily give us the right answer; many things can differ in the
pre- and post-implementation periods that are completely unrelated to implementing BOPS. For
example, there might be seasonal factors that cause a change in sales. In order to deal with this
challenge, we consider a difference-in-differences approach (DiD)4.
In general, in order to implement a DiD approach we need to identify a portion of the population
that is not affected by the intervention for which we are trying to estimate the causal effect (BOPS
implementation, in our case). In other words, we need a control group. After identifying a control
group, we can measure the effect of the treatment by comparing the differences between treatment
and control groups before and after the treatment is applied. Of course, this approach is not new in
the operations management literature (e.g., Caro and Gallien 2010). For a more detailed discussion
on this topic, see Angrist and Pischke (2008).
The rest of this section applies a DiD approach to evaluate the impact of BOPS in the online
and brick-and-mortar channels. Subsection 4.1 estimates the effect of BOPS on the online channel
using a control group based on the distance between the online customers and the store closest
to them. Customers who visit the website from locations that are very far from a store are used
as a control group in the DiD framework. Subsection 4.2 uses stores in Canada, where the BOPS
functionality was not deployed, as a control group for the DiD framework.
4.1. Impact on the Online Channel
We start our analysis of the impact of BOPS by focusing on its effects on sales observed in the
online channel. For this purpose, we use data from the online business that covers the six months
preceding the implementation of BOPS and the six months following the implementation.
As mentioned before, if we simply compared what happened before and after the intervention,
we would not be able to find a causal effect of the intervention, because the pre- and post-
implementation periods might differ in aspects other than the intervention. For example, the
post-intervention period includes the Christmas season, which we can expect to have higher sales
irrespective of the BOPS project. In order to control for differences not related to BOPS imple-
mentation, we define two different groups in our population. The first group includes the portion of
the population that was affected by the BOPS implementation (the treatment group); the second
group includes the portion of the population that was not affected by this decision (the control
4 The naıve approach could lead to the same conclusions as the more rigorous analysis. However, that need not bethe case and there is no way of knowing if the naıve analysis gives the same results as the DiD analysis before thelatter analysis is conducted.
Gallino and Moreno: Integration of Online and Offline Channels in Retail8 Article submitted to Management Science; manuscript no. MS-12-01440
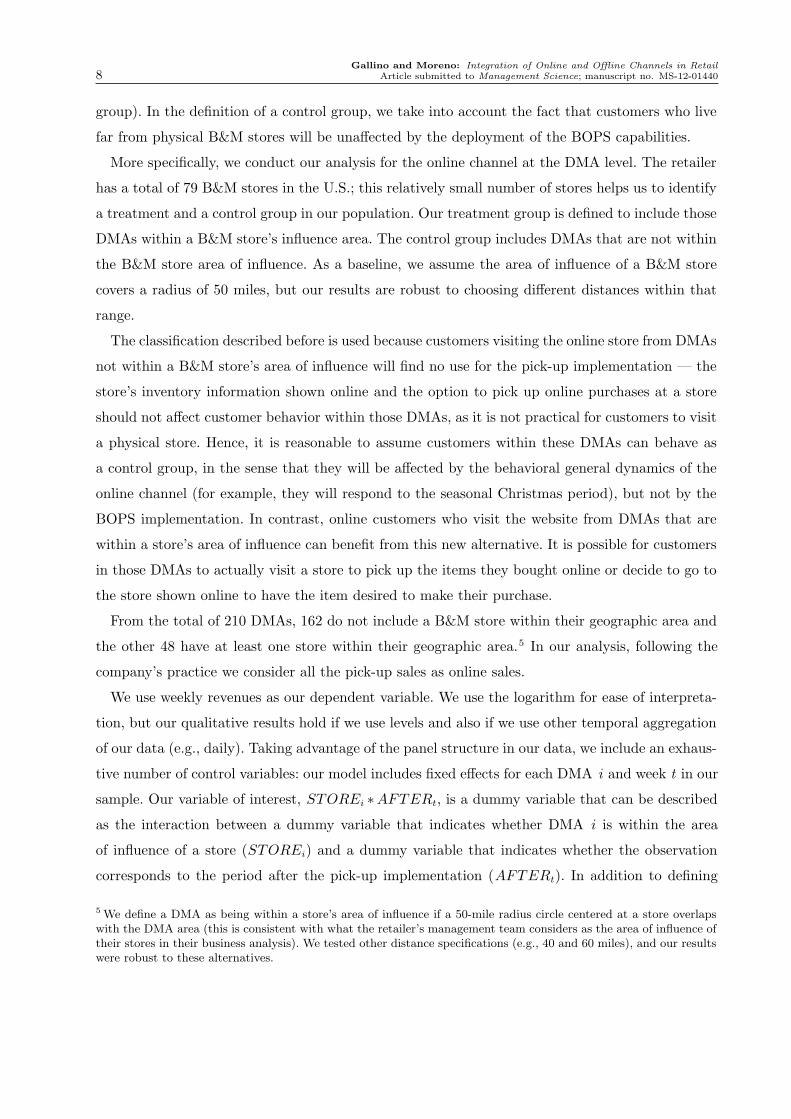
group). In the definition of a control group, we take into account the fact that customers who live
far from physical B&M stores will be unaffected by the deployment of the BOPS capabilities.
More specifically, we conduct our analysis for the online channel at the DMA level. The retailer
has a total of 79 B&M stores in the U.S.; this relatively small number of stores helps us to identify
a treatment and a control group in our population. Our treatment group is defined to include those
DMAs within a B&M store’s influence area. The control group includes DMAs that are not within
the B&M store area of influence. As a baseline, we assume the area of influence of a B&M store
covers a radius of 50 miles, but our results are robust to choosing different distances within that
range.
The classification described before is used because customers visiting the online store from DMAs
not within a B&M store’s area of influence will find no use for the pick-up implementation — the
store’s inventory information shown online and the option to pick up online purchases at a store
should not affect customer behavior within those DMAs, as it is not practical for customers to visit
a physical store. Hence, it is reasonable to assume customers within these DMAs can behave as
a control group, in the sense that they will be affected by the behavioral general dynamics of the
online channel (for example, they will respond to the seasonal Christmas period), but not by the
BOPS implementation. In contrast, online customers who visit the website from DMAs that are
within a store’s area of influence can benefit from this new alternative. It is possible for customers
in those DMAs to actually visit a store to pick up the items they bought online or decide to go to
the store shown online to have the item desired to make their purchase.
From the total of 210 DMAs, 162 do not include a B&M store within their geographic area and
the other 48 have at least one store within their geographic area.5 In our analysis, following the
company’s practice we consider all the pick-up sales as online sales.
We use weekly revenues as our dependent variable. We use the logarithm for ease of interpreta-
tion, but our qualitative results hold if we use levels and also if we use other temporal aggregation
of our data (e.g., daily). Taking advantage of the panel structure in our data, we include an exhaus-
tive number of control variables: our model includes fixed effects for each DMA i and week t in our
sample. Our variable of interest, STOREi ∗AFTERt, is a dummy variable that can be described
as the interaction between a dummy variable that indicates whether DMA i is within the area
of influence of a store (STOREi) and a dummy variable that indicates whether the observation
corresponds to the period after the pick-up implementation (AFTERt). In addition to defining
5 We define a DMA as being within a store’s area of influence if a 50-mile radius circle centered at a store overlapswith the DMA area (this is consistent with what the retailer’s management team considers as the area of influence oftheir stores in their business analysis). We tested other distance specifications (e.g., 40 and 60 miles), and our resultswere robust to these alternatives.

Gallino and Moreno: Integration of Online and Offline Channels in RetailArticle submitted to Management Science; manuscript no. MS-12-01440 9
our treatment and control groups and the independent variables described before, some of our
specifications also use the log of the number of unique visitors (TRAFFICit) from a DMA i in a
week t as an additional control variable. Our model specification is the following:
ONLINE SALESit =μi + β1AFTERt+
β2STOREi ∗AFTERt + β3CONTROLSit + εit. (1)
Since we have DMA fixed effects μi, it is not possible to identify the effect any time invariant
aspect that affects a particular DMA. For example, there is no variation in STOREi for a given
DMA in the period of analysis, and therefore it would not be possible to quantify the effect that
proximity to a store has on online sales. However, it is indeed possible to identify how the impact of
the program differently affects those DMAs that are close to a store — through the coefficient β2 of
the interaction term STOREi ∗AFTERt.6 If the set of controls includes weekly dummies, β1 will
not be identified separately from the coefficients of the weekly dummies. This is not problematic
because we are interested in the value of the coefficient β2 in this specification, which is identified.7
The results of the estimation of this model are presented in Table 3. Both columns include DMA
fixed effects and weekly dummies. The second column also includes our control for the number of
unique visitors. This allows us to measure the effect of BOPS on online sales that does not arise
purely from a change in traffic levels pre and post-implementation. We can observe that after BOPS
implementation, for those DMAs within the area of influence of a store (i.e., STOREi ∗AFTERt =
1), there was a negative and significant effect on sales, relative to those DMAs not within the area
of influence of a store (STOREi ∗AFTERt = 0). In other words, sales from DMAs that were in
the catchment area of a B&M store increased less8 than sales from DMAs that were not close to
a B&M store. That is, BOPS implementation reduced online sales. Given the magnitude of the
coefficient, we can estimate the drop in sales of the online channel to be about 7 percent of the
total online sales.
6 For better interpretation of the effect of the interaction term, one could express the equation as
ONLINE SALESit = μi + β0STOREi + β1AFTERt + β2STOREi ∗AFTERt + β3CONTROLSit + εit,
where μi and β0 are not separately identified. A similar argument applies to equations 2, 3, 4, 5 and 9.
7 Since the set of controls may not include week dummies, we leave β1AFTERt in our general specifications, althoughthe coefficient is not separately identified when we add week controls. A similar argument applies to equations 2, 3,4, 5 and 9.
8 We abuse language for clarity of exposition. More precisely, what we mean by “increase less” is that the differencebetween the increase in sales in DMAs that were in the catchment area of a store and the increase in sales in DMAsthat were not is negative. The actual increase in sales in one and the other type of DMA can be positive or negative.Actually, the level of sales happens to decrease on average in both types of DMAs (however, this decrease might bedue to purely seasonal factors).
Gallino and Moreno: Integration of Online and Offline Channels in Retail10 Article submitted to Management Science; manuscript no. MS-12-01440
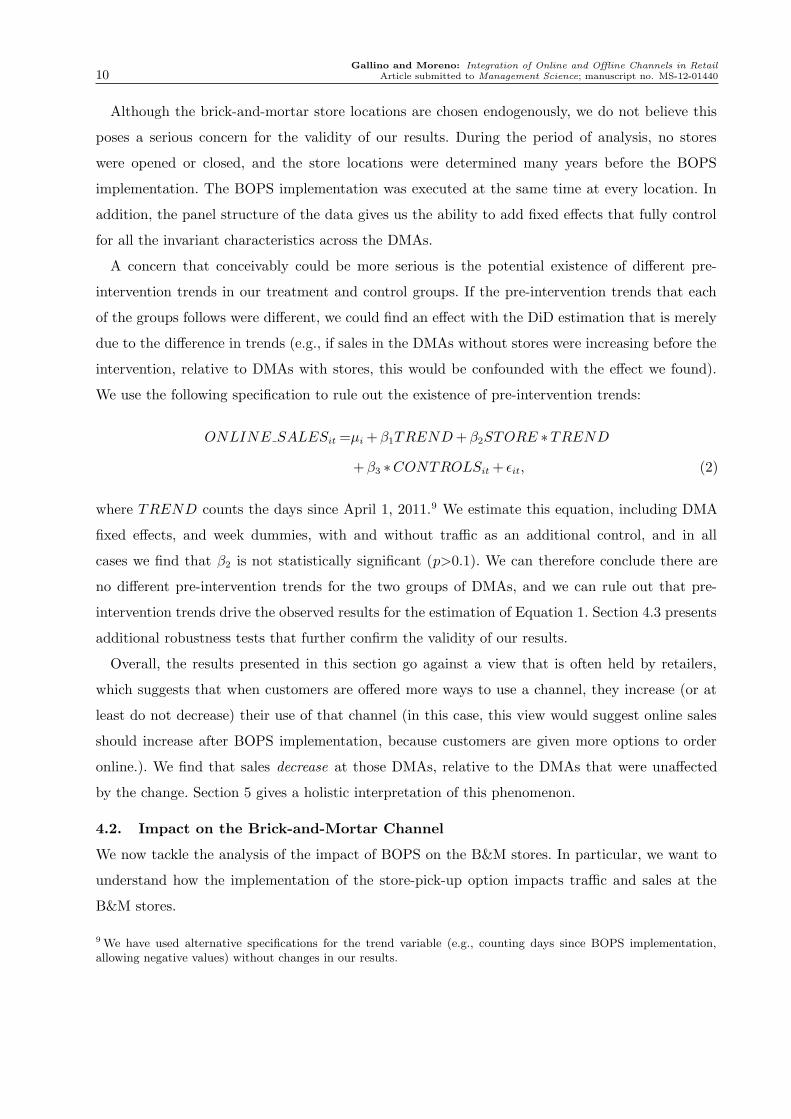
Although the brick-and-mortar store locations are chosen endogenously, we do not believe this
poses a serious concern for the validity of our results. During the period of analysis, no stores
were opened or closed, and the store locations were determined many years before the BOPS
implementation. The BOPS implementation was executed at the same time at every location. In
addition, the panel structure of the data gives us the ability to add fixed effects that fully control
for all the invariant characteristics across the DMAs.
A concern that conceivably could be more serious is the potential existence of different pre-
intervention trends in our treatment and control groups. If the pre-intervention trends that each
of the groups follows were different, we could find an effect with the DiD estimation that is merely
due to the difference in trends (e.g., if sales in the DMAs without stores were increasing before the
intervention, relative to DMAs with stores, this would be confounded with the effect we found).
We use the following specification to rule out the existence of pre-intervention trends:
ONLINE SALESit =μi + β1TREND + β2STORE ∗TREND
+ β3 ∗CONTROLSit + εit, (2)
where TREND counts the days since April 1, 2011.9 We estimate this equation, including DMA
fixed effects, and week dummies, with and without traffic as an additional control, and in all
cases we find that β2 is not statistically significant (p>0.1). We can therefore conclude there are
no different pre-intervention trends for the two groups of DMAs, and we can rule out that pre-
intervention trends drive the observed results for the estimation of Equation 1. Section 4.3 presents
additional robustness tests that further confirm the validity of our results.
Overall, the results presented in this section go against a view that is often held by retailers,
which suggests that when customers are offered more ways to use a channel, they increase (or at
least do not decrease) their use of that channel (in this case, this view would suggest online sales
should increase after BOPS implementation, because customers are given more options to order
online.). We find that sales decrease at those DMAs, relative to the DMAs that were unaffected
by the change. Section 5 gives a holistic interpretation of this phenomenon.
4.2. Impact on the Brick-and-Mortar Channel
We now tackle the analysis of the impact of BOPS on the B&M stores. In particular, we want to
understand how the implementation of the store-pick-up option impacts traffic and sales at the
B&M stores.
9 We have used alternative specifications for the trend variable (e.g., counting days since BOPS implementation,allowing negative values) without changes in our results.
Gallino and Moreno: Integration of Online and Offline Channels in RetailArticle submitted to Management Science; manuscript no. MS-12-01440 11
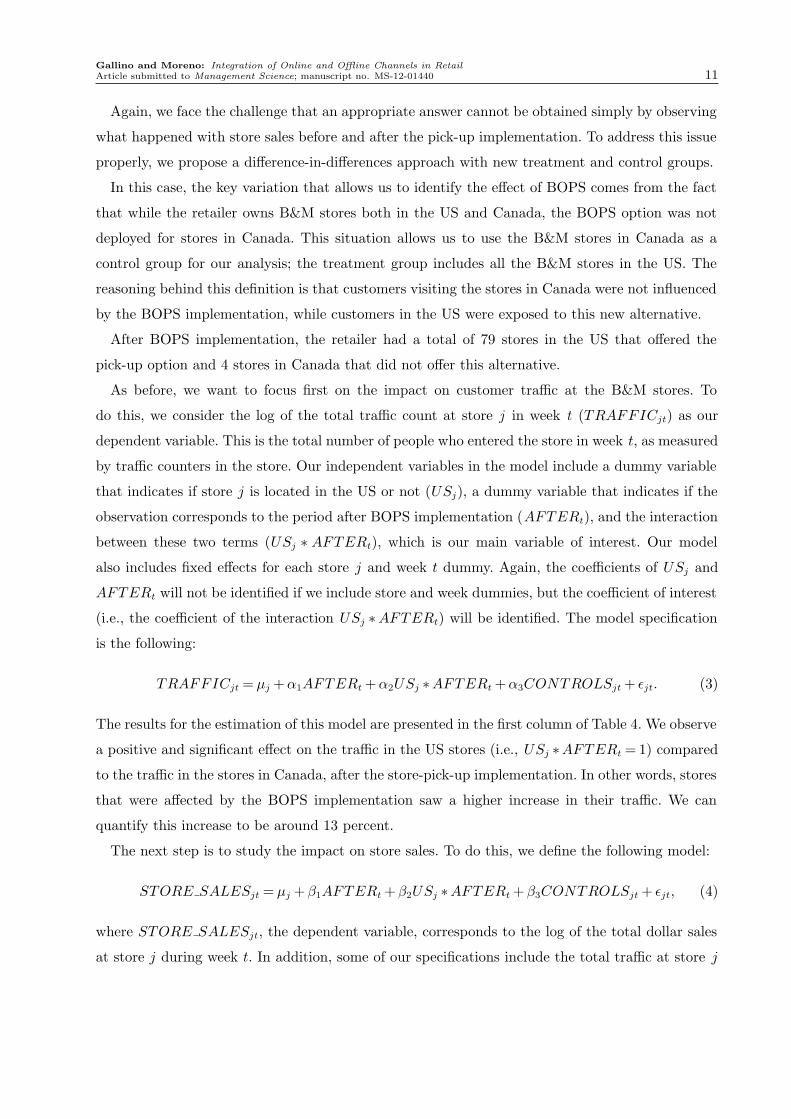
Again, we face the challenge that an appropriate answer cannot be obtained simply by observing
what happened with store sales before and after the pick-up implementation. To address this issue
properly, we propose a difference-in-differences approach with new treatment and control groups.
In this case, the key variation that allows us to identify the effect of BOPS comes from the fact
that while the retailer owns B&M stores both in the US and Canada, the BOPS option was not
deployed for stores in Canada. This situation allows us to use the B&M stores in Canada as a
control group for our analysis; the treatment group includes all the B&M stores in the US. The
reasoning behind this definition is that customers visiting the stores in Canada were not influenced
by the BOPS implementation, while customers in the US were exposed to this new alternative.
After BOPS implementation, the retailer had a total of 79 stores in the US that offered the
pick-up option and 4 stores in Canada that did not offer this alternative.
As before, we want to focus first on the impact on customer traffic at the B&M stores. To
do this, we consider the log of the total traffic count at store j in week t (TRAFFICjt) as our
dependent variable. This is the total number of people who entered the store in week t, as measured
by traffic counters in the store. Our independent variables in the model include a dummy variable
that indicates if store j is located in the US or not (USj), a dummy variable that indicates if the
observation corresponds to the period after BOPS implementation (AFTERt), and the interaction
between these two terms (USj ∗ AFTERt), which is our main variable of interest. Our model
also includes fixed effects for each store j and week t dummy. Again, the coefficients of USj and
AFTERt will not be identified if we include store and week dummies, but the coefficient of interest
(i.e., the coefficient of the interaction USj ∗AFTERt) will be identified. The model specification
is the following:
TRAFFICjt = μj + α1AFTERt + α2USj ∗AFTERt + α3CONTROLSjt + εjt. (3)
The results for the estimation of this model are presented in the first column of Table 4. We observe
a positive and significant effect on the traffic in the US stores (i.e., USj ∗AFTERt = 1) compared
to the traffic in the stores in Canada, after the store-pick-up implementation. In other words, stores
that were affected by the BOPS implementation saw a higher increase in their traffic. We can
quantify this increase to be around 13 percent.
The next step is to study the impact on store sales. To do this, we define the following model:
STORE SALESjt = μj + β1AFTERt + β2USj ∗AFTERt + β3CONTROLSjt + εjt, (4)
where STORE SALESjt, the dependent variable, corresponds to the log of the total dollar sales
at store j during week t. In addition, some of our specifications include the total traffic at store j

Gallino and Moreno: Integration of Online and Offline Channels in Retail12 Article submitted to Management Science; manuscript no. MS-12-01440
in week t (TRAFFICjt) as a control variable (recent work in retail operations has considered how
store traffic affects conversion rates; see Perdikaki et al. 2012). Adding traffic as a control allows us
to measure the impact of BOPS on store sales that does not purely arise from a change in traffic
levels. For example, if after controlling for traffic, β2 becomes insignificant, that would mean the
effect of BOPS on sales is merely a consequence of the increase of store traffic generated by BOPS.
The results of this analysis are presented in the second and third columns of Table 4. We observe
a positive and significant effect on sales for the US stores after the pick-up implementation (i.e.,
USj ∗AFTERt = 1) compared with the stores in Canada. This result suggests that the B&M stores
affected by the BOPS implementation (i.e., stores in the US) saw an increase in sales compared to
the control group (i.e., stores in Canada). The effects are not merely a consequence of the change
in store traffic, since the coefficient of interest is positive and significant in both specifications
with and without traffic controls. Given the values of our estimates, a conservative estimate of the
magnitude of this effect is equivalent to around 6 percent of total store sales.
Our analysis includes, as an additional control, a weekly measure for the currency exchange rate
between the US and Canada. This variable can capture changes in the economic situation between
the two countries during the period of analysis that potentially could affect our results. As we
did with our analysis of the impact on the online channel, we want to rule out the possibility of
different pre-intervention trends in Canada and the US driving these results. We use the following
specification to rule out the existence of pre-intervention trends:
STORE SALESjt =μj + β1TREND + β2US ∗TREND
+ β3 ∗CONTROLSjt + εjt (5)
We estimate this equation including store fixed effects, week fixed effects and foreign exchange
rates, with and without additional controls for traffic. In all cases, β2 is not statistically significant
(p>0.1), which allows us to conclude there are no different pre-intervention trends in sales for the
US and Canada stores. If we run an analogous regression using traffic as a dependent variable,
the estimation indicates a small and significant difference in the pre-intervention trends in traffic
(the traffic trend is slightly lower for US stores, relative to the traffic trend in Canada). However,
note that this pre-intervention trend in traffic is biasing against our results. If, despite this relative
decrease in traffic in the US in the period preceding the intervention, we find an increase in traffic
after the intervention, this suggests a potentially even higher effect on traffic that can be attributed
to the intervention.
Overall, the analysis of the impact of BOPS on the B&M stores indicates B&M stores received
more traffic and increased their sales as a consequence of the BOPS implementation. Section 4.3
presents additional robustness tests that further confirm the validity of our results.

Gallino and Moreno: Integration of Online and Offline Channels in RetailArticle submitted to Management Science; manuscript no. MS-12-01440 13
4.3. Robustness of the Effects
We conduct additional robustness checks by restricting our attention to different subsamples of the
data in order to ensure our results are not driven by systematic differences between groups or by
some particular extreme values or spurious effects in our data.
First, we start by constructing a matched sample that contains only DMAs with a comparable
traffic pattern. While we have not found any difference in the pre-intervention trends, using this
matched sample provides additional robustness to potential differences in the groups that are not
manifested in the pre-intervention period — this potentially could be a concern in our online
analysis, because of the heterogeneity of the DMAs. In order to make sure our results are not driven
by fundamental differences between the treatment and control groups, we consider only DMAs that
have a comparable traffic pattern (fewer than 900 daily visits to the online store). This excludes
extremely dense DMAs that are more likely to appear in the treatment group. Using this matched
sample, we are in a situation that is more similar to random assignment of treatment (see Krueger
1999). We reproduce the exact same analysis as the one shown in Table 3, but with the new,
more homogenous sample of DMAs that generate fewer than 900 daily visits to the website. The
coefficient of the variable of interest (STORE*AFTER) is still negative and significant (p<0.05),
with the point estimates being -0.22 and -0.19, suggesting a decline in online sales also when we
restrict to homogenous DMAs.
Second, we conduct an analysis in which we exclude peak periods, without significant differences
in our results. To be precise, we exclude from our analysis those weeks that include Black Fri-
day (11/25/11), Cyber Sunday (11/27/11) and Cyber Monday (11/28/11), the two days before
Christmas Day of 2011, and any other week for which the sales observations exceed 3.5 standard
deviations from the average weekly sales at the same location. After excluding these observations,
we run the same analysis that we report in Table 3, column 1 (for the online sales), and Table 4,
column 2 (for the store sales). The coefficients of interest are -0.15 for STORE AFTER (p< 0.01)
and 0.10 for US AFTER (p<0.01). These values are similar in sign and magnitude to the ones
found using the full sample (-0.16 and 0.14, respectively).
Third, we investigate whether the pattern we observe at the aggregate level in the online and
B&M channels also arises with more-granular data. We obtained data of the weekly sales for the
different departments for each of the brick-and-mortar stores and also for the aggregate online
channel. The retailer has a total of eight product departments its stores. We focus our analysis on
three departments: Kitchen, Entertainment, and Decoration. These departments together capture
80 percent of the BOPS transactions during the period under analysis and represent 72 percent of
total sales (excluding furniture) in the stores for the same period. The analysis of brick-and-mortar
sales at the department level reproduces the pattern we found at the aggregate level. Table 5 shows

Gallino and Moreno: Integration of Online and Offline Channels in Retail14 Article submitted to Management Science; manuscript no. MS-12-01440
the results, using stores in Canada as a control group. Sales at brick-and-mortar stores in the US
increase for all departments, relative to Canada.
Finally, for additional robustness check of our results, we also conduct a placebo test, where we
keep only the pre-intervention portion of the data and we estimate the effect of a “fake” change of
policy in the middle of the pre-intervention period. In particular, we choose day July 5, 2011, as
our fake launch date, and we keep observations until October 2011 (the real launch). As we would
expect, when we estimate the effect of that fictitious policy change, we do not find a statistically
significant effect on our variables of interest — in the analogous analysis to Table 3, column 1, and
Table 4, column 2, the coefficients of STORE AFTER and US AFTER have p>0.1.
4.4. Aggregate Impact
Sections 4.1 and 4.2 have identified a negative impact of the BOPS program on the online channel
and a positive effect on the B&M channel. One question unaddressed so far is whether the increase
in store sales compensates for the decrease in online sales. In our particular case, it turns out it
does. Based on our results presented in Table 3, we know that after the BOPS implementation,
the online sales drop of around 7 percent in those DMAs affected by the program, relative to those
DMAs that remain unaffected by BOPS implementation. In our analysis of the impact of BOPS
in the B&M stores (Table 5), we find the B&M sales in stores affected by BOPS implementation
increased by 6 percent, relative to those stores that were not affected by BOPS implementation.
The online sales represent roughly one fourth of the total sales for the company, and given the
DMAs and stores affected by the program, the decrease in online sales attributed to the BOPS
implementation is compensated by the increase in store sales, giving an average net increase of 4
percent of the total sales and the estimated 95 percent confidence interval is between 7.5 percent
and 0.5 percent10. Interestingly, without the holistic interpretation of online and store sales, an
evaluation of the effects on the online channel in isolation might have suggested that BOPS was
not a good idea given the decrease in online sales.
While our results show a net positive and significant effect of the program implementation, the
specific magnitude of the impact can be quite idiosyncratic. The impact of the program actually
varies by category (as seen, for example, in Table 5), and what in our setting is a 4 percent increase
in sales can be a very different number in other settings. However, we believe the directional effects
that we find and, more importantly, the mechanisms at play, are very likely to be found in more
general settings. Section 5 focuses on explaining the mechanisms through which BOPS results in
the observed patterns.
10 The mean and confidence interval for the overall impact were estimated with a 10,000 iteration bootstrap over thetwo estimation models.

Gallino and Moreno: Integration of Online and Offline Channels in RetailArticle submitted to Management Science; manuscript no. MS-12-01440 15
5. Understanding the Mechanism of the Impact of BOPS
Given that BOPS sales are considered to originate from the online channel and are therefore
considered online sales, the results presented in the previous section are hard to reconcile with
conventional wisdom, which suggests that offering customers more options to buy online should
benefit the retailer’s online sales. The results presented in Section 4.1 tell us the opposite: online
sales decrease after the pick-up implementation.11 On the other hand, as presented in Section
4.2, B&M sales benefit very substantially from this new online service. While some level of cross-
selling in the stores to BOPS customers could be expected, this alone does not seem to explain the
magnitude we observe in the increase in store sales that we can attribute to the implementation of
BOPS.
This section tries to unveil the mechanism underlying the results described in Section 4. We begin
by studying the cross-selling mechanism through which B&M sales could benefit from the BOPS
functionality. After that, we describe channel-shift patterns and we verify those are consistent with
an increase of ROPO after BOPS implementation.
5.1. BOPS and Cross-Selling Effect
Customers who visit the B&M stores to pick up an item they bought online using BOPS, or indi-
viduals accompanying them, might decide to buy extra items during their visit. We are interested
in testing whether there is evidence in our data about this positive externality from BOPS on store
sales.
Our data does not allow us to uniquely identify purchases made by customers when visit-
ing the store to pick up an item they have ordered online. To overcome this challenge, we test
whether the total number of customers who picked up items at a store in a particular week
(PICKUP V ISITSjt) correlates to an increase in store sales that week. By performing this anal-
ysis, we can observe if more pick-up customers at the stores generate more store sales. We propose
the following model:
STORE SALESjt =μj + β1PICKUP V ISITSjt + β2TRAFFICjt+
+ CONTROLSjt + εjt, (6)
where STORE SALESjt corresponds to the total dollar sales at store j during week t. The inde-
pendent variables in the model include total traffic at each store (TRAFFICjt), store fixed effects,
and week dummies. Controlling for traffic mitigates the potential bias we may have if people choose
11 To make our exposition clearer, we refer to our results in absolute terms. However, it is important to note that theresults obtained in Section 4.1 should be interpreted in relative terms, since we are always comparing a treatmentgroup and a control group and their relative differences. For example, it is possible that both the treatment- and thecontrol-group sales increased during the period under analysis, but at different rates.

Gallino and Moreno: Integration of Online and Offline Channels in Retail16 Article submitted to Management Science; manuscript no. MS-12-01440
to pick up items at certain times with particular characteristics that might be correlated with
sales.12 As in the previous models, all the variables are included in log form. This analysis applies
to the period that follows the BOPS implementation, since no customers were picking up items
they had ordered online before that.
The results of this analysis are presented in Table 6. In the first column, we observe that the
number of pick-up transactions has a positive and significant effect on the number of purchase
transactions. The second and third columns in Table 6 present the analysis of the impact of the
pick-up transactions on store sales. This result seems consistent with the hypothesis that some
customers who go to the store to pick up their BOPS orders buy other products while in the store,
products they would not have otherwise bought. However, an alternative explanation for these
findings is that these additional sales associated with the number of pick-up transactions could have
taken place anyway, either at a different time or on the online channel. From our results of Section
4.4, it is clear that the overall net effect of the program is positive— i.e., there are incremental
sales overall. Are the identified cross-sales incremental? It is indeed difficult to rule out that those
sales would not have happened because we do not have the ability to run a precise counterfactual.
We can express the cross-selling effect as the sum of two terms— the incremental term (corre-
sponding to sales that would not have occurred otherwise) and the sales-displacement term (sales
that would have occurred in the online channel or in the stores, possibly at a different time).
While we cannot precisely quantify each of the two effects, we hypothesize that the incremental
term of the cross-selling effect is positive and significant. In order to provide evidence supporting
this hypothesis, we examine how the cross-selling effect of BOPS differs for each of the different
departments. We look at the association between the number of customers picking up products in
store j on week t and the sales of each department. Cross-selling incremental sales are more likely
in categories where purchases are unplanned—e.g., a customer visits the store to pick up an item
and decides to buy some additional items on the fly. In contrast, sales displacement is more likely
to occur in categories where purchases are more planned—e.g., a customer was planning to buy
an item (online or at a later date) and does so when going to the store to pick up another item
instead of doing it online or at a later date. If our hypothesis that cross-selling does generate some
incremental sales is correct, the effect should be more salient in those categories where purchases
are more likely to be unplanned, impulse sales.
Table 8 shows the results at the department level. All departments experience an increase in sales
that can be linked to the number of customers picking up BOPS orders, suggesting that cross-selling
occurs in every department. The effect is most pronounced for the Kitchen and Entertainment
12 We have also run robustness checks including additional controls, such as the total sales in the online channel, andour results do not substantially change.

Gallino and Moreno: Integration of Online and Offline Channels in RetailArticle submitted to Management Science; manuscript no. MS-12-01440 17
departments. These two happen to be the departments where the average transaction price is
the lowest (see Table 7) and where the sales are most responsive to the traffic in the store (the
coefficients of traffic are the highest in Table 8). This is consistent with the idea that purchases
in these departments are potentially more impulsive than purchases in the other departments and
are more likely to be unplanned–purchases that otherwise would have not occurred. The fact that
the cross-sales are more prominent in categories more prone to impulse shopping suggests that a
significant part of the cross-selling effect indeed comes from incremental sales.
We conclude from this analysis that a cross-selling effect exists and that part of the increase in
B&M sales can be explained by the positive externality generated by customers picking up their
online orders at the stores and purchasing additional items they otherwise would not have bought.
5.2. BOPS and Channel-Shift Effect
The total number of BOPS transactions is not high enough to explain increases in store sales of
around 6 percent arising from cross-selling. Also, the cross-selling effect does not explain why online
sales go down in areas near a store or why traffic increases at stores after BOPS implementation
(which is the case even if we subtract traffic that corresponds to BOPS customers).
We hypothesize that there exists a channel-shift effect that is an indirect consequence of the
implementation of BOPS. This channel shift is based on an increase in a behavior that retailers
know as ROPO (“research online, purchase offline”). We argue that BOPS causes an increase in
ROPO behavior; after BOPS implementation, some customers who would have purchased online
engage in ROPO behavior, and some customers who would not have made purchases at all become
ROPO customers. The mechanisms through which BOPS may result in additional ROPO can be
explained in light of the recent operations management literature on inventory-availability infor-
mation.
5.2.1. Channel Choice and Research Online, Purchase Offline
Customers can choose the channel through which they make a transaction. Each channel has some
associated costs and benefits. Before BOPS was implemented, a customer considering a potential
transaction had three options: not to make a purchase, make a purchase through the web, or
visit to a store to make the purchase there. The expected utility of each of those options can be
expressed as follows: U(∅) = 0; U(web) = f(value, price, shipping cost,waiting cost, quality risk);
U(store) = f(value, price, trip cost, availability risk).
The utility of purchasing online decreases with higher shipping costs, longer lead times, and
quality uncertainty of the product the customer is considering. The utility of visiting a store to make
a purchase decreases with the costs of visiting the store and availability uncertainty. A customer
will choose the option that gives the highest utility.

Gallino and Moreno: Integration of Online and Offline Channels in Retail18 Article submitted to Management Science; manuscript no. MS-12-01440
After BOPS was implemented, a new option was added to the channel-choice menu:13
U(BOPS) = f(value, price, trip cost, quality risk)
Note that both purchases made on the web and those made through BOPS are considered online
revenue. A customer who chooses the BOPS option does not have to pay shipping, and we can
assume waiting time and availability risk are reduced to 0. Since the customer pays for the order
before seeing the product, the individual faces a quality risk.
If the implementation of BOPS did not affect the utility of the other channels, we would expect
some channel shift between ∅ and BOPS, between online and BOPS, or between store and BOPS,
but not between online and store, or between ∅ and store.
Offering online customers the option to pick up their online purchases at a nearby store can
benefit them in several ways. For example, compared to the traditional online channel, customers
can obtain their items faster or avoid paying shipping costs. Another potential motivation for
customers to use BOPS is to avoid the risk of going to the store and not finding what they want.
Our data shows more than 70 percent of BOPS customers wait two days or more to pick up their
items (see Figure 2), suggesting that speed is not necessarily the main driver of BOPS usage.
BOPS provides an additional benefit to customers that might not be evident right away: when
customers are offered the possibility of buying their items online and picking them up from a
store shortly after, they learn that the items are available in the store. Hence, they can decide to
check their item’s availability online and drive to the store to pick them up without closing the
transaction online. This behavior allows customers the benefit of getting their items fast with no
shipping cost and additionally provides an opportunity to evaluate the items at the store before
actually paying for them (while avoiding the risk of making a trip to the store and not finding the
desired item). In other words, the implementation of BOPS is associated with providing inventory
information that may reduce the availability risk of the store channel and actually change the
utility of that channel, enabling a channel shift from the online channel to the store and from ∅ to
the store. This is a behavior consistent with ROPO.
How can BOPS implementation lead to an increase in ROPO behavior? In a setting where no
inventory availability information is shared prior to BOPS implementation, the reason would be
clear. BOPS gives information about inventory availability in the stores. Customers can use that
information before deciding to visit a store. Su and Zhang (2009) show that committing to an
inventory level is valuable; giving customers information about a store’s inventory reduces the
13 We are here considering BOPS as a separate option of the channel-choice menu that bridges the online and offlineworlds. Orders are considered online revenue, but they are fulfilled with store inventory. The purpose is to discusswhat BOPS does to the sales of the two conventional channels. Even if BOPS is not a separate channel per se, it ishelpful to consider it as a separate option in the channel-choice menu.
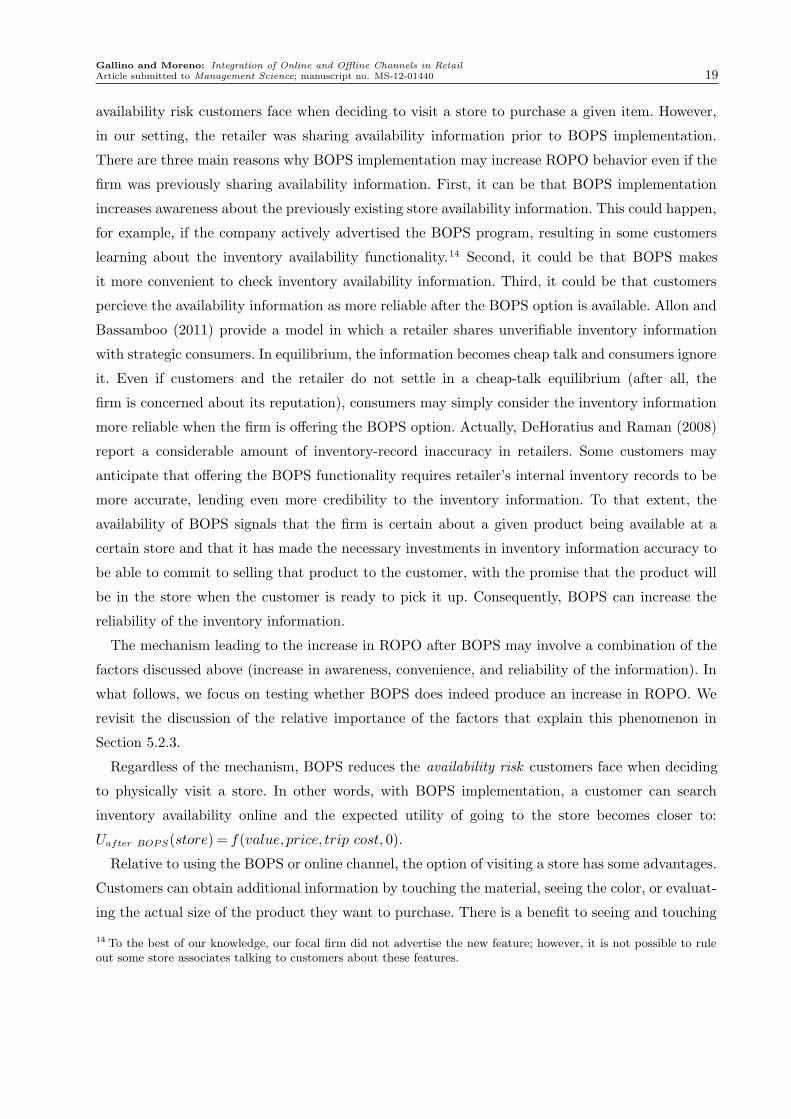
Gallino and Moreno: Integration of Online and Offline Channels in RetailArticle submitted to Management Science; manuscript no. MS-12-01440 19
availability risk customers face when deciding to visit a store to purchase a given item. However,
in our setting, the retailer was sharing availability information prior to BOPS implementation.
There are three main reasons why BOPS implementation may increase ROPO behavior even if the
firm was previously sharing availability information. First, it can be that BOPS implementation
increases awareness about the previously existing store availability information. This could happen,
for example, if the company actively advertised the BOPS program, resulting in some customers
learning about the inventory availability functionality.14 Second, it could be that BOPS makes
it more convenient to check inventory availability information. Third, it could be that customers
percieve the availability information as more reliable after the BOPS option is available. Allon and
Bassamboo (2011) provide a model in which a retailer shares unverifiable inventory information
with strategic consumers. In equilibrium, the information becomes cheap talk and consumers ignore
it. Even if customers and the retailer do not settle in a cheap-talk equilibrium (after all, the
firm is concerned about its reputation), consumers may simply consider the inventory information
more reliable when the firm is offering the BOPS option. Actually, DeHoratius and Raman (2008)
report a considerable amount of inventory-record inaccuracy in retailers. Some customers may
anticipate that offering the BOPS functionality requires retailer’s internal inventory records to be
more accurate, lending even more credibility to the inventory information. To that extent, the
availability of BOPS signals that the firm is certain about a given product being available at a
certain store and that it has made the necessary investments in inventory information accuracy to
be able to commit to selling that product to the customer, with the promise that the product will
be in the store when the customer is ready to pick it up. Consequently, BOPS can increase the
reliability of the inventory information.
The mechanism leading to the increase in ROPO after BOPS may involve a combination of the
factors discussed above (increase in awareness, convenience, and reliability of the information). In
what follows, we focus on testing whether BOPS does indeed produce an increase in ROPO. We
revisit the discussion of the relative importance of the factors that explain this phenomenon in
Section 5.2.3.
Regardless of the mechanism, BOPS reduces the availability risk customers face when deciding
to physically visit a store. In other words, with BOPS implementation, a customer can search
inventory availability online and the expected utility of going to the store becomes closer to:
Uafter BOPS(store) = f(value, price, trip cost, 0).
Relative to using the BOPS or online channel, the option of visiting a store has some advantages.
Customers can obtain additional information by touching the material, seeing the color, or evaluat-
ing the actual size of the product they want to purchase. There is a benefit to seeing and touching
14 To the best of our knowledge, our focal firm did not advertise the new feature; however, it is not possible to ruleout some store associates talking to customers about these features.

Gallino and Moreno: Integration of Online and Offline Channels in Retail20 Article submitted to Management Science; manuscript no. MS-12-01440
the type of items this retailer sells before committing to the purchase. This firsthand experience is
less relevant for customers when buying various types of products that are more standardized (e.g.,
books or electronics). In other words, physically commuting to the store can reduce the quality risk
potential customers face.
Hence, the patterns we observe after BOPS implementation can be explained by the following
behavior: After BOPS, some customers (more than before) visit the online store to browse the
catalog, find the item they want to buy, and check its availability. They then travel to their
local store to close the sale knowing the item is there. The customers, after observing availability
information (potentially more reliable than before), decide to visit the store without closing the
sale online.
If BOPS indeed increases ROPO, the following patterns would be observed:
1. an increase in store visits to stores that offer BOPS, relative to those that do not.
2. an increase in store sales in stores that offer BOPS, relative to those that do not.
3. a decrease in online sales in DMAs that are within the area of influence of the stores
(affected by BOPS), relative to those DMAs that are not (unaffected by BOPS).
These are precisely the results we found in Section 4.
In other words, we argue that BOPS implementation increases the appeal of the store channel
by reducing the perceived availability risk. This results in a shift to the store channel by some
users who otherwise would have used the online channel and by some users who otherwise would
not have made the purchase.
5.2.2. Does BOPS Increase ROPO?
The patterns obtained in Section 4 and discussed in Section 5.2.1 are consistent with an increase
in ROPO behavior after BOPS. We present additional tests to provide even more evidence that
confirms BOPS implementation increases ROPO. This evidence is valid regardless of the mechanism
through which BOPS affects ROPO.
Evidence from Cart Abandonment
In order to validate that the aforementioned mechanism is in place, we have established a hypothesis
that will be supported if the described mechanism is indeed occurring. This hypothesis is related
to shopping-cart abandonment. A number of customers abandon their online shopping carts before
finishing the transaction. After BOPS was deployed, customers could order an item online and
pick it up from the store. Learning that a product is available at a nearby store can prompt
some customers to abandon their virtual shopping carts and buy the items directly from the
store without closing the transaction online. If, as our explanation suggests, the ROPO behavior
increases after BOPS implementation (for example, because inventory information is perceived as

Gallino and Moreno: Integration of Online and Offline Channels in RetailArticle submitted to Management Science; manuscript no. MS-12-01440 21
more reliable), we can hypothesize that the rate of shopping-cart abandonment will increase after
BOPS implementation for customers who live near a store.
To test this hypothesis, we once again follow a DiD approach. We want to compare what hap-
pened before and after the BOPS implementation. To do this, we consider the group of DMAs that
were affected by the BOPS implementation (our treatment group) and the group of DMAs that
were not affected (our control group). These groups are the same as those described in Section 4.1.
We use the following model:
ABANDONit =μi + β1AFTERt+
β2STOREi ∗AFTERt + β3CONTROLSit + εit (7)
Our dependent variable (ABANDONit) corresponds to the fraction of customers who, after
placing an item in their cart, did not close the sale.15 As in Section 4.1, the interaction STOREi ∗
AFTERt is 1 after BOPS implementation for those DMAs that are in the catchment area of a
store. If its coefficient β2 is positive and significant, this suggests some customers in those DMAs
in the catchment area of a store increase their likelihood of abandoning their carts after BOPS
implementation, relative to customers who are not in a store’s area of influence.
The results of this analysis are presented in Table 9. One of the columns uses week dummies and
the other column uses month dummies. Our hypothesis is validated in both cases. The shopping-cart
abandonment rate increased after BOPS was deployed for those DMAs where BOPS was available,
compared with those DMAs where customers could not take advantage of this new feature. As
we did in our analysis of BOPS implact on online and brick-and-mortar sales, we calculated pre-
intervention trends in abandonment behavior and we did not find statistically significant differences
in our pre-intervention trends.
The increase in the online shopping-cart abandonment rate was around 1 percent (statistically
significant). This analysis provides evidence that is consistent with the patterns we would expect
to find if ROPO behavior indeed increases following BOPS implementation.
Evidence on Channel Conversion Rates
In order to provide additional validation for the hypothesis that there is a shift toward buying in
the stores (channel shift) after the BOPS introduction, we analyze the change in conversion rates
of the different channels before and after BOPS implementation.
Again, the hypothesis we want to test is whether deploying BOPS incentivizes ROPO behavior.
If there is an increase in ROPO behavior after BOPS implementation, the online channel will expe-
rience lower revenue per visitor (because more online visitors will end up buying in the stores) and
15 The abandonment rate in our sample has a mean of 51 percent with a standard deviation of 24 percent.

Gallino and Moreno: Integration of Online and Offline Channels in Retail22 Article submitted to Management Science; manuscript no. MS-12-01440
the brick-and-mortar channel will experience higher revenue per visitor (because ROPO customers
who go to the stores are determined to make a purchase and therefore have a higher expected
revenue per visit). We refer to revenues per unique online visitor and revenues per store visitor as
the channel conversion rate.
In our model, we express store sales as a function of foot traffic, and we let this function change
after the implementation of BOPS. The specification we use for brick-and-mortar sales is the
following:
STORE SALESjt =f(TRAFFICjt)+ εjt
=μj + β0TRAFFICjt + β1TRAFFICjt ∗USj + β2TRAFFICjt ∗AFTERt
(8)
+ β3TRAFFICjt ∗USj ∗AFTERt + β4CONTROLSjt + εjt
A value of β3 that is statistically different from 0 would suggest that the revenue per visitor
changes after BOPS implementation; a positive value would indicate an increase in the revenue
per visitor for the stores affected by BOPS after the program is implemented. Table 10 shows
the estimates, and column 3 shows that β3 is positive and significant. In other words, the average
revenue per visitor to the store increases.
We use a similar specification for the online sales from DMA i:
ONLINE SALESit =f(V ISITORit)+ εit
=μi + α0V ISITORit + α1V ISITORit ∗USi + α2V ISITORit ∗AFTERt
(9)
+ α3V ISITORit ∗USi ∗AFTERt + α4CONTROLSit + εit
A value of α3 that is statistically different from 0 would suggest that the revenue per unique online
visitor actually changes after the deployment of BOPS; a negative value would indicate a decrease
in the revenue per visitor for the stores affected by BOPS after the program is implemented. Table
10 shows the estimates, and column 3 shows that α3 is negative and significant. In other words,
the average revenue per online visitor decreases.
Overall, these results are consistent with an increase in ROPO behavior as a consequence of
BOPS implementation. Visitors to the website buy less on average and visitors to the stores buy
more on average after BOPS is implemented.
5.2.3. Reliability of the Inventory Information
We have pointed out several possible factors that explain the mechanism by which BOPS increases
ROPO. It is possible BOPS implementation generates increased awareness about the inventory
information. It is also possible BOPS implementation makes it more convenient for customers to

Gallino and Moreno: Integration of Online and Offline Channels in RetailArticle submitted to Management Science; manuscript no. MS-12-01440 23
access this information. Finally, it is possible customers perceive inventory information as more
reliable after BOPS implementation. While the increase of ROPO after BOPS implementation
probably comes from a combination of these (and potentially other) factors, we believe the increase
in perceived reliability of the inventory information after BOPS is implemented is a material factor
that explains part of the increase in ROPO. In order to support this statement with data, we
propose and conduct two series of experiments. In the first, we simply generate two images that
replicate the information and the look and feel of the interface customers observed before and
after BOPS implementation. The only difference between the images is that one includes a button
indicating the item can be bought online an picked up in a store. Two hundred subjects, selected
with Google Consumer Surveys, are asked to choose the situation under which they would be more
likely to make a travel to the store if they needed to buy an item that same day. Even in the
most conservative of the results, more than 62 percent of the participants indicated they would be
more likely to make a trip to the store in the situation where the BOPS option was available. The
results are statistically significant. In the second set of experiments, 130 subjects were presented
with only one screenshot, which may or may not have the pick-up option, and they were asked to
rank how much they trusted the inventory availability information on a scale of 1 (very unlikely)
to 5 (very likely). The average score when the BOPS button was shown was 4.18, versus 3.68 when
the BOPS button was not shown. The difference again is statistically significant. While presenting
a comprehensive behavioral study is beyond the scope of this paper (but could be an area of
future research), we believe these results suggest the shock in inventory reliability after BOPS
implementation is material. While we cannot rule out other simultaneous mechanisms, increased
perceived inventory reliability can explain at least part of the increase in ROPO behavior after
BOPS implementation.
5.3. Further Evidence from Department-level Data
In addition to providing further robustness checks on our main results, the differences we observe
for different categories can shed more light regarding the mechanisms that are in place.
The penetration of the BOPS option varies across departments. For example, the Entertainment
category accounts for 35 percent of the brick-and-mortar sales but 48 percent of the BOPS sales.
Figure 1 shows the share of the brick-and-mortar sales and BOPS sales for each of the three
categories of interest. The figure shows how customers use the BOPS alternative more to buy
items in the Entertainment category, relative to the average department sales. An opposite effect
occurs with the Decoration department, where customers use the BOPS alternative relatively less
compared with the average B&M sales. One reason why we may observe less use of BOPS for
decor sales is the relatively higher uncertainty regarding product characteristics for SKUs that

Gallino and Moreno: Integration of Online and Offline Channels in Retail24 Article submitted to Management Science; manuscript no. MS-12-01440
belong to that department. As pointed out above, we expect customers to find BOPS less valuable
for products with tangible characteristics that the customer wants to feel before buying because
there is more quality risk in those situations. This concern is less prevalent for departments where
products are more commoditized, such as Entertainment and Kitchen category. At the same time,
the value of BOPS increases when customers perceive a risk of experiencing a stockout if visiting
the store. This can explain the higher penetration of BOPS for products from the Entertainment
department, where most of the SKUs are sold in quantities larger than one; a customer might want
to close the transaction with the BOPS option to make sure the 6 plates or the 12 glasses he wants
to buy are going to be available when he visits the store.
When we consider the pattern of migration from the online to the store channel across different
departments, we have to keep in mind the relative importance of shipping costs, which for this
retailer are a flat rate. Since ROPO saves customers the shipping costs (relative to buying online),
we expect ROPO to be more attractive to customers when shipping costs are a higher fraction of the
total costs. A customer placing an order for an item that costs $600 would be relatively less affected
by a $50 shipping charge (and therefore more likely to use the online channel) than a customer
buying a $50 item. The Entertainment and Kitchen departments have less expensive items than
the Decoration department and therefore are more sensitive to the shipping costs. Entertainment
and Kitchen are actually the departments that experience a bigger decrease in online sales and
a bigger increase in brick-and-mortar sales after BOPS is implemented. Another reason that can
help explain this pattern is that products in these two department tend to be smaller and therefore
easier to carry than products that fall under Decoration.
6. Conclusions
Our analysis of the impact of an online–offline integration strategy that offers the option of buying
items online and picking them up in a physical store shows that online sales do not increase with
the implementation of this functionality. We find that BOPS implementation results in lower online
sales, higher store sales, and higher store traffic. We explain these results as arising from two
simultaneous phenomena: a cross-selling effect from customers who go to the stores to pick up
items they purchased using the BOPS functionality, and a channel-shift effect, which we attribute
to an increase in ROPO (research online, purchase offline) behavior. This increase in ROPO can
be explained in light of recent models from the operations management community that study the
effects of sharing inventory information with strategic consumers. The implementation of BOPS
provides a quasi-experiment that gives a positive shock to the perceived reliability of the inventory
information shared with the customers. As this information becomes more credible, more customers

Gallino and Moreno: Integration of Online and Offline Channels in RetailArticle submitted to Management Science; manuscript no. MS-12-01440 25
engage in ROPO; they use the online channel to browse store inventory availability but make their
purchases in the stores. Our analysis shows that channels interact in a subtle way.
Future research could build on our results and the channel-choice analysis presented in Section
5.2.1 to enrich existing models in operations management and marketing. For example, models
along the lines of Su and Zhang (2009) could be enriched to incorporate options like ROPO, in
which customers can engage in some costly action that reduces the availability risk. Similarly, the
recent literature on channel choice in marketing (e.g., Ansari et al. 2008, Valentini et al. 2011)
could consider the availability risk that we have shown to affect the store channel’s utility.
One of the consequences of the increase in online activity in retail is the availability of richer data
that can be used to evaluate the impact of operational interventions and to discover relationships
between different operational aspects of the business. We provide a replication appendix (Appendix
A) that retailers could follow to replicate the results of our analysis or evaluate other channel-
integration efforts they may be interested in.
We believe our results have important managerial implications. Because channel integration is
an increasing trend, practitioners have been seeking guidance on how to implement these programs,
and some practitioner-oriented publications have addressed this issue (e.g., Bain & Company 2011).
This is the first academic study of this area, and we believe our analysis provides insights that are
helpful to practitioners as they think about implementing a multichannel program.
Our results can inform cost benefit analysis by firms that are trying to assess the profitability
of implementing BOPS. There are two caveats to make here. The first is that this analysis is
necessarily idiosyncratic: as we saw in our category-level analysis, the effects can vary substantially
from category to category and probably even more from retailer to retailer. In our empirical setting,
most of the products have an experiential component and shopping in the store is a pleasant
experience. For highly standardized products or for products that lead to a less pleasant store
experience, it is possible BOPS implementation does not result in such a substantial shift from
the online channel to the store channel. Indeed, we have observed that the effects differ across
categories. Products with a low price, relative to the shipping costs, are the items that see a higher
shift from the online channel to the stores. It is possible that for some products one observes the
opposite behavior of ROPO, with customers visiting B&M stores to inspect the items and then
placing orders through a different online retailer. This is what is known in retail as “showrooming.”
The second caveat is that our discussion so far has been mostly centered on the demand side
of the equation; what happens to sales after BOPS implementation? Our empirical analysis has
focused on identifying patterns in channel-shift behavior that arise from implementing BOPS. There
may be nontrivial changes in costs too. At the very least, implementing a multichannel strategy
such as BOPS requires substantial investments in inventory management systems to maintain

Gallino and Moreno: Integration of Online and Offline Channels in Retail26 Article submitted to Management Science; manuscript no. MS-12-01440
accurate, real-time information about product availability across different channels. Besides that,
the costs of serving customers with online inventory or with store inventory can be very different.
Online orders are usually fulfilled from centralized, efficient warehouses where inventory costs are
lower and there are substantial economies of scale and demand-pooling benefits. Oftentimes, a
firm subsidizes part of the shipping costs. If there is a shift of online customers toward stores,
retailers probably will save in shipping costs but will have to replenish their stores more frequently
and will have higher inventory costs. At the same time, there is now more store inventory being
used to fulfill customer orders, and this may result (all the rest being equal) in lower end-of-
season inventories and fewer markdowns. It has been documented that more sophisticated channel
integration strategies, such as pooling inventory across stores, have resulted in an increase in
inventory turns after implementing channel pooling strategies.16 If store purchases are less likely
to be returned, this shift could also result in lower costs from returned products. Our analysis of
the demand side shows that multichannel interventions may result in subtle patterns that make
cost projections difficult.
As we pointed out, assessing the profitability of a BOPS-like intervention has to be done in
a case-by-case basis. Now we present six other managerial implications that, in our view, are
also extremely relevant and can be more easily translated to other retailers or other online-offline
implementations.
First, our results show a clean example of how traditional retailers can take advantage of mul-
tichannel presence. BOPS integrates two channels in a novel way and we show that the analysis
of its implementation is not trivial, its implications are significant from a business perspective,
and its impact is economically relevant. As we show in our analysis, the impact of a multichannel
strategy is also multichannel.
This brings us to the second implication. The evaluation of a multichannel strategy should be
performed in a holistic way. A naive approach to estimating the impact of BOPS would have
looked at the results exclusively, or primarily, on the online channel. As we have shown, trying to
understand the effect of a multichannel decision by evaluating only one channel can be misleading.
In our particular case, an evaluation of the consequences of the program exclusively on the online
channel would have resulted in the company shutting down the program. This would not have been
a good decision given the net aggregate effect.
Thirdly, our analysis highlights the importance to rethink the incentive alignments in multichan-
nel organizations. As we mentioned in our previous point, a partial analysis of the BOPS decision
would have been inaccurate. The need to realign incentives in the organization is vital. If parties
16 “ Nordstrom Links Online Inventory to Real World,” see http://www.nytimes.com/2010/08/24/business/24shop.html

Gallino and Moreno: Integration of Online and Offline Channels in RetailArticle submitted to Management Science; manuscript no. MS-12-01440 27
involved in a multichannel implementation are evaluated and incentivized exclusively by the results
in their own channel, multichannel initiatives will not go far. Our analysis is a clear example where
channel-specific incentives would have resulted in the interruption of the BOPS program, since the
leading team in the implementation—the online team—would have decided to stop the program
given the observed sales reduction on the online channel.
A fourth point that our results make evident is that multichannel programs can bring unexpected
operational implications to the organization. In the particular case of BOPS, the focal company
had to the rethink their inventory policy given the unexpected shift in demand from one channel
to the other. Similarly, the company had to revisit its store staffing needs and define new in store
replenishment times at the stores, and new processes for the pick-up customers. All this poses new
challenges for store execution.
The fifth point we would like to emphasize is that our analysis shows how customers may derive
value from multichannel interventions in some ways that are unanticipated. For example, we have
seen that a number of customers use BOPS as a reliable way of checking store inventory, which was
not the purpose for which BOPS was originally implemented. Similarly, customers who do indeed
use BOPS conventionally (to pay for products they can pick up at the store) do not pick up the
products immediately. Figure 2 shows how long customers wait to pick up the products. It turns
out that only 28 percent of the customers pick up their orders on the same or the same day or
day after they placed them. This suggests the main reason customers are using the program is not
necessarily speed but, more likely, the convenience of knowing their products will be available for
pick-up when they choose to do so.
The final point we would like to make goes back to the two questions we address at the beginning
of this section. One might be tempted to think of BOPS implementation in terms of short-term
profitability and treat this practice as something that a multichannel retailer can decide to imple-
ment or not depending on the short-term outcome. Our results show that customers clearly see
the company as one entity and not two separate businesses (online vs offline). The impact of the
BOPS implementation shows that, customers perceive the interaction between themselves and one
company and they are willing to inform their purchase process by taking advantage of the multi-
channel experience. Competitive pressure from many retailers offering this multichannel experience
leads to the question of to what extent the leading retail companies today have the real option
of not offering a multichannel experience, even in cases when profitability might not be there yet.
Our results show that multichannel integration has already happened and the challenge for many
retailers is to implement it in the most efficient way, rather than deciding whether or not to do it.
Acknowledgments

Gallino and Moreno: Integration of Online and Offline Channels in Retail28 Article submitted to Management Science; manuscript no. MS-12-01440
The authors gratefully acknowledge helpful comments from Gad Allon, Alessandro Arlotto, Gerard Cachon,
Nicole DeHoratius, Beth DeRosier, Marshall Fisher, Noah Gans, Raghu Iyengar, Robert Shumsky, Xuan-
ming Su, participants in the 2012 conference of the Consortium of Operational Excellence in Retailing, and
participants in the Kellogg Operations Workshop 2012. Kevin Huang provided excellent research assistance.
References
Allon, G., A. Bassamboo. 2011. Buying from the babbling retailer? The impact of availability information
on customer behavior. Management Science 57(4) 713.
Anderson, E.T., G.J. Fitzsimons, D. Simester. 2006. Measuring and mitigating the costs of stockouts.
Management Science 1751–1763.
Angrist, Joshua D., Jorn-Steffen Pischke. 2008. Mostly Harmless Econometrics: An Empiricist’s Companion .
1st ed. Princeton University Press.
Ansari, A., C. F. Mela, S. A. Neslin. 2008. Customer channel migration. Journal of Marketing Research
45(1) 60–76.
Bain & Company. 2011. Omnichannel retailing. Retail holiday newsletter 3, special edition.
Bendoly, E., J.D. Blocher, K.M. Bretthauer, S. Krishnan, MA Venkataramanan. 2005. Online/in-store
integration and customer retention. Journal of Service Research 7(4) 313–327.
Brynjolfsson, E., Y. J. Hu, M. Rahman. 2009. Battle of the retail channels: How product selection and
geography drive cross-channel competition. Management Science 55(11) 1755–1765.
Caro, Felipe, Jeremie Gallien. 2010. Inventory management of a fast-fashion retail network. Operations
Research 58(2) 257–273.
Chen, Kay-Yut, Murat Kaya, Ozalp Ozer. 2008. Dual sales channel management with service competition.
Manufacturing & Service Operations Management 10(4) 654–675.
Chintagunta, Pradeep K., Junhong Chu, Javier Cebollada. 2012. Quantifying transaction costs in online/off-
line grocery channel choice. Marketing Science 31(1) 96–114.
Chu, J., P. Chintagunta, J. Cebollada. 2008. Research note: A comparison of within-household price sensi-
tivity across online and offline channels. Marketing Science 27(2) 283–299.
Dana, Jr., James D., Nicholas C. Petruzzi. 2001. Note: The newsvendor model with endogenous demand.
Management Science 47(11) 1488–1497.
DeHoratius, N., A. Raman. 2008. Inventory record inaccuracy: An empirical analysis. Management Science
54(4) 627–641.
Dholakia, R.R., M. Zhao, N. Dholakia. 2005. Multichannel retailing: A case study of early experiences.
Journal of Interactive Marketing 19(2) 63–74.
Ebeltoft Group. 2012. Global cross channel retail report. The (un)connected store. White
Paper. URL https://ebeltoftgroup.bscw.de/pub/bscw.cgi/d132894/2012%20Global%20Cross%
20Channel%20Retail%20Report-The%20(un)connected%20Store_EBELTOFT%20GROUP.pdf.

Gallino and Moreno: Integration of Online and Offline Channels in RetailArticle submitted to Management Science; manuscript no. MS-12-01440 29
Fisher, M. L., J. Krishnan, S. Netessine. 2006. Retail store execution: An empirical study. Working Paper,
University of Pennsylvania. .
Fitzsimons, G. J. 2000. Consumer response to stockouts. Journal of Consumer Research 27(2) 249–266.
Forman, C., A. Ghose, A. Goldfarb. 2009. Competition between local and electronic markets: How the
benefit of buying online depends on where you live. Management Science 55(1) 47–57.
Geyskens, I., K. Gielens, M. G. Dekimpe. 2002. The market valuation of internet channel additions. The
Journal of Marketing 102–119.
Huang, Tingliang, Jan A Van Mieghem. 2014. Clickstream data and inventory management: Model and
empirical analysis. Production and Operations Management, forthcoming .
Jerath, K., A. Kumar, S. Netessine. 2012. An information stock model of customer behavior in multichannel
customer support services. Working paper, Avaliable at SSRN .
Kok, A. G., M. L. Fisher. 2007. Demand estimation and assortment optimization under substitution: Method-
ology and application. Operations Research 55(6) 1001–1021.
Krueger, Alan B. 1999. Experimental estimates of education production functions. The Quarterly Journal
of Economics 114(2) 497–532.
Lewis, M., V. Singh, S. Fay. 2006. An empirical study of the impact of nonlinear shipping and handling fees
on purchase incidence and expenditure decisions. Marketing Science 51–64.
Musalem, A., M. Olivares, E.T. Bradlow, C. Terwiesch, D. Corsten. 2012. Structural estimation of the effect
of out-of-stocks. Management Science 52(1) 113.
Neslin, S. A., D. Grewal, R. Leghorn, V. Shankar, M. L. Teerling, J. S. Thomas, P. C. Verhoef. 2006.
Challenges and opportunities in multichannel customer management. Journal of Service Research 9(2)
95–112.
Netessine, S., N. Rudi. 2006. Supply chain choice on the internet. Management Science 844–864.
Ofek, E., Z. Katona, M. Sarvary. 2011. Bricks and clicks?: The impact of product returns on the strategies
of multichannel retailers. Marketing Science 30(1) 42–60.
Pauwels, K., S. A. Neslin. 2008. Building with bricks and mortar: The revenue impact of opening physical
stores in a multichannel environment. Working Paper, Marketing Science Institute .
Perdikaki, O., S. Kesavan, J. M. Swaminathan. 2012. Effect of traffic on sales and conversion rates of retail
stores. Manufacturing and Service Operations Management 14(1) 145.
Randall, T., S. Netessine, N. Rudi. 2006. An empirical examination of the decision to invest in fulfillment
capabilities: A study of Internet retailers. Management Science 52(4) 567–580.
Rao, S., S.E. Griffis, T.J. Goldsby. 2011. Failure to deliver? Linking online order fulfillment glitches with
future purchase behavior. Journal of Operations Management .

Gallino and Moreno: Integration of Online and Offline Channels in Retail30 Article submitted to Management Science; manuscript no. MS-12-01440
Su, X., F. Zhang. 2009. On the value of commitment and availability guarantees when selling to strategic
consumers. Management Science 55(5) 713–726.
Swinney, R. 2012. Inventory pooling with strategic consumers: Operational and behavioral benefits. Working
Paper .
Valentini, Sara, Elisa Montaguti, Scott A Neslin. 2011. Decision process evolution in customer channel
choice. Journal of Marketing 75(6) 72–86.
Zettelmeyer, F. 2000. Expanding to the Internet: Pricing and communications strategies when firms compete
on multiple channels. Journal of Marketing Research 37(3) 292–308.
Appendix A: Replication Appendix
This appendix may be of interest to practitioners or academics who seek to replicate the analysis presented
in this paper or perform an analysis of similar interventions. These replication steps can be applied to study
an online–offline integration strategy such as BOPS or other business decisions that have been or will be
implemented by a retailer interested in business analytics.
The first step is to identify the business decision to be evaluated (in our case the impact of inventory
verifiability on online and B&M sales).
The second step, and probably the most crucial one, is to identify a treatment group and a control group.
In an ideal setting, the retailer will plan ahead of time and before implementing the business practice will
create a treatment group and a control group, with randomly assigned members to each group. These groups
can include, for example, different categories within the store, stores, ZIP code areas, countries, etc. Fast pace
is an intrinsic characteristic of the retail industry and, in most cases, decisions are made without developing
a careful plan for evaluating their impact. This is the situation we faced in our own project, where BOPS
was carefully planned on the implementation side but lacked a clear strategy for carefully measuring its
impact. If this is the situation, identifying treatment and control groups requires some ingenious planning.
The treatment group is usually more obvious because most of the stores or ZIP code areas (we will call
these the units of analysis) have been affected by the implementation. The hope here is that it is possible
to identify a group of those units of analysis that were not affected by the implementation so that they can
become the control group. In our case, these groups were the DMAs far from the stores (for the analysis of
the online channel) and the stores in Canada (for the analysis of the B&M channel).
The next step is to evaluate the impact of the decision by considering a suitable identification strategy,
such as a difference-in-differences analysis. The objective here is to compare the impact before and after the
implementation between the treatment and the control groups. Relevant controls for this analysis are a fixed
effect for each unit of analysis, if it has been possible to work with a panel structure, and time controls that
can address any seasonality concerns. If some units belong to different countries, it might be useful to include
additional macroeconomic controls. In our case, we used the currency exchange rate between US dollars and
Canadian dollars as an additional control variable.

Gallino and Moreno: Integration of Online and Offline Channels in RetailArticle submitted to Management Science; manuscript no. MS-12-01440 31
Finally, there are a number of tests that are relevant to perform when the treatment and control groups
are not randomly defined, as in our own case. Among others, the main robustness validations that we suggest
are:
• Random assignment test. If there is no clear evidence that the members of each group were endogenous
to a business decision, it is important to perform a random assignment test within the treatment and control
groups.
• Placebo test. This robustness check consists of the replication of the main analysis performed but with
a fake implementation date.
• Group pre-trends. This robustness check attempts to rule out the possibility that there is a different
trend present between the treatment and the control groups prior to the business implementation.
• Matching units of analysis. This robustness analysis attempts to balance the observable characteristics
of the treatment and control groups by implementing a matching technique, e.g., propensity score matching.
After the matching has been performed, the difference-in-differences analysis can be performed between the
matched groups.

Gallino and Moreno: Integration of Online and Offline Channels in Retail32 Article submitted to Management Science; manuscript no. MS-12-01440
Appendix B: Tables and Figures
Table 1 Summary Statistics
Online Stores — Average Weekly Parameters per DMA
# DMAs # Visitors # Orders Revenue Distance[page visits] [orders] [dollars] [closest store]
Before BOPS 210 6,022 167 25,260 165(16,391) (448) (79,319) (236)
After BOPS 210 6,146 161 24,181 165(16,877) (461) (79,172) (236)
B&M Store — Average Weekly Parameters per Store
# Stores Traffic Transactions Revenue[customers] [number] [dollars]
Before BOPS 83 6,162 1,643 177,815(3,569) (762) (108,182)
After BOPS 83 7,378 2,170 175,185(5,228) (1,543) (107,672)
Standard deviations in parentheses
DÉCOR ENTERTAINING KITCHEN
B&M 13% 35% 24%
Pick Up 8% 48% 24%
0%
10%
20%
30%
40%
50%
Sale
s Pe
rce
nta
ge b
y D
ep
arta
me
nt
Figure 1 BOPS and brick-and-mortar sales share (by department)
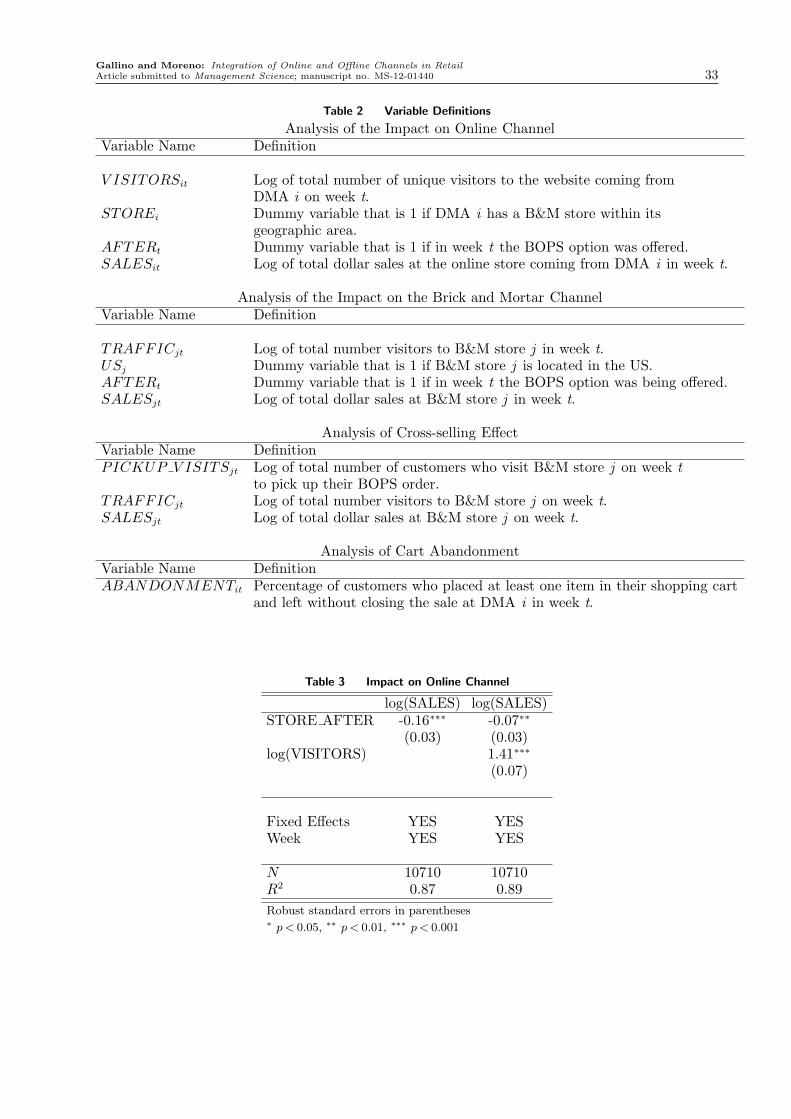
Gallino and Moreno: Integration of Online and Offline Channels in RetailArticle submitted to Management Science; manuscript no. MS-12-01440 33
Table 2 Variable Definitions
Analysis of the Impact on Online ChannelVariable Name Definition
V ISITORSit Log of total number of unique visitors to the website coming fromDMA i on week t.
STOREi Dummy variable that is 1 if DMA i has a B&M store within itsgeographic area.
AFTERt Dummy variable that is 1 if in week t the BOPS option was offered.SALESit Log of total dollar sales at the online store coming from DMA i in week t.
Analysis of the Impact on the Brick and Mortar ChannelVariable Name Definition
TRAFFICjt Log of total number visitors to B&M store j in week t.USj Dummy variable that is 1 if B&M store j is located in the US.AFTERt Dummy variable that is 1 if in week t the BOPS option was being offered.SALESjt Log of total dollar sales at B&M store j in week t.
Analysis of Cross-selling EffectVariable Name DefinitionPICKUP V ISITSjt Log of total number of customers who visit B&M store j on week t
to pick up their BOPS order.TRAFFICjt Log of total number visitors to B&M store j on week t.SALESjt Log of total dollar sales at B&M store j on week t.
Analysis of Cart AbandonmentVariable Name DefinitionABANDONMENTit Percentage of customers who placed at least one item in their shopping cart
and left without closing the sale at DMA i in week t.
Table 3 Impact on Online Channel
log(SALES) log(SALES)STORE AFTER -0.16∗∗∗ -0.07∗∗
(0.03) (0.03)log(VISITORS) 1.41∗∗∗
(0.07)
Fixed Effects YES YESWeek YES YES
N 10710 10710R2 0.87 0.89
Robust standard errors in parentheses∗ p < 0.05, ∗∗ p < 0.01, ∗∗∗ p < 0.001

Gallino and Moreno: Integration of Online and Offline Channels in Retail34 Article submitted to Management Science; manuscript no. MS-12-01440
Table 4 Impact on Brick-and-Mortar Stores
log(TRAFFIC) log(SALES) log(SALES)
US*AFTER 0.13∗∗∗ 0.14∗∗∗ 0.06∗
(0.03) (0.02) (0.02)log(TRAFFIC) 0.63∗∗∗
(0.07)Fixed Effects YES YES YESMacroeconomic Controls YES YES YESTime Effect Week Week Week
N 4347 4497 4342R2 0.95 0.90 0.91
Robust standard errors in parentheses∗ p < 0.05, ∗∗ p < 0.01, ∗∗∗ p < 0.001
Table 5 Impact on Brick-and-Mortar Stores by Department
DECOR ENTERT KITCHENlog(SALES) log(SALES) log(SALES)
US*AFTER 0.06∗∗ 0.10∗∗∗ 0.14∗∗∗
(0.02) (0.02) (0.02)log(TRAFFIC) 0.54∗∗∗ 0.57∗∗∗ 0.57∗∗∗
(0.03) (0.03) (0.03)Fixed Effects YES YES YESMacroeconomic Controls YES YES YESTime Effect Week Week Week
N 4172 4172 4172R2 0.88 0.93 0.94
Robust standard errors in parentheses∗ p < 0.05, ∗∗ p < 0.01, ∗∗∗ p < 0.001
Table 6 Cross-selling Effect
log(TRANS) log(SALES) log(SALES)
log(PICKUP VISITS) 0.07* 0.06*** 0.05***(0.03) (0.02) (0.01)
log(TRAFFIC) 0.35*** 0.30***(0.10) (0.07)
Fixed Effects YES YES YESWeek YES YES YESN 5088 5238 5083R2 0.92 0.78 0.82
Robust standard errors in parentheses
* p < 0.05, ** p < 0.01, *** p < 0.001

Gallino and Moreno: Integration of Online and Offline Channels in RetailArticle submitted to Management Science; manuscript no. MS-12-01440 35
Table 7 Summary Statistics by Department
Department Median SKU Avg Units per Avg Trans. ExamplesPrice Trans. per SKU Price
[dollars] [units] [dollars]
Decoration 39.95 2.00 79.9 Decorative pillows,candleholders, vases, etc.
Entertainment 9.95 3.34 33.23 Dinnerware sets,coffee mugs, flatware, etc.
Kitchen 14.95 1.40 20.93 Knife sets, griddles,grill pans, blenders, etc.
Table 8 Cross-selling Effect by Department
DECOR ENTERT KITCHENlog(SALES) log(SALES) log(SALES)
log(PICKUP VISITS) 0.03*** 0.07*** 0.05***(0.01) (0.01) (0.01)
log(TRAFFIC) 0.49*** 0.57*** 0.57***(0.03) (0.03) (0.03)
Fixed Effects YES YES YESTime Effects Week Week WeekN 5007 5007 5007R2 0.87 0.94 0.95
Robust standard errors in parentheses
* p < 0.05, ** p < 0.01, *** p < 0.001
Table 9 Impact on Cart Abandonment
ABAND ABANDSTORE*AFTER 0.009∗∗ 0.009∗∗
(0.003) (0.003)Fixed Effects YES YESTime Effects Week Month
N 10920 10920R2 0.48 0.46
Robust standard errors in parentheses∗ p < 0.05, ∗∗ p < 0.01, ∗∗∗ p < 0.001

Gallino and Moreno: Integration of Online and Offline Channels in Retail36 Article submitted to Management Science; manuscript no. MS-12-01440
Table 10 Visitor Conversion: Brick-and-Mortar Channel and Online Channel
Brick and Mortar Online Channellog(SALES) log(SALES)
(1) (2) (3) (4) (5) (6)log(TRAFFIC) 0.46∗∗∗ 0.47∗∗∗ 0.46∗∗∗
(0.07) (0.07) (0.07)log(TRAFFIC US) 0.19∗∗∗ 0.19∗∗∗ 0.19∗∗∗
(0.04) (0.04) (0.04)log(TRAFFIC AFTER) -0.02 -0.02∗
(0.01) (0.01)log(TRAFFIC US AFTER) 0.01∗
(0.00)log(VISITORS) 1.419∗∗∗ 1.422∗∗∗ 1.417∗∗∗
(0.067) (0.067) (0.067)log(VISITORS STORE) -0.010 -0.011 -0.006
(0.008) (0.008) (0.009)log(VISITORS AFTER) 0.006 0.025
(0.013) (0.021)log(VISITORS STORE AFTER) -0.002∗
(0.001)Fixed Effects YES YES YES YES YES YESTime Effect Week Week Week Week Week Week
N 4342 4342 4342 10710 10710 10710R2 0.91 0.91 0.91 0.89 0.89 0.89
Robust standard errors in parentheses∗ p < 0.05, ∗∗ p < 0.01, ∗∗∗ p < 0.001
Figure 2 Pick-up delay