integrating openstreetmap data in object based … · quantitative and visual analysis of the...
TRANSCRIPT

INTEGRATING OPENSTREETMAP
DATA IN OBJECT BASED
LANDCOVER AND LANDUSE
CLASSIFICATION FOR DISASTER
RECOVERY
LILIAN VEDASTO KATO
February, 2018
SUPERVISORS:
Prof. Dr. N. Kerle
Dr. C. J. Van. Westen


INTEGRATING OPENSTREETMAP
DATA IN OBJECT BASED
LANDCOVER AND LANDUSE
CLASSIFICATION FOR DISASTER
RECOVERY
LILIAN VEDASTO KATO
Enschede, The Netherlands, February, 2019
SUPERVISORS:
Prof. Dr. N. Kerle
Dr. C. J. Van. Westen
THESIS ASSESSMENT BOARD:
Prof. Dr. V. Jetten (Chair)
Dr. Marc. Van de Homberg (Netherlands Red Cross)
Thesis submitted to the Faculty of Geo-Information Science and Earth
Observation of the University of Twente in partial fulfilment of the requirements
for the degree of Master of Science in Geo-information Science and Earth
Observation.
Specialization: Applied Earth Sciences

DISCLAIMER
This document describes work undertaken as part of a programme of study at the Faculty of Geo-Information Science and
Earth Observation of the University of Twente. All views and opinions expressed therein remain the sole responsibility of the
author, and do not necessarily represent those of the Faculty.
i
ABSTRACT
Land cover and land use (LCLU) change is a very important indicator that can assist in the
monitoring and assessment of both physical and functional recovery. Its fundamental approach rests on
change assessment comparing the situation before, the immediate post-disaster situation and later the
recovery stage through image classification. Remote sensing (RS) imagery provides spatial, spectral and
contextual information that can assist in the LCLU classification. However, this works well with the
classification of land cover (LC) but not for land use (LU) as it fails to capture information on the building
use and function which are highly significant in LU classification. OpenStreetMap (OSM) data have been
an emerging data source for providing base map information (roads, buildings, etc) on the ground. Most of
the studies conducted using OSM data have been mainly concentrated on OSM data quality issues, but the
potential of OSM data in disaster recovery assessment has been less explored.
Therefore, the main objective of this study was to contribute to fill this knowledge gap by
investigating the potential of using RS imagery and OSM data in LCLU classification for improving the
understanding of post-disaster recovery assessment. This study addresses the limitations that came to light
in a previous study performed using a pixel-based approach for assessing LCLU changes with RS imagery,
but that faced problems related to the issue of mixed unit pixels and uncertainty, especially in the LU
classification. This study aimed at using Object-Based Image Analysis (OBIA) for improving the accuracy
of LCLU classification. This was done first by analyzing to what extent LCLU mapping performed by using
a pixel-based approach can be improved with an OBIA, and secondly investigating the significance of using
OSM information to supplement satellite imagery during the LCLU classification and lastly to assess the
performance of these two methods in the detection of different LC and LU classes.
Tacloban city in the Philippines was highly impacted by Typhoon Haiyan on 8 November 2013. As
a result of the typhoon, the area underwent drastic changes related to LC and LU in the process of recovery.
This area was selected as a study area for recovery monitoring using three Worldview 2 satellite images of
multiple time steps and OSM data.
A methodology was employed which starts by creating image segments through integrating the
vector data (road network, building footprint) obtained from OSM data in the process. Then samples were
generated using the OSM data that provided the sample label and other multi-source information (Google
Earth Pro, Google Street View, panchromatic band) for image classification. To have direct comparability
of the methods (pixels vs. segments) Support Vector Machine (SVM) classifier was employed for
classification purposes, and different object-based features for OBIA were tested to identify the specific
features that provide competent class descriptions in the classification process. The object geometry (size,
shape), layer value (brightness, mean of all WV2 bands), spectral indices (NDVI2, NDWI) and class-related
features were used for the LC classification. For the LU classification, the same features were employed in
addition to texture features and layer value (panchromatic band). The results for the three timestep images
showed an OA of 89.9%, 85.3%, 88.9% and 79.9%, 68.7%, 78.6% for the LC and LU respectively. This
shows that object geometry features and spatial data yield promising results in improving the classification,
especially for the built-up related classes.
The OSM information was shown to be of significant value in the LCLU classification as it helped
in the proper identification of road area and also in providing a sample label for image classification. A
quantitative and visual analysis of the classification results was conducted to assess the performance of
object and pixel- based methods. The results showed that the object based method produce maps with more
homogeneous and meaningful LCLU objects, but it still suffered from misclassification of vegetation classes.
The pixel-based process performed slightly better than the object-based approach in the classification of

ii
vegetation classes (palm tree, other tree). Both methods showed poor performance in the classification of
the damage class (rubble), more investigation is required when it comes to the detection of debri/rubble in
a complex urban environment. On the whole, with OBIA a promising result in the LCLU classification was
attained, however more additional of ancillary data (elevation data etc) in the analysis could show more
competitive performance.
Keywords: recovery, land cover, land use, satellite imagery, OpenStreetMap, OBIA

iii
ACKNOWLEDGEMENTS
I would like to thank the Almighty God the overseer and the creator who gave me the strength and courage
to work and finish this thesis. Special thanks to my supervisors Prof. Dr. Norman Kerle and Dr. Cees
Westen who have dedicated their time and effort to guide the thesis. Their support has been significantly
appreciated. Also, I would like to dedicate special thanks to my advisor Saman Ghaffarian, who dedicated
his time to give advice and guidance during this process.
Furthermore, I would like to thank the Digital Globe Foundations for providing the image used in this case
study. In addition, I would like to thank all the academic AES professors and doctors who help me during
all the relevant skills required to be applied in the thesis process. I would also like to thank my fellow
classmates from all the departments who gave me support and inspiration in this process.
Lastly, I would like to thank my parents who kept me in their prayers all the time I started my studies, also
I would like to thank other members of my family in Tanzania who gave me courage and supported other
activities back home on behalf. Their love is really appreciated.
iv
TABLE OF CONTENTS
Abstract ............................................................................................................................................................................ i
Acknowledgements ...................................................................................................................................................... iii
List of figures ................................................................................................................................................................ vi
List of tables ................................................................................................................................................................ viii
List of Acronyms .......................................................................................................................................................... ix
1. Introduction ........................................................................................................................................................ 11
1.1. Background ................................................................................................................................................................ 11 1.2. Research Problem ..................................................................................................................................................... 13 1.3. Objectives and Research Questions ...................................................................................................................... 14 1.4. Thesis Structure ........................................................................................................................................................ 14
2. Understanding post disaster recovery ............................................................................................................. 15
2.1. Definition of Recovery ............................................................................................................................................ 15 2.2. The Relationship Between Land Cover and Land Use in Urban Functions ................................................. 16 2.3. Measuring Recovery ................................................................................................................................................. 17 2.4. Land Cover and Land Use Change Analysis and Existing Literature ............................................................. 19
3. Study area and data ............................................................................................................................................. 22
3.1. Description of Study Area ...................................................................................................................................... 22 3.2. Descprition of Dataset ............................................................................................................................................ 23
4. Methodology ....................................................................................................................................................... 25
4.1. Image Segmentation ................................................................................................................................................. 26 4.2. Image Classification ................................................................................................................................................. 27 4.3. Analysis of the OSM ................................................................................................................................................ 31 4.4. Comparison Analysis of the Pixel and Object-Based Classification Results ................................................. 32 4.5. Summary .................................................................................................................................................................... 32
5. Results .................................................................................................................................................................. 33
5.1. Image Segmentation ................................................................................................................................................. 33 5.2. Analysis of OSM Data ............................................................................................................................................. 34 5.3. Features used in LCLU image Classification ....................................................................................................... 39 5.4. Accuracy Assessment ............................................................................................................................................... 48
6. Discussion ............................................................................................................................................................ 52
6.1. The Value of OSM Information in the OBIA Process ..................................................................................... 52 6.2. Utilization of Object Features in LCLU Classification ...................................................................................... 53 6.3. LCLU Analysis Using the Object-Based Strategy. ............................................................................................. 54 6.4. Comparison of the Object-Based Approach to the Pixel-Based Method. ..................................................... 56 6.5. Comparison Based on the Percentage of Area Coverage in Both Strategy. .................................................. 60
7. Conclusions ......................................................................................................................................................... 61
7.1. Recommendations and Future Works .................................................................................................................. 62
LIST OF REFERENCES ......................................................................................................................................... 63
List of appendices........................................................................................................................................................ 69

v

vi
LIST OF FIGURES
Figure 2.1. The Elements of community recovery (CDEM, 2005)..................................................................... 15
Figure 2.2. LC,LU and land function interaction retrieved from Verburg et al., (2009) ................................. 16
Figure 2.3. Types of geospatial data created in OpenStreetMap (Jokar Arsanjani et al., 2013) ...................... 18
Figure 3.1. Devastated houses in the city of Tacloban (right), and debris lines in the street of Tacloban
(left) after typhoon Haiyan ........................................................................................................................................ 22
Figure 3.2. Track of Typhoon Haiyan in the Philippines showing one of the affected province Leyte (left),
and the location of the study area in Tacloban (right) .......................................................................................... 23
Figure 4.1. Flowchart of the proposed research. .................................................................................................... 25
Figure 4.2. Hierarchy definition of LC and LU classes (Sheykhmousa, 2018) .................................................. 27
Figure 5.1. ESP graph produced from the pre-event image processing, the red circle indicates the peak of
the ROC corresponding to the scale parameters of 22, 24, 32, 45, 54 and 70 which are relevant scale levels
for the segmentation. .................................................................................................................................................. 33
Figure 5.2. A map showing the nature of land use in a different neighbourhood in the study area obtained
using OSM information. ............................................................................................................................................ 35
Figure 5.3. Significance of using OSM road network in the segmentation process. Section (b) shows the
results of segmentation without including OSM road network while section (c) shows the result of
segmentation with the inclusion of the road network. Section (a) shows the overview of the study area
with a red circle indicating the zoomed section. .................................................................................................... 36
Figure 5.4. Errors related to OSM historical data quality shown in pre-disaster image (a) and post-disaster
image (b) 1) shows buildings that were not digitized 2) shows newly constructed buildings in section (b)
but not updated 3) shows incompleteness in the building footprint in section (a) as compared in section
(b). .................................................................................................................................................................................. 37
Figure 5.5. Shifting of the building footprint from the original position as indicated in the image (a), image
(b) shows the adjustment of the building footprints after rubber sheeting. ...................................................... 38
Figure 5.6. A map showing the post-disaster image with a problem of the incorrect label of the building
footprints in the northwest area of Tacloban (a) and corresponding attribute table showing the
information of the building selected in blue color (b) ........................................................................................... 39
Figure 5.7. LC classification map for the pre disaster image obtained using object based approach and
corresponding pie chart showing the coverage area per class (outer layer) in comparison to pixel-based
approach (inner layer) coverage area per class previously obtained by Sheykhmousa, (2018) ....................... 42
Figure 5.8. LC classification map for the event image obtained using object based approach and
corresponding pie chart showing the coverage area per class (outer layer) in comparison to pixel-based
approach (inner layer) coverage area per class previously obtained by Sheykhmousa, (2018) ....................... 43
Figure 5.9. LC classification map for the post disaster image obtained using object based approach and
corresponding pie chart showing the coverage area per class (outer layer) in comparison to pixel-based
approach (inner layer) coverage area per class previously obtained by Sheykhmousa, (2018) ....................... 44
Figure 5.10. LU classification map for the pre disaster image obtained using object based approach and
corresponding pie chart showing the coverage area per class (outer layer) in comparison to pixel-based
approach (inner layer) coverage area per class previously obtained by Sheykhmousa, (2018) ....................... 45
Figure 5.11. LU classification map for the event image obtained using object based approach and
corresponding pie chart showing the coverage area per class (outer layer) in comparison to pixel-based
approach (inner layer) coverage area per class previously obtained by Sheykhmousa, (2018) ....................... 46
vii
Figure 5.12. LU classification map for the post disaster image obtained using object based approach and
corresponding pie chart showing the coverage area per class (outer layer) in comparison to pixel-based
approach (inner layer) coverage area per class previously obtained by Sheykhmousa, (2018)....................... 47
Figure 6.1. Spectral separability of the tree category showing the mean digital number values obtained in
each band from pre-event WV2 image. .................................................................................................................. 55
Figure 6.2. A subset of a multispectral image showing the complexity of the area covered by a palm tree
and other trees in both pre-disaster state (A) and post-disaster state (C) image, also the damage in the
disaster situation showing (flattened tree) (C) ........................................................................................................ 55
Figure 6.3. Uncertainty in assessing road damage as shown in different time series drone images. (A) image
taken 6 days after the disaster showing the impassable road; (B) image taken 8 days after the disaster
showing the cleaning up effort; (C) image taken 7 weeks after the disaster (Corephil Data Services Inc,
2013) ............................................................................................................................................................................. 56
Figure 6.4. Built-up classes comparison of the object based and pixel-based classification performance in a
small subset of a study area. The blue circle and the white circle highlight the area of uncertainty in both
approaches. A) pre-disaster image B) event image ................................................................................................ 58
Figure 6.5. Vegetation classes comparison of object-based and pixel-based classification performance in a
small subset of a study area. The panchromatic image of the pre-disaster (A), event (B), and post-disaster
(C) respectively are used for the clear visualization of the palm tree and other trees. .................................... 59
Figure 6.6. Complexity of the damage class flattened tree A) WV2 image, B) Drone Image ........................ 59
viii
LIST OF TABLES
Table 3-1. List of available datasets and the description ....................................................................................... 24
Table 4-1. List of objects features ............................................................................................................................ 30
Table 5-1. Classification threshold values used in the assessment of the nature of land use (‘X’=average
size of the structure) ................................................................................................................................................... 34
Table 5-2. Selected object features in OBIA for LC classification task ............................................................. 40
Table 5-3. Selected object features in OBIA for LU classification task ............................................................. 40
Table 5-4. LC classification accuracies for the pre, event and post-disaster images ........................................ 49
Table 5-5. LU classification accuracies for the pre, event and post-disaster images. The bolded classes in
each timestep shows the vegetation classes that has low UA and PA as compared to the results obtained in
pixel based approach ................................................................................................................................................... 50
Table 5-6: The UA and PA of the vegetation classes obtained previous by the pixel based approach with
improved accuracy as compared to object based results for both pre, event and post disaster respectively
........................................................................................................................................................................................ 51
ix
LIST OF ACRONYMS
Bare Area Index BAI
Disaster Risk Management DRM
Estimation of Scale Parameter ESP
Formal Built Up Area FBA
Grey Level Cooccurrence Matrix GLCM
Informal Built Up Area IBA
Large Scale Industry LSI
Land Cover and Land Use LCLU
Land Cover LC
Land Use LU
Multiresolution Segmentation MRS
Normalized Difference Water Index NDWI
Normalized Difference Vegetation Index NDVI
Overall Accuracy OA
OpenStreetMap OSM
Object Based Image Analysis OBIA
Producer Accuracy PA
Random Forest RF
Remote Sensing RS
Rate of Change ROC
Support Vector Machine SVM
User Accuracy UA
Very High Resolution Image VHR
Volunteered Geographic Information VGI
WorldView2 WV2


INTEGRATING OPENSTREETMAP DATA IN OBJECT BASED LANDCOVER AND LANDUSE CLASSIFICATION FOR DISASTER RECOVERY
11
1. INTRODUCTION
1.1. Background
A community or society is said to have been affected by a disaster when a hazardous event causes
serious disruption in its operation and results in physical, socio-economic and environmental losses such
that the community or society fails to cope using its own resources (UNISDR, 2009). According to Guha-
Sapir, Hoyois, & Below (2016), the distribution of disaster occurrences varies from continent to continent.
Asia has been reported as the most affected continent by disasters, in which the Philippines is frequently
affected by natural disaster. The statistics show that the country was hit by 311 typhoons, 168 hydrological
disasters, 54 geophysical disasters and 9 climatological disasters from 1950 to 2014 (CRED, 2014).
Typhoons are one among the main types of hazards that may cause loss of life or injury, damage,
and destruction to property and environment. In 2013, the Philippines was hit by the super typhoon Haiyan.
This was the strongest tropical cyclone ever recorded to make landfall in the history of the Philippines, with
category five storm surge and wind speed that reached 300 km/h (DEC, 2015; Takagi & Esteban, 2016).
The typhoon brought damages and losses to the country of an estimated USD 2.2 billion, and a total of
6,300 individuals were reported dead, 28,688 injured and 1,062 are still missing (NDRRMC, 2014; DEC,
2015). The areas that were largely affected by the typhoon includes the province of Samar and Leyte
especially Tacloban among others. Rapid damage assessment was carried out followed by the response phase
using various methods such as Remote Sensing (RS), Volunteered Geographic Information (VGI) (social
media, OpenStreetMap) and ground-based observations (Westrope, Banick, & Levine, 2014; Takahashi,
Tandoc, & Carmichael, 2015). Furthermore, different studies have been done in this area to understand how
the area is recovering from this devastating event (Yan et al., 2017; Sheykhmousa, 2018).
Recovery is significant for communities affected by the disaster to improve or restore the pre-
disaster living condition. UNDP (2011) defined recovery as the process of returning to a normal situation
after a time of difficulty whereas enabling essential modifications that will facilitate disaster risk reduction.
In general, recovery is seen as a dynamic process which involves different phases in the procedure. The
recovery phase begins after the response phase has ended and it can take several months or years to reach
its goals, that is to say, restoring the pre-disaster stage by implementing the progress actions to reduce the
disaster risk (Coppola, 2015; UNISDR, 2015).
After a disaster, it is vital for policymakers and other stakeholders to understand how the recovery
process might take place and to have proper planning and management of the resources. Although assessing
and monitoring of recovery is important, this process is still considered to be the least understood phase of
the DRM cycle (Hettige, 2018). The initial step of understanding recovery is to define and measure it in a
more systematic and holistic framework (Miles & Chang, 2003).
There are existing methods that can be used to monitor and assess the recovery processes. These
techniques guide in obtaining essential data that can support the decision-making process by relevant
stakeholders and policymakers for necessary and effective actions to be taken (Horney et al., 2016). Existing
recovery assessment methods include but are not limited to ground survey and observation, social audits
(key informant interviews, focus group discussion), household surveys, official publication and statistics,
VGI and satellite image analysis (Platt, Brown, & Hughes, 2016). Ground-based techniques are costly, time-
consuming and difficult to cover all the aspect of recovery over the large and inaccessible areas. Platt et al.,
(2016) found out that combining ground-based techniques with satellite data to monitor and assess recovery
yielded effective results. RS allows measurements and assessment of recovery over large areas while ground-
based techniques provide more details on the ground over a small area.

INTEGRATING OPENSTREETMAP DATA IN OBJECT BASED LANDCOVER AND LANDUSE CLASSIFICATION FOR DISASTER RECOVERY
12
Remote sensing (RS) is a potential tool to study and understand recovery. The use of existing
satellite imagery data of multiple time steps has proven to be useful in assessing the state of the structure
(buildings, roads) as well as non-structural elements such as vegetation areas and water bodies in detecting
the changes over time (Guo et al., 2010; Sheykhmousa, 2018). In addition, indicator methods are widely
used in the monitoring and assessment of recovery. Brown et al. (2015) used the indicator-based method to
assess the physical and social recovery based on the Very High Resolution (VHR) image combined with a
ground survey and social audit technique. The use of the indicator-based method associated with
quantifiable metrics was adopted to study post-disaster community recovery in the United States (Horney
et al., 2016). However, these studies focused much on the physical aspect of recovery which is limited to
detect changes in the construction and reconstruction of the built-up environment and neglects the
functional recovery that reveals changes on the use/function of ground objects. Besides, the RS approach
fails to capture information on the building’s facades, building use and function both of which can assist in
the functional recovery. This is due to limited spatial resolution and non-oblique look angle of most satellite
sensors (Cusicanqui, Kerle, & Nex, 2018). On the contrary, VGI data OSM specifically can be combined
with the RS approach to assist the analysis data as it provides base map which contains information that can
be used to support different phases of disaster activities (Westrope et al., 2014).
OpenStreetMap (OSM) is a crowdsourced thematic database that has grown in relevance. In the
OSM platform, detailed and up-to-date geospatial data can be generated by online volunteers (Miyazaki,
Nagai, & Shibasaki, 2015). On the other hand, the Humanitarian OpenStreetMap Team (HOT) is a
worldwide dedicated team that performs humanitarian actions by working together online to build local
mapping capacity and add data to OSM (HOT, 2018). These geographic data are freely available and can be
used for a wide range of application such as in disaster risk management (DRM). A very comprehensive
database can be quickly created after a disaster event. The database includes useful features such as the
outline of the buildings and building use, both of which can provide information on the land-use hence
strongly assist in functional recovery assessment (Wang & Zipf, 2017). However, since the assessment of
recovery depends on the accurate determination of pre-disaster and post-disaster state, in some areas such
as Tacloban in the Philippines, OSM data in the past prior to the disaster, does not exist. For this reason, it
is difficult to relate to the pre-disaster state as the benchmark dataset is not available.
Much research work has been conducted on using VGI data to support the prevention, preparation,
and response phases of the DRM cycle (de Albuquerque et al., 2016; Latif et al., 2011). However, the use of
OSM data in the recovery phase has received less attention. The existing studies have largely focused on the
economic aspect of recovery, for instance, Yan et al. (2017) use the geotagged social media data as one of
the forms of VGI to assess and monitor post-disaster recovery in tourist destinations. The author
highlighted the incompleteness of the extracted tourists’ sites from the OSM database due to data quality
issues. In fact, the quality of OSM data has been a point of discussion in different literature. Different
researches have investigated the completeness and accuracy of OSM data, especially in large cities. The
results obtained from these studies show that overall OSM data has proven to be an excellent source of
information and often outstanding official data (Mobasheri et al., 2018; Haklay et al., 2010; Kounadi, 2009).
However, there is little knowledge on the use of these available and free data in the recovery phase after a
major disaster.
The recovery process after a disaster influence different changes in the community affected, which
ranges from physical reconstruction to social economic and environmental impacts (CDEM, 2005). The
increasing availability of VHR imagery before and after the disaster allows different indicators of features to
be detected that can assist in the monitoring of recovery (Joyce et al., 2009). Land cover (LC) and land use
(LU) change detection can be used as a reliable indicator to assist in the monitoring and assessment of
recovery. It provides information that can reveal the physical changes in the environment (LC) as well as
the functional changes (LU). The provided information can be used to support the planning and
management of resources and also to assess how well the recovery has taken place in the affected area.
INTEGRATING OPENSTREETMAP DATA IN OBJECT BASED LANDCOVER AND LANDUSE CLASSIFICATION FOR DISASTER RECOVERY
13
There are various methods used in the LCLU change assessment. Among others, the traditional
pixel-based approach has been widely used in image classification for change detection analysis (Joyce et al.,
2009; Veljanovski, Kanjir, & Oštir, 2011). Recently, the development of satellite imagery with a resolution
below 1-meter has made the pixel size considerably smaller than the mean size of the object to be observed
(Blaschke, 2010a). Therefore, most of the studies started changing from individual pixels to objects
representation as the most appropriate data for image classification analysis.
Object-based image analysis (OBIA) has been extensively used for many application such as in LC
and LU image classification in the field of RS (Goodin, Anibas, & Bezymennyi, 2015a; Marangoz, 2018).
There are different approaches that can be used to perform the OBIA classification among others the
supervised classification methods which use the training sample and reference data are mostly used in the
classification of LC and LU (Marangoz, Sekertekin, & Akcin, 2017). Advanced in technology has lead to the
development of machine learning algorithms that have demonstrated the capability to detect, quantify and
identify different features in an image. Support Vector Machine (SVM) among others is more popular in the
RS field due to the capability of handling small training data set and producing competitive results
(Mountrakis, Im, & Ogole, 2011). In the OBIA process, the use of machine learning has proved to perform
well in differentiating different segments and are capable of handling different learning tasks with high-
resolution images and produce high classification accuracy (Kuffer et al., 2016a).
1.2. Research Problem
An accurate assessment of recovery depends on the determination of changes on the situation
before, during and after a disaster event. The use of available high-resolution satellite images of multiple
time steps has made the recovery assessment possible through the change detection analysis (Joyce et al.,
2009). Different change detection methods based on RS data can be performed using pixel and object-based
classification techniques. However, the performance of these techniques lies in the efficient procedures used
to classify satellite images.
Landcover (LC) can be obtained directly from the RS images. However, the process may be
challenging depending on the type of LC that needs to be extracted. For example, extraction of the damage
features such as debris or rubble in the area affected by a disaster may be challenging and hence making the
classification process problematic. This problem has been observed by Sheykhmousa, (2018) who used the
pixel-based approach in LC and LU classification and faced difficulties in detecting the class debris/rubble
from an image resulting in considerable misclassification of this damage class with other cover classes. The
reason for such misclassification might be rooted by the problem of mixed unit class within a pixel at which
spectral and textural information only may not be enough for such a discrimination. From the preceding
discussion, it is evident that a method that can discriminate features by using additional information other
than spectral and textural characteristics which mostly used by pixel approach be adopted.
LU which refers to the function of the surface cover, desires more information on the use of the
cover to be well classified. Crowdsource information such as OSM data can be used to aid in LU
classification. OSM data that contains boundaries of the buildings, roads and other objects can be
incorporated with satellite imagery for LU classification. For this reason, OSM data can be used to aid the
OBIA process to improve the accuracy in LC and LU classification. However, to what extent the use of
OBIA will help improve the accuracy of LC and LU mapping which was previously done by the pixel-based
approach and faced difficulties especially in the detection of debris/rubble in Tacloban city is still a question
to be answered.
Therefore, this study aims at investigating the potential of using OSM data within an OBIA
approach for the LCLU classification of high-resolution satellite images in post-disaster recovery
assessment. The analysis will be performed in eCognition software which has incorporated different
machine learning tools.
INTEGRATING OPENSTREETMAP DATA IN OBJECT BASED LANDCOVER AND LANDUSE CLASSIFICATION FOR DISASTER RECOVERY
14
1.3. Objectives and Research Questions
1.3.1. Main Objective
To investigate the potential of using OSM data within an OBIA and machine learning approach for
LCLU classification of high-resolution satellite images in post-disaster recovery assessment.
1.3.2. Specific Objective
1. To investigate to what extent LCLU mapping performed by using a pixel-based approach for
recovery assessment in Tacloban city can be improved with the OBIA method.
a. Which classes were particularly difficult to classify using the pixel-based approach performed in
previous LCLU recovery research in Tacloban city and why?
b. Which aspect of OBIA (e.g., size, shape) can help to reduce the ambiguity of identified classes that
were difficult to be accurately classified using a pixel-based approach?
c. How can the use of the object-based approach yield potentially better results for LCLU
classification and for which specific class/es do OBIA lead to an improvement?
2. To investigate the significance of using OSM information to supplement satellite imagery during
LCLU classification by OBIA.
a. How valuable is the use of historical data in OSM during the LCLU classification process?
b. How can OSM information be used to support the OBIA process?
3. To analyze the value of using the object-based machine learning algorithm in eCognition for
LCLU classification.
a. What are the similarities and differences in the performance of pixels and objects based approaches
in classifying urban-rural environment?
1.4. Thesis Structure
This research is divided into seven chapters. In chapter 1, the general background and motivation
of the research are introduced, followed by the research problem, research objectives, and research
questions. Chapter 2, provides an in-depth literature review carried out to understand the concept of post-
disaster recovery. Also, it introduces the methods used in the assessment of recovery and the contribution
of VGI information in the recovery assessment. The chapter goes further in explaining the approaches used
in the analysis of LCLU change as one of the indicators in the assessment of recovery with the focus on the
object-based approach using RS and OSM data. Chapter 3, describes the study area and gives a brief
overview of the disaster (Typhoon Haiyan). Also, it illustrates the description of the dataset used in this
study. The methods used in this study to answer the research questions are described in chapter 4. Chapter
5 presents the results, while chapter 6 discusses the limitations of the data and the method, and chapter 7
elaborates on the conclusions and recommendations.

INTEGRATING OPENSTREETMAP DATA IN OBJECT BASED LANDCOVER AND LANDUSE CLASSIFICATION FOR DISASTER RECOVERY
15
2. UNDERSTANDING POST DISASTER RECOVERY
This chapter presents a general understanding of post-disaster recovery based on the in-depth literature
review. Section 2.1 illustrates the concepts of recovery including different author’s definitions and different
types of recovery. The following section, 2.2, demonstrates the relationship between land cover and land
use in urban functions. Section 2.3 describes different methods used in the assessment of recovery and the
contribution of Volunteered Geographic Information (VGI) in recovery assessment. The last section 2.4,
illustrates the approaches used in the analysis of LCLU change as one of the indicators in the monitoring of
recovery with the focus on the object-based approach using remote sensing and OSM data.
2.1. Definition of Recovery
Recovery has been defined in different ways in the existing literature. The term has been defined as the
process of returning to a normal state after a period of difficulty (Chang, 2010). This definition creates
contradiction especially when the status before the event is highly vulnerable to risk. Recently, recovery
definitions have concentrated on improving and restoring the pre-disaster status of the affected society
whereas enabling essential modifications that will facilitate disaster risk reduction (UNDP, 2011). In general,
recovery is seen as a dynamic process which involves different phases in the process. Haas, Kates, &
Bowden, (1977) described recovery as the long term
process that passes through four main sequential steps with
the main focus on the reconstruction stage. Following this
argument, there has been a disagreement on the logic
presented in this study (Rodriguez, Quarantelli, & Dynes,
2007). Recovery is seen as the process that involve more
than the reconstruction of the physical environment (Khan
and Sayem, 2013). The holistic framework explains
different elements of community recovery (figure 2-1), it is
indicated that a successive recovery of the community
should cover different sectors in the community that
ranges from physical reconstruction to social-economical
and environment impacts (CDEM, 2005). As well as the
strategies of how well these sectors will cover over time. Figure 2.1. The Elements of community recovery (CDEM, 2005)
According to CDEM, (2005) successive recovery should involve the process that considers the needs of the community as well as their interaction in social, natural, economic and built environment. Social environment needs include safety and well-being, health and welfare. Natural environment comprises of biodiversity and ecosystem, amenity value, pollution, and natural resources. All these components are essential as they play a great role in changing the physical environment.
CDEM, (2005) also defined the economic environment as the component of community recovery
which comprises of individual, firm, infrastructure and government. This component is important in the
recovery process as it involves the economic status of the community ranging from individual to community
level. Lastly, is the build-up environment which is the most studied component in the recovery process. It
is comprised of residential, commercial/industry, rural, public building and lifeline utilities. All these four
components of community recovery are very important to be implemented in the recovery process.
INTEGRATING OPENSTREETMAP DATA IN OBJECT BASED LANDCOVER AND LANDUSE CLASSIFICATION FOR DISASTER RECOVERY
16
2.1.1. Short Term and Long term Recovery
Recovery is the process that involves different phases that can occur either sequentially or
simultaneously. The recovery phase begins after the response phase has ended and it can take several months
or years to reach its goals, that is to say, restoring the pre-disaster stage (Coppola, 2015). Different targets
have been implemented towards the risk of disasters caused by natural hazards. Among others, enhancing
disaster preparedness for effective response plays a great role as it facilitates recovery, rehabilitation and
reconstruction phase which is a potential opportunity to build- back- better (UNISDR, 2015). Lindell, (2013)
argued that recovery is the process that involves four phases of activities: disaster assessment, short term
recovery, long term reconstruction, and recovery management. Short term recovery focuses on the security
of the impacted area, temporal shelter and housing, infrastructure restoration and debris management. All
these activities start immediately after the disaster event and facilitate the long term recovery process.
Long term recovery phase comprises reconstruction of the impacted area and manages the social,
economic and political effect caused by the disaster. For this phase to be well accomplished proper planning
and management of resources are vital for policymakers, stakeholders, non- governmental agencies and
donors to understand how the recovery process will be conducted (Miles & Chang, 2003). The planning is
significant as during this process changes in the environment are unavoidable.
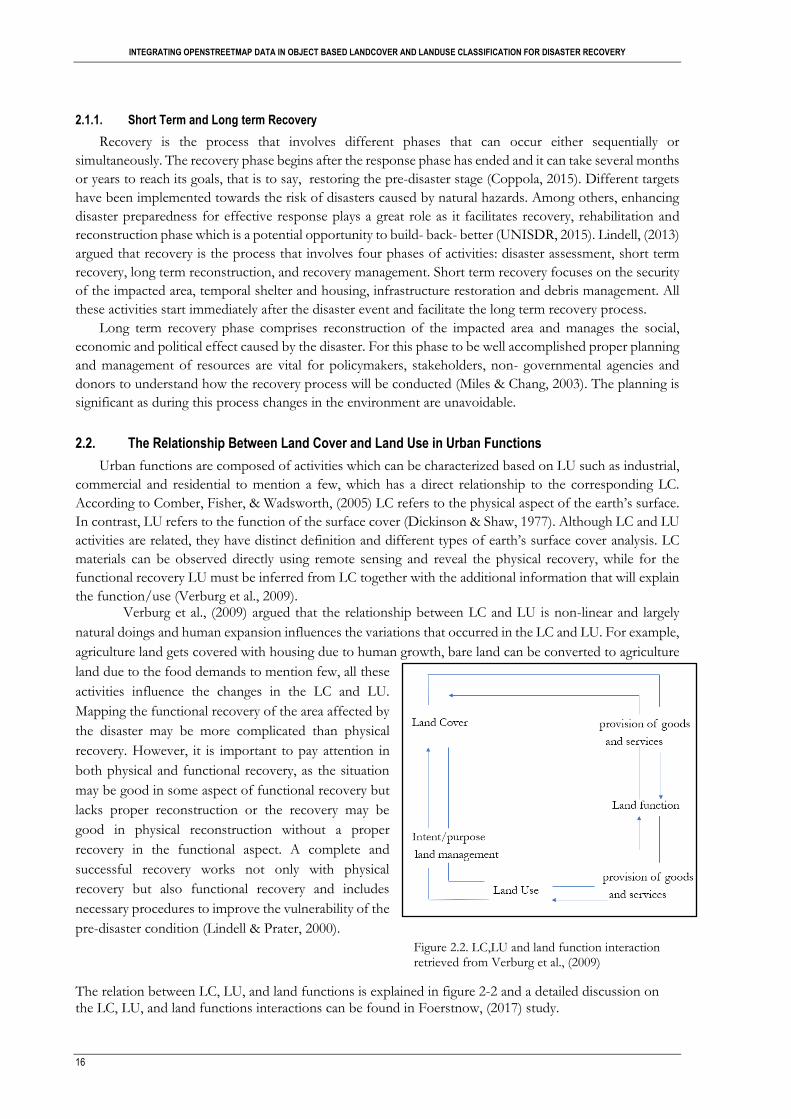
2.2. The Relationship Between Land Cover and Land Use in Urban Functions
Urban functions are composed of activities which can be characterized based on LU such as industrial,
commercial and residential to mention a few, which has a direct relationship to the corresponding LC.
According to Comber, Fisher, & Wadsworth, (2005) LC refers to the physical aspect of the earth’s surface.
In contrast, LU refers to the function of the surface cover (Dickinson & Shaw, 1977). Although LC and LU
activities are related, they have distinct definition and different types of earth’s surface cover analysis. LC
materials can be observed directly using remote sensing and reveal the physical recovery, while for the
functional recovery LU must be inferred from LC together with the additional information that will explain
the function/use (Verburg et al., 2009). Verburg et al., (2009) argued that the relationship between LC and LU is non-linear and largely
natural doings and human expansion influences the variations that occurred in the LC and LU. For example,
agriculture land gets covered with housing due to human growth, bare land can be converted to agriculture
land due to the food demands to mention few, all these
activities influence the changes in the LC and LU.
Mapping the functional recovery of the area affected by
the disaster may be more complicated than physical
recovery. However, it is important to pay attention in
both physical and functional recovery, as the situation
may be good in some aspect of functional recovery but
lacks proper reconstruction or the recovery may be
good in physical reconstruction without a proper
recovery in the functional aspect. A complete and
successful recovery works not only with physical
recovery but also functional recovery and includes
necessary procedures to improve the vulnerability of the
pre-disaster condition (Lindell & Prater, 2000).
Figure 2.2. LC,LU and land function interaction retrieved from Verburg et al., (2009)
The relation between LC, LU, and land functions is explained in figure 2-2 and a detailed discussion on the LC, LU, and land functions interactions can be found in Foerstnow, (2017) study.

INTEGRATING OPENSTREETMAP DATA IN OBJECT BASED LANDCOVER AND LANDUSE CLASSIFICATION FOR DISASTER RECOVERY
17
2.3. Measuring Recovery
Monitoring of post-disaster recovery is important for policy-makers and other stakeholders who
invested resources in the process and therefore want to know how the resources have been spent. This
process requires special attention to the proper planning and management of invested funds to facilitate the
activities involved (Yan et al., 2017). Successive assessment of post-disaster recovery requires valid data that
can be acquired from different affected sectors such as built stock, social, economic and environmental
sectors. Although, recovery assessment is essential this process is still considered to be the least understood
phase of the DRM cycle (Hettige, 2018). The initial step of understanding recovery is to define and measure
it in a more systematic and holistic framework (Miles & Chang, 2003).
Measuring recovery depends on many factors that should be encountered in the process. The scale at
which the disaster happens is vital in the evaluation of the disaster impacts (Rathfon et al., 2013). The
geographic scale can range from individual, community to the regional level. Also, there are other factors
that facilitate the recovery assessment process such as the type of disaster and the level of damage among
others.
There are existing methods that can be used to monitor and assess the recovery processes as discussed
by Brown et al., (2008) and Platt et al., (2016). As this study is based on using RS and VGI information to
understand post-disaster recovery, RS and VGI techniques will be discussed.
2.3.1. Remote Sensing Methods
Remote sensing has long been used in different phases of the DRM cycle. The increase
developments of VHR images such as Pleiades, Sentinel and Planet Labs among others which provides
information of an area on a daily basis has made the use of RS popular tool for spatial information (Platt et
al., 2016). High-resolution images can be used to support or monitor post-disaster recovery activities by
analyzing the changes in the time series images in a particular disaster area (Joyce et al., 2009).
Remote sensing-based method in monitoring and assessing recovery has been adopted by many of
the researchers. For example, multi-temporal remote sensing images from various sources were acquired for
analyzing post-earthquake landslide after the Wenchuan earthquake in China (Tang et al., 2016). In the study
of Hoshi et al., (2017) satellite images were used in the assessment and monitoring of urban recovery after
the Peru earthquake. Ghaffarian, Kerle, & Filatova, (2018) showed that monitoring and assessment of the
recovery process could be achieved by using different proxies that can be obtained from the RS images.
However, most of these studies concentrated on the physical aspect of recovery which is based on the
reconstruction of buildings and infrastructures, ignoring the functional aspects which are also essential in
recovery assessment. There have been changes in the recovery assessment taking even other parts of
recovery into account (Joyce et al., 2009). Physical recovery can be directly assessed by RS. However, the
RS approach has limits; for instance, if a roof has been rebuilt this can be directly observed from an image
but what has been rebuilt beneath it is impossible to be captured.
The use of Unmanned Aerial Vehicle (UAV) images and videos can play a very important role as
well in the recovery situation. The fusion of photogrammetry and computer vision makes it possible to
obtain simple photos, also the generation of orthophoto and point cloud from images obtained from UAV
(Dominici, Alicandro, & Massimi, 2017). These data have the ability to provide detailed information such
as damage to structural facades (Gerke & Kerle, 2011) that allows much better characterization of the
damage situation after the disaster. In general with UAV a very high temporal resolution can be generated
aftermath, and this information can be used to look for rapid changes over time to support the recovery
processes (Vetrivel, 2018). However, with UAV only a small portion of an area can be covered, this limits
the amount of information especially when a disaster occurs over a large area. Also, information on the
object function on the ground cannot be accurately obtained from UAV data, there is a need of ground
information for verification to produce accurate assessment (Ezequiel et al., 2014). Obtaining ground
INTEGRATING OPENSTREETMAP DATA IN OBJECT BASED LANDCOVER AND LANDUSE CLASSIFICATION FOR DISASTER RECOVERY
18
information can be expensive and time-consuming especially if traditional methods are used. Alternatively,
the use of VGI data OpenStreetMap (OSM) specifically which is open source information can be employed.
2.3.2. Volunteered Geographic Information in Recovery Assessment
Volunteered Geographic Information (VGI) is a special case of user-generated content which has
successfully achieved in collecting geospatial data through citizen volunteers who creates and disseminate
the dataset voluntarily worldwide (Gröchenig, Brunauer, & Rehrl, 2014). In recent years VGI has arisen as
a significant source of information that can support disaster management. This fact has been proved in
different existing literature that used this source of information to support various activities in disaster
management (Horita et al., 2013).
There are different form of the VGI that exist, among others, OSM is one of the most popular
VGI platforms, that has grown in relevance (Neis & Zielstra, 2014). In the OSM platform, a detailed and
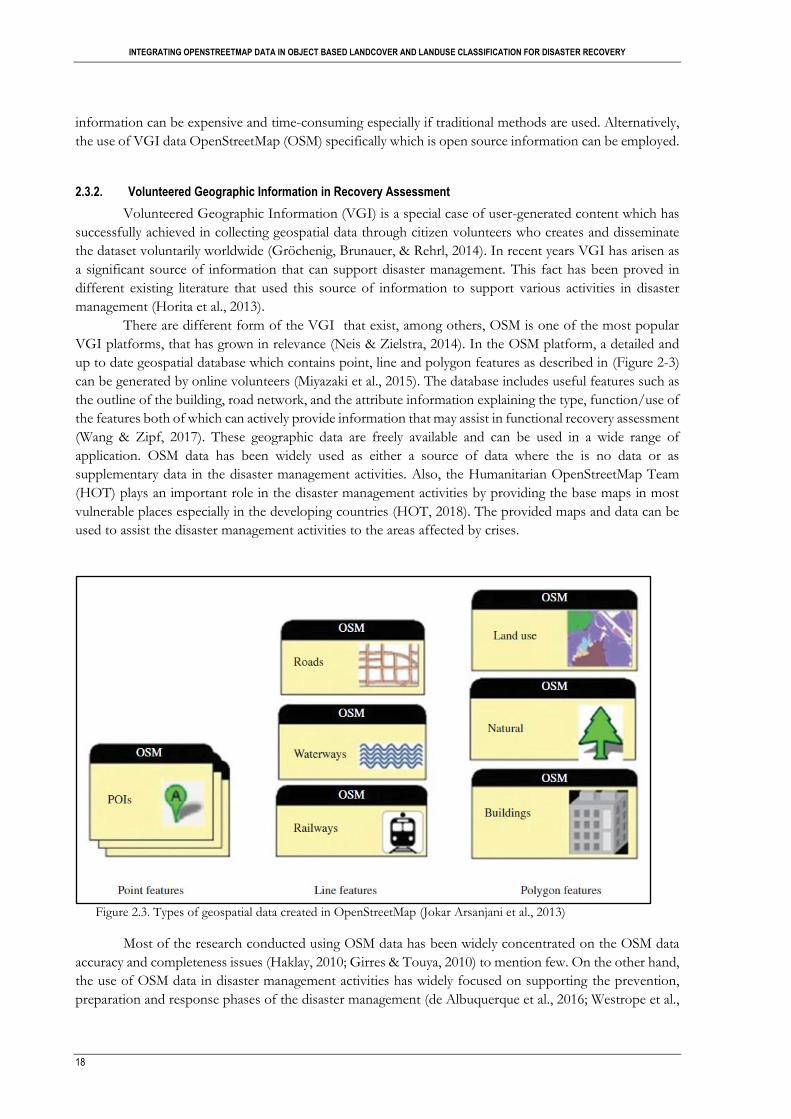
up to date geospatial database which contains point, line and polygon features as described in (Figure 2-3)
can be generated by online volunteers (Miyazaki et al., 2015). The database includes useful features such as
the outline of the building, road network, and the attribute information explaining the type, function/use of
the features both of which can actively provide information that may assist in functional recovery assessment
(Wang & Zipf, 2017). These geographic data are freely available and can be used in a wide range of
application. OSM data has been widely used as either a source of data where the is no data or as
supplementary data in the disaster management activities. Also, the Humanitarian OpenStreetMap Team
(HOT) plays an important role in the disaster management activities by providing the base maps in most
vulnerable places especially in the developing countries (HOT, 2018). The provided maps and data can be
used to assist the disaster management activities to the areas affected by crises.
Figure 2.3. Types of geospatial data created in OpenStreetMap (Jokar Arsanjani et al., 2013)
Most of the research conducted using OSM data has been widely concentrated on the OSM data
accuracy and completeness issues (Haklay, 2010; Girres & Touya, 2010) to mention few. On the other hand,
the use of OSM data in disaster management activities has widely focused on supporting the prevention,
preparation and response phases of the disaster management (de Albuquerque et al., 2016; Westrope et al.,

INTEGRATING OPENSTREETMAP DATA IN OBJECT BASED LANDCOVER AND LANDUSE CLASSIFICATION FOR DISASTER RECOVERY
19
2014; Horita et al., 2013). However, the use of OSM information in the recovery phase has been receiving
less attention which brings a gap of knowledge in this field.
The existing study on recovery has primarily focused on the economic aspect of recovery using
other sources of VGI information. For instance, Yan et al., (2017) use the geotagged social media data as
one of the forms of VGI to assess and monitor post-disaster recovery in tourist destinations. However, this
was the aspect of social/economic recovery, other aspects of recovery such as the built up/natural
environment which has the component of physical and functional recovery have been receiving less
attention.
In this study, the recovery assessment process will be evaluated based on the changes in the LC and
LU. The analysis will be conducted by performing the classification of multi-temporal images to obtain
changes over time. LC can be derived directly from the remote sensing images, but LU needs more
information on the use of the cover to be well classified, and this is where the OSM information will play a
significant role in this study. Some researchers have adopted the use of OSM data as either the only source
of information or supplementary data in supporting land use/cover mapping in urban planning. For
example, Jokar Arsanjani et al., (2013) utilized OSM information as a substitute source of data together with
satellite images in mapping land use pattern of an urban landscape instead of gathering training sites through
the direct visit of the area. An automated approach with decision rules and spatial analysis was used to
convert OSM features into LC and LU maps in European areas (Fonte et al., 2016). The automated approach
was adopted due to the reason of data quality which has been on top of the discussion in most of the OSM
projects.
According to Haklay et al., (2010); Girres & Touya, (2010) and Fonte, Antoniou, & Bastin, (2017)
it has been recognized that one of the problems when working with the OSM data set is the data quality.
Different researchers have established several ways of assessing the quality of the OSM dataset. The use of
geometric and semantic accuracy was one among the criteria used by Haklay et al., (2010) to assess the
quality of OSM data. Girres & Touya, (2010) used a set of six criteria to asses the quality of OSM dataset in
French. The review study conducted by Fonte et al., (2017), reveals the indicators that can be used in the
assessment of the OSM data quality which included; positional accuracy, thematic accuracy, completeness,
temporal quality, logical consistency, and usability. In the recovery assessment the position, thematic,
completeness and temporally accuracy of OSM data are important as an accurate determination of changes
depends mainly on these criteria. OSM dataset contains the historical feature which can be used to reveal
the temporal information over time, this information requires high temporal accuracy meaning the quality
of attribute and frequently update (Fonte et al., 2017). A detailed discussion of the indicators used in the
assessment of OSM quality and its application can be found in Fonte et al., (2017).
Generally, the mentioned literature about the OSM data quality was using reliable reference dataset.
Also, the studies cited above were conducted in the developed areas where the availability of dataset and
completeness seems not to be problematic. However, it is a bit challenging to use this valuable information
in developing countries (Latif et al., 2011). Since the accurate assessment of recovery depends on the precise
determination of pre-disaster and post-disaster event state, in some areas, OSM data in the past tended not
to exist. For this reason, it is difficult to relate to the pre-disaster state. However, the dataset available can
be of value in the assessment of recovery based on the changes in LC and LU.
2.4. Land Cover and Land Use Change Analysis and Existing Literature
The increasing availability of the VHR image has created more attention to the use of the Object-based
image analysis (OBIA) procedures for LC and LU change analysis. OBIA approach is based on the analysis
of objects rather than individual pixels. The use of objects allows easy integration of information which
helps in object identification. The information used can be categorized into spectral, shape, and
neighborhood characteristics. The spectral characteristics involve the mean and standard deviation of a
specific spectral band; shape variable includes the size, perimeter, and compactness of an object and

INTEGRATING OPENSTREETMAP DATA IN OBJECT BASED LANDCOVER AND LANDUSE CLASSIFICATION FOR DISASTER RECOVERY
20
neighborhood variable involve mean difference of an object compared to the other objects (Martha et al.,
2011). In OBIA procedure it is possible to integrate different datasets from different sources such as vector
data, DEM, LIDAR, and point clouds in the analysis. These capabilities are difficult to be performed based
on pixel as the relationship between pixel size and dimension of the objects on the earth’s surface is entirely
different (Blaschke, 2010; Zhu et al., 2016).
With OBIA, the neighboring pixels with similar attribute values based on shape, color, and size are used
to sub-divides an image into non-overlapping units through the process called segmentation (Veljanovski et
al., 2011). Segmentation is a first building block of the OBIA, as the result of the image analysis depends on
the accuracy of segmentation. One among the reason for grouping pixels into image segments is to
overcome the effect of salt and paper which can result in uncertainties especially when extracting
information from RS images. However, this depends on the spectral and spatial resolution of the dataset
used (Blaschke, 2010b). The segmentation process can be performed in different environments such as in
eCognition, ArcMap, QGIS, R Studio and Python. According to Veljanovski et al., (2011) eCognition
software is one of the powerful software that could be used to perform the quality object-based analysis of
remote sensing data. With this software incorporation of different spectral/spatial, contextual and other
additional information can be used in the image analysis for successful analysis.
Several studies have been conducted to investigate the relevance of OBIA in the content of urban RS
applications (Rejaur Rahman & Saha, 2008; Ma et al., 2017; Marangoz, 2018). LC and LU mapping have
been a significant theme in RS applications. Change detection based on RS data is one among the
applications that have grown in relevance due to the increased availability of high-resolution images (Joyce
et al., 2009). This development has made the disaster recovery assessment possible through the analysis of
the time series imagery to determine if any changes are occurring.
The use of the pixel-based and object-based approach has been applied in RS change detection to
determine the changes over time. Both methods tend to find the changes based on comparing the pixels
and objects/image segments on an image respectively. The traditional pixel-based change detection
approach is mostly focused on the use of spectral information, and more recently, the use of textual
information has been incorporated to detect the changes on the image (Gupta & Bhadauria, 2014). However,
with the increase of high spatial resolution pixel-based approach becomes less effective as the association
among the size of the pixel and measurement of the detected objects on the ground has altered significantly
(Veljanovski et al., 2011). In this study, the analysis of recovery assessment is to be performed through
evaluating the changes in LCLU over time in a complex urban and rural environment. In the study of
Goodin, Anibas, & Bezymennyi, (2015b) it is observed that with the pixel-based approach the analysis of
LC works better as compared to LU which requires additional information to use in extracting image
features. Most researchers have claimed that OBIA is a suitable approach for overcoming the
aforementioned problem (Goodin et al., 2015b)
Various methods namely supervised and unsupervised has been adopted by researchers in object-
based image classification in a wide range of application. Supervised classification approach is the most used
method in the classification of the LC and LU analysis (Ma et al., 2017). According to Ali et al., (2015) there
is a change in the image analysis processing approach due to development of machine learning method in
the supervised classification procedure that can potentially be applied in different types of RS data. The use
of this machine learning approach has proved to perform well with the object based image analysis especially
in differentiating different segments and are capable in handling different learning task with high-resolution
images (Kuffer et al., 2016a).
There are several machine learning classifiers in eCognition software. The most used classifier
includes; Random Forest (RF), Random Tree (RT), and Support Vector Machine (SVM) (Trimble Germany
GmbH, 2016). Most of these algorithms need many training datasets. However, they are flexible and can be
applied in any learning task for example image classification (Ali et al., 2015). In the study of Mountrakis,
Im, & Ogole, (2011) SVM classifier is seen as a potential learning approach appealing in the RS field due to

INTEGRATING OPENSTREETMAP DATA IN OBJECT BASED LANDCOVER AND LANDUSE CLASSIFICATION FOR DISASTER RECOVERY
21
the ability to perform learning tasks even with limited training samples. However, proper attention should
be kept as this learning approach is affected by parameter assignment matters that can expressively affect
the obtained results (Mountrakis et al., 2011). Apart from using the machine learning approach, other factors
contribute to the accuracy of the obtained results among others includes the selection of the features used
in the description of the classification task and the data type used to perform the analysis (Gupta &
Bhadauria, 2014).

INTEGRATING OPENSTREETMAP DATA IN OBJECT BASED LANDCOVER AND LANDUSE CLASSIFICATION FOR DISASTER RECOVERY
22
3. STUDY AREA AND DATA
This chapter describes the case study area of this research, and it presents an overview of the
typhoon Haiyan disaster and its impact. Also, it concludes with an overview of the dataset used in this study.
3.1. Description of Study Area
The study area of this research is in Tacloban the Philippines, located at 110 15’-110 12’ N and 1240
59’- 1250 17’ E. Tacloban city has an area of 201.7 km2 and has approximately 243,000 inhabitants. Tacloban
is a highly urbanized city in the Philippines, which is bound by mountains in the north and the west, but
also in the east and south is surrounded by water leading to Leyte Gulf and Pacific Ocean (Pia Ranada,
2013). The economy of Tacloban city is focused on the trade and services which provided around 54% of
its annual tax revenues in 2013 followed by the industry sector activities that accounted 26% tax revenue
(Paragas et al., 2016). The location of Tacloban city and its transportation infrastructures such as ports and
airports make the city as the net importer of food to different areas in the country. The city was profoundly
impacted by super Typhoon Haiyan on November 8, 2013, that resulted in massive damages and losses. A
large number of losses took place in this city due to a maximum inundation height of 7m that was detected
in the area ( Takagi et al., 2017). The number of damage to houses in Tacloban city itself was reported to be
40,192 with 28734 totally damaged and 17,643 partially damaged (Figure 3-1) also there were 2,669 fatalities
(Paragas et al., 2016). The airport in Tacloban city was severely damaged affecting business and tourism
activities while major roads were blocked by trees and were impassable (GCSE, 2014). Also, the typhoon
affected the fishing communities by destroying the boats and other equipment and most of the trees in the
area around the city were uprooted (GCSE, 2014).
Consequently, a wide range of changes has occurred through short, medium and long-term
recovery. The changes due to recovery processes influence the changes to the LC and LU. For instance,
there were changes due to new construction and reconstruction of public buildings and infrastructures,
changes in the trading and agriculture sectors as well as changes in tourism and industrial development
(GFDRR, 2014). Thus, all the above mentioned making this area suitable to test the potential of using the
OBIA method for LCLU changes to understand both physical and functional post-disaster recovery. Figure
3-2 shows the map that describes the path of typhoon Haiyan and the location of the study area which is a
subsection of the Tacloban area.
Figure 3.1. Devastated houses in the city of Tacloban (right), and debris lines in the street of Tacloban (left) after typhoon Haiyan

INTEGRATING OPENSTREETMAP DATA IN OBJECT BASED LANDCOVER AND LANDUSE CLASSIFICATION FOR DISASTER RECOVERY
23
Figure 3.2. Track of Typhoon Haiyan in the Philippines showing one of the affected province Leyte (left), and the location of the study area in Tacloban (right)
3.2. Descprition of Dataset
The dataset for this study involves 3 Worldview2 (WV2) images with eight multispectral bands
acquired at a different time (before, shortly after and 4 years after the occurrence of Haiyan). Multispectral
images have a resolution of 2-meter while the panchromatic images have a resolution of 0.5-meter. The
WV2 bands includes coastal blue (400-450nm), blue (450-510nm), green (510-580nm), yellow (585-625nm),
red (630-690), red-edge (705-745), NIR1 (770-895) and NIR2 (860-1040) (DigitalGlobe, 2010). The
selection of these images highly depended on the acquisition time, cloud-free scene and the coverage of the
study area. Consideration of the mentioned factors while selecting the images was important since to
perform the recovery assessment studies relies on the information determined at the situation before, during
and after the disaster event.
In addition, OSM data that contains building footprints, as well as other point and line features of
the study area obtained from the OSM platform, will be used in this study. Moreover, the LCLU
classification maps of the same study area and the accuracy assessment results obtained by Sheykhmousa,
(2018) using the pixel-based approach will be used in this study for the comparative analysis of the results
as this study will be using the object-based approach for the analysis. Below is the list of the dataset used in
this study and its description related to the selected study area.
INTEGRATING OPENSTREETMAP DATA IN OBJECT BASED LANDCOVER AND LANDUSE CLASSIFICATION FOR DISASTER RECOVERY
24
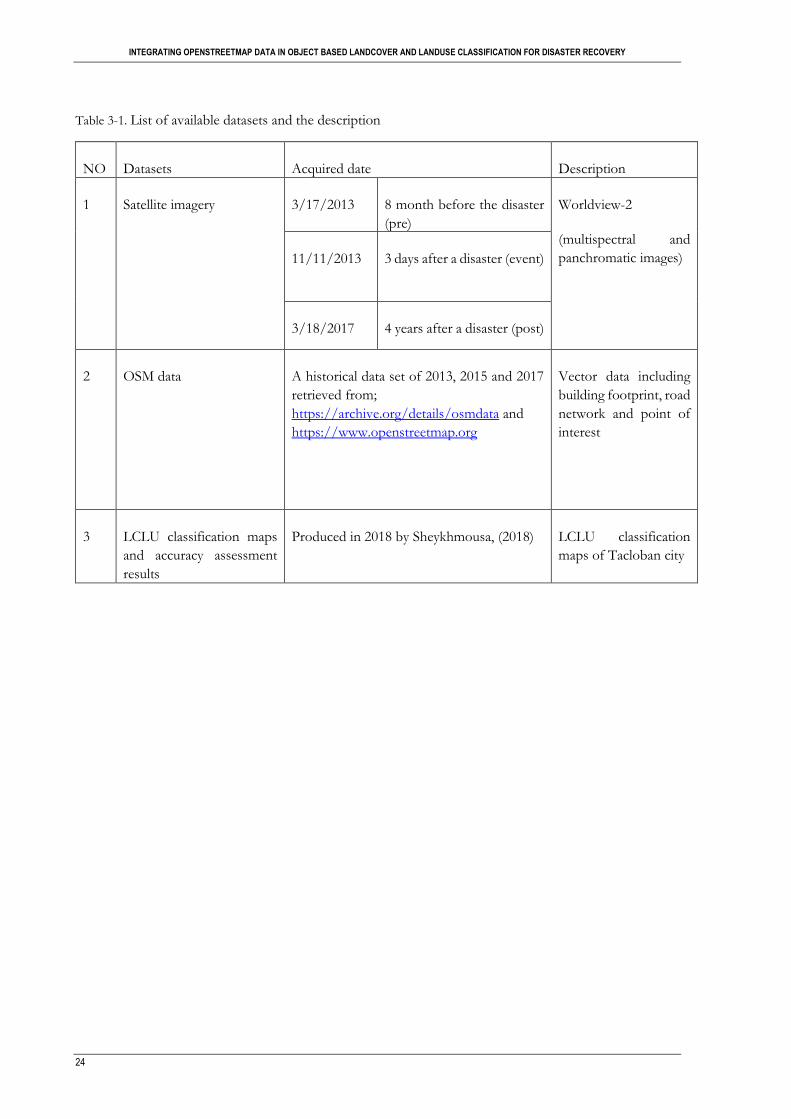
Table 3-1. List of available datasets and the description
NO Datasets Acquired date Description
1 Satellite imagery 3/17/2013 8 month before the disaster
(pre)
Worldview-2
(multispectral and
panchromatic images) 11/11/2013
3 days after a disaster (event)
3/18/2017 4 years after a disaster (post)
2 OSM data A historical data set of 2013, 2015 and 2017
retrieved from;
https://archive.org/details/osmdata and
https://www.openstreetmap.org
Vector data including
building footprint, road
network and point of
interest
3 LCLU classification maps
and accuracy assessment
results
Produced in 2018 by Sheykhmousa, (2018) LCLU classification
maps of Tacloban city

INTEGRATING OPENSTREETMAP DATA IN OBJECT BASED LANDCOVER AND LANDUSE CLASSIFICATION FOR DISASTER RECOVERY
25
4. METHODOLOGY
This chapter illustrates the methods used in the LCLU classification in disaster-related multitemporal image
analysis for improving understanding of the post-disaster recovery. The first section demonstrates the
segmentation procedure which is the first building block of the OBIA. Second section describes the image
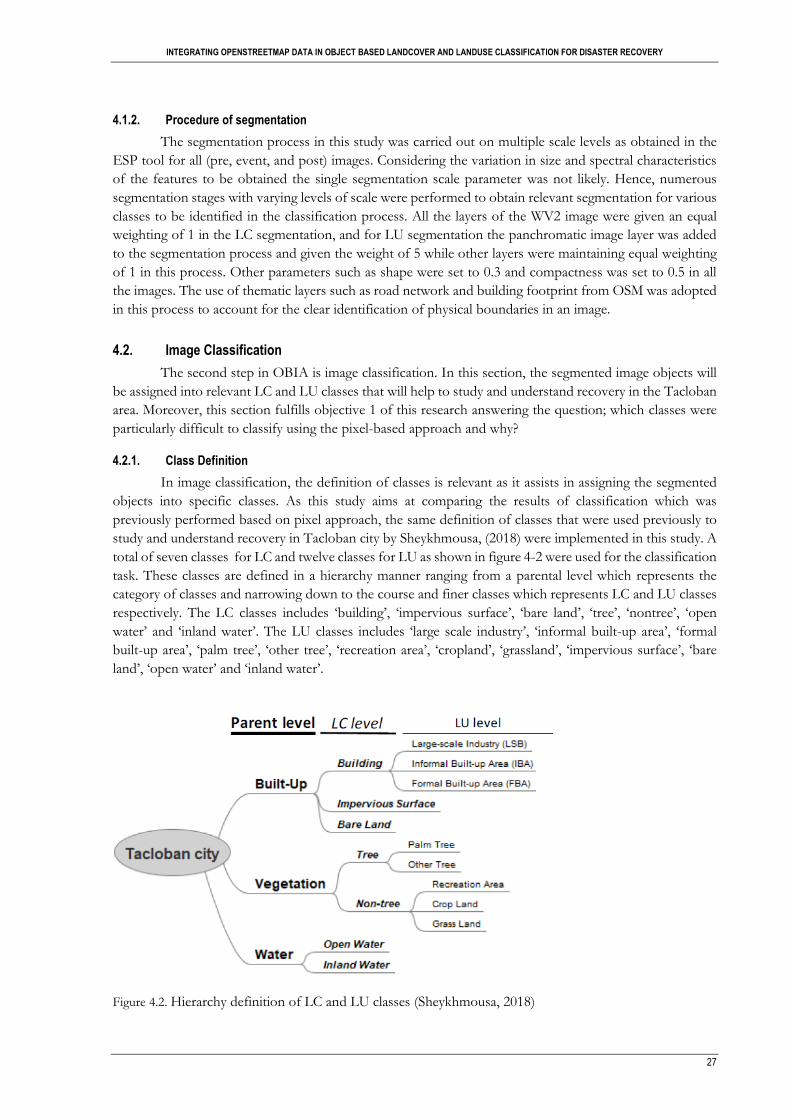
classification process, in this section the class definition which is based on the deep literature review of the
previous work performed by using the pixel-based approach is described and answers the first question of
this study: which classes were particularly difficult to classify using the pixel-based approach performed in
previous LCLU recovery research in Tacloban city and why?. Then the LCLU classification procedure is
illustrated together with the sample generation approach. The third section describes the analysis of OSM
data in the LCLU classification. Lastly, the fourth section demonstrates the approach used in the comparison
of the performance of pixel-based and object-based methods for LCLU classification. The flow chart of the
proposed method is presented in figure 4-1.
Figure 4.1. Flowchart of the proposed research.

INTEGRATING OPENSTREETMAP DATA IN OBJECT BASED LANDCOVER AND LANDUSE CLASSIFICATION FOR DISASTER RECOVERY
26
4.1. Image Segmentation
Image segmentation is the first step in the OBIA. This process identifies homogeneous areas
in the image and groups them into specific objects called segments (Blaschke, 2010b). There are different
segmentation algorithms used in OBIA, among others, Multiresolution Segmentation (MRS) technique is
the most popular region growing segmentation algorithm and powerful when dealing with VHR images
(Drǎguţ et al., 2014). The region growing method generates the image objects based on pairwise region
technique starting with a one-pixel object (Rejaur Rahman & Saha, 2008).
In this study, MRS algorithm was used for image segmentation in eCognition. In MRS the
meaningful segments are created in an iterative process based on three key parameters namely, shape,
compactness and scale. The scale is considered as the most critical factor in MRS as it controls the size of
the objects to be obtained (Blaschke, 2010a). Advanced methods for automation that leads to the extraction
of high quality and meaningful features from VHR images have been done (Drǎguţ, Tiede, & Levick, 2010).
This technique has been used in wide range of application such as automatic change detection studies,
geomorphological process, extraction of information from image due to its ability to produce high segments
at different scales (Martha et al., 2011). For this reason, the Estimation of the Scale Parameter (ESP) tool
was used in this study for the automatic generation of various scale levels for segmenting the images.
4.1.1. Estimation of Scale Parameter
The estimation of the scale parameter tool works in a bottom-up manner for the automatic generation
of image objects at multiple scale levels corresponding to the degree of homogeneity. For each object level
obtained in the process, the local variance for each scale is calculated to evaluate the level at which image
can be segmented in a meaningful manner (Drǎguţ et al., 2010). The variation in the heterogeneity of
segmented objects is discovered by plotting local variance against the corresponding scale. Besides, the
plateau objective function that uses the peak values close to the maximum value of the objective function
to determine the relevant scale parameter, is an alternative approach that can be used in the identification
of relevant scale parameters (Martha et al., 2011). In this study, the ESP tool was used to estimate the optimal
scale parameter at which the objects were segmented. The ruleset applied for ESP tool was loaded in
eCognition 9.3.2 to obtain the relevant scale levels of pre-disaster, event and post-disaster event images. The
process implemented is summarized as follows:
▪ The selection of the step-size scale levels which defines the increment of the scale parameter for
the stepwise segmentation was performed, and the value was set to 1.
▪ Then the minimum scale at which the processing starts was chosen and the starting scale parameter
was set to 10. The decision for this choice was made based on the smallest feature that is to be
mapped from an image.
▪ The use of hierarchy was considered in the processing to allow the hierarchy generation of scale
levels whereby high level is based on the segmentation results at a lower level. By keeping the shape
constant and varying the compactness and vice versa the value of 0.3 and 0.5 were obtained and
used for the settings of shape and compactness respectively.
▪ Lastly, the graph was plotted, and 70 scale levels were automatically processed, the peak values of
rate of change curve were obtained, and the scale levels corresponding to these peak values were
considered as the relevant scale parameters that will be implemented in the MRS process to obtain
image segments.
INTEGRATING OPENSTREETMAP DATA IN OBJECT BASED LANDCOVER AND LANDUSE CLASSIFICATION FOR DISASTER RECOVERY
27
4.1.2. Procedure of segmentation
The segmentation process in this study was carried out on multiple scale levels as obtained in the
ESP tool for all (pre, event, and post) images. Considering the variation in size and spectral characteristics
of the features to be obtained the single segmentation scale parameter was not likely. Hence, numerous
segmentation stages with varying levels of scale were performed to obtain relevant segmentation for various
classes to be identified in the classification process. All the layers of the WV2 image were given an equal
weighting of 1 in the LC segmentation, and for LU segmentation the panchromatic image layer was added
to the segmentation process and given the weight of 5 while other layers were maintaining equal weighting
of 1 in this process. Other parameters such as shape were set to 0.3 and compactness was set to 0.5 in all
the images. The use of thematic layers such as road network and building footprint from OSM was adopted
in this process to account for the clear identification of physical boundaries in an image.
4.2. Image Classification
The second step in OBIA is image classification. In this section, the segmented image objects will
be assigned into relevant LC and LU classes that will help to study and understand recovery in the Tacloban
area. Moreover, this section fulfills objective 1 of this research answering the question; which classes were
particularly difficult to classify using the pixel-based approach and why?
4.2.1. Class Definition
In image classification, the definition of classes is relevant as it assists in assigning the segmented
objects into specific classes. As this study aims at comparing the results of classification which was
previously performed based on pixel approach, the same definition of classes that were used previously to
study and understand recovery in Tacloban city by Sheykhmousa, (2018) were implemented in this study. A
total of seven classes for LC and twelve classes for LU as shown in figure 4-2 were used for the classification
task. These classes are defined in a hierarchy manner ranging from a parental level which represents the
category of classes and narrowing down to the course and finer classes which represents LC and LU classes
respectively. The LC classes includes ‘building’, ‘impervious surface’, ‘bare land’, ‘tree’, ‘nontree’, ‘open
water’ and ‘inland water’. The LU classes includes ‘large scale industry’, ‘informal built-up area’, ‘formal
built-up area’, ‘palm tree’, ‘other tree’, ‘recreation area’, ‘cropland’, ‘grassland’, ‘impervious surface’, ‘bare
land’, ‘open water’ and ‘inland water’.
Figure 4.2. Hierarchy definition of LC and LU classes (Sheykhmousa, 2018)

INTEGRATING OPENSTREETMAP DATA IN OBJECT BASED LANDCOVER AND LANDUSE CLASSIFICATION FOR DISASTER RECOVERY
28
In addition, for the situation right after the typhoon Haiyan, it is essential to consider the definition
of damage classes. That is because the classes for the disaster situation are no longer regarded as normal due
to the destruction caused by the typhoon. The same definition of damage classes as studied in the previous
study based on a pixel-based approach in Tacloban were adopted in this study. A total of 4 damage classes
namely ‘rubble,’ ‘debris,’ ‘inundated land’ and ‘flattened tree’ that represents damage related to buildings,
trees and water bodies respectively will be used.
Concerning the damage related to buildings, two damage classes namely ‘rubble’ and ‘debris’ were
assigned. The class ‘rubble’ is mainly related to the damage patterns corresponding to structural or building
material while the class ‘debris’ is mainly related to damage patterns corresponding to a mix of wind and
water-borne material. In this study, these two damage classes were merged into one class ‘rubble’ because
with the 2-meter resolution of WV2 image differentiating the two both spatially and spectrally is very
difficult and challenging and can cause uncertainty in the classification task. The class ‘inundated land’
represents damage related to the rising of the body water and overflowing into the dry land and the class
‘flattened tree’ represents land covered by fallen or toppled tree branches or uprooted trees. A detailed
description of the LCLU classes and they are important in studying recovery in Tacloban city can be found
in Sheykhmousa, (2018).
In order to identify the classes that were difficult to be classified using the pixel-based approach, an
in-depth literature review of the recovery work performed in Tacloban city using the pixel-based approach
by Sheykhmousa, (2018) was carried out. It was observed that the built-up category and vegetation related
classes were having misclassification problem for both LC and LU classification, but the problem was worse
for the LU classification. Regarding the LC, the classes that were particularly having a problem include;
‘building,’ ‘impervious surface’ and ‘rubble.’ There was a confusion in distinguishing the class ‘building’ from
‘rubble’ and ‘building’ from ‘impervious surface’ which leads to the misclassification of these classes,
especially for an immediate post-disaster situation. The reason for such misclassification was rooted by the
spectral similarity of the classes and hence it was difficult to be extracted by using the spectral and textural
information only as per pixel based approach works (Gupta & Bhadauria, 2014). In addition, with the pixel-
based approach, it is difficult to overcome the “salt and pepper” effect which can result in uncertainties
especially if the spectral and spatial resolution of the used image is not good, this attributed the
misclassification found (Blaschke, 2010c).
Moreover, the class rubble was massively misclassified in both the LC and LU classification, and
this had the consequences in overestimating the damage in an area. Objectively, the amount of damage was
much less in the affected area, the classifier confused a lot of stuff in the street which was related to blown
up and washed up material due to the wind and heavy rainfall that can be quite easily removed, but all these
were regarded as damage. This was a challenge according to the resolution of the WV2 image used to
distinguish the real rubble or debris with other materials on the affected area.
For the LU classification, the confusion of the built-up classes was worse as compared to the LC.
Regarding the built-up classes, the class ‘Large Scale Industry’ (LSI), ‘Formal Built Up Area’ (FBA) and
‘Informal Built Up Area’ (IBA) were having the misclassification problem. This was attributed by the mixed
pixel problem influenced by the high spectral similarity of the buildings which created complexity in the
classification process. Furthermore, there was misclassification of the vegetation classes due to the
confusion between the class ‘palm tree,’ and ‘other tree’ and another confusion was within the classes ‘grass’,
‘cropland’ and ‘recreation area’. The reason for this misclassification is rooted by the high spectral similarity
of these classes with the low spectral and spatial resolution of WV2 for such a discrimination.
All the mentioned classes made the image classification complex as they could not be distinguished
relying on spectral and textural information only. For this reason, additional information is required to
resolve the ambiguity of the mentioned classes to improve the LCLU classification mapping in Tacloban
city as will be explained in the following sections.
INTEGRATING OPENSTREETMAP DATA IN OBJECT BASED LANDCOVER AND LANDUSE CLASSIFICATION FOR DISASTER RECOVERY
29
4.2.2. Procedure for Land Cover and Land Use Classification
The process of assigning image objects according to specific cover and use as per class definition
was followed. There are different supervised algorithms that are used for the classification of VHR image
in eCognition, among others Random Forest (RF) and Support Vector Machine (SVM) classifier are very
popular and have been used for LC and LU classification in urban areas using remote sensing images (Ma
et al., 2017; Zhang et al., 2017; Fallatah et al., 2018)
An SVM classifier is a supervised machine learning approach that operates by following a structural
risk minimization. It is discriminative classifier defined by separating hyperplane that separates the dataset
into a discrete predefined number of classes based on the training datasets (Mountrakis et al., 2011). The
classifier operates in a binary system by fitting an optimal separating hyperplane of training samples in a
multi-dimensional feature. The distance between the closest training and the hyperplane is maximized by
the classifier (Chich Hsu, Chich-Chung Chang, 2016). For classes that are linearly nonseparable, a slack
variable is introduced, the regularization parameter C is introduced to overcome the number of
misclassification error. However for the nonlinear situation, a kernel function is introduced, and among the
most used kernel in RS studies radial basis functions are known (Vapnik, 1999). The accuracy of SVM based
on radial basis function kernel relies on two parameters C and gamma. Parameter C controls the magnitude
related to training data and gamma controls the width of the kernel.
Since the objective of this study is to compare the classification results performed by using SVM
based on pixels, and due to high ability of this classifier to handle small training dataset and achieve high
accuracy classification results (Mountrakis et al., 2011) the SVM classifier was used for the classification of
LC and LU in this study. A grid search using cross-validation approach as recommended by (Hsu et al.,
2016) to be the most effective method to optimize the radial basis function parameter was used to determine
the optimal parameter for C and gamma.
4.2.3. Features Employed in LCLU Classification
In this study, the object features in OBIA were used for the class description in the LC and LU
classification process. The morphological, texture, class-related features and spectral indices were used to
help the classification task (Table 4-1). The morphological features help to describe the object class based
mostly on their shape; for example, the buildings which are most rectangular in shape can be discriminated
from the road which are elongated features based on the shape (Salehi et al., 2012). The class-related features
help to describe the object class in relation to neighbor objects, sub-objects, and super objects.
Moreover, the contextual features help to describe the image objects based on the information
derived from the digital number values of the neighborhood pixels. This information is calculated based on
the grey level variations in the image. The obtained information helps in the classification task by providing
additional information about the image properties (Mboga et al., 2017). Texture features based on the grey-
level co-occurrence matrix (GLCM) have been proved to be useful in extracting relevant information from
VHR imagery and improve classification accuracy in urban settings (Mboga et al., 2017; Lan & Liu, 2018).
There are eight types of GLM features that can be used to assist image classification as mentioned
in Haralick, Shanmugam, & Dinstein, (1973) study. However, according to Hall-Beyer, (2017), not all
features are helpful in the classification process due to the reason that some of these features are highly
associated and hence can result into the redundancy of features. In this study, the calculation of GLCM
features using the windows sizes (3*3, 5*5) was performed and used to assist the classification task in
eCognition.

INTEGRATING OPENSTREETMAP DATA IN OBJECT BASED LANDCOVER AND LANDUSE CLASSIFICATION FOR DISASTER RECOVERY
30
Table 4-1. List of objects features
Feature category Object features
Shape and geometry Rectangular fit, shape index, length/width, compactness, density, asymmetry
Spectral Mean, brightness, standard deviation, NDWI (Green - NIR 2 / Green + NIR
2), NDVI (NIR 1 -Red / NIR1 + Red) NDVI2 (NIR 2 – Red / NIR 2 + Red)
BAI (Blue - NIR 1 / Blue + NIR 2)
Texture GLCM Contrast, GLCM Variance, GLCM Homogeneity, GLCM Mean,
GLCM Dissimilarity, GLCM Entropy, GLCM Angular second moment,
GLCM correlation.
4.2.4. Sample Generation
In the absence of reference data (obtained direct from the field), an approach is developed that
combines OSM data and other multi-source data such as Google Earth Pro, Google Street View and a
panchromatic band of WV2 images for the sample generation. For the case of LC, the reference data was
generated by visual interpretation using Google Earth Pro, Google street view and panchromatic bands of
the WV2 image. On the other hand, the LU samples were generated based mostly on the information
obtained from the OSM data. With the OSM data, training sample labels for the LU classification were
obtained as it contained rich information of the ground object classes. The OSM data provided information
on the line features (road network, railway, river/canal) and polygon features (building footprints, farmland,
park, forest and water bodies). However, some errors occurred due to the problem of OSM data accuracy
and quality. Therefore, the samples generated from the OSM data were refined by using the size of the
calculated buildings (for the building classes category) but also by visual comparison on the other multi-
source data.
4.2.5. Experiment Setup
To achieve the classification of the LCLU analysis using the OBIA approach and improve the
classification accuracy, the following procedures were implemented in the eCognition software and are
summarized as follows:
.
• The samples were imported in eCognition, then converted to sample objects that represent the class
of interest using ‘assign class by thematic layer’ aligorithm. This aligorithm is used to assign image
objects to a class based on the relation to a thematic layer considering different image objects levels.
• Then the sample objects were converted to sample statistics and a *csv file that stores a feature
information was created; in this process, the features that the supervised classification model will
use to calculate the class description were selected.
• Then the process of removing the initial classification was followed since the sample information
is now stored in a sample statistics file.
• Lastly, the process of training and applying the supervised classification model (SVM classifier) was
done based on sample statistics. In this stage, the feature normalization was implemented as it
allows the normal distribution characteristic of each feature and to make training and classification
faster (Chich Hsu, Chich-Chung Chang, 2016). Also, the process assists to avoid domination of
high numerical value from dominating the low numerical values. The classification process was
done for both LC and LU.
4.2.6. Accuracy Assessment
Accuracy assessment is a measure that provides the quality of the classified map. The process is
performed by calculating the confusion matrix which provides different accuracy parameter to judge the

INTEGRATING OPENSTREETMAP DATA IN OBJECT BASED LANDCOVER AND LANDUSE CLASSIFICATION FOR DISASTER RECOVERY
31
classification results. The accuracy parameters which includes overall accuracy, kappa statistics producer and
consumer accuracy can be used to evaluate the results of classification (Kerle, Janssen, & Bakker, 2004).
In this study accuracy assessment was performed by using a sampling method, the dataset was separated
into two parts, one for training the classifier (70% of the samples) and one part (unseen) for validating the
accuracy of the classifier (30% of the samples) using stratified random sampling method. All classes of LC
and LU were considered for accuracy assessment, and the process was performed in eCognition.
4.3. Analysis of the OSM
The OSM historical dataset of the study area for the year 2013, 2015 and 2017 was download
through https://archieve.org./details/osmdata and https://www.openstreetmap.org. Since the obtained
dataset was computationally intense to be extracted by using other software such as ArcGIS, in QGIS a
code created in python was used to extract the dataset covering the study area whereby polygon, point, and
line features were extracted.
The OSM dataset obtained was used in this study to supplement satellite imagery during the LCLU
classification process. In this case, the method was formulated that included different aspects of how
significance the dataset will add value in the process of LCLU classification by OBIA approach. The value
of OSM information was evaluated based on three criteria, the value of geometric and thematic information,
in the OBIA process and the value of historical information in the multi-temporal analysis. With these 3
criteria analyses was conducted to assess the potential value of OSM information in the LCLU classification
as explained below.
4.3.1. Analysis Based on the Geometrical Value of OSM Information
The geometrical information obtained from the OSM dataset such as building footprint and road
network was analyzed using a statistical approach. The analysis was conducted in ArcGIS software in all 3
images following the below-mentioned steps:
• Feature to polygon tool was used to convert the road network to a polygon to create boundaries of
different neighborhoods (units) within a study area.
• Then different defined neighborhoods were created based on the number of buildings available by
using the clipping tool.
• The calculation of the number of buildings available, the average size of the building structure, and
the density of the buildings were conducted in each neighborhood.
• Lastly, evaluation of the nature of the land use per each unit block was done by using the statistical
values obtained from the analysis.
In addition, geometric information was analyzed on how valuable can be used to assist in the OBIA
process. Delineating objects during the segmentation process might be challenging especially when dealing
with features like buildings that are close to each other. With geometric information such as building
footprint and roads network, the physical boundary of the buildings can be easily identified (Kuffer, Pfeffer,
Sliuzas, & Baud, 2016b). The OSM road networks obtained were buffered according to the adaptive radii
and used as a thematic layer in the segmentation process. Also, the building footprint with the area greater
than 200m2 was used as the thematic layer to orient the OBIA in the segmentation process in eCognition.
The process was done by using the 3 images (pre, event and post-disaster) following other settings required
in the segmentation process as already explained in section 4.1.2.
4.3.2. Analysis Based on the Thematic Value of OSM Information
The thematic information obtained from the historical OSM dataset was evaluated on how well this
detailed information can be used to assist in the LC and LU classification process. LC information can be
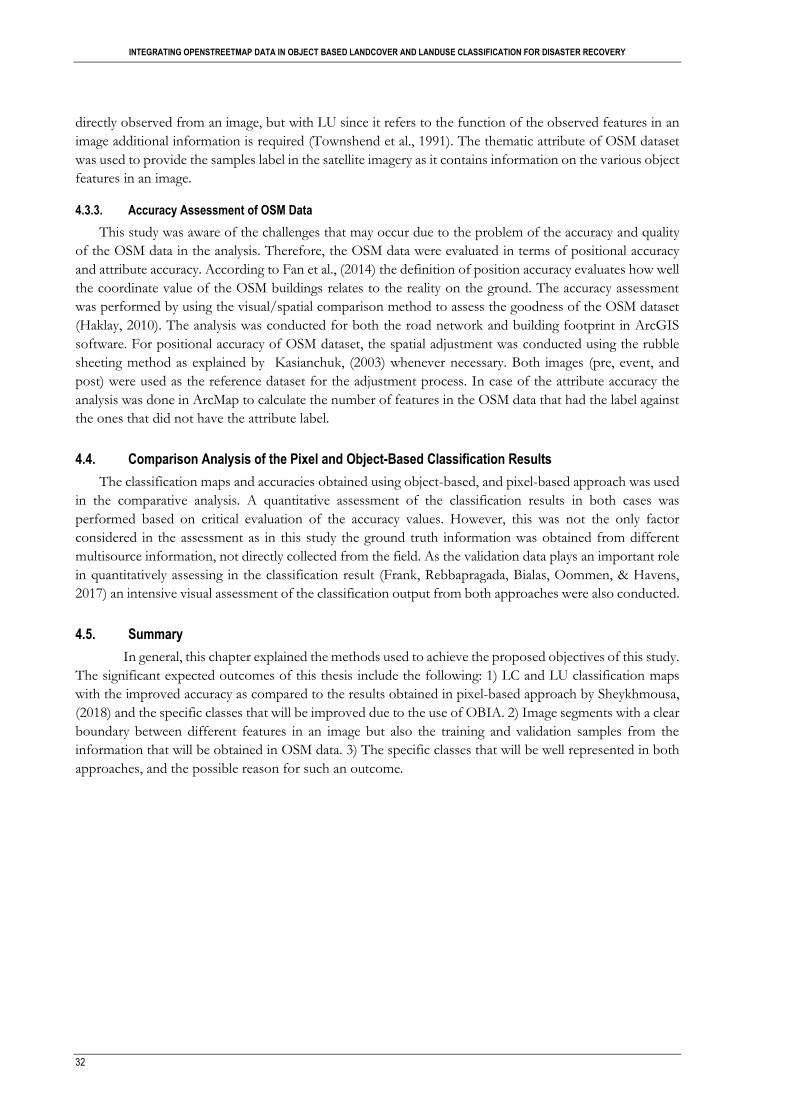
INTEGRATING OPENSTREETMAP DATA IN OBJECT BASED LANDCOVER AND LANDUSE CLASSIFICATION FOR DISASTER RECOVERY
32
directly observed from an image, but with LU since it refers to the function of the observed features in an
image additional information is required (Townshend et al., 1991). The thematic attribute of OSM dataset
was used to provide the samples label in the satellite imagery as it contains information on the various object
features in an image.
4.3.3. Accuracy Assessment of OSM Data
This study was aware of the challenges that may occur due to the problem of the accuracy and quality
of the OSM data in the analysis. Therefore, the OSM data were evaluated in terms of positional accuracy
and attribute accuracy. According to Fan et al., (2014) the definition of position accuracy evaluates how well
the coordinate value of the OSM buildings relates to the reality on the ground. The accuracy assessment
was performed by using the visual/spatial comparison method to assess the goodness of the OSM dataset
(Haklay, 2010). The analysis was conducted for both the road network and building footprint in ArcGIS
software. For positional accuracy of OSM dataset, the spatial adjustment was conducted using the rubble
sheeting method as explained by Kasianchuk, (2003) whenever necessary. Both images (pre, event, and
post) were used as the reference dataset for the adjustment process. In case of the attribute accuracy the
analysis was done in ArcMap to calculate the number of features in the OSM data that had the label against
the ones that did not have the attribute label.
4.4. Comparison Analysis of the Pixel and Object-Based Classification Results
The classification maps and accuracies obtained using object-based, and pixel-based approach was used
in the comparative analysis. A quantitative assessment of the classification results in both cases was
performed based on critical evaluation of the accuracy values. However, this was not the only factor
considered in the assessment as in this study the ground truth information was obtained from different
multisource information, not directly collected from the field. As the validation data plays an important role
in quantitatively assessing in the classification result (Frank, Rebbapragada, Bialas, Oommen, & Havens,
2017) an intensive visual assessment of the classification output from both approaches were also conducted.
4.5. Summary
In general, this chapter explained the methods used to achieve the proposed objectives of this study.
The significant expected outcomes of this thesis include the following: 1) LC and LU classification maps
with the improved accuracy as compared to the results obtained in pixel-based approach by Sheykhmousa,
(2018) and the specific classes that will be improved due to the use of OBIA. 2) Image segments with a clear
boundary between different features in an image but also the training and validation samples from the
information that will be obtained in OSM data. 3) The specific classes that will be well represented in both
approaches, and the possible reason for such an outcome.
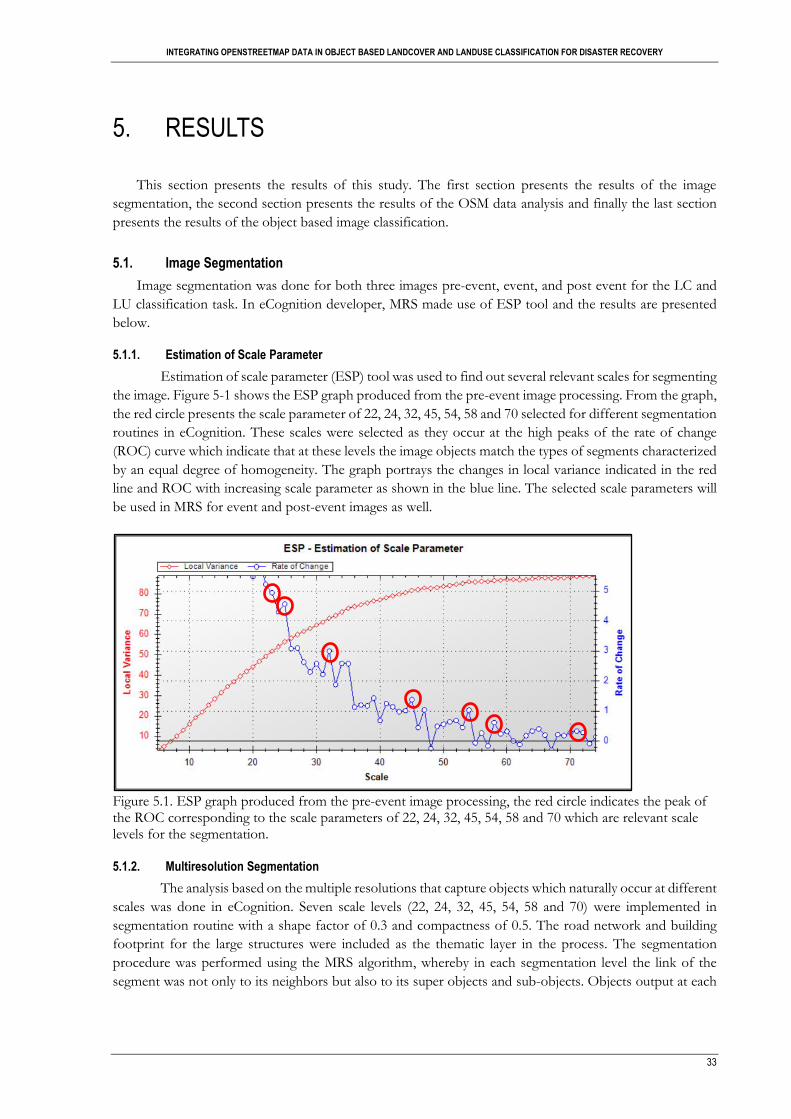
INTEGRATING OPENSTREETMAP DATA IN OBJECT BASED LANDCOVER AND LANDUSE CLASSIFICATION FOR DISASTER RECOVERY
33
5. RESULTS
This section presents the results of this study. The first section presents the results of the image
segmentation, the second section presents the results of the OSM data analysis and finally the last section
presents the results of the object based image classification.
5.1. Image Segmentation
Image segmentation was done for both three images pre-event, event, and post event for the LC and
LU classification task. In eCognition developer, MRS made use of ESP tool and the results are presented
below.
5.1.1. Estimation of Scale Parameter
Estimation of scale parameter (ESP) tool was used to find out several relevant scales for segmenting
the image. Figure 5-1 shows the ESP graph produced from the pre-event image processing. From the graph,
the red circle presents the scale parameter of 22, 24, 32, 45, 54, 58 and 70 selected for different segmentation
routines in eCognition. These scales were selected as they occur at the high peaks of the rate of change
(ROC) curve which indicate that at these levels the image objects match the types of segments characterized
by an equal degree of homogeneity. The graph portrays the changes in local variance indicated in the red
line and ROC with increasing scale parameter as shown in the blue line. The selected scale parameters will
be used in MRS for event and post-event images as well.
Figure 5.1. ESP graph produced from the pre-event image processing, the red circle indicates the peak of the ROC corresponding to the scale parameters of 22, 24, 32, 45, 54, 58 and 70 which are relevant scale levels for the segmentation.
5.1.2. Multiresolution Segmentation
The analysis based on the multiple resolutions that capture objects which naturally occur at different
scales was done in eCognition. Seven scale levels (22, 24, 32, 45, 54, 58 and 70) were implemented in
segmentation routine with a shape factor of 0.3 and compactness of 0.5. The road network and building
footprint for the large structures were included as the thematic layer in the process. The segmentation
procedure was performed using the MRS algorithm, whereby in each segmentation level the link of the
segment was not only to its neighbors but also to its super objects and sub-objects. Objects output at each
INTEGRATING OPENSTREETMAP DATA IN OBJECT BASED LANDCOVER AND LANDUSE CLASSIFICATION FOR DISASTER RECOVERY
34
scale level was visually examined and it was observed that the scale parameter of 24 and 54 were having
minor modifications in the structure of objects.
On the other hand, the scale parameter of 70 resulted mostly in over-segmentation of most image
objects when taking into consideration the classes of interest to be obtained. Therefore, the image objects
obtained at the scale levels of 22, 32, 45 and 58 were used in the classification analysis. For example, the
scale parameter of 22 was good for the classes that were small such as the small structured buildings and
patches of bare land. The scale parameter of 32 and 45 obtained image objects that capture road and
river/canal features and most of the medium size-structured building respectively. The scale parameter of
58 obtained the segments that presented most of the large structured building and the vegetation areas.
This study was aware that there is no perfect scale parameter for segmenting the image, there will be
always over segmentation and under-segmentation of the image objects at different scale levels. All small
objects or other problem related to the obtained segments were solved in the re-segmentation and
classification analysis.
5.2. Analysis of OSM Data
This section presents the results of the OSM analysis which was conducted to investigate the significant
value of including OSM information in the OBIA process as well as the value of using historical OSM data
during the LCLU classification. The obtained results answer the research objective 2 of this study and its
questions as presented below.
5.2.1. Assessing the Potential Value of OSM Geometrical Information
The geometric value of the OSM data is to give information on the objects that are on the ground
in terms of their size and density which determines the nature of the land use at a particular area. Figure 5-
2, shows the map of the nature of the land use in a different neighborhood of the study area, the map was
created from outcomes of the statistical analysis performed using the building footprint and road network
information. This information was difficult to be obtained using satellite imagery alone. Using the road
network, different units were created which presents the neighborhood in the study area. With building
footprint found in the created neighborhoods, statistical analysis was performed to identify the nature of
land use in the area. The selection of the nature of the land use was made based on the average size of the
structure, considering the building size, number of building and building density of each neighborhood. For
example, having a large number of buildings within a block this indicates that the area is squatter (slum) or
if the average size of the buildings is very large this indicates that the city block is commercial or residential
etc.
Table 5-1 shows the threshold values used in the assessment of the nature of the land use obtained
using the OSM information. The selection was done considering the average size of the structure in relation
to other factors as mentioned above. However, the results show that this approach was subjective as within
a unit they can be residential buildings as well as the commercial buildings. This was the limitation
encountered in this analysis since the approach was based on the calculated statistical information obtained
in each neighborhood, but not for the individual building in each unit. Generally, the statistical results
obtained helped in the analysis of LU classification.
Table 5-1. Classification threshold values used in the assessment of the nature of land use (‘X’=average size of the structure)
No The average size of the structure in (square meter) Class
1 0>X<=60 Slum
2 60>X<=120 Residential
3 X>120 Commercial

INTEGRATING OPENSTREETMAP DATA IN OBJECT BASED LANDCOVER AND LANDUSE CLASSIFICATION FOR DISASTER RECOVERY
35
Figure 5.2. A map showing the nature of land use in a different neighbourhood in the study area obtained using OSM information.
In addition, the geometrical value was tested to find out how the building footprints and road
network will assist in the OBIA process. The building footprint obtained did not perfectly represent the
building outlines in an image as explained earlier, but it was valuable as a tool to locate the buildings in the
segmentation process. The road network and building with large an area coverage of >200m2 were used to
assist in the segmentation process. The reason for choosing the building with the area greater than 200m2
was because for rubber sheeting adjustment, the building small than this size were still having the shifting
problem. Figure 5-3, shows that involving the OSM geometric information helps to clearly segment the
building and road by giving them more identified shapes and physical boundary. Segmentation without OSM
information resulted in poor shape and unclear physical boundary.
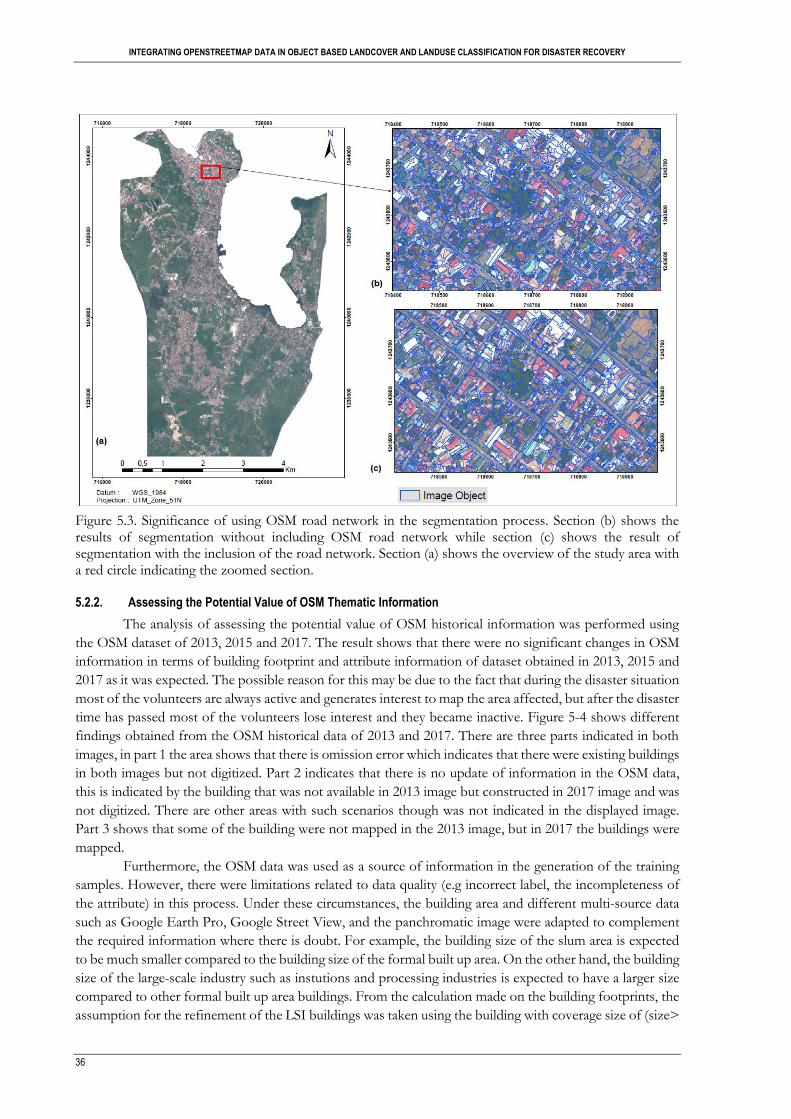
INTEGRATING OPENSTREETMAP DATA IN OBJECT BASED LANDCOVER AND LANDUSE CLASSIFICATION FOR DISASTER RECOVERY
36
Figure 5.3. Significance of using OSM road network in the segmentation process. Section (b) shows the results of segmentation without including OSM road network while section (c) shows the result of segmentation with the inclusion of the road network. Section (a) shows the overview of the study area with a red circle indicating the zoomed section.
5.2.2. Assessing the Potential Value of OSM Thematic Information
The analysis of assessing the potential value of OSM historical information was performed using
the OSM dataset of 2013, 2015 and 2017. The result shows that there were no significant changes in OSM
information in terms of building footprint and attribute information of dataset obtained in 2013, 2015 and
2017 as it was expected. The possible reason for this may be due to the fact that during the disaster situation
most of the volunteers are always active and generates interest to map the area affected, but after the disaster
time has passed most of the volunteers lose interest and they became inactive. Figure 5-4 shows different
findings obtained from the OSM historical data of 2013 and 2017. There are three parts indicated in both
images, in part 1 the area shows that there is omission error which indicates that there were existing buildings
in both images but not digitized. Part 2 indicates that there is no update of information in the OSM data,
this is indicated by the building that was not available in 2013 image but constructed in 2017 image and was
not digitized. There are other areas with such scenarios though was not indicated in the displayed image.
Part 3 shows that some of the building were not mapped in the 2013 image, but in 2017 the buildings were
mapped.
Furthermore, the OSM data was used as a source of information in the generation of the training
samples. However, there were limitations related to data quality (e.g incorrect label, the incompleteness of
the attribute) in this process. Under these circumstances, the building area and different multi-source data
such as Google Earth Pro, Google Street View, and the panchromatic image were adapted to complement
the required information where there is doubt. For example, the building size of the slum area is expected
to be much smaller compared to the building size of the formal built up area. On the other hand, the building
size of the large-scale industry such as instutions and processing industries is expected to have a larger size
compared to other formal built up area buildings. From the calculation made on the building footprints, the
assumption for the refinement of the LSI buildings was taken using the building with coverage size of (size>
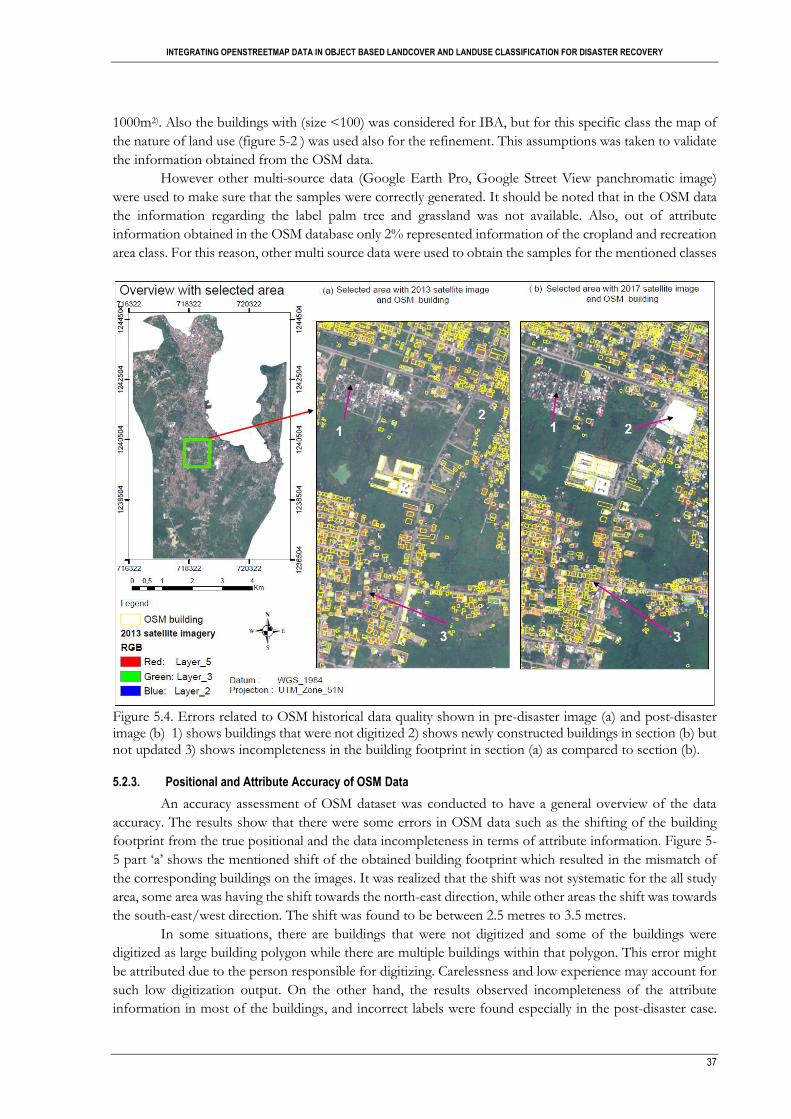
INTEGRATING OPENSTREETMAP DATA IN OBJECT BASED LANDCOVER AND LANDUSE CLASSIFICATION FOR DISASTER RECOVERY
37
1000m2). Also the buildings with (size <100) was considered for IBA, but for this specific class the map of
the nature of land use (figure 5-2 ) was used also for the refinement. This assumptions was taken to validate
the information obtained from the OSM data.
However other multi-source data (Google Earth Pro, Google Street View panchromatic image)
were used to make sure that the samples were correctly generated. It should be noted that in the OSM data
the information regarding the label palm tree and grassland was not available. Also, out of attribute
information obtained in the OSM database only 2% represented information of the cropland and recreation
area class. For this reason, other multi source data were used to obtain the samples for the mentioned classes
Figure 5.4. Errors related to OSM historical data quality shown in pre-disaster image (a) and post-disaster image (b) 1) shows buildings that were not digitized 2) shows newly constructed buildings in section (b) but not updated 3) shows incompleteness in the building footprint in section (a) as compared to section (b).
5.2.3. Positional and Attribute Accuracy of OSM Data
An accuracy assessment of OSM dataset was conducted to have a general overview of the data
accuracy. The results show that there were some errors in OSM data such as the shifting of the building
footprint from the true positional and the data incompleteness in terms of attribute information. Figure 5-
5 part ‘a’ shows the mentioned shift of the obtained building footprint which resulted in the mismatch of
the corresponding buildings on the images. It was realized that the shift was not systematic for the all study
area, some area was having the shift towards the north-east direction, while other areas the shift was towards
the south-east/west direction. The shift was found to be between 2.5 metres to 3.5 metres.
In some situations, there are buildings that were not digitized and some of the buildings were
digitized as large building polygon while there are multiple buildings within that polygon. This error might
be attributed due to the person responsible for digitizing. Carelessness and low experience may account for
such low digitization output. On the other hand, the results observed incompleteness of the attribute
information in most of the buildings, and incorrect labels were found especially in the post-disaster case.
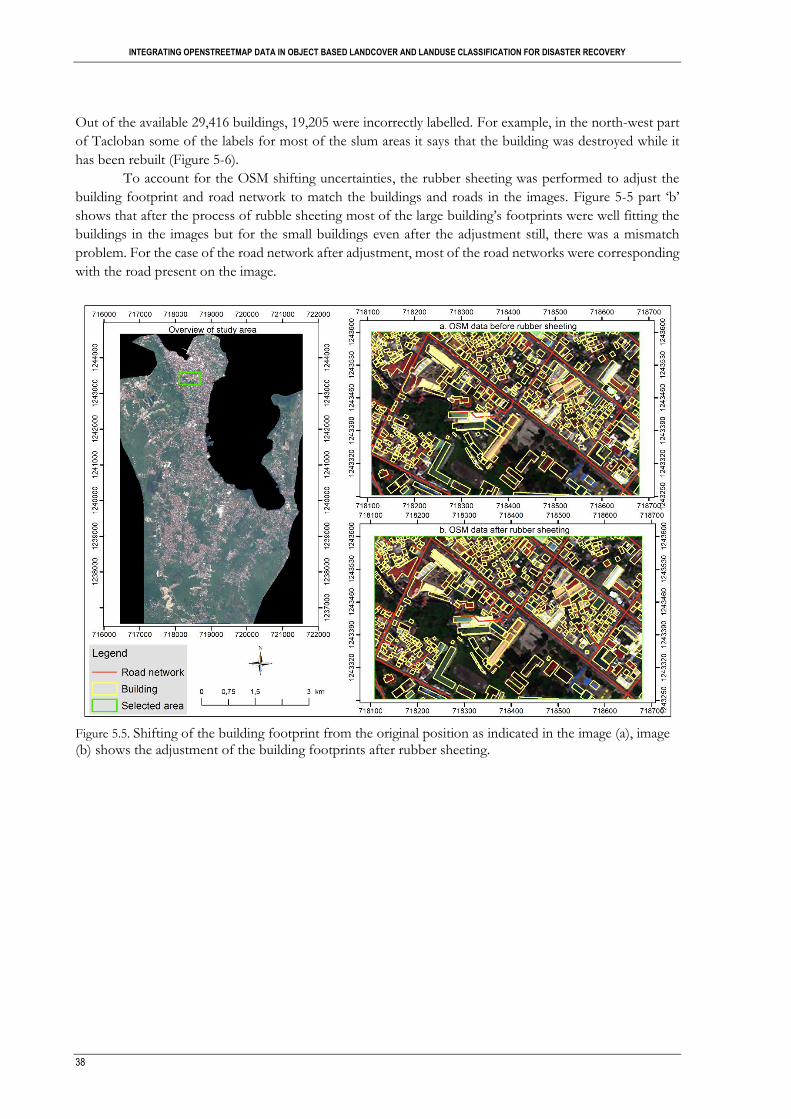
INTEGRATING OPENSTREETMAP DATA IN OBJECT BASED LANDCOVER AND LANDUSE CLASSIFICATION FOR DISASTER RECOVERY
38
Out of the available 29,416 buildings, 19,205 were incorrectly labelled. For example, in the north-west part
of Tacloban some of the labels for most of the slum areas it says that the building was destroyed while it
has been rebuilt (Figure 5-6).
To account for the OSM shifting uncertainties, the rubber sheeting was performed to adjust the
building footprint and road network to match the buildings and roads in the images. Figure 5-5 part ‘b’
shows that after the process of rubble sheeting most of the large building’s footprints were well fitting the
buildings in the images but for the small buildings even after the adjustment still, there was a mismatch
problem. For the case of the road network after adjustment, most of the road networks were corresponding
with the road present on the image.
Figure 5.5. Shifting of the building footprint from the original position as indicated in the image (a), image (b) shows the adjustment of the building footprints after rubber sheeting.
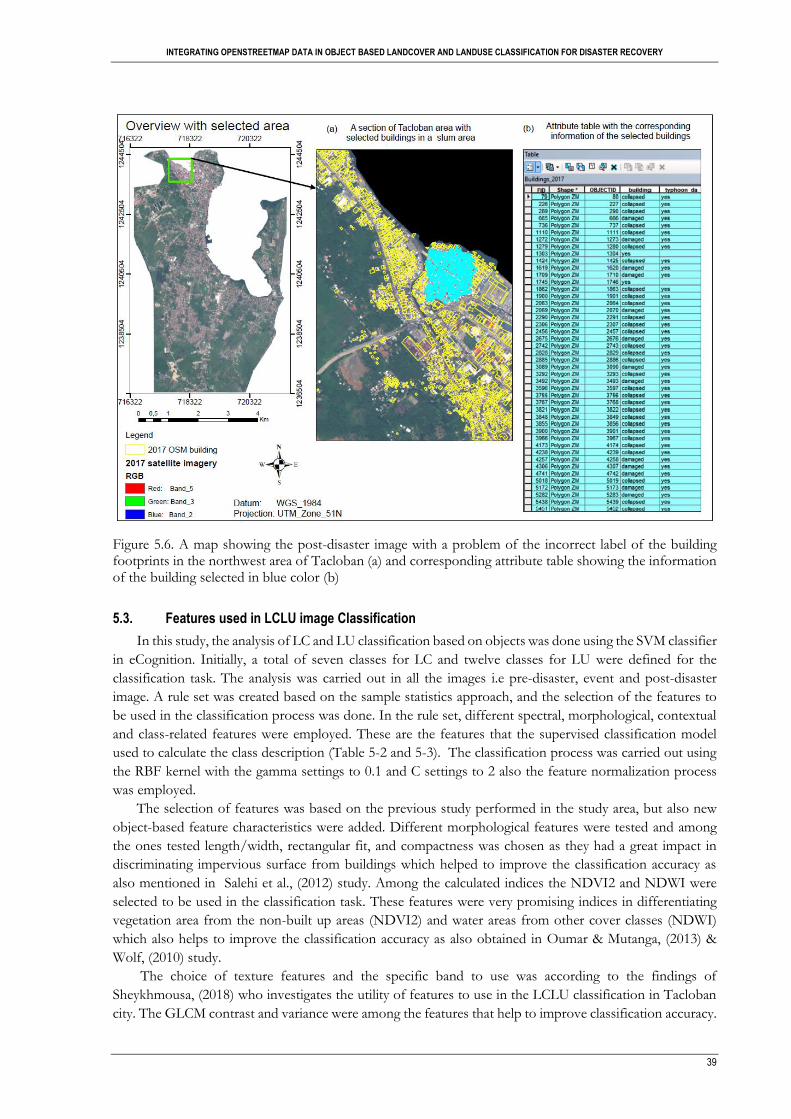
INTEGRATING OPENSTREETMAP DATA IN OBJECT BASED LANDCOVER AND LANDUSE CLASSIFICATION FOR DISASTER RECOVERY
39
Figure 5.6. A map showing the post-disaster image with a problem of the incorrect label of the building footprints in the northwest area of Tacloban (a) and corresponding attribute table showing the information of the building selected in blue color (b)
5.3. Features used in LCLU image Classification
In this study, the analysis of LC and LU classification based on objects was done using the SVM classifier
in eCognition. Initially, a total of seven classes for LC and twelve classes for LU were defined for the
classification task. The analysis was carried out in all the images i.e pre-disaster, event and post-disaster
image. A rule set was created based on the sample statistics approach, and the selection of the features to
be used in the classification process was done. In the rule set, different spectral, morphological, contextual
and class-related features were employed. These are the features that the supervised classification model
used to calculate the class description (Table 5-2 and 5-3). The classification process was carried out using
the RBF kernel with the gamma settings to 0.1 and C settings to 2 also the feature normalization process
was employed.
The selection of features was based on the previous study performed in the study area, but also new
object-based feature characteristics were added. Different morphological features were tested and among
the ones tested length/width, rectangular fit, and compactness was chosen as they had a great impact in
discriminating impervious surface from buildings which helped to improve the classification accuracy as
also mentioned in Salehi et al., (2012) study. Among the calculated indices the NDVI2 and NDWI were
selected to be used in the classification task. These features were very promising indices in differentiating
vegetation area from the non-built up areas (NDVI2) and water areas from other cover classes (NDWI)
which also helps to improve the classification accuracy as also obtained in Oumar & Mutanga, (2013) &
Wolf, (2010) study.
The choice of texture features and the specific band to use was according to the findings of
Sheykhmousa, (2018) who investigates the utility of features to use in the LCLU classification in Tacloban
city. The GLCM contrast and variance were among the features that help to improve classification accuracy.
INTEGRATING OPENSTREETMAP DATA IN OBJECT BASED LANDCOVER AND LANDUSE CLASSIFICATION FOR DISASTER RECOVERY
40
The use of panchromatic images and GLCM textural features were very helpful especially in LU
classification, as it had more classes that were very difficult to differentiate using the spectral, morphological
and spatial information alone.
The feature such as brightness helped in discrimination of the vegetation areas among tree and grass
which also helped to improve the classification as also mentioned in the Salehi et al., (2012) study. After
obtaining the classification results, the visual interpretation of the classified image was conducted to find
out if the output was good enough. The class related features were very helpful in improving the accuracy
of the LC and LU classification maps. The process of reclassification was performed using the ‘assign class’
algorithm based on the class related characteristics using the ‘relation to neighbor objects’ feature to improve
the classification. Different geometry features such as area, shape index and length/width also the vector
data were employed in this process and helped to improve the classification results.
Table 5-2. Selected object features in OBIA for LC classification task
Type Feature
Layer Value Brightness, Mean (all WV2 bands)
Customized Indices NDVI2, NDWI
Object Geometry Length/width, Rectangular fit, and
Compactness
Class related feature Relation to neighbor objects
Table 5-3. Selected object features in OBIA for LU classification task
Type Feature
Layer Value Brightness, Mean (all WV2 bands and
panchromatic band)
Customized Indices NDVI2, NDWI
Object Geometry Length/width, Rectangular fit, Density,
and Compactness
Class related feature Relation to neighbor objects
Texture GLCM Contrast (all dir) (L2, L5, L6, L7,
L8 all dir)
GLCM Variance (all dir) (L2, L5, L6, L7,
L8 all dir)
5.3.1. Classified Maps of LC and LU
Figure 5-7, 5-8, and 5-9 show the result of LC classified maps for the pre-disaster, event and post-
disaster images, and related pie charts respectively. The results show that the pre and post-disaster classified
maps are less noisy as compared to the event map. It is observed that most of the road networks are well
classified in both images, this is sensible as the road network layer was used in the segmentation process.
However, there is a misclassification in the built-up areas among the buildings and impervious surfaces
especially the pavements close to the built-up areas. This misclassification was worse especially for the event
image whereby, the misclassification of the built-up areas is also attributed due to a disaster situation in the
area. Moreover, for the vegetation area, the results show misclassification of the class flattened tree and non-
tree especially in the north-east part of the study area for the event map. This might be attributed due to the
fact that the classifier confused the fallen or topped tree branches with the class non-tree (grass). However,
this misclassification is reduced in both pre and post classified maps.

INTEGRATING OPENSTREETMAP DATA IN OBJECT BASED LANDCOVER AND LANDUSE CLASSIFICATION FOR DISASTER RECOVERY
41
The multi-layer pie charts describe the percentage area coverage of each class category in pre-
disaster, event and post-disaster maps respectively. The inner pie charts show the percentage of the coverage
area in each class obtained in a previous study performed by using pixel-based approach, while the outer pie
charts show the area coverage based on the object-based classification results of this study. The results from
the object-based approach show the increase of 2% in the class building and impervious surface respectively
from pre-disaster to post-disaster state. This indicates that most of the affected areas and some new
buildings and road have been rebuild after 4 years, which indicates a good sign of recovery in an area. Also,
there is a decrease of 2% of bare land from pre-disaster to post-disaster state which indicates a recovery in
the area as most of the bare land areas were proposed for the plantation, vegetation and building
development (Tacloban Recovery and Sustainable Development Group, 2014).
With regard to vegetation class, there is an increase of 3% in the non-tree area in the post-disaster
state while the tree is showing a decrease of 4% in the post-disaster state. The reduction of the area covered
by the tree is sensible as the typhoon Haiyan destroyed almost all palm tree in area around the city either
living them fruitless or destroyed. Furthermore, the damage class shows huge destruction in the disaster
situation as 32% of the area is covered by rubble, a flattened tree covers 15% of the area, and 6% of the
area is covered by inundated land. The comparison of the similarity and differences in the results obtained
from the object-based and pixel-based approach will be discussed in section 6.4 in the next chapter.

INTEGRATING OPENSTREETMAP DATA IN OBJECT BASED LANDCOVER AND LANDUSE CLASSIFICATION FOR DISASTER RECOVERY
42
Figure 5.7. LC classification map for the pre disaster image obtained using object based approach and corresponding pie chart showing the coverage area per class (outer layer) in comparison to pixel-based approach (inner layer) coverage area per class previously obtained by Sheykhmousa, (2018)
Pre- disaster LC classified map

INTEGRATING OPENSTREETMAP DATA IN OBJECT BASED LANDCOVER AND LANDUSE CLASSIFICATION FOR DISASTER RECOVERY
43
Figure 5.8. LC classification map for the event image obtained using object based approach and corresponding pie chart showing the coverage area per class (outer layer) in comparison to pixel-based approach (inner layer) coverage area per class previously obtained by Sheykhmousa, (2018)

INTEGRATING OPENSTREETMAP DATA IN OBJECT BASED LANDCOVER AND LANDUSE CLASSIFICATION FOR DISASTER RECOVERY
44
Figure 5.9. LC classification map for the post disaster image obtained using object based approach and corresponding pie chart showing the coverage area per class (outer layer) in comparison to pixel-based approach (inner layer) coverage area per class previously obtained by Sheykhmousa, (2018)

INTEGRATING OPENSTREETMAP DATA IN OBJECT BASED LANDCOVER AND LANDUSE CLASSIFICATION FOR DISASTER RECOVERY
45
Figure 5.10. LU classification map for the pre disaster image obtained using object based approach and corresponding pie chart showing the coverage area per class (outer layer) in comparison to pixel-based approach (inner layer) coverage area per class previously obtained by Sheykhmousa, (2018)
Pre- disaster LU classified map

INTEGRATING OPENSTREETMAP DATA IN OBJECT BASED LANDCOVER AND LANDUSE CLASSIFICATION FOR DISASTER RECOVERY
46
Figure 5.11. LU classification map for the event image obtained using object based approach and corresponding pie chart showing the coverage area per class (outer layer) in comparison to pixel-based approach (inner layer) coverage area per class previously obtained by Sheykhmousa, (2018)
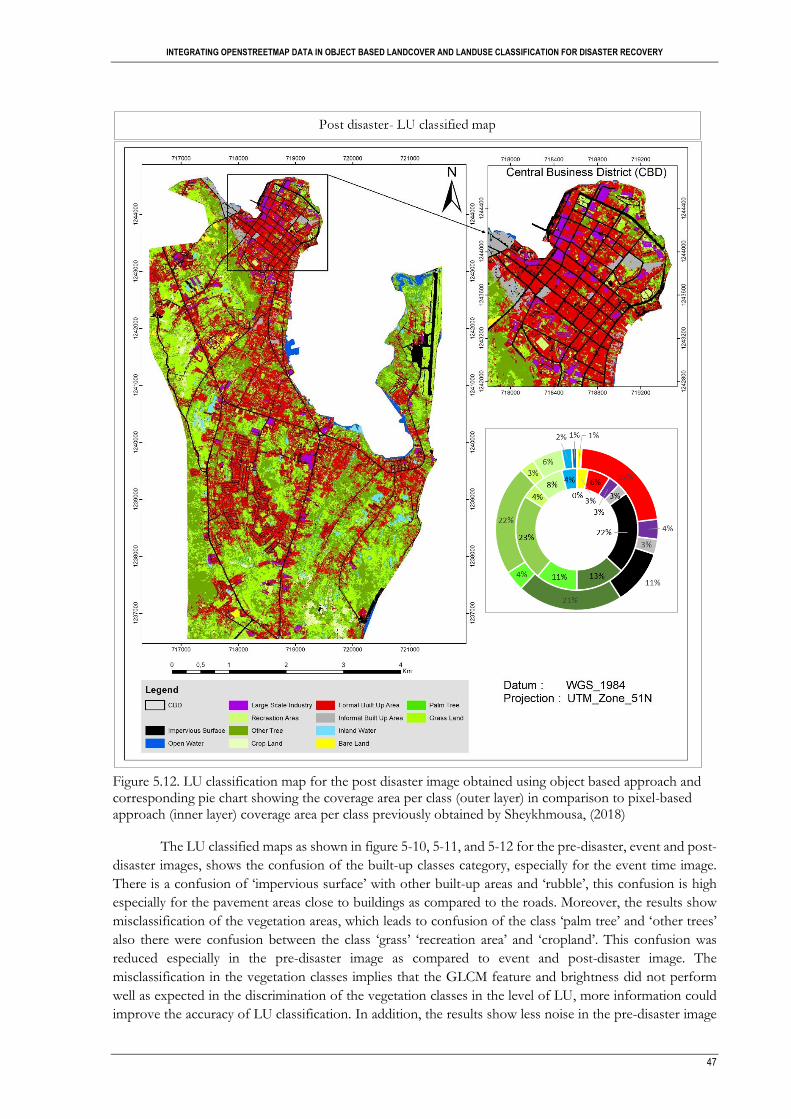
INTEGRATING OPENSTREETMAP DATA IN OBJECT BASED LANDCOVER AND LANDUSE CLASSIFICATION FOR DISASTER RECOVERY
47
Figure 5.12. LU classification map for the post disaster image obtained using object based approach and corresponding pie chart showing the coverage area per class (outer layer) in comparison to pixel-based approach (inner layer) coverage area per class previously obtained by Sheykhmousa, (2018)
The LU classified maps as shown in figure 5-10, 5-11, and 5-12 for the pre-disaster, event and post-
disaster images, shows the confusion of the built-up classes category, especially for the event time image.
There is a confusion of ‘impervious surface’ with other built-up areas and ‘rubble’, this confusion is high
especially for the pavement areas close to buildings as compared to the roads. Moreover, the results show
misclassification of the vegetation areas, which leads to confusion of the class ‘palm tree’ and ‘other trees’
also there were confusion between the class ‘grass’ ‘recreation area’ and ‘cropland’. This confusion was
reduced especially in the pre-disaster image as compared to event and post-disaster image. The
misclassification in the vegetation classes implies that the GLCM feature and brightness did not perform
well as expected in the discrimination of the vegetation classes in the level of LU, more information could
improve the accuracy of LU classification. In addition, the results show less noise in the pre-disaster image
INTEGRATING OPENSTREETMAP DATA IN OBJECT BASED LANDCOVER AND LANDUSE CLASSIFICATION FOR DISASTER RECOVERY
48
as compared to the event and post-disaster image which facilitates the low accuracy of the event and post-
disaster image classification as widely explained in the discussion chapter.
The LU related pie charts obtained from the result of object based in the outer layer show that there is
an increase in the building category of 2% and 1% in FBA and LSI respectively which indicates a good sign
of recovery in the public buildings and industrial areas. This is sensible as it can be seen in the post-disaster
raw image that there are changes due to the construction and reconstruction of public buildings,
infrastructure and industrial development in an area (GFDRR, 2014).
On the contrary, the class IBA area shows the destruction of 1% in the disaster situation from 3% pre-
disaster state, and in the post-disaster state, the slums were built back to 3%. This indicates a negative sign
of recovery as explained in the UNDP, (2011) that recovery should concentrate on improving and restoring
the pre-disaster status of the affected society whereas enabling essential modification that will facilitate
disaster risk reduction. Regarding the vegetation category, there is a decrease in 4%, and 2% in a class ‘palm
tree’ and ‘other tree’ while the class ‘cropland’ and ‘recreation area’ shows an increase of 3% and 1%
respectively. The decrease of a palm tree and other tree is related to the reasons explained earlier in the LC.
However, the increase of cropland and recreation area indicates a good sign of recovery in the area as
most of the recreation area was restored again. Also, the possible reasons for the increase in the cropland
may be attributed due to the fact that farmers adapted other types of crops to adapt the changes in climate
and disaster readiness as also mention in Thomas, (2017) report. The comparison of the coverage area
between the two methods will be addressed in the discussion chapter
5.4. Accuracy Assessment
The accuracy assessment of LC and LU classified maps is presented and analyzed in this section.
5.4.1. LC Accuracy Assessment
After obtaining the LC classified maps, an accuracy assessment was calculated for both images and
user, producer, overall accuracy and accuracy statistics (kappa) values are presented in table 5-4.
The results show the Overall Accuracy (OA) of 89.9%, 85.3%, and 88.9% and a kappa coefficient
of 0.87, 0.83 and 0.85 for pre-disaster, event and post-disaster classification respectively. The higher OA is
reflected in pre-disaster and post-disaster classified maps while the event classified map shows low OA. The
reason for low OA in the event image is attributed due to the disaster situation in the area which results in
confusion of some classes. Among all classes in the event image, the built-up area classes were having low
PA and UA especially ‘bare land’ class which resulted to high commission and omission error ranging from
42.9% to 33.3% respectively. On the other hand, the UA of buildings and the impervious surface was 72.2%
and 76% respectively which highlights the commission error of these two classes. Also, there was confusion
between the class ‘building’ and ‘impervious surface’ and ‘bare land’. However, the results show a slight
improvement in the built-up area related classes especially for the building and impervious surface in both
pre-disaster, event and post-disaster situation as compared to the results obtained using the pixel-based
approach. The bare land class shows high PA and low UA as compared to the pixel-based approach which
shows high UA and low PA. On the other hand, in both approaches, the damage and vegetation classes
portray high PA and UA.
The performance of the results obtained using the object based approach with the results that was
previous obtained by Sheykhmousa, (2018) using the pixel based are compared. The object-based approach
shows an increase in the accuracy of 0.5% and 3.1% for the pre-disaster and event classified images in
contrast to pixel-based approach that had OA of (89.4% and 82.2%) for pre disaster and event classified
image respectively. Surprisingly, the object based approach shows a decrease in accuracy of 1.9% for the
post disaster classified image in contrast to results obtained by pixel based approach that had OA of (90.8%).

INTEGRATING OPENSTREETMAP DATA IN OBJECT BASED LANDCOVER AND LANDUSE CLASSIFICATION FOR DISASTER RECOVERY
49
A detailed description of the reason for having high or low accuracy in different classes category will be
explained in chapter 6. Also the results obtained previous by Sheykhmousa, (2018) can be found in (Annex1)
Table 5-4. LC classification accuracies for the pre, event and post-disaster images
Class name Accuracy Error Overall Accuracy/Kappa
value
Land cover classes UA% PA% Commission Omission
PRE Bare land 79.2 82.6 20.8 17.4
89.9
0.87
Building 91.0 90.0 9.0 10.0
Impervious surface 86.0 84.1 14.0 15.9
Inland water 94.7 100.0 5.3 0.0
Non-tree 92.5 94.2 7.5 5.8
Open water 99.6 100.0 0.4 0.0
Tree 93.3 87.5 6.7 12.5
EVENT Bare land 57.1 66.7 42.9 33.3
85.3
0.83
Building 72.2 73.9 27.8 26.1
Impervious surface 76.0 79.2 24 20.8
Inundated land 100.0 88.9 0.0 11.4
Non-tree 96.6 96.5 3.4 3.5
Open water 81.8 100 18.2 0.0
Flattened tree 88.9 94.0 11.1 6.0
Rubble 89.1 82.5 10.9 17.5
POST Bare Land 80.0 90.9 20.0 9.9
88.9
0.85
Building 92.0 84.4 18.0 15.6
Impervious surface 85.7 89.1 14.3 10.9
Inland water 98.0 100.0 2.0 0.0
Non-tree 97.2 87.5 2.8 12.5
Open water 97.0 100.0 3.0 0.0
Tree 80.8 95.5 19.2 4.5
5.4.2. LU Accuracy Assessment
Accuracy assessment of LU classification maps was calculated for all images and the UA, PA,
together with OA and kappa coefficient is presented in Table 5-5. In general, the result shows that the OA
for pre and post-disaster images was higher as compared to the event image. This was because of the
complexity of the scene in the event state due to a disaster situation which attributed to uncertainties in
different classes as it was observed in LC results as well. It is also observed that the OA of the LU maps
were lower as compared to LC maps. The result shows the OA of 79.9%, 68.7% and 78.6% with kappa
coefficient value of 0.77, 0.6 and 0.75 for both pre-disaster, event and post-disaster classified maps
respectively.

INTEGRATING OPENSTREETMAP DATA IN OBJECT BASED LANDCOVER AND LANDUSE CLASSIFICATION FOR DISASTER RECOVERY
50
Table 5-5. LU classification accuracies for the pre, event and post-disaster images. The bolded classes in each timestep shows the vegetation classes that has low UA and PA as compared to the results obtained in pixel based approach
Class name Accuracy Error Overall
Accuracy/Kappa
value
Land use classes UA% PA% Commission Omission
PRE Bare land 84.3 53.8 15.7 46.2
79.9
0.77
Formal built up area 79.0 81.7 21 18.3
Large scale industry 88.2 81.4 11.8 18.6
Informal built up area 83.7 91.3 16.3 8.7
Impervious surface 96.6 88.4 3.4 11.6
Other tree 65.7 67.6 34.3 32.4
Palm tree 60.0 75.0 40.0 25.0
Grass land 62.5 61.7 37.5 38.3
Recreation area 66.7 50.0 33.3 50.0
Crop land 70.5 51.7 29.5 48.3
Inland water 100.0 84.2 0.0 15.8
Open water 100.0 89.5 0.0 10.5
EVENT Bare land 75.3 42.7 24.4 57.3
68.7
0.6
Formal built up area 66.8 59.8 33.2 40.3
Large scale industry 66.7 70.5 33.3 29.5
Informal built up area 89.9 50.0 10.1 50.0
Impervious surface 80.0 80.0 20.0 20.0
Flattened tree 67.7 93.3 32.3 6.7
Grass land 55.6 71.4 44.4 28.6
Recreation area 38.9 57.8 61.1 42.2
Crop land 45.0 53.6 55 46.4
Inundated land 95.2 100.0 4.8 0.0
Open water 100 94.4 0.0 5.6
Rubble 55.2 92.7 44.8 7.3
POST
Bare Land 91.3 84.0 8.7 16
78.6
0.75
Formal built up area 76.2 86.5 23.8 13.5
Large scale industry 84.3 82.7 15.7 17.3
Informal built up area 83.7 70.9 16.3 29.1
Impervious surface 95.5 96.9 4.5 3.1
Other tree 57.4 72.2 42.6 27.8
Palm tree 42.9 57.1 57.1 42.9
Grass land 60.1 88.9 39.9 11.1
Recreation area 90.0 64.3 10.0 35.7
Crop land 70.0 41.2 30.0 58.8
Inland water 100 90.9 0.0 9.1
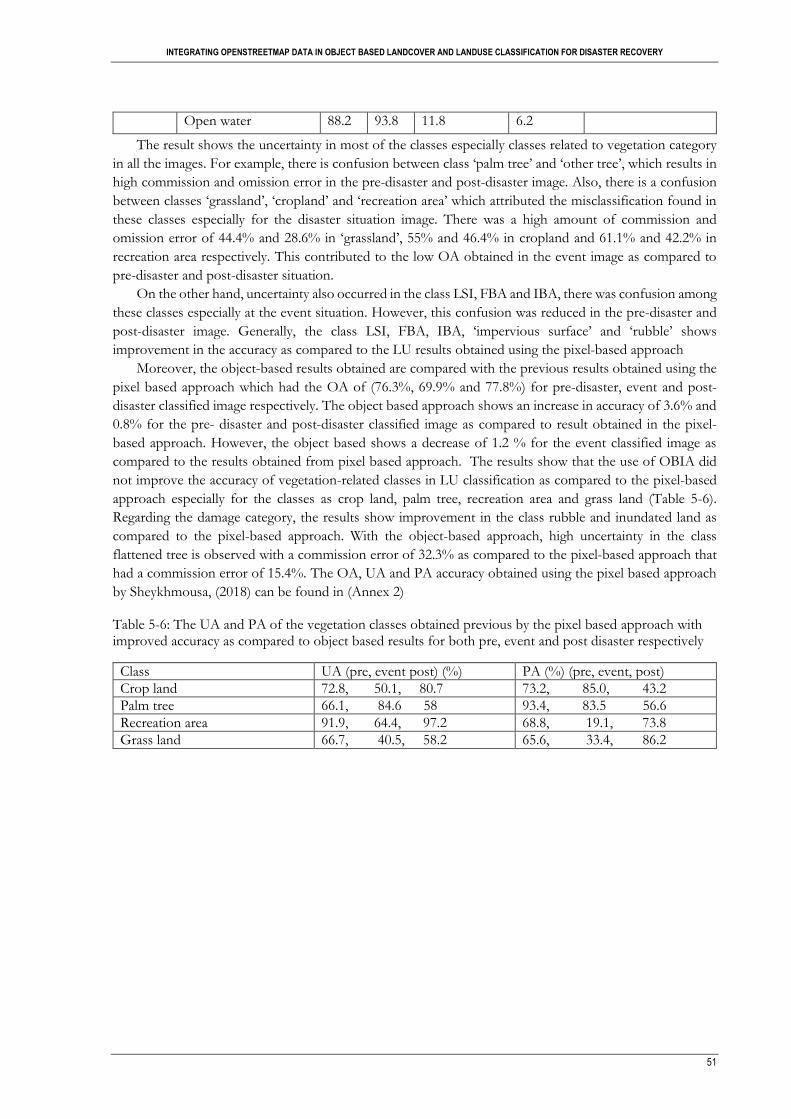
INTEGRATING OPENSTREETMAP DATA IN OBJECT BASED LANDCOVER AND LANDUSE CLASSIFICATION FOR DISASTER RECOVERY
51
Open water 88.2 93.8 11.8 6.2
The result shows the uncertainty in most of the classes especially classes related to vegetation category
in all the images. For example, there is confusion between class ‘palm tree’ and ‘other tree’, which results in
high commission and omission error in the pre-disaster and post-disaster image. Also, there is a confusion
between classes ‘grassland’, ‘cropland’ and ‘recreation area’ which attributed the misclassification found in
these classes especially for the disaster situation image. There was a high amount of commission and
omission error of 44.4% and 28.6% in ‘grassland’, 55% and 46.4% in cropland and 61.1% and 42.2% in
recreation area respectively. This contributed to the low OA obtained in the event image as compared to
pre-disaster and post-disaster situation.
On the other hand, uncertainty also occurred in the class LSI, FBA and IBA, there was confusion among
these classes especially at the event situation. However, this confusion was reduced in the pre-disaster and
post-disaster image. Generally, the class LSI, FBA, IBA, ‘impervious surface’ and ‘rubble’ shows
improvement in the accuracy as compared to the LU results obtained using the pixel-based approach
Moreover, the object-based results obtained are compared with the previous results obtained using the
pixel based approach which had the OA of (76.3%, 69.9% and 77.8%) for pre-disaster, event and post-
disaster classified image respectively. The object based approach shows an increase in accuracy of 3.6% and
0.8% for the pre- disaster and post-disaster classified image as compared to result obtained in the pixel-
based approach. However, the object based shows a decrease of 1.2 % for the event classified image as
compared to the results obtained from pixel based approach. The results show that the use of OBIA did
not improve the accuracy of vegetation-related classes in LU classification as compared to the pixel-based
approach especially for the classes as crop land, palm tree, recreation area and grass land (Table 5-6).
Regarding the damage category, the results show improvement in the class rubble and inundated land as
compared to the pixel-based approach. With the object-based approach, high uncertainty in the class
flattened tree is observed with a commission error of 32.3% as compared to the pixel-based approach that
had a commission error of 15.4%. The OA, UA and PA accuracy obtained using the pixel based approach
by Sheykhmousa, (2018) can be found in (Annex 2) Table 5-6: The UA and PA of the vegetation classes obtained previous by the pixel based approach with improved accuracy as compared to object based results for both pre, event and post disaster respectively
Class UA (pre, event post) (%) PA (%) (pre, event, post)
Crop land 72.8, 50.1, 80.7 73.2, 85.0, 43.2
Palm tree 66.1, 84.6 58 93.4, 83.5 56.6
Recreation area 91.9, 64.4, 97.2 68.8, 19.1, 73.8
Grass land 66.7, 40.5, 58.2 65.6, 33.4, 86.2
INTEGRATING OPENSTREETMAP DATA IN OBJECT BASED LANDCOVER AND LANDUSE CLASSIFICATION FOR DISASTER RECOVERY
52
6. DISCUSSION
This chapter discusses the main findings of this research presented in chapter 5, the discussion is built
on the consideration and reflection of the limitation of the data and method used in this study. The main
objective of this study was to investigate the potential of using OBIA with OSM data for the LCLU
classification of high-resolution satellite image in post-disaster recovery assessment. The first section (6.1)
of this discussion reflects the findings obtained in the second objective in question 1 and 2. Section 6.2 and
6.3 discusses the findings obtained in the first objective. Lastly, section 6.4 and 6.5 the findings obtained in
the third objective are discussed.
6.1. The Value of OSM Information in the OBIA Process
The results obtained from the OSM data analysis shows that OSM data has significant value in the
LCLU classification task regardless of the problems found related to data quality. In this study, the spatial
information obtained from OSM data shows a potential value in assisting the OBIA process. For example,
the OSM road network was used in the segmentation process to orient the OBIA on the proper delineation
of the road network. This explains the good segments with a clear road network definition obtained. On
the whole, this proves that inclusion of the road network in the OBIA process helps in proper identification
of road areas as also mentioned in other studies (Luo et al., 2019; Grippa et al., 2018). Also, the building
footprint layer used in the segmentation process helped in orienting the OBIA by proving the physical
boundary of each buildings, especially in the areas that the buildings were close to each other. However, not
all buildings were included in the analysis due to the shifting problem in OSM data, the large building
included show that image objects with clearly physical boundary of each buildings can be obtained and this
can help improve the accuracy in the classification process.
The statistical analysis conducted using the OSM data shows that with road network it was possible to
derive the parcels that present different neighborhood as also achieved in other studies (Hu, Yang, Li, &
Gong, 2016; Grippa et al., 2018). By using building footprint information, it was possible to identify different
land use information based on the building density, size of the building structure together with the number
of buildings within the neighborhood. However, due to data incompleteness, it was not possible to identify
the changes within the neighborhood in different time steps, and this hinders the recovery assessment using
the OSM information only.
Moreover, with satellite image alone it is difficult to obtain the ground information of different objects,
the OSM information helped to supplement the satellite image by providing the sample label for the image
classification. However, there was a limitation in this process due to a problem related to the incorrect label
of OSM information but also data incompleteness. Even by combining different multi-source information
such as Google Earth, Google Street View, and panchromatic image to refine the OSM data still there were
mistakes in the identification of different LU classes especially the vegetation related classes. This facilitates
the challenge observed in the classification of the vegetation classes. The possible solution for this could be
to refine the OSM data by intersecting the OSM sample with multiple information indexes (Luo et al., 2019).
This will help to correct the errors on the OSM database which are related to the user generated process of
OSM. However, this can be subjective as the refinement needs the threshold which may differ from one
expert to the other, but also in different study areas. The thematic data obtained from the OSM data proves
to be valuable in providing ground information despite the quality data issues which have been a discussion
in most of the studies. However, having good quality OSM data can help provide more information on the
ground and hence improve the LU classification accuracy.
Apart from the successful results obtained from the OSM data, there are limitations related to the OSM
data quality which facilitates the uncertainty obtained in this study. For example, the accuracy of the
segmented object based on the road network depends on the completeness of the OSM road data. In case

INTEGRATING OPENSTREETMAP DATA IN OBJECT BASED LANDCOVER AND LANDUSE CLASSIFICATION FOR DISASTER RECOVERY
53
the digitized roads in OSM data are more as compared to the reality in the image or if there are roads that
are not mapped in the area but are existing in the OSM data. This could create the problem in the
classification and hence cause misclassification. Therefore, this indicates that the success classification of
the roads is highly attributed to the high completeness of the OSM road networks.
In general, OSM data shows a promising value in assisting the LCLU classification task. However, the
performance of these data relies on the accuracy and completeness of the data. It is clear that in the area
selected for this study the OSM data was not good in terms of data completeness but also the shifting of
the building footprint due to unknown source data used in the digitization is an issue to be explored in
detail.
The deficiency of the shifting found is related to the fact that the source image used in the digitization
process is unknown. Also, this can be attributed by the fact that after the disaster when speed matters most
of the sensors are shifted to capture the disaster event, as a result, satellite image with non-nadir viewing
angle is being used in the original digitizing process, or even non orthorectified image. On the other hand,
the issue of data accuracy and incompleteness was also observed in this study, this had been a problem in
most places in the world as also explained in other studies (Haklay, 2010; Girres & Touya, 2010). In most
of the developed countries, OSM data can be used directly to create land cover/land use maps due to the
high quality of data in these areas. However, due to the lack of data quality and completeness as explained
above the OSM data was incorporated with remote sensing imagery for the LCLU classification process.
6.2. Utilization of Object Features in LCLU Classification
The findings obtained in the analysis of LCLU shows that the object geometry features (shape, size)
and spatial information (road network, building footprint) helps to improve the accuracy of built up related
classes in both LC and LU classification. As explained in section 4.1.2, the classification of LCLU that was
previously performed with the pixel-based approach resulted in some uncertainty of some classes due to
spectral similarity and mixed unit classes within a pixel problem (Sheykhmousa, 2018). Therefore, in this
study application of object features in OBIA helps to solve the ambiguity of the classes ‘building’ and
‘impervious surface’ for the LC classification and LSI, IBA, FBA for the LU classification.
The use of length/width and rectangular shape assists in the discrimination of the class building and
impervious surface as it was also found in Salehi et al., (2012) study. Very likely, most of the road networks
are length and buildings are rectangular in shape, by refining these features in the classification analysis using
the shape aspect the ambiguity of these two classes was reduced. However, there was a river/canal in the
study area which had similar characteristics with the road network in terms of shape. For this reason, the
NDWI index helps to refine the area covered with water, the index is very helpful in avoiding
misinterpretation of other architectural surfaces from water as also found in the study of Oumar & Mutanga,
(2013).
The aspect of size and spatial features obtained from OSM data reduces the ambiguity of the classes
LSI, FBA, and IBA. Apart from using the geometry and spatial features, the class related features helped to
reduce the ambiguity of these classes as well. For example, if the area is classified as a slum area, but there
are few objects classified as FBA and are 100% surrounded by slum buildings, then the area is refined to
IBA. Also, the same approach applies in the refinement of the FBA and LSI classes, taking into
consideration other aspects of object features. On the other hand, the GLCM contrast feature was helpful
in discriminating IBA from FBA as also mentioned in Kuffer et al., (2016a) study.
Regarding the vegetation classes, the brightness feature helps to discriminate forest area from grass area,
especially for LC classification as also mentioned in Salehi et al., (2012) study. However, the GLCM feature
and brightness did not perform well in discriminating vegetation classes at the level of LU as also observed
in Adam, Csaplovics, & Elhaja, (2016) study. This explains the low UA and PA results obtained in these
classes. Also, due to the absence of ground truth data, there was the possibility of inherent errors related to

INTEGRATING OPENSTREETMAP DATA IN OBJECT BASED LANDCOVER AND LANDUSE CLASSIFICATION FOR DISASTER RECOVERY
54
the way the samples were created. This also contributed to low accuracy obtained in vegetation classes for
the LU classification.
In general, object-based features and spatial data from OSM in OBIA improved the accuracy of the
built-up related classes, especially for the LU classification. However, the addition of other information such
as the ancillary elevation data could help yield competitive results in the built-up related classes. This data
could assist the discrimination of the impervious surface and buildings by using the height difference and
hence reduce the confusion of these classes.
6.3. LCLU Analysis Using the Object-Based Strategy.
Based on the results obtained, the use of SVM based on the object performed well for the LC
classification as compared to the LU classification. The possible reason for such an outcome may be related
due to the fact that, the LU classes are heterogeneous and are more classes and according to Clarke,
Couclelis, & Clarke, (2005) the OA decreases as the number of classes increases. In addition, the low UA
and PA of the vegetation classes contribute to the low OA obtained in LU classification, especially for the
event time image. The most significance confusion occurred between a class palm tree and other tree, which
is attributed in high spectral similarity and also low spatial resolution of the WV2 image as shown in (figure
6-2).
Moreover, adding the panchromatic band in the LU classification task helps to differentiate the
vegetation classes in LU classification. However, the object-based approach misclassifies objects of these
classes especially in the areas with mixed palm tree and other tree. This is sensible as object-based approach
depends largely on the sample objects used during the training process, and as explained earlier the samples
were created based on the visual interpretation of the images which may lead to inherent errors and hence
affects the classification results. Figure 6-1 shows the graph obtained from the separability analysis of the
class palm tree and other tree. As it is observed in the graph separating the palm tree from other tree using
the first 5 bands of WV2 image is not possible. Even in the three remaining bands, it shows that the classes
are closely related which explained the confusion obtained in these two classes. The possible solution for
solving this problem could be using high-resolution multispectral satellite image, with this image vegetation
index having the most powerful discrimination between a palm tree and other trees can be extracted
(Srestasathiern & Rakwatin, 2014). Also, the use of texture from high-resolution image data such as those
obtained by drones may be more useful to discriminate palm tree from other tree.
On the other hand, the confusion observed between grassland, recreation area, and cropland facilitates
the low OA obtained in LU classification as well. The use of GLCM texture features was not good enough
for such discrimination as also observed by Sheykhmousa, (2018). The possible solution could also be
including additional information in the analysis such as using the Local Binary Pattern (LBP) feature which
is a more powerful feature in separating different objects based on their texture characteristics as it was
observed in the Sheykhmousa, (2018) study.
Moreover, the low accuracy obtained in the post-disaster image for LU classification may be influenced
by the segmentation process. Surprisingly, the segments obtained in this image at different levels was very
small as compared to the pre-disaster image on the same scale parameter settings, this explains the noise
found in the LU post disaster classified image. The possible reason for such an outcome may be due to the
number of features used in the segmentation process but also other reasons may be related to the impact of
feature normalization. In the meantime, the specific reason for such an outcome is not clear yet, but this
fact has a direct consequence on the low OA obtained in the post-disaster classified image.
Furthermore, in both LC and LU classification the event time image had the low OA, this is sensible as
the classification process faces difficult due to the complexity of the scene in the typhoon Haiyan setting.
For example, as a result of the typhoon, the area was overflown with water which made almost the bare
land areas to become wet. In this case the spectral characteristics of the bare land changes, this created
confusion of the class bare land with rubble as visually seen in the image they appeared to be looking similar.

INTEGRATING OPENSTREETMAP DATA IN OBJECT BASED LANDCOVER AND LANDUSE CLASSIFICATION FOR DISASTER RECOVERY
55
The possible solution for this is to use the image with high spectral and spatial resolution but also using
another image from the time when the holding water vanishes. However, this will have the consequences
of losing the damage information as also explained in Sheykhmousa, (2018) work. The high amount of
commission error in the flattened tree class which is rooted by the low spatial resolution of the WV2 image
(Figure 6-6) facilitates the low accuracy obtained in the event state classified image.
Figure 6.1. Spectral separability of the tree category showing the mean digital number values obtained in each band from pre-event WV2 image.
Figure 6.2. A subset of a multispectral image showing the complexity of the area covered by a palm tree and other trees in both pre-disaster state (A) and post-disaster state (C) image, also the damage in the disaster situation showing (flattened tree) (C)
The most significance misclassification occurred in the class rubble and debris. This confusion is
attributed to the difficulty in the identification of what is considered as real debris due to the limitation of
using ground truth map which facilitates the uncertainty in the classification results. During the disaster
situation, there was a different fragment that has been blown about due to strong wind and flood tides. This
causes most of the roads to be covered by different pieces of the fragment which can be related to car pieces,
branches of a tree, or materials washed down due to torrential rain and extremely strong winds. All these
materials may look as rubble in the image which may facilitate uncertainty when analyzing the rubble and
0100200300400500600700800900
1000
CoastalBlue
Blue Green Yellow Red Rededge
NIR1 NIR2
Mea
n D
N v
alues
Spectral separability of other tree and palm tree
Other tree
Palm tree
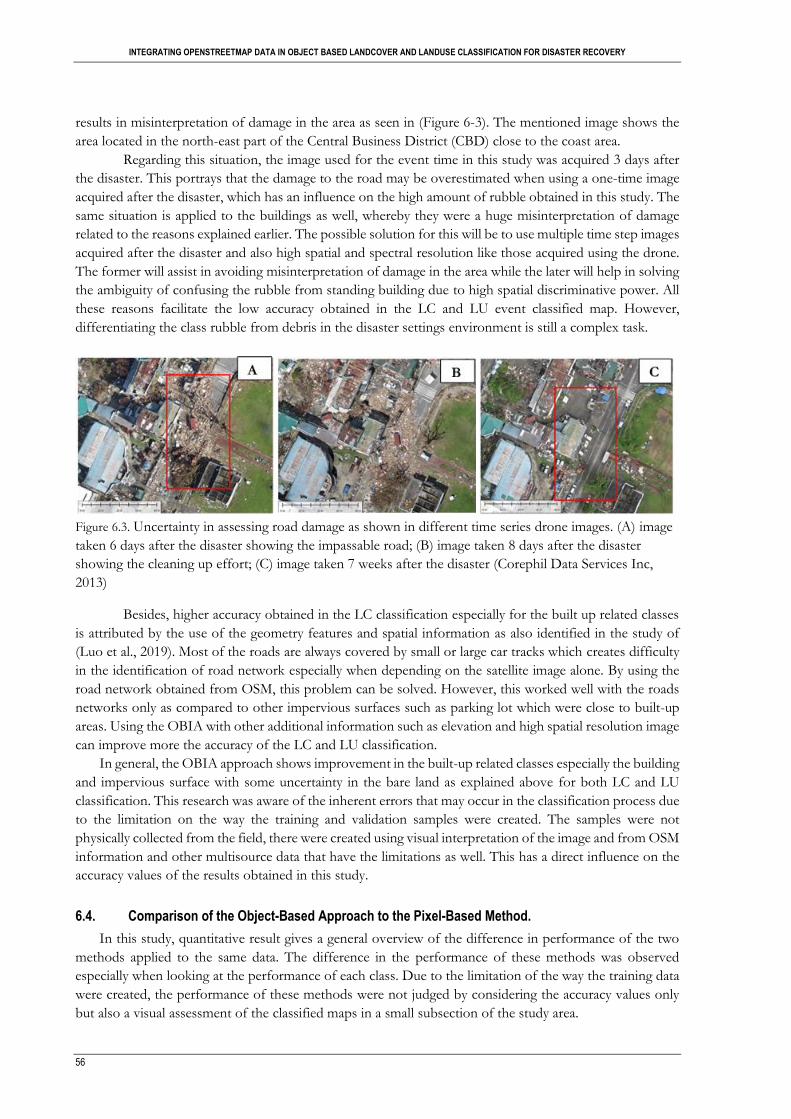
INTEGRATING OPENSTREETMAP DATA IN OBJECT BASED LANDCOVER AND LANDUSE CLASSIFICATION FOR DISASTER RECOVERY
56
results in misinterpretation of damage in the area as seen in (Figure 6-3). The mentioned image shows the
area located in the north-east part of the Central Business District (CBD) close to the coast area.
Regarding this situation, the image used for the event time in this study was acquired 3 days after
the disaster. This portrays that the damage to the road may be overestimated when using a one-time image
acquired after the disaster, which has an influence on the high amount of rubble obtained in this study. The
same situation is applied to the buildings as well, whereby they were a huge misinterpretation of damage
related to the reasons explained earlier. The possible solution for this will be to use multiple time step images
acquired after the disaster and also high spatial and spectral resolution like those acquired using the drone.
The former will assist in avoiding misinterpretation of damage in the area while the later will help in solving
the ambiguity of confusing the rubble from standing building due to high spatial discriminative power. All
these reasons facilitate the low accuracy obtained in the LC and LU event classified map. However,
differentiating the class rubble from debris in the disaster settings environment is still a complex task.
Figure 6.3. Uncertainty in assessing road damage as shown in different time series drone images. (A) image
taken 6 days after the disaster showing the impassable road; (B) image taken 8 days after the disaster
showing the cleaning up effort; (C) image taken 7 weeks after the disaster (Corephil Data Services Inc,
2013)
Besides, higher accuracy obtained in the LC classification especially for the built up related classes
is attributed by the use of the geometry features and spatial information as also identified in the study of
(Luo et al., 2019). Most of the roads are always covered by small or large car tracks which creates difficulty
in the identification of road network especially when depending on the satellite image alone. By using the
road network obtained from OSM, this problem can be solved. However, this worked well with the roads
networks only as compared to other impervious surfaces such as parking lot which were close to built-up
areas. Using the OBIA with other additional information such as elevation and high spatial resolution image
can improve more the accuracy of the LC and LU classification.
In general, the OBIA approach shows improvement in the built-up related classes especially the building
and impervious surface with some uncertainty in the bare land as explained above for both LC and LU
classification. This research was aware of the inherent errors that may occur in the classification process due
to the limitation on the way the training and validation samples were created. The samples were not
physically collected from the field, there were created using visual interpretation of the image and from OSM
information and other multisource data that have the limitations as well. This has a direct influence on the
accuracy values of the results obtained in this study.
6.4. Comparison of the Object-Based Approach to the Pixel-Based Method.
In this study, quantitative result gives a general overview of the difference in performance of the two
methods applied to the same data. The difference in the performance of these methods was observed
especially when looking at the performance of each class. Due to the limitation of the way the training data
were created, the performance of these methods were not judged by considering the accuracy values only
but also a visual assessment of the classified maps in a small subsection of the study area.
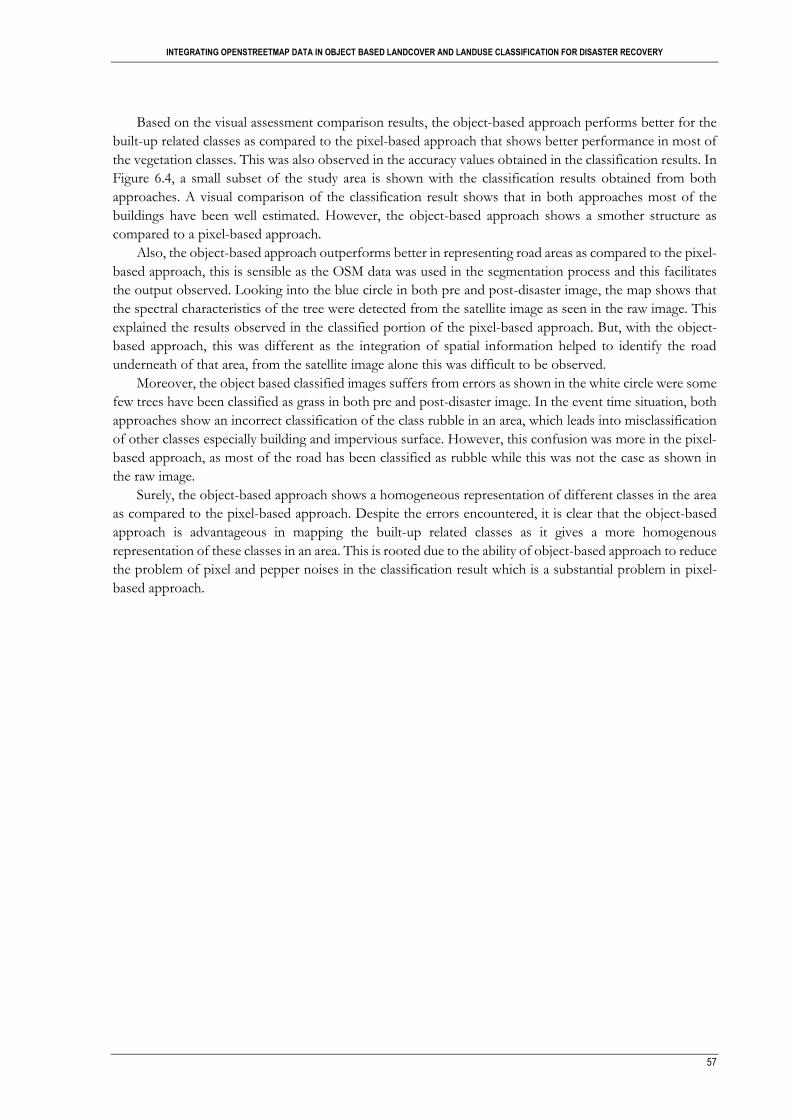
INTEGRATING OPENSTREETMAP DATA IN OBJECT BASED LANDCOVER AND LANDUSE CLASSIFICATION FOR DISASTER RECOVERY
57
Based on the visual assessment comparison results, the object-based approach performs better for the
built-up related classes as compared to the pixel-based approach that shows better performance in most of
the vegetation classes. This was also observed in the accuracy values obtained in the classification results. In
Figure 6.4, a small subset of the study area is shown with the classification results obtained from both
approaches. A visual comparison of the classification result shows that in both approaches most of the
buildings have been well estimated. However, the object-based approach shows a smother structure as
compared to a pixel-based approach.
Also, the object-based approach outperforms better in representing road areas as compared to the pixel-
based approach, this is sensible as the OSM data was used in the segmentation process and this facilitates
the output observed. Looking into the blue circle in both pre and post-disaster image, the map shows that
the spectral characteristics of the tree were detected from the satellite image as seen in the raw image. This
explained the results observed in the classified portion of the pixel-based approach. But, with the object-
based approach, this was different as the integration of spatial information helped to identify the road
underneath of that area, from the satellite image alone this was difficult to be observed.
Moreover, the object based classified images suffers from errors as shown in the white circle were some
few trees have been classified as grass in both pre and post-disaster image. In the event time situation, both
approaches show an incorrect classification of the class rubble in an area, which leads into misclassification
of other classes especially building and impervious surface. However, this confusion was more in the pixel-
based approach, as most of the road has been classified as rubble while this was not the case as shown in
the raw image.
Surely, the object-based approach shows a homogeneous representation of different classes in the area
as compared to the pixel-based approach. Despite the errors encountered, it is clear that the object-based
approach is advantageous in mapping the built-up related classes as it gives a more homogenous
representation of these classes in an area. This is rooted due to the ability of object-based approach to reduce
the problem of pixel and pepper noises in the classification result which is a substantial problem in pixel-
based approach.
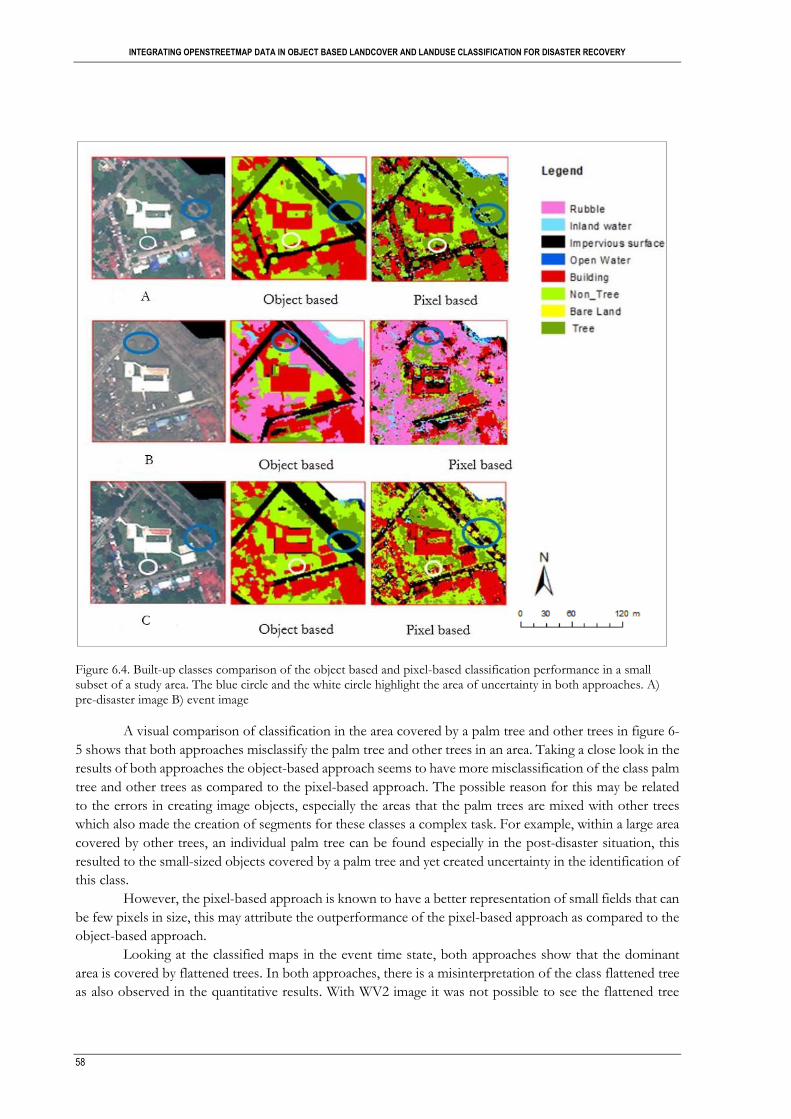
INTEGRATING OPENSTREETMAP DATA IN OBJECT BASED LANDCOVER AND LANDUSE CLASSIFICATION FOR DISASTER RECOVERY
58
Figure 6.4. Built-up classes comparison of the object based and pixel-based classification performance in a small subset of a study area. The blue circle and the white circle highlight the area of uncertainty in both approaches. A) pre-disaster image B) event image
A visual comparison of classification in the area covered by a palm tree and other trees in figure 6-
5 shows that both approaches misclassify the palm tree and other trees in an area. Taking a close look in the
results of both approaches the object-based approach seems to have more misclassification of the class palm
tree and other trees as compared to the pixel-based approach. The possible reason for this may be related
to the errors in creating image objects, especially the areas that the palm trees are mixed with other trees
which also made the creation of segments for these classes a complex task. For example, within a large area
covered by other trees, an individual palm tree can be found especially in the post-disaster situation, this
resulted to the small-sized objects covered by a palm tree and yet created uncertainty in the identification of
this class.
However, the pixel-based approach is known to have a better representation of small fields that can
be few pixels in size, this may attribute the outperformance of the pixel-based approach as compared to the
object-based approach.
Looking at the classified maps in the event time state, both approaches show that the dominant
area is covered by flattened trees. In both approaches, there is a misinterpretation of the class flattened tree
as also observed in the quantitative results. With WV2 image it was not possible to see the flattened tree
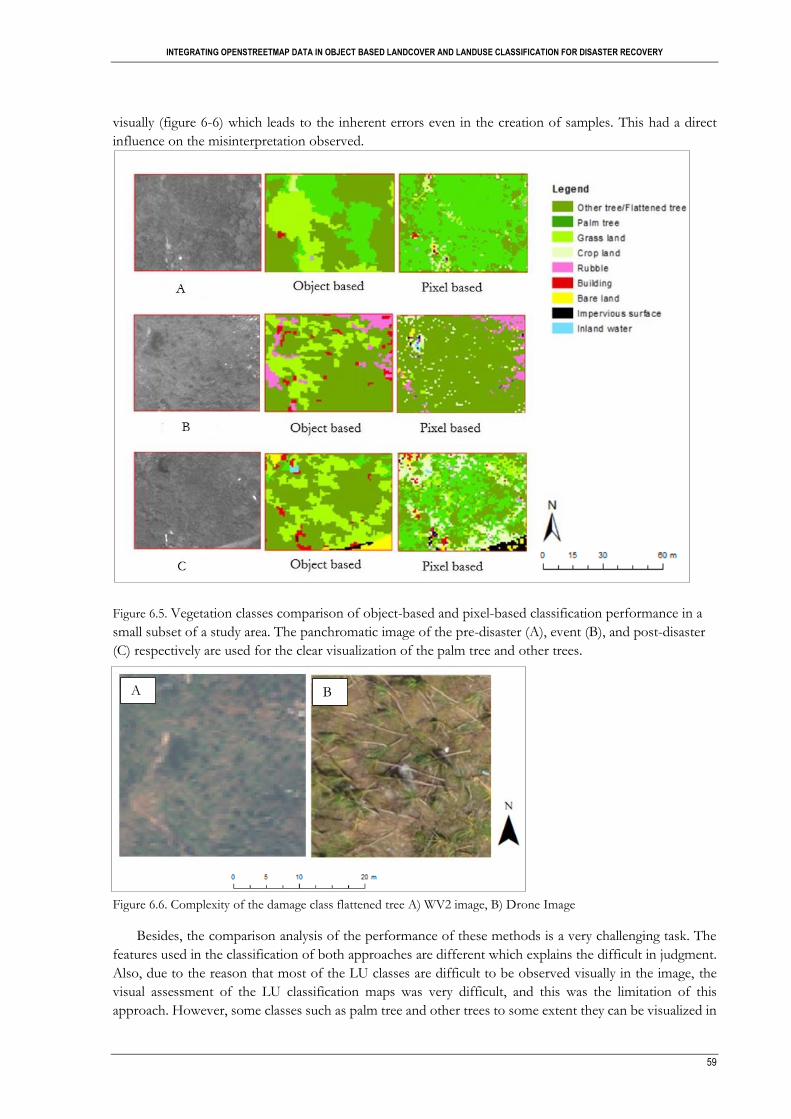
INTEGRATING OPENSTREETMAP DATA IN OBJECT BASED LANDCOVER AND LANDUSE CLASSIFICATION FOR DISASTER RECOVERY
59
visually (figure 6-6) which leads to the inherent errors even in the creation of samples. This had a direct
influence on the misinterpretation observed.
Figure 6.5. Vegetation classes comparison of object-based and pixel-based classification performance in a
small subset of a study area. The panchromatic image of the pre-disaster (A), event (B), and post-disaster
(C) respectively are used for the clear visualization of the palm tree and other trees.
Figure 6.6. Complexity of the damage class flattened tree A) WV2 image, B) Drone Image
Besides, the comparison analysis of the performance of these methods is a very challenging task. The
features used in the classification of both approaches are different which explains the difficult in judgment.
Also, due to the reason that most of the LU classes are difficult to be observed visually in the image, the
visual assessment of the LU classification maps was very difficult, and this was the limitation of this
approach. However, some classes such as palm tree and other trees to some extent they can be visualized in
A B
INTEGRATING OPENSTREETMAP DATA IN OBJECT BASED LANDCOVER AND LANDUSE CLASSIFICATION FOR DISASTER RECOVERY
60
the panchromatic image, but this was difficult for the class grassland, recreation area, and cropland. Also, it
was not possible with the building classes category as visually in the image the function of the building
cannot be recognized.
6.5. Comparison Based on the Percentage of Area Coverage in Both Strategy.
Grounded on the results of the percentage coverage of each class in both approaches as presented in
section 5.3.1, there are similarities and differences in representation of the coverage area per class in both
methods. A high percentage of the area covered by the building is observed in the object-based approach
while the pixel-based approach is having the low coverage area of the same class. This is sensible as with
OBIA more homogeneous areas can be obtained as compared to a pixel-based approach that has the effect
of salt and paper and hence creates uncertainty in the estimation of the area covered by the building. On
the other hand, an object-based approach shows the lower coverage of the impervious surface as compared
to the pixel-based approach which shows an increase of 5% in the area covered by impervious surface. This
increase can be accelerated by the confusion of building and the impervious surface made in the pixel-based
classification work as also mentioned in Sheykhmousa, (2018) study.
The class inland water seems to be overestimated in the pixel-based approach. This is attributed due to
the fact that the discrimination of the features in the pixel-based approach is mostly depending on the
spectral characteristics of the object. For example, buildings with the dark color roofs can be misinterpreted
as water in the pixel-based approach. However, this problem was not encountered in the object-based
approach as the NDWI index used in the classification process helps to discriminate water areas from other
structural and non-structural areas. Also the use of spatial features such as size and shape helps to avoid
such a confusion. With regard to damage classes, the object-based approach obtained a low percentage
covered by the rubble as compared to the pixel-based approach. However, in both approaches, this class
was overestimated due to the confusion of this class with debris. The class flattened tree shows a low
coverage area as compared to the pixel-based approach, this is attributed due to the confusion of this class
with other vegetation class in the object-based approach as explained earlier.
Furthermore, the class other trees and palm tree shows a huge difference in the area covered in both
approaches. This is attributed due to the confusion between these two-classes, especially with the object-
based approach. The class grassland, recreation area, and cropland show no significant difference in the
coverage area. Surprisingly, the class cropland in the event time state shows an increase of 2% in the pixel-
based approach, which indicates huge confusion of this class with other vegetation class in the event time
state.
Truly, the classification based on the object-based approach produced more uniform objects for easier
interpretation in the structured urban environment, and this can avoid misinterpretation of the LCLU
changes. On the contrary, the classification based on the pixel-based approach had salt and paper appearance
and this results in the harder interpretation of the LCLU changes and hence affected the recovery
assessment. For example, in the buildings, other pixels of water, impervious surface, bare land can be found
in the building structure while all those pixels they belong to the building, this leads to harder interpretation
or even misinterpretation of changes from one-time span to the other.
INTEGRATING OPENSTREETMAP DATA IN OBJECT BASED LANDCOVER AND LANDUSE CLASSIFICATION FOR DISASTER RECOVERY
61
7. CONCLUSIONS
This thesis demonstrated that the use of object-based approach in disaster-related multitemporal image
analysis yields a promising result in the LCLU classification over the urban-rural environment. It has also
demonstrated that the object geometry features and spatial information obtained from OSM data in OBIA
help to improve the accuracy of LCLU classification. The principal purpose of this study was to investigate
the potential of using RS imagery and OSM data within an OBIA for improving the LCLU classification.
The study was based on the limitation encountered in the previous study that was performed using the pixel-
based approach. This study established three objectives 1) to investigate to what extent LCLU mapping
performed by using a pixel-based approach for recovery assessment can be improved with the OBIA
method; 2) to investigate the significance of using OSM information to supplement satellite imagery during
LCLU classification by OBIA method; 3) to analyze the value of using object-based machine learning
algorithm in eCognition for LCLU classification. The available dataset were 3 WV2 images obtained at
different timestep ( 8 months before the disaster, 3 days right after the disaster and 4 years after a disaster)
and OSM data.
A ruleset was developed in OBIA that integrates the spatial information from OSM data in obtaining
the image segments. The attributes from the OSM data and other multi-source information (Google Earth
Pro, Google Street View, panchromatic band) were used to obtain the validation samples. Different object
features were tested for class description in the LC and LU classification task. The results showed the use
of spatial and geometry features improved the results of the built up related classes while the GLCM features
and brightness failed to improve the accuracy of the vegetation classes, additional of information such as
texture, high spatial and spectral resolution images could yield competitive results in discrimination of
vegetation-related classes especially in the level of LU.
The integration of spatial information in OBIA improved the accuracy of the LCLU classification map.
The geometric information obtained from OSM road network and building footprint showed better results
of obtained image segments with clear shape and the physical boundary which highly assisted in class
identification in the classification process. In addition, the attributes from the OSM historical data were used
together with other multisource data to extract training samples. However, there was limitation related to
the quality of OSM data, and this had a direct impact on the obtained results, more investigation is needed
on the actual database of OSM in the study area.
The classification of LC was performed using the SVM classifier with object geometry (size, shape),
layer value (brightness, mean of all WV2 bands), spectral indices (NDVI2, NDWI) and class-related features
resulted in the high overall accuracy of 89.9%, 85.3% and 88.9% for pre-disaster, event and post-disaster
classified image respectively for LC classification. In the case of the LU classification, the SVM classifier
was used, the same features were employed with addition of GLCM features and panchromatic band, the
overall accuracy of 79.9%, 68.7% and 78.6% for the pre-disaster, event and post-disaster classified maps
respectively was obtained. In both results, the event classified image had low OA. The results showed high
accuracies in the LC classification as compared to the LU classification.
On the whole, the OBIA approach shows an improvement of the accuracy in comparison to the pixel-
based approach. It should be noted that with LC classification no texture information was used, but also in
the LU classification, the texture information used was based in the GLCM features as compared to a pixel-
based approach that adopted the use of LBP texture information in the analysis. Therefore, the addition of
more features in the analysis could show more improved results especially for LU classification which was
very complex and challenging.
Furthermore, the comparison of the two approaches showed that the object based performed better as
compared to the pixel-based approach. However, in both approaches, there was uncertainty in the
classification of the vegetation related classes and the rubble class. With the object-based approach, the
INTEGRATING OPENSTREETMAP DATA IN OBJECT BASED LANDCOVER AND LANDUSE CLASSIFICATION FOR DISASTER RECOVERY
62
uncertainty in the class rubble was reduced to some extent. However, more investigation is required on the
best approach of discriminating the rubble from debris in a disaster setting environment.
In general, the object-based approach produced more uniform objects for easier interpretation in the
structure urban-rural environment setting, while the pixel-based approach maps obtained in the previous
study had a salt and pepper appearance and were harder to interpret. This thesis revealed that in the bases
of the recovery assessment the pixel-based approach showed an overestimation of the class rubble which
was due to the confusion of this class with the building. This indicated the misinterpretation of the recovery
in the building as well. Also, related to damage classes, this study observed that the damage in the impervious
surface and building in both approaches might be overestimated depending on the image used in the
analysis. This requires more investigation on the number of the image to be used for the assessment of
recovery.
7.1. Recommendations and Future Works
The use of high-resolution satellite image and OSM data for improving LCLU classification in post-
disaster recovery assessment provide an opportunity for future study. Based on the highlighted limitation
of this study the following recommendations are proposed.
• Investigating to what extent the information obtained from OSM data only can be used to study
and understand functional post-disaster recovery in an urban setting environment.
• Exploiting the impact of the feature normalization in aiding the identification of feature description
in the LCLU classification using OBIA approach.
• Investigate the reasons that may influence the difference in the size and number of image objects
when the same settings for the segmentation is applied in the same area of an image (in this case
the pre- disaster and post-disaster (4 years after the event))
• Investigate the appropriate approach that can be used in the assessment of the performance of the
pixel and object-based methods when the same data type is used but different classification features
are employed in the classification process.

63
LIST OF REFERENCES
Adam, H. E., Csaplovics, E., & Elhaja, M. E. (2016). A comparison of pixel-based and object-based approaches for land use land cover classification in semi-arid areas, Sudan. IOP Conference Series: Earth and Environmental Science, 37(1). https://doi.org/10.1088/1755-1315/37/1/012061
Ali, I., Greifeneder, F., Stamenkovic, J., Neumann, M., & Notarnicola, C. (2015). Review of machine learning approaches for biomass and soil moisture retrievals from remote sensing data. Remote Sensing, 7(12), 16398–16421. https://doi.org/10.3390/rs71215841
Blaschke, T. (2010a). Object based image analysis for remote sensing. ISPRS Journal of Photogrammetry and Remote Sensing, 65(1), 2–16. https://doi.org/10.1016/j.isprsjprs.2009.06.004
Blaschke, T. (2010b). Object based image analysis for remote sensing. ISPRS Journal of Photogrammetry and Remote Sensing, 65(1), 2–16. https://doi.org/10.1016/j.isprsjprs.2009.06.004
Blaschke, T. (2010c). Object based image analysis for remote sensing. ISPRS Journal of Photogrammetry and Remote Sensing, 65(1), 2–16. https://doi.org/10.1016/j.isprsjprs.2009.06.004
Brown, D., Platt, S., Bevington, J., Saito, K., Adams, B., Chenvidyakarn, T., … Spence, R. (2015). Monitoring and evaluating post-disaster recovery using high-resolution satellite imagery – towards standardised indicators for post-disaster recovery. In 8th International Workshop on Remote Sensing for Disaster Application. Tokyo, Japan. October.
Brown, D., Saito, K., Spence, R., Chenvidyakarn, T., Adams, B., Mcmillan, A., … Platt, S. (2008). Indicators for measuring, monitoring and evaluating post-disaster recovery. 6th International workshop on Remote Sensing for disaster applications. In 6th International Workshop on Remote Sensing for Disaster Applications. Pavia, Italy, September 12.
CDEM. (2005). A holistic Framework for Recovery in New Zealand. Wellington. Retrieved from https://www.civildefence.govt.nz/assets/Uploads/publications/is-05-05-focus-on-recovery.pdf
Chang, S. E. (2010). Urban disaster recovery: A measurement framework and its application to the 1995 Kobe earthquake. Disasters, 34(2), 303–327. https://doi.org/10.1111/j.1467-7717.2009.01130.x
Chich Hsu, Chich-Chung Chang, C.-J. L. (2016). A practical guide to support vector classification. Theory, Culture and Society, 17(1), 39–61. https://doi.org/10.1177/02632760022050997
Clarke, K. C., Couclelis, H., & Clarke, K. C. (2005). The role of spatial metrics in the analysis and modeling of urban land use change. Computers, Environment and Urban Systems, 29(4), 369–399. https://doi.org/10.1016/j.compenvurbsys.2003.12.001
Comber, A., Fisher, P., & Wadsworth, R. (2005). What is land cover? Environment and Planning B: Planning and Design, 32(2), 199–209. https://doi.org/10.1068/b31135
Coppola, D. P. (2015). The management of disasters. In Introduction to International Disaster Management (3rd ed., pp. 1–39). Kidlington, Oxford, U.K: Butterworth Heinemann. https://doi.org/10.1016/B978-0-12-801477-6.00001-0
Corephil Data Services Inc. (2013). Time series drone survey: Tacloban_Day6 / Day 8 / Week 7. Retrieved February 25, 2019, from https://www.dropbox.com/s/s0zku5qc9686bbm/Corephil_Reports.zip?file_subpath=%2FTime+Series+Survey_Tacloban_drone_Jeremy_Corephil+DSI.pdf
CRED. (2014). The international disaster database. Retrieved February 26, 2019, from https://www.emdat.be/index.php
Cusicanqui, J., Kerle, N., & Nex, F. (2018). Usability of aerial video footage for 3-D scene reconstruction and structural damage assessment. EGU Natural Hazards and Earth System Sciences, 1–16. https://doi.org/https://doi.org/10.5194/
de Albuquerque, J. P., Eckle, M., Herfort, B., & Zipf, A. (2016). Crowdsourcing geographic information for disaster management and improving urban resilience: an overview of recent developments and lessons learned. In R. P. Cristina Capineri, Muki Haklay, Haosheng Huang, Vyron Antoniou, Juhani Kettunen, Frank Ostermann (Ed.), European Handbook of Crowdsourced Geographic Information (pp. 309–321). London: Ubiquity Press. https://doi.org/10.5334/bax.w
DEC. (2015). Philippines typhoon facts and figures. Retrieved February 22, 2019, from https://www.dec.org.uk/articles/facts-and-figures

64
Dickinson, G. C., & Shaw, M. G. (1977). What is Land Use ? Environment and Planning A, 14(3), 343–358. https://doi.org/10.1068/a140343
DigitalGlobe. (2010). The benefits of the eight spectral bands of Worldview-2. Retrieved from www.digitalglobe.com
Dominici, D., Alicandro, M., & Massimi, V. (2017). UAV photogrammetry in the post-earthquake scenario: case studies in L’Aquila. Geomatics, Natural Hazards and Risk, 8(1), 87–103. https://doi.org/10.1080/19475705.2016.1176605
Drǎguţ, L., Csillik, O., Eisank, C., & Tiede, D. (2014). Automated parameterisation for multi-scale image segmentation on multiple layers. ISPRS Journal of Photogrammetry and Remote Sensing, 88, 119–127. https://doi.org/10.1016/j.isprsjprs.2013.11.018
Drǎguţ, L., Tiede, D., & Levick, S. R. (2010). ESP: A tool to estimate scale parameter for multiresolution image segmentation of remotely sensed data. International Journal of Geographical Information Science, 24(6), 859–871. https://doi.org/10.1080/13658810903174803
Ezequiel, C. A. F., Cua, M., Libatique, N. C., Tangonan, G. L., Alampay, R., Labuguen, R. T., … Palma, B. (2014). UAV aerial imaging applications for post-disaster assessment, environmental management and infrastructure development. In 2014 International Conference on Unmanned Aircraft Systems (ICUAS). Orlando Florida, USA. https://doi.org/10.1109/ICUAS.2014.6842266
Fallatah, A., Jones, S., Mitchell, D., & Kohli, D. (2018). Mapping informal settlement indicators using object-oriented analysis in the middle East. International Journal of Digital Earth, (September), 1–23. https://doi.org/10.1080/17538947.2018.1485753
Fan, H., Zipf, A., Fu, Q., & Neis, P. (2014). Quality assessment for building footprints data on OpenStreetMap. International Journal of Geographical Information Science, 28(4), 700–719. https://doi.org/10.1080/13658816.2013.867495
Foerstnow, L. P. (2017). Functional post-disaster damage assessment in urban setting with remote sensing. University of Twente. Retrieved from https://webapps.itc.utwente.nl/librarywww/papers_2017/msc/aes/ Foerstnow.pdf%0A%0A
Fonte, C. C., Antoniou, V., & Bastin, L. (2017). Assessing VGI data quality. Mapping and the Citizen Sensor, (September), 137–163. https://doi.org/10.5334/bbf.g
Fonte, C., Minghini, M., Antoniou, V., See, L., Patriarca, J., Brovelli, M., & Milcinski, G. (2016). Automated methodology for converting OSM data into a land use/cover map. 6th International Conference on Cartography & GIS, 501(June), 13–17. Retrieved from http://pure.iiasa.ac.at/13152/
Frank, J., Rebbapragada, U., Bialas, J., Oommen, T., & Havens, T. C. (2017). Effect of label noise on the machine-learned classification of earthquake damage. Remote Sensing, 9(8), 1–18. https://doi.org/10.3390/rs9080803
GCSE. (2014). Tropical cyclones - Edexcel - Revision 4 - GCSE Geography - BBC Bitesize. Retrieved February 23, 2019, from https://www.bbc.com/bitesize/guides/z9whg82/revision/4
Gerke, M., & Kerle, N. (2011). Automatic structural seismic damage assessment with airborne oblique pictometry imagery. Photogrammetric Engineering and Remote Sensing, 77(9), 885–898. https://doi.org/10.14358/PERS.77.9.885
GFDRR. (2014). Recovery and reconstruction planning in the aftermath of typhoon Hayan (Yolanda). Washington DC; USA. https://doi.org/10.15713/ins.mmj.3
Ghaffarian, S., Kerle, N., & Filatova, T. (2018). Remote Sensing-Based Proxies for Urban Disaster Risk Management and Resilience: A Review. Remote Sensing, 10(11), 1760. https://doi.org/10.3390/rs10111760
Girres, J. F., & Touya, G. (2010). Quality assessment of the French OpenStreetMap dataset. Transactions in GIS, 14(4), 435–459. https://doi.org/10.1111/j.1467-9671.2010.01203.x
Goodin, D. G., Anibas, K. L., & Bezymennyi, M. (2015a). Mapping land cover and land use from object-based classification: an example from a complex agricultural landscape. International Journal of Remote Sensing, 36(18), 4702–4723. https://doi.org/10.1080/01431161.2015.1088674
Goodin, D. G., Anibas, K. L., & Bezymennyi, M. (2015b). Mapping land cover and land use from object-based classification: an example from a complex agricultural landscape. International Journal of Remote Sensing, 36(18), 4702–4723. https://doi.org/10.1080/01431161.2015.1088674
Grippa, T., Georganos, S., Zarougui, S., Bognounou, P., Diboulo, E., Forget, Y., … Wolff, E. (2018). Mapping urban land use at street block level using OpenStreetMap, Remote Sensing data, and spatial metrics. ISPRS International Journal of Geo-Information, 7(7), 246. https://doi.org/10.3390/ijgi7070246
Gröchenig, S., Brunauer, R., & Rehrl, K. (2014). Digging into the history of VGI data-sets: results from a worldwide study on OpenStreetMap mapping activity. Journal of Location Based Services, 8(3), 198–210.
65
https://doi.org/10.1080/17489725.2014.978403 Guha-sapir, D., Hoyois, P., & Below, R. (2016). Annual disaster statistical review 2010: The numbers and
trends. Review Literature And Arts Of The Americas, 1–50. https://doi.org/10.1093/rof/rfs003 Guo, H., Liu, L., Lei, L., Wu, Y., Li, L., Zhang, B., … Li, Z. (2010). Dynamic analysis of the Wenchuan
Earthquake disaster and reconstruction with 3-year remote sensing data. International Journal of Digital Earth, 3(4), 355–364. https://doi.org/10.1080/17538947.2010.532632org/10.1080/17538947.2010.532632
Gupta, N., & Bhadauria, H. S. (2014). Object based information extraction from high resolution satellite imagery using eCognition. IJCSI International Journal of Computer Science Issues, 11(3), 139–144. https://doi.org/10.1177/1553350614554232
Haas, J. E., Kates, R. W., & Bowden, M. J. (1977). Reconstruction Following Disaster.The MIT Press. (First Edit). Cambridge, Massachusetts: The MIT Press.
Haklay, M. (2010). How good is Volunteered Geographical Information? A comparative study of OpenStreetMap and ordnance survey datasets. Environment and Planning. B, Planning & Design, 37(4), 682. https://doi.org/10.1068/b35097
Hall-Beyer, M. (2017). Practical guidelines for choosing GLCM textures to use in landscape classification tasks over a range of moderate spatial scales. International Journal of Remote Sensing, 38(5), 1312–1338. https://doi.org/10.1080/01431161.2016.1278314
Haralick, R. M., Shanmugam, K., & Dinstein, I. (1973). Textural Features for Image Classification. IEEE Transactions on Systems, Man, and Cybernetics, SMC-3(6), 610–621. https://doi.org/10.1109/TSMC.1973.4309314
Hettige, S. (2018). Community level indicators of long term disaster recovery. Procedia Engineering, 212, 1287–1294. https://doi.org/10.1016/J.PROENG.2018.01.166
Horita, F., Degrossi, L., Assis, L., Zipf, A., & Porto de Albuquerque, J. (2013). The use of Volunteered Geographic Information and crowdsourcing in disaster management: a systematic literature review. Proceedings of the Nineteenth Americas Conference on Information Systems, (June), 1–10. https://doi.org/10.1.1.1004.1606
Horney, J., Aminto, M., Berke, P. R., & Smith, G. (2016). Developing indicators to measure post- disaster community recovery in the United States. Disasters, 41(i), 124–149. https://doi.org/10.1111/disa.12190
HOT. (2018). MAPATHON : Mapping disaster prone areas. Retrieved February 24, 2019, from https://www.hotosm.org/updates/mapathon-mapping-disaster-prone-areas/
Hsu, C.-W., Chang, C.-C., & Lin, C.-J. (2016). A Practical Guide to Support Vector Classification. Retrieved from http://www.csie.ntu.edu.tw/~cjlin
Hu, T., Yang, J., Li, X., & Gong, P. (2016). Mapping urban land use by using landsat images and open social data. Remote Sensing, 8(2). https://doi.org/10.3390/rs8020151
Jokar Arsanjani, J., Helbich, M., & Bakillah, M. (2013). Exploiting Volunteered Geographic Information to ease land use mapping of an urban landscape. International Archives of the Photogrammetry, Remote Sensing and Spatial Information Sciences, XL-4/W1, 29–31. https://doi.org/10.5194/isprsarchives-XL-4-W1-51-2013
Joyce, K., C., K., V., S., & G., V. (2009). Remote sensing and the disaster management cycle. In Advances in Geoscience and Remote Sensing. InTech. https://doi.org/10.5772/8341
Kasianchuk, P. (2003). Spatial Adjustment Tools in ArcGIS. ArcUser, (March), 48–49. Kerle, N. (2015). Disasters: risk assessment, management, and post - disaster studies using remote sensing.
Remote Sensing of Water Resources, Disasters, and Urban Studies, (October), 455–482. https://doi.org/10.1201/b19321-39
Kerle, N., Janssen, L. L. F., & Bakker, W. H. (2004). Principles of remote sensing : an introductory textbook (3rd ed.). Enschede: The International Institute for Geo-Information Science and Earth Observation (ITC). Retrieved from https://www.worldcat.org/title/principles-of-remote-sensing-an-introductory-textbook/oclc/66027040
Khan, M.A.U and Sayem, M. . (2013). Understanding recovery of small enterprises from natural disaster. Environmental Hazards. https://doi.org/10.1080/17477891.2012.761593
Kounadi, O. (2009). Assessing the quality of OpenStreetMap data. Geographical Information Science, University College of, (August), 0–80. Retrieved from ftp://ftp.cits.nrcan.gc.ca/pub/cartonat/Reference/VGI/Rania_OSM_dissertation.pdf
Kuffer, M., Pfeffer, K., Sliuzas, R., & Baud, I. (2016a). Extraction of slum areas from VHR imagery using GLCM variance. IEEE Journal of Selected Topics in Applied Earth Observations and Remote Sensing, 9(5),
66
1830–1840. https://doi.org/10.1109/JSTARS.2016.2538563 Kuffer, M., Pfeffer, K., Sliuzas, R., & Baud, I. (2016b). Extraction of Slum Areas From VHR Imagery
Using GLCM Variance. IEEE Journal of Selected Topics in Applied Earth Observations and Remote Sensing, 9(5), 1830–1840. https://doi.org/10.1109/JSTARS.2016.2538563
Lan, Z., & Liu, Y. (2018). Study on multi-scale window determination for GLCM texture description in high-resolution Remote Sensing image geo-analysis supported by GIS and domain knowledge. ISPRS International Journal of Geo-Information, 7(5), 175. https://doi.org/10.3390/ijgi7050175
Latif, S., Islam, K. M. R., Khan, M. M. I., & Ahmed, S. I. (2011). OpenStreetMap for the disaster management in Bangladesh. 2011 IEEE Conference on Open Systems, ICOS 2011, (September), 435–439. https://doi.org/10.1109/ICOS.2011.6079240
Lindell, M. K., & Prater, C. S. (2000). Assessing community impacts of natural disasters. Natural Hazard Review. https://doi.org/10.1061/ASCE1527-698820034:4176
Luo, N., Wan, T., Hao, H., & Lu, Q. (2019). Fusing high-spatial-resolution Remotely Sensed imagery and OpenStreetMap data for land cover classification over urban areas. Remote Sensing, 11(1), 88. https://doi.org/10.3390/rs11010088
Ma, L., Li, M., Ma, X., Cheng, L., Du, P., & Liu, Y. (2017). A review of supervised object-based land-cover image classification. ISPRS Journal of Photogrammetry and Remote Sensing, 130, 277–293. https://doi.org/10.1016/j.isprsjprs.2017.06.001
Marangoz, A. M. (2018). Analysis of land use / land cover classification results derived from Sentinel-2 image. In 17th International Multidisciplinary Scientific GeoConference (SGEM 2017), At Albena,. https://doi.org/10.5593/sgem2017/23/S10.004
Marangoz, A. M., Sekertekin, A., & Akcin, H. (2017). Analysis of land use land cover classification results derived from Sentinel-2 image. In 17th International Multidisciplinary Scientific GeoConference (SGEM 2017), At Albena,. Albena, Varna, Bulgaria. https://doi.org/10.1016/S0924-2716(14)00019-7
Martha, T. R., Kerle, N., Van Westen, C. J., Jetten, V., & Kumar, K. V. (2011). Segment optimization and data-driven thresholding for knowledge-based landslide detection by object-based image analysis. IEEE Transactions on Geoscience and Remote Sensing, 49(12 PART 1), 4928–4943. https://doi.org/10.1109/TGRS.2011.2151866
Mboga, N., Persello, C., Bergado, J. R., & Stein, A. (2017). Detection of informal settlements from VHR satellite images using convolutional neural networks. International Geoscience and Remote Sensing Symposium (IGARSS), 2017–July, 5169–5172. https://doi.org/10.1109/IGARSS.2017.8128166
Miles, S. B., & Chang, S. E. (2003). Urban disaster recovery: A framework and simulation model. Washington. Retrieved from http://mceer.buffalo.edu/pdf/report/03-0005.pdf
Miyazaki, H., Nagai, M., & Shibasaki, R. (2015). Reviews of geospatial information technology and collaborative data delivery for disaster risk management. ISPRS International Journal of Geo-Information, 4(4), 1936–1964. https://doi.org/10.3390/ijgi4041936
Mobasheri, A., Huang, H., Degrossi, L. C., & Zipf, A. (2018). Enrichment of OpenStreetMap data completeness with sidewalk geometries using data mining techniques. Sensors (Switzerland), 18(2), 8–10. https://doi.org/10.3390/s18020509
Mountrakis, G., Im, J., & Ogole, C. (2011). Support vector machines in remote sensing: A review. ISPRS Journal of Photogrammetry and Remote Sensing, 66(3), 247–259. https://doi.org/10.1016/j.isprsjprs.2010.11.001
NDRRMC. (2014). Effects of typhoon “YOLANDA” (HAIYAN). Retrieved from http://www.ndrrmc.gov.ph/21-disaster-events/1329-situational-report-re-effects-of-typhoon-yolanda-haiyan
Neis, P., & Zielstra, D. (2014). Recent developments and future trends in Volunteered Geographic Information research: The case of OpenStreetMap. Future Internet, 6(1), 76–106. https://doi.org/10.3390/fi6010076
Oumar, Z., & Mutanga, O. (2013). Using WorldView-2 bands and indices to predict bronze bug (Thaumastocoris peregrinus) damage in plantation forests. International Journal of Remote Sensing, 34(6), 2236–2249. https://doi.org/10.1080/01431161.2012.743694
Paragas, G., Rodil, A., Urban, L. P., & Pelingon, L. (2016). Tacloban after Haiyan-working together towards recovery. Retrieved from [email protected]/theIIED
Pia Ranada. (2013). What made Tacloban so vulnerable to Haiyan? Retrieved February 25, 2019, from https://www.rappler.com/move-ph/issues/disasters/typhoon-yolanda/43712-tacloban-assessment
Platt, S., Brown, D., & Hughes, M. (2016). Measuring resilience and recovery. International Journal of Disaster Risk Reduction, 19(May), 447–460. https://doi.org/10.1016/j.ijdrr.2016.05.006

67
Rathfon, D., Davidson, R., Bevington, J., Vicini, A., & Hill, A. (2013). Quantitative assessment of post-disaster housing recovery: a case study of Punta Gorda, Florida, after Hurricane Charley. Disasters, 37(2), 333–355. https://doi.org/10.1111/j.1467-7717.2012.01305.x
Rejaur Rahman, M., & Saha, S. K. (2008). Multi-resolution segmentation for object-based classification and accuracy assessment of land use/land cover classification using remotely sensed data. Journal of the Indian Society of Remote Sensing, 36(2), 189–201. https://doi.org/10.1007/s12524-008-0020-4
Rodriguez, H., Quarantelli, E. L. (Enrico L., & Dynes, R. R. (2007). Handbook of disaster research (2nd ed). Cham, Switzerland: Springer International Publishing AG.
Salehi, B., Zhang, Y., Zhong, M., & Dey, V. (2012). Object-based classification of urban areas using VHR imagery and height points ancillary data. Remote Sensing, 4(8), 2256–2276. https://doi.org/10.3390/rs4082256
Sheykhmousa, M. (2018). Understanding post-disaster recovery through assessment of land cover and land use changes using Remote Sensing, (ITC Thesis). University of Twente. Retrieved from https://webapps.itc.utwente.nl/librarywww/papers_2018/msc/aes/sheykhmousa.pdf
Srestasathiern, P., & Rakwatin, P. (2014). Oil palm tree detection with high resolution multi-spectral satellite imagery. Remote Sensing, 6(10), 9749–9774. https://doi.org/10.3390/rs6109749
Tacloban Recovery and Sustainable Development Group. (2014). Proposed Tacloban Recovery and Rehabilitation. Retrieved from https://logcluster.org/sites/default/files/trrp_updated_mar_21_public_forum.pdf
Takagi, H., & Esteban, M. (2016). Statistics of tropical cyclone landfalls in the Philippines: unusual characteristics of 2013 Typhoon Haiyan. Natural Hazards, 80(1), 211–222. https://doi.org/10.1007/s11069-015-1965-6
Takagi, H., Esteban, M., Shibayama, T., Mikami, T., Matsumaru, R., De Leon, M., … Nakamura, R. (2017). Track analysis, simulation, and field survey of the 2013 Typhoon Haiyan storm surge. Journal of Flood Risk Management, 10(1), 42–52. https://doi.org/10.1111/jfr3.12136
Takahashi, B., Tandoc, E. C., & Carmichael, C. (2015). Communicating on twitter during a disaster: An analysis of tweets during Typhoon Haiyan in the Philippines. Computers in Human Behavior, 50, 392–398. https://doi.org/10.1016/j.chb.2015.04.020
Tang, C., Van Westen, C. J., Tanyas, H., & Jetten, V. G. (2016). Analysing post-earthquake landslide activity using multi-temporal landslide inventories near the epicentral area of the 2008 Wenchuan earthquake. Natural Hazards and Earth System Sciences, 16(12), 2641–2655. https://doi.org/10.5194/nhess-16-2641-2016
Thomas Maresca. (2017). Four years after killer typhoon, Filipinos are still picking up the pieces. Retrieved from https://eu.usatoday.com/story/news/world/2017/08/09/super-typhoon-haiyan-4-years-later/525374001/
Townshend, J., Justice, C., Li, W., McManus, J., & Gurney, C. (1991). Global land cover classification by Remote Sensing: present capabilities and future possibilities. Remote Sensing of Environment, 35(2–3), 243–255. https://doi.org/10.1016/0034-4257(91)90016-Y
Trimble Germany GmbH. (2016). eCognition ® Developer user guide, (March), 1–267. https://doi.org/10.1525/hlq.2011.74.1.43
UNDP. (2011). Methodological guide for post-disaster recovery planning processes. United Nations Devleopment Program. Switzerland. Retrieved from https://www.preventionweb.net/publications/view/32306
UNISDR. (2009). Terminology on disaster risk reduction. Retrieved from www.preventionweb.net UNISDR. (2015). Sendai framework for disaster risk reduction. Retrieved June 7, 2018, from
https://www.unisdr.org/we/coordinate/sendai-framework Vapnik, V. N. (1999). An overview of statistical learning theory. IEEE Transactions on Neural Networks,
10(5), 988–999. https://doi.org/10.1109/72.788640 Veljanovski, T., Kanjir, U., & Oštir, K. (2011). Object-based image analysis of remote sensing data.
Geodetski Vestnik, 55(4), 665–688. Verburg, P. H., van de Steeg, J., Veldkamp, A., & Willemen, L. (2009). From land cover change to land
function dynamics: A major challenge to improve land characterization. Journal of Environmental Management, 90(3), 1327–1335. https://doi.org/10.1016/j.jenvman.2008.08.005
Vetrivel, A. (2018). Automatic information extraction from remote sensing images and 3D point clouds for building damage assessment. Univesity of Twente. https://doi.org/10.3990/1.9789036545075
Wang, Z., & Zipf, A. (2017). Using OpenStreetMap data to generate building models with their inner structures for 3D maps. ISPRS Annals of the Photogrammetry, Remote Sensing and Spatial Information Sciences, 4(2W4), 411–416. https://doi.org/10.5194/isprs-annals-IV-2-W4-411-2017

68
Westrope, C., Banick, R., & Levine, M. (2014). Groundtruthing OpenStreetMap building damage assessment. Procedia Engineering, 78, 29–39. https://doi.org/10.1016/j.proeng.2014.07.035
Wolf, M. A. (2012). Using WorldView 2 Vis-NIR MSI imagery to support land mapping and feature extraction using normalized difference index ratios. In Proceedings of SPIE - The International Society for Optical Engineering. Baltimore, Maryland, United States. https://doi.org/10.1117/12.917717
Yan, Y., Eckle, M., Kuo, C., Herfort, B., & Fan, H. (2017). Monitoring and assessing post-disaster tourism recovery using geotagged social media data. ISPRS International Journal of Geo-Information, 6(5), 144. https://doi.org/10.3390/ijgi6050144
Zhang, X., Cui, J., Wang, W., & Lin, C. (2017). A study for texture feature extraction of high-resolution satellite images based on a direction measure and gray level co-occurrence matrix fusion algorithm. Sensors (Switzerland), 17(7). https://doi.org/10.3390/s17071474
Zhu, H., Cai, L., Liu, H., & Huang, W. (2016). Information extraction of high resolution Remote Sensing images based on the calculation of optimal segmentation parameters. https://doi.org/10.1371/journal.pone.0158585
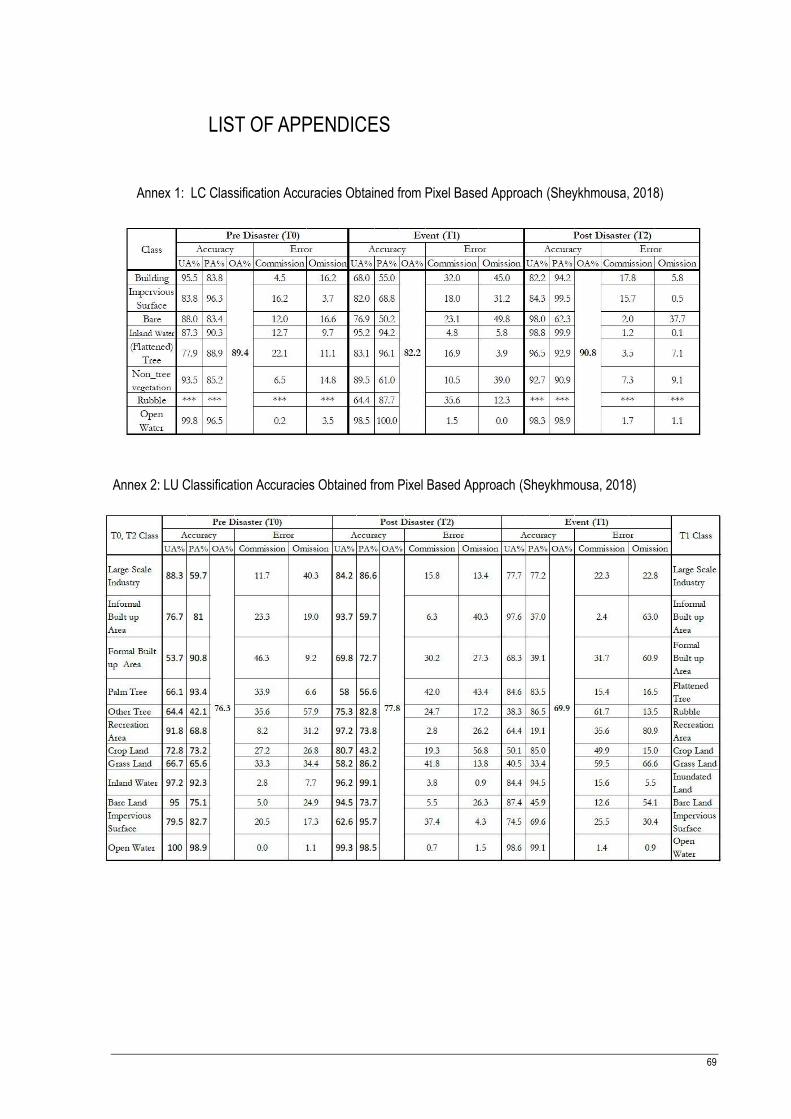
69
LIST OF APPENDICES
Annex 1: LC Classification Accuracies Obtained from Pixel Based Approach (Sheykhmousa, 2018)
Annex 2: LU Classification Accuracies Obtained from Pixel Based Approach (Sheykhmousa, 2018)