integrating natural infrastructure into urban coastal ... | integrating natural infrastructure into...
TRANSCRIPT
IntegratIng natural Infrastructure Into
urban coastal resIlIence
Howard Beach, QueensDecember 2013
1
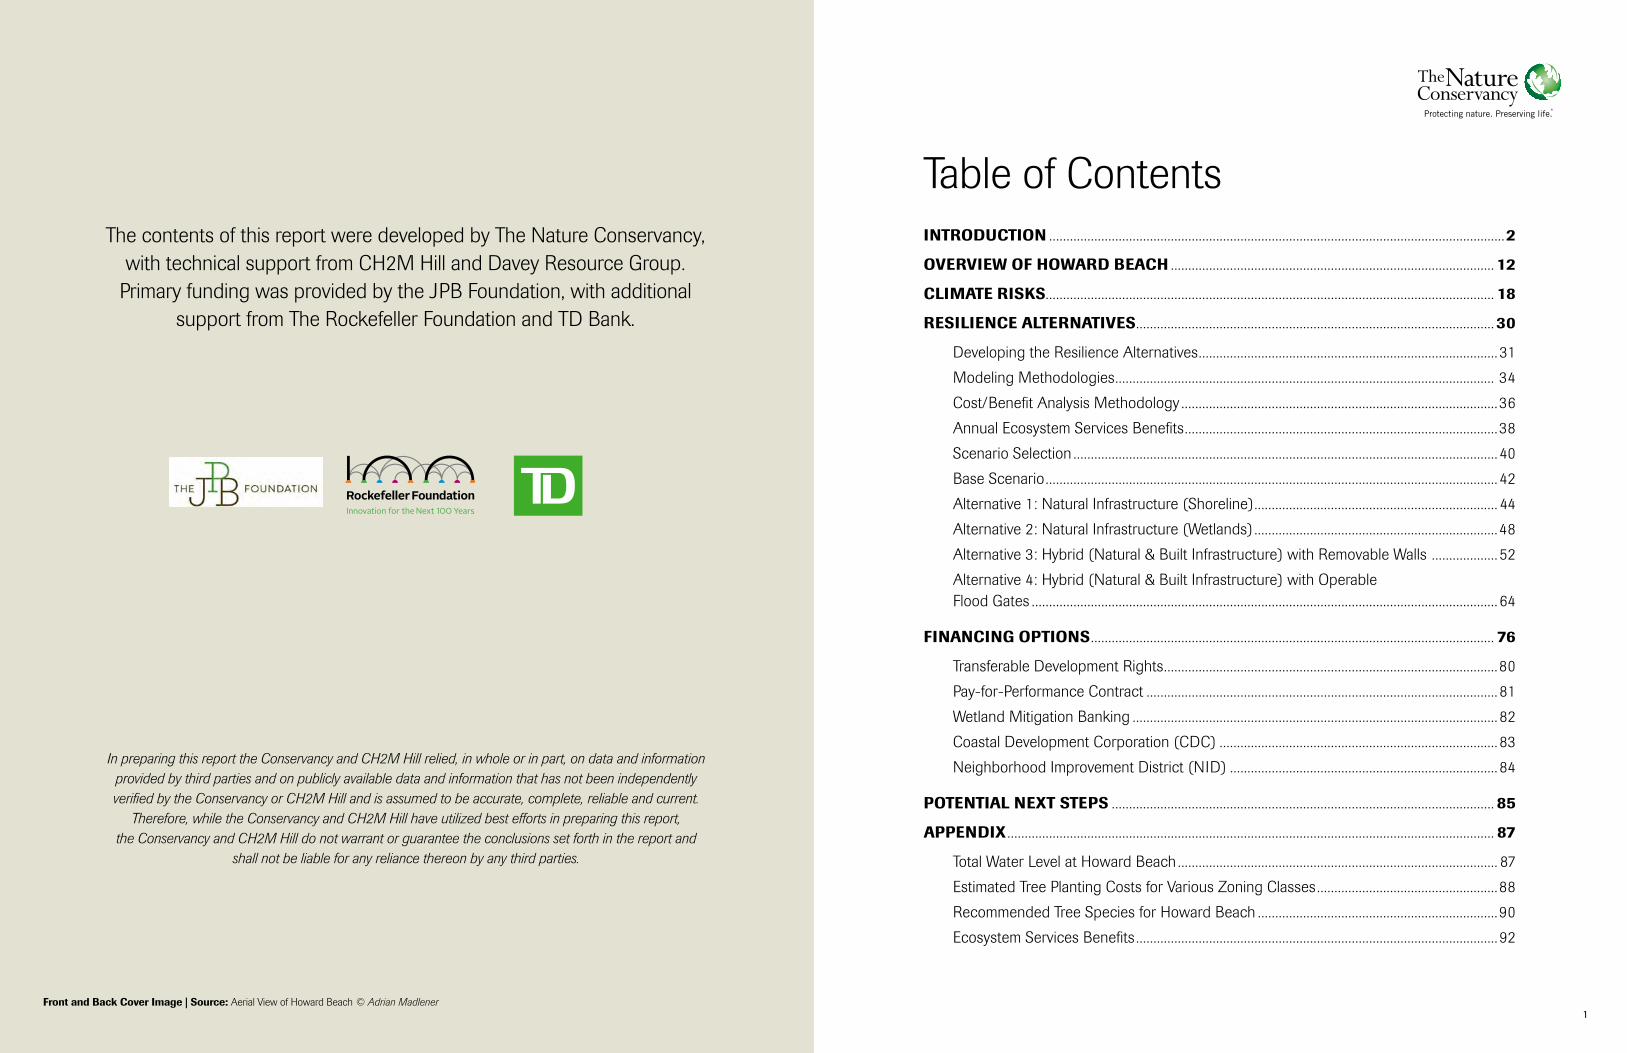
The contents of this report were developed by The Nature Conservancy, with technical support from CH2M Hill and Davey Resource Group.
Primary funding was provided by the JPB Foundation, with additional support from The Rockefeller Foundation and TD Bank.
Table of ContentsIntroductIon ...................................................................................................................................2
overvIew of Howard beacH ............................................................................................. 12
clImate rIsks................................................................................................................................. 18
resIlIence alternatIves ....................................................................................................... 30
Developing the Resilience Alternatives ...................................................................................... 31
Modeling Methodologies ............................................................................................................. 34
Cost/Benefit Analysis Methodology ...........................................................................................36
Annual Ecosystem Services Benefits ..........................................................................................38
Scenario Selection .......................................................................................................................... 40
Base Scenario .................................................................................................................................. 42
Alternative 1: Natural Infrastructure (Shoreline) ...................................................................... 44
Alternative 2: Natural Infrastructure (Wetlands) ......................................................................48
Alternative 3: Hybrid (Natural & Built Infrastructure) with Removable Walls ................... 52
Alternative 4: Hybrid (Natural & Built Infrastructure) with Operable Flood Gates ...................................................................................................................................... 64
fInancIng optIons .................................................................................................................... 76
Transferable Development Rights ................................................................................................80
Pay-for-Performance Contract ..................................................................................................... 81
Wetland Mitigation Banking ......................................................................................................... 82
Coastal Development Corporation (CDC) ................................................................................ 83
Neighborhood Improvement District (NID) ............................................................................. 84
potentIal next steps .............................................................................................................. 85
appendIx ............................................................................................................................................ 87
Total Water Level at Howard Beach ............................................................................................ 87
Estimated Tree Planting Costs for Various Zoning Classes ....................................................88
Recommended Tree Species for Howard Beach .....................................................................90
Ecosystem Services Benefits ........................................................................................................ 92
Add Rockefeller Logo
front and back cover Image | source: Aerial View of Howard Beach © Adrian Madlener
In preparing this report the Conservancy and CH2M Hill relied, in whole or in part, on data and information provided by third parties and on publicly available data and information that has not been independently verified by the Conservancy or CH2M Hill and is assumed to be accurate, complete, reliable and current.
Therefore, while the Conservancy and CH2M Hill have utilized best efforts in preparing this report, the Conservancy and CH2M Hill do not warrant or guarantee the conclusions set forth in the report and
shall not be liable for any reliance thereon by any third parties.
2 | Integrating natural Infrastructure into urban coastal resilience Howard Beach, Queens, December 2013 3
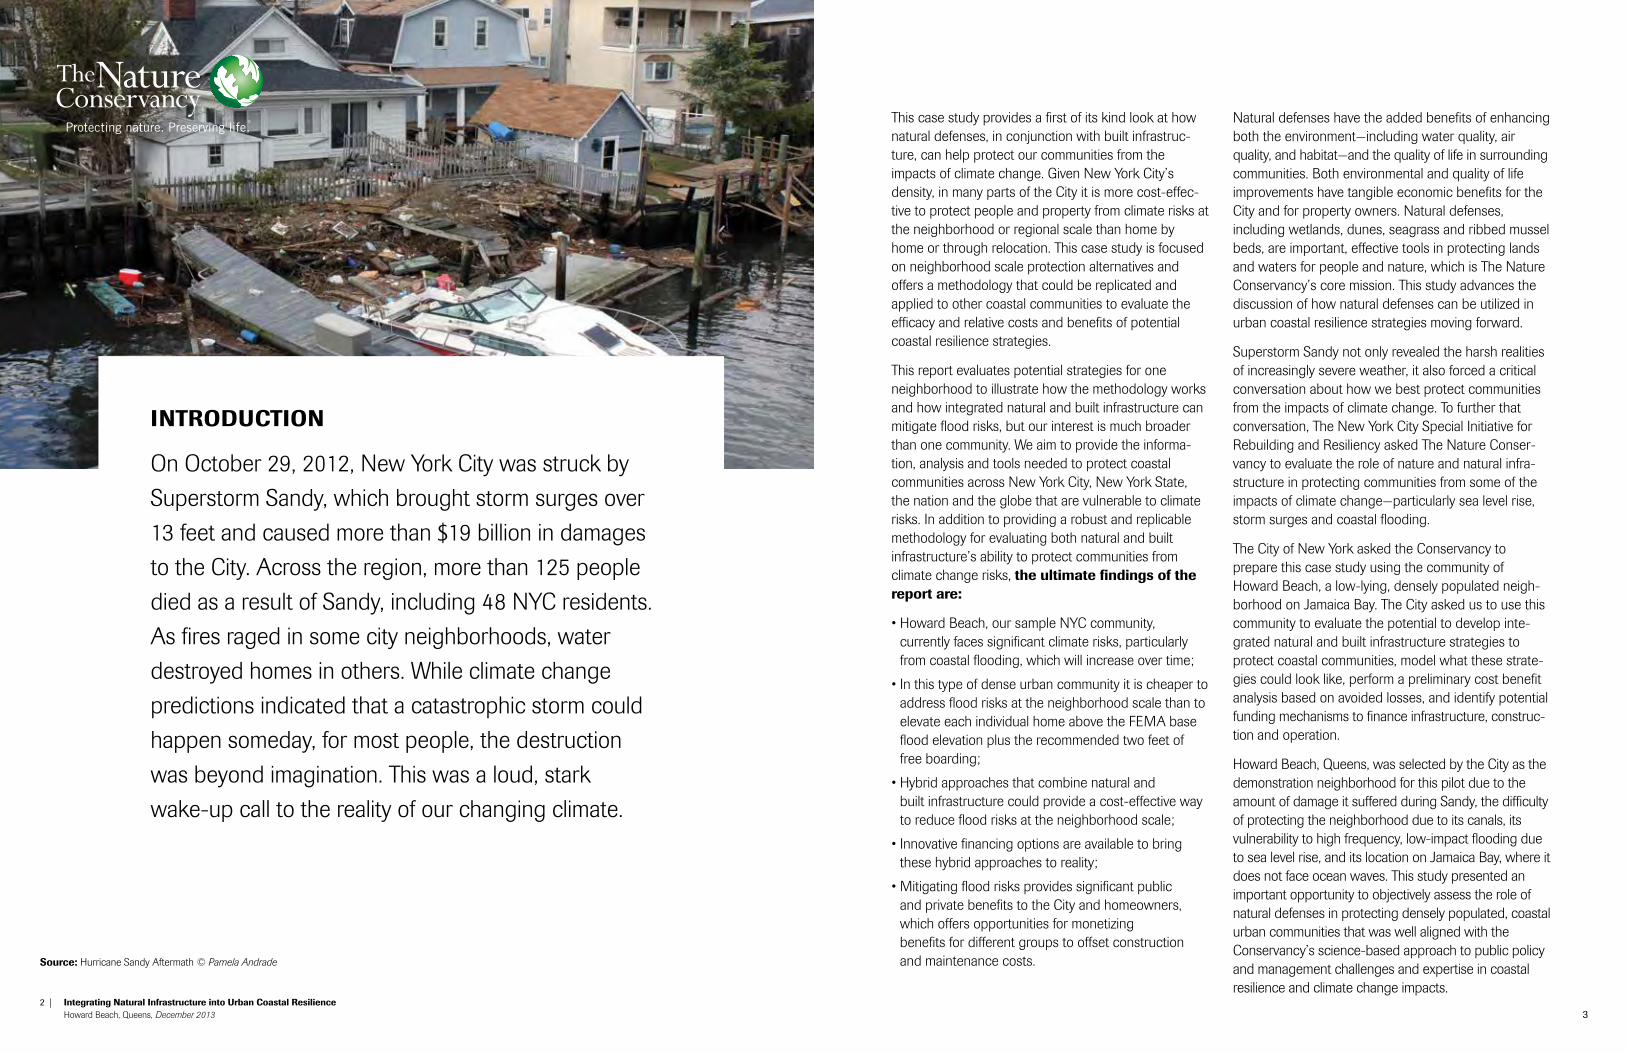
IntroductIon
On October 29, 2012, New York City was struck by
Superstorm Sandy, which brought storm surges over
13 feet and caused more than $19 billion in damages
to the City. Across the region, more than 125 people
died as a result of Sandy, including 48 NYC residents.
As fires raged in some city neighborhoods, water
destroyed homes in others. While climate change
predictions indicated that a catastrophic storm could
happen someday, for most people, the destruction
was beyond imagination. This was a loud, stark
wake-up call to the reality of our changing climate.
This case study provides a first of its kind look at how natural defenses, in conjunction with built infrastruc-ture, can help protect our communities from the impacts of climate change. Given New York City’s density, in many parts of the City it is more cost-effec-tive to protect people and property from climate risks at the neighborhood or regional scale than home by home or through relocation. This case study is focused on neighborhood scale protection alternatives and offers a methodology that could be replicated and applied to other coastal communities to evaluate the efficacy and relative costs and benefits of potential coastal resilience strategies.
This report evaluates potential strategies for one neighborhood to illustrate how the methodology works and how integrated natural and built infrastructure can mitigate flood risks, but our interest is much broader than one community. We aim to provide the informa-tion, analysis and tools needed to protect coastal communities across New York City, New York State, the nation and the globe that are vulnerable to climate risks. In addition to providing a robust and replicable methodology for evaluating both natural and built infrastructure’s ability to protect communities from climate change risks, the ultimate findings of the report are:
• Howard Beach, our sample NYC community, currently faces significant climate risks, particularly from coastal flooding, which will increase over time;
• In this type of dense urban community it is cheaper to address flood risks at the neighborhood scale than to elevate each individual home above the FEMA base flood elevation plus the recommended two feet of free boarding;
• Hybrid approaches that combine natural and built infrastructure could provide a cost-effective way to reduce flood risks at the neighborhood scale;
• Innovative financing options are available to bring these hybrid approaches to reality;
• Mitigating flood risks provides significant public and private benefits to the City and homeowners, which offers opportunities for monetizing benefits for different groups to offset construction and maintenance costs.
Natural defenses have the added benefits of enhancing both the environment—including water quality, air quality, and habitat—and the quality of life in surrounding communities. Both environmental and quality of life improvements have tangible economic benefits for the City and for property owners. Natural defenses, including wetlands, dunes, seagrass and ribbed mussel beds, are important, effective tools in protecting lands and waters for people and nature, which is The Nature Conservancy’s core mission. This study advances the discussion of how natural defenses can be utilized in urban coastal resilience strategies moving forward.
Superstorm Sandy not only revealed the harsh realities of increasingly severe weather, it also forced a critical conversation about how we best protect communities from the impacts of climate change. To further that conversation, The New York City Special Initiative for Rebuilding and Resiliency asked The Nature Conser-vancy to evaluate the role of nature and natural infra-structure in protecting communities from some of the impacts of climate change—particularly sea level rise, storm surges and coastal flooding.
The City of New York asked the Conservancy to prepare this case study using the community of Howard Beach, a low-lying, densely populated neigh-borhood on Jamaica Bay. The City asked us to use this community to evaluate the potential to develop inte-grated natural and built infrastructure strategies to protect coastal communities, model what these strate-gies could look like, perform a preliminary cost benefit analysis based on avoided losses, and identify potential funding mechanisms to finance infrastructure, construc-tion and operation.
Howard Beach, Queens, was selected by the City as the demonstration neighborhood for this pilot due to the amount of damage it suffered during Sandy, the difficulty of protecting the neighborhood due to its canals, its vulnerability to high frequency, low-impact flooding due to sea level rise, and its location on Jamaica Bay, where it does not face ocean waves. This study presented an important opportunity to objectively assess the role of natural defenses in protecting densely populated, coastal urban communities that was well aligned with the Conservancy’s science-based approach to public policy and management challenges and expertise in coastal resilience and climate change impacts.
source: Hurricane Sandy Aftermath © Pamela Andrade
4 | Integrating natural Infrastructure into urban coastal resilience Howard Beach, Queens, December 2013 5
To conduct this analysis we retained CH2M Hill, a global engineering firm with expertise in coastal engineering, to complement our expertise in natural infrastructure. This study demonstrates that natural infrastructure is a crucial part of addressing climate change impacts on coastal communities—including those in urban areas. It also provides a foundation for additional work.
The resilience strategies evaluated in this report do not represent the only strategies that could be utilized to increase the resilience of Howard Beach or other coastal communities. Rather, they represent an initial attempt to create a suite of representative coastal protection options for an urban neighborhood to help the City and the Conservancy understand the costs and benefits of neighborhood-scale coastal protection utilizing natural and conventional defenses.
It should be noted that since we conducted the analysis, new information and flood maps were pro-duced by FEMA, which may have an impact on our final cost-benefit calculations. Our methodology was created to further assessment and evaluation as updated information and data becomes available in this rapidly evolving field. Additionally, while this report explores a set of alternatives, it does not recommend a specific course of action. Any specific actions would require further analysis in accordance with applicable funding and other requirements and need to be compatible with the region’s other restoration and redevelopment plans.
In this study we offer possible infrastructure solutions that address the challenges that Howard Beach faces in order to (a) further the dialogue around coastal resilience and finance, and (b) ultimately advance better management practices, risk reduction initiatives and policy choices for similar communities. This report details the background on the study and its connection to City initiatives, the scope of work, our methods, the solution suites, analyses of the efficacy of the alterna-tives and their cost/benefit ratios, and potential financing options. Our estimates of the benefits of both natural and hybrid approaches are conservative and should be viewed as a starting point, as we do not fully quantify all the benefits. Ultimately, we see these alternatives providing more value than indicated in this preliminary report.
We do recommend further study and action steps, some of which we are conducting as part of our ongoing work on coastal resilience and urban conser-vation, and others that will need to be conducted by the appropriate agencies and community organizations.
recommended next steps include:
• Evaluate the efficacy and benefits of the proposed strategies during more frequent, less intense storms and other climate change scenarios;
• Evaluate water quality and other ecological impacts of the proposed strategies;
• Conduct a robust ecosystem services analysis of the options to create a more complete picture of benefits;
• Consider an analysis of built infrastructure only strategies;
• Evaluate the social impacts of the proposed strategies;
• Analyze the benefits of the proposed strategies for neighboring communities and upland areas;
• Conduct a robust community information and input process to inform comprehensive decisions about resilience solutions, planning, policies and practices;
• Conduct a 30 year return on investment analysis on the proposed strategies.
Using nature and natural infrastructure in conjunction with built infrastructure to make the City more resilient in the face of climate change is critical to the future of people living in its 520 miles of coastal communities. Protecting, rebuilding and restoring wetlands, dunes, seagrass and trees can help safeguard coastal commu-nities by slowing waves, reducing storm surges, preventing erosion and absorbing rain, while providing other important quality of life and environmental benefits. These natural assets create an insurance policy for the future—they are nature’s cushion against rising sea levels and storm surge, and they remove pollution from the millions of gallons of freshwater that flow into our oceans each minute.
The Conservancy’s coastal restoration and protection strategy aims to preserve and enhance these natural-systems and ensure they continue to deliver critical protection for our coastal cities. The Conservancy’s urban strategy advances natural infrastructure as a
critical asset for coastal defense. This report demon-strates that natural infrastructure can and should be considered side by side with built infrastructure in evaluating sustainable solutions for protecting our coastal cities from the impacts of climate change.
Scope of workWhile Superstorm Sandy was the impetus for this report, our charge was not to model the impacts of Sandy or to develop strategies to mitigate the damage caused by a similar storm. Rather, our goal was to evaluate the current and future climate risks facing Howard Beach as a sample community, with an emphasis on coastal flooding, and demonstrate the potential role and value of an integrated suite of strategies that include natural and built infrastructure.
To accomplish this, we developed four suites of strategies (“Alternatives”) containing natural and built infrastructure elements, and modeled their ability to mitigate damage caused by a 1-in-10, 1-in-25, and 1-in-100 year storm. Two of these alternatives were further modeled for risk reduction capacity using sea level rise projections (12 and 32 inches), to determine how their protective capacity would change over the next 40 years. Flood levels and sea level rise projections were based on analysis conducted by FEMA and the New York City Panel on Climate Change. These strategies do not represent the entire universe of potential options. Rather, they were selected to illustrate how a hybrid approach could be appropriately evaluated and analyzed.
Estimated losses were calculated using HAZUS, a software tool developed by FEMA that does not include infrastructure damage in its projections.
As a result, economic loss estimates are limited to building damage, vehicle losses and business inter-ruption—outputs that are calculated by HAZUS. Impacts to public infrastructure are likely to be significant during 1-in-100 year storms, which would increase the cost benefit ratio for many of the scenarios analyzed in this report.
In addition, only limited operation and maintenance costs for our proposed coastal resilience strategies were used for this analysis. More robust annual costs need to be factored into each scenario to develop a complete return on investment (ROI) analysis over the lifespan of the infrastructure.
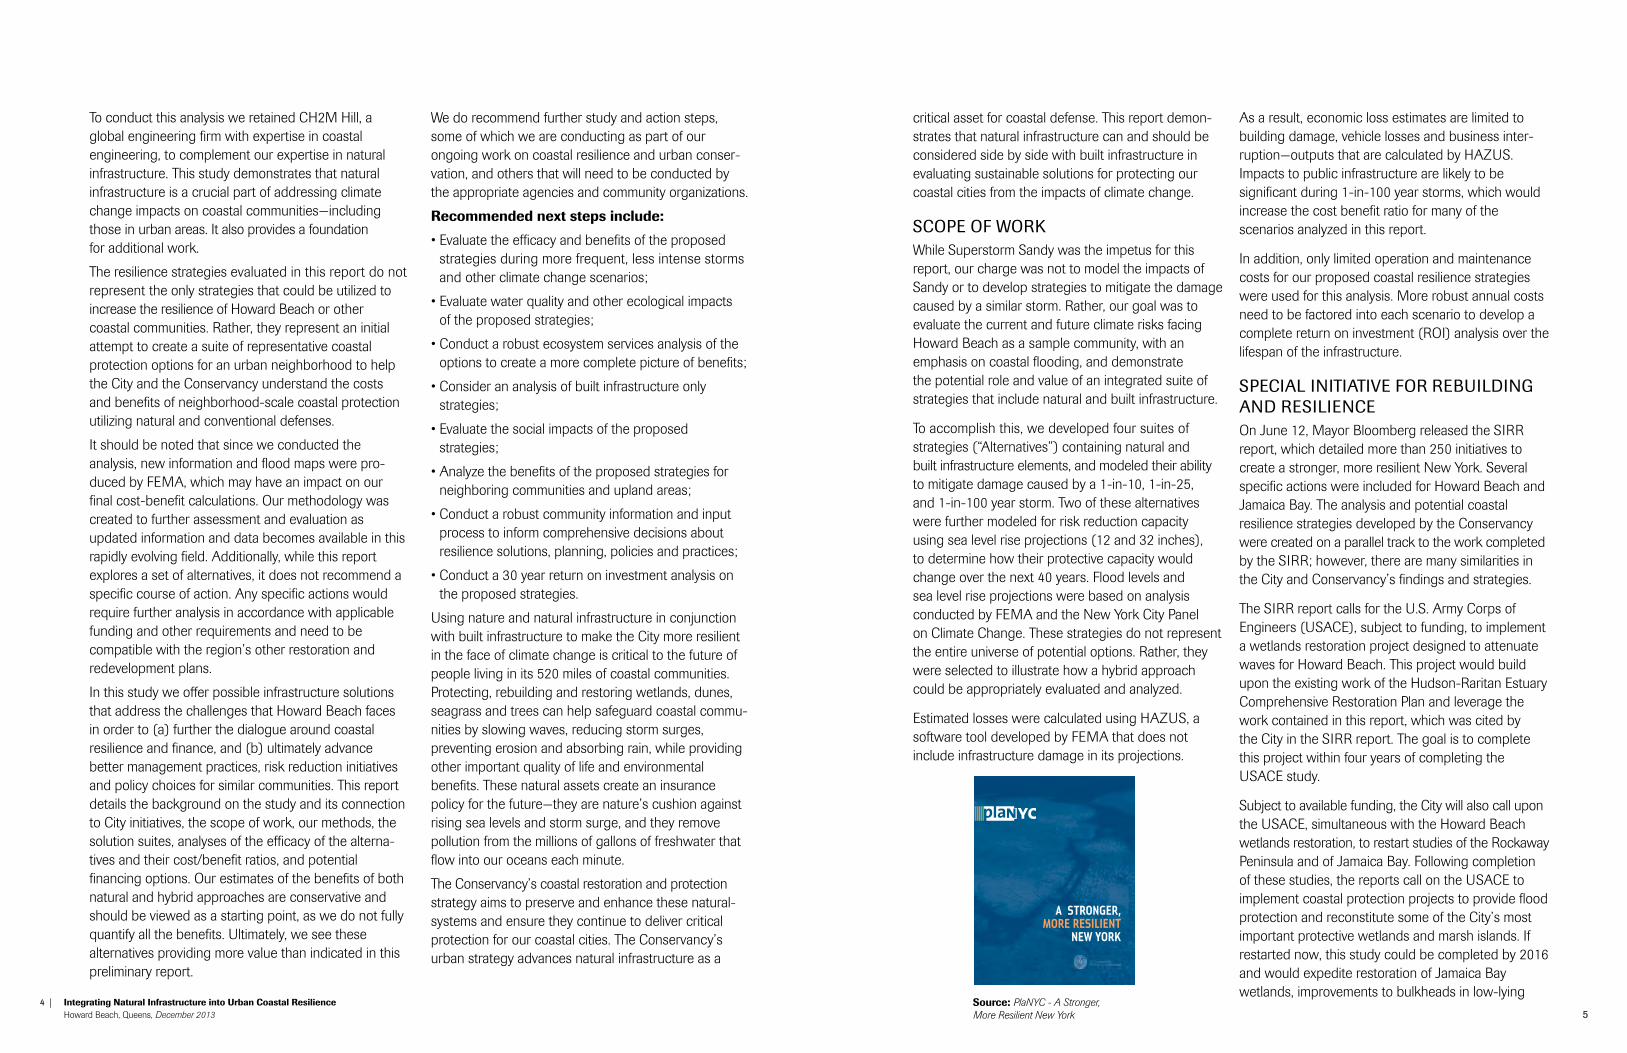
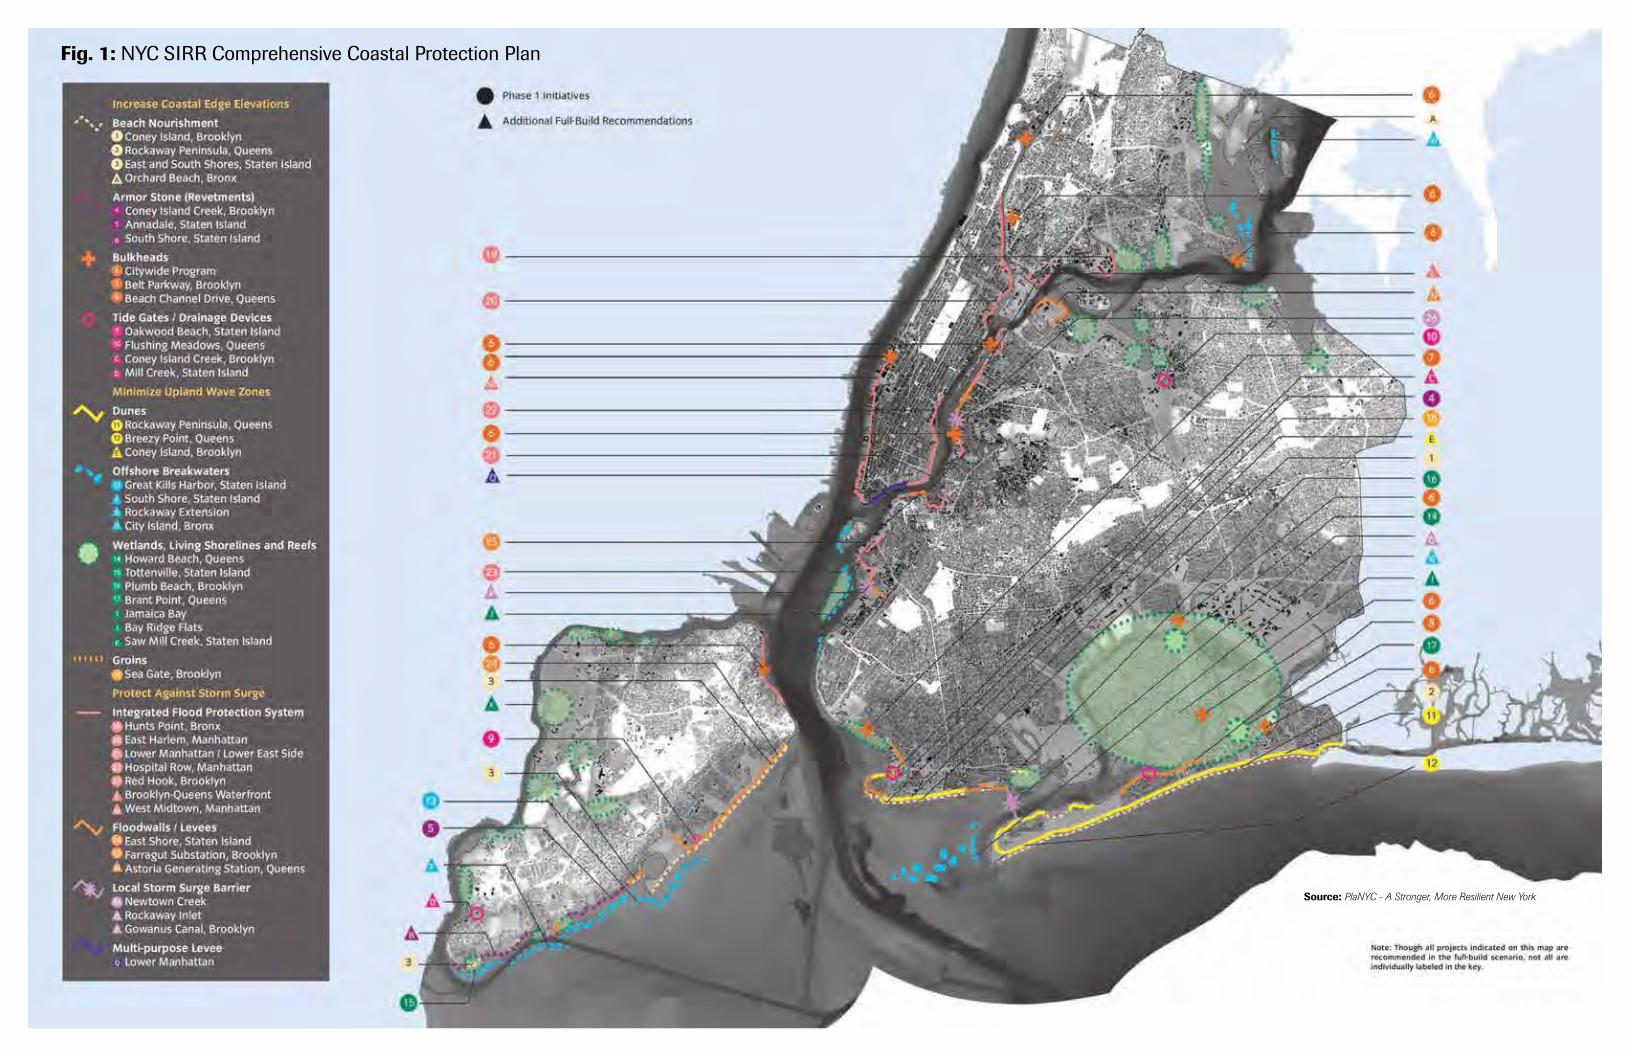
Special initiative for rebuilding and reSilienceOn June 12, Mayor Bloomberg released the SIRR report, which detailed more than 250 initiatives to create a stronger, more resilient New York. Several specific actions were included for Howard Beach and Jamaica Bay. The analysis and potential coastal resilience strategies developed by the Conservancy were created on a parallel track to the work completed by the SIRR; however, there are many similarities in the City and Conservancy’s findings and strategies.
The SIRR report calls for the U.S. Army Corps of Engineers (USACE), subject to funding, to implement a wetlands restoration project designed to attenuate waves for Howard Beach. This project would build upon the existing work of the Hudson-Raritan Estuary Comprehensive Restoration Plan and leverage the work contained in this report, which was cited by the City in the SIRR report. The goal is to complete this project within four years of completing the USACE study.
Subject to available funding, the City will also call upon the USACE, simultaneous with the Howard Beach wetlands restoration, to restart studies of the Rockaway Peninsula and of Jamaica Bay. Following completion of these studies, the reports call on the USACE to implement coastal protection projects to provide flood protection and reconstitute some of the City’s most important protective wetlands and marsh islands. If restarted now, this study could be completed by 2016 and would expedite restoration of Jamaica Bay wetlands, improvements to bulkheads in low-lying
A STRONGER, MORE RESILIENT
NEW YORK
source: PlaNYC - A Stronger, More Resilient New York
7
source: PlaNYC - A Stronger, More Resilient New York
fig. 1: nYc Sirr comprehensive coastal protection plan
8 | Integrating natural Infrastructure into urban coastal resilience Howard Beach, Queens, December 2013
neighborhoods and implementation of a local storm surge barrier for Rockaway Inlet.
In addition to restoring wetlands, the SIRR Report recommends that the City, subject to funding, raise bulkheads and other shoreline structures to minimize the risk of regular flooding in targeted neighborhoods including Howard Beach and the bayside of the Rockaway Peninsula, Broad Channel in Queens, West Midtown in Manhattan, Locust Point in the Bronx, Greenpoint in Brooklyn, the North Shore of Staten Island, and other low-lying locations.
As this report was going to press, New York State announced an ambitious Jamaica Bay restoration plan designed to provide natural protective functions to Howard Beach by implementing an innovative resilien-cy project on a 150 acre span along Spring Creek and Jamaica Bay. This commitment goes well beyond the natural infrastructure options evaluated in this report, and represents a significant and valuable investment by the state in using natural systems effectively to protect communities and provide other benefits.
The Conservancy has been asked to continue to work with the City to increase the resilience of coastal communities, with a near-term focus on Jamaica Bay.
keY findingSHoward beach currently faces significant climate risks, particularly from coastal flooding, which will increase over time.
• Howard Beach faces significant flood risks. The current 1-in-25 year storm causes $30 million in losses. The current 1-in-100 year storm is estimated to result in $494 million in losses.
• An increase in sea levels of 32 inches will double the estimated losses associated with a 1-in-100 year storm to $1 billion.
preliminary analyses indicate that integrated natural and built infrastructure could be a cost-effective solution for reducing flood risks.
• In this area, it is more cost-effective to address flood risks at the neighborhood scale than to elevate each individual home above the FEMA base flood elevation plus the recommended 2 feet of free boarding. The total estimated cost of elevating each individual home is more than $700 million (approximately $125,000 per home)—a figure 2.5 times greater than the most expensive alternative identified in this report.
• The natural infrastructure options alone (Alterna-tives 1 and 2) that are evaluated in this report cannot protect Howard Beach from major flood events given the existing urban conditions and flood risks.
• Hybrid strategies (Alternatives 3 and 4) that integrate natural and built infrastructure (e.g., sea walls and sea gates) can offer significant protection from high frequency, low impact flood events and the current 1-in-100 year storm.
• Alternatives 3 and 4 result in anticipated avoided losses from the current 1-in-100 year storm of $348 million and $466 million, respectively. This includes between $300-$400 million in avoided building damage.
• The natural infrastructure elements of Alternatives 3 and 4 likely lengthen the life and reduce annual maintenance costs of Spring Creek Park and its protective berms through the reduction of wave energy and erosion. In addition, having properties adjacent to parkland as opposed to sea walls is likely to result in an increase in property values.
opportunities exist to spread the cost of adaptation actions among those who benefit from increased resilience and avoided losses.
• Mitigating flood risks provides significant public and private benefits to the City and homeowners, offering opportunities to monetize benefits for different groups to offset construction and maintenance costs.
• Several types of financing mechanisms could be used to offset portions of the construction and maintenance costs associated with resilience strategies.
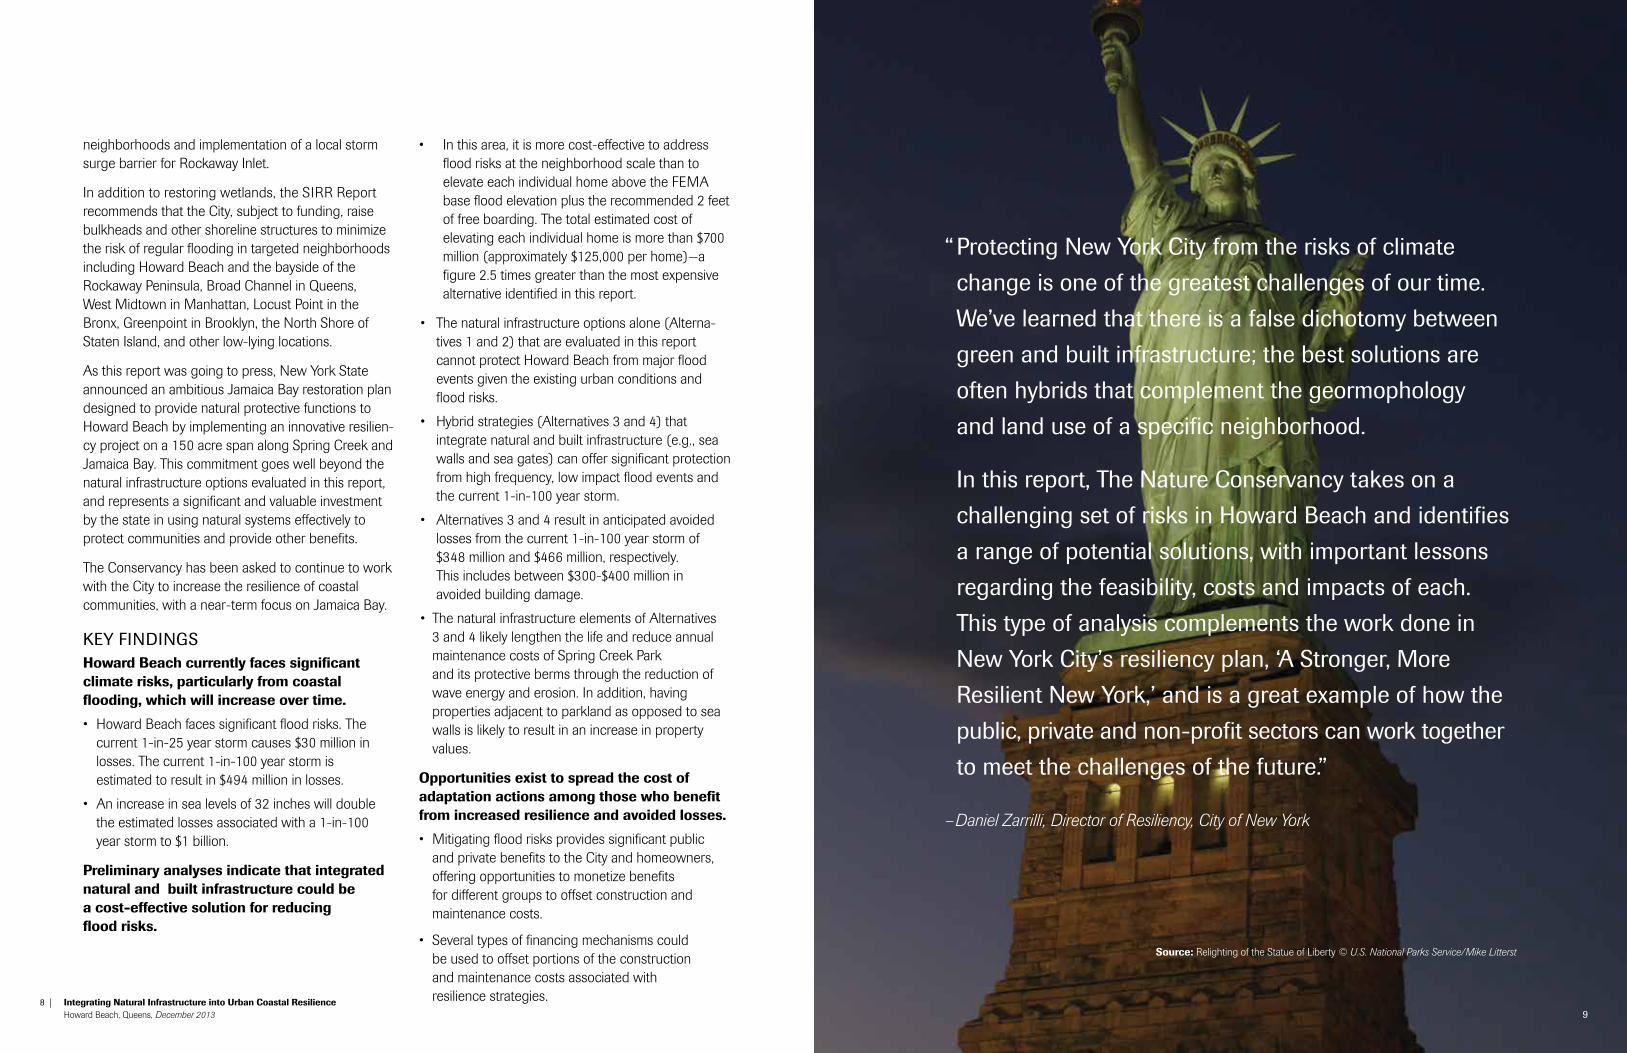
“ protecting new York city from the risks of climate
change is one of the greatest challenges of our time.
we’ve learned that there is a false dichotomy between
green and built infrastructure; the best solutions are
often hybrids that complement the geormophology
and land use of a specific neighborhood.
in this report, the nature conservancy takes on a
challenging set of risks in Howard beach and identifies
a range of potential solutions, with important lessons
regarding the feasibility, costs and impacts of each.
this type of analysis complements the work done in
new York city’s resiliency plan, ‘a Stronger, More
resilient new York,’ and is a great example of how the
public, private and non-profit sectors can work together
to meet the challenges of the future.”
–Daniel Zarrilli, Director of Resiliency, City of New York
source: Relighting of the Statue of Liberty © U.S. National Parks Service/Mike Litterst
9
10 | Integrating natural Infrastructure into urban coastal resilience Howard Beach, Queens, December 2013 11
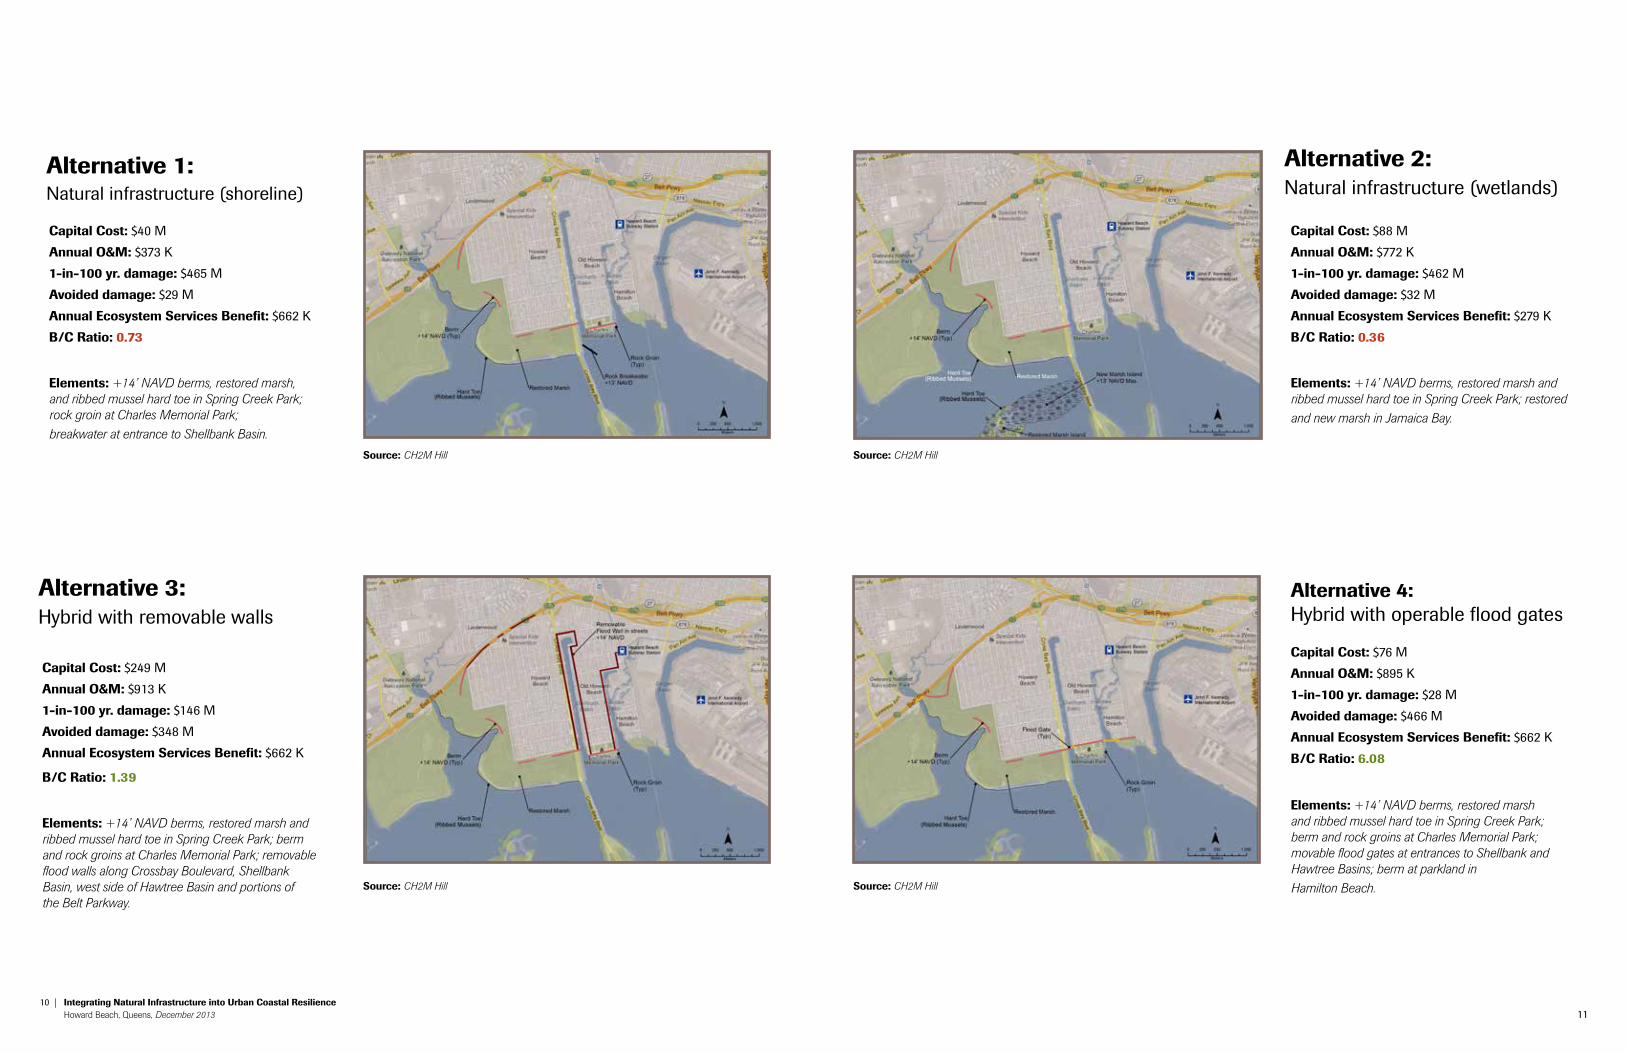
alternative 1: natural infrastructure (shoreline)
alternative 2: natural infrastructure (wetlands)
capital cost: $88 M
annual o&m: $772 k
1-in-100 yr. damage: $462 M
avoided damage: $32 M
annual ecosystem services benefit: $279 k
b/c ratio: 0.36
elements: +14’ NAVD berms, restored marsh and ribbed mussel hard toe in Spring Creek Park; restored and new marsh in Jamaica Bay.
alternative 3: Hybrid with removable walls
capital cost: $249 M
annual o&m: $913 k
1-in-100 yr. damage: $146 M
avoided damage: $348 M
annual ecosystem services benefit: $662 k
b/c ratio: 1.39
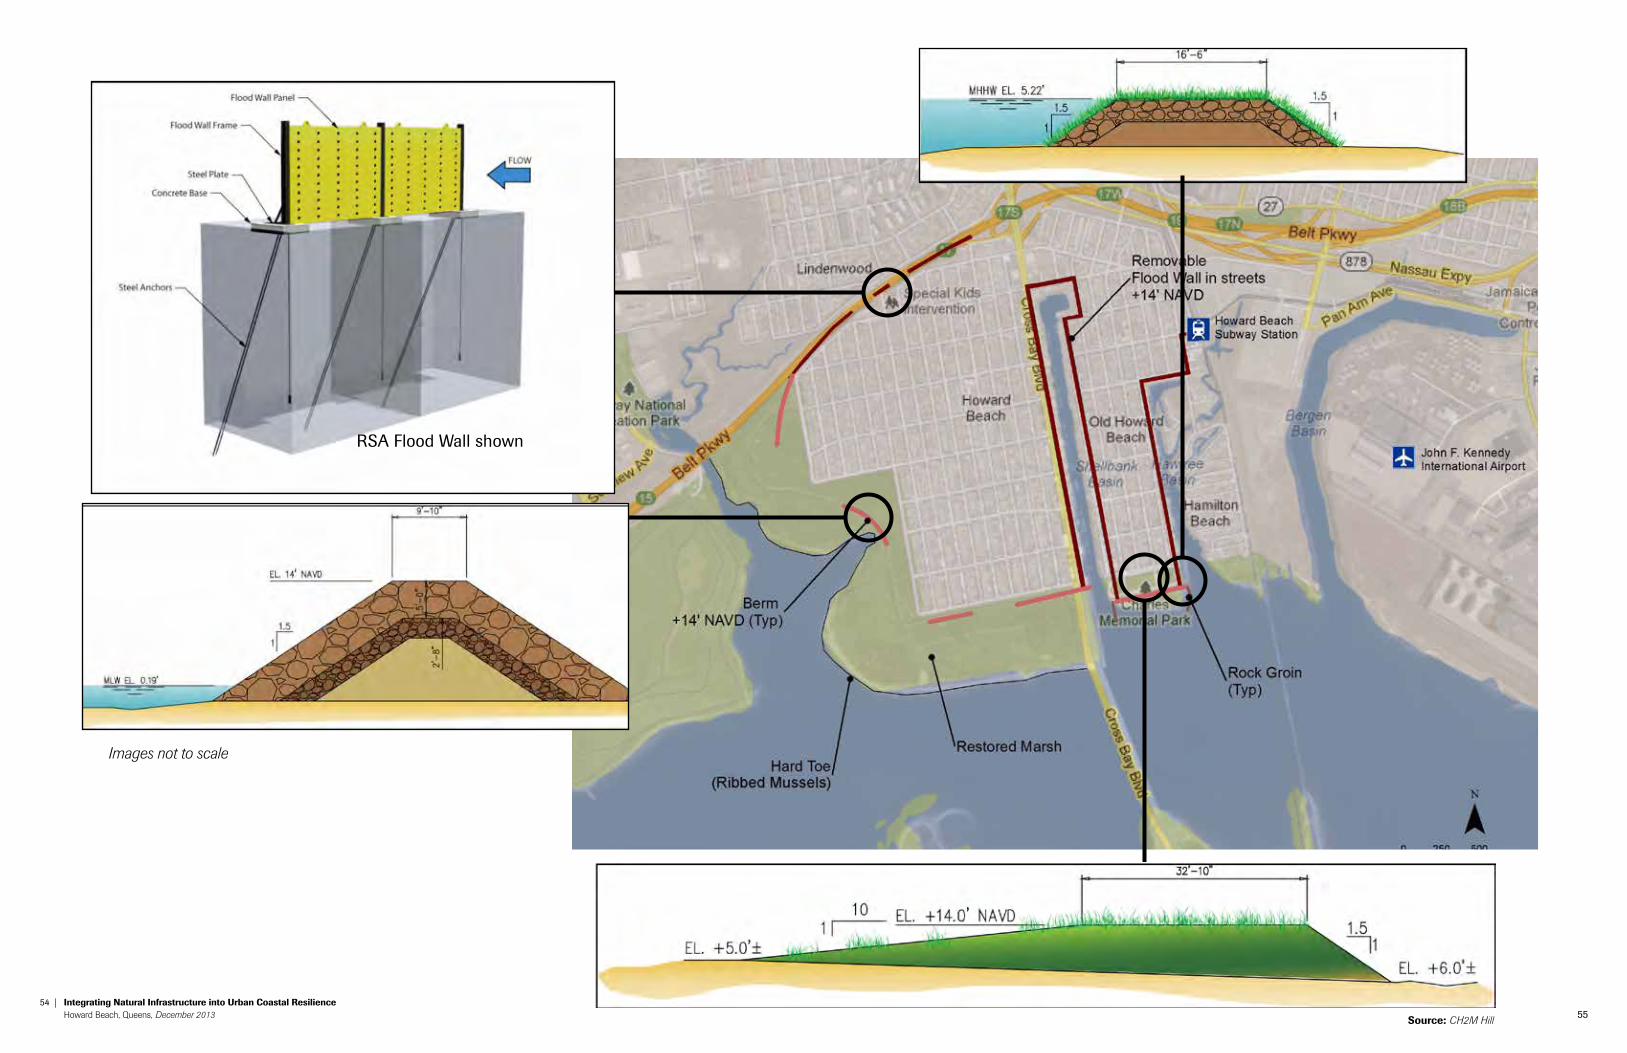
elements: +14’ NAVD berms, restored marsh and ribbed mussel hard toe in Spring Creek Park; berm and rock groins at Charles Memorial Park; removable flood walls along Crossbay Boulevard, Shellbank Basin, west side of Hawtree Basin and portions of the Belt Parkway.
alternative 4: Hybrid with operable flood gates
capital cost: $76 M
annual o&m: $895 k
1-in-100 yr. damage: $28 M
avoided damage: $466 M
annual ecosystem services benefit: $662 k
b/c ratio: 6.08
elements: +14’ NAVD berms, restored marsh and ribbed mussel hard toe in Spring Creek Park; berm and rock groins at Charles Memorial Park; movable flood gates at entrances to Shellbank and Hawtree Basins; berm at parkland in Hamilton Beach.
capital cost: $40 M
annual o&m: $373 k
1-in-100 yr. damage: $465 M
avoided damage: $29 M
annual ecosystem services benefit: $662 k
b/c ratio: 0.73
elements: +14’ NAVD berms, restored marsh, and ribbed mussel hard toe in Spring Creek Park; rock groin at Charles Memorial Park; breakwater at entrance to Shellbank Basin.
Capital Cost: $40 MAnnual O&M: $373 K1-in-100 yr. damage: $465 MAvoided damage: $29 MAnnual Ecosystem Services Benefit: $662KB/C Ratio: 0.73
source: CH2M Hill
source: CH2M Hill source: CH2M Hill
source: CH2M Hill
12 | Integrating natural Infrastructure into urban coastal resilience Howard Beach, Queens, December 2013 13
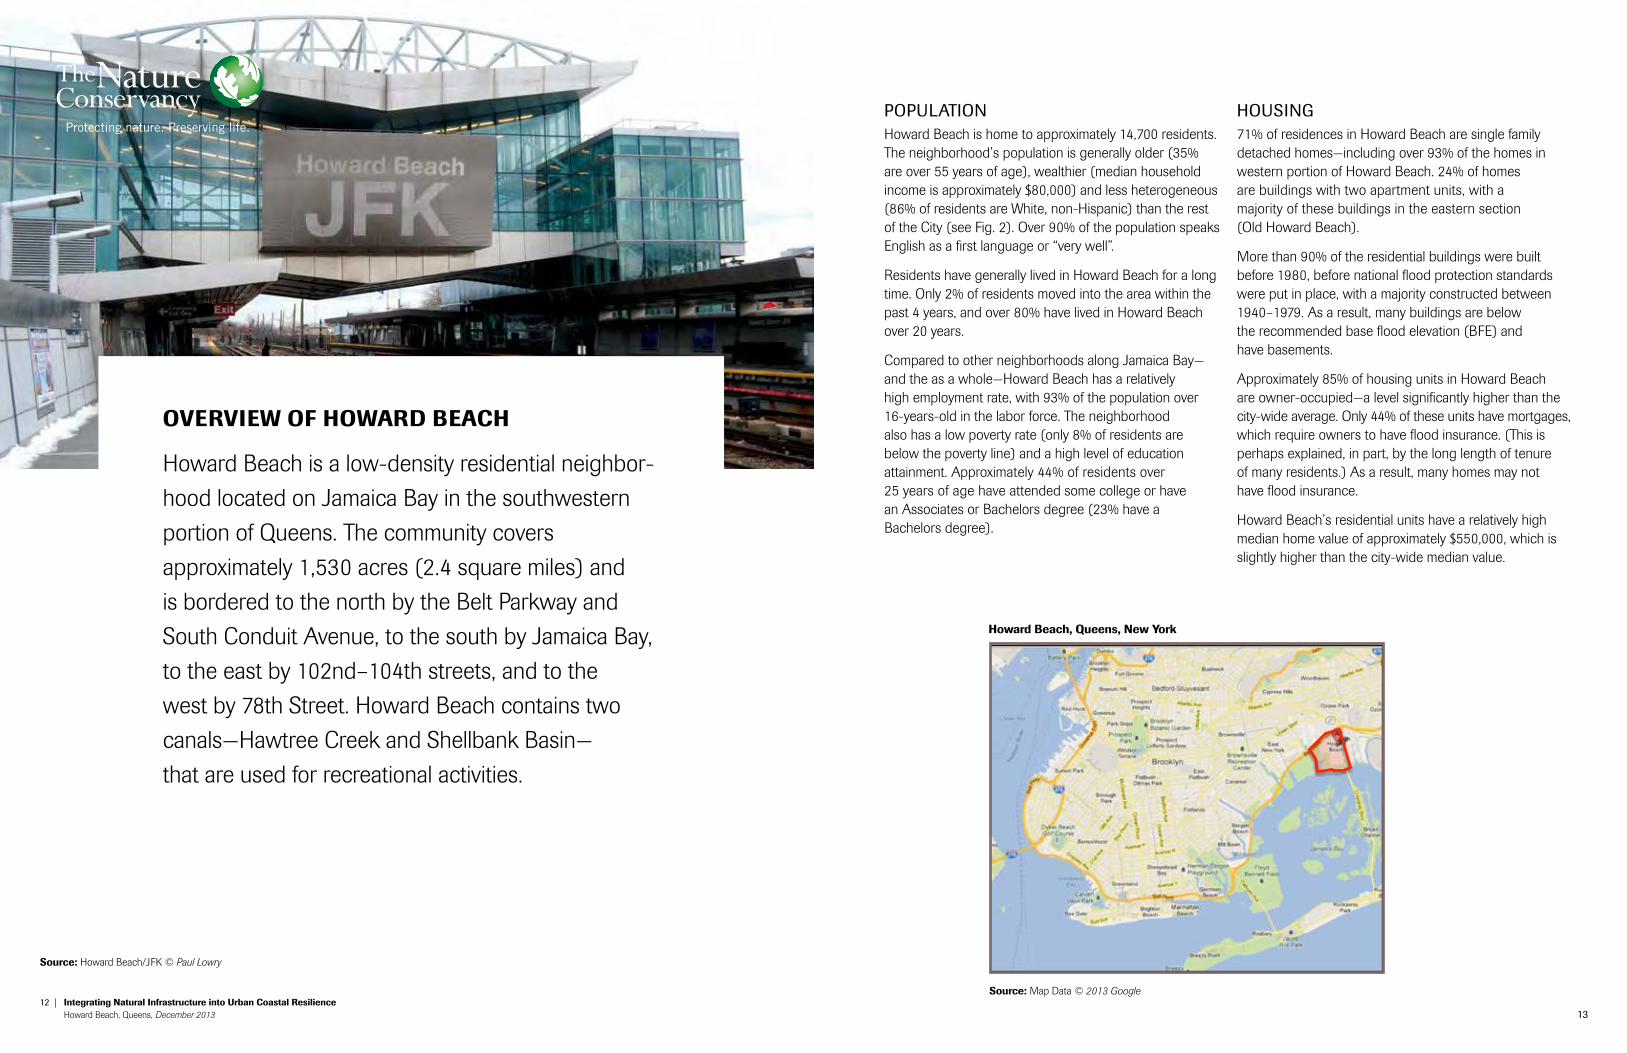
overvIew of Howard beacH
Howard Beach is a low-density residential neighbor-
hood located on Jamaica Bay in the southwestern
portion of Queens. The community covers
approximately 1,530 acres (2.4 square miles) and
is bordered to the north by the Belt Parkway and
South Conduit Avenue, to the south by Jamaica Bay,
to the east by 102nd–104th streets, and to the
west by 78th Street. Howard Beach contains two
canals—Hawtree Creek and Shellbank Basin—
that are used for recreational activities.
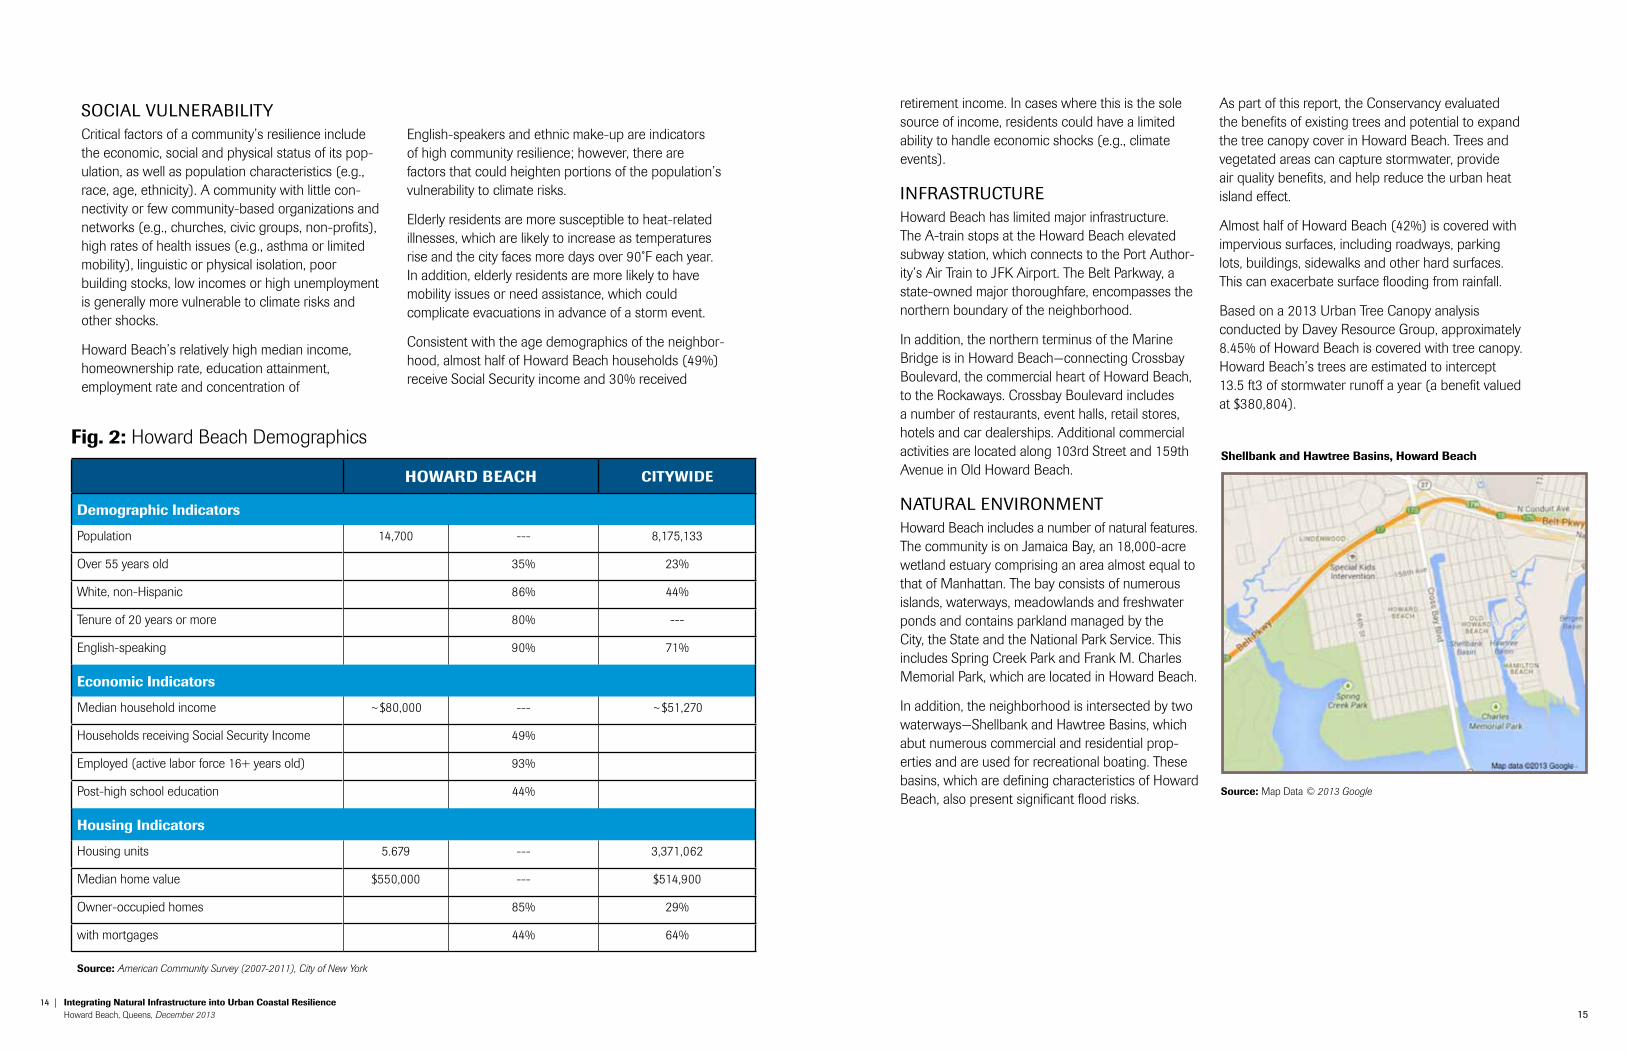
population Howard Beach is home to approximately 14,700 residents. The neighborhood’s population is generally older (35% are over 55 years of age), wealthier (median household income is approximately $80,000) and less heterogeneous (86% of residents are White, non-Hispanic) than the rest of the City (see Fig. 2). Over 90% of the population speaks English as a first language or “very well”.
Residents have generally lived in Howard Beach for a long time. Only 2% of residents moved into the area within the past 4 years, and over 80% have lived in Howard Beach over 20 years.
Compared to other neighborhoods along Jamaica Bay—and the as a whole—Howard Beach has a relatively high employment rate, with 93% of the population over 16-years-old in the labor force. The neighborhood also has a low poverty rate (only 8% of residents are below the poverty line) and a high level of education attainment. Approximately 44% of residents over 25 years of age have attended some college or have an Associates or Bachelors degree (23% have a Bachelors degree).
HouSing71% of residences in Howard Beach are single family detached homes—including over 93% of the homes in western portion of Howard Beach. 24% of homes are buildings with two apartment units, with a majority of these buildings in the eastern section (Old Howard Beach).
More than 90% of the residential buildings were built before 1980, before national flood protection standards were put in place, with a majority constructed between 1940–1979. As a result, many buildings are below the recommended base flood elevation (BFE) and have basements.
Approximately 85% of housing units in Howard Beach are owner-occupied—a level significantly higher than the city-wide average. Only 44% of these units have mortgages, which require owners to have flood insurance. (This is perhaps explained, in part, by the long length of tenure of many residents.) As a result, many homes may not have flood insurance.
Howard Beach’s residential units have a relatively high median home value of approximately $550,000, which is slightly higher than the city-wide median value.
source: Map Data © 2013 Google
source: Howard Beach/JFK © Paul Lowry
Howard beach, Queens, new York
14 | Integrating natural Infrastructure into urban coastal resilience Howard Beach, Queens, December 2013 15
retirement income. In cases where this is the sole source of income, residents could have a limited ability to handle economic shocks (e.g., climate events).
infraStructureHoward Beach has limited major infrastructure. The A-train stops at the Howard Beach elevated subway station, which connects to the Port Author-ity’s Air Train to JFK Airport. The Belt Parkway, a state-owned major thoroughfare, encompasses the northern boundary of the neighborhood.
In addition, the northern terminus of the Marine Bridge is in Howard Beach—connecting Crossbay Boulevard, the commercial heart of Howard Beach, to the Rockaways. Crossbay Boulevard includes a number of restaurants, event halls, retail stores, hotels and car dealerships. Additional commercial activities are located along 103rd Street and 159th Avenue in Old Howard Beach.
natural environMentHoward Beach includes a number of natural features. The community is on Jamaica Bay, an 18,000-acre wetland estuary comprising an area almost equal to that of Manhattan. The bay consists of numerous islands, waterways, meadowlands and freshwater ponds and contains parkland managed by the City, the State and the National Park Service. This includes Spring Creek Park and Frank M. Charles Memorial Park, which are located in Howard Beach.
In addition, the neighborhood is intersected by two waterways—Shellbank and Hawtree Basins, which abut numerous commercial and residential prop-erties and are used for recreational boating. These basins, which are defining characteristics of Howard Beach, also present significant flood risks.
As part of this report, the Conservancy evaluated the benefits of existing trees and potential to expand the tree canopy cover in Howard Beach. Trees and vegetated areas can capture stormwater, provide air quality benefits, and help reduce the urban heat island effect.
Almost half of Howard Beach (42%) is covered with impervious surfaces, including roadways, parking lots, buildings, sidewalks and other hard surfaces. This can exacerbate surface flooding from rainfall.
Based on a 2013 Urban Tree Canopy analysis conducted by Davey Resource Group, approximately 8.45% of Howard Beach is covered with tree canopy. Howard Beach’s trees are estimated to intercept 13.5 ft3 of stormwater runoff a year (a benefit valued at $380,804).
Social vulnerabilitYCritical factors of a community’s resilience include the economic, social and physical status of its pop-ulation, as well as population characteristics (e.g., race, age, ethnicity). A community with little con-nectivity or few community-based organizations and networks (e.g., churches, civic groups, non-profits), high rates of health issues (e.g., asthma or limited mobility), linguistic or physical isolation, poor building stocks, low incomes or high unemployment is generally more vulnerable to climate risks and other shocks.
Howard Beach’s relatively high median income, homeownership rate, education attainment, employment rate and concentration of
Howard beacH cItYwIde
demographic Indicators
Population 14,700 --- 8,175,133
Over 55 years old 35% 23%
White, non-Hispanic 86% 44%
Tenure of 20 years or more 80% ---
English-speaking 90% 71%
economic Indicators
Median household income ~$80,000 --- ~$51,270
Households receiving Social Security Income 49%
Employed (active labor force 16+ years old) 93%
Post-high school education 44%
Housing Indicators
Housing units 5.679 --- 3,371,062
Median home value $550,000 --- $514,900
Owner-occupied homes 85% 29%
with mortgages 44% 64%
source: American Community Survey (2007-2011), City of New York
fig. 2: Howard Beach Demographics
English-speakers and ethnic make-up are indicators of high community resilience; however, there are factors that could heighten portions of the population’s vulnerability to climate risks.
Elderly residents are more susceptible to heat-related illnesses, which are likely to increase as temperatures rise and the city faces more days over 90˚F each year. In addition, elderly residents are more likely to have mobility issues or need assistance, which could complicate evacuations in advance of a storm event.
Consistent with the age demographics of the neighbor-hood, almost half of Howard Beach households (49%) receive Social Security income and 30% received
source: Map Data © 2013 Google
shellbank and Hawtree basins, Howard beach
16 | Integrating natural Infrastructure into urban coastal resilience Howard Beach, Queens, December 2013 17
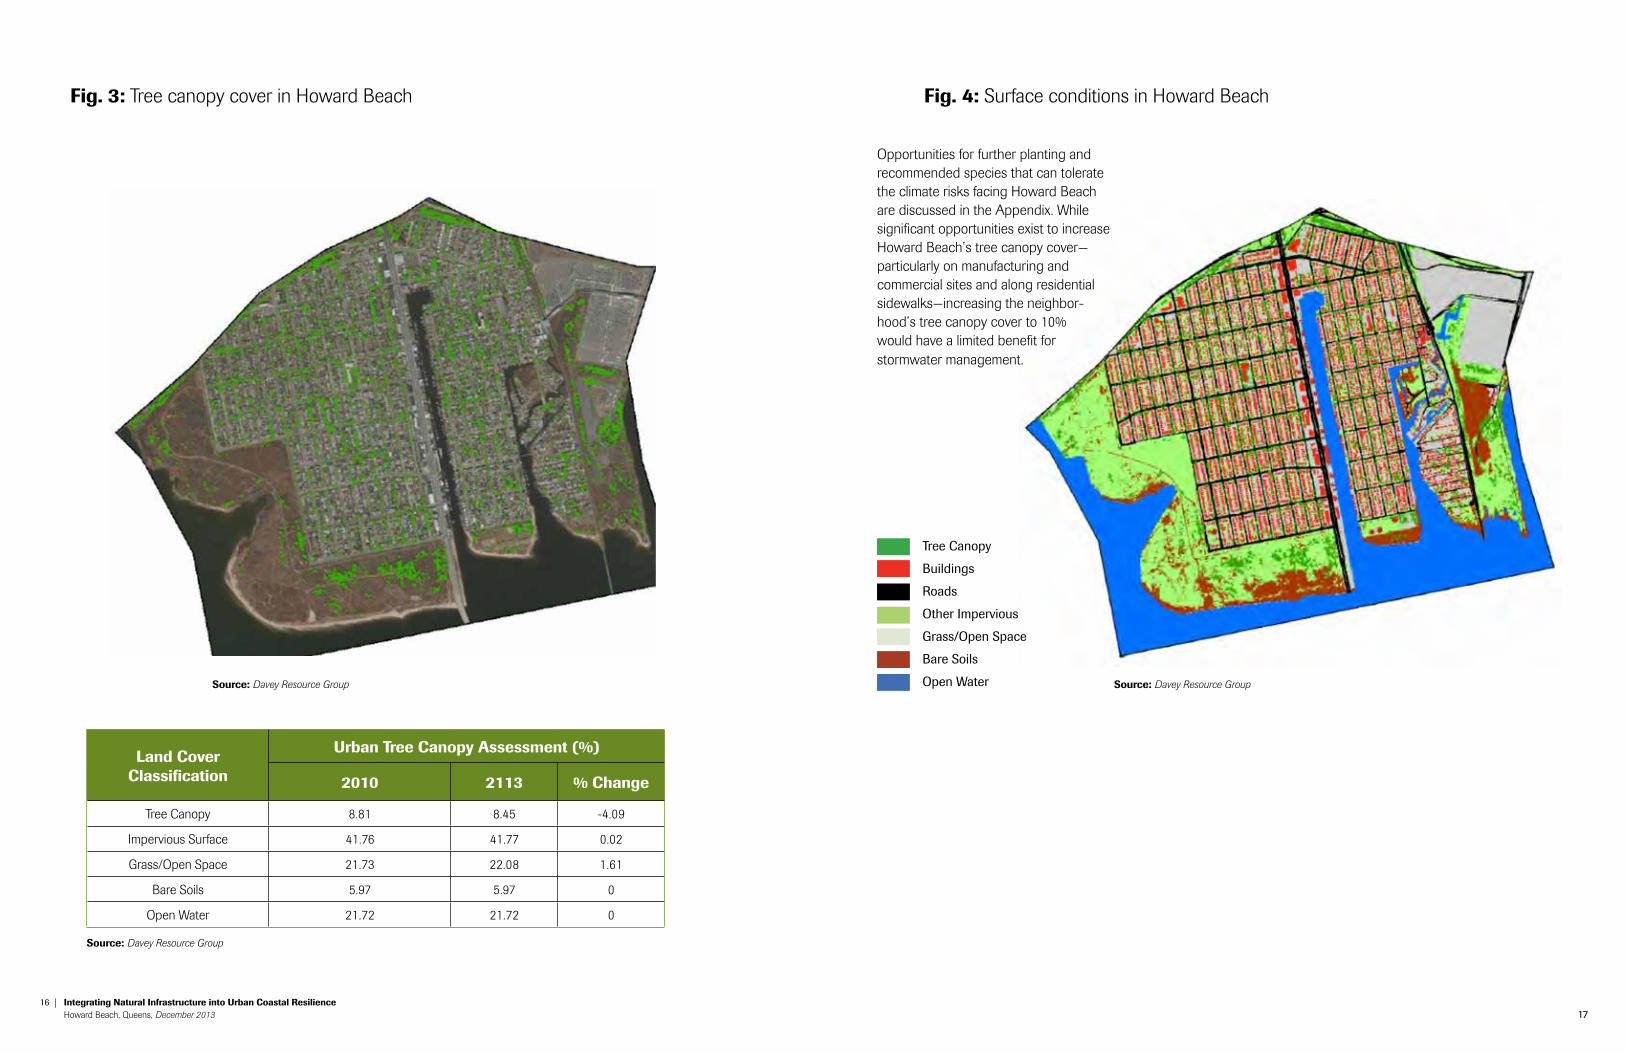
Opportunities for further planting and recommended species that can tolerate the climate risks facing Howard Beach are discussed in the Appendix. While significant opportunities exist to increase Howard Beach’s tree canopy cover— particularly on manufacturing and commercial sites and along residential sidewalks—increasing the neighbor-hood’s tree canopy cover to 10% would have a limited benefit for stormwater management.
fig. 4: Surface conditions in Howard Beachfig. 3: Tree canopy cover in Howard Beach
source: Davey Resource Group source: Davey Resource Group
land cover classification
urban tree canopy assessment (%)
2010 2113 % change
Tree Canopy 8.81 8.45 -4.09
Impervious Surface 41.76 41.77 0.02
Grass/Open Space 21.73 22.08 1.61
Bare Soils 5.97 5.97 0
Open Water 21.72 21.72 0
tree canopy
buildings
roads
other impervious
grass/open Space
bare Soils
open water
source: Davey Resource Group
18 | Integrating natural Infrastructure into urban coastal resilience Howard Beach, Queens, December 2013 19
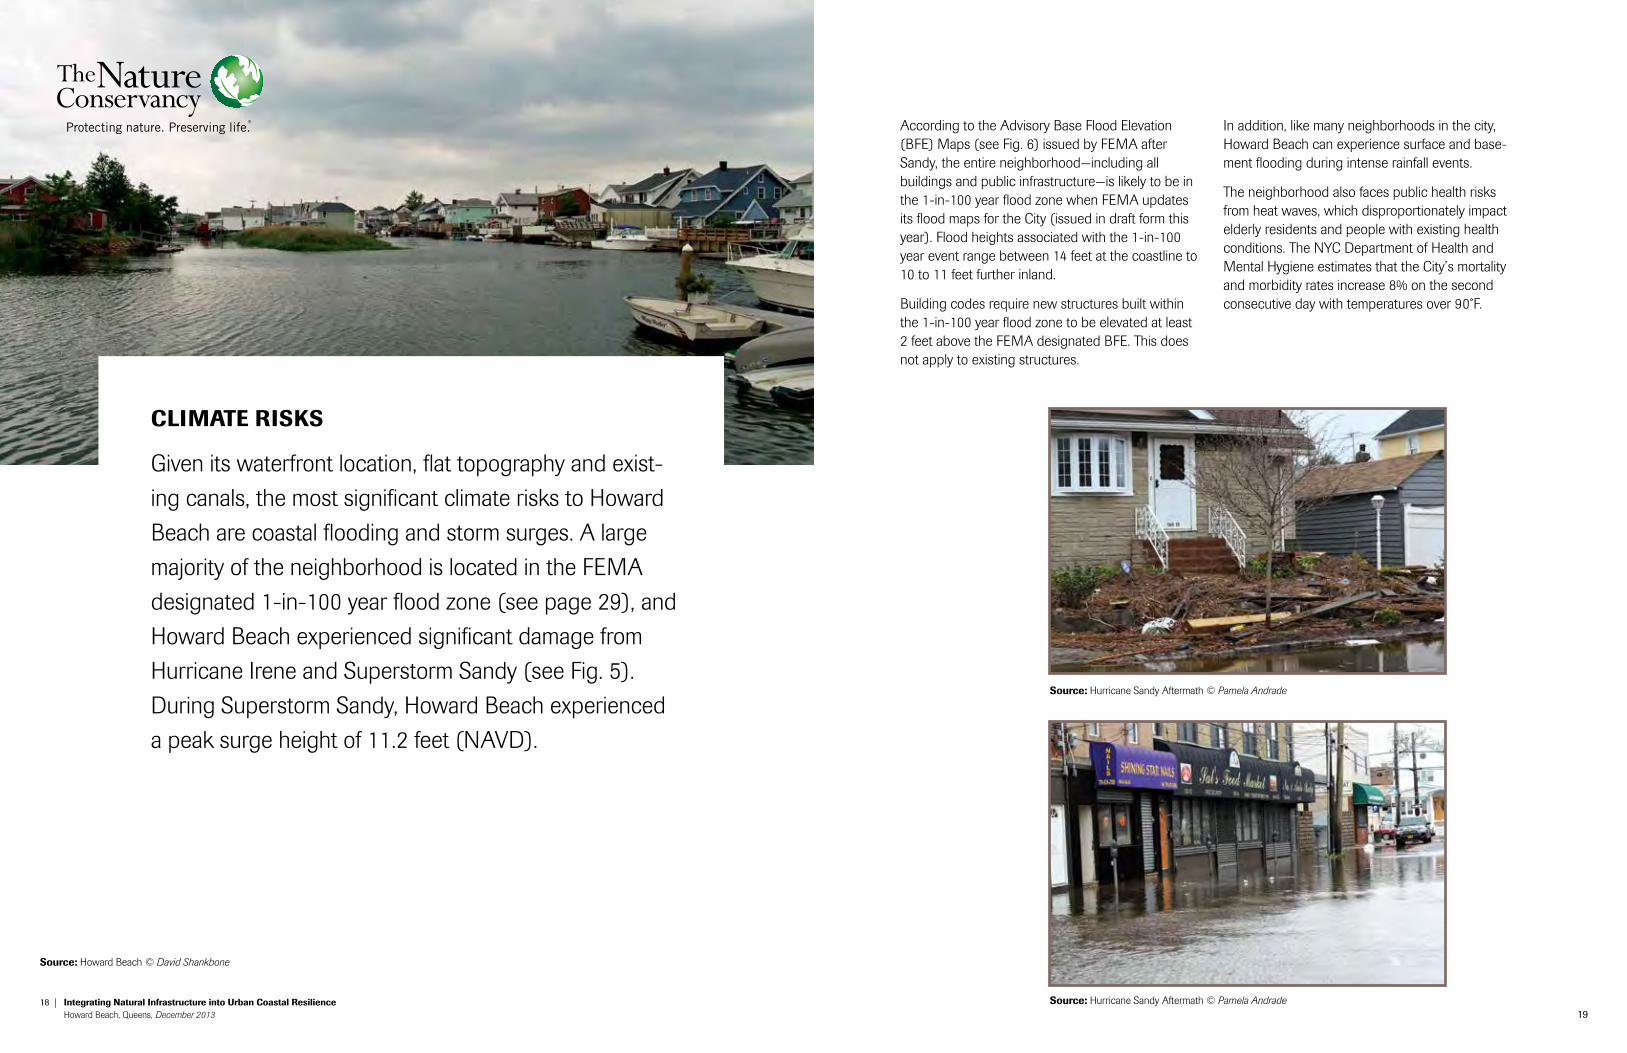
clImate rIsks
Given its waterfront location, flat topography and exist-
ing canals, the most significant climate risks to Howard
Beach are coastal flooding and storm surges. A large
majority of the neighborhood is located in the FEMA
designated 1-in-100 year flood zone (see page 29), and
Howard Beach experienced significant damage from
Hurricane Irene and Superstorm Sandy (see Fig. 5).
During Superstorm Sandy, Howard Beach experienced
a peak surge height of 11.2 feet (NAVD).
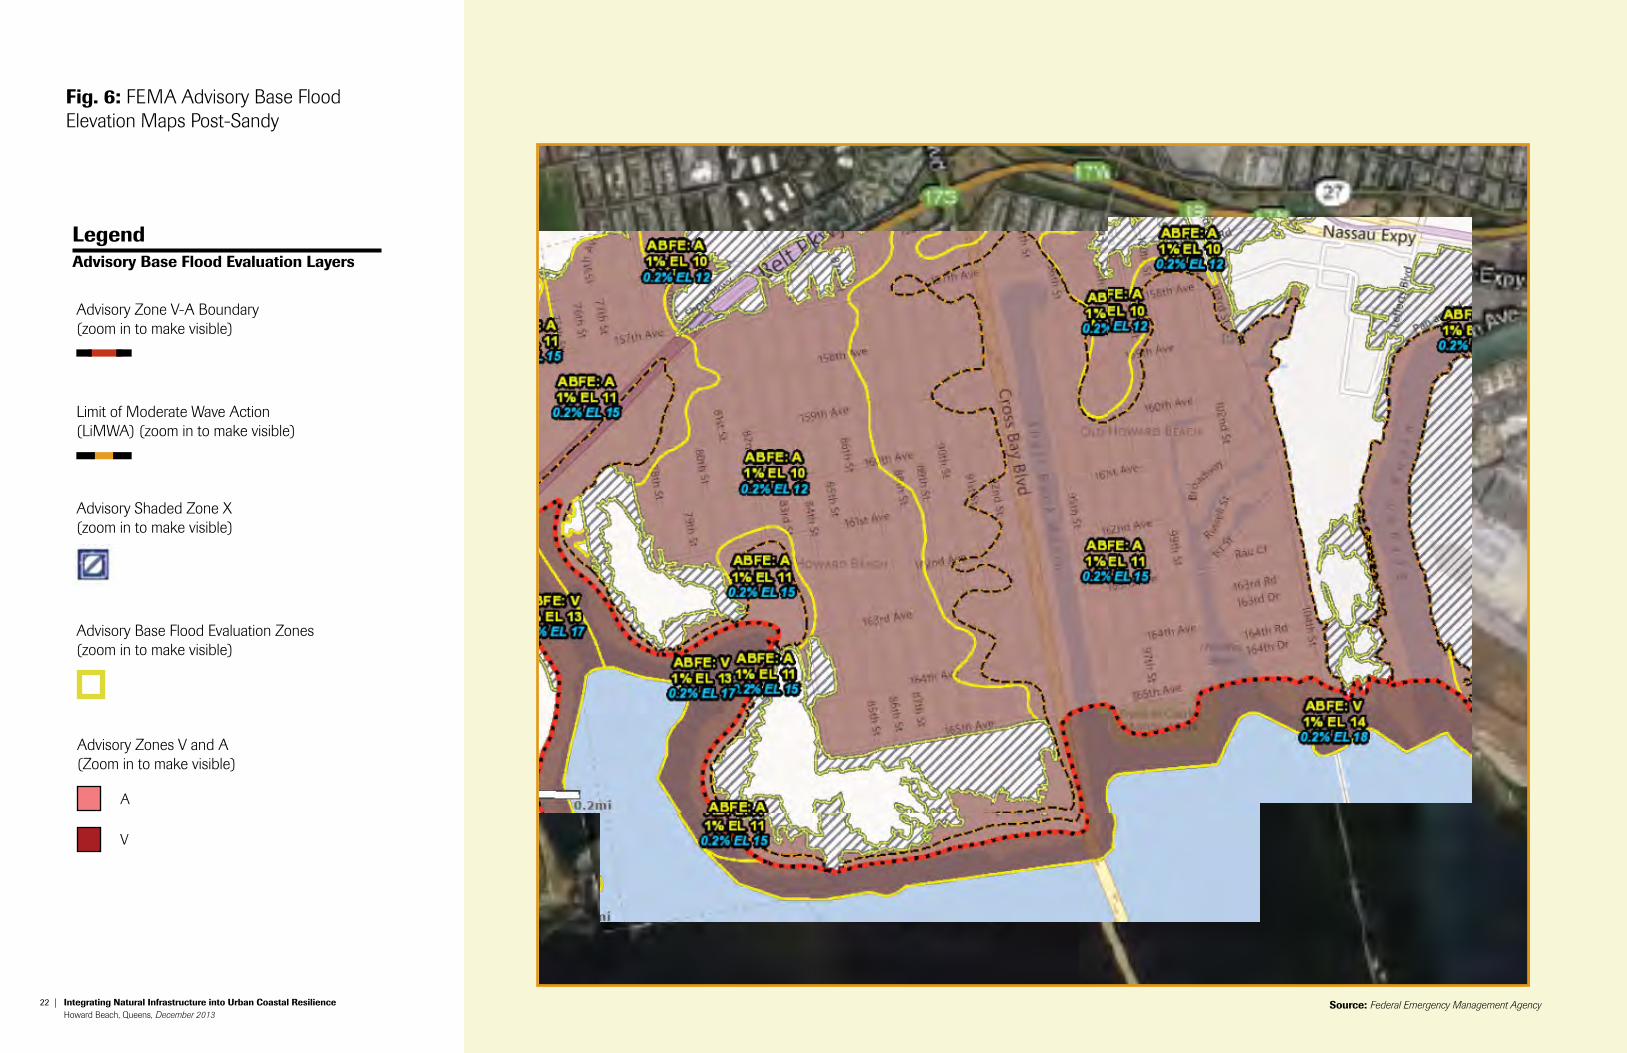
According to the Advisory Base Flood Elevation (BFE) Maps (see Fig. 6) issued by FEMA after Sandy, the entire neighborhood—including all buildings and public infrastructure—is likely to be in the 1-in-100 year flood zone when FEMA updates its flood maps for the City (issued in draft form this year). Flood heights associated with the 1-in-100 year event range between 14 feet at the coastline to 10 to 11 feet further inland.
Building codes require new structures built within the 1-in-100 year flood zone to be elevated at least 2 feet above the FEMA designated BFE. This does not apply to existing structures.
In addition, like many neighborhoods in the city, Howard Beach can experience surface and base-ment flooding during intense rainfall events.
The neighborhood also faces public health risks from heat waves, which disproportionately impact elderly residents and people with existing health conditions. The NYC Department of Health and Mental Hygiene estimates that the City’s mortality and morbidity rates increase 8% on the second consecutive day with temperatures over 90˚F.
source: Howard Beach © David Shankbone
source: Hurricane Sandy Aftermath © Pamela Andrade
source: Hurricane Sandy Aftermath © Pamela Andrade
20 | Integrating natural Infrastructure into urban coastal resilience Howard Beach, Queens, December 2013 21
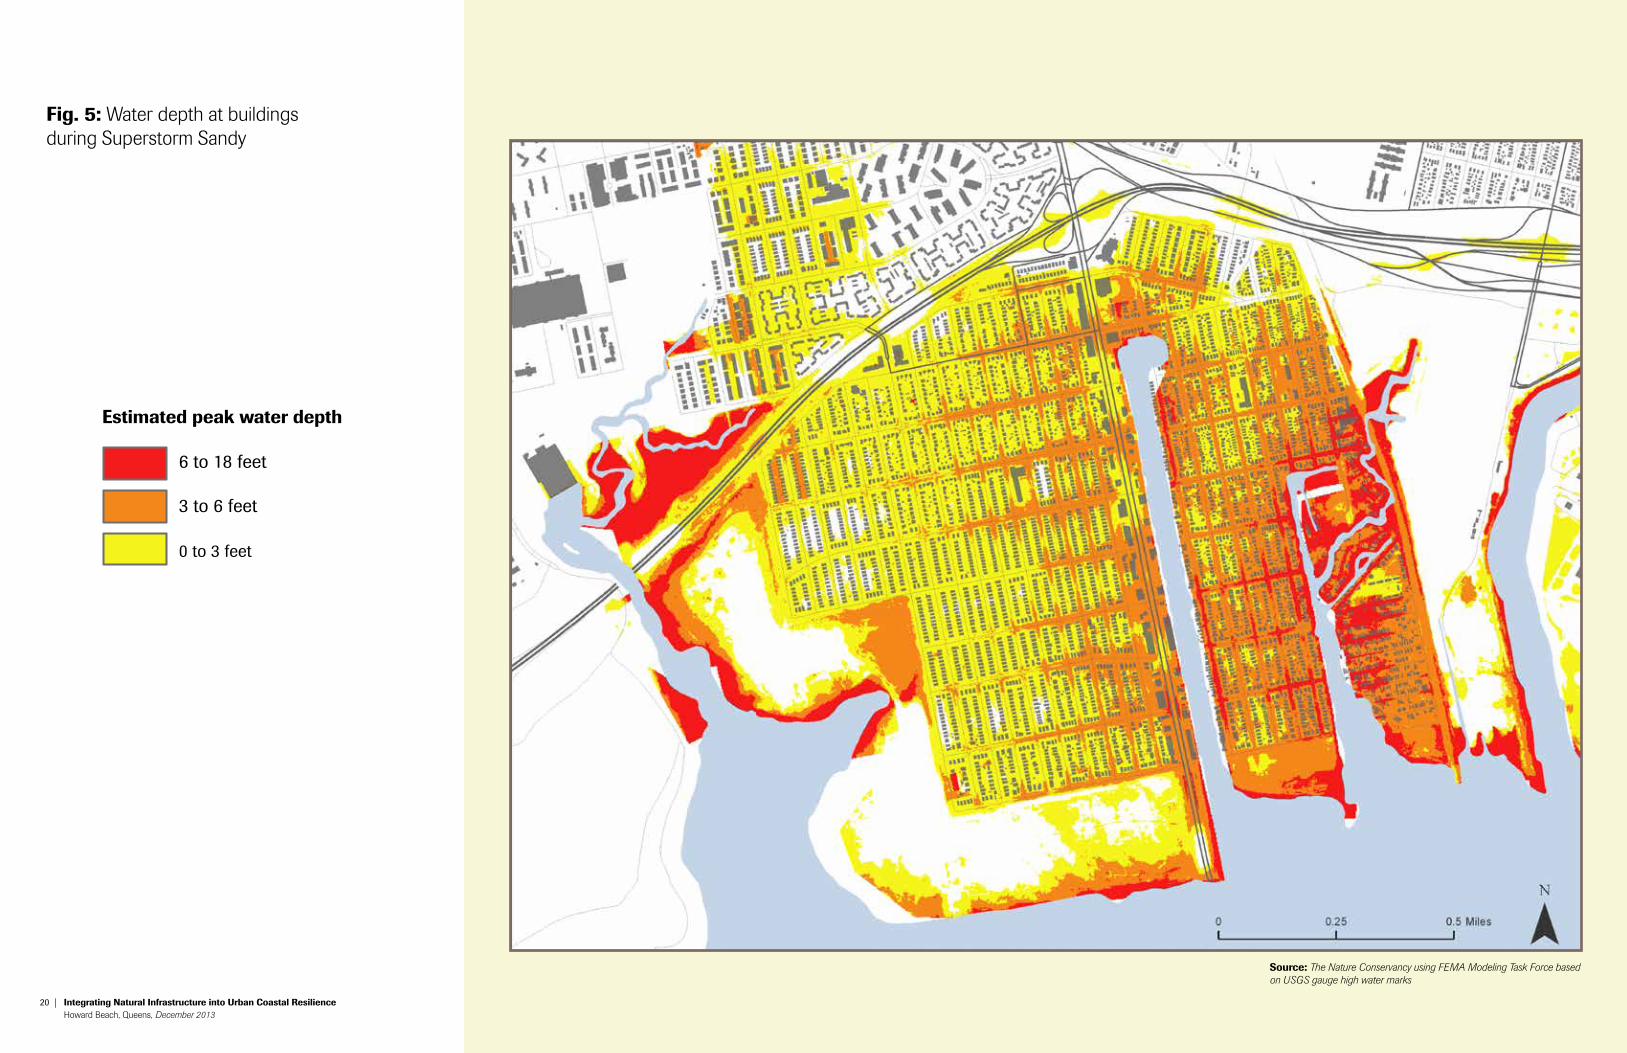
fig. 5: Water depth at buildings during Superstorm Sandy
source: The Nature Conservancy using FEMA Modeling Task Force based on USGS gauge high water marks
estimated peak water depth
6 to 18 feet
3 to 6 feet
0 to 3 feet
22 | Integrating natural Infrastructure into urban coastal resilience Howard Beach, Queens, December 2013 23
fig. 6: FEMA Advisory Base Flood Elevation Maps Post-Sandy
source: Federal Emergency Management Agency
legendadvisory base flood evaluation layers
Advisory Zone V-A Boundary(zoom in to make visible)
Advisory Zones V and A (Zoom in to make visible)
A
V
Advisory Base Flood Evaluation Zones (zoom in to make visible)
Advisory Shaded Zone X (zoom in to make visible)
Limit of Moderate Wave Action(LiMWA) (zoom in to make visible)
24 | Integrating natural Infrastructure into urban coastal resilience Howard Beach, Queens, December 2013 25
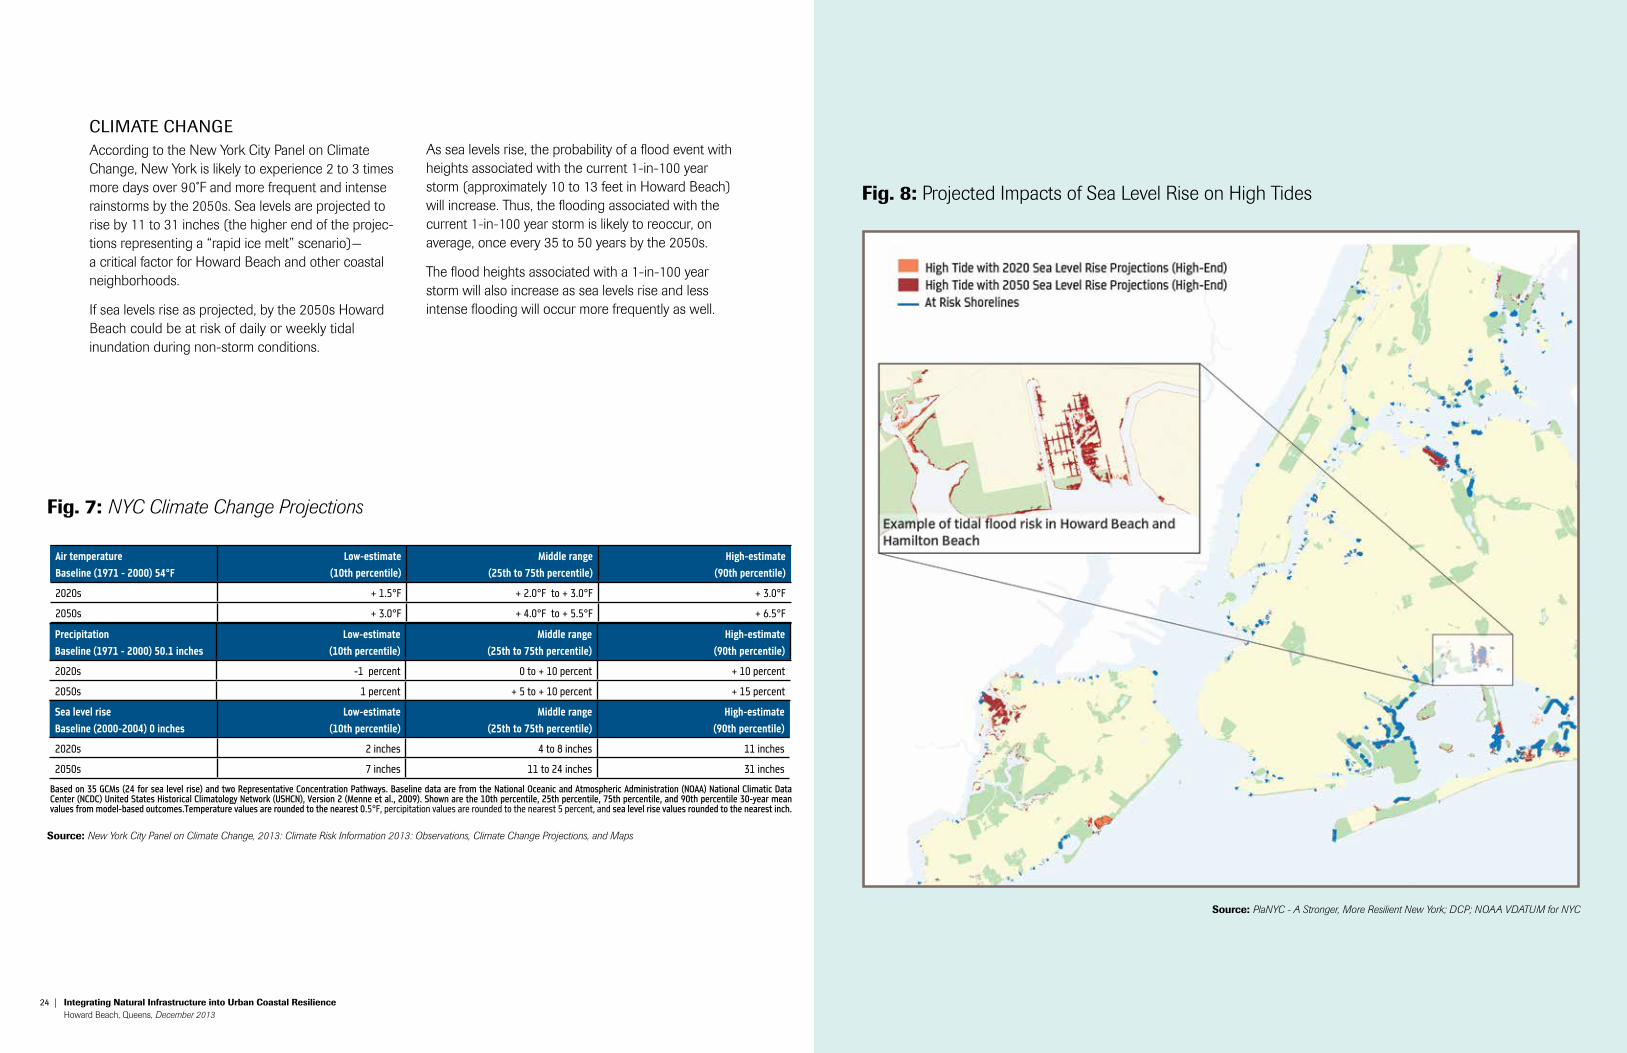
cliMate cHangeAccording to the New York City Panel on Climate Change, New York is likely to experience 2 to 3 times more days over 90˚F and more frequent and intense rainstorms by the 2050s. Sea levels are projected to rise by 11 to 31 inches (the higher end of the projec-tions representing a “rapid ice melt” scenario)— a critical factor for Howard Beach and other coastal neighborhoods.
If sea levels rise as projected, by the 2050s Howard Beach could be at risk of daily or weekly tidal inundation during non-storm conditions.
fig. 7: NYC Climate Change Projections
source: New York City Panel on Climate Change, 2013: Climate Risk Information 2013: Observations, Climate Change Projections, and Maps
fig. 8: Projected Impacts of Sea Level Rise on High Tides
As sea levels rise, the probability of a flood event with heights associated with the current 1-in-100 year storm (approximately 10 to 13 feet in Howard Beach) will increase. Thus, the flooding associated with the current 1-in-100 year storm is likely to reoccur, on average, once every 35 to 50 years by the 2050s.
The flood heights associated with a 1-in-100 year storm will also increase as sea levels rise and less intense flooding will occur more frequently as well.
source: PlaNYC - A Stronger, More Resilient New York; DCP; NOAA VDATUM for NYC
Precipitation
Baseline (1971 - 2000) 50.1 inches
Low-estimate
(10th percentile)
Middle range
(25th to 75th percentile)
High-estimate
(90th percentile)
2020s -1 percent 0 to + 10 percent + 10 percent
2050s 1 percent + 5 to + 10 percent + 15 percent
Sea level rise
Baseline (2000-2004) 0 inches
Low-estimate
(10th percentile)
Middle range
(25th to 75th percentile)
High-estimate
(90th percentile)
2020s 2 inches 4 to 8 inches 11 inches
2050s 7 inches 11 to 24 inches 31 inches
Based on 35 GCMs (24 for sea level rise) and two Representative Concentration Pathways. Baseline data are from the National Oceanic and Atmospheric Administration (NOAA) National Climatic Data Center (NCDC) United States Historical Climatology Network (USHCN), Version 2 (Menne et al., 2009). Shown are the 10th percentile, 25th percentile, 75th percentile, and 90th percentile 30-year mean values from model-based outcomes.Temperature values are rounded to the nearest 0.5°F, percipitation values are rounded to the nearest 5 percent, and sea level rise values rounded to the nearest inch.
Air temperature
Baseline (1971 - 2000) 54°F
Low-estimate
(10th percentile)
Middle range
(25th to 75th percentile)
High-estimate
(90th percentile)
2020s + 1.5°F + 2.0°F to + 3.0°F + 3.0°F
2050s + 3.0°F + 4.0°F to + 5.5°F + 6.5°F
26 | Integrating natural Infrastructure into urban coastal resilience Howard Beach, Queens, December 2013 27
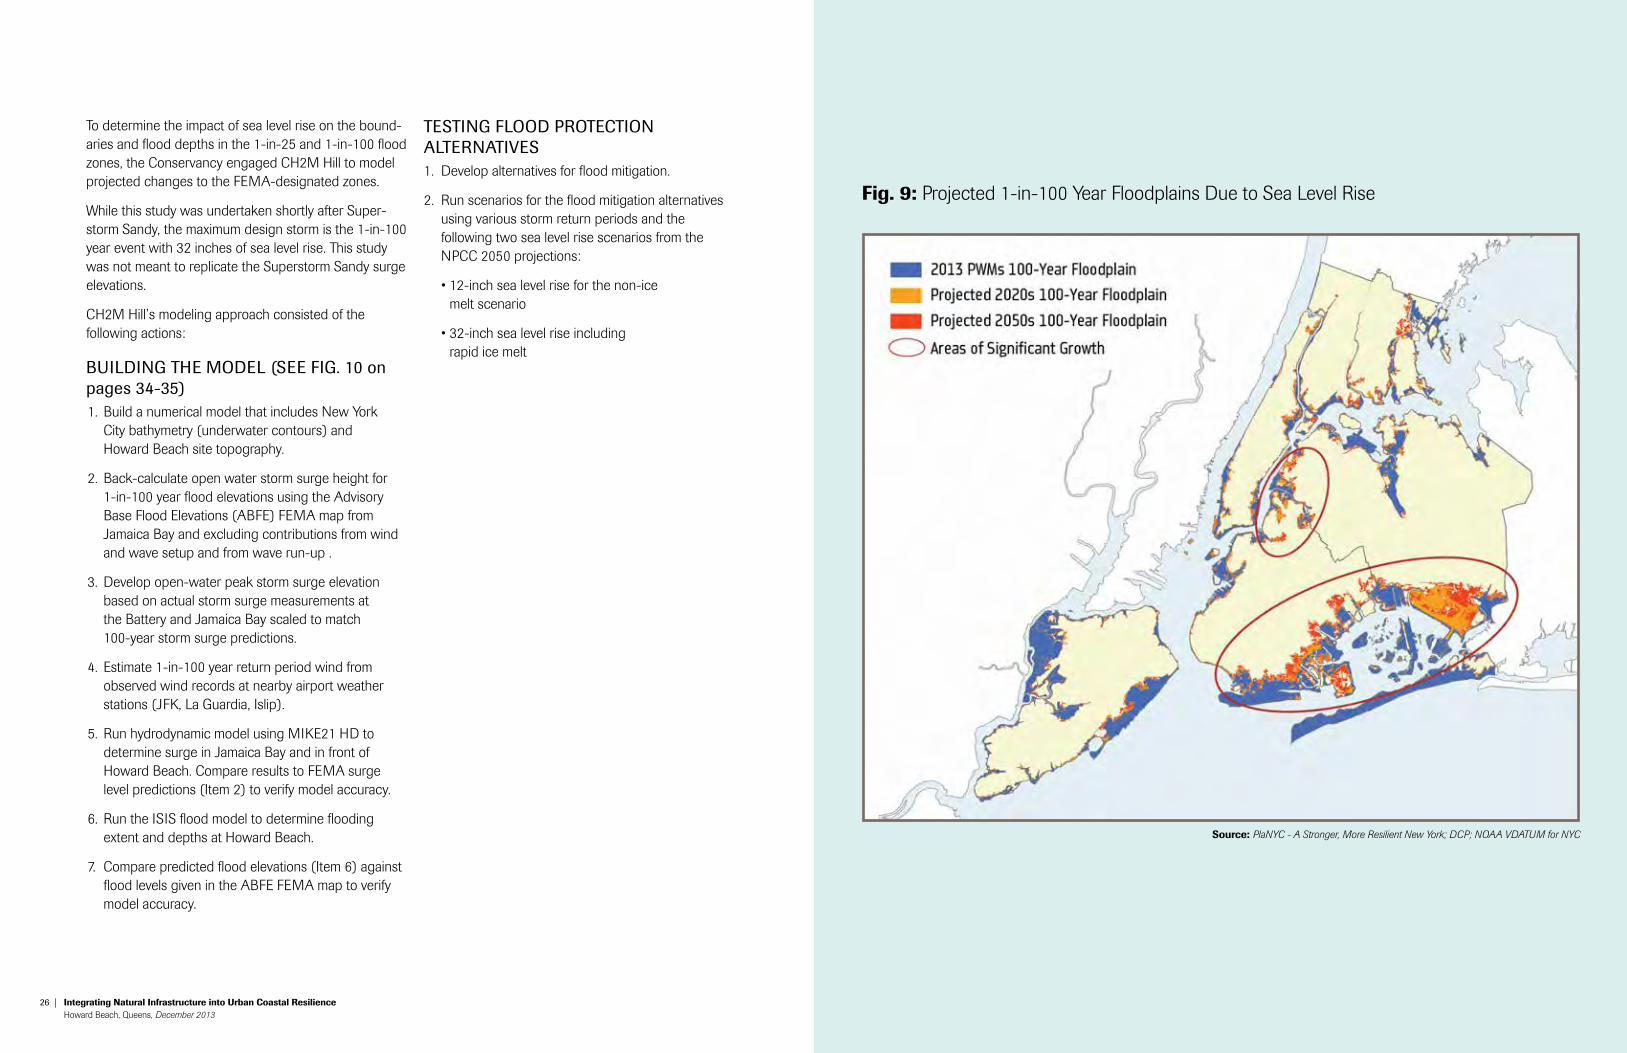
To determine the impact of sea level rise on the bound-aries and flood depths in the 1-in-25 and 1-in-100 flood zones, the Conservancy engaged CH2M Hill to model projected changes to the FEMA-designated zones.
While this study was undertaken shortly after Super-storm Sandy, the maximum design storm is the 1-in-100 year event with 32 inches of sea level rise. This study was not meant to replicate the Superstorm Sandy surge elevations.
CH2M Hill’s modeling approach consisted of the following actions:
building tHe Model (See fig. 10 on pages 34-35)1. Build a numerical model that includes New York
City bathymetry (underwater contours) and Howard Beach site topography.
2. Back-calculate open water storm surge height for 1-in-100 year flood elevations using the Advisory Base Flood Elevations (ABFE) FEMA map from Jamaica Bay and excluding contributions from wind and wave setup and from wave run-up .
3. Develop open-water peak storm surge elevation based on actual storm surge measurements at the Battery and Jamaica Bay scaled to match 100-year storm surge predictions.
4. Estimate 1-in-100 year return period wind from observed wind records at nearby airport weather stations (JFK, La Guardia, Islip).
5. Run hydrodynamic model using MIKE21 HD to determine surge in Jamaica Bay and in front of Howard Beach. Compare results to FEMA surge level predictions (Item 2) to verify model accuracy.
6. Run the ISIS flood model to determine flooding extent and depths at Howard Beach.
7. Compare predicted flood elevations (Item 6) against flood levels given in the ABFE FEMA map to verify model accuracy.
teSting flood protection alternativeS1. Develop alternatives for flood mitigation.
2. Run scenarios for the flood mitigation alternatives using various storm return periods and the following two sea level rise scenarios from the NPCC 2050 projections:
• 12-inch sea level rise for the non-ice melt scenario
• 32-inch sea level rise including rapid ice melt
fig. 9: Projected 1-in-100 Year Floodplains Due to Sea Level Rise
source: PlaNYC - A Stronger, More Resilient New York; DCP; NOAA VDATUM for NYC
28 | Integrating natural Infrastructure into urban coastal resilience Howard Beach, Queens, December 2013 29
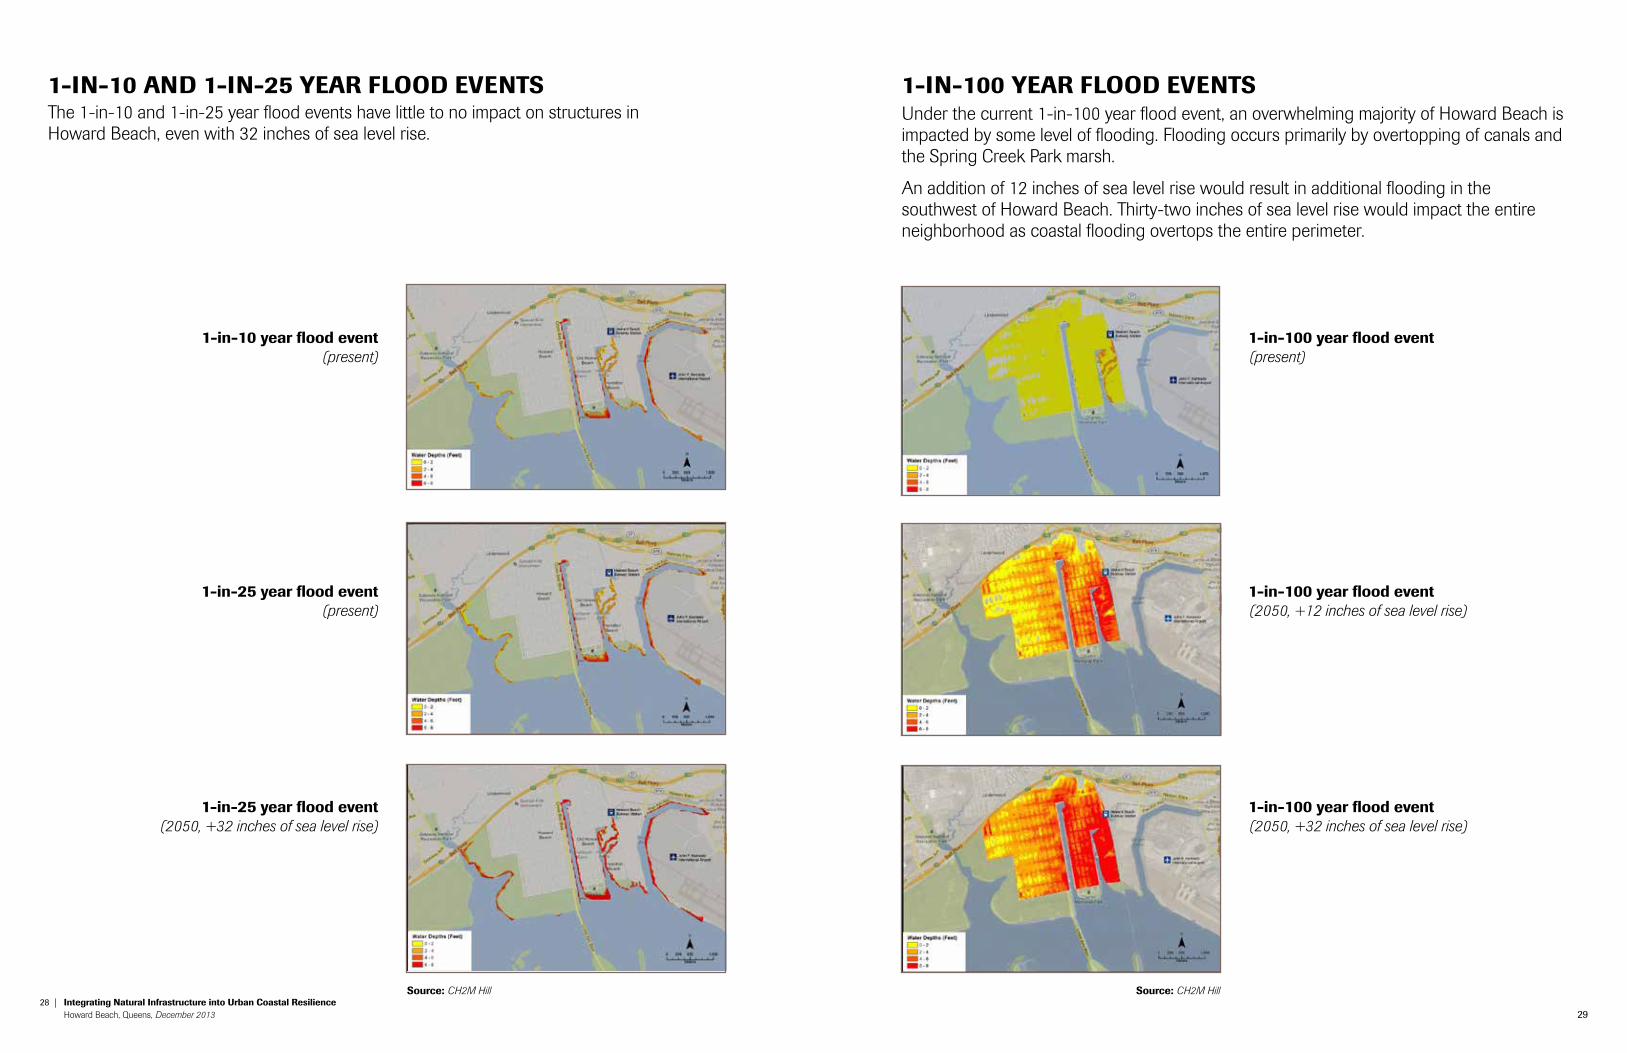
1-In-10 and 1-In-25 Year flood eventsThe 1-in-10 and 1-in-25 year flood events have little to no impact on structures in Howard Beach, even with 32 inches of sea level rise.
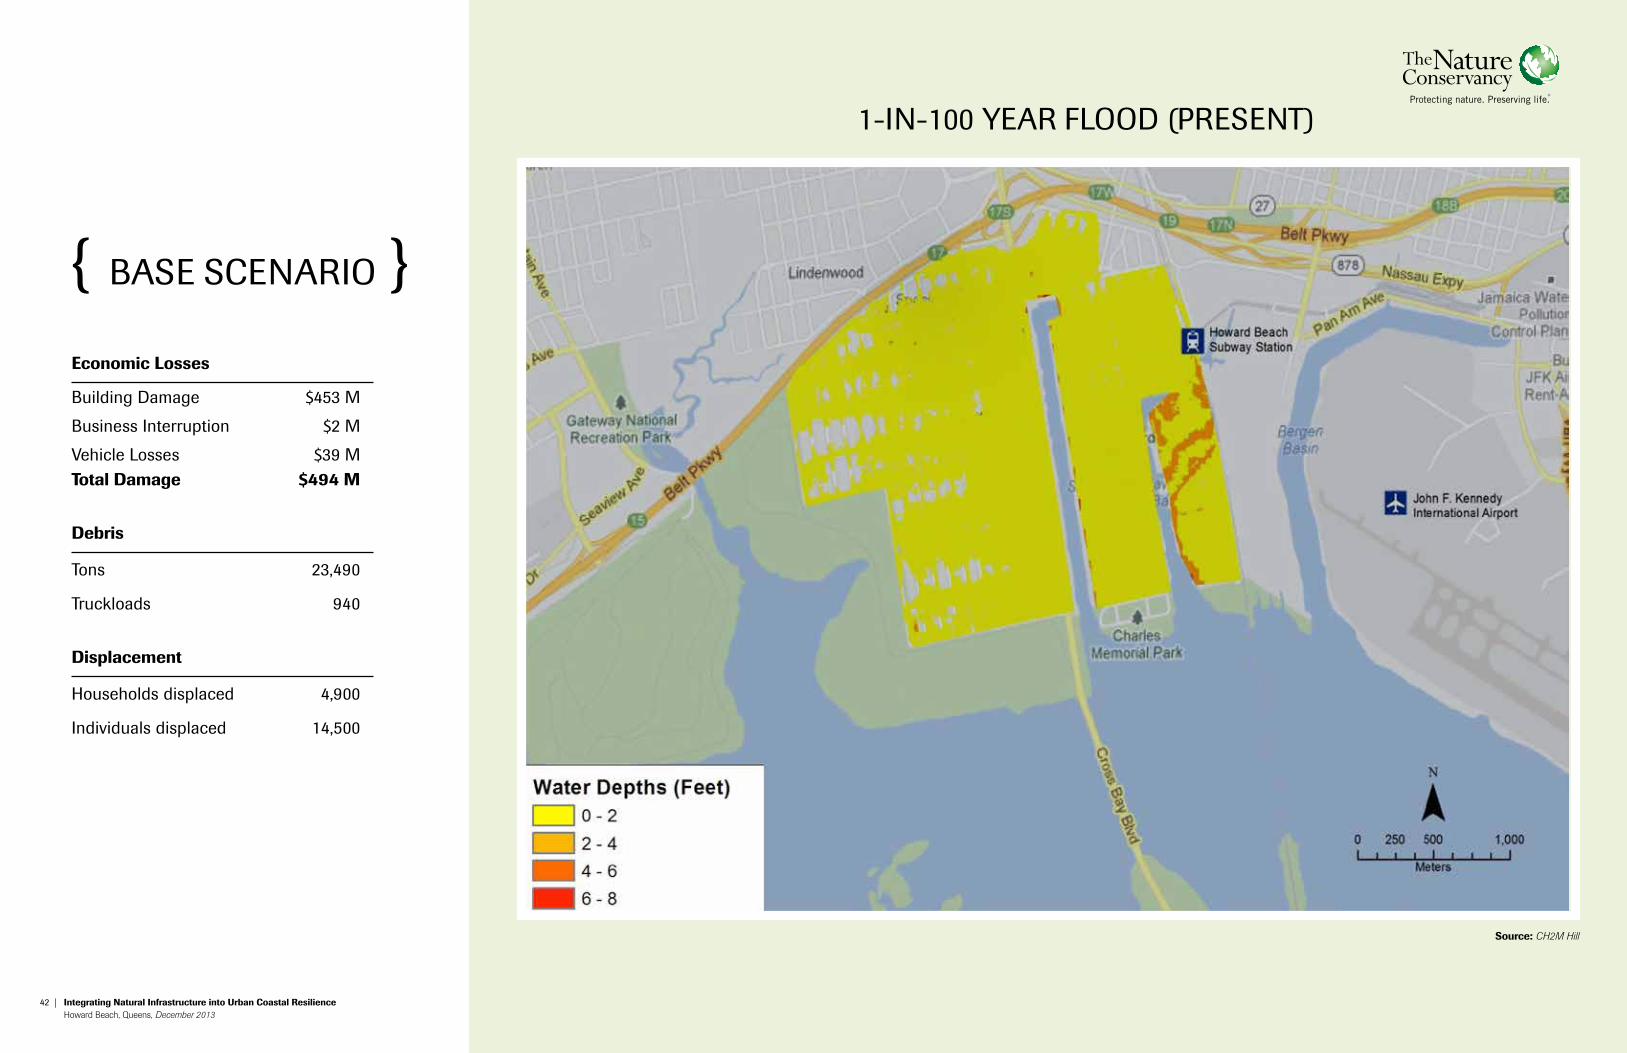
1-In-100 Year flood eventsUnder the current 1-in-100 year flood event, an overwhelming majority of Howard Beach is impacted by some level of flooding. Flooding occurs primarily by overtopping of canals and the Spring Creek Park marsh.
An addition of 12 inches of sea level rise would result in additional flooding in the southwest of Howard Beach. Thirty-two inches of sea level rise would impact the entire neighborhood as coastal flooding overtops the entire perimeter.
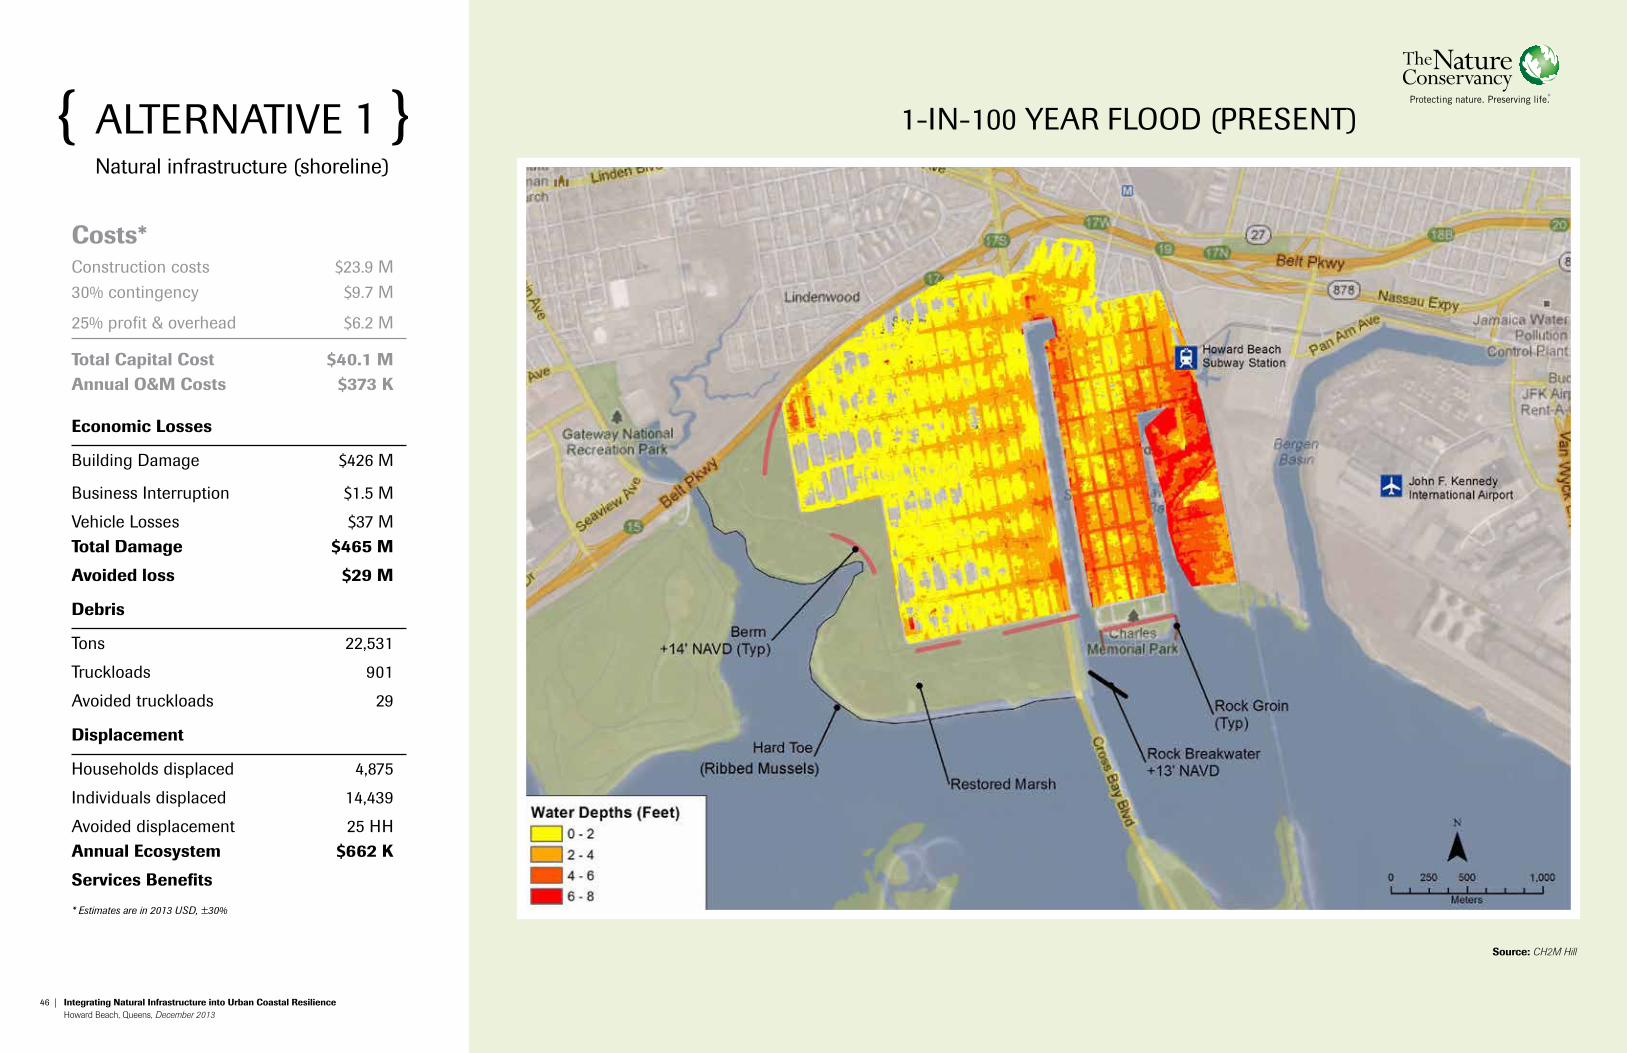
1-in-100 year flood event (present)
1-in-100 year flood event (2050, +12 inches of sea level rise)
1-in-100 year flood event (2050, +32 inches of sea level rise)
1-in-10 year flood event (present)
1-in-25 year flood event (present)
1-in-25 year flood event (2050, +32 inches of sea level rise)
source: CH2M Hill source: CH2M Hill
30 | Integrating natural Infrastructure into urban coastal resilience Howard Beach, Queens, December 2013 31
developing tHe reSilience alternativeS
To develop alternative strategies, the Conservancy hosted a charrette with CH2M Hill and various City agencies to identify flood risks and potential risk mitigation strategies. These strategies were com-piled into four suites of interventions (“alternatives”) to represent two natural infrastructure-only alterna-tives and two alternatives that include natural and built infrastructure (see page 28).
The natural infrastructure utilized in the alternatives include:
• dunes and berms
• marshes
• edges hardened with ribbed mussel toes
• rock groins and breakwaters
• artificial islands/wetlands
The alternatives integrating built infrastructure include:
• removable flood walls
• operable flood gates
Coastal protection elements were sited in Howard Beach based on site topography and geometry, direction of incoming wind and wave action, and the location of the study area within Jamaica Bay.
These alternatives do not represent the only strate-gies or suites of strategies that could increase the resilience of Howard Beach. Rather, they represent a first attempt to create a suite of comprehensive coastal protection options for an urban neighbor-hood that enables the City and the Conservancy to understand the costs and benefits of coastal protection utilizing natural and built infrastructure. Actionable strategies require further analysis and modeling and could include a mix of strategies from each alternative or other options.
The alternatives developed through the charrette were modeled against the 1-in-100 year storm to determine their ability to reduce flood risks as compared to current conditions in Howard Beach (“base case”). Alternatives 3 and 4 were further
modeled to estimate how they would perform with 12 and 32 inches of sea level rise (see Fig. 13). Alternatives 1 and 2 were not modeled for sea level rise as they failed to reduce risks under current flooding conditions.
While it could be possible to reduce flood risks for Howard Beach using only built infrastructure, integrating natural infrastructure into coastal defenses can provide three types of benefits:
1. substitution value where substituting natural for built infrastructure reduces capital costs (CapEx). Operating costs may increase, decrease or remain the same.
2. Integration value where integrating natural infrastructure into built infrastructure produces operation savings (OpEx). Capital costs may increase, decrease, or remain the same.
3. complementary value where utilizing natural infrastructure produces additional, complementary benefits, e.g., increased property values (revenues). Capital and operating costs may increase, decrease, or remain the same.
Alternatives 3 and 4 include both natural and built infrastructure. The natural infrastructure elements of these alternatives (ribbed mussel hard toe and wetlands) are likely to lengthen the useful life of Spring Creek Park and its protective berms through the reduction of wave energy and erosion. This would reduce long-term capital and maintenance costs (substitution and integration value). In addition, having properties adjacent to parkland as opposed to sea walls is likely to increase in property values (complementary value).
Unfortunately, given the short duration of this project, we were unable to calculate the exact value of these benefits or to include a comparison of operating costs between natural and built infra-structure elements (e.g., maintaining a sea wall vs. a wetland). A logical next step is to complete this analysis to determine the life cycle value of an integrated approach and the difference in costs and benefits between a grey-only and a hybrid strategy.
resIlIence alternatIves
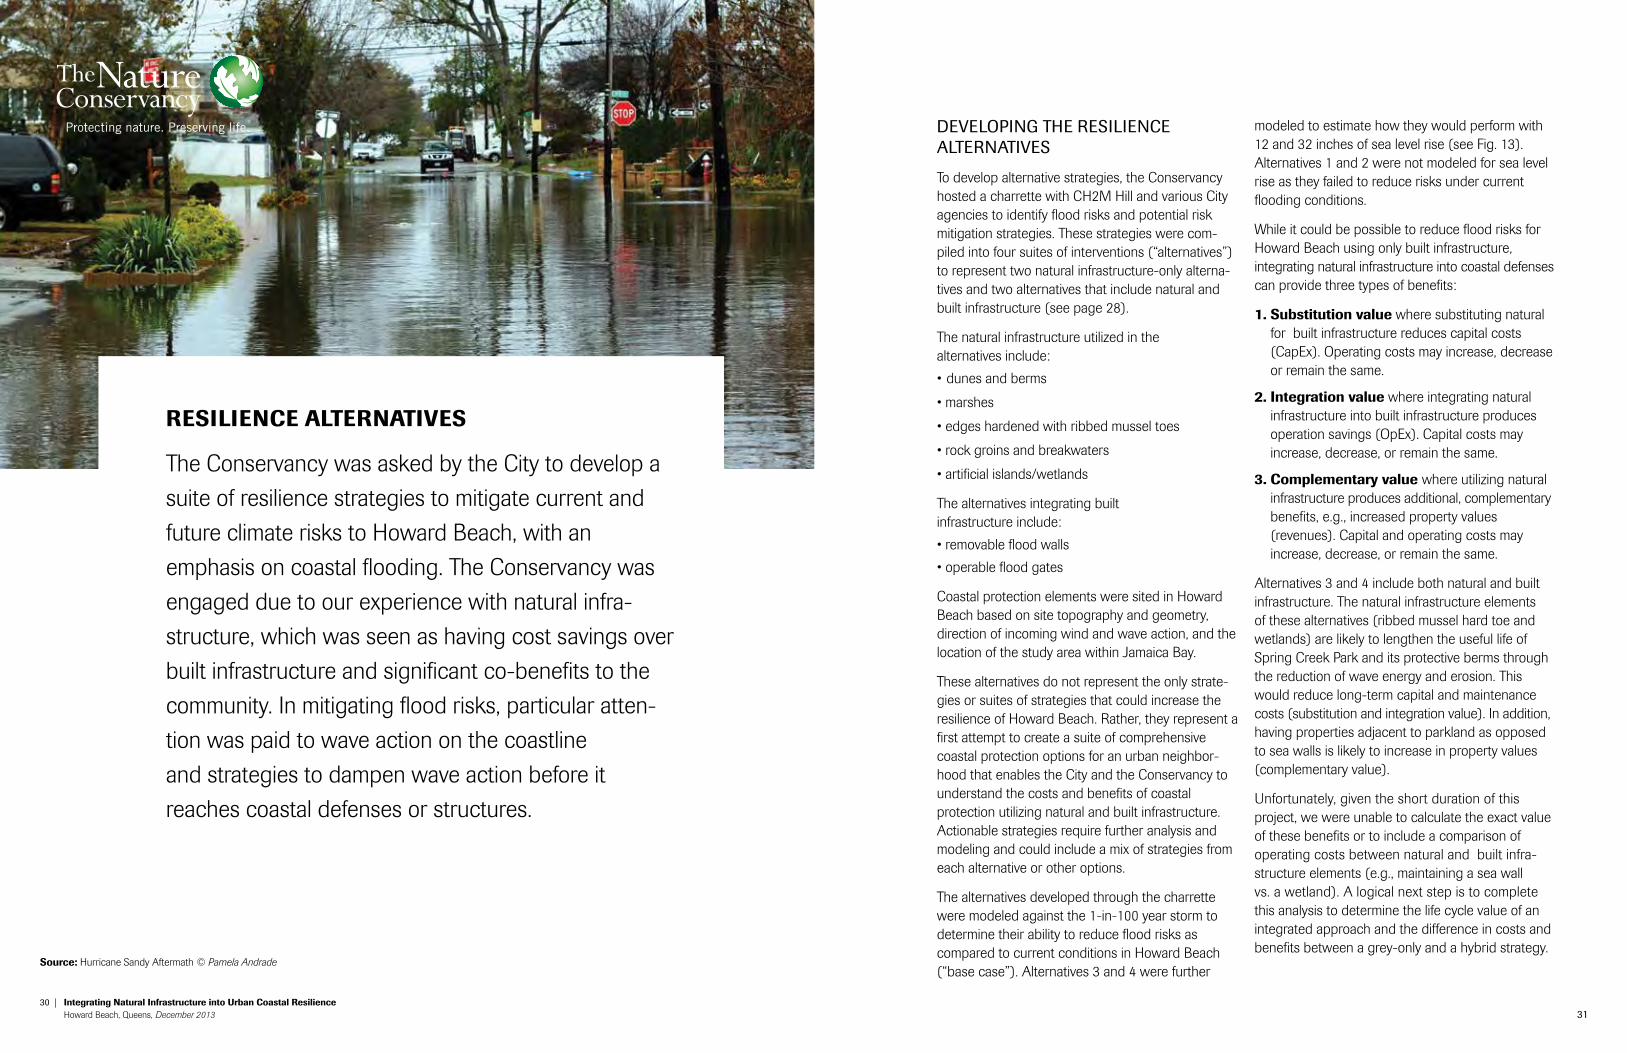
The Conservancy was asked by the City to develop a
suite of resilience strategies to mitigate current and
future climate risks to Howard Beach, with an
emphasis on coastal flooding. The Conservancy was
engaged due to our experience with natural infra-
structure, which was seen as having cost savings over
built infrastructure and significant co-benefits to the
community. In mitigating flood risks, particular atten-
tion was paid to wave action on the coastline
and strategies to dampen wave action before it
reaches coastal defenses or structures.
source: Hurricane Sandy Aftermath © Pamela Andrade
32 | Integrating natural Infrastructure into urban coastal resilience Howard Beach, Queens, December 2013 33
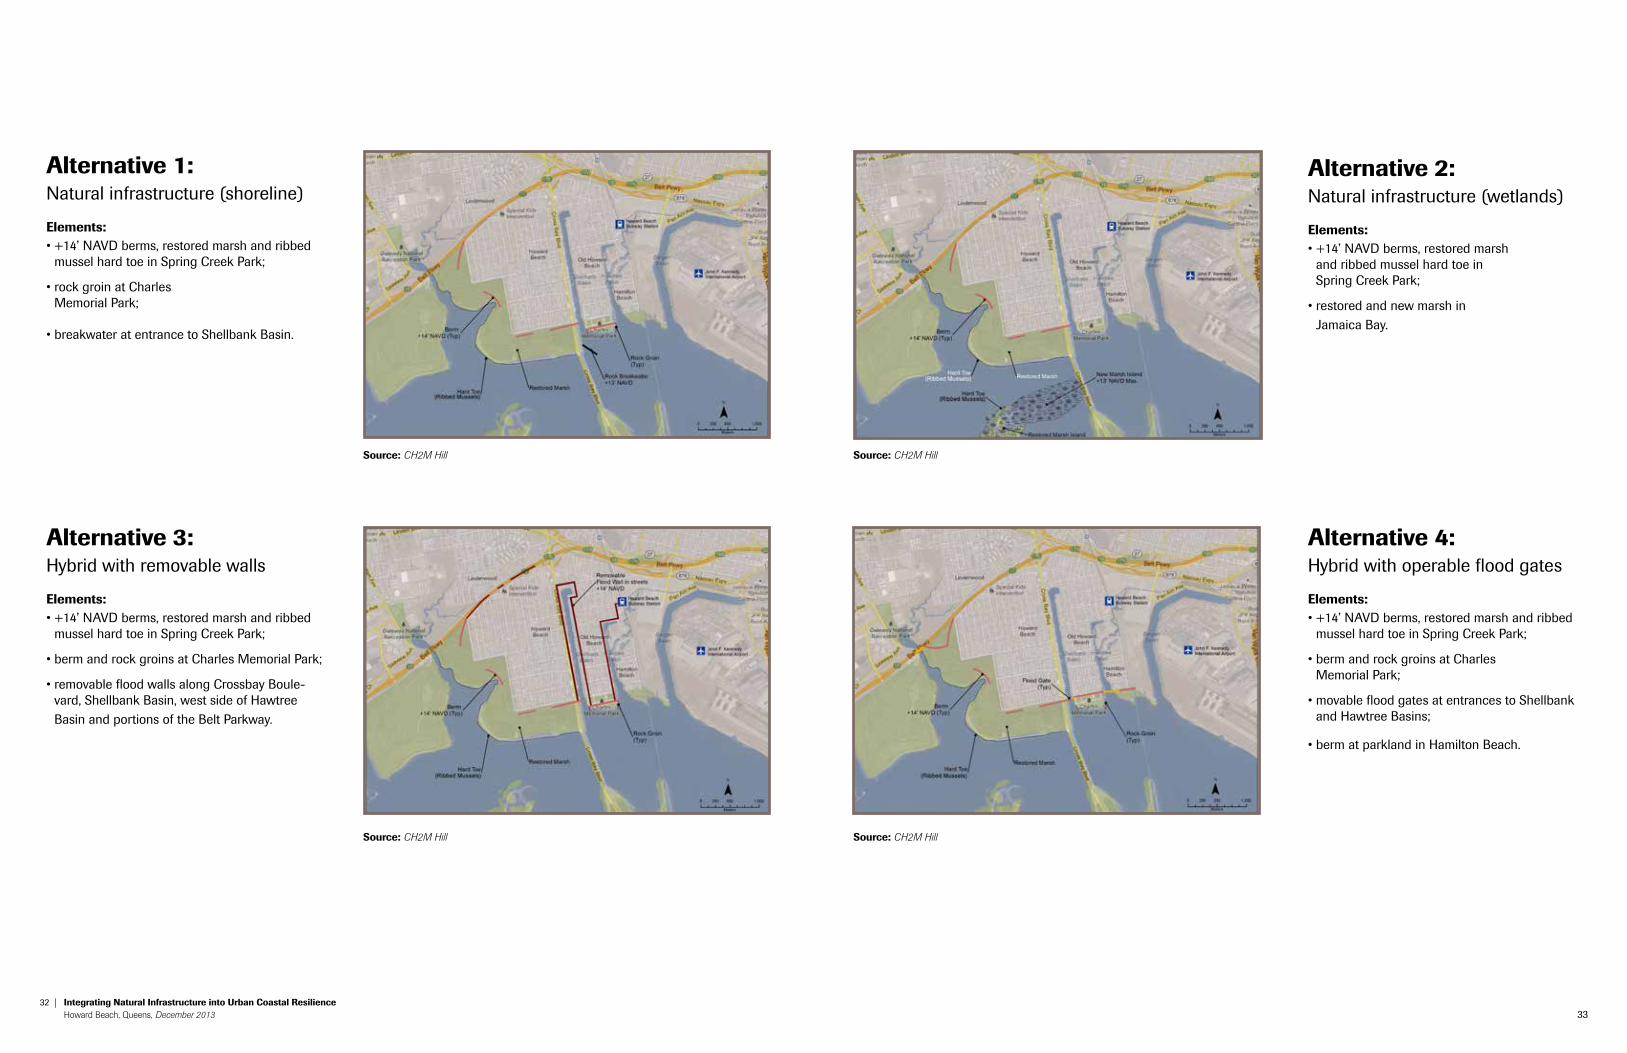
alternative 1: natural infrastructure (shoreline)
elements: • +14’ NAVD berms, restored marsh and ribbed
mussel hard toe in Spring creek park;
• rock groin at Charles Memorial park;
• breakwater at entrance to Shellbank Basin.
alternative 2: natural infrastructure (wetlands)
elements: • +14’ NAVD berms, restored marsh
and ribbed mussel hard toe in Spring creek park;
• restored and new marsh in Jamaica bay.
alternative 3: Hybrid with removable walls
elements: • +14’ NAVD berms, restored marsh and ribbed
mussel hard toe in Spring creek park;
• berm and rock groins at Charles Memorial Park;
• removable flood walls along Crossbay Boule-vard, Shellbank basin, west side of Hawtree basin and portions of the belt parkway.
alternative 4: Hybrid with operable flood gates
elements: • +14’ NAVD berms, restored marsh and ribbed
mussel hard toe in Spring creek park;
• berm and rock groins at Charles Memorial park;
• movable flood gates at entrances to Shellbank and Hawtree basins;
• berm at parkland in Hamilton Beach.
source: CH2M Hill
source: CH2M Hill source: CH2M Hill
source: CH2M Hill
34 | Integrating natural Infrastructure into urban coastal resilience Howard Beach, Queens, December 2013 35
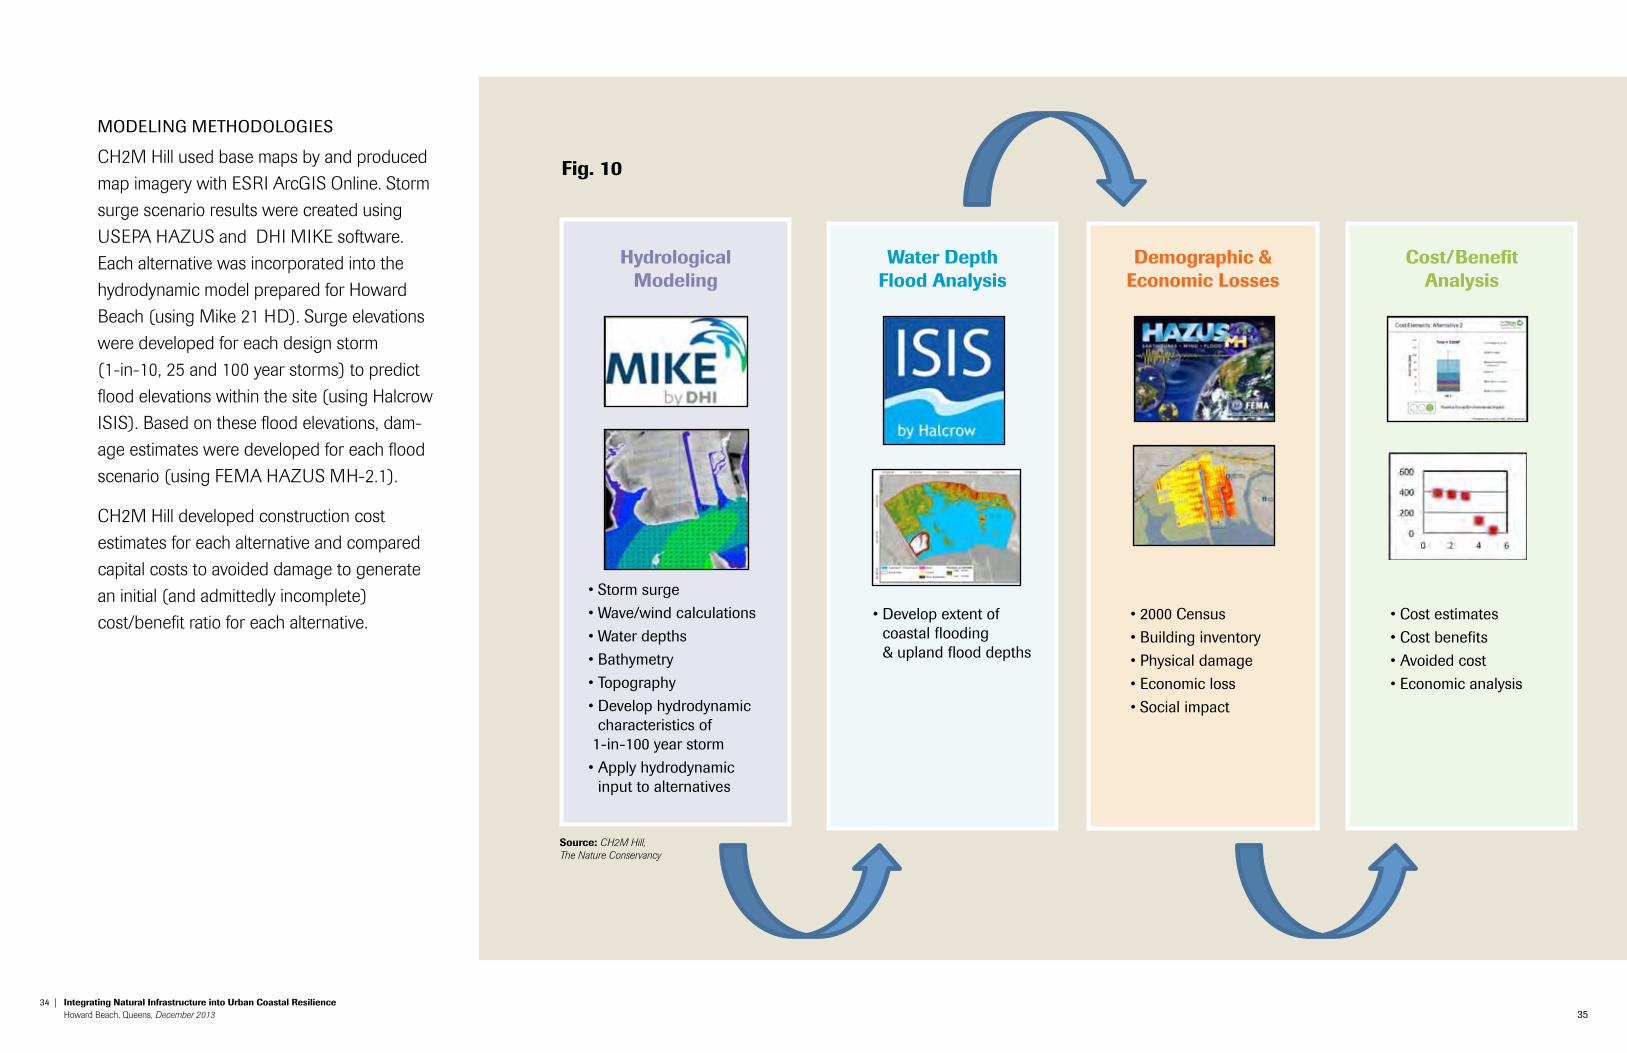
Modeling MetHodologieS
CH2M Hill used base maps by and produced map imagery with ESRI ArcGIS Online. Storm surge scenario results were created using USEPA HAZUS and DHI MIKE software. Each alternative was incorporated into the hydrodynamic model prepared for Howard Beach (using Mike 21 HD). Surge elevations were developed for each design storm (1-in-10, 25 and 100 year storms) to predict flood elevations within the site (using Halcrow ISIS). Based on these flood elevations, dam-age estimates were developed for each flood scenario (using FEMA HAZUS MH-2.1).
CH2M Hill developed construction cost estimates for each alternative and compared capital costs to avoided damage to generate an initial (and admittedly incomplete) cost/benefit ratio for each alternative.
fig. 10
Hydrologicalmodeling
• Storm surge• Wave/wind calculations• Water depths• Bathymetry • Topography• Develop hydrodynamic
characteristics of 1-in-100 year storm• Apply hydrodynamic
input to alternatives
water depthflood analysis
• Develop extent of coastal flooding & upland flood depths
demographic &economic losses
• 2000 Census• Building inventory• Physical damage• Economic loss• Social impact
cost/benefitanalysis
• Cost estimates• Cost benefits• Avoided cost• Economic analysis
source: CH2M Hill, The Nature Conservancy
36 | Integrating natural Infrastructure into urban coastal resilience Howard Beach, Queens, December 2013 37
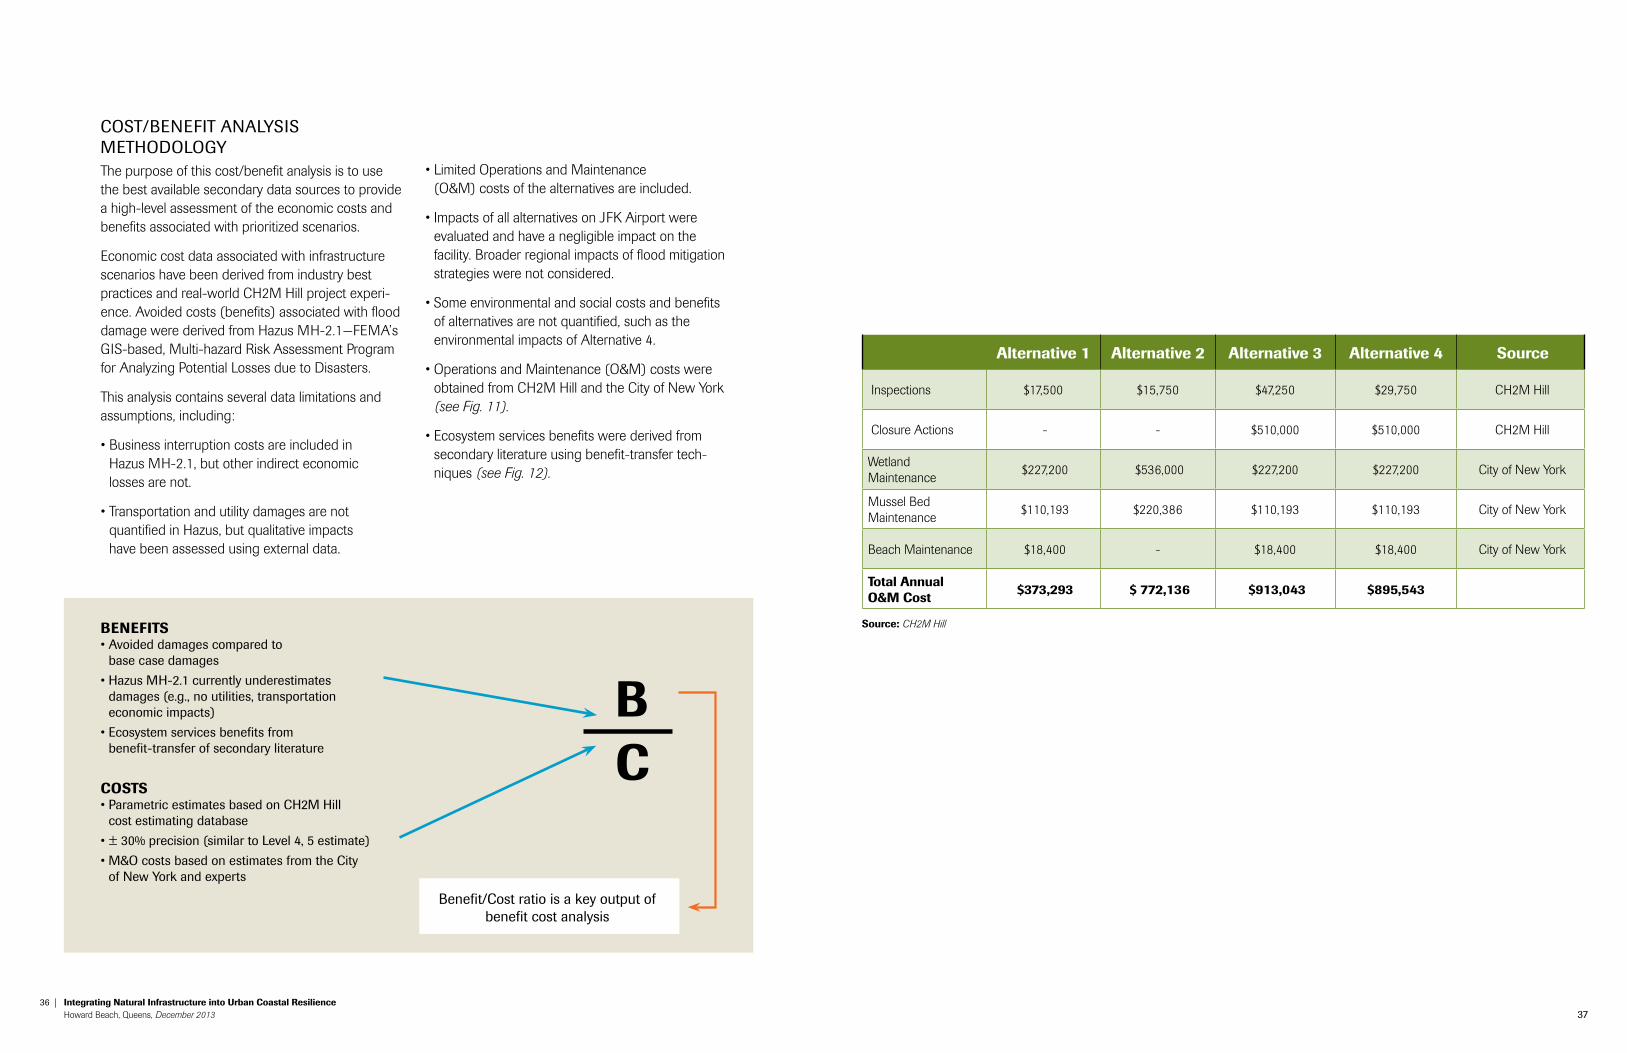
coSt/benefit analYSiS MetHodologY The purpose of this cost/benefit analysis is to use the best available secondary data sources to provide a high-level assessment of the economic costs and benefits associated with prioritized scenarios.
Economic cost data associated with infrastructure scenarios have been derived from industry best practices and real-world CH2M Hill project experi-ence. Avoided costs (benefits) associated with flood damage were derived from Hazus MH-2.1—FEMA’s GIS-based, Multi-hazard Risk Assessment Program for Analyzing Potential Losses due to Disasters.
This analysis contains several data limitations and assumptions, including:
• Business interruption costs are included in Hazus MH-2.1, but other indirect economic losses are not.
• Transportation and utility damages are not quantified in Hazus, but qualitative impacts have been assessed using external data.
benefIts• Avoided damages compared to
base case damages
• Hazus MH-2.1 currently underestimates damages (e.g., no utilities, transportation economic impacts)
• Ecosystem services benefits from benefit-transfer of secondary literature
costs• Parametric estimates based on CH2M Hill
cost estimating database
• ± 30% precision (similar to Level 4, 5 estimate)
• M&O costs based on estimates from the City of new York and experts
benefit/cost ratio is a key output of benefit cost analysis
• Limited Operations and Maintenance (O&M) costs of the alternatives are included.
• Impacts of all alternatives on JFK Airport were evaluated and have a negligible impact on the facility. Broader regional impacts of flood mitigation strategies were not considered.
• Some environmental and social costs and benefits of alternatives are not quantified, such as the environmental impacts of Alternative 4.
• Operations and Maintenance (O&M) costs were obtained from CH2M Hill and the City of New York (see Fig. 11).
• Ecosystem services benefits were derived from secondary literature using benefit-transfer tech-niques (see Fig. 12).
alternative 1 alternative 2 alternative 3 alternative 4 source
Inspections $17,500 $15,750 $47,250 $29,750 CH2M Hill
Closure Actions - - $510,000 $510,000 CH2M Hill
Wetland Maintenance
$227,200 $536,000 $227,200 $227,200 City of New York
Mussel Bed Maintenance
$110,193 $220,386 $110,193 $110,193 City of New York
Beach Maintenance $18,400 - $18,400 $18,400 City of New York
total annual o&m cost $373,293 $ 772,136 $913,043 $895,543
bc
source: CH2M Hill
38 | Integrating natural Infrastructure into urban coastal resilience Howard Beach, Queens, December 2013 39
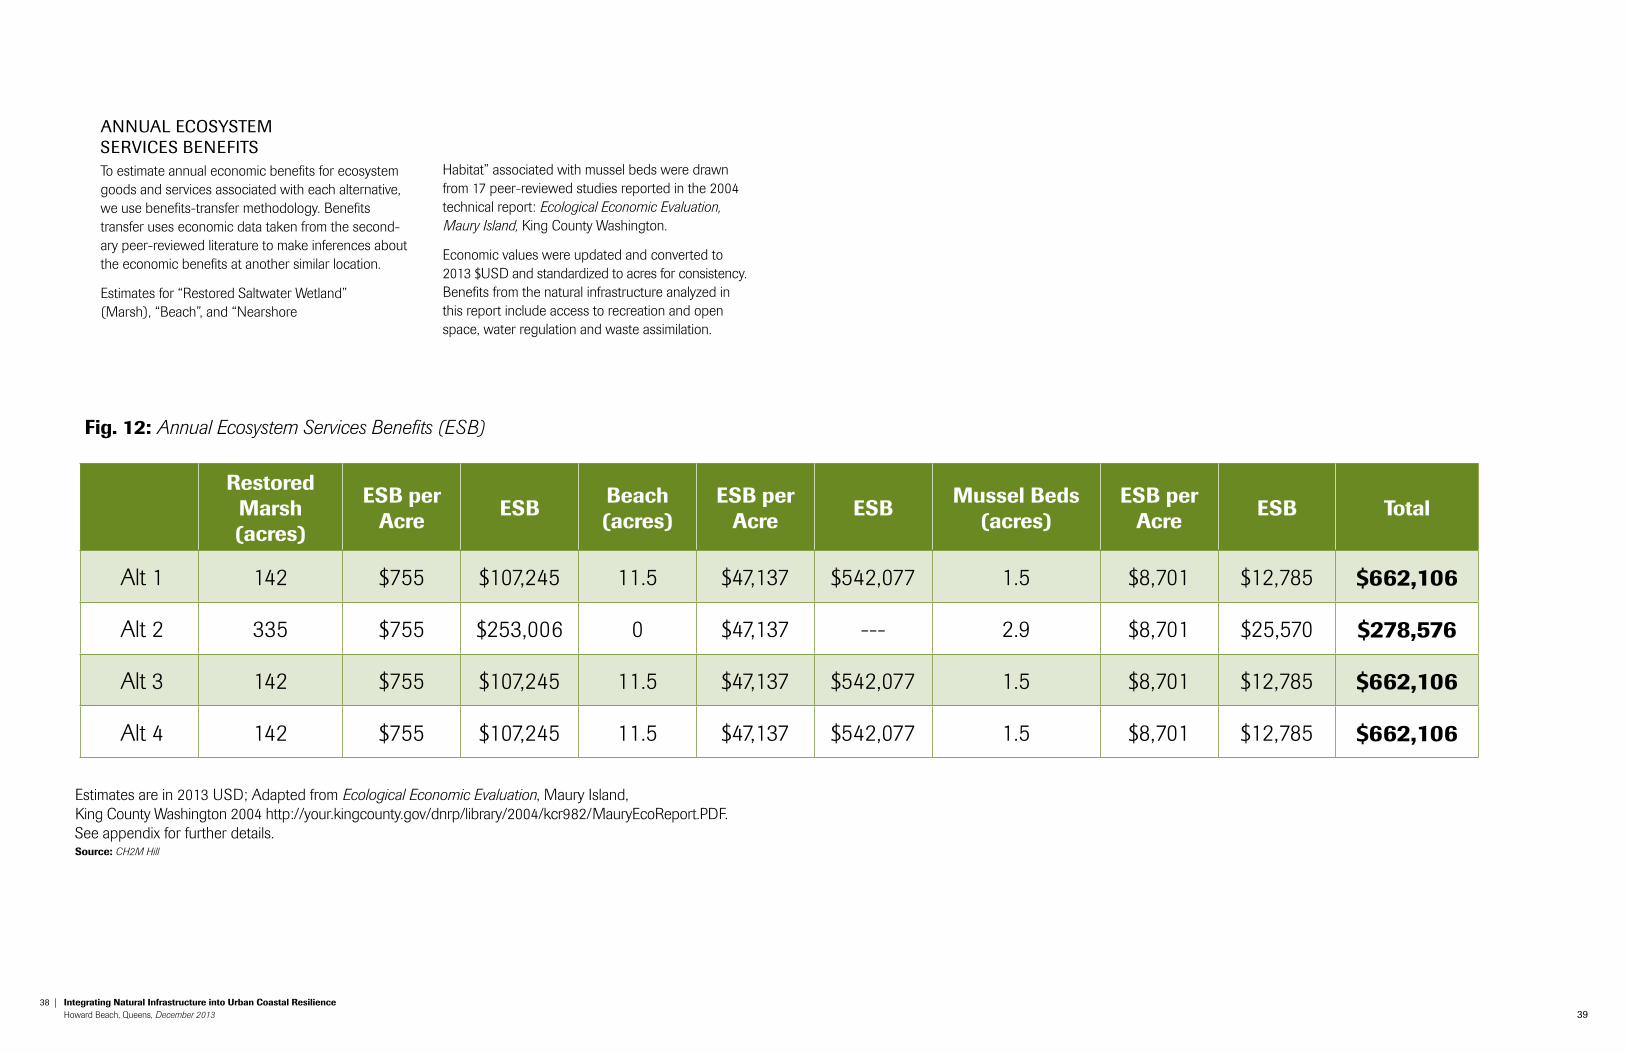
fig. 12: Annual Ecosystem Services Benefits (ESB)
Estimates are in 2013 USD; Adapted from Ecological Economic Evaluation, Maury Island, King County Washington 2004 http://your.kingcounty.gov/dnrp/library/2004/kcr982/MauryEcoReport.PDF. See appendix for further details. source: CH2M Hill
restored marsh (acres)
esb per acre esb beach
(acres)esb per
acre esb mussel beds (acres)
esb per acre esb total
Alt 1 142 $755 $107,245 11.5 $47,137 $542,077 1.5 $8,701 $12,785 $662,106
Alt 2 335 $755 $253,006 0 $47,137 --- 2.9 $8,701 $25,570 $278,576
Alt 3 142 $755 $107,245 11.5 $47,137 $542,077 1.5 $8,701 $12,785 $662,106
Alt 4 142 $755 $107,245 11.5 $47,137 $542,077 1.5 $8,701 $12,785 $662,106
annual ecoSYSteM ServiceS benefitS To estimate annual economic benefits for ecosystem goods and services associated with each alternative, we use benefits-transfer methodology. Benefits transfer uses economic data taken from the second-ary peer-reviewed literature to make inferences about the economic benefits at another similar location.
Estimates for “Restored Saltwater Wetland” (Marsh), “Beach”, and “Nearshore
Habitat” associated with mussel beds were drawn from 17 peer-reviewed studies reported in the 2004 technical report: Ecological Economic Evaluation, Maury Island, King County Washington.
Economic values were updated and converted to 2013 $USD and standardized to acres for consistency. Benefits from the natural infrastructure analyzed in this report include access to recreation and open space, water regulation and waste assimilation.
40 | Integrating natural Infrastructure into urban coastal resilience Howard Beach, Queens, December 2013 41
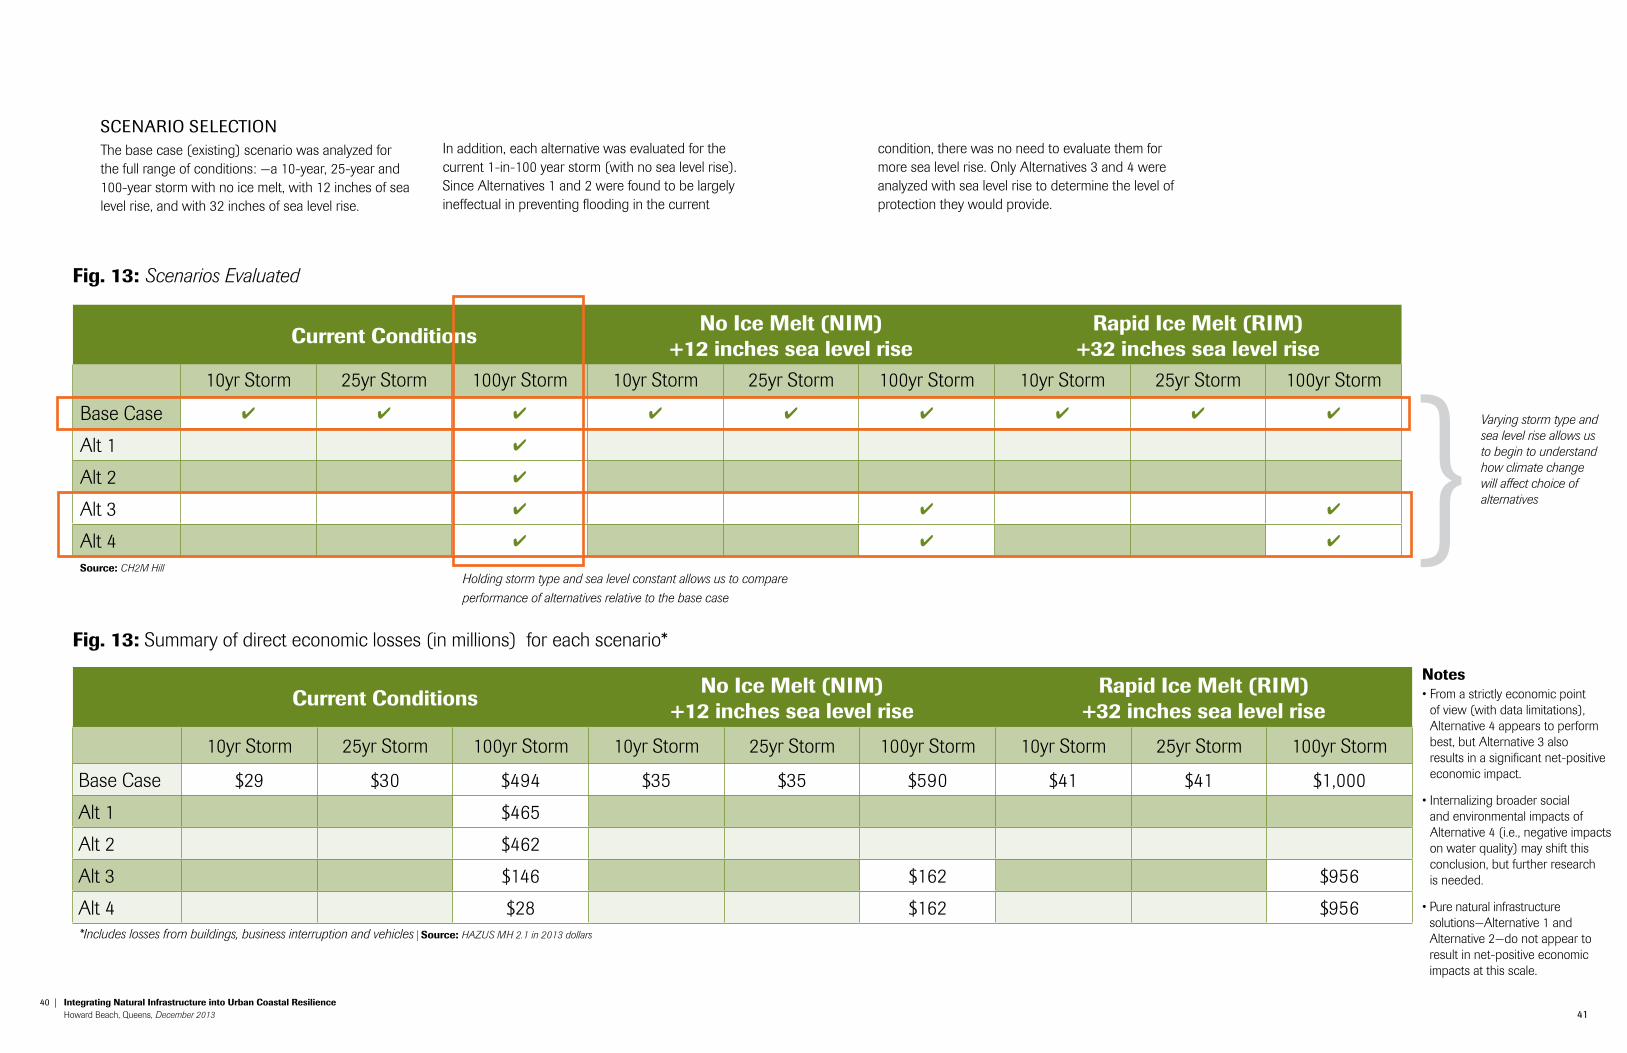
fig. 13: Summary of direct economic losses (in millions) for each scenario*
notes• From a strictly economic point
of view (with data limitations), Alternative 4 appears to perform best, but Alternative 3 also results in a significant net-positive economic impact.
• Internalizing broader social and environmental impacts of Alternative 4 (i.e., negative impacts on water quality) may shift this conclusion, but further research is needed.
• Pure natural infrastructure solutions—Alternative 1 and Alternative 2—do not appear to result in net-positive economic impacts at this scale.
current conditions no Ice melt (nIm) +12 inches sea level rise
rapid Ice melt (rIm) +32 inches sea level rise
10yr Storm 25yr Storm 100yr Storm 10yr Storm 25yr Storm 100yr Storm 10yr Storm 25yr Storm 100yr Storm
Base Case $29 $30 $494 $35 $35 $590 $41 $41 $1,000
Alt 1 $465
Alt 2 $462
Alt 3 $146 $162 $956
Alt 4 $28 $162 $956*Includes losses from buildings, business interruption and vehicles | source: HAZUS MH 2.1 in 2013 dollars
fig. 13: Scenarios Evaluated
Holding storm type and sea level constant allows us to compare performance of alternatives relative to the base case
Varying storm type and sea level rise allows us to begin to understand how climate change will affect choice of alternatives
current conditions no Ice melt (nIm) +12 inches sea level rise
rapid Ice melt (rIm) +32 inches sea level rise
10yr Storm 25yr Storm 100yr Storm 10yr Storm 25yr Storm 100yr Storm 10yr Storm 25yr Storm 100yr Storm
Base Case 4 4 4 4 4 4 4 4 4
Alt 1 4
Alt 2 4
Alt 3 4 4 4
Alt 4 4 4 4
source: CH2M Hill
Scenario SelectionThe base case (existing) scenario was analyzed for the full range of conditions: —a 10-year, 25-year and 100-year storm with no ice melt, with 12 inches of sea level rise, and with 32 inches of sea level rise.
In addition, each alternative was evaluated for the current 1-in-100 year storm (with no sea level rise). Since Alternatives 1 and 2 were found to be largely ineffectual in preventing flooding in the current
condition, there was no need to evaluate them for more sea level rise. Only Alternatives 3 and 4 were analyzed with sea level rise to determine the level of protection they would provide.
abcdefghijklmnopqrstuvxy2344
42 | Integrating natural Infrastructure into urban coastal resilience Howard Beach, Queens, December 2013 43
1-in-100 Year flood (preSent)
source: CH2M Hill
economic losses
building damage $453 M
business interruption $2 M
vehicle losses $39 Mtotal damage $494 m
debris
tons 23,490
truckloads 940
displacement
Households displaced 4,900
individuals displaced 14,500
{ baSe Scenario }
44 | Integrating natural Infrastructure into urban coastal resilience Howard Beach, Queens, December 2013 45
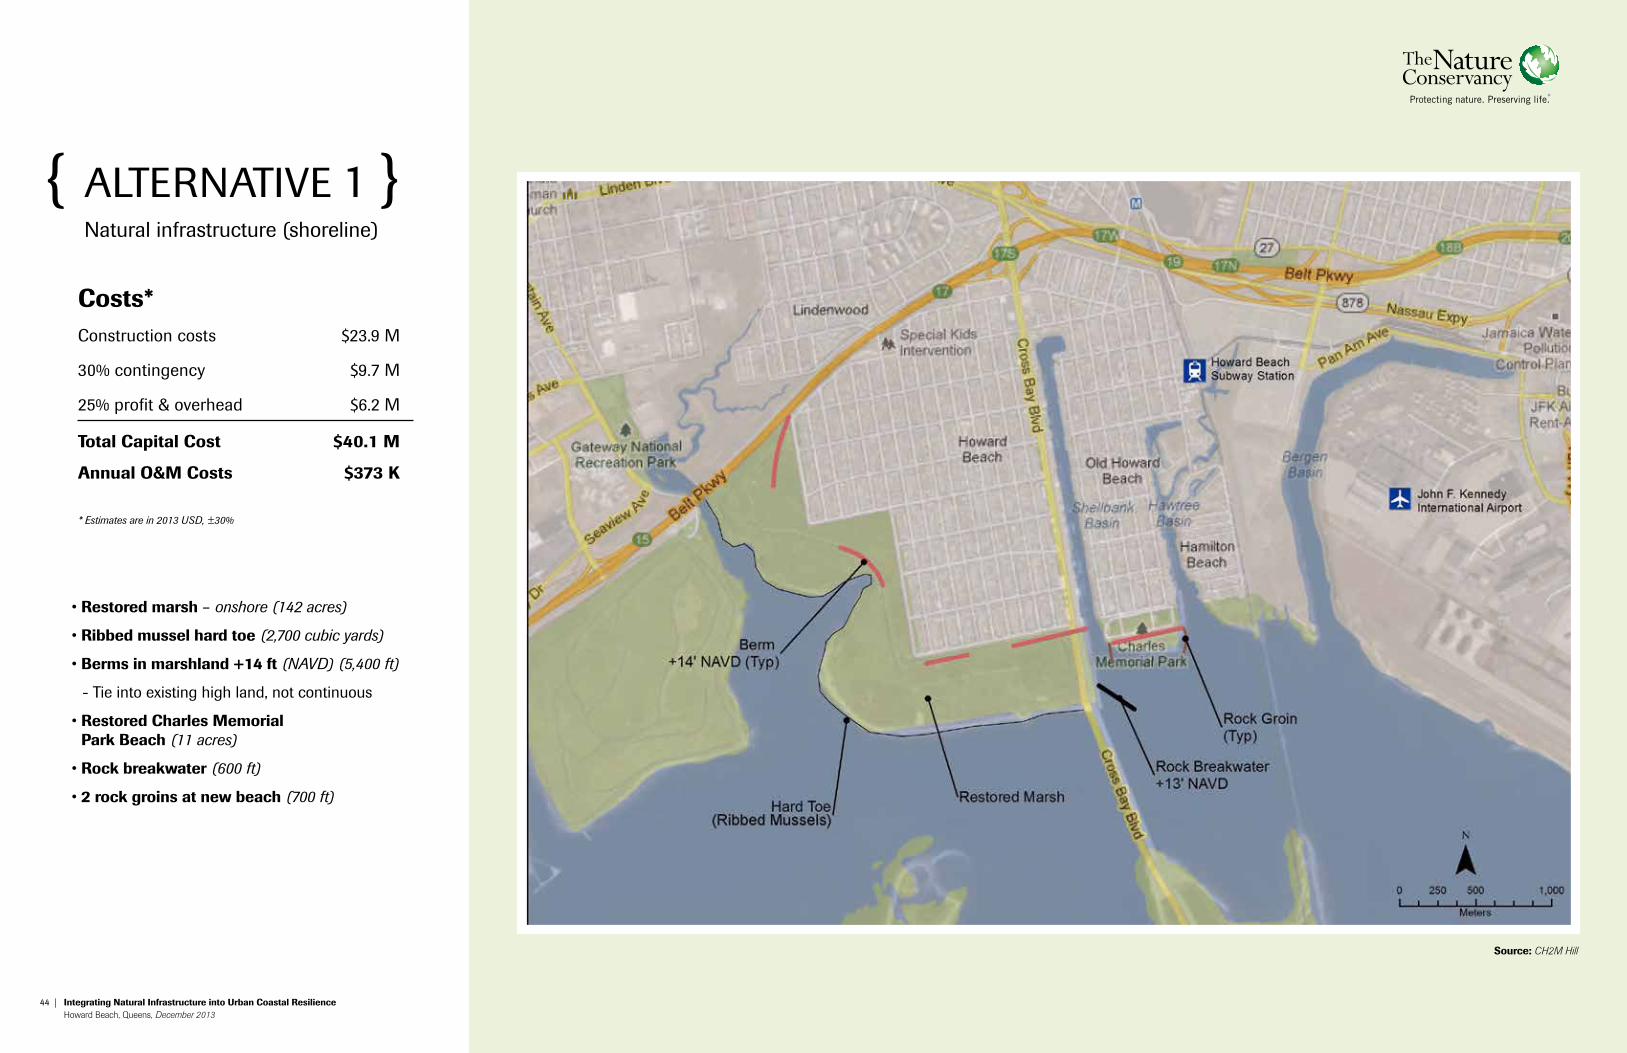
costs*construction costs $23.9 M
30% contingency $9.7 M
25% profit & overhead $6.2 M
total capital cost $40.1 m
annual o&m costs $373 k
* Estimates are in 2013 USD, ±30%
• restored marsh – onshore (142 acres)
• ribbed mussel hard toe (2,700 cubic yards)
• berms in marshland +14 ft (NAVD) (5,400 ft)
- tie into existing high land, not continuous
• restored charles memorial park beach (11 acres)
• rock breakwater (600 ft)
• 2 rock groins at new beach (700 ft)
{ alternative 1 }natural infrastructure (shoreline)
source: CH2M Hill
46 | Integrating natural Infrastructure into urban coastal resilience Howard Beach, Queens, December 2013 47
1-in-100 Year flood (preSent)
source: CH2M Hill
{ alternative 1 }natural infrastructure (shoreline)
costs*construction costs $23.9 M30% contingency $9.7 M
25% profit & overhead $6.2 M
total capital cost $40.1 mannual o&m costs $373 k
economic losses
building damage $426 M
business interruption $1.5 M
vehicle losses $37 Mtotal damage $465 m
avoided loss $29 m
debris
tons 22,531
truckloads 901
avoided truckloads 29
displacement
Households displaced 4,875
individuals displaced 14,439
avoided displacement 25 HHannual ecosystem $662 k
services benefits
* Estimates are in 2013 USD, ±30%
48 | Integrating natural Infrastructure into urban coastal resilience Howard Beach, Queens, December 2013 49
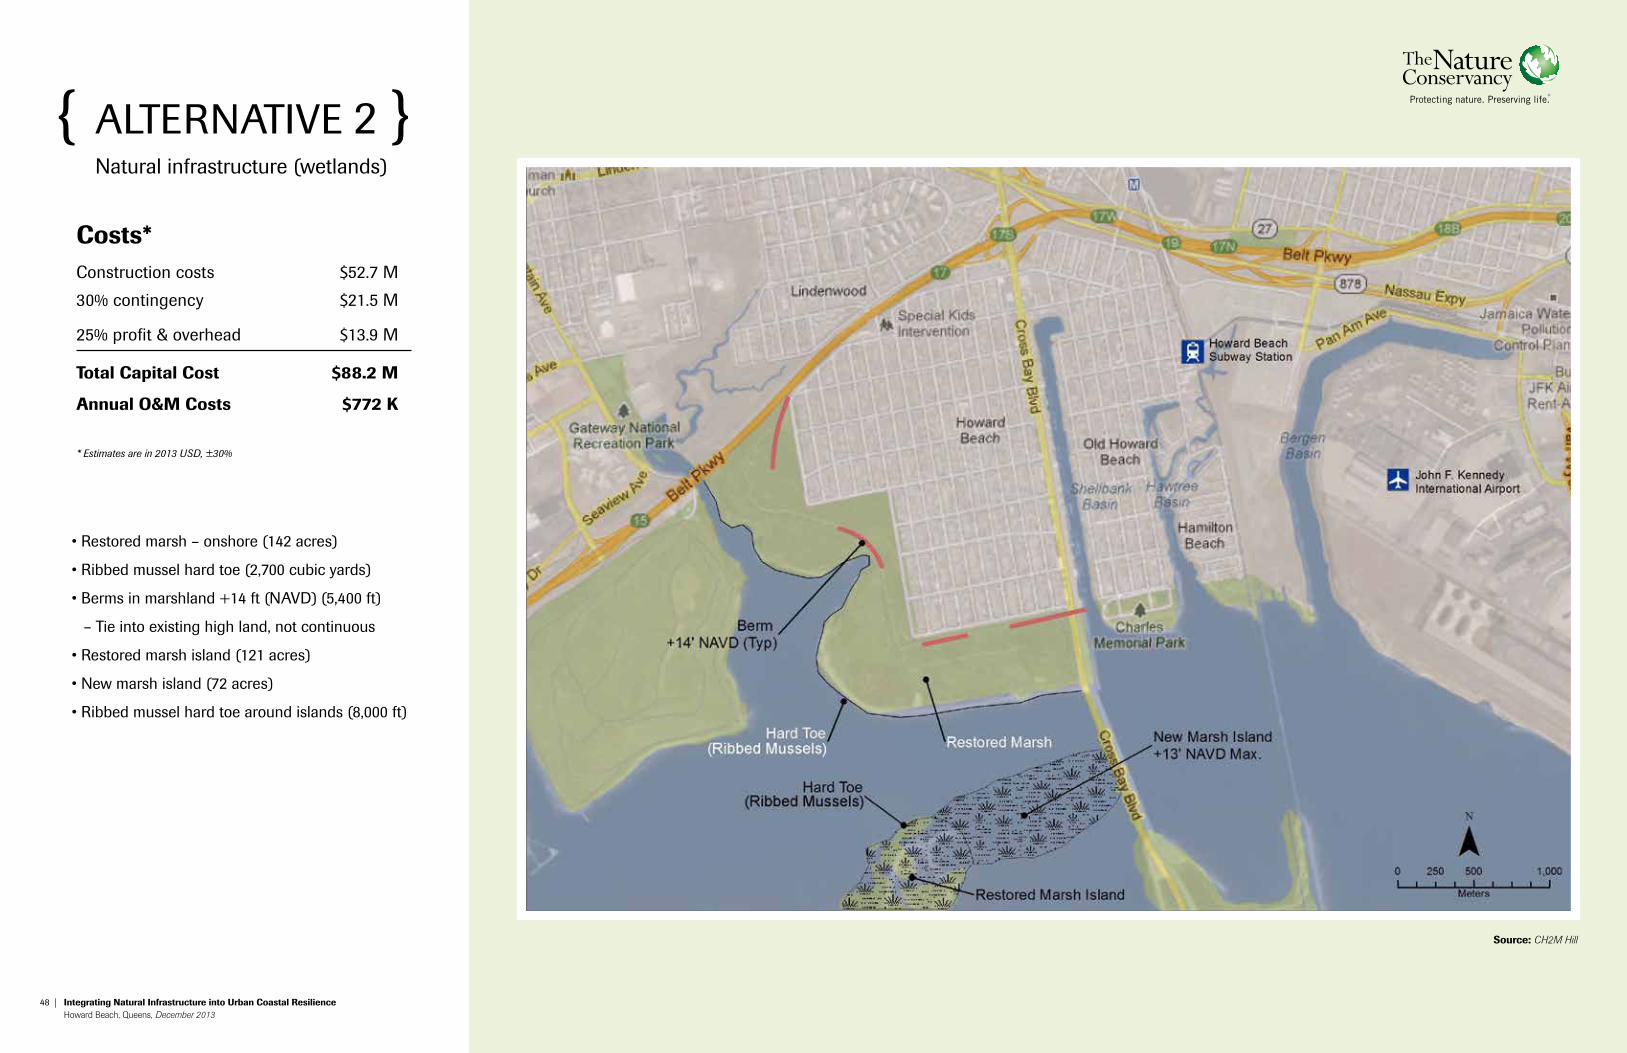
• Restored marsh – onshore (142 acres)
• Ribbed mussel hard toe (2,700 cubic yards)
• Berms in marshland +14 ft (NAVD) (5,400 ft)
– tie into existing high land, not continuous
• Restored marsh island (121 acres)
• New marsh island (72 acres)
• Ribbed mussel hard toe around islands (8,000 ft)
costs*construction costs $52.7 M
30% contingency $21.5 M
25% profit & overhead $13.9 M
total capital cost $88.2 m
annual o&m costs $772 k
* Estimates are in 2013 USD, ±30%
{ alternative 2 }natural infrastructure (wetlands)
source: CH2M Hill
50 | Integrating natural Infrastructure into urban coastal resilience Howard Beach, Queens, December 2013 51
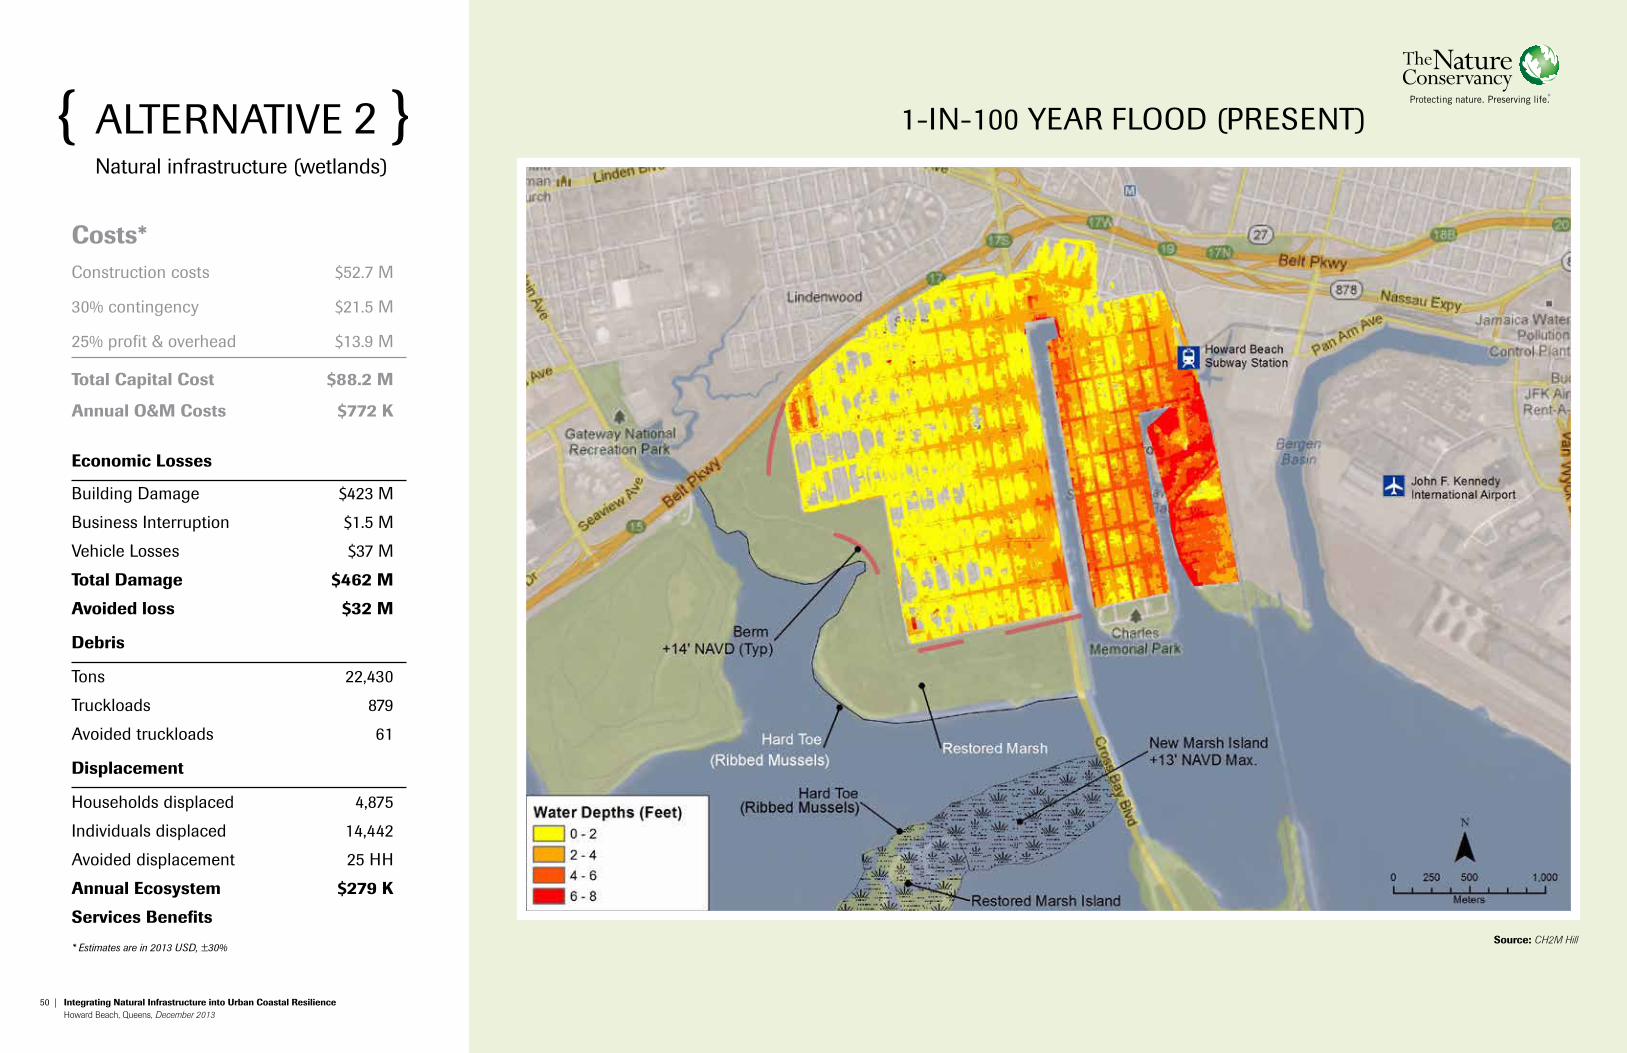
1-in-100 Year flood (preSent)
source: CH2M Hill
costs*construction costs $52.7 M
30% contingency $21.5 M
25% profit & overhead $13.9 M
total capital cost $88.2 m
annual o&m costs $772 k
economic losses
building damage $423 M
business interruption $1.5 M
vehicle losses $37 M
total damage $462 m
avoided loss $32 m
debris
tons 22,430
truckloads 879
avoided truckloads 61
displacement
Households displaced 4,875
individuals displaced 14,442
avoided displacement 25 HH
annual ecosystem $279 k
services benefits
* Estimates are in 2013 USD, ±30%
{ alternative 2 }natural infrastructure (wetlands)
52 | Integrating natural Infrastructure into urban coastal resilience Howard Beach, Queens, December 2013 53
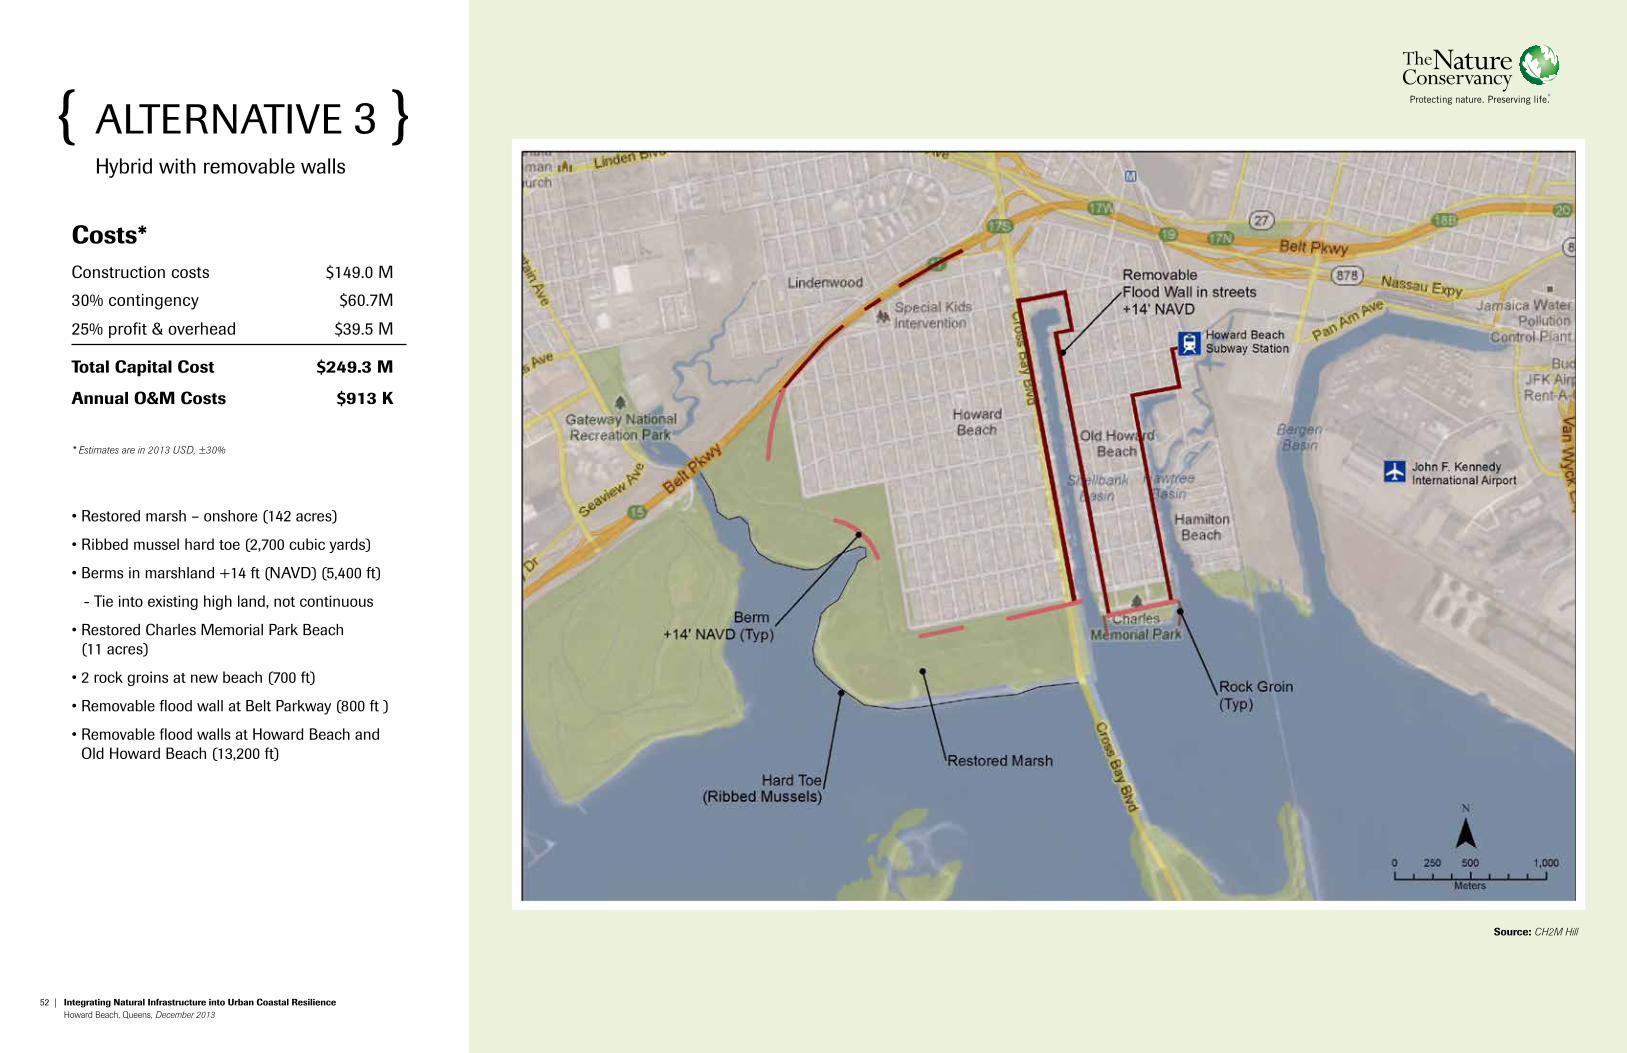
costs*construction costs $149.0 M
30% contingency $60.7M
25% profit & overhead $39.5 M
total capital cost $249.3 m
annual o&m costs $913 k
* Estimates are in 2013 USD, ±30%
• Restored marsh – onshore (142 acres)
• Ribbed mussel hard toe (2,700 cubic yards)
• Berms in marshland +14 ft (NAVD) (5,400 ft)
- tie into existing high land, not continuous
• Restored Charles Memorial Park Beach (11 acres)
• 2 rock groins at new beach (700 ft)
• Removable flood wall at Belt Parkway (800 ft )
• Removable flood walls at Howard Beach and old Howard beach (13,200 ft)
{ alternative 3 }Hybrid with removable walls
source: CH2M Hill
54 | Integrating natural Infrastructure into urban coastal resilience Howard Beach, Queens, December 2013 55
Images not to scale
rSa flood wall shown
source: CH2M Hill
56 | Integrating natural Infrastructure into urban coastal resilience Howard Beach, Queens, December 2013 57
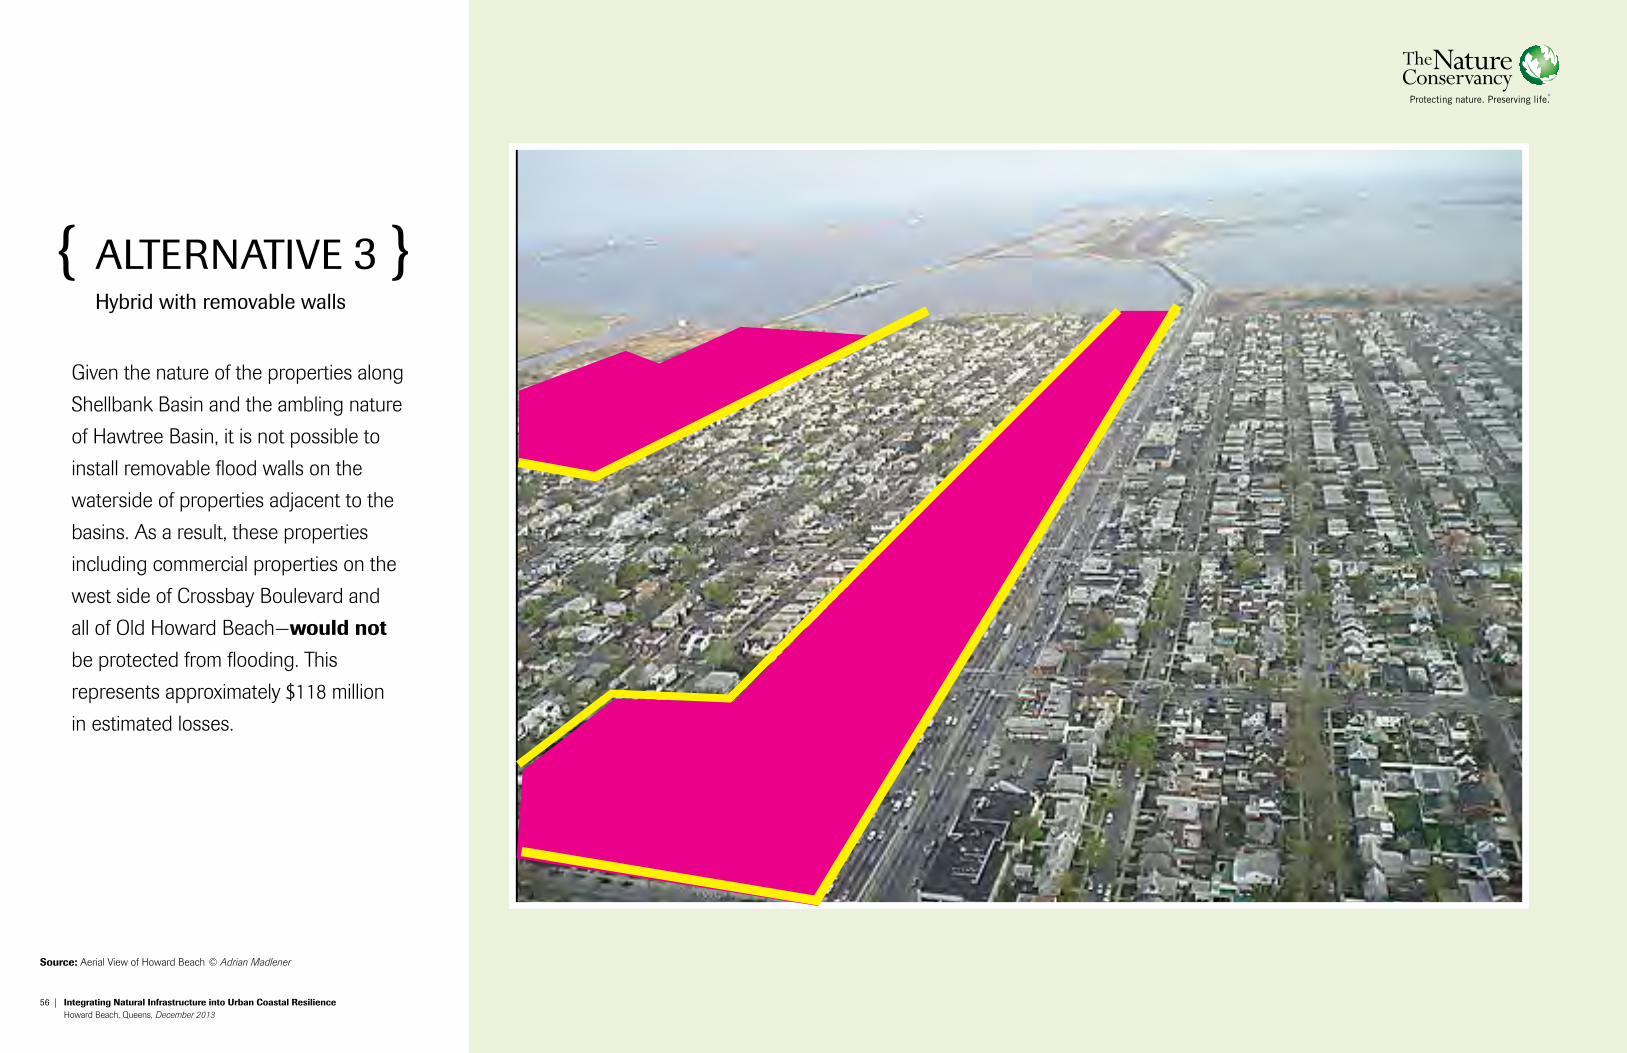
Given the nature of the properties along
Shellbank Basin and the ambling nature
of Hawtree Basin, it is not possible to
install removable flood walls on the
waterside of properties adjacent to the
basins. As a result, these properties
including commercial properties on the
west side of Crossbay Boulevard and
all of Old Howard Beach—would not be protected from flooding. This
represents approximately $118 million
in estimated losses.
{ alternative 3 }Hybrid with removable walls
source: Aerial View of Howard Beach © Adrian Madlener
58 | Integrating natural Infrastructure into urban coastal resilience Howard Beach, Queens, December 2013 59
{ alternative 3 }Hybrid with removable walls
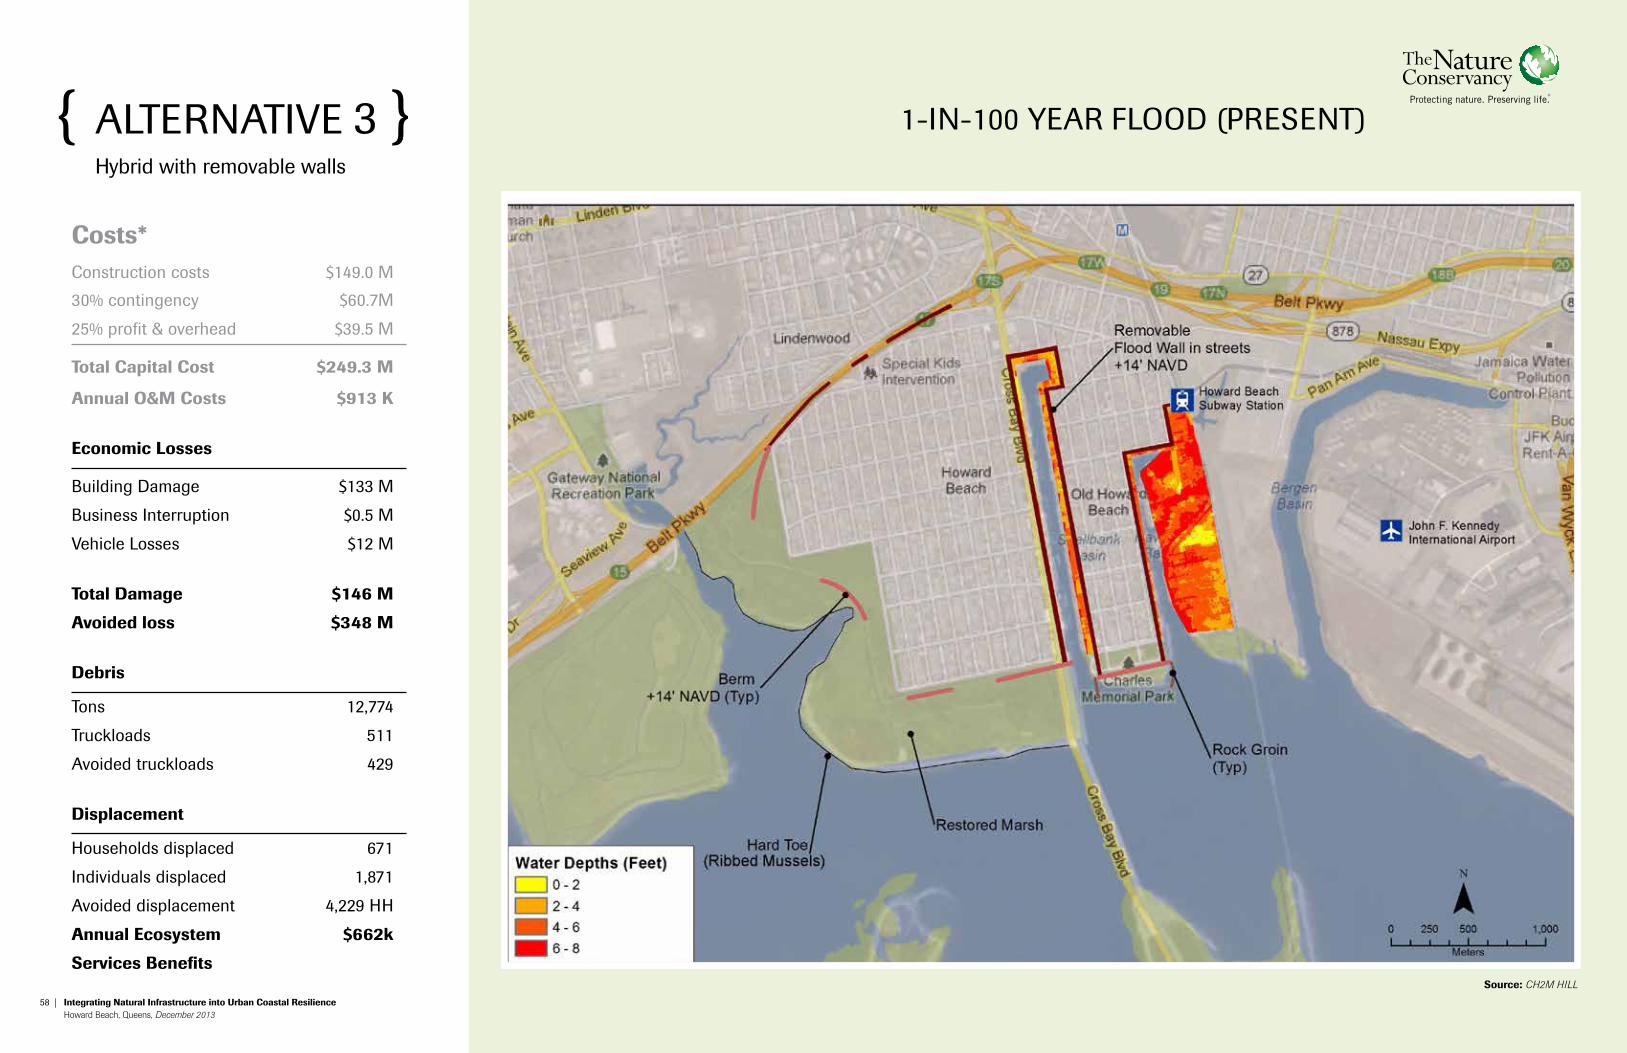
costs*construction costs $149.0 M
30% contingency $60.7M
25% profit & overhead $39.5 M
total capital cost $249.3 m
annual o&m costs $913 k
economic losses
building damage $133 M
business interruption $0.5 M
vehicle losses $12 M
total damage $146 m
avoided loss $348 m
debris
tons 12,774
truckloads 511
avoided truckloads 429
displacement
Households displaced 671
individuals displaced 1,871
avoided displacement 4,229 HH
annual ecosystem $662k
services benefits
1-in-100 Year flood (preSent)
source: CH2M HILL
60 | Integrating natural Infrastructure into urban coastal resilience Howard Beach, Queens, December 2013 61
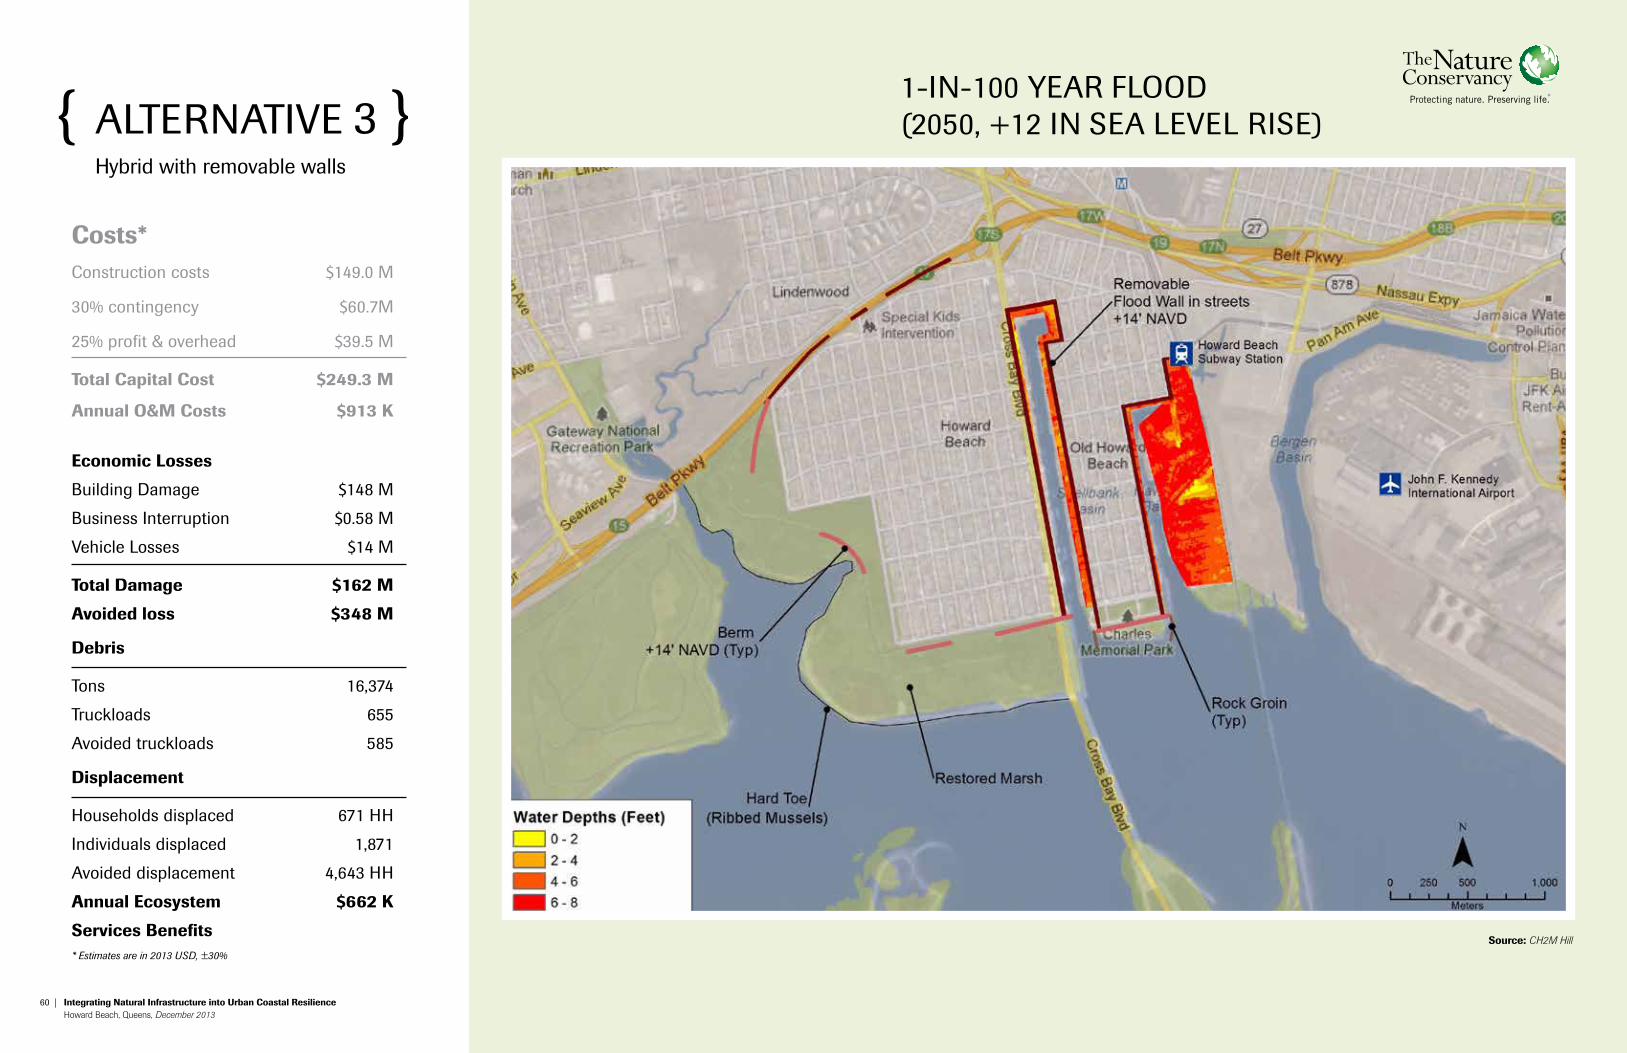
costs*construction costs $149.0 M
30% contingency $60.7M
25% profit & overhead $39.5 M
total capital cost $249.3 m
annual o&m costs $913 k
economic losses
building damage $148 M
business interruption $0.58 M
vehicle losses $14 M
total damage $162 m
avoided loss $348 m
debris
tons 16,374
truckloads 655
avoided truckloads 585
displacement
Households displaced 671 HH
individuals displaced 1,871
avoided displacement 4,643 HH
annual ecosystem $662 k
services benefits * Estimates are in 2013 USD, ±30%
{ alternative 3 }Hybrid with removable walls
1-in-100 Year flood (2050, +12 iN SEA LEVEL RiSE)
source: CH2M Hill
62 | Integrating natural Infrastructure into urban coastal resilience Howard Beach, Queens, December 2013 63
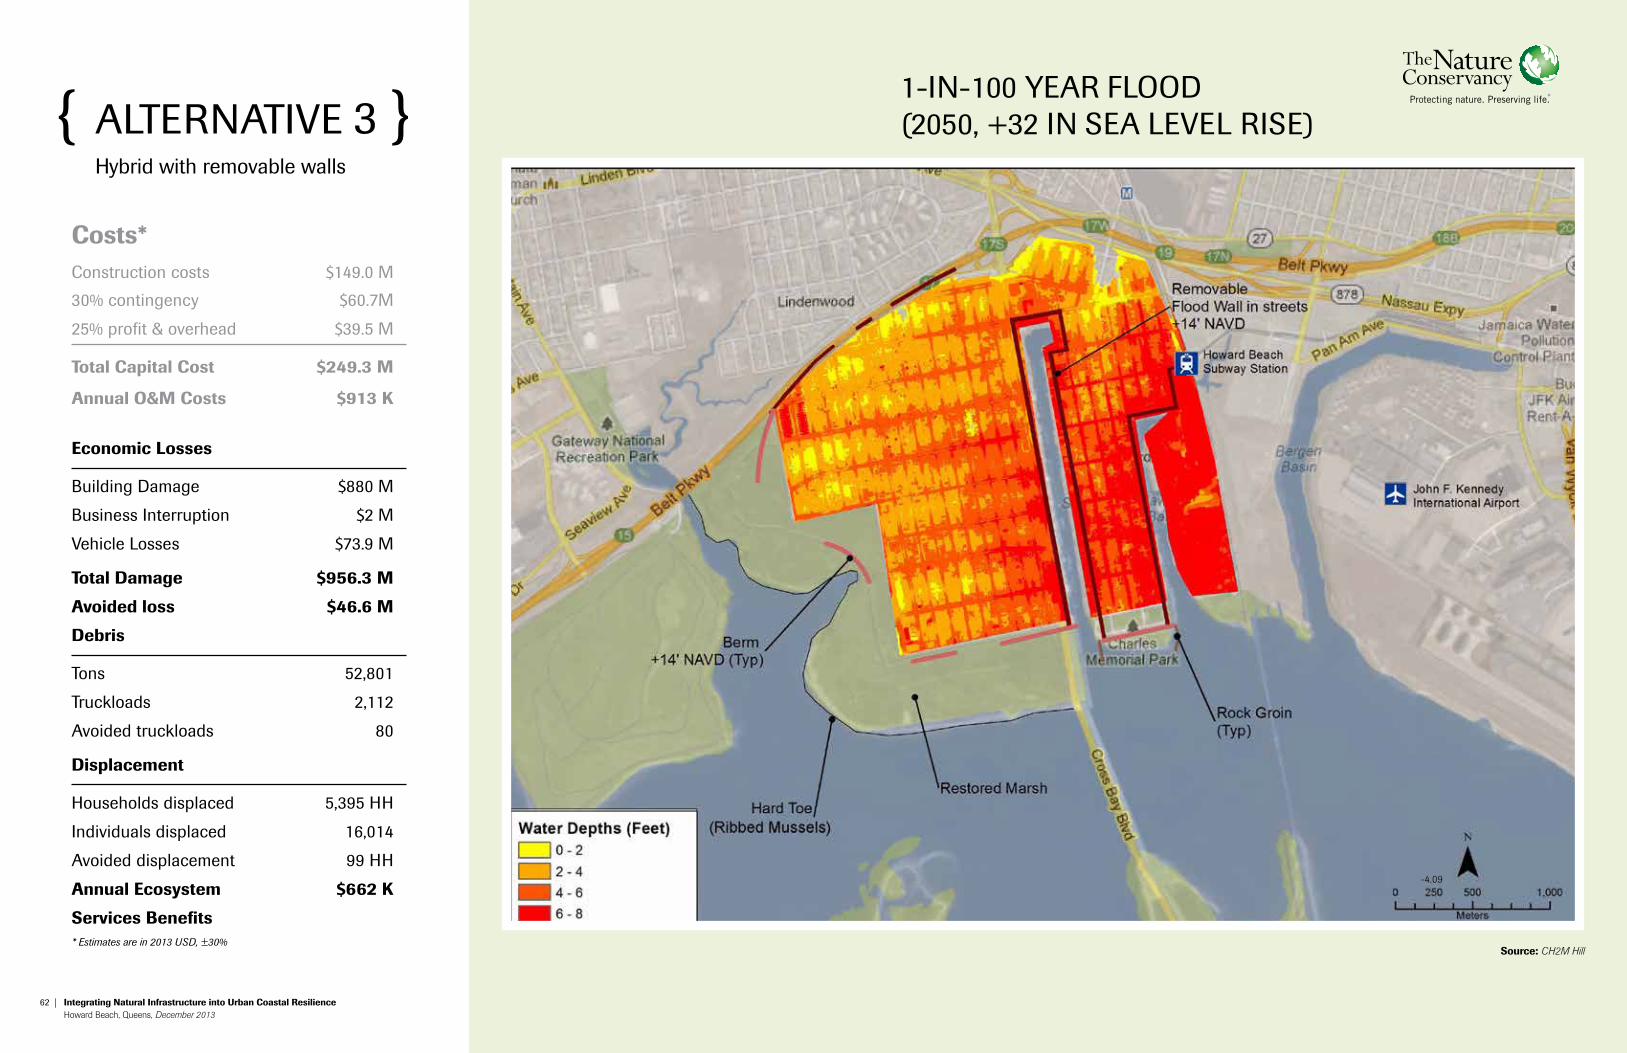
1-in-100 Year flood (2050, +32 iN SEA LEVEL RiSE){ alternative 3 }
Hybrid with removable walls
costs*construction costs $149.0 M
30% contingency $60.7M
25% profit & overhead $39.5 M
total capital cost $249.3 m
annual o&m costs $913 k
economic losses
building damage $880 M
business interruption $2 M
vehicle losses $73.9 M
total damage $956.3 m
avoided loss $46.6 m
debris
tons 52,801
truckloads 2,112
avoided truckloads 80
displacement
Households displaced 5,395 HH
individuals displaced 16,014
avoided displacement 99 HH
annual ecosystem $662 k
services benefits * Estimates are in 2013 USD, ±30%
source: CH2M Hill
-4.09
64 | Integrating natural Infrastructure into urban coastal resilience Howard Beach, Queens, December 2013 65
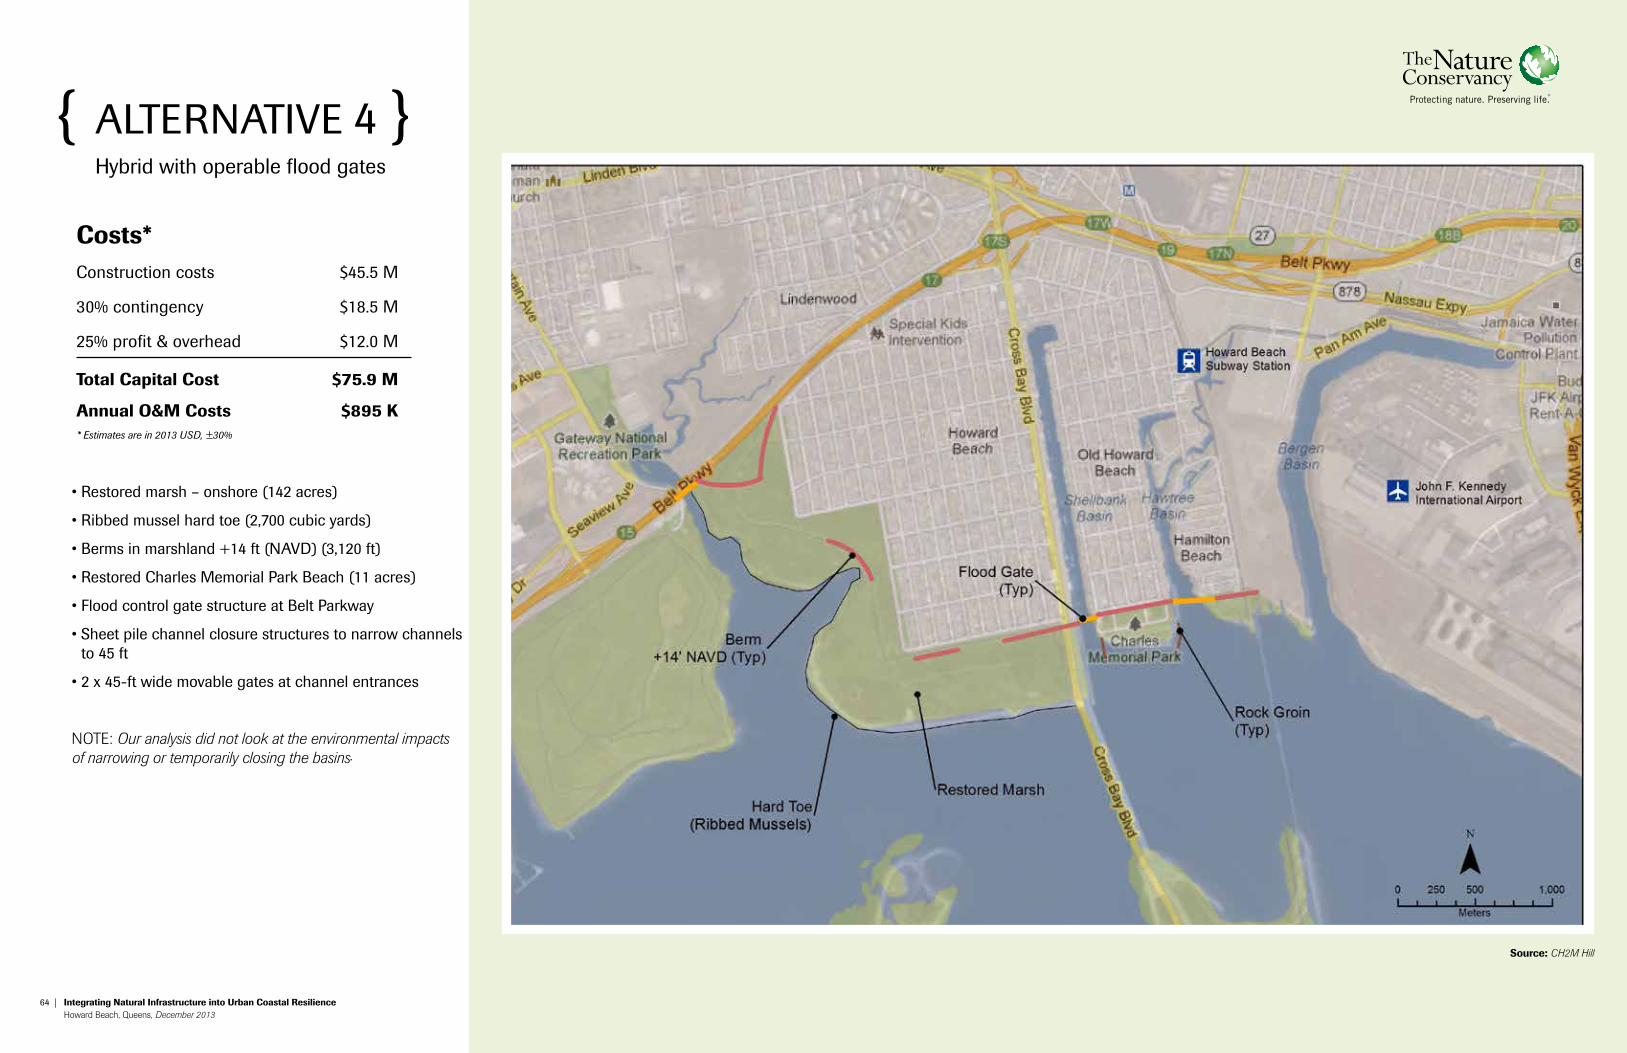
{ alternative 4 }Hybrid with operable flood gates
• Restored marsh – onshore (142 acres)
• Ribbed mussel hard toe (2,700 cubic yards)
• Berms in marshland +14 ft (NAVD) (3,120 ft)
• Restored Charles Memorial Park Beach (11 acres)
• Flood control gate structure at Belt Parkway
• Sheet pile channel closure structures to narrow channels to 45 ft
• 2 x 45-ft wide movable gates at channel entrances
NOTE: Our analysis did not look at the environmental impacts of narrowing or temporarily closing the basins.
costs*construction costs $45.5 M
30% contingency $18.5 M
25% profit & overhead $12.0 M
total capital cost $75.9 m
annual o&m costs $895 k* Estimates are in 2013 USD, ±30%
source: CH2M Hill
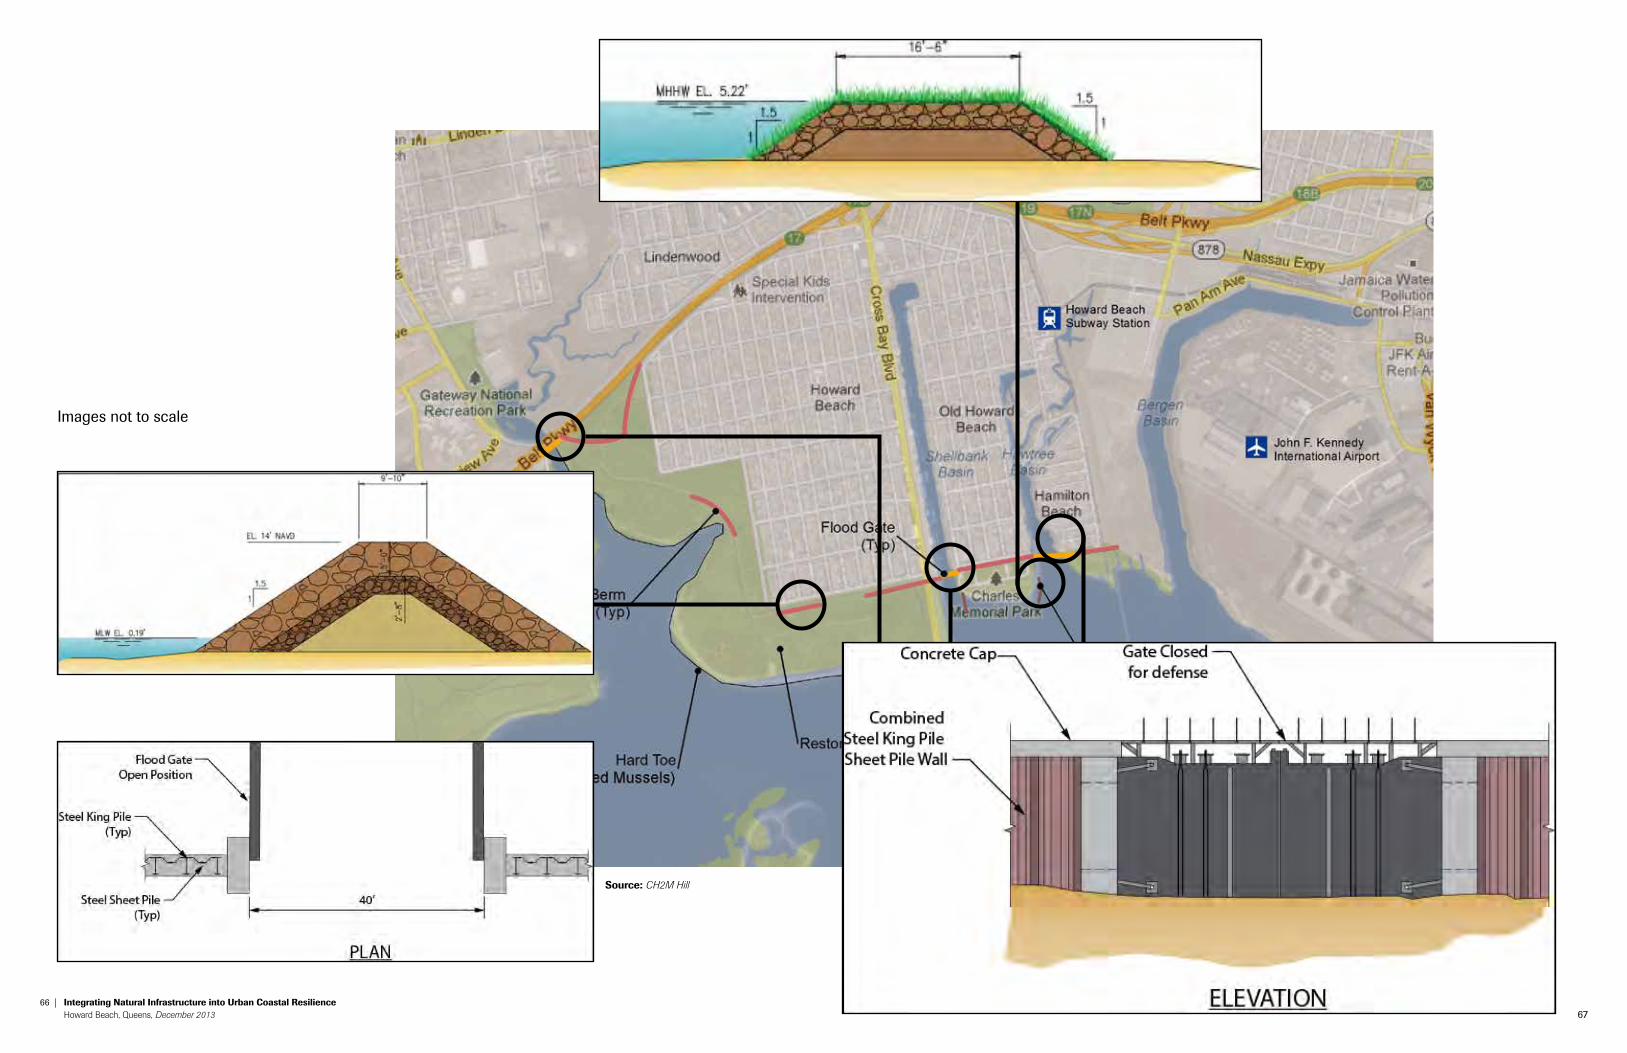
66 | Integrating natural Infrastructure into urban coastal resilience Howard Beach, Queens, December 2013 67
images not to scale
source: CH2M Hill
68 | Integrating natural Infrastructure into urban coastal resilience Howard Beach, Queens, December 2013 69
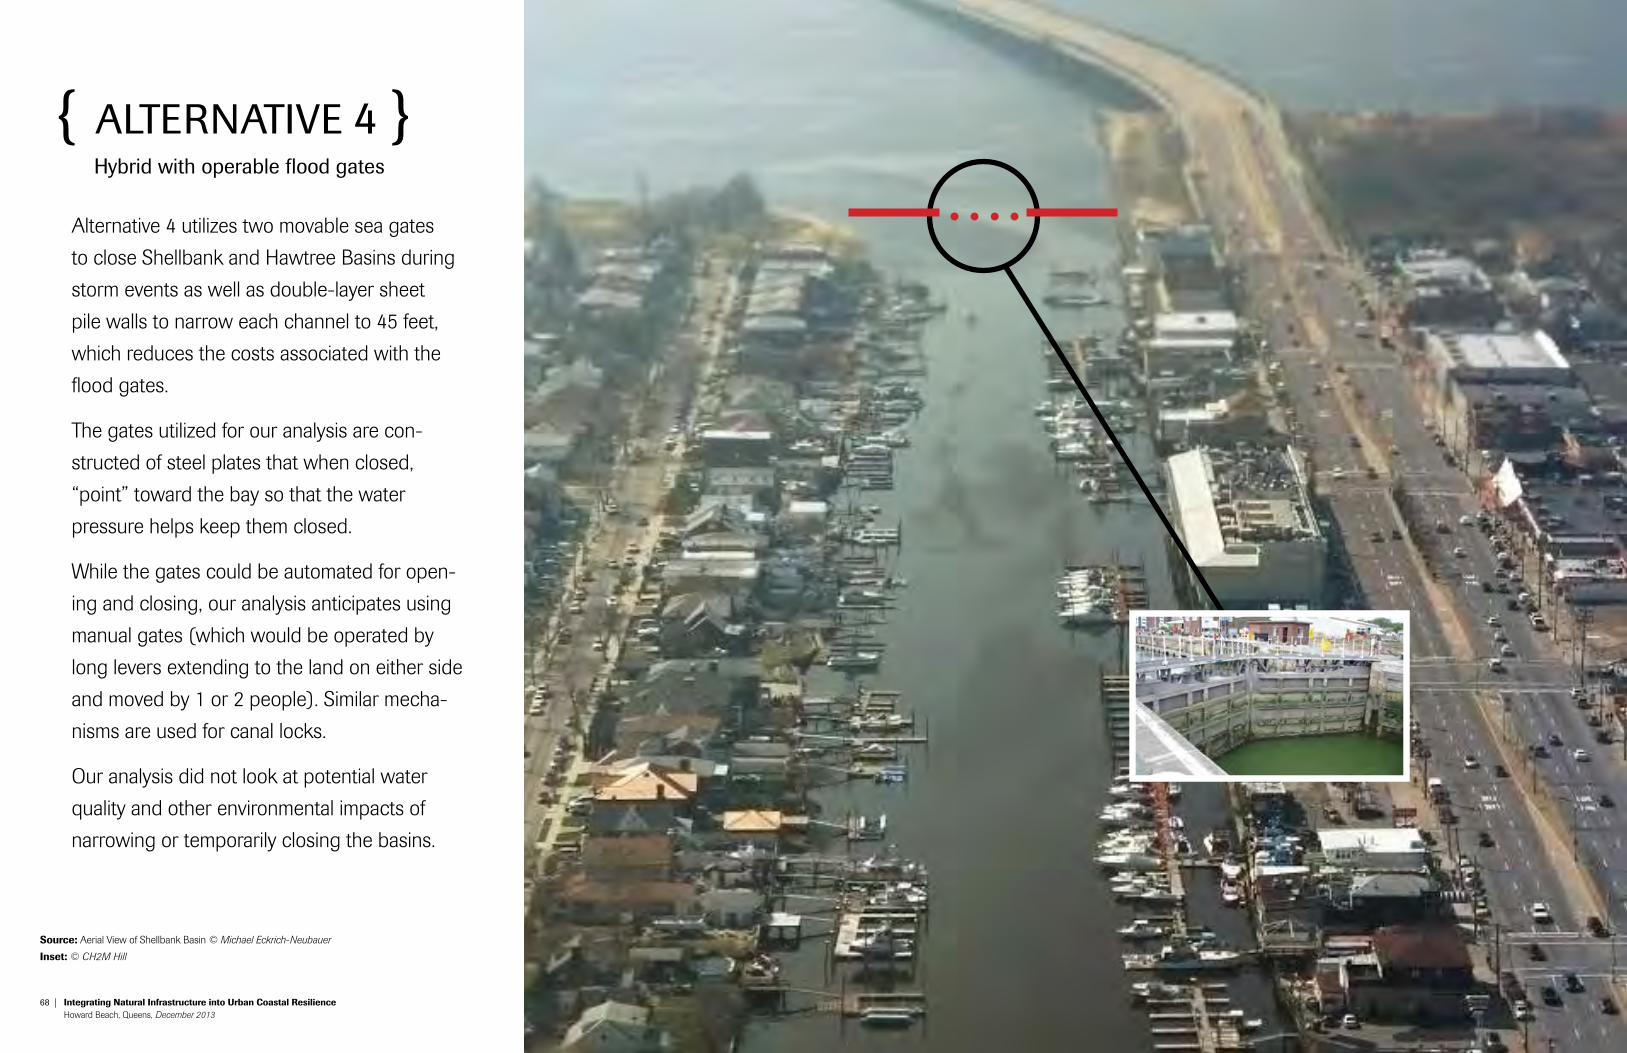
Alternative 4 utilizes two movable sea gates
to close Shellbank and Hawtree Basins during
storm events as well as double-layer sheet
pile walls to narrow each channel to 45 feet,
which reduces the costs associated with the
flood gates.
The gates utilized for our analysis are con-
structed of steel plates that when closed,
“point” toward the bay so that the water
pressure helps keep them closed.
While the gates could be automated for open-
ing and closing, our analysis anticipates using
manual gates (which would be operated by
long levers extending to the land on either side
and moved by 1 or 2 people). Similar mecha-
nisms are used for canal locks.
Our analysis did not look at potential water
quality and other environmental impacts of
narrowing or temporarily closing the basins.
{ alternative 4 } Hybrid with operable flood gates
source: Aerial View of Shellbank Basin © Michael Eckrich-Neubauer
Inset: © CH2M Hill
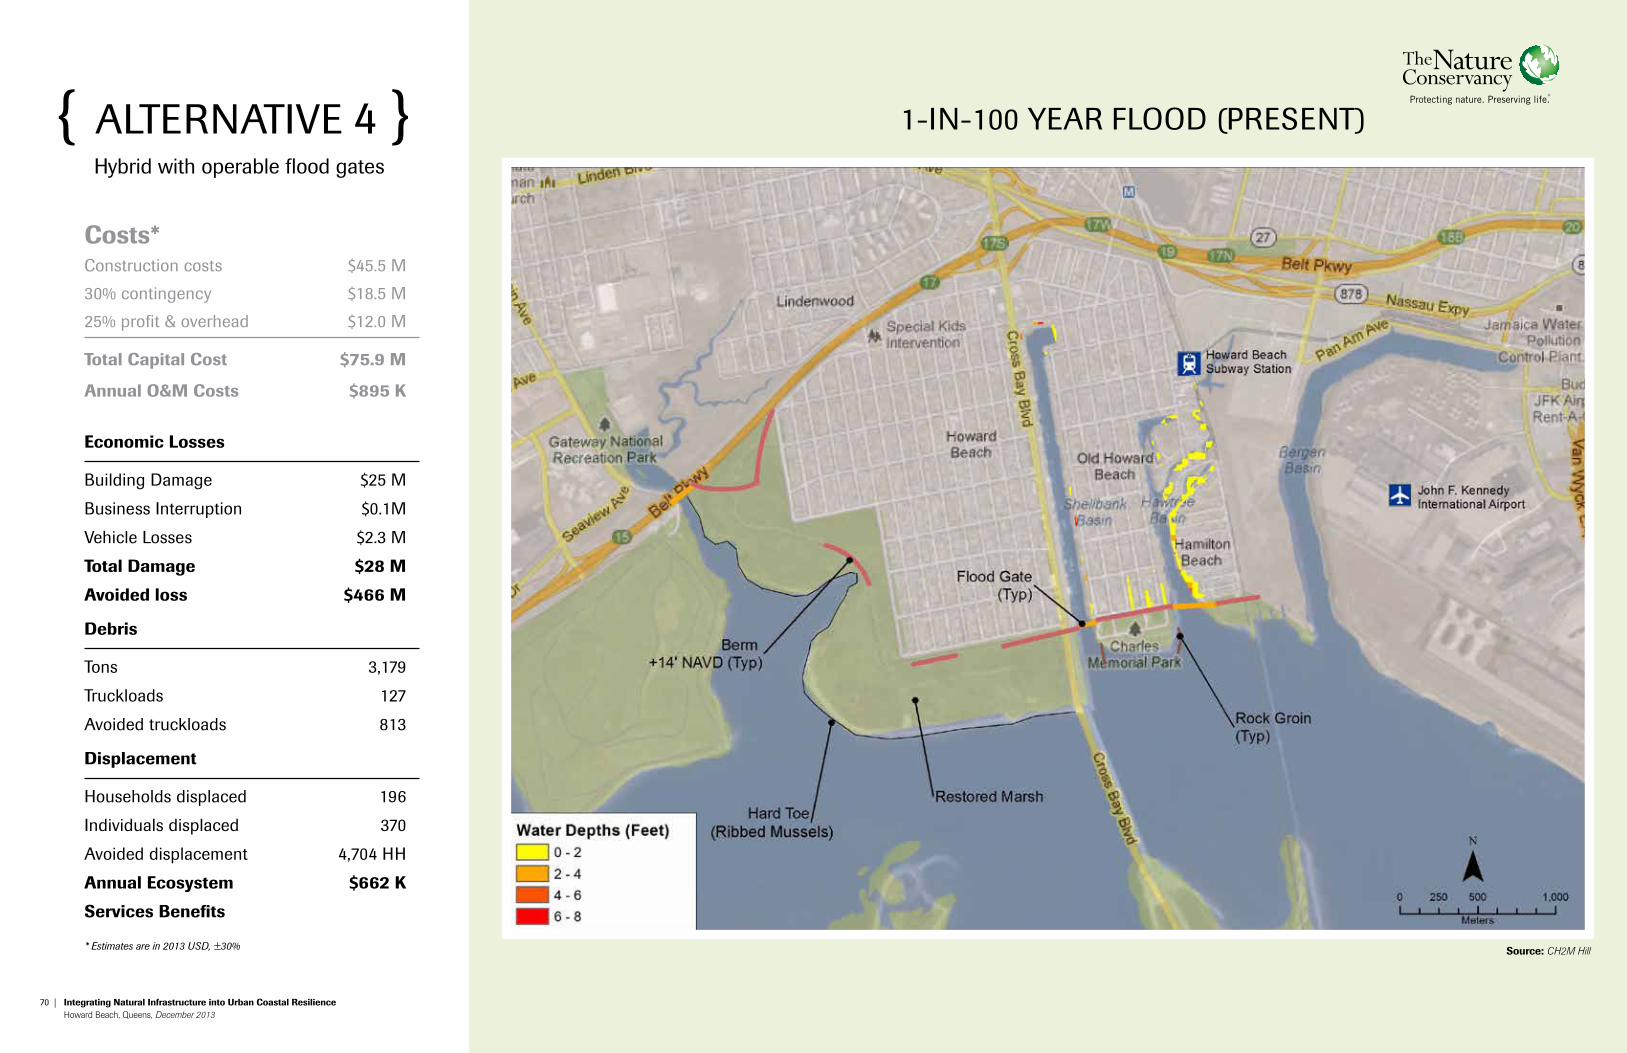
70 | Integrating natural Infrastructure into urban coastal resilience Howard Beach, Queens, December 2013 71
{ alternative 4 } Hybrid with operable flood gates
source: CH2M Hill
costs*construction costs $45.5 M
30% contingency $18.5 M
25% profit & overhead $12.0 M
total capital cost $75.9 m
annual o&m costs $895 k
economic losses
building damage $25 M
business interruption $0.1M
vehicle losses $2.3 M
total damage $28 m
avoided loss $466 m
debris
tons 3,179
truckloads 127
avoided truckloads 813
displacement
Households displaced 196
individuals displaced 370
avoided displacement 4,704 HH
annual ecosystem $662 k
services benefits
* Estimates are in 2013 USD, ±30%
1-in-100 Year flood (preSent)
72 | Integrating natural Infrastructure into urban coastal resilience Howard Beach, Queens, December 2013 73
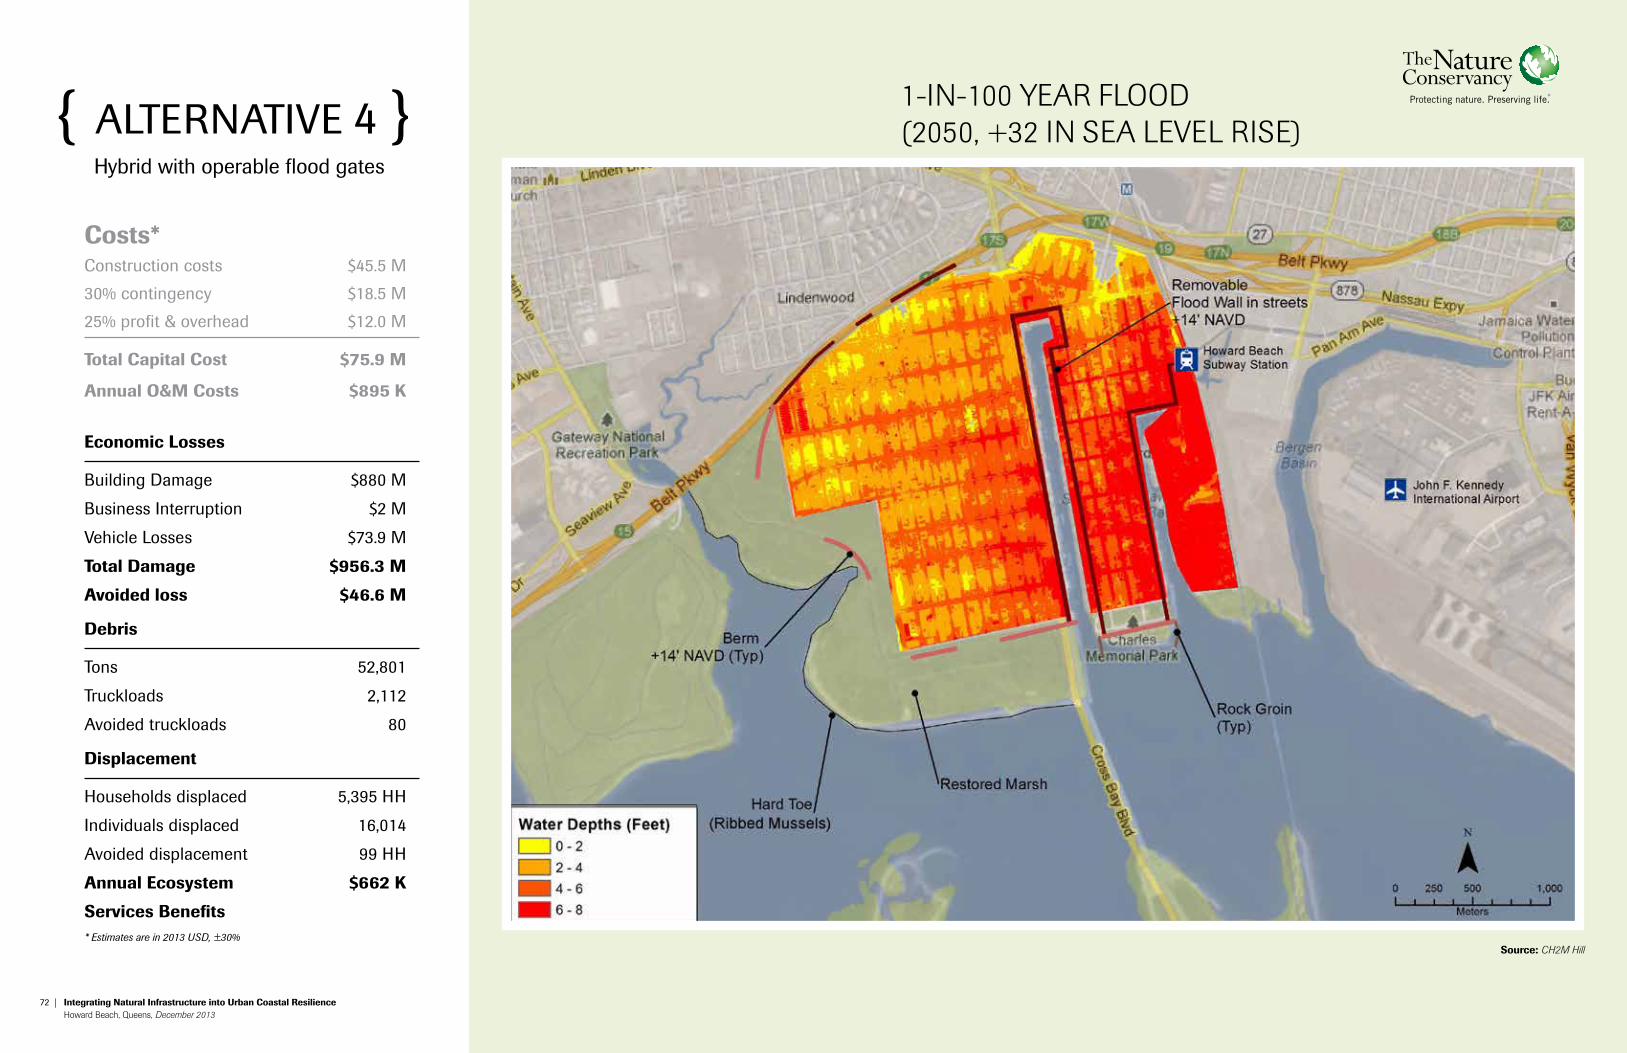
1-IN-100 YEAR FLOOD (2050, +32 IN SEA LEVEL RISE)
source: CH2M Hill
{ alternative 4 } Hybrid with operable flood gates
costs*construction costs $45.5 M
30% contingency $18.5 M
25% profit & overhead $12.0 M
total capital cost $75.9 m
annual o&m costs $895 k
economic losses
building damage $880 M
business interruption $2 M
vehicle losses $73.9 M
total damage $956.3 m
avoided loss $46.6 m
debris
tons 52,801
truckloads 2,112
avoided truckloads 80
displacement
Households displaced 5,395 HH
individuals displaced 16,014
avoided displacement 99 HH
annual ecosystem $662 k
services benefits* Estimates are in 2013 USD, ±30%
74 | Integrating natural Infrastructure into urban coastal resilience Howard Beach, Queens, December 2013 75
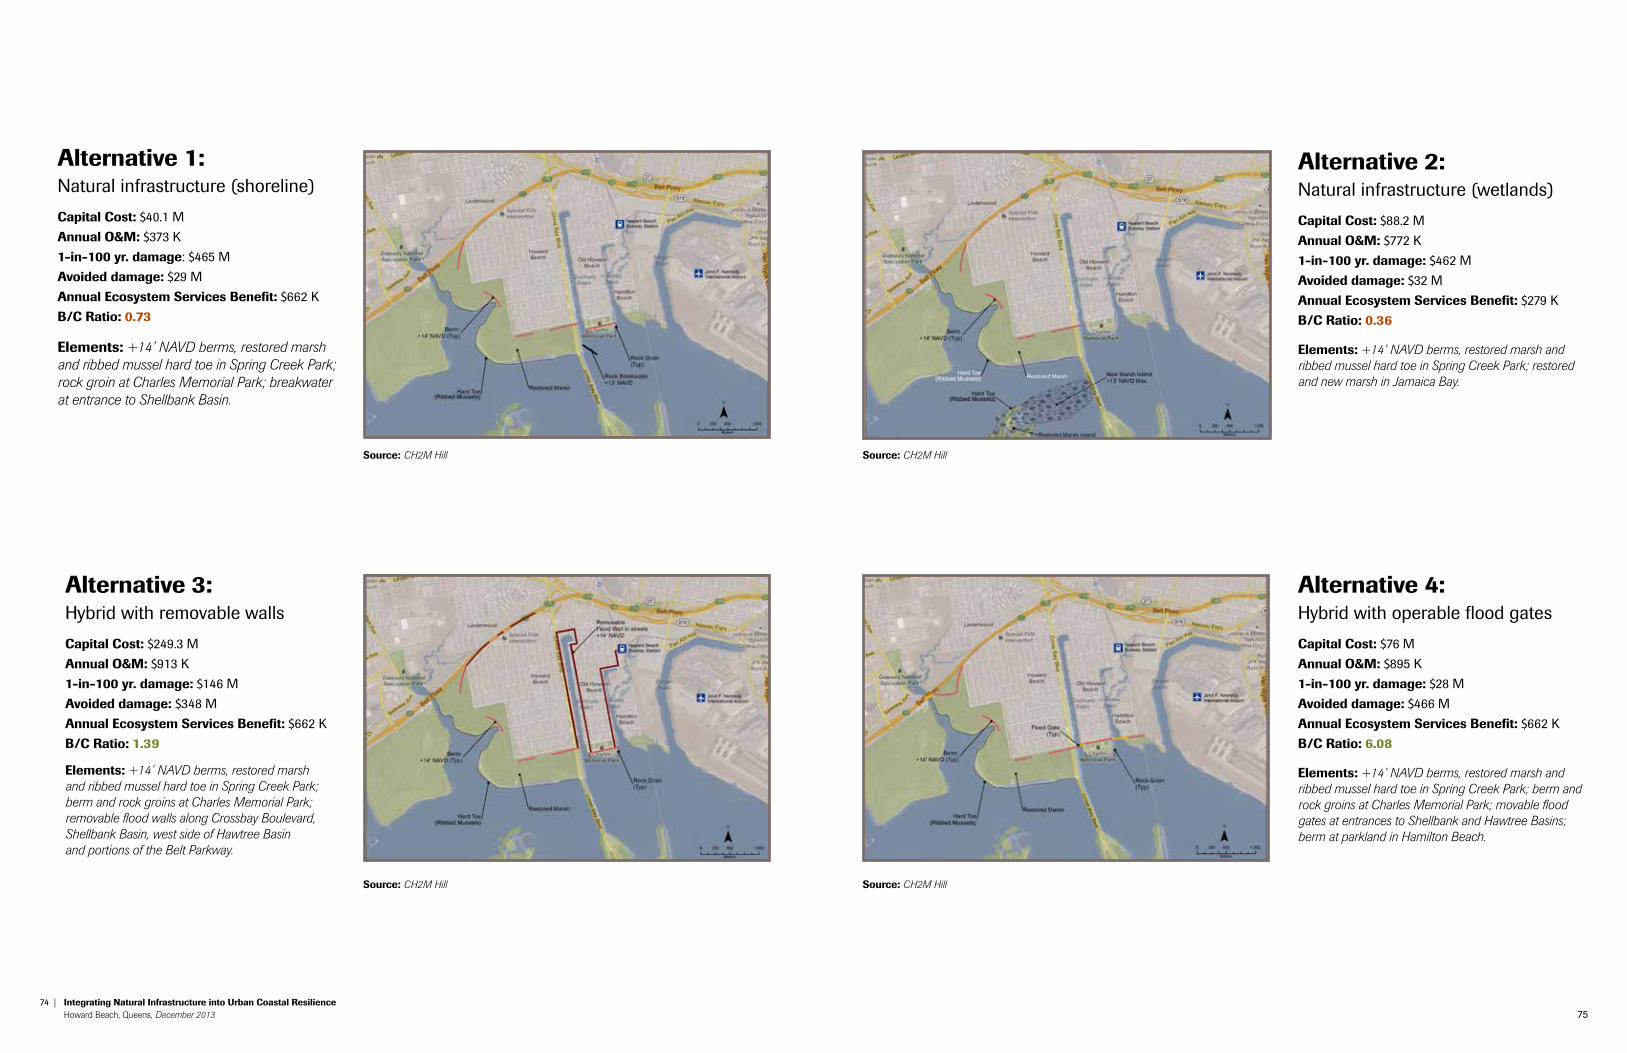
alternative 2: natural infrastructure (wetlands)
capital cost: $88.2 M
annual o&m: $772 k
1-in-100 yr. damage: $462 M
avoided damage: $32 M
annual ecosystem services benefit: $279 k
b/c ratio: 0.36
elements: +14’ NAVD berms, restored marsh and ribbed mussel hard toe in Spring Creek Park; restored and new marsh in Jamaica Bay.
alternative 3: Hybrid with removable walls
capital cost: $249.3 M
annual o&m: $913 k
1-in-100 yr. damage: $146 M
avoided damage: $348 M
annual ecosystem services benefit: $662 k
b/c ratio: 1.39
elements: +14’ NAVD berms, restored marsh and ribbed mussel hard toe in Spring Creek Park; berm and rock groins at Charles Memorial Park; removable flood walls along Crossbay Boulevard, Shellbank Basin, west side of Hawtree Basin and portions of the Belt Parkway.
alternative 4: Hybrid with operable flood gates
capital cost: $76 M
annual o&m: $895 k
1-in-100 yr. damage: $28 M
avoided damage: $466 M
annual ecosystem services benefit: $662 k
b/c ratio: 6.08
elements: +14’ NAVD berms, restored marsh and ribbed mussel hard toe in Spring Creek Park; berm and rock groins at Charles Memorial Park; movable flood gates at entrances to Shellbank and Hawtree Basins; berm at parkland in Hamilton Beach.
alternative 1: natural infrastructure (shoreline)
capital cost: $40.1 M
annual o&m: $373 k
1-in-100 yr. damage: $465 M
avoided damage: $29 M
annual ecosystem services benefit: $662 k
b/c ratio: 0.73
elements: +14’ NAVD berms, restored marsh and ribbed mussel hard toe in Spring Creek Park; rock groin at Charles Memorial Park; breakwater at entrance to Shellbank Basin.
source: CH2M Hill
source: CH2M Hill source: CH2M Hill
source: CH2M Hill
76 | Integrating natural Infrastructure into urban coastal resilience Howard Beach, Queens, December 2013 77
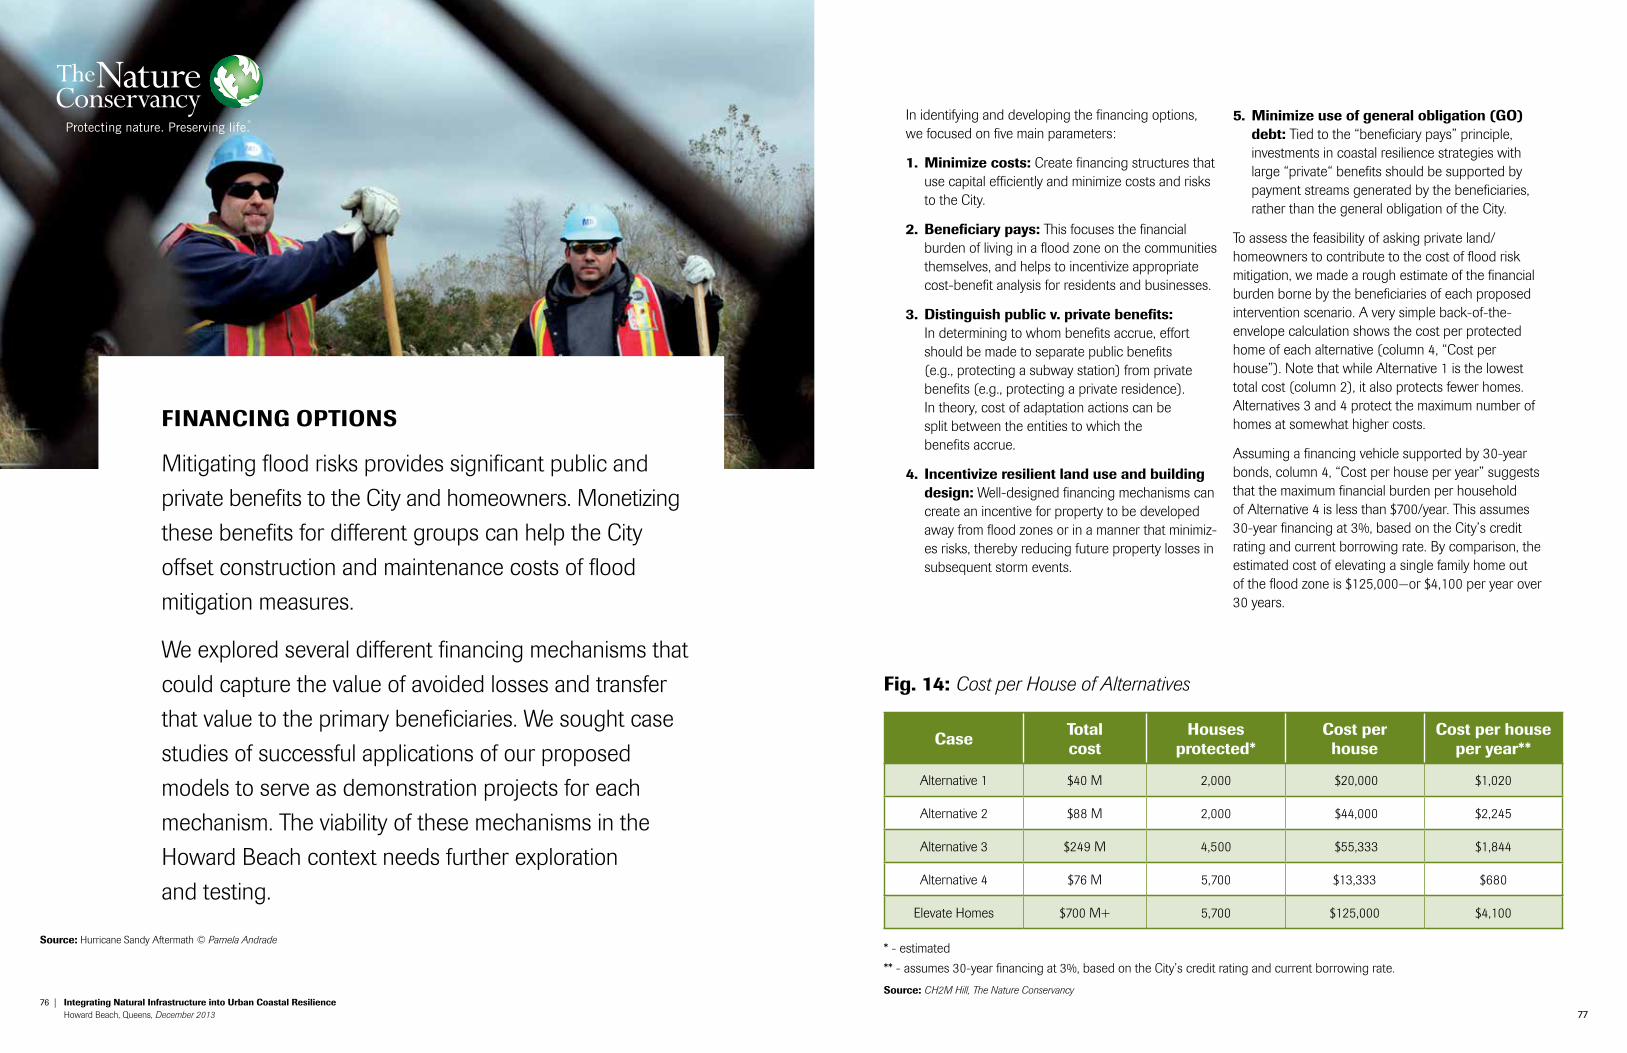
fInancIng optIons
Mitigating flood risks provides significant public and
private benefits to the City and homeowners. Monetizing
these benefits for different groups can help the City
offset construction and maintenance costs of flood
mitigation measures.
We explored several different financing mechanisms that
could capture the value of avoided losses and transfer
that value to the primary beneficiaries. We sought case
studies of successful applications of our proposed
models to serve as demonstration projects for each
mechanism. The viability of these mechanisms in the
Howard Beach context needs further exploration
and testing.
In identifying and developing the financing options, we focused on five main parameters:
1. minimize costs: Create financing structures that use capital efficiently and minimize costs and risks to the City.
2. beneficiary pays: This focuses the financial burden of living in a flood zone on the communities themselves, and helps to incentivize appropriate cost-benefit analysis for residents and businesses.
3. distinguish public v. private benefits: In determining to whom benefits accrue, effort should be made to separate public benefits (e.g., protecting a subway station) from private benefits (e.g., protecting a private residence). In theory, cost of adaptation actions can be split between the entities to which the benefits accrue.
4. Incentivize resilient land use and building design: Well-designed financing mechanisms can create an incentive for property to be developed away from flood zones or in a manner that minimiz-es risks, thereby reducing future property losses in subsequent storm events.
5. minimize use of general obligation (go) debt: Tied to the “beneficiary pays” principle, investments in coastal resilience strategies with large “private“ benefits should be supported by payment streams generated by the beneficiaries, rather than the general obligation of the City.
To assess the feasibility of asking private land/homeowners to contribute to the cost of flood risk mitigation, we made a rough estimate of the financial burden borne by the beneficiaries of each proposed intervention scenario. A very simple back-of-the- envelope calculation shows the cost per protected home of each alternative (column 4, “Cost per house”). Note that while Alternative 1 is the lowest total cost (column 2), it also protects fewer homes. Alternatives 3 and 4 protect the maximum number of homes at somewhat higher costs.
Assuming a financing vehicle supported by 30-year bonds, column 4, “Cost per house per year” suggests that the maximum financial burden per household of Alternative 4 is less than $700/year. This assumes 30-year financing at 3%, based on the City’s credit rating and current borrowing rate. By comparison, the estimated cost of elevating a single family home out of the flood zone is $125,000—or $4,100 per year over 30 years.
fig. 14: Cost per House of Alternatives
* - estimated
** - assumes 30-year financing at 3%, based on the City’s credit rating and current borrowing rate.
case total cost
Houses protected*
cost per house
cost per house per year**
Alternative 1 $40 M 2,000 $20,000 $1,020
Alternative 2 $88 M 2,000 $44,000 $2,245
Alternative 3 $249 M 4,500 $55,333 $1,844
Alternative 4 $76 M 5,700 $13,333 $680
Elevate Homes $700 M+ 5,700 $125,000 $4,100
source: CH2M Hill, The Nature Conservancy
source: Hurricane Sandy Aftermath © Pamela Andrade
78 | Integrating natural Infrastructure into urban coastal resilience Howard Beach, Queens, December 2013 79
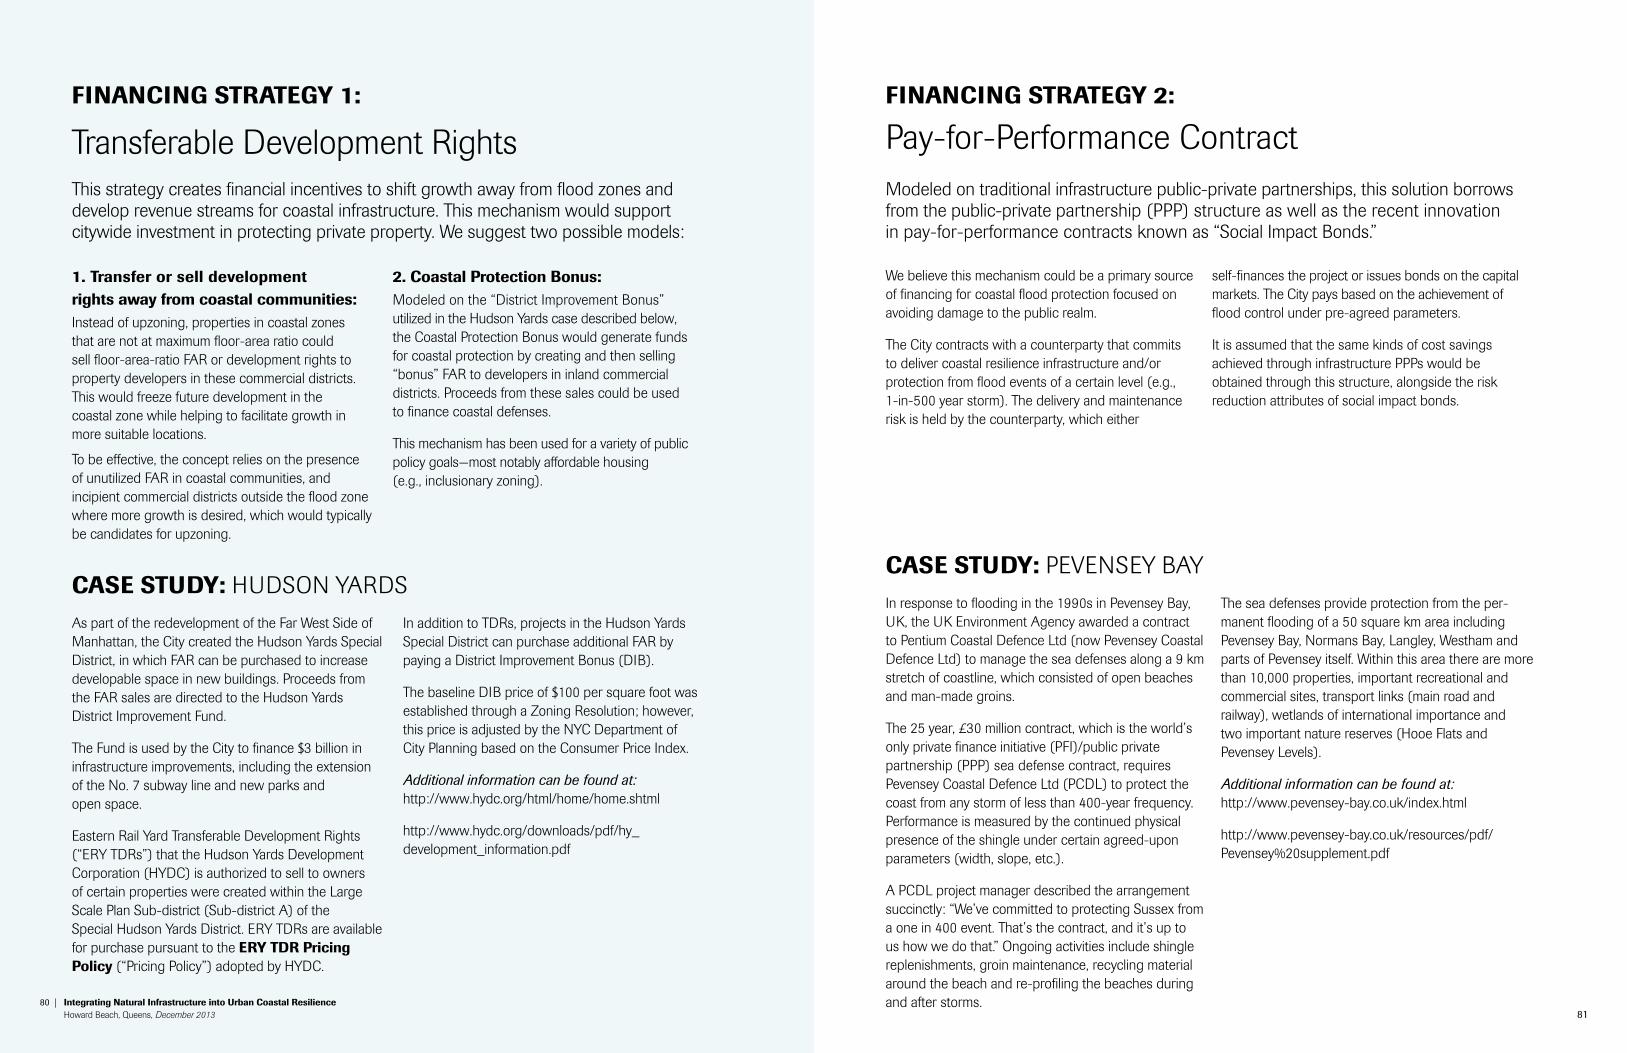
• Transferable development rights
• Wetlands mitigation banking• Pay-for-performance contract
• Pay-for-performance contract
• Coastal development insurance product
• Property-Assessed Coastal Resilience financing
• Coastal development corporation
• Property-Assessed Coastal Resilience financing
• Pay-for-performance contract
While our assumptions rely on the City’s cost of capital, in the following pages we outline ways that the City can rely on repayment streams outside of (GO) debt to support the financing.
This analysis is not meant to suggest that homeown-ers alone should pay for coastal protective measures. The public benefits associated with reduced flood risks (e.g., preventing subway flooding and protecting other infrastructure) are significant and should be factored into any financing schemes.
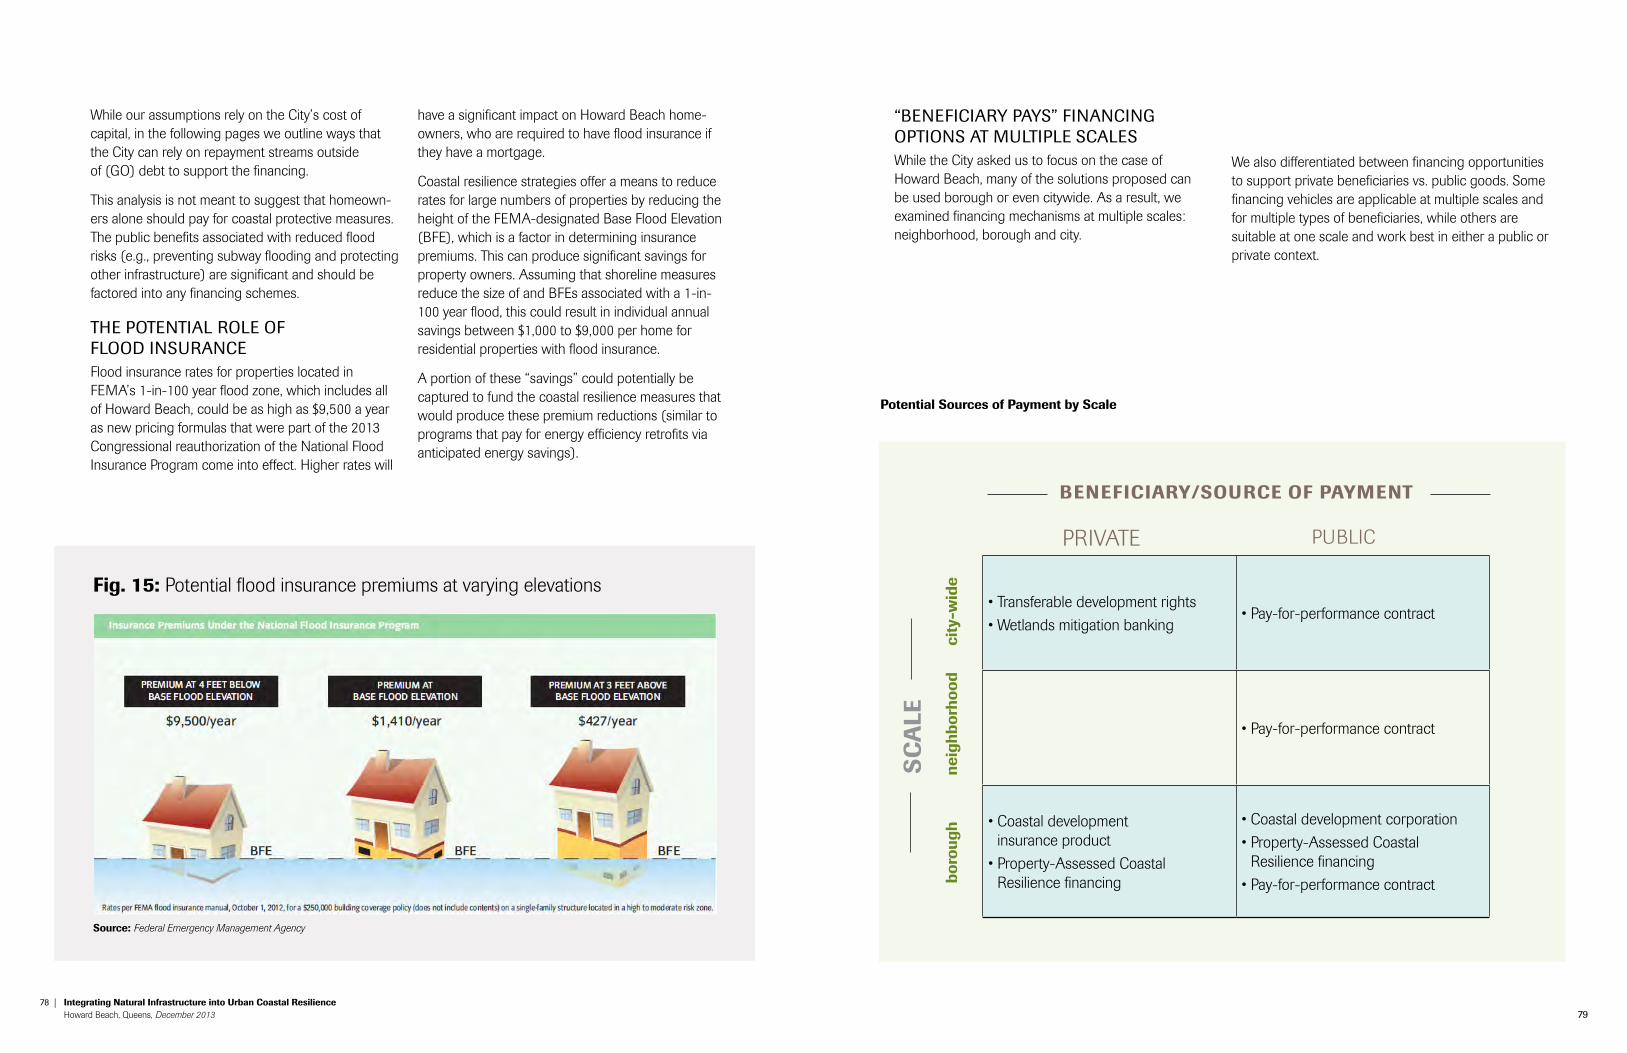
tHe potential role of flood inSuranceFlood insurance rates for properties located in FEMA’s 1-in-100 year flood zone, which includes all of Howard Beach, could be as high as $9,500 a year as new pricing formulas that were part of the 2013 Congressional reauthorization of the National Flood Insurance Program come into effect. Higher rates will
have a significant impact on Howard Beach home-owners, who are required to have flood insurance if they have a mortgage.
Coastal resilience strategies offer a means to reduce rates for large numbers of properties by reducing the height of the FEMA-designated Base Flood Elevation (BFE), which is a factor in determining insurance premiums. This can produce significant savings for property owners. Assuming that shoreline measures reduce the size of and BFEs associated with a 1-in-100 year flood, this could result in individual annual savings between $1,000 to $9,000 per home for residential properties with flood insurance.
A portion of these “savings” could potentially be captured to fund the coastal resilience measures that would produce these premium reductions (similar to programs that pay for energy efficiency retrofits via anticipated energy savings).
fig. 15: Potential flood insurance premiums at varying elevations
source: Federal Emergency Management Agency
“beneficiarY paYS” financing optionS at Multiple ScaleSWhile the City asked us to focus on the case of Howard Beach, many of the solutions proposed can be used borough or even citywide. As a result, we examined financing mechanisms at multiple scales: neighborhood, borough and city.
We also differentiated between financing opportunities to support private beneficiaries vs. public goods. Some financing vehicles are applicable at multiple scales and for multiple types of beneficiaries, while others are suitable at one scale and work best in either a public or private context.
potential sources of payment by scale
sc
ale
neig
hbor
hood
boro
ugh
city
-wid
e
PRIVATE PUBLIC
benefIcIarY/source of paYment
81
This strategy creates financial incentives to shift growth away from flood zones and develop revenue streams for coastal infrastructure. This mechanism would support citywide investment in protecting private property. We suggest two possible models:
fInancIng strategY 1:
Transferable Development Rights
As part of the redevelopment of the Far West Side of Manhattan, the City created the Hudson Yards Special District, in which FAR can be purchased to increase developable space in new buildings. Proceeds from the FAR sales are directed to the Hudson Yards District Improvement Fund.
The Fund is used by the City to finance $3 billion in infrastructure improvements, including the extension of the No. 7 subway line and new parks and open space.
Eastern Rail Yard Transferable Development Rights (“ERY TDRs”) that the Hudson Yards Development Corporation (HYDC) is authorized to sell to owners of certain properties were created within the Large Scale Plan Sub-district (Sub-district A) of the Special Hudson Yards District. ERY TDRs are available for purchase pursuant to the erY tdr pricing policy (“Pricing Policy”) adopted by HYDC.
In addition to TDRs, projects in the Hudson Yards Special District can purchase additional FAR by paying a District Improvement Bonus (DIB).
The baseline DIB price of $100 per square foot was established through a Zoning Resolution; however, this price is adjusted by the NYC Department of City Planning based on the Consumer Price Index.
Additional information can be found at: http://www.hydc.org/html/home/home.shtml
http://www.hydc.org/downloads/pdf/hy_ development_information.pdf
case studY: HUDSON YARDS
1. transfer or sell developmentrights away from coastal communities:Instead of upzoning, properties in coastal zones that are not at maximum floor-area ratio could sell floor-area-ratio FAR or development rights to property developers in these commercial districts. This would freeze future development in the coastal zone while helping to facilitate growth in more suitable locations.
To be effective, the concept relies on the presence of unutilized FAR in coastal communities, and incipient commercial districts outside the flood zone where more growth is desired, which would typically be candidates for upzoning.
2. coastal protection bonus:Modeled on the “District Improvement Bonus” utilized in the Hudson Yards case described below, the Coastal Protection Bonus would generate funds for coastal protection by creating and then selling “bonus” FAR to developers in inland commercial districts. Proceeds from these sales could be used to finance coastal defenses.
This mechanism has been used for a variety of public policy goals—most notably affordable housing (e.g., inclusionary zoning).
Modeled on traditional infrastructure public-private partnerships, this solution borrows from the public-private partnership (PPP) structure as well as the recent innovation in pay-for-performance contracts known as “Social Impact Bonds.”
fInancIng strategY 2:
Pay-for-Performance Contract
We believe this mechanism could be a primary source of financing for coastal flood protection focused on avoiding damage to the public realm.
The City contracts with a counterparty that commits to deliver coastal resilience infrastructure and/or protection from flood events of a certain level (e.g., 1-in-500 year storm). The delivery and maintenance risk is held by the counterparty, which either
self-finances the project or issues bonds on the capital markets. The City pays based on the achievement of flood control under pre-agreed parameters.
It is assumed that the same kinds of cost savings achieved through infrastructure PPPs would be obtained through this structure, alongside the risk reduction attributes of social impact bonds.
In response to flooding in the 1990s in Pevensey Bay, UK, the UK Environment Agency awarded a contract to Pentium Coastal Defence Ltd (now Pevensey Coastal Defence Ltd) to manage the sea defenses along a 9 km stretch of coastline, which consisted of open beaches and man-made groins.
The 25 year, £30 million contract, which is the world’s only private finance initiative (PFI)/public private partnership (PPP) sea defense contract, requires Pevensey Coastal Defence Ltd (PCDL) to protect the coast from any storm of less than 400-year frequency. Performance is measured by the continued physical presence of the shingle under certain agreed-upon parameters (width, slope, etc.).
A PCDL project manager described the arrangement succinctly: “We’ve committed to protecting Sussex from a one in 400 event. That’s the contract, and it’s up to us how we do that.” Ongoing activities include shingle replenishments, groin maintenance, recycling material around the beach and re-profiling the beaches during and after storms.
The sea defenses provide protection from the per-manent flooding of a 50 square km area including Pevensey Bay, Normans Bay, Langley, Westham and parts of Pevensey itself. Within this area there are more than 10,000 properties, important recreational and commercial sites, transport links (main road and railway), wetlands of international importance and two important nature reserves (Hooe Flats and Pevensey Levels).
Additional information can be found at: http://www.pevensey-bay.co.uk/index.html
http://www.pevensey-bay.co.uk/resources/pdf/Pevensey%20supplement.pdf
case studY: PEVENSEY BAY
80 | Integrating natural Infrastructure into urban coastal resilience Howard Beach, Queens, December 2013
83
Wetlands are a key source of natural flood protection, buffering flood zones and attenuating wave action. A wetlands mitigation bank can create a stream of payments from private developers to finance wetland restoration in critical flood management regions by allowing developers to pay a mitigation fee to develop on wetland fragments in low flood-risk areas.
Financing Strategy 3:
Wetlands Mitigation Banking
While wetlands mitigation banks do facilitate some development on wetlands, they also support investment in restoration of fragmented, degraded wetlands in high-priority areas while allowing development to occur in places where natural systems cannot easily be restored.
New York lags far behind regional neighbors in the de-velopment and implementation of a wetlands mitigation banking strategy. New Jersey has 15 mitigation banks helping to preserve and restore thousands of acres of open space, while New York State has just three.
There are certainly challenges to implementing a wetlands mitigation bank in New York City—in partic-ular, the watersheds in which EPA typically approves mitigation offsets to occur are small and do not aggre-gate areas of high development demand with areas of need for wetlands preservation and restoration. However, other regions have addressed this problem in creative ways that may be applicable to New York. For example, New Jersey allows for compensation in adjacent watersheds, as do Ohio, Texas and Virginia.
The Eugene Wetlands Mitigation Bank is a public-ly-managed venture of the City of Eugene Parks and Open Space Division. By creating the mitigation bank, the City of Eugene was able to simplify regulatory processes, preserve ecosystem function and include citizen values from outside the mitigation process, such as recreation and education.
Since its creation in 1994, the bank has protected or restored more than 250 acres of wetlands within greater Eugene. The bank is part of an integrated plan for development and protection of the wet prairies west of the city. As such, prices for wetland credits are almost 40% lower for projects within the urban growth boundary of Eugene than for projects outside the growth boundary.
The Bank provides significant benefits to the community including:
• Enhanced air and water quality treatment for non-point source pollution.
• Flood control and water quality treatment through an interconnected system of wetland and riparian areas.
• A diverse array of native plants and animals, and significant connected system of wildlife habitats.
• Access to large natural areas near downtown Eugene for all citizens to enjoy.
• Educational and recreational opportunities in and along the wetlands and stream corridors.
Additional information can be found at: http://www.eugene-or.gov/index.aspx?NID=497
http://www.ecosystemcommons.org/sites/default/files/wew_final.pdf
caSe Study: EugENE, OrEgON
Derived from a business improvement district, this strategy entails creating a quasi- public entity with bonding authority that would issue debt to finance coastal protection projects (Note that the pay-for-performance contract described previously could also be used within/by the CDC.) .
Financing Strategy 4:
Coastal Development Corporation (CDC).
To finance a massive downtown waterfront revitalization project, the City of Toronto launched WaterfronToronto, which utilizes Tax Increment Financing (TIF) to fund infrastructure improvements that stimulate economic development within a designated area. TIFs have been used to finance infrastructure projects by leveraging future tax revenue increases within a TIF zone and allocating the incremental tax revenue to support the infrastructure project’s capital repayment obligations.
WaterfronToronto was seeded with $1.5 billion from governments of Toronto, Ontario and Canada. These investments are projected to yield more than $10 billion in benefits. Elements of redevelopment include:
• $219.6 million in municipal infrastructure, utilities and flood protection for 26 hectares of land for development pull up line.
• $113.6 million in land acquisition to assemble devel-opment blocks for future private sector investment.
• $161 million to create and/or improve 17 parks or public spaces.
• generation of $136M in annual property taxes from new development.
Additional information can be found at: http://www1.toronto.ca/staticfiles/city_of_toronto/economic_development__culture/cultural_services/cultural_affairs/initiatives/files/pdf/creative-city-plan-ning-framework-feb08.pdf
http://www.waterfrontoronto.ca/
caSe Study: WATErFrONTOrONTO
Bonds could be repaid by a fee assessed to the CDC population (e.g., property owners in the district benefiting from coastal protections). Alternatively, repayment could come through a structure that captures cost savings from reduced insurance rates (similar to PACE financing for energy efficiency loans). This may be problematic in Howard Beach, where only 44% of owner-occupied housing units have outstanding mortgages.
As with successful PACE programs, implementation of a program involving assessments on residential properties could be restricted to commercial proper-ties because Fannie Mae and Freddie Mac view the assessment fees as an impermissible senior lien ahead of their mortgages. The fee could be assessed specifi-cally on businesses located in coastal areas (perhaps as part of a Coastal Development Corporation), or more broadly across the city to support larger-scale coastal protection projects.
82 | integrating natural infrastructure into urban coastal resilience Howard Beach, Queens, December 2013
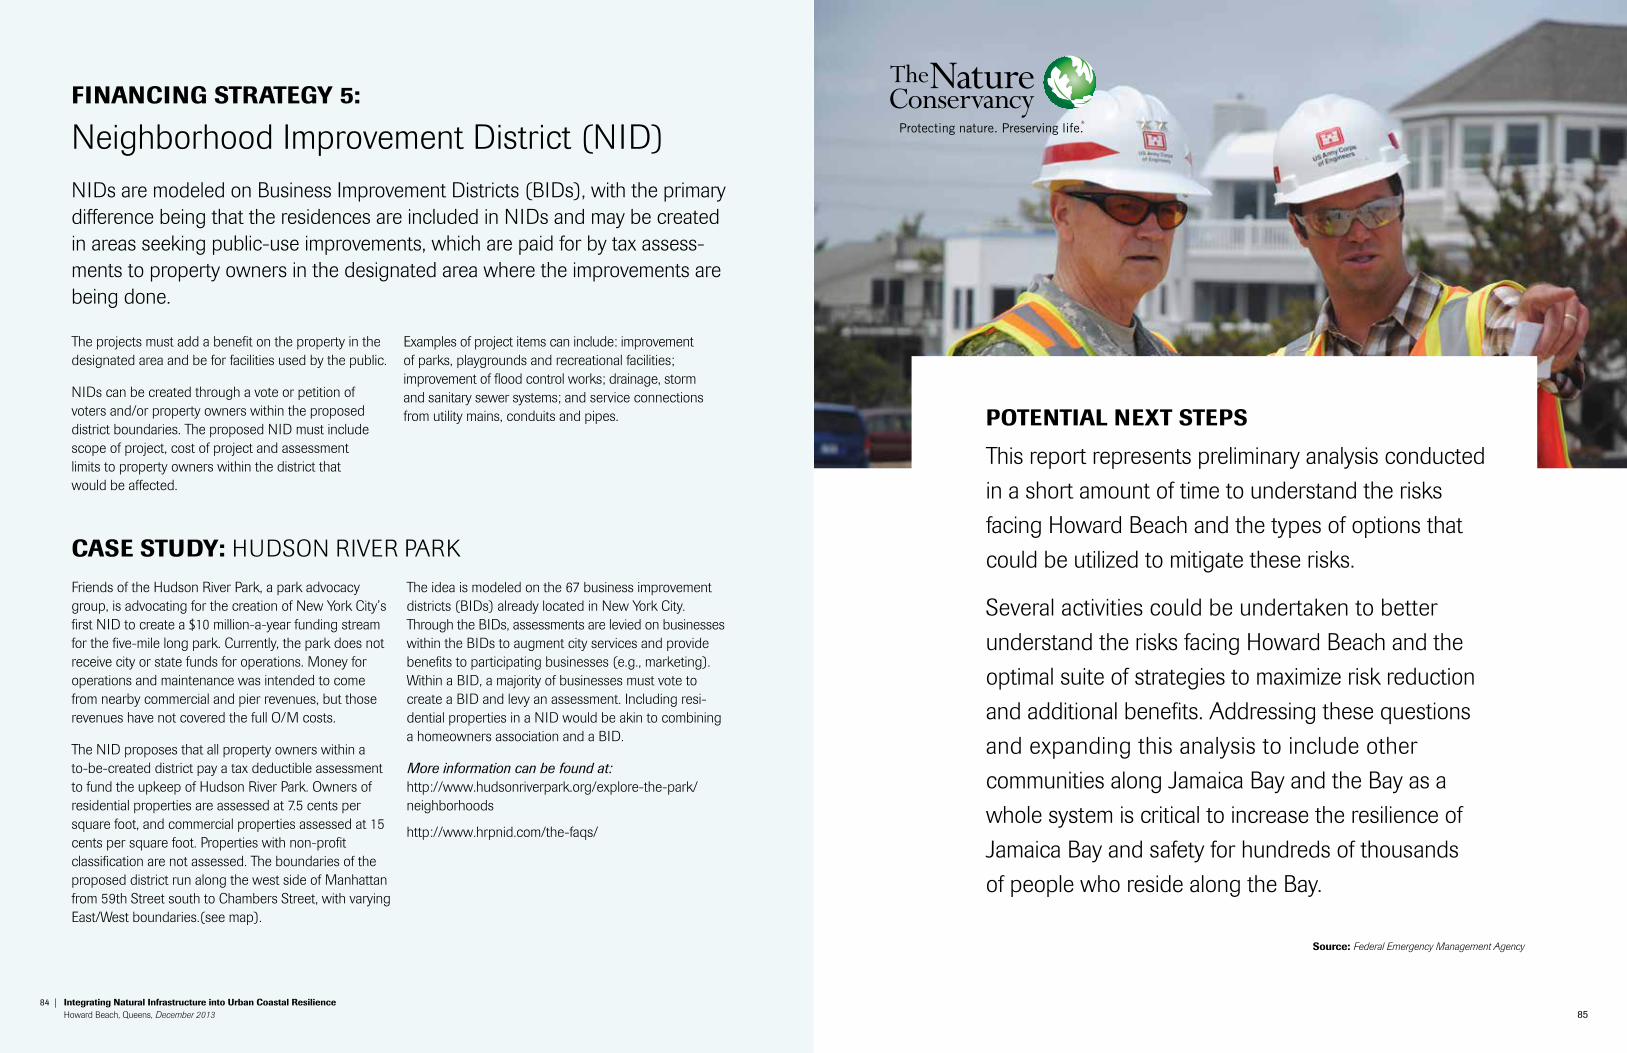
85 84 | Integrating natural Infrastructure into urban coastal resilience Howard Beach, Queens, December 2013
NIDs are modeled on Business Improvement Districts (BIDs), with the primary difference being that the residences are included in NIDs and may be created in areas seeking public-use improvements, which are paid for by tax assess-ments to property owners in the designated area where the improvements are being done.
fInancIng strategY 5:
Neighborhood Improvement District (NID)
case studY: HUDSON RIVER PARK
Friends of the Hudson River Park, a park advocacy group, is advocating for the creation of New York City’s first NID to create a $10 million-a-year funding stream for the five-mile long park. Currently, the park does not receive city or state funds for operations. Money for operations and maintenance was intended to come from nearby commercial and pier revenues, but those revenues have not covered the full O/M costs.
The NID proposes that all property owners within a to-be-created district pay a tax deductible assessment to fund the upkeep of Hudson River Park. Owners of residential properties are assessed at 7.5 cents per square foot, and commercial properties assessed at 15 cents per square foot. Properties with non-profit classification are not assessed. The boundaries of the proposed district run along the west side of Manhattan from 59th Street south to Chambers Street, with varying East/West boundaries.(see map).
The idea is modeled on the 67 business improvement districts (BIDs) already located in New York City. Through the BIDs, assessments are levied on businesses within the BIDs to augment city services and provide benefits to participating businesses (e.g., marketing). Within a BID, a majority of businesses must vote to create a BID and levy an assessment. Including resi-dential properties in a NID would be akin to combining a homeowners association and a BID.
More information can be found at: http://www.hudsonriverpark.org/explore-the-park/neighborhoods
http://www.hrpnid.com/the-faqs/
The projects must add a benefit on the property in the designated area and be for facilities used by the public.
NIDs can be created through a vote or petition of voters and/or property owners within the proposed district boundaries. The proposed NID must include scope of project, cost of project and assessment limits to property owners within the district that would be affected.
Examples of project items can include: improvement of parks, playgrounds and recreational facilities; improvement of flood control works; drainage, storm and sanitary sewer systems; and service connections from utility mains, conduits and pipes. potentIal next steps
This report represents preliminary analysis conducted
in a short amount of time to understand the risks
facing Howard Beach and the types of options that
could be utilized to mitigate these risks.
Several activities could be undertaken to better
understand the risks facing Howard Beach and the
optimal suite of strategies to maximize risk reduction
and additional benefits. Addressing these questions
and expanding this analysis to include other
communities along Jamaica Bay and the Bay as a
whole system is critical to increase the resilience of
Jamaica Bay and safety for hundreds of thousands
of people who reside along the Bay.
source: Federal Emergency Management Agency
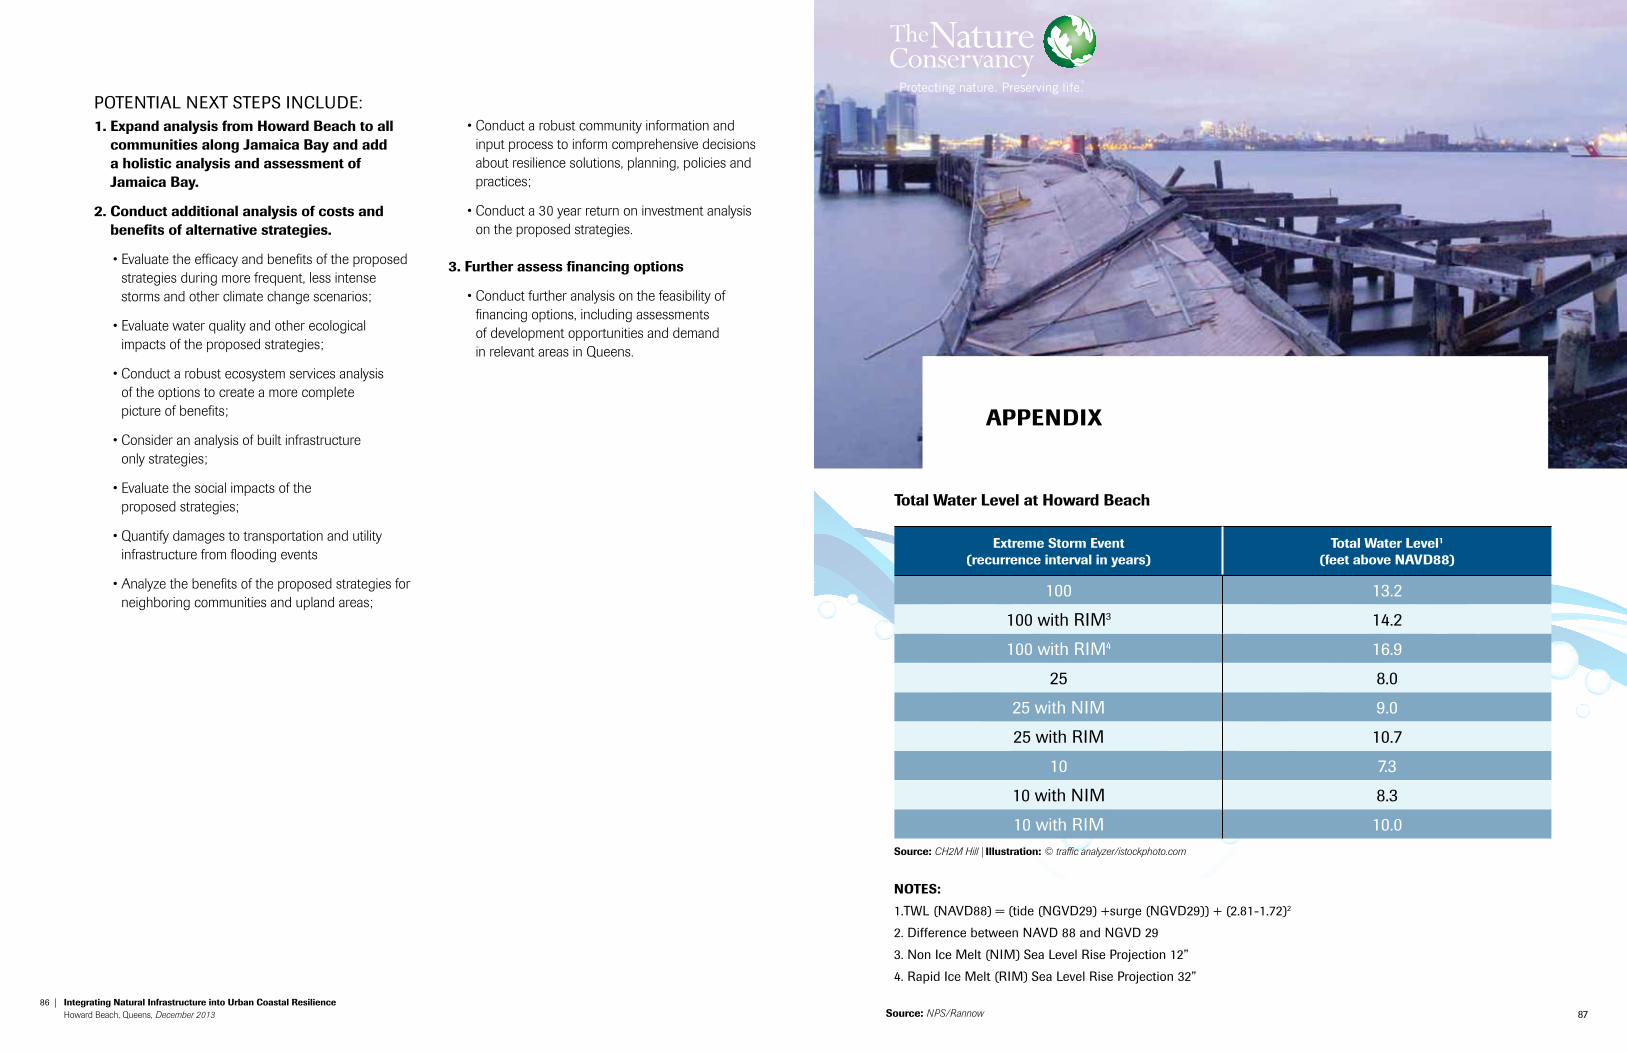
86 | Integrating natural Infrastructure into urban coastal resilience Howard Beach, Queens, December 2013 87
appendIx
potential next StepS include:1. expand analysis from Howard beach to all
communities along Jamaica bay and add a holistic analysis and assessment of Jamaica bay.
2. conduct additional analysis of costs and benefits of alternative strategies.
• Evaluate the efficacy and benefits of the proposed strategies during more frequent, less intense storms and other climate change scenarios;
• Evaluate water quality and other ecological impacts of the proposed strategies;
• Conduct a robust ecosystem services analysis of the options to create a more complete picture of benefits;
• Consider an analysis of built infrastructure only strategies;
• Evaluate the social impacts of the proposed strategies;
• Quantify damages to transportation and utility infrastructure from flooding events
• Analyze the benefits of the proposed strategies for neighboring communities and upland areas;
• Conduct a robust community information and input process to inform comprehensive decisions about resilience solutions, planning, policies and practices;
• Conduct a 30 year return on investment analysis on the proposed strategies.
3. further assess financing options
• Conduct further analysis on the feasibility of financing options, including assessments of development opportunities and demand in relevant areas in Queens.
notes:
1.TWL (NAVD88) = (tide (NGVD29) +surge (NGVD29)) + (2.81-1.72)2
2. difference between navd 88 and ngvd 29
3. non ice Melt (niM) Sea level rise projection 12”
4. rapid ice Melt (riM) Sea level rise projection 32”
extreme storm event (recurrence interval in years)
total water level1 (feet above navd88)
100 13.2
100 with riM3 14.2
100 with riM4 16.9
25 8.0
25 with niM 9.0
25 with riM 10.7
10 7.3
10 with niM 8.3
10 with riM 10.0source: CH2M Hill | Illustration: © traffic analyzer/istockphoto.com
total water level at Howard beach
source: NPS/Rannow
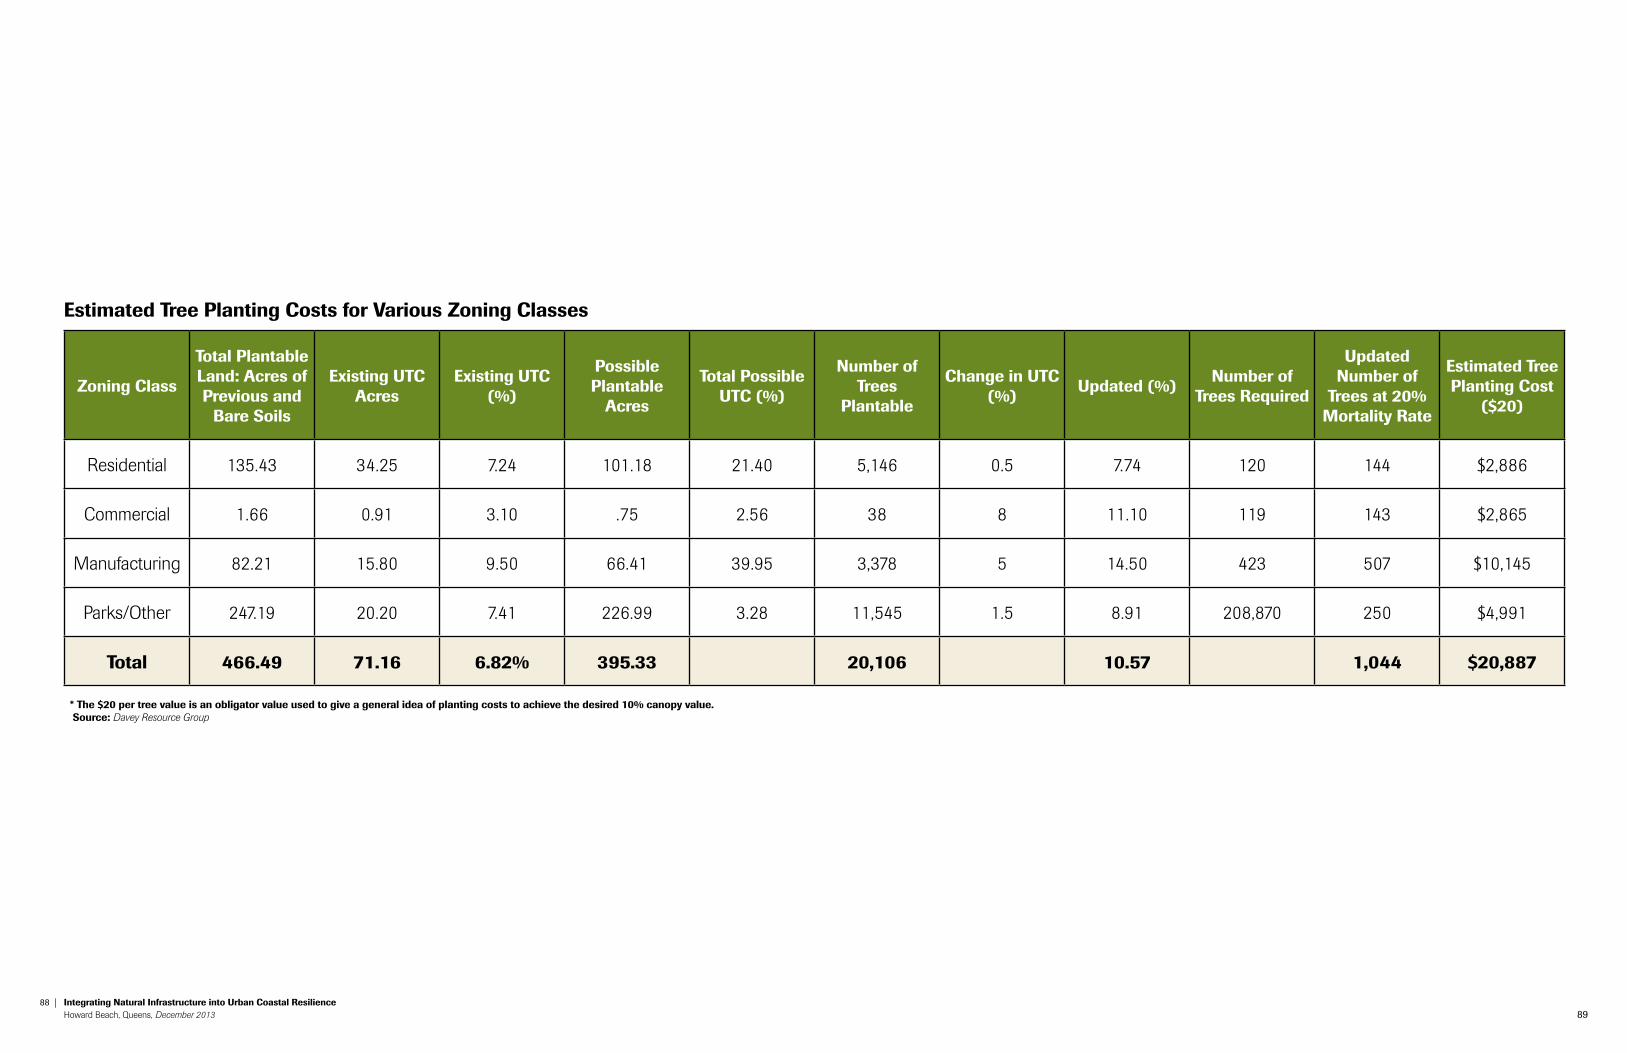
88 | Integrating natural Infrastructure into urban coastal resilience Howard Beach, Queens, December 2013 89
estimated tree planting costs for various Zoning classes
Zoning class
total plantable land: acres of previous and
bare soils
existing utc acres
existing utc (%)
possible plantable
acres
total possible utc (%)
number of trees
plantable
change in utc (%) updated (%) number of
trees required
updated number of
trees at 20% mortality rate
estimated tree planting cost
($20)
Residential 135.43 34.25 7.24 101.18 21.40 5,146 0.5 7.74 120 144 $2,886
Commercial 1.66 0.91 3.10 .75 2.56 38 8 11.10 119 143 $2,865
Manufacturing 82.21 15.80 9.50 66.41 39.95 3,378 5 14.50 423 507 $10,145
Parks/Other 247.19 20.20 7.41 226.99 3.28 11,545 1.5 8.91 208,870 250 $4,991
total 466.49 71.16 6.82% 395.33 20,106 10.57 1,044 $20,887
* the $20 per tree value is an obligator value used to give a general idea of planting costs to achieve the desired 10% canopy value. source: Davey Resource Group
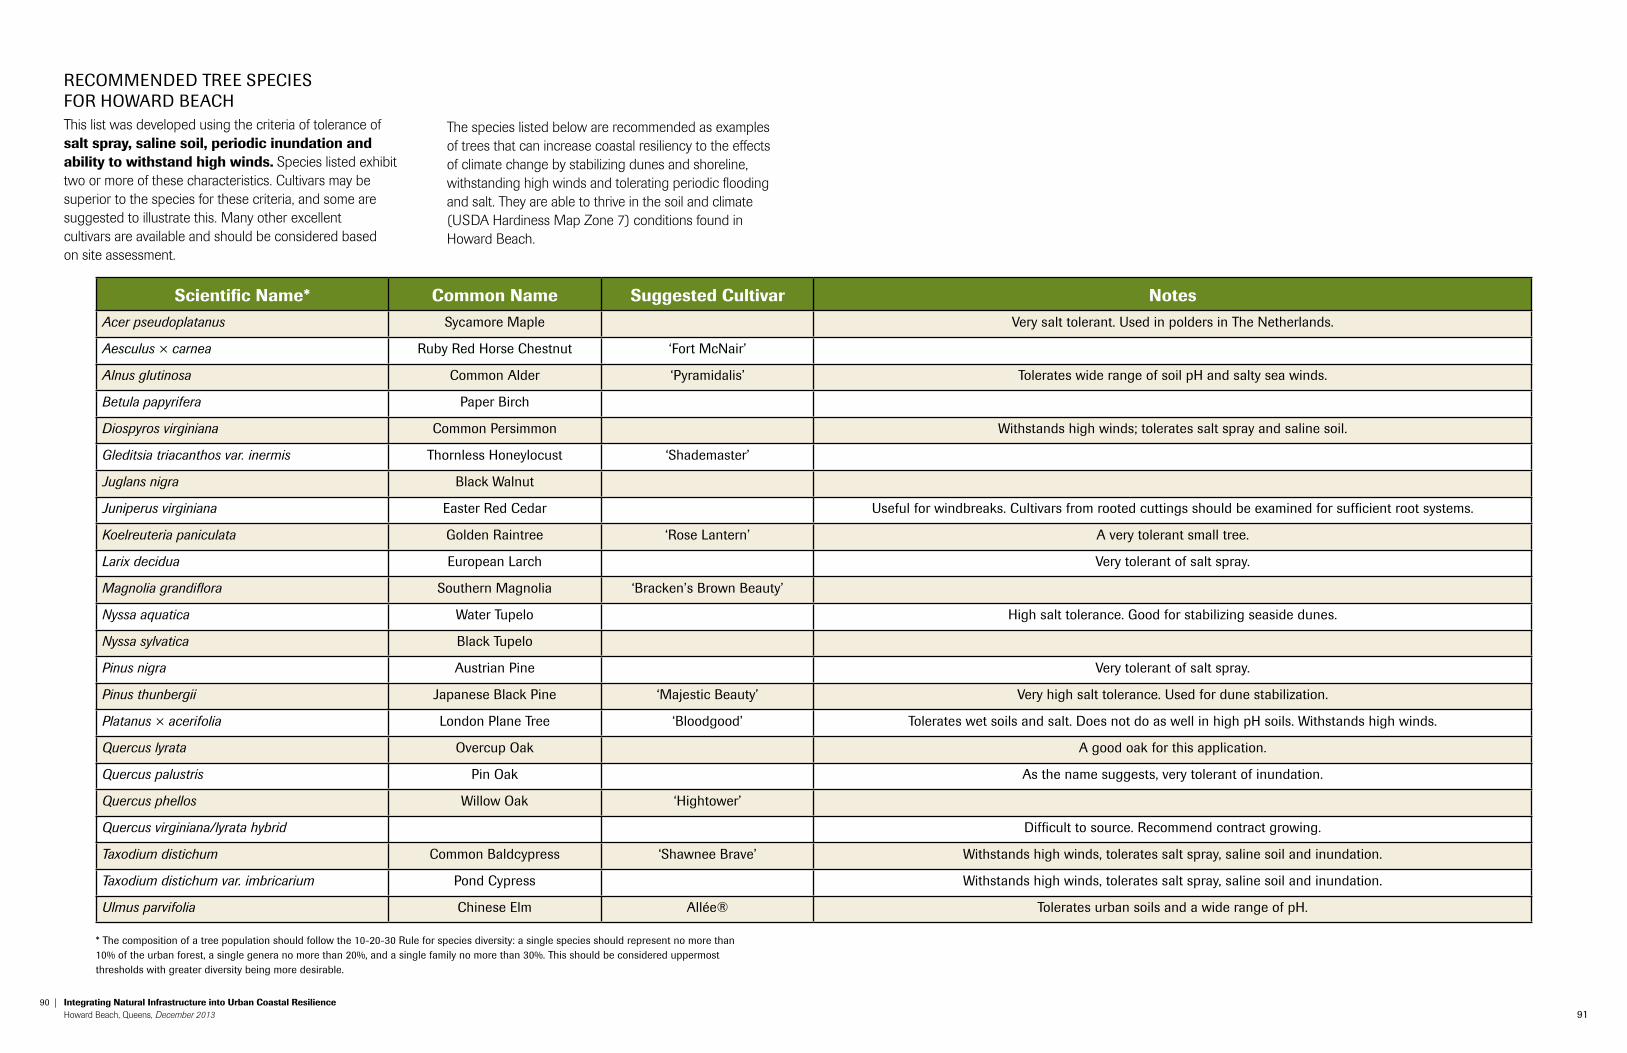
90 | Integrating natural Infrastructure into urban coastal resilience Howard Beach, Queens, December 2013 91
recoMMended tree SpecieS for Howard beacHThis list was developed using the criteria of tolerance of salt spray, saline soil, periodic inundation and ability to withstand high winds. Species listed exhibit two or more of these characteristics. Cultivars may be superior to the species for these criteria, and some are suggested to illustrate this. Many other excellent cultivars are available and should be considered based on site assessment.
The species listed below are recommended as examples of trees that can increase coastal resiliency to the effects of climate change by stabilizing dunes and shoreline, withstanding high winds and tolerating periodic flooding and salt. They are able to thrive in the soil and climate (USDA Hardiness Map Zone 7) conditions found in Howard Beach.
* the composition of a tree population should follow the 10-20-30 rule for species diversity: a single species should represent no more than 10% of the urban forest, a single genera no more than 20%, and a single family no more than 30%. This should be considered uppermost thresholds with greater diversity being more desirable.
scientific name* common name suggested cultivar notesAcer pseudoplatanus Sycamore Maple very salt tolerant. used in polders in the netherlands.
Aesculus × carnea ruby red Horse chestnut ‘fort Mcnair’
Alnus glutinosa common alder ‘pyramidalis’ tolerates wide range of soil pH and salty sea winds.
Betula papyrifera paper birch
Diospyros virginiana common persimmon withstands high winds; tolerates salt spray and saline soil.
Gleditsia triacanthos var. inermis thornless Honeylocust ‘Shademaster’
Juglans nigra black walnut
Juniperus virginiana easter red cedar useful for windbreaks. cultivars from rooted cuttings should be examined for sufficient root systems.
Koelreuteria paniculata golden raintree ‘rose lantern’ a very tolerant small tree.
Larix decidua european larch very tolerant of salt spray.
Magnolia grandiflora Southern Magnolia ‘bracken’s brown beauty’
Nyssa aquatica water tupelo High salt tolerance. Good for stabilizing seaside dunes.
Nyssa sylvatica black tupelo
Pinus nigra austrian pine very tolerant of salt spray.
Pinus thunbergii Japanese black pine ‘Majestic beauty’ Very high salt tolerance. Used for dune stabilization.
Platanus × acerifolia london plane tree ‘bloodgood’ tolerates wet soils and salt. does not do as well in high pH soils. withstands high winds.
Quercus lyrata overcup oak a good oak for this application.
Quercus palustris pin oak as the name suggests, very tolerant of inundation.
Quercus phellos willow oak ‘Hightower’
Quercus virginiana/lyrata hybrid difficult to source. recommend contract growing.
Taxodium distichum common baldcypress ‘Shawnee brave’ withstands high winds, tolerates salt spray, saline soil and inundation.
Taxodium distichum var. imbricarium pond cypress withstands high winds, tolerates salt spray, saline soil and inundation.
Ulmus parvifolia chinese elm allée® tolerates urban soils and a wide range of pH.
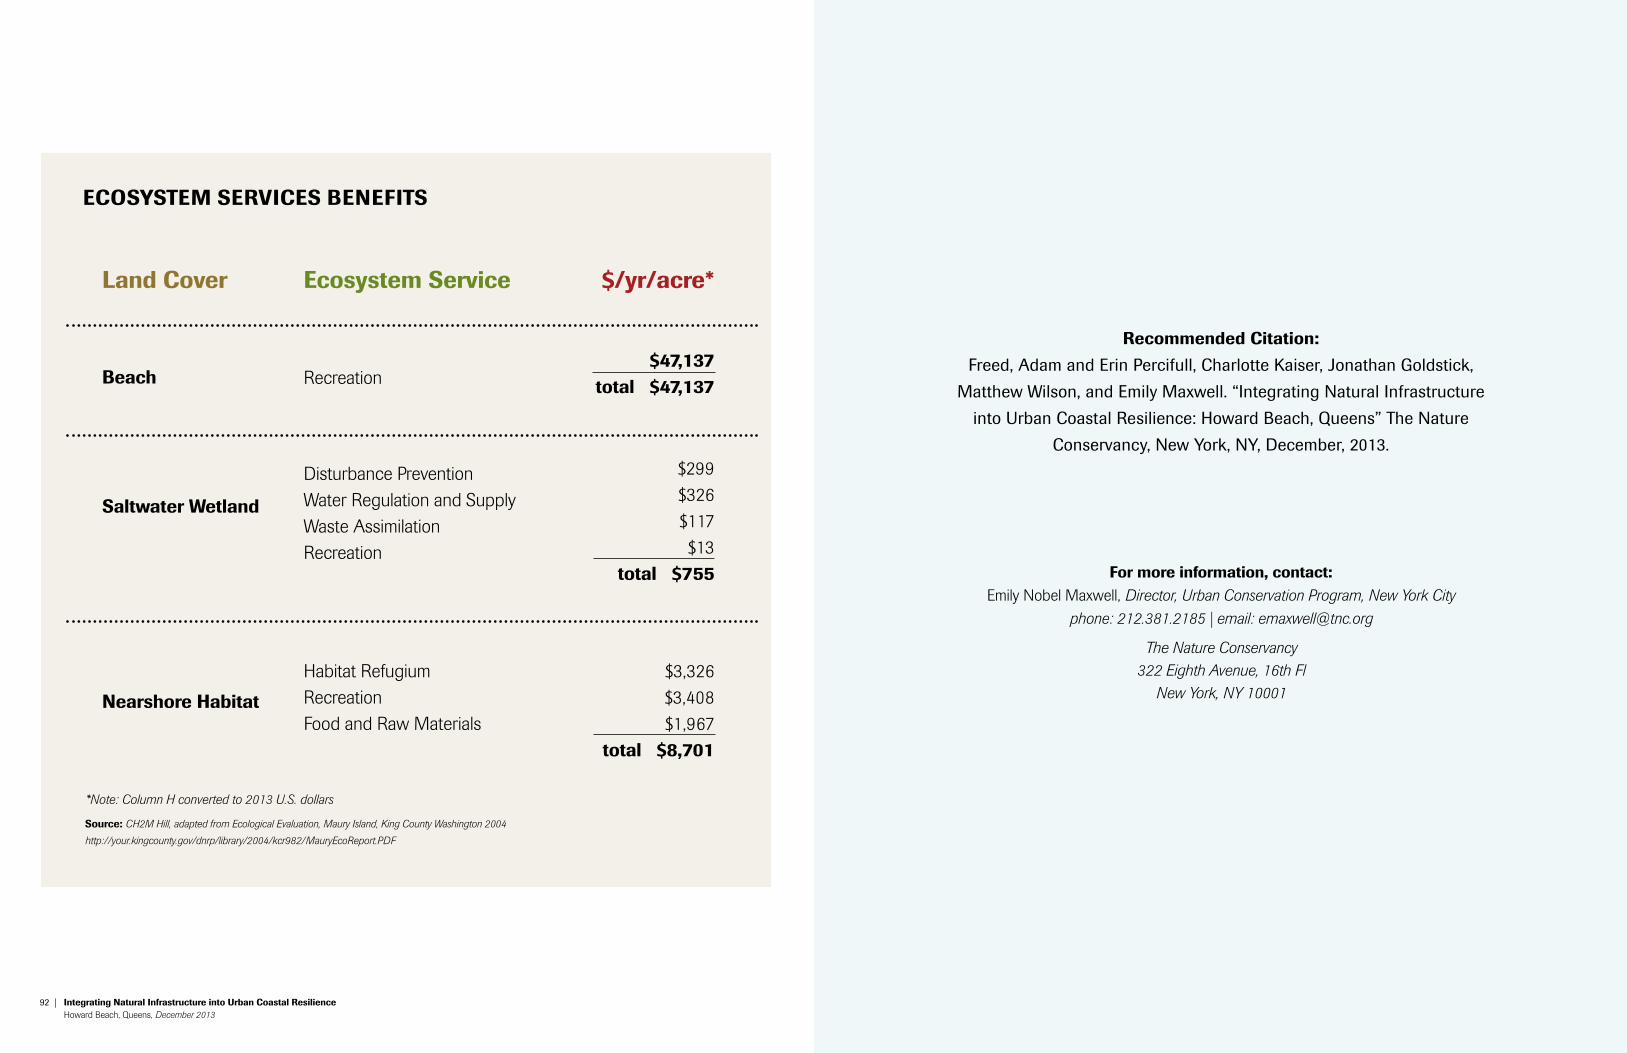
92 | Integrating Natural Infrastructure into Urban Coastal Resilience Howard Beach, Queens, December 2013 C
*Note: Column H converted to 2013 U.S. dollars
Land Cover Ecosystem Service $/yr/acre*
Beach Recreation$47,137
total $47,137
Saltwater Wetland
Disturbance Prevention Water Regulation and Supply Waste Assimilation Recreation
Nearshore Habitat
Habitat Refugium Recreation Food and Raw Materials
$299$326$117$13
total $755
$3,326$3,408$1,967
total $8,701
ECoSyStEm SERvICES BENEfItS
Source: CH2M Hill, adapted from Ecological Evaluation, Maury Island, King County Washington 2004
http://your.kingcounty.gov/dnrp/library/2004/kcr982/MauryEcoReport.PDF
Recommended Citation:
Freed, Adam and Erin Percifull, Charlotte Kaiser, Jonathan Goldstick,
Matthew Wilson, and Emily Maxwell. “Integrating Natural Infrastructure
into Urban Coastal Resilience: Howard Beach, Queens” The Nature
Conservancy, New York, NY, December, 2013.
for more information, contact:Emily Nobel Maxwell, Director, Urban Conservation Program, New York City
phone: 212.381.2185 | email: [email protected]
The Nature Conservancy322 Eighth Avenue, 16th Fl
New York, NY 10001
Our MissionThe mission of The Nature Conservancy
is to conserve the lands and waters on which all life depends.