integrating a simple traffic incident model for rapid ... management planers, for a generic incident...
TRANSCRIPT

International Journal of Transportation
Vol.4, No.3 (2016), pp.15-32
http://dx.doi.org/10.14257/ijt.2016.4.3.02
ISSN: 2287-7940 IJT
Copyright ⓒ 2016 SERSC
Integrating a Simple Traffic Incident Model for Rapid Evacuation
Analysis
Andrew J. Collins*, R. Michael Robinson, Peter Foytik, Craig Jordan
and Barry C. Ezell
Virginia Modeling, Analysis and Simulation Center (VMASC), Old Dominion
University, Suffolk, VA
[email protected]*, [email protected], [email protected], [email protected],
Abstract
Road transportation networks are a segment of society’s critical infrastructure
particularly susceptible to service disruptions. Traffic incidents disrupt road networks by
producing blockages and increasing travel times, creating significant impacts during
emergency events such as evacuations. For this reason, it is extremely important to
incorporate traffic incidents in evacuation planning models. Emergency managers and
decision makers need tools that enable rapid assessment of multiple, varied scenarios.
Many evacuation simulations require high-fidelity data input making them impractical for
rapid deployment by practitioners. Since there is such variation in evacuation types and
the method of disruption, evacuation models do not require the high-fidelity data needed
by other types of transportation models. This paper’s purpose is to show that decision
makers can gain useful information from rapid evacuation modeling which includes a
simple traffic incident model. To achieve this purpose, the research team integrated a
generic incident model into the Real-time Evacuation Planning Model (RtePM), a tool
commissioned by the U.S. Department of Homeland Security to help emergency planners
determine regional evacuation clearance times in the United States. RtePM is a simple,
web-based tool that enables emergency planners to consider multiple evacuation plans at
no additional cost to the user. Using this tool, we analyzed a simple scenario of the
United States’ National Capital Region (NCR) to determine the impact of traffic incidents
when different destination routes are blocked. The results indicate significant variations
in evacuation duration when blockages are considered.
Keywords: Computer Simulation, Road Accidents, Road Transportation, Evacuations,
Emergency Planning
1. Introduction
A road transportation network is a critical infrastructure, albeit one that is frequently
and easily disrupted. Traffic incidents create blockages and increased vehicle travel times;
this impact is an important consideration for emergency events such as evacuations. A
traffic incident is defined as any disruptive event that happens on, or nearby, a road
facility [1]. Incidents include traffic accidents and other types of events such as stalls,
debris, and road-kills. Given the disruptive nature of these events, there is a need to
incorporate the impacts of incidents within evacuation planning models. Traditional
transportation modelers use extensive data collected from the road facility of interest,
rather than generic incident models. This preference comes from the desire to incorporate
the large magnitude of factors that can influence the incident rate on road facilities. In
addition to the cost and time required to collect incident data, evacuations are time-
compressed events of high activity and a multitude of perturbing influences with no
International Journal of Transportation
Vol.4, No.3 (2016)
16 Copyright ⓒ 2016 SERSC
“average” conditions. Evacuation simulations often do not require the same degree of
high-fidelity data used in other transportation applications. Thus, there is a demand, by
emergency management planers, for a generic incident models to conduct rapid analysis
of evacuation scenarios.
This paper describes this demand for an evacuation simulation that incorporates a
simple traffic incident model. This tool would enable a decision maker to rapidly create
and run multiple variations of an evacuation area scenario that takes into account the
impact of traffic incidents. The purpose of this paper is to demonstrate that useful
information can be obtained from such rapid analysis. To achieve this purpose, the
researchers adapted an existing evacuation simulation, Real-time Evacuation Planning
Model (RtePM), to include a generic incident model so that a case-study evacuation
scenario could analyzed. RtePM is a tool developed for the U.S. Department of Homeland
Security to help emergency planners determine the evacuation time required to clear user-
defined regions in the United States. RtePM is a simple, free, web-based tool that allows
emergency planners to consider multiple options for evacuation plans
(www.rtepm.vmasc.odu.edu).
The Washington, D.C., evacuation scenario was used to investigate the compound
effects of traffic incidents and random evacuation route closures. Thus multiple scenarios
had to be constructed which would have been extremely time-consuming for existing
simulation approaches. These evacuation route closures represent failures in the other
critical infrastructure systems, e.g., downed power lines, gas leaks, dam breaches, or
nuclear power station exclusion zones due to reactor breach.
The paper begins with justifying the motivation for conducting rapid simulation
analysis of evacuation scenarios. This is followed by a description of the generic incident
model and the scenario. Results are displayed and discussed. Finally, validation and
conclusions are provided.
2. Motivation
Extant traffic incident models tend to focus on specific traffic incident attributes rather
than developing a holistic incident model [2-4] . This modern aversion to holistic models
derives from the work of Ceder and Livneh [5] who criticize attempts to use accidents-
per-vehicle-kilometer as the sole analytical tool to assess the effectiveness of road
improvements. The criticism appears to reflect the effects of traffic density/congestion
represented as Average Daily Traffic influence. However, not all traffic incident models
are used for determining road improvements; incorporating incidents provide significant
value in other contexts, for example, determining random effects on an evacuation’s
duration. The traffic incident model used in this paper considers only one factor for
determining incident occurrence rates: the Vehicle Miles Traveled (VMT). By
considering a singular factor, this model provides decision-makers with a fast and simple
tool to approximate the impacts of incident rates without collecting vast amounts of data.
With such an obvious application gap, why has this method not been developed already?
The reason that a simple generic traffic incident tool does not already exist within the
literature is due to the different cultures of the transportation research community and the
emergency management community.
2.1. Cultures of Transportation and Emergency Management
Many transportation models are used to assess the viability of developing or extending
existing transportation networks; as such, they require a high level of resolution to be fit
for purpose and to be credible within the transportation community. Credibility is the
willingness of a community to accept a simulation as fit for its purpose, whereas
validation is a simulation’s fitness for purpose [6]. The United States transportation
community’s preference for detailed models is evidenced in the development of the

International Journal of Transportation
Vol.4, No.3 (2016)
Copyright ⓒ 2016 SERSC 17
Highway Capacity Manual (HCM) which, in 37 chapters, delineates the data requirements
and expected modeling processes for a variety of modeling situations to ensure credibility
and validity [7]. The HCM is very appropriate for many transportation planning and
management situations, such as development and facilities planning. There are, however,
limitations on the extent to which the HCM is relevant to larger planning models. In
particular, the HCM dictates that traffic incident models be based on data from the road
facility or segment of interest; for larger, regional evacuation models that reflect rare
events, data collection of this type and scope is extremely difficult. As the scenario
considered in this paper has nearly 10,000 road segments even if the data were readily
available this implementation would be impractical. Though non-United States modelers
are not beholden to the HCM, they will be beholden to equivalent standards in their own
country.
With the emergency management community’s focus on rare events and short
timelines for analysis, the culture, viewpoints, and priorities differ from those in the
transportation community. An emergency manager must be a “jack of all trades” and
make decisions based on the models and data readily available. So what happens when the
cultures of transportation and emergency management collide in evacuation modeling? A
void appears when existing transportation models are too complex for the needs of
emergency managers but the fit-for-purpose models are deemed too simple by the
transportation community. In some ways, this difference in cultures is reminiscent of the
current clash occurring in the Decision Science / Operations Research domain where
practitioners require the “80% solution” while academics produce more and more
complex models [8].
2.2. Existing Evacuation Simulations
The development of evacuation simulations is quite mature with many potential
platforms available from research centers (University of Florida’s CORSIM, Oak Ridge
National Laboratory’s OREMS, and TRANSIMS etc.) and commercial vendors (RST
International’s DynusT, KLD Engineering’s Dynev, Citilabs® CUBE Avenue, Visual
Solutions’ VISSIM, etc.). Government agencies around the world also have produced
specialized simulations. Often, these models are designed for evacuations from a specific
region and capable of better fidelity and accuracy than generic models, though this can be
hard to assess. These models also require considerable resources to develop. The
constraints on access, generalizability, and data requirements prompted the U.S.
Department of Homeland Security to commission an application that meets the planning
needs of disaster and emergency managers throughout the country. This project
culminated in the development of the Real-time Evacuation Planning Model or “RtePM.”
Unlike a bespoke simulation, RtePM utilizes US Census and proprietary road network
data to enable disaster and emergency management planners to evaluate quickly any
region of the US with minimum data entry requirements. The application requires little to
no technical expertise of users to develop and run simulation models. The subject matter
expertise of local emergency managers can be used to tailor the simulation to reflect
specific characteristics of the investigation area. For its accessibility to the general
emergency management and transportation communities, as well as flexibility in
adaptation to differing evacuation environments, in this paper, RtePM is the tool used to
the benefits of a simple evacuation model for decision-makers that incorporates accident
and incidents.
Though the current scope of RtePM is restricted to the U.S., the principles of the
software application are generalizable to other countries as well. European evacuation
models such as those in Rotterdam in The Netherlands [9], Istanbul in Turkey [10] or
Lancaster in the United Kingdom [11] suffer from the same gap as those studies from the
US discussed above. This is likely due to the dominance of academic evacuation literature
generated in United States. For example, Galindo and Batta [12] found that, when doing a

International Journal of Transportation
Vol.4, No.3 (2016)
18 Copyright ⓒ 2016 SERSC
review of disaster Operational Research, 80 of the 104 papers they found that were from
the US-based Transportation Research Record (TRR) rather than Operational Research /
Management Science journals were from the Transportation Research Record (TRR), the
journal of the United States’ transportation research funding body: the Transportation
Research Board (TRB). The current preponderance of US influence in evacuation
research, however, does not reflect the applicability of rapid emergency simulations in
other global contexts.
It should be noted that not all emergency evacuation models use simulation or even
consider vehicles. Liu et al., [13] and Chen and Xiao [14] used linear programming to
evacuation route rerouting; Wang et al., [15] used systems dynamics to explore the spread
of panic in evacuations; and qualitative studies of evacuees’ decision processes was
conducted by Robinson and Khattak [16]. Pedestrians are also model in evacuation
simulations [17-19].
3. Model
Modern day traffic incident modeling originated with Ceder and Livneh [20, 21] who
advocated against using simple models for road-improvement planning purposes. Most
evacuation simulations, however, focus on determining the evacuation duration for a
particular scenario rather than road improvement. For this reason, it is important to
reconsider the value of simplistic models. At its most basic level, a traffic incident model
that is useful in evacuation simulations must include two vital elements: incident
occurrence rate and incident impact on travel-times. While there are a variety of other
factors that could affect the rate of traffic incidents, e.g., road curvature, weather
condition, human factors, a survey of the evacuation research yields little insight into the
development of an effective, quick-use tool for practitioners [22]. The impact of these
factors on travel-time does not need to be modeled explicitly within the simulation but
can be represented through other effects such as degradation of the transportation network
due to the traffic incident. The traffic incident model, described shortly, incorporates
incident occurrence rate and incident impact on travel-times applied to each road segment
of the scenario at each time-step.
To keep the model as simple and generalizable as possible, the incident occurrence rate
only considers one factor, the Vehicle Miles Traveled (VMT) on each individual road
segment throughout the modeled network. The VMT are the total miles traveled by all
vehicles on a particular road segment for a given time-step, in this case one hour.
Caliendo et al., [23] concluded that traffic flow, related to VMT, was the second most
significant factor in determining incident rate. Human factors the most significant.
Incident frequency increases with increased VMT. A faster moving road segment will
experience a higher number of VMT as a higher rate of vehicles moves through it in the
time-step. A slow-moving congested road segment will also experience a high number of
VMT due to the large number of cars on it. The form of the incident occurrence rate is
given as:
P(incident in VMT)=1- P(no incident in VMT)
P(incident in VMT)=1- (1-p)VMT (1)
The traffic incident model only allows one incident per road segment per time-step; the
form of equation (1) takes into account the possibility of multiple traffic incidents on a
road segment and combines them into a single probability for one traffic incident. The
probability of incident ‘p’ is 0.00001 or one incident per 100,000 VMT. This number was
derived from a number of national U.S. data sources including National Highway Traffic
Safety Administration’s (NHTSA) National Center for Statistics and Analysis [24], which
estimates that 2.957 billion VMT were traveled in the United States in 2009, and U.S.

International Journal of Transportation
Vol.4, No.3 (2016)
Copyright ⓒ 2016 SERSC 19
Census Bureau [25], which estimated the number of accidents to have occurred in the US
in 2009 is approximately 10,800,000. The values are educated estimates as complete data
of this magnitude is impossible to collected; specifically, only about half of all traffic
accidents are reported [26, 27].
A generic incident model must consider all types of incidents, not just accidents, in
order to understand the impact of incidents on travel times. There are limited data
available for non-accident incidents and, as such, the Highway Capacity Manual
advocates in Exhibit 36-2 “General Data Categories Required for a Reliability Evaluation”
[7] the use of crash rate and incident-to-crash ratio for the facility to determine the
incident rate. Unfortunately, no widely accepted incident-to-crash ratio exists. One
example in the Highway Capacity Manual [7] determined the ratio to be seven; that is, for
every reported accident there were seven incidents (including the accident). This ratio
came from a 5-year study of a 12.5-mile stretch on I-40E. In a study the four-county
metro Atlanta area for 2009 by the Georgia Department of Transportation (GDOT), the
ratio was only five [28]. In both cases, the ratio was based on reported accidents, thus the
ratio is halved in the model when considering both reported and unreported accidents, e.g.,
2.5 and 3.5. More details about our generic incident model are given in Collins et al., [22]
and validation is discussed in Collins et al., [29].
The project team derived the generic incident model from data obtained from normal
traffic conditions. It is likely that conditions will be significantly different in evacuation
scenarios. However, the authors contest that accurate data about traffic accident rates in
an emergency evacuation scenario will never be collected because there are higher
priorities for emergency services to consider, i.e., getting people out of the danger zone.
Hence, it must be accepted that an approximate approach must be used. This argument
also provides justification for not using convoluted traffic incident models for emergency
evacuation scenarios because though those convoluted models might make estimates that
are more accurate but these estimates are based on assumptions from a different scenario,
i.e., driving under normal conditions.
3.1. Impact of Incidents
Evaluating evacuation duration is often the purpose of an evacuation simulation; thus
the impact of traffic incidents on a given road segment is the primary area of inquiry for
this study. Our simple traffic incident model reduces the number of lanes open and
reduces the speed of the vehicles on that road segment for the duration of the incident.
Considering these two factors aligns with the recommendations of the Highway Capacity
Manual [7] which advocates using lane closures and a reduction in the capacity of the
remaining open lanes to simulate the impact of an incident. The quantitative values used
for these two factors was informed by a study from the Georgia Department of
Transportation (GDOT) of the four-county metro Atlanta area in 2009 [28]. This data
source is from only one type of road segment; however, with over 10,000 road segments
in the scenario below, it would be extremely difficult and costly to produce traffic
incident impacts for them all. The impact of incidents was compared to previous studies
of Robinson et al. [30] and was found to have a similar impact on evacuation duration as
the city of Virginia Beach, Virginia in the United States [22].
To understand how this two-part traffic incident model is implemented, we provide an
overview of the incident/accident algorithm used in the model. At each time-step, the
number of VMT is determined for a road segment and input into Equation (1) to
determine if an incident occurred. If an incident did occur, then a random traffic incident
type is determined from the incident impact model. The incident type determines the
number of lanes to be closed and the duration. The simulated road segment’s
characteristics are changed to reflect the effects of the road incident; specifically, the road
capacity is reduced to reflect the reduction in available lanes.

International Journal of Transportation
Vol.4, No.3 (2016)
20 Copyright ⓒ 2016 SERSC
3.2. Real-time Evacuation Planning Model (RtePM)
Our generic traffic incident model is a combination of the incident occurrence rate
model and incident impact model. This model was incorporated into the Real-Time
Evacuation Planning Model (RtePM), a publicly available stochastic evacuation planning
tool. A scenario was developed in RtePM to investigate the impacts of varying the
number of evacuation routes available during an evacuation.
RtePM is a micro-simulation traffic model with each individual vehicle represented in
the simulation. RtePM is easy to use, allowing users to draw polygons on a map to
determine the evacuation areas and road facilities available. Population and road network
data is automatically drawn from United States Census and NAVTEQ data, thus
minimizing data input requirements. Additional inputs supplied by regional evacuation
subject matter experts further refine the model to reflect factors such as seasonal
populations and varying evacuation response curve. RtePM is designed to run as fast as
possible and, as such, employs simplification of certain computations, for example, the
Origin-Destination matrix updates each simulated hour, evacuees are only released on the
simulated hour, and there is no dynamic lane changing within the simulation.
The traffic incident model was integrated within RtePM at the road segment level. At
each simulated hour, the total number of VMT on each segment is calculated and used to
determine if an incident had occurred on that segment during the last hour, if it did then
the incident affect is applied to the next hour. For simplicity, no secondary traffic
incidents were included, though it has been shown that there is positive probability they
will occur [31].
The actual impact of a traffic incident within RtePM was the reduction of speed on the
affected road segment for that simulated hour. A randomly selected incident type was
selected and that type determined the speed reduction, which ranged from a 5% reduction
to a 100% reduction. These reductions in speeds were calibrated using a combination of
the data from the Georgia Department of Transportation (GDOT), of the 4-county metro
Atlanta area for 2009, and the Highway Capacity Manual. The speed reduction allowed
for the same impact to traffic volume and segment capacity as if actual lanes were closed.
The calibration also took into account the difference between capacity due to the
incident’s duration not being one hour. More details of this approach can be found in
Collins et al., [22, 29].
When an incident occurs in RtePM, it affects a single segment. However, many traffic
incidents happen on intersections thus affecting multiple segments. Due to the difficulties
of automatically determining which road segments would be effected, a single incident
does not affect multiple segments within RtePM. The authors accept that this is a
weakness of the generic incident approach along with not including weather affects, road
curvatures, etc.
It is worth noting the simulated vehicles make re-routing choices each hour so if a
vehicle is stuck in congestion they will potentially choose a different route.
4. Scenario
The studied scenario was a hypothetical evacuation of Washington, D.C, through the
National Capital Region (NCR), including parts of the states of Virginia and Maryland.
Possible reasons for such an evacuation could be terrorist threats, toxic material releases,
or severe weather conditions, such as a hurricane. The evacuation is ordered in advance of
a predicted adverse event. As such, the response duration is assumed to be eight hours
following a truncated sigmoid-shaped response curve [32]. By considering a more
controlled evacuation scenario, we avoid discussion on effects of panic and potential
vehicle-abandonment.
The evacuees are assumed to use only vehicular modes of transportation allowing the
evacuees to travel a significant distance away. The model tracks the evacuees until they
International Journal of Transportation
Vol.4, No.3 (2016)
Copyright ⓒ 2016 SERSC 21
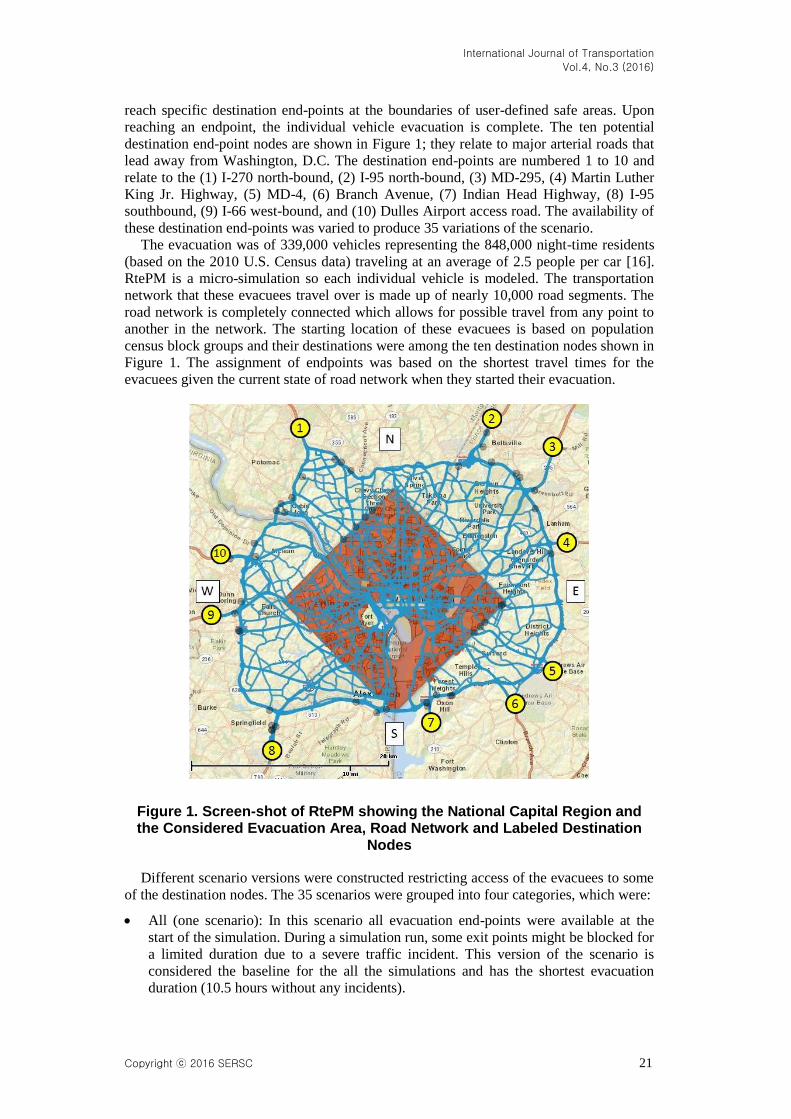
reach specific destination end-points at the boundaries of user-defined safe areas. Upon
reaching an endpoint, the individual vehicle evacuation is complete. The ten potential
destination end-point nodes are shown in Figure 1; they relate to major arterial roads that
lead away from Washington, D.C. The destination end-points are numbered 1 to 10 and
relate to the (1) I-270 north-bound, (2) I-95 north-bound, (3) MD-295, (4) Martin Luther
King Jr. Highway, (5) MD-4, (6) Branch Avenue, (7) Indian Head Highway, (8) I-95
southbound, (9) I-66 west-bound, and (10) Dulles Airport access road. The availability of
these destination end-points was varied to produce 35 variations of the scenario.
The evacuation was of 339,000 vehicles representing the 848,000 night-time residents
(based on the 2010 U.S. Census data) traveling at an average of 2.5 people per car [16].
RtePM is a micro-simulation so each individual vehicle is modeled. The transportation
network that these evacuees travel over is made up of nearly 10,000 road segments. The
road network is completely connected which allows for possible travel from any point to
another in the network. The starting location of these evacuees is based on population
census block groups and their destinations were among the ten destination nodes shown in
Figure 1. The assignment of endpoints was based on the shortest travel times for the
evacuees given the current state of road network when they started their evacuation.
Figure 1. Screen-shot of RtePM showing the National Capital Region and the Considered Evacuation Area, Road Network and Labeled Destination
Nodes
Different scenario versions were constructed restricting access of the evacuees to some
of the destination nodes. The 35 scenarios were grouped into four categories, which were:
All (one scenario): In this scenario all evacuation end-points were available at the
start of the simulation. During a simulation run, some exit points might be blocked for
a limited duration due to a severe traffic incident. This version of the scenario is
considered the baseline for the all the simulations and has the shortest evacuation
duration (10.5 hours without any incidents).

International Journal of Transportation
Vol.4, No.3 (2016)
22 Copyright ⓒ 2016 SERSC
Single Blocked Destination Node (ten scenarios): In these scenarios one of the ten
destination nodes are blocked, this may be due to a number of reasons such as
flooding or downed power line. It is assumed that the blocked destination node is not
available for the duration of the evacuation. The scenarios are labeled ‘B1,’ ‘B2,’ etc.
Cardinal Directions (15 scenarios): These scenarios block an entire cardinal direction
due to some major event, e.g., a leakage at a nuclear power plant. The destination
nodes are divided among the four cardinal directions as show in Table 1. The 15
scenarios are derived from the different combinations of closures of these cardinal
directions, e.g., NES is the scenario when the north, east, and south destination nodes
are open with the west exits closed. The study does not consider a scenario where all
the cardinal directions are closed for obvious reasons.
Single Destination Node (ten scenarios): In these extreme scenarios, only one
destination node is left opened for the evacuation. Though highly unlikely, these
scenarios do provide a way to measure the usefulness of the different destination end-
points. These scenarios are labeled by number, e.g., ‘1.’
Table 1. Grouping of Destination Nodes into Cardinal Direction
Cardinal Direction North East South West
Related Destination nodes 1, 2, 3 4, 5 6, 7, 8 9, 10
The exclusion (or inclusion) of some of the destination nodes allowed for an
investigation into which are most effective at reducing the evacuation durations. This aids
a decision maker faced with the choice to close one or more of the related road facilities.
Due to the stochastic nature of the simulation, each of the scenarios was repeatedly run
one hundred times: fifty times including the effects of incidents and fifty times without.
Thus, a total of 3,500 (35 x100) simulation runs were completed. Due to other stochastic
elements in the RtePM simulations, i.e., acceleration rates, following distance, total
evacuating population, the simulations runs without traffic incidents involved varying
factors, thus necessitating multiple simulations runs for statistical significance.
Beyond the effects of each individual destination node being closed, the compounding
effects of incidents on evacuation duration when limiting the number of destination nodes
was of particular interest. In other words, do road traffic incidents have a greater effect on
evacuation duration when there are less destination nodes available? A breakdown of the
scenarios and their available destination nodes is given in Table 2.
Table 2. Number of Scenarios which Contain a Certain Number of Destination Nodes (due to Excess Evacuation Times Seven Scenarios were
Excluded from the Analysis and are shown in Grey)
# Available Destination Nodes Scenarios # Scenarios
1 1, 2, 3, 4, 5, 6, 7, 8, 9, 10 3 (10)
2 E, W 2
3 N, S 2
4 EW 1
5 NE, NW, SE, SW 4
6 NS 1
7 NEW, ESW 2
International Journal of Transportation
Vol.4, No.3 (2016)
Copyright ⓒ 2016 SERSC 23
8 NES, NSW 2
9 b1, b2, b3, b4, b5, b6, b7, b8, b9, b10 10
10 NESW 1
28 (35)
RtePM limits the evacuation duration to 72 hours after which the simulation stops. In a
few of scenarios, some or all of the simulation runs went over this limit and, as such, the
actual evacuation duration for those runs was unknown. The decision was made to
exclude those scenarios from the results that exceeded 72 hours. In total, seven scenarios
were excluded: 1, 3, 4, 5, 6, 7, and 10. These were all single-destination nodes scenario
variations.
5. Results
The simulation runs were used to draw various results and conclusions about the
impact of closing different combinations of destination nodes. The purpose of these
results was to determine if there was any compound effects from reducing the number of
destination nodes and the inclusion of traffic incidents in the model. First, a brief
discussion is given on the relationship between number of destination nodes and
evacuation time. This is followed by looking at results of difference between scenarios
runs with incidents and without. The impact on individual road facilities is shown
followed by a discussion about the compound relationship between traffic incidents and
destination node closures.
A key requirement of this study was the speed of analysis. All scenarios were created
in approximately eight hours, and each batch run, of 50 runs, took one day to complete.
Since RtePM runs on a web-server, multiple simulation instances could be run in parallel.
The simulation run data was exported for analysis, constituting the most time consuming
aspect of the study.
Each scenario was run with and without traffic incidents in RtePM. The average
evacuation durations from these simulation runs are shown in Figure 2. The graph groups
the scenarios by number of destination nodes available. As the graph indicates, there is a
clear negative relationship between the number of destinations available in scenario and
the time it takes to evacuation Washington, D.C.; the result indicate that the more
evacuation destination nodes available, the quicker the evacuation. In the baseline
scenario, when all destination nodes are available, the evacuation took approximately 10.5
hours on average without traffic incidents and 11.5 hours with incidents. In the extreme
case, the evacuation duration took seven times longer (potentially more if the evacuation
duration could have been determined for excluded scenarios). This rapid increase of
evacuation durations shows the importance of designating as many evacuation routes
available as possible.

International Journal of Transportation
Vol.4, No.3 (2016)
24 Copyright ⓒ 2016 SERSC
Figure 2. Graph Showing the Simulation Run Results Groups by Number of Available Destination Nodes Compared to Average Evacuation Duration
(in hours) for that Scenario
The results indicate that the inclusion of traffic incident increases the evacuation
duration of that particular scenario. To test this hypothesis, a series of Welch’s t-tests
were conducted at the 95% confidence level, and from these results, it can generally be
concluded that traffic incidents significantly increase the evacuation duration. The details
of these results have been omitted in the interest of space.
The only exception is the scenario where the East routes are closed (NSW). Given
similar scenarios showed significant differences the NSW exception has been put down to
random chance. This hypothesis was confirmed by completing a new set of NSW scenario
runs. In the new results, incidents increased evacuation duration by 0.3%, significant at
the 95% confidence level. We have included the original results in our graphs because we
feel it is important to highlight the multiplicity problem [33], that is, when conducting a
lot of t-tests at the 95% level we would expect 5% of them to produce a type I error.
The next set of results focuses on the effects of the ten individual destinations nodes.
This is done through consideration of the ten scenarios that relate to the exclusion of each
one of the destination nodes. The impact of the destination nodes on evacuation duration
is considered in terms of unavailability rather than availability. Individually availability of
each destination node could not be considered due to the exclusion of some of the related
scenarios from this analysis. Emergency managers are likely more interested in
unavailable routes out of Washington, D.C. than available roads. The results from this
analysis are shown in Figure 3.
As the graph indicates, there is not much difference between the cases when the
different destination nodes are excluded. There are noticeable peaks when parts of the I-
95 interstate facility are closed; this indicates the importance of that road as an evacuation
route. The I-95 scenarios were one of the only single-destination node scenarios that had
an evacuation duration of less than 72 hours. The bars of the graph are colored to show
which cardinal direction they relate to: North (Red), East (Green), South (Blue), and West
(Purple). The graph indicates that North is the most vital direction of the road network to
increase the speed of an evacuation.

International Journal of Transportation
Vol.4, No.3 (2016)
Copyright ⓒ 2016 SERSC 25
Figure 3. Graph Depicting the Scenario Evacuation Duration, with Traffic Incidents, when One Destination Node is Closed. The Destination Nodes are
ordered Numerically and are Represented by their Related Road Facility
The final piece of analysis conducted was to try to find evidence of a compound
relationship between the traffic incidents and closure of destination routes. No evidence
was found and thus it was concluded that there was not compound effect of these two
types of events. Graphs where created to exemplify this lack of relationship as shown in
Figure 4 and Figure 5. Figure 4 shows the relationship between the change in evacuation
duration and the number available destination nodes. It was expected that a positive
correlation would exist between these two aspects of the model, but the graphs indicates
that is not the case. The reason for this expectation was that if an incident happened in a
scenario where there was only one destination node, it would hold up the whole system; if
there were many destination nodes then an incident would have less effect. Given the
spread of results, Figure 4 indicates that other affects had a greater influence in
determining the differences between the simulation runs with and without incidents.
Figure 4. Graph Depicting the Relationship between the Increase in Evacuation Duration Due to Traffic Incidents and the Number of Available
Destination Nodes
It was also hypothesized that variability of impacts of traffic incidents would be greater
in scenarios where there were fewer destination nodes; for example, if there is only one
destination node then multiple incidents on road segments just before the end-point could

International Journal of Transportation
Vol.4, No.3 (2016)
26 Copyright ⓒ 2016 SERSC
cause a major disruption in the evacuation duration. Figure 5 shows the relationship
between the number of destination nodes and the normalized variance of the simulation
runs with traffic incidents. The variances were normalized to account for the wide spread
of average evacuation duration, i.e., 10 to 70 hours. No clear pattern was detected in the
runs conducted. Thus, it was concluded that there does not exist a relationship between
the impact of traffic incidents and the availability of the destination nodes.
Figure 5. Graph Depicting the Relationship between the Normalized Variances of Simulation Runs that included Traffic Incidents, for a
Particular Scenario, and the Number of Available Destination
The results indicate that there is no compound relationship between traffic incidents
and number of destination nodes closures on the evacuation duration. However, both
traffic incidents and number of destination nodes do have an impact, individually, on
evacuation duration and this should be considered by emergency management decision-
makers. In addition, the effects of failures of other critical infrastructure, like a blackout,
could increase the rate of traffic incidents and thus the evacuation duration.
6. Sensitivity Analysis and Validation
As already mentioned, the rate of incidents was derived from national level statistics.
However, due to rounding errors and the imprecise nature of the incident-to-accident ratio,
this rate could have taken values within a range from 0.905 incidents per 100,000 VMT
(low) to 1.29 incidents per 100,000 VMT (high) [29]. Washington D.C. contains a lot of
commuter traffic and this extra traffic could also affect the results. Thus, there is a
requirement to conduct the sensitivity analysis on both the traffic incident rates and the
inclusion of background traffic.
International Journal of Transportation
Vol.4, No.3 (2016)
Copyright ⓒ 2016 SERSC 27
The project team used a simple discrete approach for the sensitivity analysis. Three
new variations were applied to a subset of the scenarios, namely: a low incident rate, a
high incident rate, and a normal (medium) incident rate with background traffic. RtePM
allows the users to make these setting changes in a straightforward manner. The
background traffic considered was a high rate with an extra 75% of the demand being
included as background traffic. RtePM incorporates background traffic as changes to the
vehicle parameter so the background traffic is not explicitly model as new vehicles.
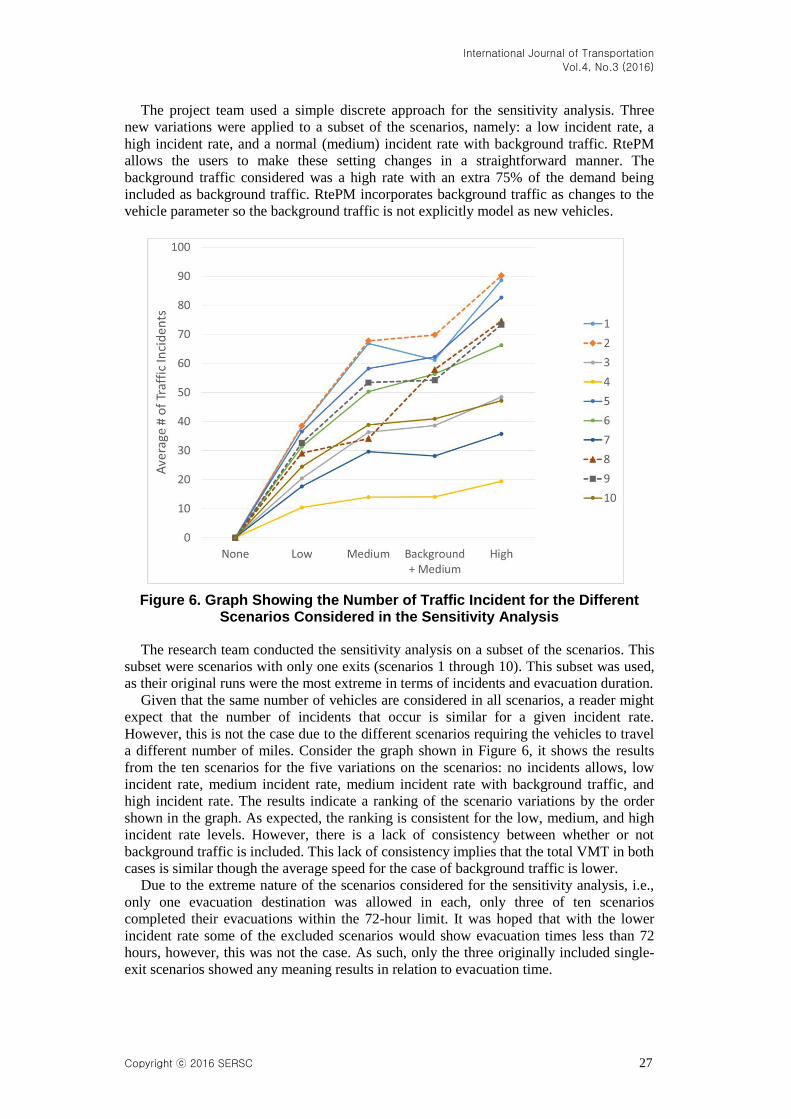
Figure 6. Graph Showing the Number of Traffic Incident for the Different Scenarios Considered in the Sensitivity Analysis
The research team conducted the sensitivity analysis on a subset of the scenarios. This
subset were scenarios with only one exits (scenarios 1 through 10). This subset was used,
as their original runs were the most extreme in terms of incidents and evacuation duration.
Given that the same number of vehicles are considered in all scenarios, a reader might
expect that the number of incidents that occur is similar for a given incident rate.
However, this is not the case due to the different scenarios requiring the vehicles to travel
a different number of miles. Consider the graph shown in Figure 6, it shows the results
from the ten scenarios for the five variations on the scenarios: no incidents allows, low
incident rate, medium incident rate, medium incident rate with background traffic, and
high incident rate. The results indicate a ranking of the scenario variations by the order
shown in the graph. As expected, the ranking is consistent for the low, medium, and high
incident rate levels. However, there is a lack of consistency between whether or not
background traffic is included. This lack of consistency implies that the total VMT in both
cases is similar though the average speed for the case of background traffic is lower.
Due to the extreme nature of the scenarios considered for the sensitivity analysis, i.e.,
only one evacuation destination was allowed in each, only three of ten scenarios
completed their evacuations within the 72-hour limit. It was hoped that with the lower
incident rate some of the excluded scenarios would show evacuation times less than 72
hours, however, this was not the case. As such, only the three originally included single-
exit scenarios showed any meaning results in relation to evacuation time.

International Journal of Transportation
Vol.4, No.3 (2016)
28 Copyright ⓒ 2016 SERSC
Table 3. Duration Results for the Three included Single-exit Scenarios
Scenario
Average duration
without incidents (hr) Low Medium
Medium +
background High
2 49.4 5.6%* 9.6%* 12.7%* 13.5%*
8 51.2 6.0%* 8.7%* 13.9%* 14.2%*
9 65.1 6.8%* 8.2%* 9.3%* 8.8%*
* Significate at 95% confidence level
There are several points of interest from the results shown in Table 3. Notice that
Scenario 2 has the highest number in incidents, from figure 6, but smallest evacuation
time. This result implies the vehicles were greatly using the faster ring road for evacuation.
There is a significant jump in the number of incidents for Scenario 8, as shown in figure 6,
which implies a high degree of traffic rerouting for when background traffic or high
incident rates are considered. Finally, even though Scenario 9 has a higher evacuation
time for background traffic compared to the high incident rate, both cases have
approximately the same number of incidents.
The sensitivity analysis imply that decreasing/increasing the incident rate
decreases/increases evacuation rate and the number of incident. This result was expected.
Including background traffic seems to have little effect on the number of incidents but
does increase the evacuation duration.
6.1. Validation
One approach to validation is to compare these results to those from similar studies, but
limited such information exists. This research was to demonstrate the ability to consider a
whole host of different scenarios rapidly, which could not be done in a reasonable amount
of time using traditional evacuation modeling, and, as such, the results from our scenarios
do not exist in other research. To use a traditional method for determining traffic incident
rates, for our scenarios, would require determining the curvature and other road features
of over 100,000 road segments, which would have be a significant challenge. To the
authors’ knowledge, no existing study exists which considers the evacuation duration
when multiple major routes are closed down in the Washington, D.C. area.
There has been some validation of the generic incident model, which is discussed in
Collins et al., [29]. This validation included comparing incident rate draw from the
California Department of Transportation (Caltrans) Performance Measurement System
(PeMS). Our actual scenario results shown are comparable with existing studies that used
different scenarios. For example, Robinson et al., [30] found that traffic incident affect
evacuation duration by about 10%; the effects from our scenarios range from 1% to 14%.
7. Conclusion
This paper describes the demand for the rapid simulation of evacuation scenarios
employing generic traffic incident modeling. To demonstrate practical usage, evacuation
scenarios of the Washington, D.C. area were developed and analyzed in the Real-time
Evacuation Planning Model (RtePM), which was adapted to include a generic incident
model. The incident model uses the Vehicle Miles Travelled (VMT) on a road segment to
determine if an incident has occurred on that segment. The impact of an incident is
modeled as flow reductions. By excluding other potential factors that could affect the rate
of traffic incidents, our generic model limits the data collection requirements of the
potential user, making it applicable for use in a variety of different modeling situations.
However, generic incident models are not well accepted within the transportation
community. This is mainly due to concerns about the application to planning for road
improvements. Emergency planners do not have the same fidelity requirements as civil

International Journal of Transportation
Vol.4, No.3 (2016)
Copyright ⓒ 2016 SERSC 29
engineers; hence, there is a demand for a more simplistic decision-support tool for
emergency evacuations.
This paper demonstrates a rapid approach to modeling “what-if” analysis of evacuation
scenarios. The RtePM tool allows decision-makers a quick and easy way to explore these
scenarios, requiring only a web-connection and computer. The results from the case-study
evacuation of Washington, D.C., indicate that both traffic incidents and the number of
destination routes available effects the evacuation duration. If the number of destination
routes available is severely decreased then the evacuation duration dramatically increases.
This rapid information collection could help emergency managers inform senior decision-
makers about evacuation announcement timing for specific rare events. As a rule of
thumb, the results indicate that traffic incidents increase evacuation duration by about
10%. Most importantly, the simulation was able to run in a matter of hours, which is vital
when time is critical factor in decision-making.
The results from the simulation scenario analysis would be virtually impossible to get
entirely from real-world data. This is the particular strength of rapid simulation as a tool
to aid emergency managers as it would be virtually impossible for them to be able to plan
for every single possible evacuation scenario with a high resolution required for urban
planning. These difficulties are both due to time limitations and data collection
requirements. Hence, there is a need for emergency managers to be able to develop
quickly and analysis the results from evacuation scenarios on the fly.
Currently, RtePM only contains data for use in the United States, though the authors
believe that other nations could apply this approach to their own demands. The next stage
for this project is determining how actual emergency decision-makers react to this
approach and what improvement they think are needed.
Acknowledgments
The U.S. Department of Homeland Security (DHS) Science and Technology
Directorate provided initial funding for the Real-Time Evacuation Planning Model
(RtePM). The Johns Hopkins University Applied Physics Laboratory (JHU-APL) led
initial prototype development. In the fall of 2012, the task of developing RtePM to full
operating capability transferred to the Virginia Modeling, Analysis, and Simulation
Center (VMASC), a research center of Old Dominion University (ODU). The
development of this generic incident model was completed under this tasking.
References
[1] American National Standards Institute, "American National Standard Manual on Classification of Motor
Vehicle Traffic Accidents", ANSI2007.
[2] D. Jovanović, T. Bačkalić and S. Bašić, "The application of reliability models in traffic accident
frequency analysis," Safety Science, vol. 49, (2011) October, pp. 1246-1251.
[3] M. Al-Harbi, M. F. Yassin and M. B. Shams, "Stochastic modeling of the impact of meteorological
conditions on road traffic accidents," Stochastic Environmental Research and Risk Assessment, vol. 26,
(2012), pp. 739-750.
[4] K. M. Chen, L. F. Xie and W. S. Xiang, "Traffic Accidents Prediction Using Improved Grey-Markov
Model", Advanced Materials Research, vol. 378, (2012), pp. 222-225.
[5] A. Ceder and M. Livneh, "Further evaluation of the relationships between road accidents and average
daily traffic," Accident Analysis & Prevention, vol. 10, (1978), pp. 95-109.
[6] J. Banks, "Handbook of Simulation: Principles, Methodology, Advances, Applications, and Practice",
Wiley, (1998).
[7] Highway Capacity Manual 2010, "Chapter 36: Travel Time Reliability, Transportation Research Board
Publications", Highway Capacity Manual 2010, ed: Transportation Research Board Publications, (2012).
[8] A. J. Collins, "Which is Worse: Large‐Scale Simulations or the 80% Solution?", SCS M&S Magazine,
(2012) April, pp. 27-38.
[9] A. J. Pel, S. P. Hoogendoorn and M. C. J. Bliemer, "Impact of Variations in Travel Demand and
Network Supply Factors for Evacuation Studies", Transportation Research Record: Journal of the
Transportation Research Board, vol. 2196, (2010) December 1, pp. 45-55.

International Journal of Transportation
Vol.4, No.3 (2016)
30 Copyright ⓒ 2016 SERSC
[10] W. Yi and L. Ö zdamar, "A dynamic logistics coordination model for evacuation and support in disaster
response activities", European Journal of Operational Research, vol. 179, (2007), pp. 1177-1193.
[11] M. Pidd, F. De Silva, and R. Eglese, "A simulation model for emergency evacuation," European Journal
of Operational Research, vol. 90, (1996), pp. 413-419.
[12] G. Galindo and R. Batta, "Review of recent developments in OR/MS research in disaster operations
management", European Journal of Operational Research, vol. 230, (2013), pp. 201-211.
[13] Y. Liu, X. Lai and G.-L. Chang, "Two-level integrated optimization system for planning of emergency
evacuation", Journal of transportation Engineering, vol. 132, (2006), pp. 800-807.
[14] Y.-M. Chen and D.-Y. Xiao, "Evacuation model and algorithms for emergency management system",
(2007), pp. 3171-3177.
[15] J.-H. Wang, S.-M. Lo, J.-H. Sun, Q.-S. Wang and H.-L. Mu, "Qualitative simulation of the panic spread
in large-scale evacuation", Simulation, vol. 88, (2012) September 11, pp. 1465-1474.
[16] R. M. Robinson and A. Khattak, "Route change decision making by hurricane evacuees facing
congestion", Transportation Research Record: Journal of the Transportation Research Board, vol. 2196,
(2010), pp. 168-175.
[17] D. Helbing, I. J. Farkas, P. Molnar and T. Vicsek, "Simulation of pedestrian crowds in normal and
evacuation situations," Pedestrian and evacuation dynamics, vol. 21, (2002), pp. 21-58.
[18] S. Liu, S. Lo, J. Ma and W. Wang, "An Agent-Based Microscopic Pedestrian Flow Simulation Model
for Pedestrian Traffic Problems", IEEE Transactions on Intelligent Transportation Systems, vol. 15,
(2014), pp. 992-1001.
[19] A. J. Collins, T. Elzie, E. Frydenlund and R. M. Robinson, "Do groups matter? An agent-based
modeling approach to pedestrian egress", The Conference in Pedestrian and Evacuation Dynamics 2014
(PED2014), Deft, NL, (2014), p. (In Press).
[20] A. Ceder and M. Livneh, "Relationships between road accidents and hourly traffic flow—I: analyses and
interpretation", Accident Analysis & Prevention, vol. 14, (1982), pp. 19-34.
[21] A. Ceder, "Relationships between road accidents and hourly traffic flow—II: probabilistic approach,"
Accident Analysis & Prevention, vol. 14, (1982), pp. 35-44.
[22] A. J. Collins, P. Foytik, E. Frydenlund, R. M. Robinson and C. A. Jordan, "Generic Incident Model for
Investigating Traffic Incident Impacts on Evacuation Times in Large-Scale Emergencies",
Transportation Research Record: Journal of the Transportation Research Board, vol. 2549, (2015), pp.
11-17.
[23] C. Caliendo, M. Guida and A. Parisi, "A crash-prediction model for multilane roads", Accid Anal Prev,
vol. 39, (2007) July, pp. 657-70.
[24] National Center for Statistics and Analysis (NCSA). (2013). Fatality Analysis Reporting System (Fars)
Encyclopedia. Available: http://www-fars.nhtsa.dot.gov/Main/index.aspx
[25] United States Census Bureau. (2012). Table 1103: Motor Vehicle Accidents – Number and Deaths: 1990
to 2009, The 2012 Statistical Abstract, the National Data Book. Available:
http://www.census.gov/compendia/statab/2012/tables/12s1103.pdf
[26] National Highway Traffic Safety Administration (NHTSA). (2013). National Automotive Sampling
Systems (NASS) General Estimate System. Available:
http://www.nhtsa.gov/Data/National+Automotive+Sampling+System+(NASS)/NASS+General+Estimat
es+System
[27] National Safety Council (NSC). (2011). Injury Facts (2011 Edition ed.). Available:
http://www.nsc.org/Documents/Injury_Facts/Injury_Facts_2011_w.pdf
[28] R. Margiotta, "Title," unpublished|.
[29] A. J. Collins, R. M. Robinson, C. A. Jordan, P. Foytik and B. C. Ezell, "Generic Incident Model for Use
in Large-Scale Evacuation Simulations", 2013 IEEE International Conference on Technologies for
Homeland Security, Waltham, MA, (2013), pp. 26-31.
[30] R. M. Robinson, A. J. Khattak, J. A. Sokolowski, P. Foytik and X. Wang, "The Role of Traffic Incidents
in Hampton Roads Hurricane Evacuations", Transportation Research Board 88th Annual Meeting,
(2009).
[31] A. Khattak, X. Wang and H. Zhang, "Are incident durations and secondary incidents interdependent?,"
Transportation Research Record: Journal of the Transportation Research Board, vol. 2099, pp. 39-49,
(2009).
[32] M. K. Lindell and C. S. Prater, "Critical behavioral assumptions in evacuation time estimate analysis for
private vehicles: Examples from hurricane research and planning", Journal of Urban Planning and
Development, vol. 133, (2007), pp. 18-29.
[33] R. G. Miller, "Simultaneous Statistical Inference", 2nd ed New York, NY: Springer-Verlag, (1981).

International Journal of Transportation
Vol.4, No.3 (2016)
Copyright ⓒ 2016 SERSC 31
Authors
Andrew J. Collins was born in Canterbury, Kent, United
Kingdom (UK) in 1977. He holds a Ph.D. (2009) and an MSc (2001)
from the University of Southampton, UK, in Operations Research,
and a bachelor’s degree in Mathematics from the University of
Oxford (UK). He is an Research Assistant Professor at the Virginia
Modeling, Analysis and Simulation Center (VMASC), which is part
of Old Dominion University, Norfolk, VA. He previously worked as
an analyst for Ministry of Defence (MoD), UK. He current research
focus is Agent-based Modeling and Simulation and he is the principle
analyst on an award winning investigation that applies agent-based
modeling to the foreclosure crisis. Dr. Collins is a member of several
professional organizations including the Society for Modeling &
Simulation International (SCS), Institute for Operations Research and
the Management Sciences (INFORMS) and Institute of Mathematics
and its Applications (IMA), UK.
R. Michael Robinson was born in San Antonio, Texas (USA). He
holds a Ph.D. (2010) from Old Dominion University in Norfolk,
Virginia, a MA in Physics (1987) from the U.S. Navy Post Graduate
School in Monterey, California, and a Bachelor of Science degree
i(1980) from the U.S. Naval Academy. He is a Research Assistant
Professor at the ODU Virginia Modeling, Analysis and Simulation
Center (VMASC) and the Director of the ODU Center for Innovative
Transportation Solutions. Prior to coming to ODU, he served as a
nuclear submarine officer in the U.S. Navy. Dr. Robinson is a
member of the Transportation Research Board and serves on the
Emergency Evacuation Task Force.
Peter Foytik was born in Portsmouth, Virginia, United States of
America (USA) in 1982. He holds an MSc (2013) from Old
Dominion University, in Modeling and Simulation, and a bachelor's
degree in Computer Science from Christopher Newport University.
He is a Senior Project Scientist at the Virginia Modeling, Analysis,
and Simulation Center (VMASC), which is part of Old Dominion
University, Norfolk, VA. His current research focus is modeling and
simulation research related to transportation, simulation integration,
and automated processes related to the analysis of simulation data.
Craig Jordan was born in Burbank, California (USA). He holds a
Master’s degree (2012) from Old Dominion University in Modeling
and Simulation and a Bachelor’s degree (2005) in Civil Engineering
from the University of Connecticut. He is a Senior Project Scientist at
the Virginia Modeling, Analysis, and Simulation Center (VMASC),
which is part of Old Dominion University, Norfolk, VA. He
previously worked as a design engineer for a civil engineering
consulting firm.

International Journal of Transportation
Vol.4, No.3 (2016)
32 Copyright ⓒ 2016 SERSC
Barry C. Ezell was born in Pascagoula, Mississippi, United States
of America (USA) in 1965. He holds a Ph.D. (2004) from Old
Dominion University, USA, MS (1998) from University of Virginia,
USA, and BS (Honors) from the University of Southern Mississippi
(USA). He is a Chief Scientist and Research Associate Professor at
the Virginia Modeling, Analysis and Simulation Center (VMASC)
which is part of Old Dominion University, Norfolk, VA. He
previously worked for the United States Army for 24 years as a
soldier, officer, and operations research systems analyst. His current
research is terrorism risk modeling where in 2010, one best paper in
series from the Society of Risk Analysis. Dr. Ezell is a member of
several professional organizations including Security Analysis and
Risk Management Association (SARMA), Society for Risk Analysis
(SRA), and Institute for Operations Research and the Management
Sciences (INFORMS), USA.