integrated transport systems for cities session 3 …wricitieshub.org/sites/default/files/integrated...
TRANSCRIPT

Integrated Transport Systems for Cities
Session 3
Ashwin Prabhu
Associate, EMBARQ India
Feb 18, 2013

Session 3
Innovations in Transport Service Provision
Structure

Mobility at all scales
Mass Transport
-BRT
-Metro Rail
Public Transport/IPT
-City Bus Service
-‘Private Public
Transport’
Non-Motorized
Transport
-Walking
-Public Bicycling
Schemes

Formal Public Transport
PPP for City Bus Services: Indore
Intermediate Public Transport
Improving Autorickshaw Services: Rajkot
Last Mile Connectivity and Neighbourhood Mobility
Public Bicycle Sharing Schemes
Private Vehicle Use
Car-sharing: A viable solution for Indian Cities?
Innovations in…

Innovations in Formal Public Transport:
PPP for City Bus Services in Indore

Population: 2.29 Million (3.4% Annual Growth)
Expected to grow from 110 sq km (2001) to 365 sq km (2011)
Registered vehicles growing at 10% pa
(0.55m in 2001 to 1.18m in 2010)
Private vehicles account for 82% of registrations
Accidents increasing at 3.2% pa
(2617 in 2001 to 3473 in 2010)
Indore Context

Traffic Situation in Indore
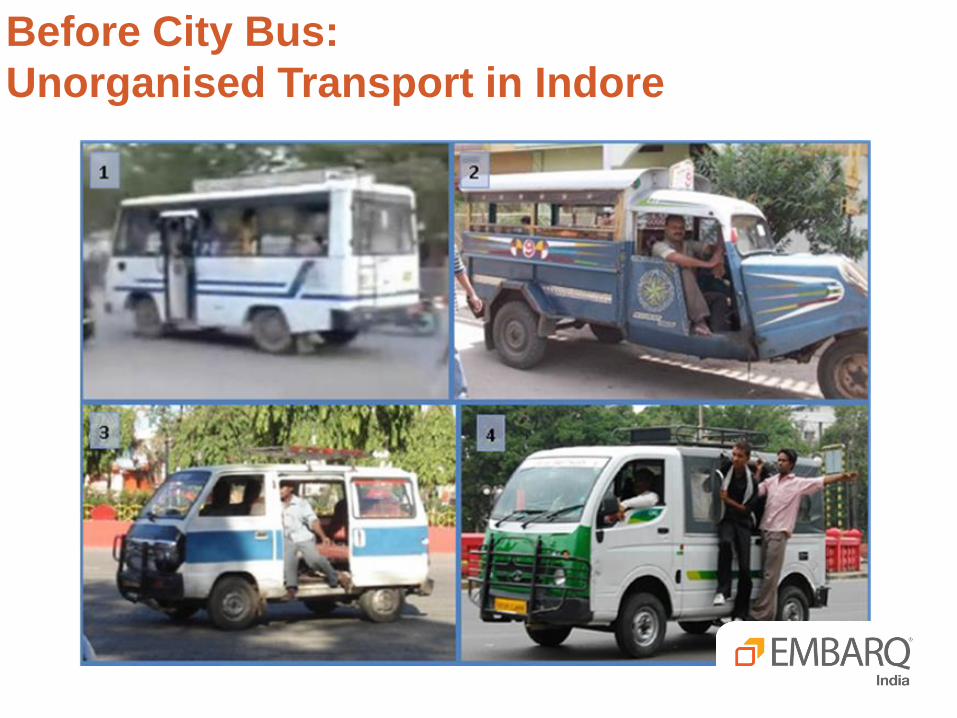
Before City Bus:
Unorganised Transport in Indore

Lack of regular service (defined stops, fares)
High competition leading to unsafe practices
Oversupply on high demand corridors, undersupply on low
demand corridors
Overcrowding
Issues with existing system

Lack of financial resources
Lack of technical capacity
Lack of manpower
Challenges to setting up PT System

PPP model for city bus service
Public Agency
Plans system
Sets operational details and parameters
Sets Fares
Provides Support Infrastructure
Co-ordinates operations
Monitors performance
Private Operators
Bid for permits/Concessions
Owns and operates fleet under contract with Public Agency
Upholds service standards
Solution

Bus Ownership
Own all vs. Own some vs. Own none
Involvement in Operations
Operate none vs. Operate some
Infrastructure provision
Unit of concession
Individual Routes Vs. Clusters
Contracting model
Net Cost vs. Gross Cost
Use of technology
Dispute resolution mechanism
Key Aspects/Decision

2006
2009
Private operator responsibilities:
Owns, operates and maintains
fleet
Collects fare from passengers
Pays premium to AICTSL for right
to operate on route
PPP Model of Bus Operations
Public partners role:
Planning of routes
Inviting tenders for bus operations
Providing support infrastructure
Objective: Providing affordable
& quality public transport

Planning,
Management,
Control and
Monitoring (ICTSL)• Fixation of fares/tariff• Monitoring quality of service• Setting standards• Ensuring adherence to
Standards• Ensuring adherence to
environmental standards• Network and route design• Identification of demand• Franchising/route allocation• Planning and provisioning of
services• Contract monitoring
Operation
(Private)•Operat0rs with multiple routes•Buses, Employees
Fare Collection
(Private)• Equipments
(ETM)
• Smart Cards
Infrastructure
(ICTSL)
• Passenger Information System
• Data collection and management.
• Dispute resolution• Management of common
infrastructure• Public relations• Security services• Management of common
ticketing facilities• Management of revenue
sharing arrangement between operators
Bus OperatorVendors•Pass
•Advertisement
•GPS/PIS
•Maintenance
RESPONSIBILITY SHARING
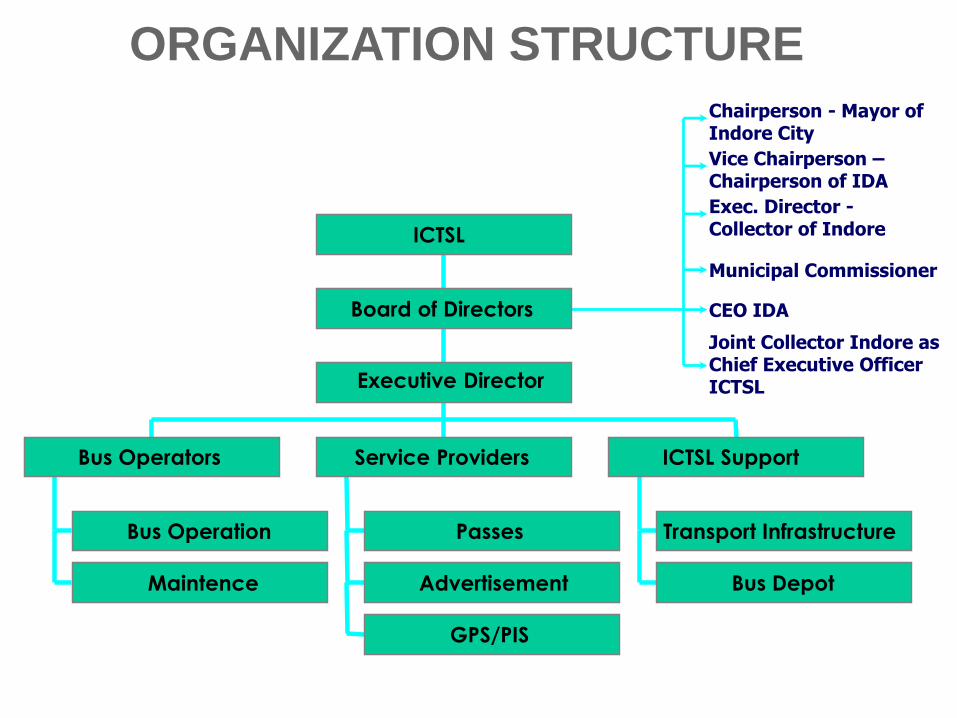
ORGANIZATION STRUCTURE
Chairperson - Mayor of Indore City
Vice Chairperson –Chairperson of IDA
Exec. Director -Collector of Indore
Municipal Commissioner
CEO IDA
Joint Collector Indore as Chief Executive Officer ICTSL
Bus Operation
Maintence
Bus Operators
Passes
Advertisement
GPS/PIS
Service Providers
Transport Infrastructure
Bus Depot
ICTSL Support
Executive Director
Board of Directors
ICTSL

Indore Statistics
Number of routes :: 16
Average route length :: 18 km
Number of bus stops :: 210
Fleet Size :: 122 buses
Operating frequency :: 8 minutes (min)
26 minutes (max)
Avg. daily ridership :: 112,000 pax
Avg. daily collection :: Rs. 5,35,000 /day
Ridership per bus :: 920 pax/bus
Avg. Revenue per day :: Rs. 7,88,000 /day

Mode Shift
Safety & Quality has helped attract
trips from private travel modes

1. 24 routes have been identified
to cover the entire city.
2. Operations started after
complete route testing and
time scheduling.
3. Route map and buses are
colour coded to facilitate easy
and convenient excess of
passengers.
Success Factor 1:
Good System Planning

1. Every bus is fitted with GPS
based tracking device with
online data transfer facility.
2. Schedule & itinerary
adherence.
3. Log of exact kilometer traveled
by bus.
4. Punctuality and improvement in
driving pattern.
5. Control over unauthorized and
unscheduled stoppages.
6. Better KMPL & EPKM.
7. Better analysis.
8. Better coordination.
Success Factor 2:
Intensive Performance Monitoring

Success Factor 3:
Good User Information

1. Combined control centre and
management offices for operators
- Constant communication between
operator and Public Agency
- Ease of dispute resolution
2. Detailed specification of
responsibilities and service
parameters
- Penalties for poor performance
- Unified branding for vehicles and
staff
- Training for drivers and conductors
Success Factor 4:
Centralized Management

System Expansion & Future
Starting from 37 buses, AICTSL now operates a fleet of 122 buses.
City bus in Indore has a mode-share of 4.4%
The BRT launch will add 50 buses (mode-share > 6%)
However, to sustain the growth, the mode-share of PT should
increase to 40% or more.
The CMP for Indore recommends having 750 city buses by 2015

Challenges
CNG fuel prices have increased by 64% in 24 months, thus
reducing profitability to operators
AICTSL has limited financial resources (premium from operators,
advertising) for additional infrastructure
Passenger ridership per bus has increased only marginally, not
keeping pace with input costs
Modernising the system by way of better workshop infrastructure,
improved information for passengers and customer service is
necessary for expanding the system.

Innovations in Intermediate Public
Transport:
Reforming Rickshaws in Rajkot

Rajkot – Key City and Transport Statistics
Population (2011): Around 1.3 million
Total motor vehicles: Around 0.8 million
Auto-rickshaws: Around 12,000
Vehicle Registration Mode Share

IPT in Rajkot
Auto-rickshaws Share-autos

CNG 2-
stroke
74.8%
Petrol 2-
stroke
1.2%
CNG 4-
stroke
23.6%
Petrol 4-
stroke
0.4%
Bajaj
98%
TVS
2%
Renter-
driver
30%
Owner-
driver
70%
Driver profile
Manufacturers
Engine/fuel profile
Fleet and Driver Profile
Market Size: 12,000

User Characteristics
<20
years
25%
20-30
years
45%
30-40
years
20%
40-50
years
8%
>50
years
2%
Age Profile
Male
64%
Femal
e
36%
Gender Profile
<
5,000
5%
5,000-
10,000
21%
10,000-
20,000
51%
20,000-
30,000
16%
30,000-
50,000
5%
> 50,000
2%
Income Profile
work
36%
educatio
n
28%
shopping
19%
health
11%
recreatio
n
6%
Trip Purpose

For Users
Informal fares
High rate of refusal
Poor quality of rickshaws/service
Poor infrastructure
High wait times (occasionally)
Poor road safety
Poor perception of safety for women
Major Issues with Existing System

For Rickshaw Drivers
Stiff competition with other drivers
Stress of haggling with customers
High cost of maintenance
Lack of/difficulty acquiring insurance
Lack of ancilliary benefits (pension, health insurance etc)
Lack of respect for work
Major Issues with Existing System

For City
Road Safety
Poor coverage of service
Air pollution from old rickshaws
Continuous demand to raise fares (from drivers)
Continuous demand to enforce laws (from users)
General concern over lack of adequate collective transport
(leading to growth in 2-Wheelers, Cars)
Major Issues with Existing System

Promote creation of fleet auto service
Mutually beneficial relationship between operator and City
City provides supporting legislation and infrastructure (Amending motor vehicle act, Providing support infrastructure)
Operator organises
Solution

Type of Fleet Service
•Non-profit organizational model
•Drivers as members and operating under a brand (such as G-Auto)
•Vehicle ownership with drivers
Organizational Model
•Driver benefits (insurance, uniform)
•Vehicle improvements
•Administrative expenses (staff salaries, travel, telephone, office)
Costs
•Grants
•Service fees (stands, dial-a-rickshaw)
•AdvertisingRevenues

Key Service Characteristics
• Call-auto service at centralized number (24-hrs)
Dial-a-Rickshaw Service
• Metered auto-rickshaw service at railway station and ST bus stand
• Booth facility with receipts
Fleet Service at key transit
hubs
• Meter-based fares based on government regulationsFare system
• Licensed and trained drivers, with uniforms
Driver characteristics
• Vehicles with environmental and safety certifications
Vehicle performance


Benefits of fleet organization
Better brand image and public perception
Elimination of refusals
Formal meter-based fares
Dial-a-rickshaw service
Operational efficiencies – reduction in empty trips
Reduction in operating and maintenance costs due to fleet management
Environmental benefits due to operational efficiencies and cleaner vehicles

Future Challenges
Scaling up: Within Rajkot and to other cities
Improving marketing and branding
Public Outreach
Continuous value add through technology

Innovations in Last Mile Connectivity and
Neighbourhood Mobility
Public Bicycle Sharing Schemes

Flexible personal private
system
Dense network of cycles
Strong identity
Encourage short trip lengths
Cycles are not tied up with
stand
Use of IT
What is bike sharing

Role of Bike Sharing
Adopted from: Quay Communication Inc. 2008. Trans Link Public Bike system Feasibility Study, Vancouver

Evolution of Bike Sharing Program

Global Trends in Bike Sharing

Bike Sharing Program Size
0 10,000 20,000 30,000 40,000 50,000 60,000 70,000
No of cycles
Hangzhou PBS
Paris: Velib
Barcelona: Bicing
Kaohsiung: C-Bike
Berlin: Call-a-Bike
Lyon: Velo’v
Montreal: BiXi
Washington: CapitalBikeShare

Ministry of Urban Development (MoUD), Government of
India organized the first national consultation meeting in
June 2011 and constituted the following subgroups:
Sub-group 1: National Policy for promotion of Non-
Motorized Transport in Indian cities
Subgroup 2: Toolkit for Public Bicycle Scheme
projects
Subgroup 3: Product design and Specifications for
the Public Bike Schemes in India
Subgroup 4: Financing Public Bicycle Schemes
MoUD Initiative on Bike Sharing

Sub Groups Recommendations

Launched in October 2011
3 Stations with 6 docks each)
2 stations added in 2012
(near Metro stations)
Limited registration
Too small to really make any
impact
Scalability
Atcag – Banglaore

Nama Cycle – Bangalore

Capital and O&M Cost
70%
17%
6%
5% 2%
Station setup
Cost of Bikes
Operation setup
Communication
Administration
30%
22%20%
14%
13%1%
Redistribution
Bike Maintenance
Station Maintenance
Back-end system
Administration
Replacements
Capital Cost in a Typical PBS System O&M Cost in a Typical PBS System
Details Lyon Paris Washington Montreal Hangzhou
Number of
Bikes 1,000 20,600 500 2,400 60,000+
Capital Cost
/Bike $4500 $4400 $3600 $3000 $1300
Operation
Cost /Bike $1500 $1944 $1600 $1200 $900

Annual Subscription
Temporary Subscription
Bike Usage
Advertisement
System Sponsorship
Parking Fee
Revenue
Cost Revenue
Many systems charge no money for first 30 minutes, in
China the system is free for first hour
About 95% of the system usage in China is free

Mysore has been recommended for taking up the Scheme under GEF Grant
Grant will be utilised for technology, rolling stocks etc
Infrastructure will be developed by city / state agency
Operation may be done by private agency
Technical Studies underway
Mysore Bike Sharing Project

Model Concession Agreement

Integration with Existing System
Indore Bicycle mode share – 20%
2000 Bicycle Rental +
Repair Shops
Average 60 Bicycles / shop
Shops in business for 20yrs
Store Hours - 7 AM to 9 PM
Bicycles rented to familiar
peopleECONOMICS
Costs
Bicycle – $70
Shop Rental – $30
Repairs/Maintenance – $2
(Per month per rental bicycle)
Revenue per bicycle
Rent – $5
Repairs/Maintenance – $1
Income – $3.5 per bicycle

Innovations in Private Vehicle Use
Car Sharing: A viable option for Indian
cities?
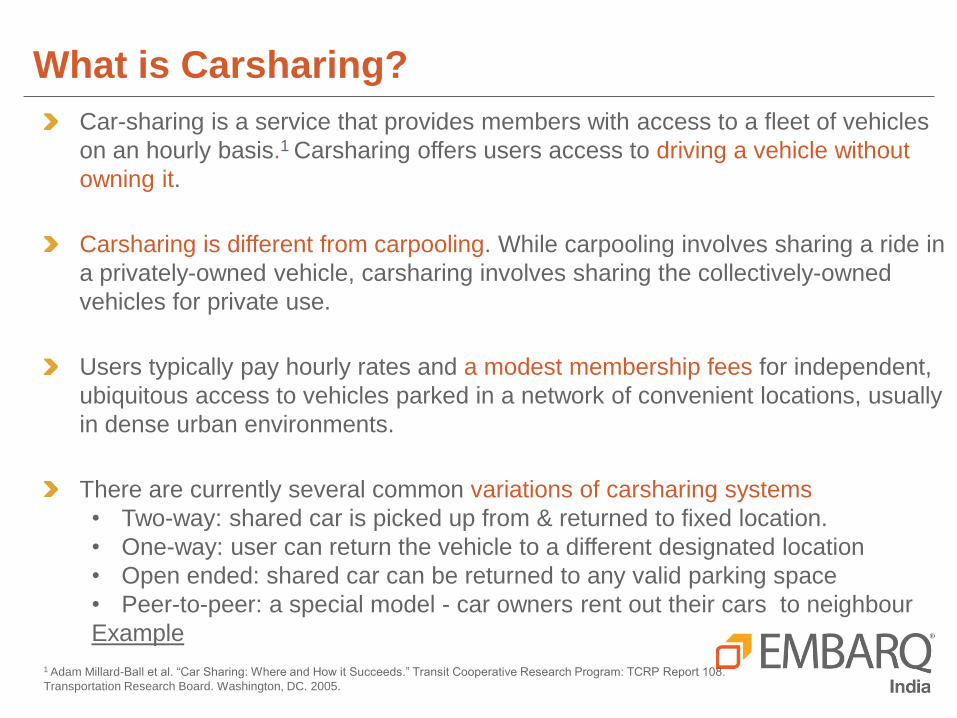
Car-sharing is a service that provides members with access to a fleet of vehicles
on an hourly basis.1 Carsharing offers users access to driving a vehicle without
owning it.
Carsharing is different from carpooling. While carpooling involves sharing a ride in
a privately-owned vehicle, carsharing involves sharing the collectively-owned
vehicles for private use.
Users typically pay hourly rates and a modest membership fees for independent,
ubiquitous access to vehicles parked in a network of convenient locations, usually
in dense urban environments.
There are currently several common variations of carsharing systems
• Two-way: shared car is picked up from & returned to fixed location.
• One-way: user can return the vehicle to a different designated location
• Open ended: shared car can be returned to any valid parking space
• Peer-to-peer: a special model - car owners rent out their cars to neighbour
Example
What is Carsharing?
1 Adam Millard-Ball et al. “Car Sharing: Where and How it Succeeds.” Transit Cooperative Research Program: TCRP Report 108.
Transportation Research Board. Washington, DC. 2005.

Users: Approximately 1,247,000 individuals share 32,000 vehicles in 1,100
cities, 26 nations and 5 continents.
New key players: Hertz, Enterprise, Daimler, and BMW have recently
invested in launching new carsharing brands. In April 2011, Zipcar launched
the industry’s first Initial Public Offering.
Predicted growth: By 2020, global carsharing membership is expected to
scale to 20 million2.
Current Carsharing Industry
Carsharing vehicles in their
reserved spots, Atlanta, Georgia
U Car Share off-street drop-
off/pick-up area on Shattuck
Avenue in Berkeley, California
Daimler’s flexible and electric car-share
venture Car2Go in Amsterdam
2 Frost & Sullivan. 2010. “Car sharing – Driving the Way to a Greener Future”.
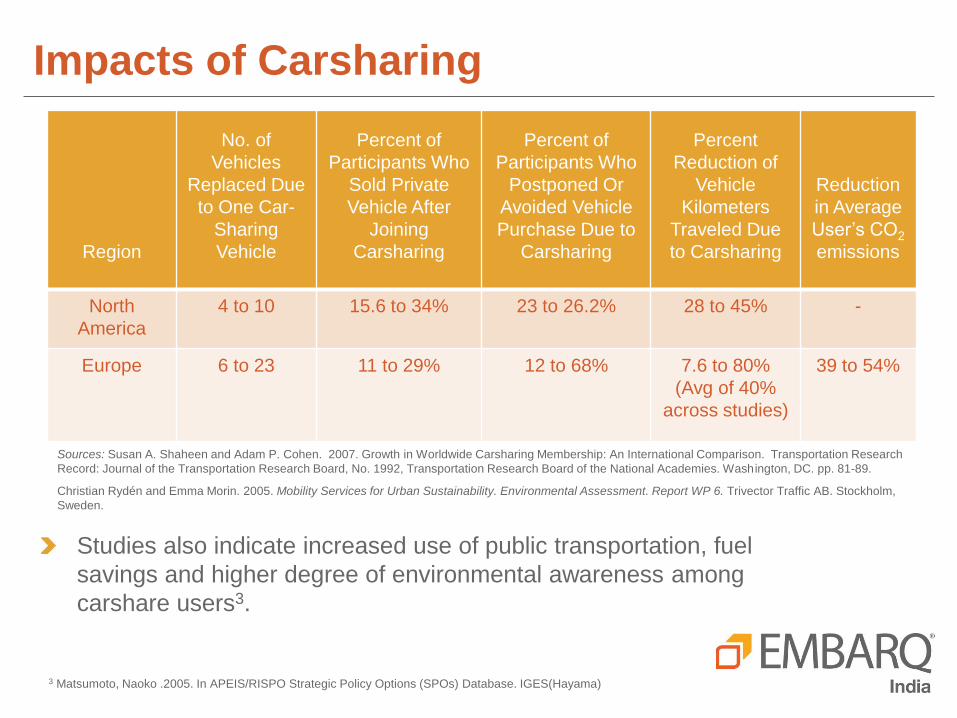
Impacts of Carsharing
3 Matsumoto, Naoko .2005. In APEIS/RISPO Strategic Policy Options (SPOs) Database. IGES(Hayama)
Region
No. of
Vehicles
Replaced Due
to One Car-
Sharing
Vehicle
Percent of
Participants Who
Sold Private
Vehicle After
Joining
Carsharing
Percent of
Participants Who
Postponed Or
Avoided Vehicle
Purchase Due to
Carsharing
Percent
Reduction of
Vehicle
Kilometers
Traveled Due
to Carsharing
Reduction
in Average
User’s CO2
emissions
North
America
4 to 10 15.6 to 34% 23 to 26.2% 28 to 45% -
Europe 6 to 23 11 to 29% 12 to 68% 7.6 to 80%
(Avg of 40%
across studies)
39 to 54%
Studies also indicate increased use of public transportation, fuel
savings and higher degree of environmental awareness among
carshare users3.
Sources: Susan A. Shaheen and Adam P. Cohen. 2007. Growth in Worldwide Carsharing Membership: An International Comparison. Transportation Research
Record: Journal of the Transportation Research Board, No. 1992, Transportation Research Board of the National Academies. Washington, DC. pp. 81-89.
Christian Rydén and Emma Morin. 2005. Mobility Services for Urban Sustainability. Environmental Assessment. Report WP 6. Trivector Traffic AB. Stockholm,
Sweden.

Carsharing in Developing Countries
• Asia, Africa and Latin America are home to over 75% of the world’s urban population3 but account for only 4.5% of the global carsharing membership (mostly in Japan and Singapore)4.
• Existing carsharing systems in China, Brazil and Turkey are primarily two-way systems.
• Shared-use vehicles (e.g. informal rideshare, shared taxis, shared rickshaws) are very common in developing countries.
Current Status
• Rapid urbanization: China and India will add at least 600 million new urban residents by 20305.
• Rapid motorization: by 2030, light auto sales in China, India, and Brazil are expected to nearly double those sold in the U.S. and Europe combined6.
Context
3 United Nations, Department of Economic and Social Affairs, Population Division: World Urbanization Prospects, the 2009 Revision. New York, 2010 4 Shaheen and Cohen. 20075 Richard Dobbs. “Megacities”. Foreign Policy. Sept/Oct 2010. 6 Vikas Sehgal. “India Automotive Markets 2020”, Booz & Company, Delhi, 2011.

Brazil an early adopter
At least 3 CSOs in operation since 2009
Active in Sao Paolo and Rio de Janeiro
Some innovation: Peer-to-Peer Car Sharing
Mexico City’s carsharing systems are expanding this summer.
Some small operations in Mexico City
Benefit from active local government support, positioning Car Sharing as a sustainable
mobility option
Turkey seeing modest growth.
3 CSOs in Istanbul, with a 4th launching soon
But Fleet Sizes are small (10-15)
China is an emerging market.
At least 2 CSOs operating in Bejing
2-3 more in the pipeline
But chauffeur-driven rental market is very mature (10,000+ fleet)
India has no traditional carsharing system currently.
Pilot in 2011 in Gurgaon (‘Rent-a-Reva’ – collaboration between Mahindra and NGO Uthaan)
New service ‘Zoom’ plans to launch in Bangalore with major expansion plans
Current status

Opportunities and Challenges
• The proportion of people with driving experience and driving licenses will increase, expanding customer base.
• Carsharing can benefit from the growing desire for personal mobility.
• Resulting congestion and pollution is likely to eventually force cities to implement policies making car ownership less attractive.
Opportunity
• People’s desire for car ownership is also a threat for carsharing industry. Access versus Ownership.
• The resulting congestion is also a challenge since reliable travel times are important for carsharing users to adhere to a reservations system
• Lack of access to online payment systems may require innovation
Challenge