integrated strategy initiative for strengthening the ...tmte.hu/_userfiles_/tmte/texapp_wp1_1...
TRANSCRIPT

The European Commission support for the production of this publication does not constitute an endorsement of the contents which reflects the views only of the authors, and the Commission cannot be held responsible for
any use which may be made of the information contained therein
Integrated strategy Initiative for Strengthening the supply of
APPrenticeships in TEXtile sector
TEXAPP
TASK 1.2 – National Reports – TMTE
Prepared by: TMTE
Contributors: NA
Work Package: WP1 Date: 21-07-2017 / 27-07-2017 (Version 2.0)

2
The European Commission support for the production of this publication does not constitute an endorsement of the contents which reflects the views only of the authors, and the Commission cannot be held responsible for
any use which may be made of the information contained therein
Table of Contents
Graphics ........................................................................................................................... 2
Tables ............................................................................................................................... 3
1 Framework .................................................................................................................... 5
2 Introduction of the Hungarian T&C sectors ..................................................................... 6
1. Chapter 1: General Characteristics ............................................................................................................ 8
2. Chapter 2: Demographics about the company and HR ............................................................................ 18
3. Chapter 3: Apprenticeship characterization ............................................................................................ 22
4. Chapter 4: Familiarizing with apprenticeship .......................................................................................... 30
5. Chapter 5: Apprenticeship in organisation & impact of apprenticeship .................................................. 34
6. Chapter 6: Conclusions ............................................................................................................................ 38
Graphics
Graphic 1 - Years of operations ............................................................................................................... 9
Graphic 2 - Company size ...................................................................................................................... 10
Graphic 3 – Sectors ................................................................................................................................ 11
Graphic 4 – Over the past 5 years, has company turnover ................................................................... 11
Graphic 5 – Over the next 5 years, do you expect turnover to ............................................................. 13
Graphic 6 – Over the past year has the workforce ............................................................................... 13
Graphic 7 – What proportion of the workforce is ................................................................................. 14
Graphic 8 – What qualifications does the workforce hold .................................................................... 15
Graphic 9 – Do you plan to increase your headcount in the next year? ............................................... 16
Graphic 10 – Do you have problems recruiting staff? ........................................................................... 16
Graphic 11 – What sources do you use for recruiting? ......................................................................... 17
Graphic 12 – Does the company have a training/HR strategy? ............................................................ 18
Graphic 13 – Does the company operate Quality standards? .............................................................. 19
Graphic 14 – Type of quality standards? ............................................................................................... 19
Graphic 15 – Usage of internal training capacity? ................................................................................ 20
Graphic 16 – Usage of external training providers? .............................................................................. 21

3
The European Commission support for the production of this publication does not constitute an endorsement of the contents which reflects the views only of the authors, and the Commission cannot be held responsible for
any use which may be made of the information contained therein
Graphic 17 – knowledge about apprenticeships ................................................................................... 22
Graphic 18 – Source of apprenticeship ................................................................................................. 22
Graphic 19 – Experience in apprenticeships ......................................................................................... 23
Graphic 20 – Possibilities for apprentice’s recruitment ........................................................................ 24
Graphic 21 – Which of the following areas might you recruit in an apprentice ................................... 24
Graphic 22 – Already participated in apprenticeship or plan recruiting an apprentice ....................... 25
Graphic 23 – Reason for participation................................................................................................... 26
Graphic 24 – To what extent you agree to the following statements, in relation to apprenticeships . 27
Graphic 25 – What are the main challenges that you foresee with apprenticeships? ......................... 28
Graphic 26 – What help would be useful when recruiting an apprentice? .......................................... 29
Graphic 27 – Experience with apprenticeship and financing support .................................................. 30
Graphic 28 – If you decided NOT to recruit an apprentice, what were your main reasons for doing so?
............................................................................................................................................................... 31
Graphic 29 – Out of the following, is there any training that you need but are not able to source
locally? ................................................................................................................................................... 33
Graphic 30 – Past esxperience with apprentices .................................................................................. 34
Graphic 31 – Experience with apprenticeship and % successfully finished, directly employ or working
............................................................................................................................................................... 35
Graphic 32 – For those who completed apprenticeship at your organisation but were not hired by
your company, what were the main reasons to reject apprentices? ................................................... 36
Graphic 33 – For those who have not completed the apprenticeship at your organisation, what were
the main reasons for non-completion? ................................................................................................. 37
Graphic 34 – Would you like to receive further information on the TEXAPP project and its results? . 37
Tables
Table 1 – What proportion of the workforce is ..................................................................................... 14
Table 2 – What qualifications does the workforce hold ....................................................................... 15
Table 3 – What sources do you use for recruiting? ............................................................................... 17
Table 4 – Does the company have a training/HR strategy? .................................................................. 18
Table 5 – Does the company operate Quality standards? .................................................................... 19
Table 6 – Type of quality standards? ..................................................................................................... 20
Table 7 – Usage of internal training capacity? ...................................................................................... 20
Table 8 – Usage of external training providers? ................................................................................... 21
Table 9 – knowledge about apprenticeships ......................................................................................... 22
Table 10 – Source of apprenticeship ..................................................................................................... 23
Table 11 – Experience in apprenticeships ............................................................................................. 23
Table 12 – Possibilities for apprentice’s recruitment ............................................................................ 24
Table 13 – Which of the following areas might you recruit in an apprentice ....................................... 25
Table 14 – Already participated in apprenticeship or plan recruiting an apprentice ........................... 25

4
The European Commission support for the production of this publication does not constitute an endorsement of the contents which reflects the views only of the authors, and the Commission cannot be held responsible for
any use which may be made of the information contained therein
Table 15 – Reason for participation ...................................................................................................... 26
Table 16 – To what extent you agree to the following statements, in relation to apprenticeships ..... 27
Table 17 – What are the main challenges that you foresee with apprenticeships? ............................. 28
Table 18 – What help would be useful when recruiting an apprentice? .............................................. 29
Table 19 – Experience with apprenticeship and financing support ...................................................... 30
Table 20 – If you decided NOT to recruit an apprentice, what were your main reasons for doing so? 31
Table 21 – Out of the following, is there any training that you need but are not able to source locally?
............................................................................................................................................................... 33
Table 22 – Past experience with apprentices ........................................................................................ 34
Table 23 – Experience with apprenticeship and % successfully finished, directly employ or working . 35

5
The European Commission support for the production of this publication does not constitute an endorsement of the contents which reflects the views only of the authors, and the Commission cannot be held responsible for
any use which may be made of the information contained therein
1 Framework
The Hungarian Society of Textile Technology and Science (TMTE) is a public benefit (non-profit) organ-
isation and a knowledge centre of the Hungarian textile, garment and textile care industry. The pro-
fessional organisation which has rich traditions has actually 80 companies and 250 individual experts
as member.
We sent our invitation to participate in the present assessment through several communication chan-
nels to business enterprises of the T&C sector:
- we delivered presentations during events arranged for professionals about the TEXAPP project,
- we sent direct mail messages to the enterprises registered in our database,
- we used also the channels provided by Internet: we published our call in TMTE's website and Face-
book page.
In total, we received 54 evaluable answers from companies (49 companies answered all questions and
5 companies not filled all questions). The total number of workers employed by respondent companies
is 3 928.
The following documents were used, for a more detailed analysis of the questionnaires:
• GENERAL ECONOMIC ENVIRONMENT AND EVOLUTION OF THE TEXTILE/CLOTHING INDUSTRY
IN 201 6, Report for EURATEX by Association of Hungarian Light Industry (AHLI) (April, 2017)
• A summary of a nation-wide survey carried out by Bobbin Ltd. between September 2016 and 15 January 2017, among enterprises active in sewing operations. (http://www.bobbin.hu/?bb001)
• A presentation held by Texture Ltd. in the second half of 2016, concerning the results and findings of a survey carried out among companies producing working apparel (see Professional Day on 7 March 2017).
• Recommended approaches proposed to solve the problems encountered in training courses focused on textile and clothing industry and textile laundering. (http://www.mksz.org/sites/default/files/javaslatok_a_textil-ruhaipari_agazat_prob-lemainak_orvoslasara_v6.pdf). Published by AHLI in 2016
• Closure of the Study on a research program titled: "Assessment of demand for adult training
in sectors of textile and clothing industry, textile laundering and the leather and shoe indus-
tries, with particular regard to the distance learning programs". Published by TMTE (October,
2009)
Unfortunately, the survey performed in 2009 marked the last attempt to perform a comprehensive
study concerning issues related to vocational (further) training and adult training. Since the Hungarian
system of education was transformed from top to bottom between 2013 and 2016, we have taken into
account only the findings yet valid under the changed circumstances.

6
The European Commission support for the production of this publication does not constitute an endorsement of the contents which reflects the views only of the authors, and the Commission cannot be held responsible for
any use which may be made of the information contained therein
2 Introduction of the Hungarian T&C sectors
The following figures show the breakdown of the production into subsectors by value:
Textile industry: Clothing industry:
After a good year in 2015, the performance of Hungarian textile industry strongly declined in 2016 in
comparison with 2015. On the other hand, the production of clothing industry was higher than last
year. The output of clothing industry increased by over 5% in 2016.
The figures show that domestic sales have strongly increased, while export sales lost again some share
both in textile and clothing industries:
In line with the sales figures, the number of companies registered show a decrease in the last year:
Registered corporations (companies and partnerships)
Sole proprietors with license
2016 2015 Index 2016 2015 Index
Textile 932 981 0.95 1340 1129 1.19
Clothing 2103 2272 0.93 2093 1987 1.05
Total 3035 3253 0.93 3433 3116 1.11
NACE Indices of sales %
Total Domestic Export
2015 2016 2015 2016 2015 2016
13 Textiles 110.1 88.3 109.4 123.3 114.1 81.6
14 Clothing 88.5 105.3 90.3 120.1 87.7 98.3
1413 Outerwear 90.8 100.9 97.7 114.3 88.1 95.1
1414 Underwear 90.9 87.9 81.8 129.0 92.5 81.7

7
The European Commission support for the production of this publication does not constitute an endorsement of the contents which reflects the views only of the authors, and the Commission cannot be held responsible for
any use which may be made of the information contained therein
The following table shows the number of companies in different staff categories. The table shows that the Hungarian T&C industry is dominated by SME’s:
*number of employees If we compare the market data with those companies who answered to the questionnaire, we can conclude that the respondents give a good selection of the Hungarian T&C industry, an average 11-12% of the companies is represented in each sector:
% of companies represented
Micro (1-9)
Small (10-49)
Medium (50-249)
Big (250+)
Textiles 0,77% 9,71% 21,62% 14,29%
Clothing 0,35% 4,30% 13,11% 33,33%
Total T/C 0,50% 5,76% 16,33% 26,32%
Branch
Year
Staff categories*
0 or unknown
1-9 10-49 50-250 > 250 Total
13 Textiles
2013 596 1110 106 38 7 1857
2014 710 1121 112 37 7 1987
2015 826 1134 106 36 8 2110
2016 704 1421 103 37 7 2272
14 Clothing
2013 859 3183 324 86 13 4465
2014 899 3116 326 85 11 4427
2015 847 3036 295 69 12 4259
2016 1023 2821 279 61 12 4196

8
The European Commission support for the production of this publication does not constitute an endorsement of the contents which reflects the views only of the authors, and the Commission cannot be held responsible for
any use which may be made of the information contained therein
1. Chapter 1: General Characteristics
Chapter 1 presents the general characteristics of the companies that replied to the questionnaire. In
this chapter, the data of the 54 companies will be presented for the year of establishment, number of
employees, sector, turnover evolution, workforce qualifications and recruitment needs and sources.
A historic survey:
As a result of reorganisations carried out in the textile industry in the 1960's, large companies having
many sites had been created predominantly.
Such large companies represented every branch of textile industry activities, from the production of
yarns and various woven and non-woven fabrics to the manufacture of finished products, based on far
reaching specialization. Also ready-to-wear products have been made by the knitwear industry classi-
fied to the textile industry.
Also the municipality-owned enterprises and industrial co-operatives played an important role. Private
producers (mostly involved in knitwear production) deserved particular attention.
On the average, the large companies exported 50% of their output directly or indirectly in the form of
ready-to-wear products.
The former COMECON countries were predominantly considered as market outlets, primarily the So-
viet Union where the textile products were delivered in exchange for energy carriers. Considerable
volumes were sold to Western Europe and to overseas markets (primarily to the USA).
The domestic textile industry produced twice as much as the household demand. (Nearly 70% of the
internal demand for clothing was satisfied by selling the products of the domestic textile industry.)
After 1990, the standing of the textile industry changed substantially.
One of the former large companies' markets, i.e. the Soviet market, had been closed to the Hungarian
products almost immediately following the disintegration of the Soviet Union and the COMECON. The
import liberalization carried out simultaneously with the loss of the primary export markets further
aggravated the situation, because cheap products from the Far East flooded the local market.
The technical level and productivity of the machinery and technologies available to the Hungarian tex-
tile industry was not adequate to make a fast swing-over towards the West European markets.
The companies' financial strength did not allow for technical development. Availability of the necessary
funds was greatly restricted by the pricing system stemming from the official domestic pricing policy
and, in several cases, by the need to reimburse loans used to finance development programs carried
out in the second half of the 1980's.
Owing to the loss of their markets, many large companies lost their financial balance, resulting in
fast cut-back of the textile industry.

9
The European Commission support for the production of this publication does not constitute an endorsement of the contents which reflects the views only of the authors, and the Commission cannot be held responsible for
any use which may be made of the information contained therein
In the course of the surge of privatization, Hungarian individuals (most frequently the former man-
agers of the companies) or foreign citizens acquired exclusive or majority ownership. Lots of small
plants were established, however, they operated obsolete equipment and lacked for adequate profes-
sional knowledge and market outlets and, therefore, many of them became bankrupt.
In the 1960's, creation of large companies dominated the textile clothing industry (like in the textile
industry). Each company had several sites and they were fundamentally expected to create new jobs
in the country. Many of them started dress making shops as a subsidiary unit of agricultural co-opera-
tives, in order to alleviate the seasonal lack of work possibilities.
Since the output of the textile clothing industry was twice as much as the local demand, more than
half of the products was exported. The Soviet market was one of the most prominent ones, in addition
to the considerable absorbing capacity of the European market.
In the early 1990's, the textile clothing industry tried (unlike the textile industry) to substitute West
European market outlets (primarily, by increasing the volume of wagework) for the opportunities lost
in the Soviet Union and the COMECON countries.
At the beginning of the 1990's, the number of employees was slightly increased in this branch of
industry, followed by stabilization and, in 1998 and 1999, this number increased again and provided
work for nearly 70,000 people, in contrast to the usual 55,000 to 60,000.
Although the privatization process had taken place also in the textile clothing industry, the level of
production and exports was maintained and the number of enterprises multiplied, accompanied by a
significant shrinking of the individual plants' size.
At present, a considerable part of the large textile industry companies are owned by foreign entities
while the biggest clothing industry workshops are operated by the state and play a special role in em-
ployment (e.g. convicts, disabled people).
Graphic 1 - Years of operations
15%
68%
17%
Years of Operations
0-1 1-10 10-30 30+

10
The European Commission support for the production of this publication does not constitute an endorsement of the contents which reflects the views only of the authors, and the Commission cannot be held responsible for
any use which may be made of the information contained therein
Of the 54 companies that responded 68% of companies’ are established between 10 and 30 years. 17%
are established more than 30 years and only 15% are established between 1 and 10 years.
As the data of those companies who participated in the survey shows, the majority of textile or apparel
companies operating in Hungary were founded around the political change (end of 1980’s, beginning
of 1990’s), when the state-owned large socialist companies were privatized. A smaller portion of com-
panies (typically with long traditions) were formed as legal succession of the state-owned companies.
They operate in form re-structured by the new owners (Hungarian or foreign owners), with a product
line more in line with the market demands. Of course there are continuously forming new companies,
typically in the SME sector under analysis.
Graphic 2 - Company size
Of the 54 companies that responded, 32% are small companies, 26% are medium, 33 % are micro and
9% are big.
The percentage of respondents in each staff category are different from the overall industry statistics.
The following table shows the number of companies in different staff categories. The table shows that
the Hungarian T&C industry is dominated by SME’s:
Branch
Year
Staff categories (%)
1-9 10-49 50-250 > 250 Total
13 Textiles 2016 90,6 6,6 2,4 0,4 100
14 Clothing 2016 88,9 8,8 1,9 0,4 100
33%
32%
26%
9%
Company size
Micro
(1-9)
Small
(10-49)
Medium
(50-249)
Big
(250+)

11
The European Commission support for the production of this publication does not constitute an endorsement of the contents which reflects the views only of the authors, and the Commission cannot be held responsible for
any use which may be made of the information contained therein
This is due to the fact, that TMTE, as the professional institution is rather in contact with SME’s, not so
much with the micro companies or individual entrepreneurs. Therefore the medium and larger size
enterprises are represented to a larger extent in the current survey.
Graphic 3 – Sectors
The companies are mainly form the Clothing sector (53%) and 47% from the Textile sector.
The survey was filled by more Clothing company, than those of Textile sector. This correlates with the
market statistics, where the textile companies represent 35%, while the clothing companies 65%.
Please note, that the responses arrived from all part of the country, independent from the sector con-
centration by regions. This also shows that the activities of TMTE achieve national coverage.
Graphic 4 – Over the past 5 years, has company turnover
Of the 54 companies that replied to the questionnaire, 24 have increased their turnover in the last 5
years. 12 companies answered that stayed the same and 18 companies stated that the company's
turnover was reduced.
Textile 47%Clothing
53%
SECTORS
- 5 10 15 20 25 30
Reduced
Stayed the same
Grown
Over the past 5 years, has company turnover

12
The European Commission support for the production of this publication does not constitute an endorsement of the contents which reflects the views only of the authors, and the Commission cannot be held responsible for
any use which may be made of the information contained therein
The answers are correlating with the sector statistics. The turnover of Clothing sector shows slight increase, while the Textile sector shows slight decrease in the past one year. Both show variations over the 5 years horizon, where also the changing HUF-EUR exchange rate can influence the EUR value of the turnover. The sales figures and the breakdown of total turnover of the last five years are in the following tables: Textiles:
Year Domestic sales Export sales Total turnover
MHUF MEUR %* MHUF MEUR %* MHUF MEUR
2012 26 658 92.1 24.5 82 936 286.6 75.5 108 995 376.6
2013 18 592 62.6 18.8 82 139 276.6 81.2 100 419 339.24
2014 17 392 56.4 14.9 99 046 320.9 85.1 116 437 377.2
2015 20 313 65.6 15.8 108 308 349.5 84.2 128 621 415.0
2016 25 436 81.7 22.2 88 841 285.2 77.8 114 277 366.90
Clothing:
Year Domestic sales Export sales Total turnover
MHUF MEUR %* MHUF MEUR %* MHUF MEUR
2012 28 109 97.1 31.1 62 395 215.6 68.9 90 504 312.7
2013 22 858 77.0 25.6 66 293 223.3 74.4 89 151 300.3
2014 30 881 100.1 30.8 69 517 225.2 69.2 100 398 325.3
2015 29 161 94.1 31.9 62 378 201.3 68.1 91 539 295.4
2016 36 274 116.5 36.5 62 983 202.2 63.5 99 257 318.7
* total sales = 100

13
The European Commission support for the production of this publication does not constitute an endorsement of the contents which reflects the views only of the authors, and the Commission cannot be held responsible for
any use which may be made of the information contained therein
Graphic 5 – Over the next 5 years, do you expect turnover to
Majority of the companies are optimistic about the future outlook (30), but a large number of compa-
nies (18) predict stagnating turnover for the next 5 years.
Those who managed to grow in the past years are more optimistic that this future trend will continue,
while those who stagnated expect no big opportunities but further stagnation in the future.
Growth can be experienced rather at those companies who are specialized in technical textile or de-
liver to industries showing growth (e.g. tourism).
Graphic 6 – Over the past year has the workforce
Regarding the evolution of the workforce, the data show that 24 of the companies stayed the same;
however, it is noteworthy that 13 companies increased significantly and 17 companies indicated that
workforce decreased significantly.
Also the surveys carried out by the two companies, mentioned in the introductory part, among their
respective clientele proved that the decrease of the availability of skilled labor is one of the greatest
concern for the enterprises, beyond the consistently increasing and generally perceivable lack of man-
power. Such lack of manpower inflicts equally the companies of the textile and the clothing industry
- 5 10 15 20 25 30 35
Reduced
Stayed the same
Grown
Over the next 5 years, do you expect turnover to
-1 1 3 5 7 9 11 13 15 17 19 21 23 25
a. Decreased significantly (>5%)
b. Decreased slightly (<5%)
c. Stayed the same
d. Increased slightly (<5%)
e. Increased significantly (>5%)
Over the past year has the workforce

14
The European Commission support for the production of this publication does not constitute an endorsement of the contents which reflects the views only of the authors, and the Commission cannot be held responsible for
any use which may be made of the information contained therein
and, nowadays, the crisis appears, in practice, irrespective of the geographic (regional) location of the
entity in question.
The scope of vocational education has shrunk equally in the facilities of both the secondary and higher
education. The teenagers of these days reluctantly opt for learning the knacks of the textile and textile
clothing profession. Even if they graduate from these schools, most of them chose some different pro-
fession. In the present system of education, the young ones have an opportunity to attend, free of
charge, also another vocational school. In this industry, the wages tend to remain below the industrial
average and the overall lack of manpower experienced in the industry as a whole, seems to prompt
also other people erudite in other professions to look for other possibilities.
From among the questions put to the clientele to assess the situation, improvement of the vocational education system was marked as the second most important condition in response to the question composed as "What is indispensably needed to keep your enterprise running?". Also the research con-ducted among the manufacturers of work clothing indicated (by a high 4.4 score) the restructuring and restarting of the training of seamstresses, as one of the most important tasks.
Graphic 7 – What proportion of the workforce is
Table 1 – What proportion of the workforce is
The highest percentage of workers in the 54 companies is between the semi-skiled (29,48%) and the
unskilled (22,85%). Office staff with 7,80% and 4,19% middle management shows healthy proportions.
Top management is only 1,70% and 6,72% represents other workers.
What proportion of the workforce is
Unskilled Semi-skilled Office staff Middle
management Top
management Other
22,85 29,48 7,80 4,19 1,70 6,72

15
The European Commission support for the production of this publication does not constitute an endorsement of the contents which reflects the views only of the authors, and the Commission cannot be held responsible for
any use which may be made of the information contained therein
Graphic 8 – What qualifications does the workforce hold
Table 2 – What qualifications does the workforce hold
What qualifications does the workforce hold
University degree
Tertiary education (non-university
degree)
High school graduation
Vocational qualifi-cations
Primary educa-tion
None
3,48 2,87 14,06 32,15 19,59 0,59
Regarding the qualification of the workforce, it is verified that the majority has vocational education
32,15%, then 19,59% only have primary education and 14.06% present a high school graduation. How-
ever, it is found that 3,48% of workers already have university degree, followed by 2.87% tertiary ed-
ucation and only 0,59% with none.
The companies are compelled to substitute unskilled workers for the missing skilled labor. Also the
above diagrams and tables indicate the significant proportions of unskilled workers (in general, they
had attended only an 8-class elementary school) in this branch of industry.
The employees having certificates issued by higher education schools are, in general, members of the
small teams of management.

16
The European Commission support for the production of this publication does not constitute an endorsement of the contents which reflects the views only of the authors, and the Commission cannot be held responsible for
any use which may be made of the information contained therein
Graphic 9 – Do you plan to increase your headcount in the next year?
The graphic shows that companies plan to increase their headcount, 30 companies answered yes and
24 companies answered no.
Graphic 10 – Do you have problems recruiting staff?
Vast majority of companies are having troubles at recruiting staff, 76% of the companies answered yes
to the question.
YES
NO
DO YOU PLAN TO INCREASE YOUR HEADCOUNT IN THE NEXT YEAR?
YES
NO
DO YOU HAVE PROBLEMS RECRUITING STAFF?

17
The European Commission support for the production of this publication does not constitute an endorsement of the contents which reflects the views only of the authors, and the Commission cannot be held responsible for
any use which may be made of the information contained therein
Graphic 11 – What sources do you use for recruiting?
Table 3 – What sources do you use for recruiting?
What sources do you use for recruiting?
Job adverti-sing
Local emp-loyment centres
Employment agencies
External service pro-viders (HR consul-ting, headhunter,
etc.)
Cooperation with schools/coll-
eges/universities Internal ad-
vertising Other
44 33 9 5 14 23 8
Job adverti-sing
Local emp-loyment centres
Employment agencies
External service pro-viders (HR consul-ting, headhunter,
etc.)
Cooperation with schools/coll-
eges/universities Internal ad-
vertising Other
81% 61% 17% 9% 26% 43% 15%
When questioned about the sources that they use in the recruitment process we found that the most
common is ‘Job advertising’ (81%), followed by ‘Local employment centres’ with 61% and ‘Internal
advertising’ with 43%. ‘Cooperation with schools/colleges/universities’ were selected by 26% of com-
panies, followed by ‘Employment agencies’ with 17% and ‘External service providers’ with 9%.
0% 10% 20% 30% 40% 50% 60%
Job advertising
Local employment centres
Employment agencies
External service providers (HR consulting, headhunter,…
Cooperation with schools/colleges/universities
Internal advertising
Other
What sources do you use for recruiting?% of companies

18
The European Commission support for the production of this publication does not constitute an endorsement of the contents which reflects the views only of the authors, and the Commission cannot be held responsible for
any use which may be made of the information contained therein
2. Chapter 2: Demographics about the company and HR
Chapter 2 analyse the training, human resources and quality companies’ strategies. In this chapter, the
data of the 54 companies will be presented.
Graphic 12 – Does the company have a training/HR strategy?
Table 4 – Does the company have a training/HR strategy?
Training/HR strategy
Yes No N/A
21 33 0
Majority of the companies (33) do not have a Training / HR strategy.
Yes39%
No61%
TRAINING/HR STRATEGY

19
The European Commission support for the production of this publication does not constitute an endorsement of the contents which reflects the views only of the authors, and the Commission cannot be held responsible for
any use which may be made of the information contained therein
Graphic 13 – Does the company operate Quality standards?
Table 5 – Does the company operate Quality standards?
Does the company operate Quality
standards?
Yes No
35 19
19 of the 54 companies answered that operate without quality standards. This number show us that
there is a concern in companies with quality process, responding with that to the market demands.
Graphic 14 – Type of quality standards?

20
The European Commission support for the production of this publication does not constitute an endorsement of the contents which reflects the views only of the authors, and the Commission cannot be held responsible for
any use which may be made of the information contained therein
Table 6 – Type of quality standards?
Type of Quality standards
ISO Internal
Standard
Custo-mer/Sector Standard Other
18 23 7 6
The companies that answered positive regarding the quality standards use mainly internal standard
(23), or ISO (18), some Customer/sector standard (7) and Other (6).
Graphic 15 – Usage of internal training capacity?
Table 7 – Usage of internal training capacity?
Usage of internal training capacity
Yes No
26 28
Almost half of the companies (26) use their internal training capacity.
YesNo
USAGE OF INTERNAL TRAINING CAPACITY

21
The European Commission support for the production of this publication does not constitute an endorsement of the contents which reflects the views only of the authors, and the Commission cannot be held responsible for
any use which may be made of the information contained therein
Graphic 16 – Usage of external training providers?
Table 8 – Usage of external training providers?
Usage of external training providers
Yes No
15 39
Only 15 companies answered that an external training provider is used.
Yes
No
USAGE OF EXTERNAL TRAINING PROVIDERS
22
The European Commission support for the production of this publication does not constitute an endorsement of the contents which reflects the views only of the authors, and the Commission cannot be held responsible for
any use which may be made of the information contained therein
3. Chapter 3: Apprenticeship characterization
Chapter 3 presents the companies' knowledge about apprenticeships, trying to analyze their involve-
ment with the apprenticeships systems.
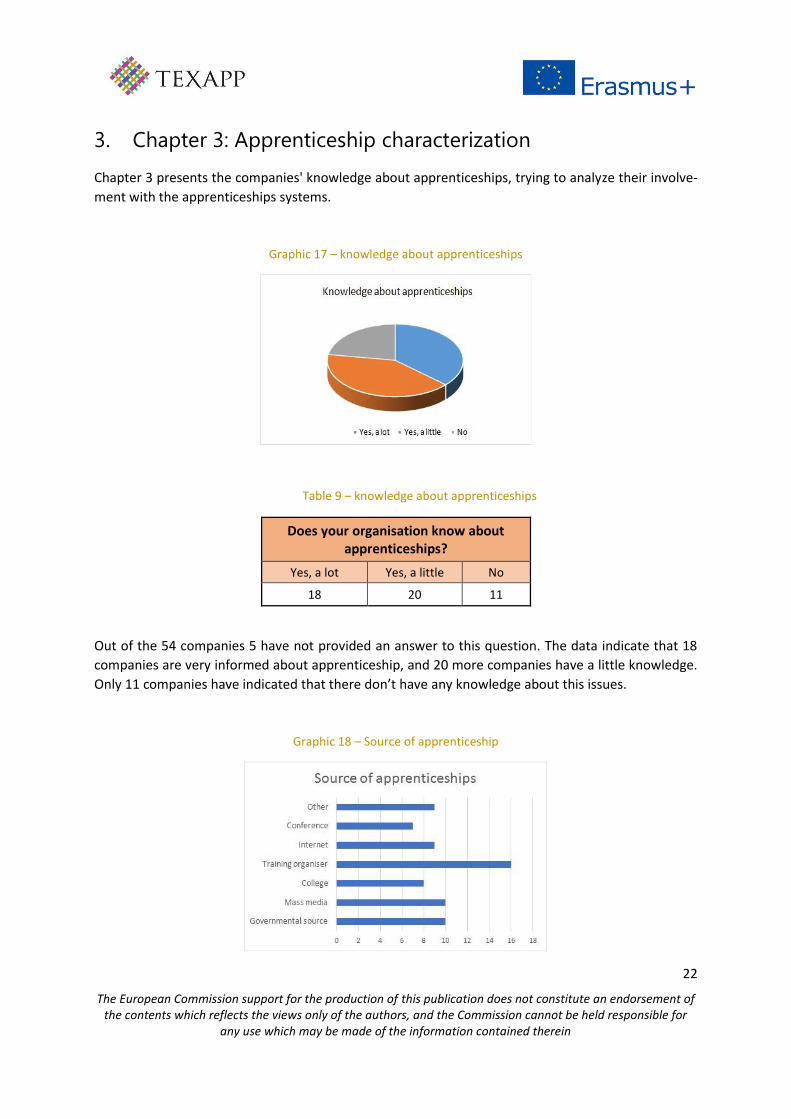
Graphic 17 – knowledge about apprenticeships
Table 9 – knowledge about apprenticeships
Does your organisation know about apprenticeships?
Yes, a lot Yes, a little No
18 20 11
Out of the 54 companies 5 have not provided an answer to this question. The data indicate that 18
companies are very informed about apprenticeship, and 20 more companies have a little knowledge.
Only 11 companies have indicated that there don’t have any knowledge about this issues.
Graphic 18 – Source of apprenticeship

23
The European Commission support for the production of this publication does not constitute an endorsement of the contents which reflects the views only of the authors, and the Commission cannot be held responsible for
any use which may be made of the information contained therein
Table 10 – Source of apprenticeship
Sources of apprenticeships
Governmental source Mass media College Training organiser Internet Conference Other
10 10 8 16 9 7 9
For the companies that answered that have a little and a lot knowledge about apprenticeships, the
main sources of information selected are: training organiser (16); governmental source (10); mass me-
dia (10); internet (9); other (9); college (8); and conference (7).
In Hungary the Chambers of Commerce (local or regional) play an important role in communicating
and education SMEs. Out of the 9 companies who have selected “Other” as source of information, 5
have gathered information on apprenticeship from such Chambers. Additional 4 companies have in-
formation from own previous experiences on apprenticeship.
Graphic 19 – Experience in apprenticeships
Table 11 – Experience in apprenticeships
Experience in apprenticeships
Yes No N/A
18 31 5
In relation to experience in apprenticeships, 49 companies answered this question. The number of
companies with experience in this issue is relative low, only 37% of the companies have experience
with apprenticeships (18). However is important to try understanding why 31 companies do not have
experience and 5 indicated N/A.

24
The European Commission support for the production of this publication does not constitute an endorsement of the contents which reflects the views only of the authors, and the Commission cannot be held responsible for
any use which may be made of the information contained therein
Graphic 20 – Possibilities for apprentice’s recruitment
Table 12 – Possibilities for apprentice’s recruitment
How likely are you to recruit an apprentice over the next 2 years
Likely Unlikely Very likely Very unlikely
14 16 7 12
Most of the 49 companies that answered this question (57%) indicated that they do not think about
currently on recruiting apprentices in the future. exists the possibility for apprentice’s recruitment,
(12) very likely, (17) likely. 7 companies say that do not need a apprentice’s in the next 2 years.
In correlation to their knowledge on apprenticeship, those companies who have no knowledge are less
likely to recruit apprentices. Those who have a little knowledge still 70% indicate that they are rather
unlikely or very unlikely to recruit apprentices. Out of those, who have a lot knowledge on apprentice-
ships, 60% have indicated they are rather likely or very likely to recruit apprentices.
Graphic 21 – Which of the following areas might you recruit in an apprentice

25
The European Commission support for the production of this publication does not constitute an endorsement of the contents which reflects the views only of the authors, and the Commission cannot be held responsible for
any use which may be made of the information contained therein
Table 13 – Which of the following areas might you recruit in an apprentice
Which of the following areas might you recruit in an apprentice
Business Administration Technical Customer service Manufacturing Marketing Finance Other
3 9 0 17 1 0 0
Regarding to the areas identified by the companies as most important, the following areas are high-
lighted: manufacturing (17), technical (9). Some in Business Administration (3) and marketing (1).
Graphic 22 – Already participated in apprenticeship or plan recruiting an apprentice
Table 14 – Already participated in apprenticeship or plan recruiting an apprentice
Have you already participated in apprenticeship or plan recruit-
ing an apprentice
Yes No
23 26
23 of the 49 companies reported having already participated in apprenticeship or indicate that plan
recruiting an apprentice.
If we look at Graphic 20 we unfortunately see, that those, who have previous experience with appren-
tices, only up to 61% are considering to recruit an apprentice over the next 2 years.
26
The European Commission support for the production of this publication does not constitute an endorsement of the contents which reflects the views only of the authors, and the Commission cannot be held responsible for
any use which may be made of the information contained therein
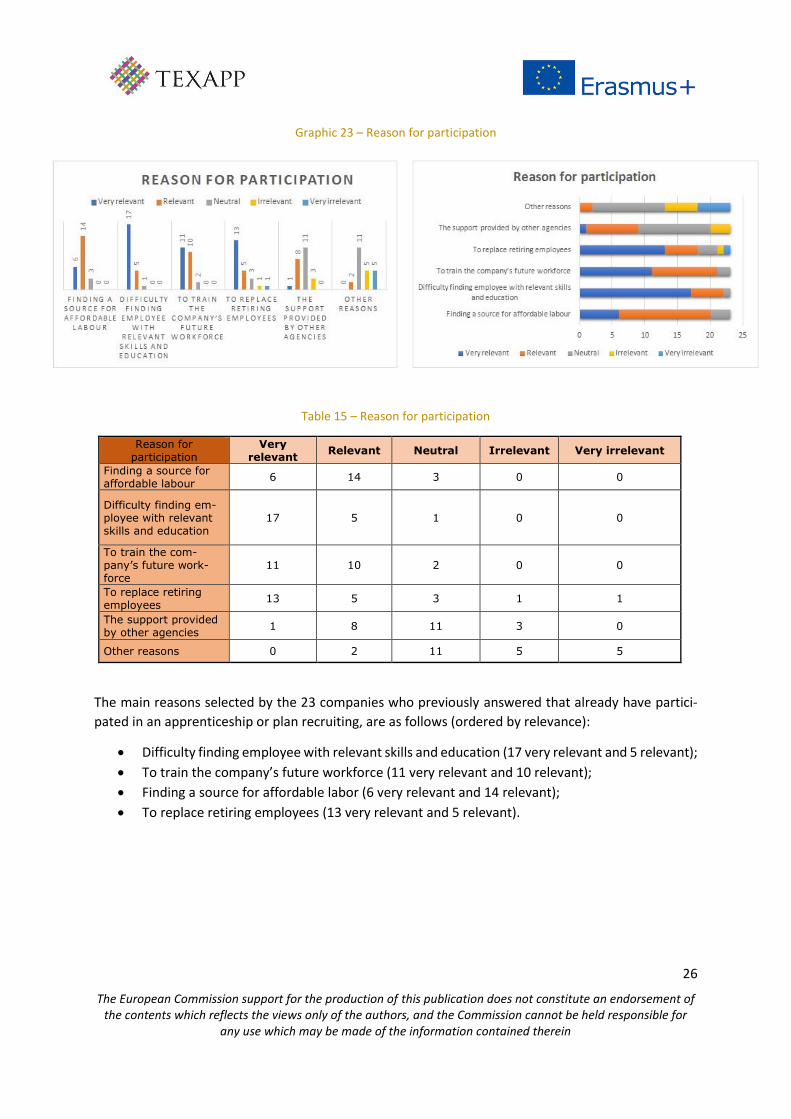
Graphic 23 – Reason for participation
Table 15 – Reason for participation
Reason for participation
Very relevant
Relevant Neutral Irrelevant Very irrelevant
Finding a source for affordable labour
6 14 3 0 0
Difficulty finding em-ployee with relevant skills and education
17 5 1 0 0
To train the com-pany’s future work-force
11 10 2 0 0
To replace retiring employees
13 5 3 1 1
The support provided by other agencies
1 8 11 3 0
Other reasons 0 2 11 5 5
The main reasons selected by the 23 companies who previously answered that already have partici-
pated in an apprenticeship or plan recruiting, are as follows (ordered by relevance):
• Difficulty finding employee with relevant skills and education (17 very relevant and 5 relevant);
• To train the company’s future workforce (11 very relevant and 10 relevant);
• Finding a source for affordable labor (6 very relevant and 14 relevant);
• To replace retiring employees (13 very relevant and 5 relevant).

27
The European Commission support for the production of this publication does not constitute an endorsement of the contents which reflects the views only of the authors, and the Commission cannot be held responsible for
any use which may be made of the information contained therein
Graphic 24 – To what extent you agree to the following statements, in relation to apprenticeships
Table 16 – To what extent you agree to the following statements, in relation to apprenticeships
To what extent you agree to the follow-ing statements, in relation to appren-ticeships
Strongly Agree
Agree Neutral Disagree Strongly Disagree
The rules applying to apprenticeships are easy to understand
5 15 21 7 1
The relevant authority provides me with the necessary information
5 19 18 6 1
The regulations are difficult to apply
3 20 19 6 1
The administration workload is accepta-ble
0 10 26 12 1
The practical training time spent at the company is sufficient
0 13 20 14 2
The 49 companies have given in many cases Neutral as answer. The companies with no previous expe-
rience rather remained neutral or expressed disagreement that could be the reason for not participat-
ing. However, we can note that:
• The relevant authority provides me with the necessary information – from those companies
who have previous experience with apprenticeship, 78% agree or strongly agree, from those
who have no previous experience still 38% selected agree or strongly agree. Those 7 compa-
nies who have indicated disagreement, 4 has previous experience with apprenticeship;
• The regulations are difficult to apply – 19 companies remained Neutral, 23 are rather agree
and only 7 companies found that regulations are not so difficult to apply. Out of those compa-
nies who thing the regulations are difficult to apply, 61% already have previous experience;

28
The European Commission support for the production of this publication does not constitute an endorsement of the contents which reflects the views only of the authors, and the Commission cannot be held responsible for
any use which may be made of the information contained therein
• The rules applying to apprenticeships are easy to understand – 21 selected agree or strongly
agree but the majority 21 selected neutral. Those 8 companies who have selected disagree or
strongly disagree, only 37% have previous experience;
• The practical training time spent at the company is sufficient – 13 selected agree; 20 selected
neutral and 16 selected disagree.
• The administration workload is acceptable – 10 selected agree; 26 selected neutral and 13
selected disagree;
The last three statements are the ones that met the greatest divergence of answering.
Graphic 25 – What are the main challenges that you foresee with apprenticeships?
Table 17 – What are the main challenges that you foresee with apprenticeships?
What are the main challenges that you foresee with apprenticeships?
Selecting / finding the right per-
son
Managing the ap-prentice
Developing the training programme
Finding them suita-ble work to
do
Right atti-tude for
work (from the appren-
tice)
Poor start-ing
knowledge (of the ap-prentice)
Cost Other No chal-lenges
Will not be taking on
an appren-tice
25 12 12 12 17 17 13 1 1 18
Selecting / finding the right per-
son
Managing the ap-prentice
Developing the training programme
Finding them suita-ble work to
do
Right atti-tude for
work (from the appren-
tice)
Poor start-ing
knowledge (of the ap-prentice)
Cost Other No chal-lenges
Will not be taking on
an appren-tice
51% 24% 24% 24% 35% 35% 27% 2% 2% 37%
We got the answer from 49 companies in this question.

29
The European Commission support for the production of this publication does not constitute an endorsement of the contents which reflects the views only of the authors, and the Commission cannot be held responsible for
any use which may be made of the information contained therein
We verified that the companies identified some challenges with foreseen apprentices, the following
four was the most outstanding:
• Selecting/finding the right person (51%);
• Right attitude for work (from the apprentice) (35%);
• Poor starting knowledge (of the apprentice) (35%);
• Cost (27%)
Graphic 26 – What help would be useful when recruiting an apprentice?
Table 18 – What help would be useful when recruiting an apprentice?
What help would be useful when recruiting an apprentice?
Advertising the va-cancy
Identifying the per-
son
Arranging interviews
Conducting interviews
Supporting development of the train-
ing pro-gramme
Providing links to schools
Supporting administration
Other
Will not be taking on
an appren-tice
10 11 8 9 19 22 6 1 19
Advertising the va-cancy
Identifying the per-
son
Arranging interviews
Conducting interviews
Supporting development of the train-
ing pro-gramme
Providing links to schools
Supporting administration
Other
Will not be taking on
an appren-tice
20% 22% 16% 18% 39% 45% 12% 2% 39%
Regarding to the type of help that would be useful to receive when recruiting an apprentice, 39% of
the companies selected "providing links to schools" with 45%, followed by "supporting development
of the training program" and "identifying the person" with 22% of responses.

30
The European Commission support for the production of this publication does not constitute an endorsement of the contents which reflects the views only of the authors, and the Commission cannot be held responsible for
any use which may be made of the information contained therein
If we relate these responses to graphic, 24 we find that the companies understand the rules but have
relative low confidence in finding the right persons, with the right attitude. Also, rules are difficult to
apply and companies would mainly need support in developing training programs.
4. Chapter 4: Familiarizing with apprenticeship
This chapter identifies companies' knowledge of eligible support for recruiting an apprentice and seeks
to identify the training needs of companies as well as to understand the reasons why companies do
not recruit an apprentice.
Graphic 27 – Experience with apprenticeship and financing support
Table 19 – Experience with apprenticeship and financing support
Are you familiar with the financ-ing support you are eligible for when employing an apprentice?
Do you have past expe-rience with apprentices
YES 22 18
NO 27 31
Regarding the knowledge about financing support for employing an apprentice, we can note that only
18 companies (37%) have it.
31
The European Commission support for the production of this publication does not constitute an endorsement of the contents which reflects the views only of the authors, and the Commission cannot be held responsible for
any use which may be made of the information contained therein
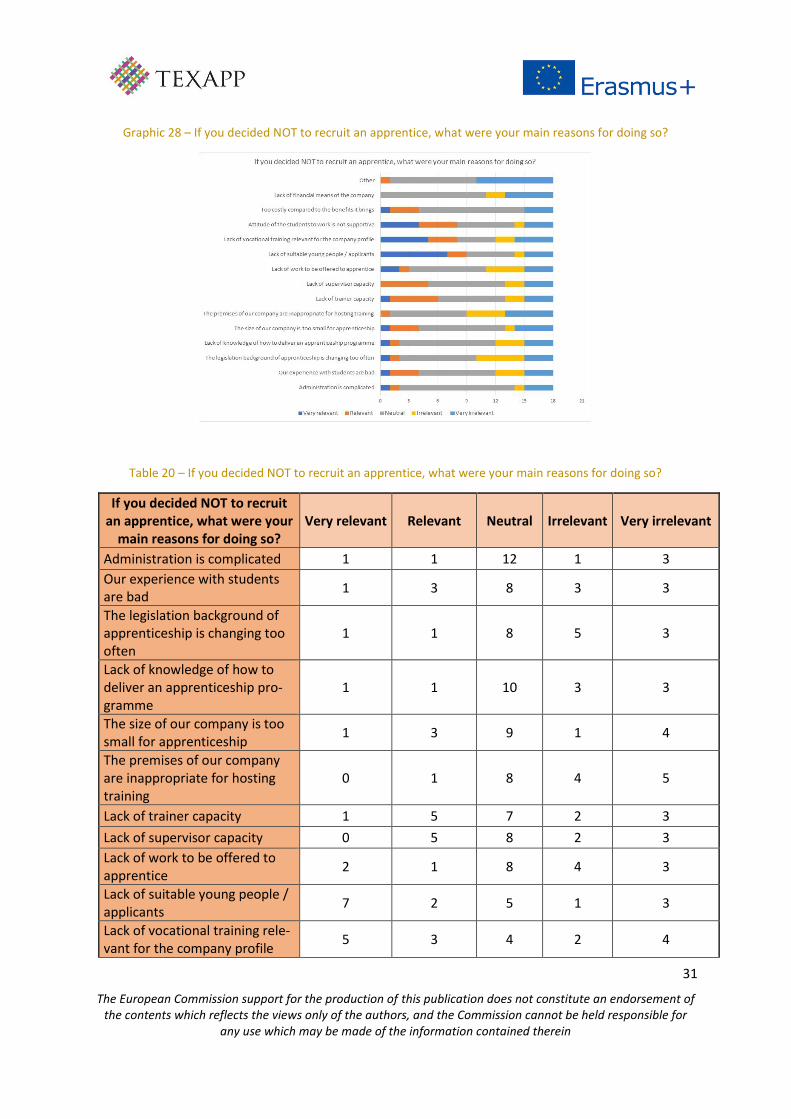
Graphic 28 – If you decided NOT to recruit an apprentice, what were your main reasons for doing so?
Table 20 – If you decided NOT to recruit an apprentice, what were your main reasons for doing so?
If you decided NOT to recruit an apprentice, what were your
main reasons for doing so? Very relevant Relevant Neutral Irrelevant Very irrelevant
Administration is complicated 1 1 12 1 3
Our experience with students are bad
1 3 8 3 3
The legislation background of apprenticeship is changing too often
1 1 8 5 3
Lack of knowledge of how to deliver an apprenticeship pro-gramme
1 1 10 3 3
The size of our company is too small for apprenticeship
1 3 9 1 4
The premises of our company are inappropriate for hosting training
0 1 8 4 5
Lack of trainer capacity 1 5 7 2 3
Lack of supervisor capacity 0 5 8 2 3
Lack of work to be offered to apprentice
2 1 8 4 3
Lack of suitable young people / applicants
7 2 5 1 3
Lack of vocational training rele-vant for the company profile
5 3 4 2 4
32
The European Commission support for the production of this publication does not constitute an endorsement of the contents which reflects the views only of the authors, and the Commission cannot be held responsible for
any use which may be made of the information contained therein
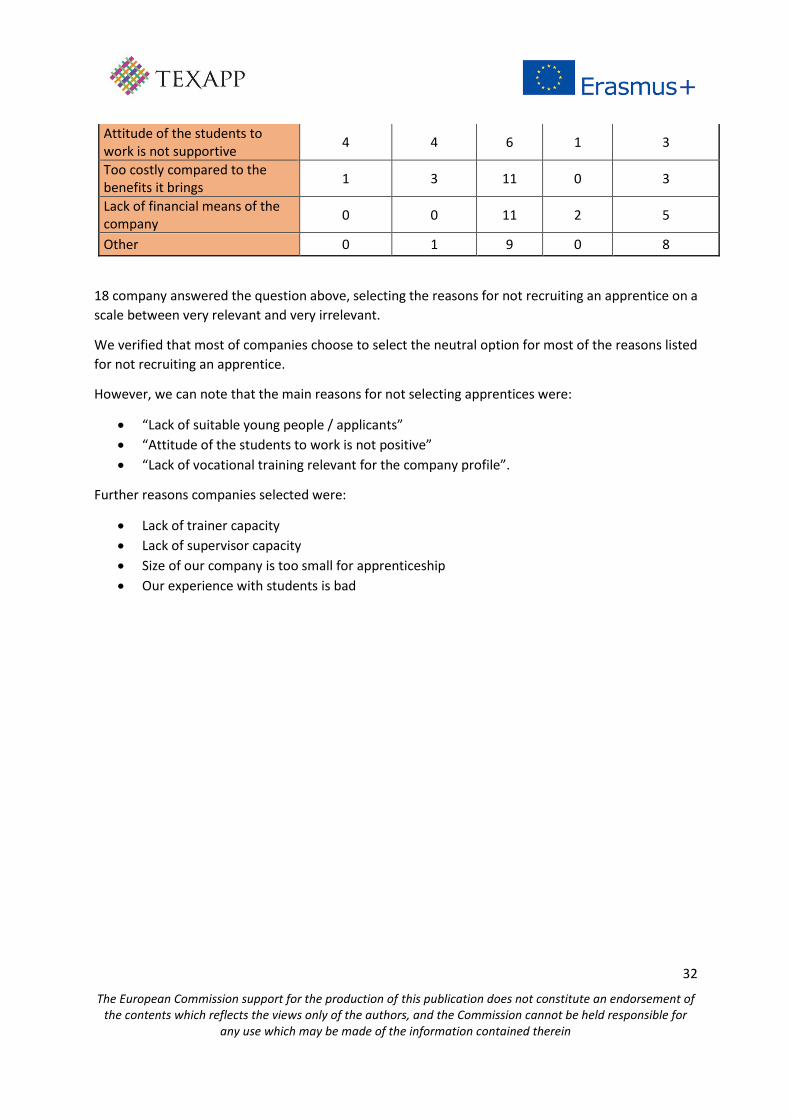
Attitude of the students to work is not supportive
4 4 6 1 3
Too costly compared to the benefits it brings
1 3 11 0 3
Lack of financial means of the company
0 0 11 2 5
Other 0 1 9 0 8
18 company answered the question above, selecting the reasons for not recruiting an apprentice on a
scale between very relevant and very irrelevant.
We verified that most of companies choose to select the neutral option for most of the reasons listed
for not recruiting an apprentice.
However, we can note that the main reasons for not selecting apprentices were:
• “Lack of suitable young people / applicants”
• “Attitude of the students to work is not positive”
• “Lack of vocational training relevant for the company profile”.
Further reasons companies selected were:
• Lack of trainer capacity
• Lack of supervisor capacity
• Size of our company is too small for apprenticeship
• Our experience with students is bad
33
The European Commission support for the production of this publication does not constitute an endorsement of the contents which reflects the views only of the authors, and the Commission cannot be held responsible for
any use which may be made of the information contained therein
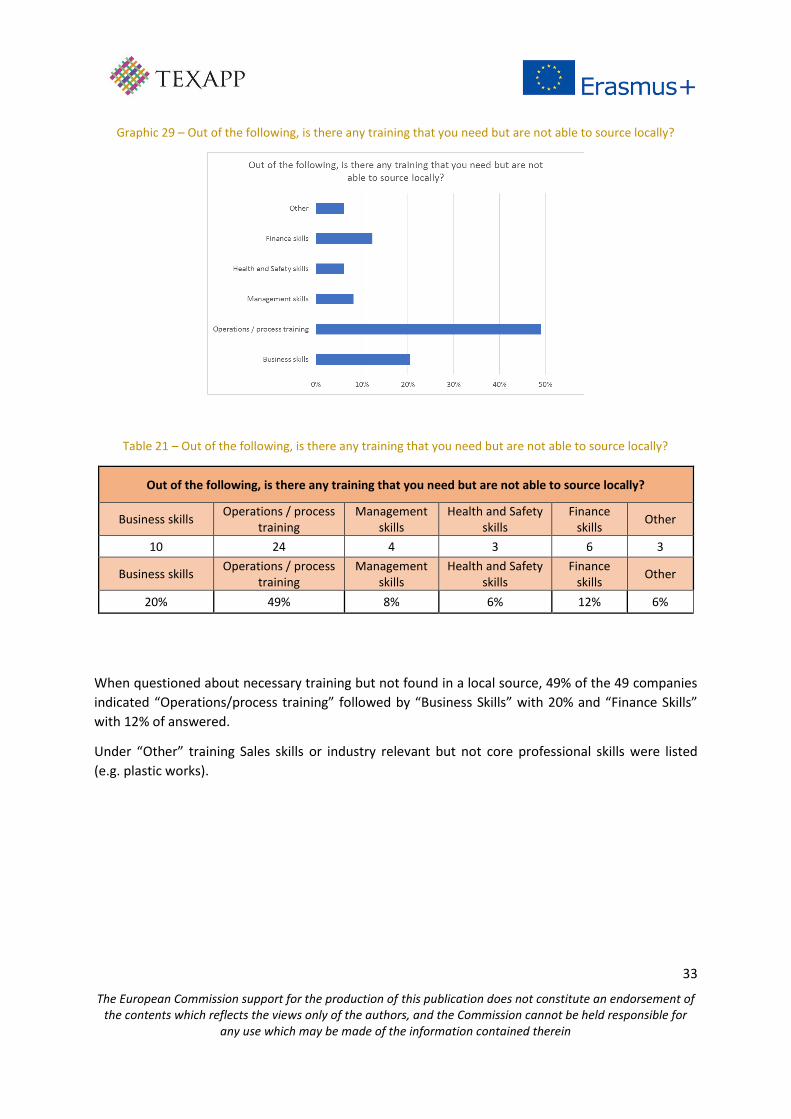
Graphic 29 – Out of the following, is there any training that you need but are not able to source locally?
Table 21 – Out of the following, is there any training that you need but are not able to source locally?
Out of the following, is there any training that you need but are not able to source locally?
Business skills Operations / process
training Management
skills Health and Safety
skills Finance
skills Other
10 24 4 3 6 3
Business skills Operations / process
training Management
skills Health and Safety
skills Finance
skills Other
20% 49% 8% 6% 12% 6%
When questioned about necessary training but not found in a local source, 49% of the 49 companies
indicated “Operations/process training” followed by “Business Skills” with 20% and “Finance Skills”
with 12% of answered.
Under “Other” training Sales skills or industry relevant but not core professional skills were listed
(e.g. plastic works).

34
The European Commission support for the production of this publication does not constitute an endorsement of the contents which reflects the views only of the authors, and the Commission cannot be held responsible for
any use which may be made of the information contained therein
5. Chapter 5: Apprenticeship in organisation & impact of ap-
prenticeship
In this chapter, the results will be presented for the questions related to the companies' experience
with apprenticeships. Namely the number of apprentice who completed a period of apprenticeship
and how many were hired, as well as how many remained in the company after one year. It will also
analyze the reasons for not hiring apprentices and why they not completed the apprenticeship.
Graphic 30 – Past experience with apprentices
Table 22 – Past experience with apprentices
27. Do you have past experience with apprentices?
YES NO N/A TOTAL
18 31 5 54
Of the 49 companies, only some 33% have experience with apprentices.
Although the companies reveal the need for more qualified workers, there is still some resistance to
the apprenticeships programs.

35
The European Commission support for the production of this publication does not constitute an endorsement of the contents which reflects the views only of the authors, and the Commission cannot be held responsible for
any use which may be made of the information contained therein
Graphic 31 – Experience with apprenticeship and % successfully finished, directly employ or working
Table 23 – Experience with apprenticeship and % successfully finished, directly employ or working
Out of those who your company hired following an apprenticeship, what % were working at your company after 1 year?
Out of those who finished apprentice-ship, what % did you
directly employ?
What % of your ap-prentices have suc-
cessfully finished the apprenticeship?
50-80% 1 2 2
>80% 0 0 10
N/A 53 52 42
Of the 18 companies with experience with apprentice, only very limited answers were collected, where
an overall conclusion cannot be given. Please note that:
- 12 companies answered to “what % of your apprentices have successfully finished the appren-
ticeship”, out of which answers 83% indicated over 80% success rate
- Only 2 companies answered to “out of those who finished apprenticeship, what % did you
directly employ” and these companies employed 50-80% of apprentices
- Only 1 company answered “out of those who your company hired following an apprenticeship,
what % were working at your company after 1 year?”, where the company indicated 50-80%

36
The European Commission support for the production of this publication does not constitute an endorsement of the contents which reflects the views only of the authors, and the Commission cannot be held responsible for
any use which may be made of the information contained therein
Graphic 32 – For those who completed apprenticeship at your organisation but were not hired by your com-pany, what were the main reasons to reject apprentices?
The clearly most relevant reason for not hiring an apprentice after a period of apprenticeship was “No
motivation or interest of the apprentice to work in the industry”.
In some other cases ‘Personal skills did not meeting company standards’, ‘Level of skills acquired were
enough for the exam but do not meet company standards’ and ‘No motivation or interest of the ap-
prentice to work with us’ were selected as reason for not hiring an apprentice.
These data underlines the previous conclusions, where the companies would need more apprentices
but their scepticism is based on the lack of availability and motivation of suitable candidates.

37
The European Commission support for the production of this publication does not constitute an endorsement of the contents which reflects the views only of the authors, and the Commission cannot be held responsible for
any use which may be made of the information contained therein
Graphic 33 – For those who have not completed the apprenticeship at your organisation, what were the main reasons for non-completion?
Of the 18 companies answered, the most selected topic (57,9%) was the ‘Apprentice quit’, followed by
‘Other’ (where the companies comments rather indicated that the apprentice is still in progress) and
‘No suitable work could be offered’.
Graphic 34 – Would you like to receive further information on the TEXAPP project and its results?
33 companies want to receive further information about the project and its results, 16 are not inter-
ested while 5 companies did not answered.

38
The European Commission support for the production of this publication does not constitute an endorsement of the contents which reflects the views only of the authors, and the Commission cannot be held responsible for
any use which may be made of the information contained therein
6. Chapter 6: Conclusions
The textile and textile clothing industry can look back upon several centuries long traditions and keeps developing even nowadays. Unfortunately, the "ancientness" of this branch of industry has firmed in the thinking of the society and the decision makers, everywhere in the world and in Hungary, in particular. The immense changes experienced in their activity and products are not perceived although both industries developed into a knowledge-based industry which uses the most recent results and innovations achieved in material science, technology, engineering and information technology. Regrettably, the scope of possibilities for acquiring special knowledge in this profession has shrunk in Hungary. In the secondary vocational schools, professionals are trained, almost exclusively, for the clothing industry while education of light industry engineers qualified in well-established textile and clothing manufacturing skills has practically disappeared. The innovative products of the textile and clothing industry are, in several areas, indispensable ele-ments of the technological solutions underlying any sustainable development. At the same time, the complexity of the production processes requires a considerable staff of employees. In Hungary, 80% of the employees are women. Such plants offer predominantly jobs that require on-the-job training and in many cases, i.e. in underdeveloped regions or in small country towns, they play an important role as employers. Certain work processes of the textile and clothing industry are suitable for introducing atypical forms of employment (e.g. part-time and remote jobs) designed to conciliate the family-related and social tasks of the employees. The following conclusions can be drawn on the basis of the questionnaire developed in the framework of the TEXAPP Project, using the analyzed data:
At the level of growth and characteristics the companies:
- are mainly micro and small companies;
- have rather increased their turnover in the last five years;
- rather expect to increase their turnover in the next five years;
- while workforce stayed the same or rather decreased over the past year;
The questionnaire applied allowed the collection of pertinent information about the experience of
textile and clothing companies in the apprenticeships. Companies:
- have mainly unskilled or semi-skilled workers;
- plan to increase headcount;
- have to a large extent problems recruiting staff;
- trust job advertising, local employment centers and internal advertising as source;
- majority have no training strategy;
- majority operate with quality standards (mainly internal standards and ISO);
- majority do not use external training providers.

39
The European Commission support for the production of this publication does not constitute an endorsement of the contents which reflects the views only of the authors, and the Commission cannot be held responsible for
any use which may be made of the information contained therein
At the level of apprenticeship the companies:
- have a little knowledge about apprenticeship;
- know different sources of apprenticeships;
- only 37% have experience with apprenticeship;
- are aware of how to recruit an apprentice;
- technical and manufacturing areas are the most important areas for recruitment;
- almost 47% already participated in apprenticeship or plan recruiting and apprentice;
- the main reason selected by the companies for participation in apprenticeship is to find work-
force;
- selecting/finding the right person is the main challenges for foresee with apprenticeship;
- need support for the development of the training program;
- need to have link to schools;
- lack of suitable young people and a lack of vocational training relevant for the company profile
is the main reasons for not recruiting an apprentice;
- about 50% indicate the operations/process training as necessary training but do not found it
in a local source;
- no motivation or interest of the apprentice to work in the industry, was the main reason se-
lected for not hiring an apprentice;
- apprentice drop out was the main reason for not-completion an apprenticeship.
The need for better trained and more highly skilled employees at different levels, and at attracting the
younger generation towards a career in the industry is an urgency for the textile and clothing sector.
Is also important a deeper involvement in relation to apprenticeship and that education and training
should be a core issue.
There are important measures still to be adopted in order to achieve an ideal apprenticeship:
- ensure better match between qualification supply and job demand;
- establishment of media/information to make the textile and clothing sector better known and
more attractive to the general public and potential recruits;
- increased dissemination of Information and apprenticeships.