integrated sales application with … sales...integrated sales application with analytical reporting...
TRANSCRIPT

1
SCHOOL OF SCIENCE AND ENGINEERING
INTEGRATED SALES APPLICATION WITH
ANALYTICAL REPORTING
Capstone Design
May 3rd, 2017 - Final Report
H. El Alami
Dr. N. Assem
SCHOOL OF SCIENCE & ENGINEERING – AL AKHAWAYN UNIVERSITY

2
INTEGRATED SALES APPLICATION WITH ANALYTICAL REPORTING
Capstone Report
Student Statement:
By signing this Statement, I affirm that I have reviewed the entirety of the attached work to be
compliant with the rules of ethics required for the design process and in the selection of the
final proposed design, as well as held the safety of the public to be paramount and have
addressed this in the presented design wherever may be applicable.
Hicham El Alami
Approved by the Supervisor
Dr. N. Assem

3
Acknowledgments
First things first, I would like to start this report, that represents a culminating point in my
curriculum, by expressing my deepest gratitude to those who contributed in some way to the success of
this project.
I would like to start first by thanking my supervisor Dr. Nasser Assem for providing me with
this opportunity of working closely with a real-world client for my capstone project. I would also like
to thank him for being the understanding and collaborating professor he is, for providing the technical
support in times of need, and for his continuous efforts to make this project a success.
A special thought goes, here, to all my friends, and fellow Capstoners for providing the moral
support needed in such period of high stress. For finding the right words to calm me, for motivating me
when nothing would work, and mostly for keeping the fun spirit even in this period of hard work and
sleepless nights. On top of this list, I would like to personally express my sincere gratitude to students
Salma Hassani Alaoui and Nisrine Ferahi.
Someone said that “a good friend knows all your best stories, a best-friend has lived them with
you”. This capstone experience will remain forever as one of the best stories I could tell, and words fail
me to describe how proud I am for living it along with my fellow, best-friend and brother, student Saâd
Laârifi.
Finally, I would like to dedicate the work performed towards achieving this capstone project to
those who have always made enormous sacrifices for my well-being. For their incredible support this
year; my beloved Parents. Thank you for every effort you have made for my success.
Hicham El Alami

4
Contents
Acknowledgments ................................................................................................................................... 3
ABSTRACT ................................................................................................................................................ 6
1. INTRODUCTION ............................................................................................................................... 7
2. STEEPLE ANALYSIS: .......................................................................................................................... 8
2.1. Social Implication..................................................................................................................... 8
2.2. Technologies Used ................................................................................................................... 9
2.3. Economic Impact ..................................................................................................................... 9
2.4. Environmental Impact ............................................................................................................. 9
2.5. Political Aspect ........................................................................................................................ 9
2.6. Legal Framework ................................................................................................................... 10
2.7. Ethics and Moral Framework ................................................................................................ 10
3. SOFTWARE SPECIFICATION ........................................................................................................... 10
3.1. Data Collection and Analysis ................................................................................................. 10
3.2. Requirements Specifications ................................................................................................. 12
3.2.1. Functional Requirements .............................................................................................. 12
3.2.2. Establishment of a software requirements specifications sheet (SRS Sheet) ............... 15
4. FEASIBILITY STUDY ......................................................................................................................... 16
4.1. Product Definition ................................................................................................................. 16
4.2. Technical Feasibility ............................................................................................................... 16
5. Methodology: ................................................................................................................................ 16
5.1. Rapid Application Development (RAD) ................................................................................. 16
5.1.1. Process Definition: ......................................................................................................... 16
5.1.2. Process Characteristics: ................................................................................................. 17
5.1.3. RAD Process Model ....................................................................................................... 18
6. SOFTWARE ARCHITECTURE ........................................................................................................... 19
6.1. Back-office Application Architecture ..................................................................................... 19
6.1.1. Model View Controller (MVC) Paradigm ....................................................................... 19
6.2. BI Dashboard Architecture .................................................................................................... 20
7. DESIGN ........................................................................................................................................... 20
7.1. Back-office Application Design .............................................................................................. 20
7.1.1. Entity Relationship Diagram .......................................................................................... 21
7.1.2. Schema Description ....................................................................................................... 22
7.1.3. UML Use Case diagram .................................................................................................. 25
7.2. BI Dashboard Design ............................................................................................................. 26
7.2.1. Sales Star Schema .......................................................................................................... 26
7.2.2. Purchase Star Schema ................................................................................................... 26

5
7.2.3. Inventory Periodic Snapshot Star Schema .................................................................... 26
8. IMPLEMENTATION DETAILS OF THE SOLUTION ............................................................................ 27
8.1. Back-office Application Implementation ............................................................................... 27
8.1.1. Screenshots ................................................................................................................... 27
8.2. BI Dashboard Implementation .............................................................................................. 31
8.2.1. OLAP vs. OLTP ................................................................................................................ 31
8.2.2. ETL; Extract, Transform, Load ........................................................................................ 31
8.2.3. Data Warehousing ......................................................................................................... 32
8.2.4. Front-end setting ........................................................................................................... 34
9. TECHNOLOGICAL ENABLERS .......................................................................................................... 35
9.1. MySQL v 5.7 ........................................................................................................................... 35
9.2. MySQL Workbench 6.3 CE ..................................................................................................... 35
9.3. CakePHP v 3.4. ....................................................................................................................... 35
9.4. Bootstrap 3 ............................................................................................................................ 36
9.5. XAMPP ................................................................................................................................... 36
9.6. Pentaho Community Edition + Kettle .................................................................................... 36
10. CONCLUSIONS & FUTURE WORK .............................................................................................. 36
6
ABSTRACT
This report summarizes the work performed towards achieving the goal of this joint
capstone project; namely the implementation of an Integrated solution for sales management
with an analytical reporting dashboard. It defines key terms and describes procedures used
throughout the software engineering and business intelligence development processes of the
project. This project is mainly divided into two significant parts; the first one centered around
the design and implementation of a web application and its corresponding database that serves
as a back-office application for our client to manage, store and populate the database, the second
part and the most important one is the realization and deployment of analytical dashboard that
provides the client, and IT company, with better decision support and strategic/operational
information. Through this report, more light will be brought on the methodology adopted as
such the rapid software development process. It will move on to determine the key performance
indicators (KPIs) on which the business intelligence algorithms are based. To then, give details
about the implementation process and the technologies that were involved in it. A discussion
of the STEEPLE implications of the project takes also a significant part of this report.

7
1. INTRODUCTION
This project comes in fulfillment of the capstone requirement towards obtaining a Bachelor
of Science in Computer Science at Al Akhawayn University. It serves as a bridge that connects
the student coming from a theoretical academia background to the more practical real world. In
other words, this project could be considered as the culminating point of students’ learning in
which they are required, for a successful completion, to retrieve most of the information
gathered during their curricula to produce a comprehensive project that encapsulates this
knowledge acquired.
This project under the title “AN INTEGRATED SALES APPLICATION WITH
ANALYTICAL REPORTING” serves well its purpose, as it is a real bridge that connects us to
the professional world by working closely with a real client. The idea behind this project is the
design, implementation, and deployment of a web application that serves as an online
management hub for sales and purchasing operations performed by the client, ENHANCED
TECHNOLOGIES, in a first phase, and as an analytical reporting tool on which the
management of Enhanced will rely on for decision making in a later one.
Enhanced Tech. is an IT, software engineering oriented, company located at the techno park
of Al Akhawayn University in Ifrane, that aims at digitizing the Moroccan administration by
developing and producing software and related hardware solutions that will help move the work
of localities and regions from the classical registry based approach to an electronic digitized
one.
Although this project can be considered as a classical, almost ERP like, application, a lot of
efforts were put on the integration of recent development methods and approaches. One of
which is the rapid application development approach to software engineering projects; this
approach is not frequently used in the Moroccan context. This problematic will be addressed

8
later in this perusal, in a dedicated section. The main component that was developed throughout
this project, which is the analytical dashboard, is also a new concept to the frame of a Moroccan
company. Nowadays, thousands of gigabytes of raw data are stored and archived by the
information system departments of many companies without putting it to good use. This project
covers this problematic, as well, by proposing and implementing an analytical dashboard that
attains the goal of transforming raw transactional data into decision support information. The
same rapid application development approach was used in the implementation of the dashboard.
This report comes to provide a detailed explanation and description of the work performed
towards attaining the goal of this project. It also provides most assumptions made during the
design phase, the architecture of the system, and it discusses in depth each component. This
report will start off by analyzing the impact of such system on all the STEEPLE perspectives,
it will move on to clarify the specification of the software by presenting all its requirements, as
gathered from the client, both the function and non-functional ones. The following part will
discuss the technical feasibility of the project; hence, introducing the architecture of the system
implemented. Details about the design and the implementation will be given further in the
report. Technologies on which relies the proper functioning of the system will also be detailed.
To finally end on several conclusions made, challenges faced; opening the discussion on future
perspectives and work that can be performed later to evolve the project.
2. STEEPLE ANALYSIS:
2.1. Social Implication
This project provides our client with an easier way to perform their day to day
operational activities, making the life of both managers and employees easier. This
allows top management to spare paper work and book keeping time for more productive
practices, such as research and development (R&D), prospecting potential clients, and
ultimately lowering significantly operational costs, leading to a considerable decrease
9
of their solutions. Additionally, this project aligns perfectly with the company’s mission
of digitizing services and making the Moroccan market a more connected one.
2.2. Technologies Used
A more detailed architecture of the technological impact and technologies used will
follow in a later section of the present report where they will be more visibility about
the architecture of the product.
2.3. Economic Impact
This solution is based on open source tools and environments, making it the least costly
possible for the client. Also, by providing the client with such solution that handles most
of their operational activities, the performance of the company is forecasted to increase
significantly after the deployment of the product mainly because of the ease of access
to key information and the role this application plays into providing the customer with
better decision support.
2.4. Environmental Impact
This solution is also forecasted to lower the companies’ print of paper consumption, as
most of the operations that were previously paper based and relying on heavy registers
will be conducted electronically. This is a huge improvement that several companies in
Morocco are striving to achieve, especially after the COP’22 that Morocco hosted
during November 2016.
2.5. Political Aspect
The product that will result from this project does not serve in any way a political
end, nor it does collude with any political party’s interest. However, it aligns in some
way with the directives given by his Majesty King Mohamed VI during one of his

10
latest speeches in which he encourages administrations and Moroccan companies to
bring more technologies into their daily operations and digitize their information as
much as possible.
2.6. Legal Framework
Non-Applicable as this solution does not infract any national or international rules
applicable in the field of software development or usage.
2.7. Ethics and Moral Framework
As stated in the student statement cited above ethics and morality were respected and
will be enforced during all the stages of this project, from the very basic design to
the complex end-product. It will serve the best interest of the community and the
company and shall make no harm to any third party directly or indirectly involved or
affected by the product.
3. SOFTWARE SPECIFICATION
3.1. Data Collection and Analysis
The first step of the software specification phase is the utmost gathering of data
relevant to determining the main tasks that the system, when up and running, should
perform. This task, known as requirement elicitation, is completed with the
involvement of the customer and provides answers to the following questions:
- For the back-office platform:
1. What business problem does this system solve?
2. What is the current situation? (Current system/tool being used)
3. What information should the system provide to users?

11
4. What features must ultimately be included in the system?
5. What process/es does this system implement?
6. Where does the process start?
7. Where does the process end?
8. Who will be using the system? If many users, are there any clearance levels?
9. Who will benefit the most from the system?
10. How can you quantify the success of this project?
- The previous questions apply also to the BI part, however, more specific elicitation
questions are to be asked, to firstly determine the type and nature of dashboards
most relevant to the usage; these are the following:
1. What information about the business is hard to get?
2. What gaps in the business performance measurement exist?
3. Who needs this information?
4. Where does (will) the data reside?
5. How frequent this data is added/updated?
6. How frequent this information is needed (access frequency)?
Other clarification ‘Why?’ questions are also part of the elicitation task.
Once finished and upon the answers of the client, the function features/functions of the
system are determined accordingly by reformulating the answers into simple, clear,
unambiguous, concise and most importantly action driven statements that will be
provided in the following section.

12
3.2. Requirements Specifications
3.2.1. Functional Requirements
Functional requirements represent the formulation in natural language of services
that the system must/should provide to its end users. It also depicts how the system is
supposed to handle, and behave to, specific inputs. Additionally, it includes the
operational constraints the system reacts to. In the frame of this project, the functional
requirements are divided into two interconnected parts. This separation comes from
the fact that business intelligence project requirements differ in many ways from the
classical software requirements. These differences are perceived in the fact that BI
projects are data-centric; everything revolves around data. Moreover, the requirements
are progress driven; the more the project advances the clearer the requirements are.
- FRs of Back-office platform
This part of the product is composed of four five main components, each of
which have a set of specific tasks to handle:
• Users Management Component
o Performs Create Read Update Delete (CRUD) operations on users.
o Separates between users’ access levels (admin, manager, employee).
o Authenticates users.
o Authorizes users accordingly to their clearance level.
• Sales Component
o Performs CRUD operations on clients
o Performs CRUD operations on quotes

13
o Performs CRUD operations on orders
o Performs CRUD operations on delivery forms
o Performs CRUD operations on invoices
o Differentiates between the different types of clients (private, public,
acquired, prospective).
o Keeps track of selling history.
o Allows a sale without quote.
o Generates orders from quote requests.
o Generates invoices/delivery forms from orders.
• Purchases Component
o Performs CRUD on suppliers.
o Performs CRUD on offers.
o Performs CRUD on purchase orders.
o Performs CRUD on purchase bills.
o Keeps track of purchasing history.
o Keeps digitized copies of offers ‘quotes’.
o Allows generation of purchasing orders.
o Keeps digitized copies of purchase bills.
o Tracks payment methods and information.
o Updates automatically the inventory after each acquisition.

14
• Inventory Component
o Performs CRUD operations on articles.
o Classifies articles by category.
o Distinguishes between products (commercialized articles) & office
articles (used in-house).
o Provides instantaneously the real state of the inventory.
• Administrative Component
o Performs CRUD operations on employees.
o Performs CRUD operations on banking.
o Edits company’s header information for invoicing.
- Requirements of a BI Dashboard:
The creation of a BI solution requires the specification of the following different
types of requirements:
• Business Requirements: Those are requirements that are associated with
the business logic. In more formal words, to determine the business
requirements, the metrics or key performance measure (KPIs) are to be
highlighted. In this project, the KPIs are as follow:
o Sales Growth; How sales are increasing or decreasing over a set
period.
o Sales Opportunities; Determines the prospects of growth from a list
of potential clients and their set value.

15
o Products Performance; Lists products accordingly to their revenue
performance for the company.
o Customer Acquisition; How many customers were acquired on a set
period.
o Customer Lifetime; For how long does the customer uses the services
of the company.
• Data Requirements: Here the focus is mainly around identifying the
systems of records – data source – (SOR) that are needed to implement the
BI solution. For this project, as the client is moving from a paper based
system to an electronic database system. The data sources will be created and
modeled from scratch. This will ensure data quality.
3.2.2. Establishment of a software requirements specifications sheet (SRS Sheet)
All the requirements listed above are present in the software requirements
specifications sheet, for both part, in the eponymous Appendix A of this report. The
software requirements specifications sheet provides an overall description of the project
including functions, classes, operating environment, assumptions and constraints. It
moves on to present with a description of the external interface requirements, the system
features and finally introduces all other requirements such as the Nonfunction ones
applicable to this project.

16
4. FEASIBILITY STUDY
4.1. Product Definition
The end-product developed in this project is a web application that handles and keeps
track of sales, purchases and inventory of the client. It includes also a BI dashboard that
provides the client with information that supports the decision-making and fills the
informational gap the client has.
4.2. Technical Feasibility
The most important feasibility perspective to be analyzed for the sake of this project is
the technological/technical one. The other perspectives, as such economic & social ones are
concerned, can be ignored for this study, though, they were previously discussed in the
STEEPLE implications part of the project. This project contains two main components, a
server-end and a user-end. For an efficient and effective development within the time
window allocated for the project, an agile methodology is to be used for a quick and goal
seeking design, implementation, and deployment. Focus here is on delivering a working
project, not on delivering an extensive set of deliverables to the client.
5. Methodology:
5.1. Rapid Application Development (RAD)
5.1.1. Process Definition:
Rapid Application Development is a development method that focuses on the
production of working models and components of the final product rather than exhaustive
planning. It is an innovative approach to software engineering that embraces change and
prioritize client regular contact over comprehensive contracts. The process in itself is not a

17
rigid one as compared to the traditional circuit of software development. It provides the
developer with great flexibility and the opportunity of including more frequently client’s
feedback for the release of a successful product. It relies mainly on extensive prototyping
of the product throughout the development stages.
5.1.2. Process Characteristics:
For RAD processes, the phases of specification, design and implementation are
concurrent. In other words, all stages happen at concurrent time periods and the project is
completed over many iterations. Detailed documentation is not at the core of the process;
the objective is rather to minimize it for a faster delivery. The product is developed in a
series of releases (increments) that the client evaluates each at a time and provide
feedback about that will be incorporated into later increments. The user interface, in the
RAD, is seemingly developed in parallel using interactive development systems. The
RAD processes take full advantages of agile methods and principles. The agile manifesto
determines its principles into five key ones:
- Customer Involvement
- Incremental Delivery
- People not process
- Embrace Change
- Maintain Simplicity

18
5.1.3. RAD Process Model
Figure 1 - Rapid Application Development Process Model

19
6. SOFTWARE ARCHITECTURE
6.1. Back-office Application Architecture
6.1.1. Model View Controller (MVC) Paradigm
Figure 2 - MVC Layers
MVC stands for Model View Controller, it refers to an architectural pattern that enables
the development of applications in a specific structure. This structure helps defining the
main responsibilities and interactions of each component in the application.
In the MVC architecture, a model is responsible for wrapping up data and business
logics besides serving as a communicator for the database (connectivity and saving
data). The view is responsible for outputting the results to the client. While the controller
has as main task to request and manipulate data from the models and feed them to the
view.
The MVC paradigm reduces the complexity of large applications and enable a more
flexible modular development style.

20
6.2. BI Dashboard Architecture
Figure 3 - BI System Architecture
Most of DW/BI projects adopt a three-tier architecture. This latter can be perceived as
follow:
1- External Data Layer: Refers to the OLTP (Operational Database) from which the
transactional data will be retrieved.
2- Bottom Tier: The Data Warehouse server that hosts the Data warehouse and most of
its Data Marts. It is the first contact point of transactional data after passing the
Extract, Transform, Load.
3- Middle Tier: The OLAP Server, it is where the OLAP Cube is stored and the
component that facilitates the most the analysis of Data.
4- Top Tier: It is the part concerned with the front-end dashboard that provides access to
ready information handy.
7. DESIGN
7.1. Back-office Application Design
21
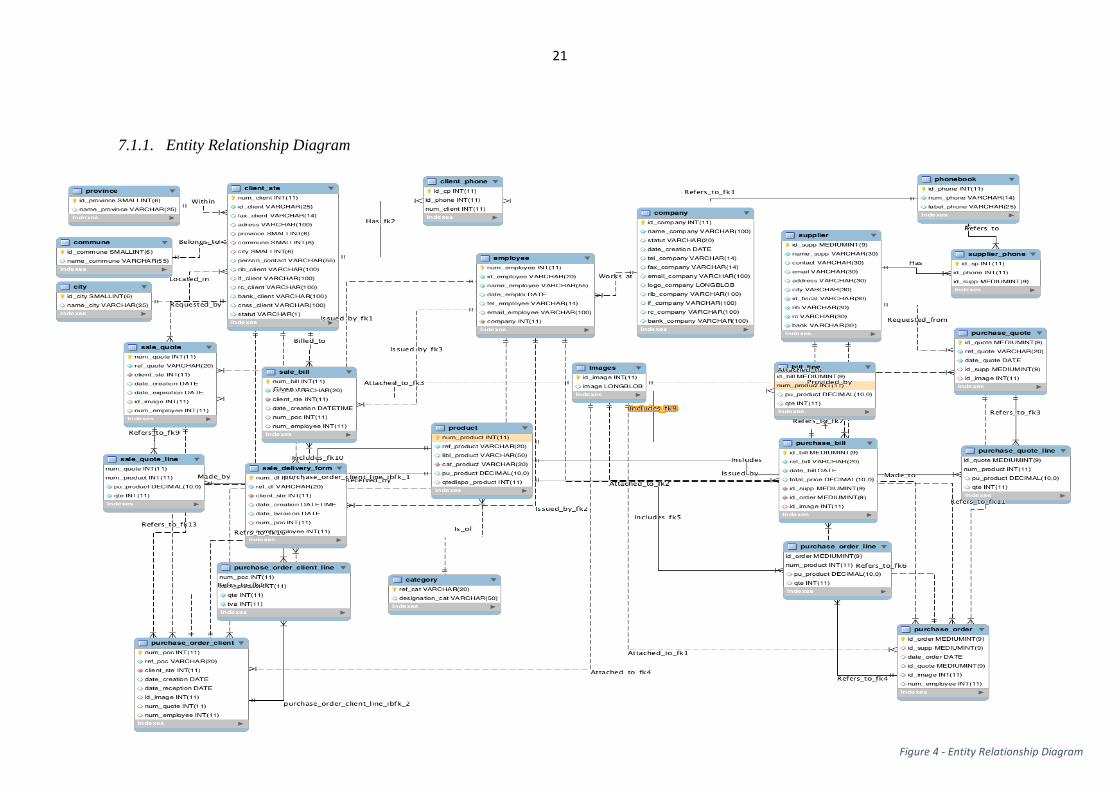
Figure 4 - Entity Relationship Diagram
7.1.1. Entity Relationship Diagram
22
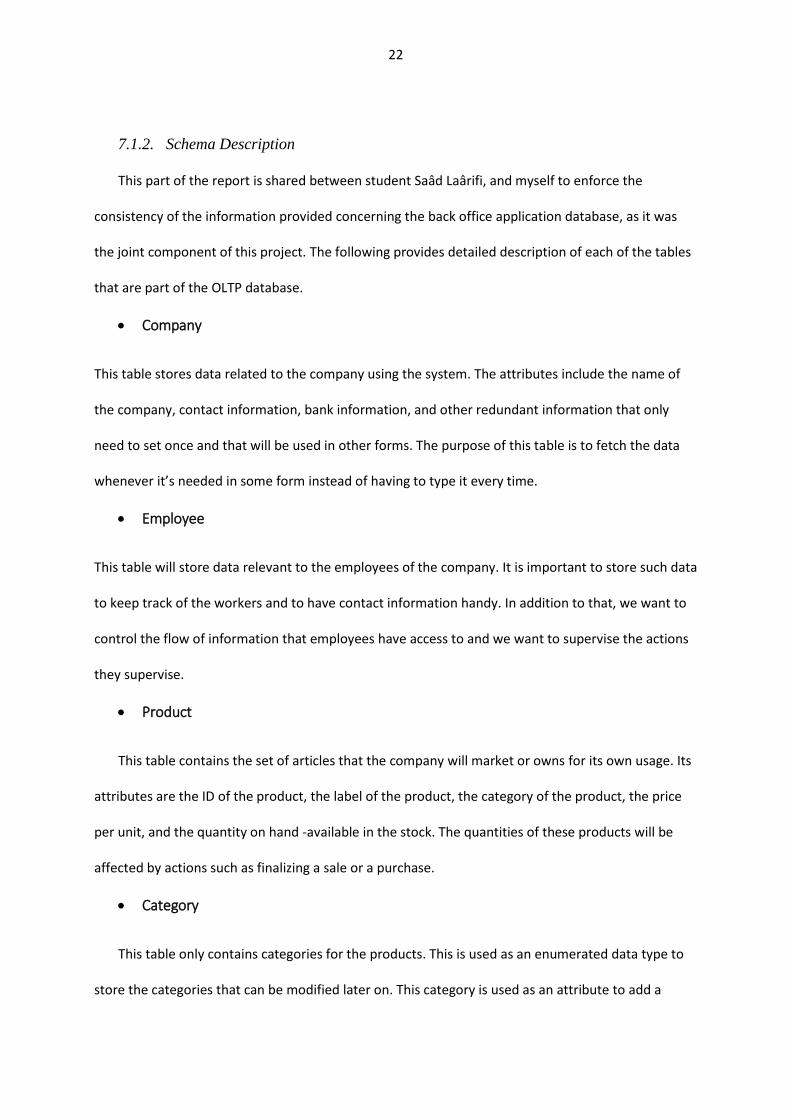
7.1.2. Schema Description
This part of the report is shared between student Saâd Laârifi, and myself to enforce the
consistency of the information provided concerning the back office application database, as it was
the joint component of this project. The following provides detailed description of each of the tables
that are part of the OLTP database.
• Company
This table stores data related to the company using the system. The attributes include the name of
the company, contact information, bank information, and other redundant information that only
need to set once and that will be used in other forms. The purpose of this table is to fetch the data
whenever it’s needed in some form instead of having to type it every time.
• Employee
This table will store data relevant to the employees of the company. It is important to store such data
to keep track of the workers and to have contact information handy. In addition to that, we want to
control the flow of information that employees have access to and we want to supervise the actions
they supervise.
• Product
This table contains the set of articles that the company will market or owns for its own usage. Its
attributes are the ID of the product, the label of the product, the category of the product, the price
per unit, and the quantity on hand -available in the stock. The quantities of these products will be
affected by actions such as finalizing a sale or a purchase.
• Category
This table only contains categories for the products. This is used as an enumerated data type to
store the categories that can be modified later on. This category is used as an attribute to add a

23
product.
• Client_ste
This table contains the information and attributes related to the clients of the company. Among
this information are contact information and bank information that will be fetched when generating
a form directed to a specific client.
• Province & Commune & City
All these tables are there to store static information to enforce consistency of data. These can be
considered as attributes to the client table but they are implemented as different tables to enforce
certain inputs because the geographic location of a location is an essential information in the
business that the client is engaged in.
• Client_phone
This table will include a series of phone numbers with the ID of the corresponding client that it
belongs to. This was not stored as an attribute to the client_ste table to allow clients to have multiple
phone numbers where they can be contacted.
• Sale_quote
This table represents the quote that the company generates for the client. It includes a reference
to the client that it is generated for, the date of creation and expiration, the id of the employee who
created it, and so on. This table in itself does not contain the articles and their quantity, but its line
table refers to it for each different article.
• Sale_quote_line
This table represents the lines for a specific quote. This is necessary because a quote may contain
multiple articles, therefore this bridge table is needed. Its attributes consist of the number or the id
of the quote that it refers to, the id of the product, the quantity, and the price at which it will be sold.

24
• Purchase_order_client
This table represents the purchase order that the client makes to the company after agreeing on
a certain quote. It contains the same attributes as the sale quote and refers to a certain quote.
• Purchase_order_client_line
These lines refer to lines in the Sale_quote_line table, which are then represented in the
Purchase_order_client table.
• Sale_delivery_form
After the purchasing order is made by the client, A sale delivery form is generated from that
latter and is stored in this table. Once the delivery is made, the corresponding items that were
declared in the form are modified in the articles table to automate the calculation of the quantity on
hand of the articles.
• Sale_bill
The corresponding bill that matches the items in delivery form. The bill is invoiced to a specific
client and refers to the purchase order made by that same client. When the bill status is declared to
have been paid, the transaction is complete and the Bill is not pending payment anymore.

25
7.1.3. UML Use Case diagram
Figure 5 - Use Case Diagram

26
7.2. BI Dashboard Design
7.2.1. Sales Star Schema
7.2.2. Purchase Star Schema
7.2.3. Inventory Periodic Snapshot Star Schema
Sale Line Fact
Time Dimension Article Dimension
Customer Dimension
Purchase Line Fact
Time Dimension Article Dimension
Supplier Dimension
Inventory Fact
Time Dimension Article Dimension

27
8. IMPLEMENTATION DETAILS OF THE SOLUTION
8.1. Back-office Application Implementation
8.1.1. Screenshots

28
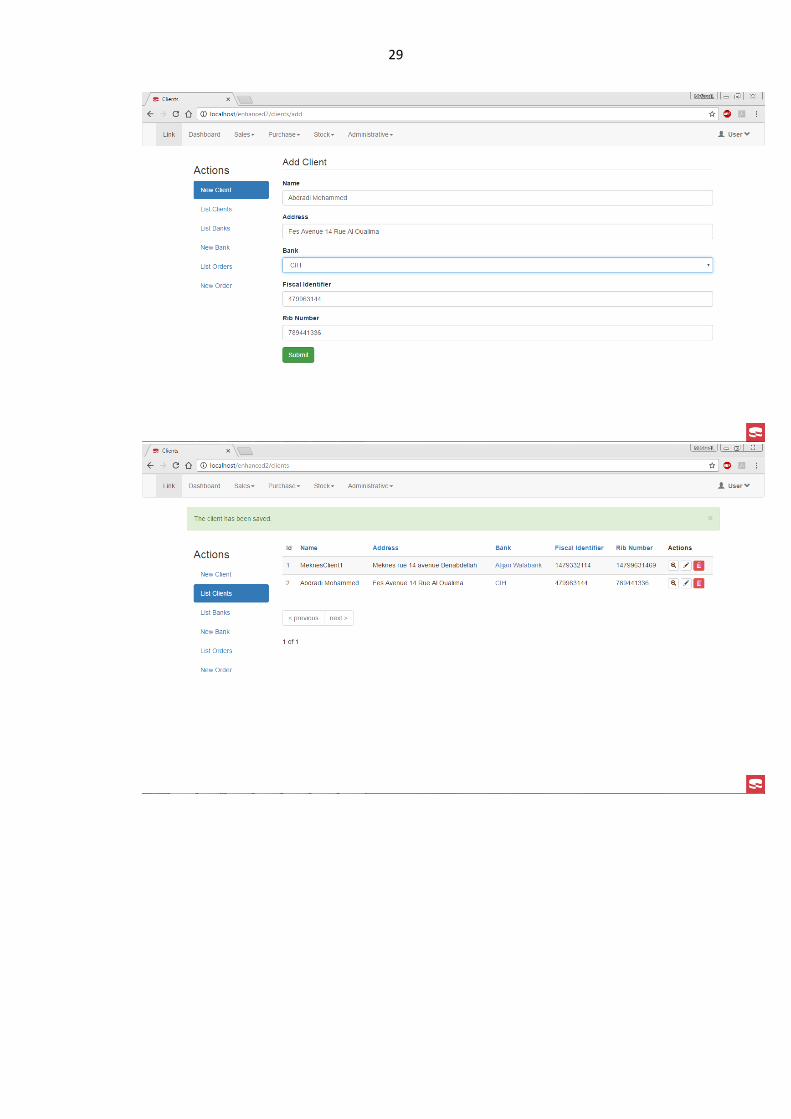
29

30

31
8.2. BI Dashboard Implementation
8.2.1. OLAP vs. OLTP
OLTP refers to Online Transactional Processing, it is most concerned with
operational databases that are used for running the business on a day to day basis. While,
OLAP refers to Online Analytical Processing and is utmost concerned with the
processing of historical information extracted from OLTP and loaded into a Data
Warehouse.
OLAP DW OLTP DB
- Enables historical processing of
information.
- Used by Executives and
Managers.
- Helps analyzing the business.
- Provides consolidated and
summarized data.
- Enables day-to-day processing.
- Used by all.
- Helps running the business.
- Provides highly detailed data.
Figure 6 - Comparison Table Between OLAP vs. OLTP
8.2.2. ETL; Extract, Transform, Load
If building the Data Warehouse is what takes the most out of a BI project’s time.
Then the second most timely expensive phase of such projects is the ETL jobs creation
and configuration. ETL stands for the three major operations that are to be performed

32
over OLTP’s source data for it to become more adaptable to the DW system. In the
frame of this project the implementation of such operations was not that timely
expensive for two main reasons:
1- Only one data source: The first advantage being that at this stage of the
project, the OLAP server relies only on one OLTP source. This is a huge
advantage towards speeding up the development process. As the overhead
responsible, normally, of conforming between the different data sources types
is not present in this case.
2- OLTP -not deployed- building parallelly: The second and most significant
advantage is that the operational database responsible for day-to-day business
process of the client was also a component of this project. Hence, the modeling
of this operational database was revised in order to fit within the data marts of
the Data Warehouse, and consequently decreasing yet another overhead of data
profiling and cleansing.
8.2.3. Data Warehousing
Data Warehouse is a relational database that focuses, from its design, on querying and
analysis rather than transaction process. It contains historical data extracted from
transactional data. It is at the core of Business Intelligence systems. Data Warehouses
are centralized repositories of integrated data from one or more disparate sources.
- Example of Sales Data Warehouse:

33
- MySQL Code:
create table dim_time(
date_id bigint not null auto_increment primary key,
date datetime,
day_of_week varchar(30),
month enum('JAN', 'FEB', 'MAR', 'APR', 'MAY', 'JUN', 'JUL',
'AUG', 'SEP', 'OCT', 'NOV', 'DEC'),
quarter enum('Q1', 'Q2', 'Q3', 'Q4'),
calendar year);
create table dim_client(
client_id bigint not null auto_increment primary key,
client_name varchar(255),
client_address varchar(255),
client_city varchar(255),
client_zip int(6),
person_contact VARCHAR(55),
bank_client varchar(100),
statut VARCHAR(1)
);
create table dim_article(
article_id bigint not null auto_increment primary key,
article_ref VARCHAR(20) NOT NULL,
article_label VARCHAR(50),
article_category VARCHAR(20) NOT NULL,
article_price DEC,
available_qty INT
);
create table sale_line_fact (
order_date_key bigint not null,
customer_key bigint not null,
article_key bigint not null,
sale_number varchar(55),
sale_line_qty int,
sale_line_subtotal float,
foreign key (order_date_key) references dim_time(date_id),
foreign key (customer_key) references dim_client(client_id),
foreign key (article_key) references dim_article(article_id)
);

34
- DW Bus architecture:
o The data warehouse bus architecture is a set of numerous data marts tightly
integrated over a set of conformed dimensions and fact tables. The idea
behind a BUS architecture is to create only one copy of a conformed
dimension and provide access to it through views for all the fact related to
it. This measure provides development with impeccable flexibility and ease
of maintenance as well as reduced redundancy.
- Data Warehouse BUS Matrix
Product Customer Time Supplier
Sales Fact X X X -
Purchase Fact X - X X
Inventory Fact X X -
Figure 7 - BUS Matrix
8.2.4. Front-end setting
Once the OLAP Cube created and plugged to the icCube BI Engine, a large and wide
variety of manipulations become possible on the information. That is why, in the frame of this
project, the choice was made to allow the end users decide on which charts, gauges, graphs or
reports they would want to see directly on their customized dashboard. This same dashboard
is later integrated to the Back-Office Application by keeping the analytical resources on the
icCube Analytics oriented server, and moving all of the assets to the web server holding most
of the back office application; and standardizing the authentication methods for them to apply
to both applications.

35
9. TECHNOLOGICAL ENABLERS
9.1. MySQL v 5.7
Open source Relational Database Management System (RDBMS) used to handle the
schemes of this project as well as the data warehouse part.
9.2. MySQL Workbench 6.3 CE
Integrated tools environment used for the design and modeling of the database; for
SQL development and querying, and Database administration.
9.3. CakePHP v 3.4.
Is a recent PHP framework, compatible with the latest seventh version of PHP, it
allows its developers to build web applications in a simpler, faster and code greedy
manner. The main features of CakePHP are:
o Quick build.
Figure 8 - Screenshot of the customizable dashboard

36
o Convention over Configuration.
o User friendly.
o Many necessary built-in functionalities.
o MVC centric.
o Secure.
9.4. Bootstrap 3
Is the most popular framework for front-end development using HTML, CSS, and JS.
It was used here to design the layout of the project. It offers responsive cross-platform
pages.
9.5. XAMPP
Apache distribution for running PHP pages on a localhost server, used for testing the
deployment of the back-office application.
9.6. Pentaho Community Edition + Kettle
Pentaho is a powerful BI suite that contains a large selection of tools for the development
of the BI dashboard. Kettle is the data integration tool for ETL operations.
10. CONCLUSIONS & FUTURE WORK
Near the end of this report, it is worth mentioning many challenges faced throughout
the realization of the project. The first important challenge that any software engineering
project faces is the time constraint. In fact, building such system as basic as it seems requires
a lot of data gathering, planning and implementation force. The time window possible in
the semester is around three months, which is an extremely tight timing. The second
problematic, that was also faced, is the lack of a large dataset for the analytical part of the

37
integrated solution. Indeed, the project combining both the design, implementation and
deployment of a back-office application managing the database and the establishment of an
analytical dashboard that relies on such database complicates the task even further. The
client not having any kind of reporting tool previously used that can be used as a point of
reference makes the requirement gathering and specification of the system a little bit of a
harder task.
However, this did not, in anyway, hinder the wiliness to produce three important
outcomes from this project. The first one, being the implementation and the delivery to the
client a working application that serves the role of managerial hub for the most important
operational activities conducted by the Enhanced Technologies, which leads to freeing time
costly hours of labor. The second aim attained by the realization of this project, is applying
a not-so-popular software engineering approach in Morocco, which is the rapid application
development process model for application development. The Moroccan SE market lacks
largely from the use of such methods, and many other techniques that fall under the
principles of Agile methodology. As a matter of fact, few companies currently use such
approach when it comes to developing software solutions in the Moroccan context, and
rather prefer to go for a more classical ‘waterfall’ approach that gives no flexibility against
the rapidly changing variables of the environment. RAD is put under practice in this project
and succeeded -time wisely-, mainly thanks to its tolerance towards computer aided
software engineering (CASE). The third outcome reached through this project is
demonstrating the real value of stored data when processed and analyzed to provide key
business information, hence, contributing in a better, and more informed, managerial
decision making. This is also new to the Moroccan market in the sense that such support
systems are only used by a minority of huge companies.
Due to the restricted amount of time given for the project, the implementation and ideas

38
developed were only limited to basic functionalities of the system. However, the project, in
itself, is very promising, especially in the context of an IT company. There are several other
functionalities and key performance measures that could be implemented and monitored
for. The human resource factor, a key one for SE companies, as an example, is not handled
by the present system but can, if integrated properly, present the project with more
ambitious analytical opportunities. More work is also to be performed on the layout of the
back-office application to make it even more user friendly. A notification hub can also be
considered in the future evolution plans of the application.
All in all, this capstone project helped advance in the new trending field of Business
Intelligence and insight; a field that I am particularly interested in. It also made me discover
innovative technologies. I was introduced to CakePHP a recent powerful frame. I also
learned the importance of moving from a configuration based system to a convention based
one. I was presented with the opportunity to develop in the frame of the MVC paradigm. I
discovered through this opportunity the basic principles of data warehousing design; a
model that is the dream of most business analysts. But most importantly, I have learned
through this project to push my limits and think of solutions outside of the box. I was also
though from this experience to keep looking for answers when things seem feasible but do
not work. To challenge my knowledge and acquire more. It has also helped me develop my
passion for information systems and shaped my thought to pursue a Master’s degree in the
eponymous management field.