instrumentation ecat: a new computerized tomographic...
TRANSCRIPT

B A S I C S C I E N C E S
INSTRUMENTATION
ECAT: A New Computerized Tomographic
Imaging System for Positron-Emitting
Radiopharmaceuticals
Michael E. Phelps, Edward J. Hoffman, Sung-Cheng Huang, and David E. Kuhl
University of California at Los Angeles, Los Angeles, California
The ECAT was designed and developed as a positron imaging system capable of providing high contrast, high resolution, quantitative images in two-dimensional (2-D) and tomographic formats. The flexibility in its various image mode options makes it useful for a wide variety of imaging problems. High (HR), medium (MR), and low (LR) tomographic resolutions are 0.95 zfc 0.1,1.3 ± 0.19 and 1.7 ± 0.1 cm FWHM; high, medium, and low resolutions in 2-D images are 0.85 ± 0.1, 1.3 ± 0.1 and 1.7 ± 0.1, depending on resolution m o d e employed. ECT system efficiency is 30,100, 15,900, and 9,200 c/sec/^Ci/cc with a 20-cm diameter phantom at LR, MR, and HR. Because of the geometric, detector, electronic and shielding design of the system, count-rate capability and linearity are high, with minimum detection of scattered radiation and random coincidence. Measured error agrees well with theoretical statistical predictions down to a level of lA°fo standard deviation. The redundant sampling scheme of this system significantly reduces errors caused by motion and detector instability. Scan times are variable from 10 sec to several min/slice and multiple levels are automatically performed by computer control of patient bed. A variety of human studies illustrate image quality, resolution, and efficiency of both ECT and 2-D imaging mode. Examples of the noninvasive study method have been made possible through development of ECT.
J Nucl Med 1 9 : 6 3 5 - 6 4 7 , 1 9 7 8
A number of different emission computerized tomographs ( E C T ) have been or are currently being developed. These instruments can be generally classed as single photon counting (SPC) systems, which employ the principles of either scanners, or scintillation cameras to the technique of reconstruction tomography. This approach is exemplified by the multiple detector array designs of Kuhl et al. (1,2), Bowley et al. (3), J & P Engineering*, and Union Carbidet and by the scintillation camera approach of Keyes et al. (4), Budinger et al. (5,6) and Jasczak et al. ( 7 ) . The second approach uses annihilation coincidence detection (ACD) for the imaging of positron-
emitting radiopharmaceuticals. Examples of the ACD approach are the single-slice, multiple-detector hexagonal designs of Phelps, Hoffman, Ter-Pogos-sian et al. (8-11), the multislice, multidetector hexagonal design of Ter-Pogossian et al. (12), the multiple-crystal dual-headed camera approach of Brownell et al. (13,14), the dual-headed scintillation camera approach of Muehllehner et al. (15,16), the
Received Nov. 11, 1977; revision accepted Feb. 15, 1978. For reprints contact: Michael E. Phelps, Div. of Nuclear
Medicine, Dept. of Radiological Sciences, School of Medicine, Center for the Health Sciences, University of California, Los Angeles, CA 90024.
Volume 19, Number 6 635
by on June 2, 2018. For personal use only. jnm.snmjournals.org Downloaded from
PHELPS, HOFFMAN, HUANG, AND KUHL
dual-headed, multiwire proportional chamber approach of Lim et al. (17) and Hattner et al. (18), and the circular ring systems of Robertson et al. (19), Yamamoto et al. (20), Cho et al. (27,22) and Derenzo et al. (23,24).
A new positron tomograph (ECAT$, developed by two of the authors—MP and EH) was specifically designed to produce transaxial tomographic images of the distribution of positron-emitting radionuclides, and in addition to produce quantitative 2-dimensional images (Fig. 1). While this system embodies many of the basic principles and design concepts of PETT III (8-10,25) it has been redesigned in terms of producing optimal physical design and inherent imaging characteristics for flexibility in its various modes.
This paper presents a) a description of the system design; b) phantom studies to illustrate the resolution, efficiency, linearity, accuracy, field uniformity and design that minimizes the acceptance of random coincidence and scattered radiation; and c) representative studies in both the transaxial-tomographic and 2-dimensional imaging modes.
Design criteria. The design objective was to develop a positron imaging system capable of providing (a) transaxial-tomographic images and conventional 2-D images; (b) a truly quantitative instrument for measuring physiologic processes (26-28); and (c) a quantitative imaging capability that will also provide maximum image contrast. The following criteria were used as guidelines:
1. Flexible sampling capability in both the linear and angular direction consistent with: (a) reconstructed image resolution (i.e., sampling distance ^ Vz image resolution); (b) inherent detector resolution (i.e., sampling distance ^ Vi inherent detector resolution; (c) required image accuracy (i.e., no sampling artifacts)
2. Accurate method for photon attenuation correction
3. Uniform detector resolution and sensitivity with depth
4. Minimum detection of scattered radiation and random coincidence events
5. High sensitivity to meet the demanding statistical requirements of CT and to minimize scan times
6. Linear response of detectors over count rates encountered
7. High count rate capability 8. Accurate mechanical positioning resolution
(i.e., no artifacts due to mechanical detector positioning)
9. Both 2-D and 3-D imaging capability 10. User oriented system operation. The importance of each of these factors has been
discussed previously (4,8,9,27-30). In addition to 2-D images, rapid rectilinear scans obtained with this system are used to select levels to be studied in more detail by the ECT mode.
Another design choice was that of single slice as opposed to multiple slice capability, a decision made not only in an effort to maintain a realistic system cost, but also in consideration of certain fundamental factors that relate to single slice and multiple slice. They are:
1. Production of quantitative, high contrast, transaxial-tomographic images of finest quality strongly dictates that the maximum detection efficiency be placed in a plane circumferential to the patient for optimal efficiency.
2. Maximum signal-to-noise ratios and quantitative accuracy can be obtained by reducing the random coincidence rate and true coincidence due to scattered radiation if slit shields of sufficient thickness and length and minimum open area restrict the radiation accepted by each detector to the examined plane (8,31). The importance of the slit shields can be appreciated from the analytical work of Derenzo et al. (23), which showed that the random coincidence rate and coincidence scatter detection rate increased in proportion to the height of the slit opening to the fourth and third power, respectively. Lead shielding around the detectors further reduces singles count rate and detector-to-detector scatter coincidence.
3. Since the data used to reconstruct a single transaxial plane are interdependent, maximum efficiency in the circumferential configuration will enable rapid data collection before patient motion, organ motion, or activity movement occurs to cause inconsistencies (i.e., distortions) among these interdependent data. For example, if a serial single slice and a five-slice system both have the same total detection efficiency (i.e., the five-slice system has Vs the efficiency per slice of the single slice system), the two systems could collect data for five slices in the same total time. The single-slice system would require one-fifth of the time collecting the interdependent data for each transaxial image, however, and would be fundamentally preferred since any movement that occurred during the data collection of one plane would not affect the other planes. With the five-slice system any motion that occurred would effect all five slices.
System design. This system consists of a hexagonal array of 66 3.8 X 7-5 cm Nal(Tl) detectors in which all detectors on opposing banks are coupled electronically in a multiple coincidence format. The 11 detectors on each opposing bank produce 121 lines of coincidence response for each detector bank
636 THE JOURNAL OF NUCLEAR MEDICINE
by on June 2, 2018. For personal use only. jnm.snmjournals.org Downloaded from

BASIC SCIENCES INSTRUMENTATION
FIG. 1. ECAT in nuclear medicine clinic.
pair or a total of 363 lines for the total system. The coincidence time resolution for the system is 20 nanoseconds. The distance between opposing banks of the detectors is 100 cm and the field of view is a circle with a 50 cm diameter.
The placement of the 66 detectors with respect to one another, the inner bank separation distance, and detector size are interrelated factors that must be correctly matched for optimum image reconstruction. The detailed relationships between these factors have been discussed in detail elsewhere for the PETT III (9,10,25,30). Although the individual parameters in this system differ from the PETT III, the general relationships and requirements apply.
The lead shielding, critical for optimal and quantitative performance, is designed to protect the detectors from radiation originating outside the fields of view. This reduces the loss of resolution and contrast and permits high count rate capability, since accidental or random coincidences and those true coincidences due to scattered radiation are rate-limiting in positron systems. Most of the lead shielding is provided by two stationary lead discs (1.5 in. thick) placed on either side of the plane of interest that extend from beyond the Nal(TI) detectors towards the center to a 60-cm diameter at the center. The detectors are embedded in lead blocks to reduce detector-to-detector scattering to a value of about 0.5% of the true coincidence counting rate.
Since the exposed detector diameter defines the inherent spatial resolution, resolution is varied by placing a lead shadow shield in front of each bank of detectors with an opening consistent with the desired spatial resolution. The shadow shields have
rectangular holes flared at different angles to allow each detector an unobstructed view of all the detectors on the opposing bank. The width of the holes in the two types of shadow shields presently used are either 2.3 or 1.5 cm wide by 3.8 cm in the axial direction. These shadow shields produce an average detector pair resolution of about 1.1 and 0.8 cm full width half maximum (FWHM), respectively in the plane. The resolution in the axial direction for both of the slit shields is about 1.9 cm. With the 3.8 cm diameter Nal(Tl) detector fully exposed (i.e., no shadow shields) the average detector pair resolution is about 1.6 cm in the plane and about 1.8 cm in the axial direction.
The output signal of the detectors is amplified and sent to a discriminator that provides energy discrimination (typically a 100 keV threshold) and converts the analog detector pulse to a logic pulse for timing. The logic pulses from all eleven detectors in each bank are routed to a mixer that provides a single output signal. The output signals from the mixers from two opposing detector banks are routed to a coincidence unit that establishes the occurrence of coincidences between all pairs of opposing detectors. The actual detector pair in which a coincidence has occurred is identified by using the output of the coincidence unit to strobe open a set of 11 one-bit latches that are connected to the detectors on a bank. When a coincidence occurs, bits are set for the two detectors in which the events originated. These bits are a binary word that is encoded into a nine-bit word that is transferred to a buffer memory and finally to the computer. Design complexity is reduced, since only three coincidence circuits, three
Volume 19, Number 6 637
by on June 2, 2018. For personal use only. jnm.snmjournals.org Downloaded from
PHELPS, HOFFMAN, HUANG, AND KUHL
binary coding modules, and one encoding module are required to establish the total 363 coincidence combinations of the system.
The computer system]j (32K core) performs operations such as control of a) the linear and angular scanning motion of the gantry and the linear motion of the patient bed; b) data collection, sorting, attenuation corrections and reconstruction of the image; c) data display and processing of data with region of interest (ROI), histogram, and grey (and color) scale windowing capabilities by means of a joy stick; d) hard copy output of data through a line printer/ plotter; and e) long term storage of information on floppy discs. All of the operations, although controlled through the computer, are accessed by the user by a simple question and answer format with the video terminal of the control console. The initiation of the system operations is through push-buttons on the control console (i.e., normalize, scan, attenuation correct, display, histogram, region of interest, grey scale windowing, pause, reset, abort, etc.).
Data are displayed with a memory-buffered video system in a 256 X 320 format with 64 grey or color scales. A small display is used for photographing, while two large displays (Blk/wht and color) are used for viewing and photographing. A joy stick is used to outline regions of interest for automatic calculation of area and mean ± s.d. of image values (see Fig. 2) and to display data within a selected grey scale range or window. Patient data are stored on a triple-drive, double-sided floppy disc with 1.87 mega bytes. A 7.5 mega byte fixed and removable disc is used for high speed bulk storage and a printer/plotter provides a hard copy.
Cardiac gating (from two to eight phases) is provided by partitioning a CAMAC buffer memory into sections for data collected during different phases of the cardiac cycle. The selected phases are identified with the ECG unit that provides a routing signal to store the data in proper sections of the CAMAC
buffer memory. These data are then transferred to the computer for reconstruction of the cross-sectional images of the selected phases of the cardiac cycle.
Routinely calibrating the system on a weekly basis with a plane source mounted on tracks in the center cover removes nonuniformity in efficiency between detectors.
Rectilinear scan mode. Rectilinear scans are performed by a combination of linear scans of detector banks followed by discrete movement of the patient bed in the axial direction (gantry is not rotated). The typical sampling resolution is 5.7 mm and 6 mm in the transverse and axial directions, respectively. Three views (i.e., from the three opposing detector banks) are simultaneously recorded and displayed; an anterior-posterior and two obliques at ±60°. The collected data are sorted and displayed in high (HR), medium (MR) or low (LR) resolution modes. In the HR mode only data from directly opposing detectors are used. In the MR and LR the coincidence data of two and four neighboring detectors that view a common point at the center of the detector field of view are added to the data in the HR mode. The resolution in the HR, MR, and LR are all the same at the center line of the field of view but above and below this line the MR and LR vary with distance due to angulation of the additional lines of response. The HR mode has constant resolution in depth. Since the data for all modes are collected and stored during each scan, the best compromise between resolution and efficiency can be selected for each imaging situation.
In the rectilinear mode, scans can be selected for a fixed time or fixed number of counts with typical whole-body scan times from 10 to 50 min. Scans can also be performed in a transmission or emission mode. An external ring source of positron activity, which fits in a track of the center hole of the tomograph, is counted with and without the subject in
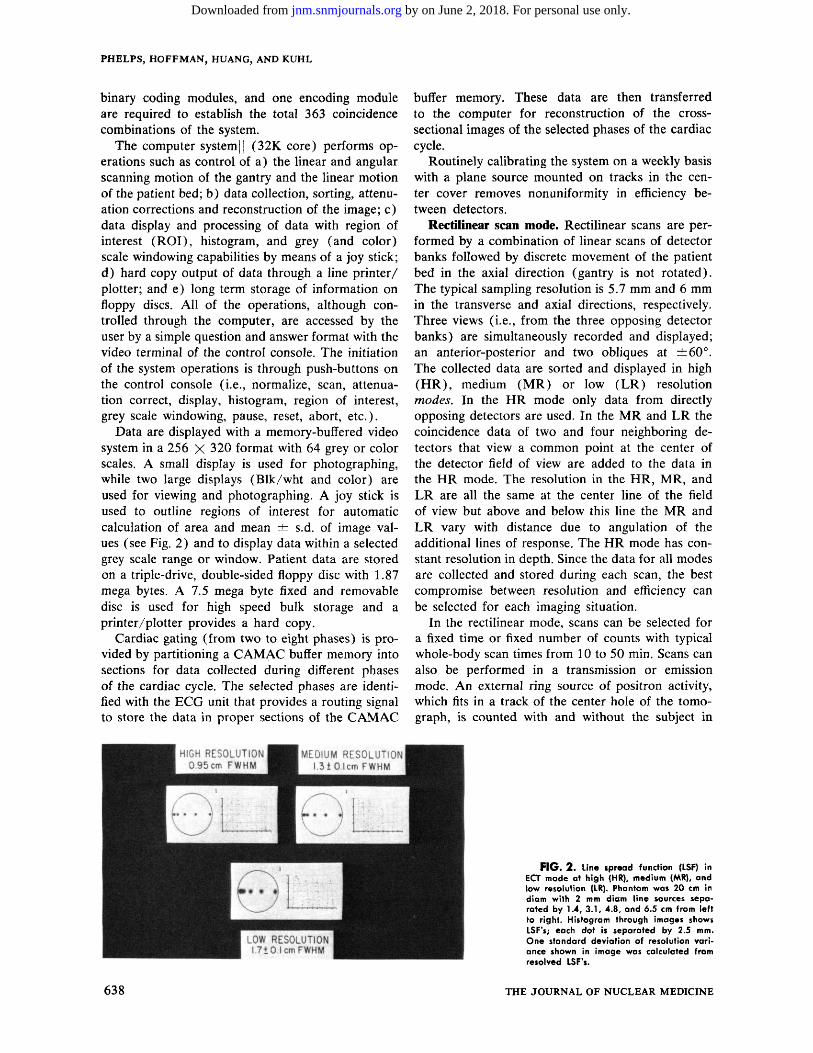
F I G . 2 . Line spread function (LSF) in ECT mode at high (HR), medium (MR), and low resolution (LR). Phantom was 20 cm in diam with 2 mm diam line sources separated by 1.4, 3 .1 , 4.8, and 6.5 cm from left to right. Histogram through images shows LSF's; each dot is separated by 2.5 mm. One standard deviation of resolution variance shown in image was calculated from resolved LSF's.
638 THE JOURNAL OF NUCLEAR MEDICINE
by on June 2, 2018. For personal use only. jnm.snmjournals.org Downloaded from

BASIC SCIENCES
Mode
High resolution
High resolution head Medium resolution
Medium resolution head Low resolution Low resolution head Rapid scan
* Although angular scann of 2.5° for reconstruction.
TABLE 1.
Angular scan*
increments
5°
10°
5 °
10°
5 °
10°
7.5°
ng increments are
TYPICAL ECT SCAN OPTION
5, 7.5
Linear scan increments
WITH ECAT
Image resolution
8 (5.7 mm/increment) 0.95, 1.3 cm 8 (5.7 mm/increment) 0.95, 1.3 cm 8 (5.7 mm/increment) 1.3 or 1.6 cm 8 (5.7 mm/increment) 1.3 or 1.6 cm 4 (1.14 cm/increment) 2.2 cm 4 (1.14 cm/increment) 2.2 cm 4 (1.14 cm/increment] 2.2 cm
and 10° , the data are sorted into linear scan profiles
I N S T R U M E N T A T I O N
^ 1 min/slice =^30 sec/slice
— 1 min/slice ^ 3 0 sec/siice
—1 min/slice ^ 3 0 sec/slice — 10 sec/slice
at angular increments
place; the ratio of these two measurements is the photon attenuation in the subject. The transmission data are used to correct the emission image for attenuation, to provide morphological identification, or to independently setup the patient for the emission scan (i.e., see Fig. 10).
The rectilinear 2-D scanning mode is used for: 1. Whole body or limited field organ scanning to
determine the distribution of the administered compound;
2. Set up and selection of levels to be studied in detail by ECT (once the 2-D image appears on the display screen, the levels of interest are selected with a joy stick the computer moves the patient to this level and the ECT sequence is initiated); and
3. To provide an overall perspective of the regions studied by ECT.
Transaxial tomographic mode. The tomographic scans are performed by a combination of linear scans of the detector banks over a distance of 4 cm followed by a rotation of the gantry through a discrete angle. For a complete scan this sequence is carried out through an angle of 60°. The computer then indexes the patient bed to the next position (i.e., next slice) and the scanning sequence is repeated in the opposite direction. The data are corrected for radioactive decay, sorted, normalized, corrected for photon attenuation, reconstructed with a convolution based algorithm, and displayed. Variable linear and angular sampling is inherent in this design, and any linear and angular sampling resolution that is multiple or submultiple of 0.57 cm and 2.5°, can be used. This assures that there need not be any sampling limitations to restrict image resolution and contrast or produce sampling artifacts. Some typical sampling options are shown in Table 1. Because of the geometric design of this system, data collected at 5°, 7.5°, or 10° increments are sorted into linear scan profiles separated by only 2.5°.
Scanning modes are selectable for a fixed time, fixed number of counts, or for automatically in
creased time from one slice to the next to compensate for radioactive decay. The number of slices may be preset and scanned automatically (i.e., by means of a computer controlled bed).
Image resolution is determined by the sampling resolution, inherent detector resolution (i.e., with or without shadow shields in place), and reconstruction filter function employed. Typical resolution values are shown in the phantom section, but a number of different combinations of the above factors are used to provide optimum image resolution, contrast, and signal/noise for different types of studies. Reconstruction time is about 35 sec for the typical 100 X 100 display format. Total time from end of scan to image display is about 2 min, however, because of additional time required for attenuation correction and display.
Attenuation correction is applied from either a transmission measured correction or geometric correction (9,31). From measurements in human subjects, Phelps et al. {31) have shown that the average path length attenuation with ACD in the head, abdomen, and thorax varies about ± 3 % , ± 8 % , ± 2 8 % ( ± 1 sd), and, therefore, the measured attenuation correction is used only for heart studies. By calculation from a uniform phantom with a known concentration of radioactivity, images can be read directly in concentration units of ^uCi/cc or metabolic rates in mg/min/100 g (i.e., with incorporation of a physiologic model of metabolism).
Phantom studies. Resolution. ECT. Typical values for the high, medium, and low resolution modes in the transaxial-tomographic format are shown in Fig. 2. These values were obtained with 2-mm diameter line sources (Cu-64) in a 20-cm diameter solid plastic phantom as a scattering media. The resolution across the transaxial plane has a measured uniformity of ^ 1 mm. Resolution in the axial direction is 1.8 cm without the shadow shields and 1.9 cm with the shadow shields.
Rectilinear. In the high resolution mode (i.e.,
Volume 19, Number 6 639
by on June 2, 2018. For personal use only. jnm.snmjournals.org Downloaded from

PHELPS, HOFFMAN, HUANG, AND KUHL
icr •
¥ 2
c 10* S o o
1 2 o
l l O 3
CO 5 -
10
V \
\
\ T. = 10 Min
\ ' 2
\ \
\ \
\
\
\ \
20 40 60 Time (Min)
80 loo
F I G . 3 . Measurement of linearity. Data was taken with a 20 cm diam X 5 cm thick phantom containing MNH3. Solid line is the correct 10 min half-time of 1 3 N. Dots are measured countrates. Excellent linearity is observed over measured counrates.
using only straight-across line of coincidence), the FWHM resolutions (2-mm diameter line sources in a 20-cm thick scattering media) are 0.85 ± 0.1, 1.3 ± 0.1, and 1.7 ± 1 cm with the 1.5 cm, 2.3 cm shadow shields and no shadow shields, respectively. In this mode resolution is constant with depth. Because angulated lines of response are used in the medium and low resolution modes, there is a variation of resolution in depth. The medium resolution mode increases the FWHM by an average of 0, 3, and 6 mm at the center of the field of view (FOV) and 7.5 and 14 cm from the center of the FOV. The resolution in the low resolution mode worsens by 0, 6, and 15 mm at the center line, 7.5 and 14 cm from center line. Across the rectilinear image, resolution at any given depth varies ^ 1 mm.
Efficiency. ECT. The efficiency was measured with
15 and 20 cm diameter cylinders filled with positron activity (F-18). The values without and with the 2.3 cm and 1.5 cm diameter shadow shields are listed in Table 2. As a measure of efficiency the count rate/activity concentration was determined for a uniform distribution of activity in a cylindrical phantom. This was considered more realistic than line or point sources in air, since it reflects the actual imaging situation (i.e., distributed activity in an attenuating media). In stating efficiency with a distributed source one must acknowledge the fraction of counts due to scatter coincidence (see section on in plane scatter) and random coincidence. The efficiency values listed in Table 1 contain < 1 % random coincidences.
Relatively small diameter phantoms were chosen for more realistic comparison to systems with smaller
TABLE 2. SYSTEM EFFICIENCY* VERSUS RESOLUTION
Average detector pair
resolution {FWHM)t
1.6 cm 1.1 cm 0.8 cm
* Efficiency is given is about 1 0 % . Energy
f Detector pair reso the ECAT. The 1.6, 1.1
Image resolution (FWHM) Image mode 15-cm diam. phantom 20-cm diam. phantom
1.7 cm Low resolution 25,100 30,100 1.3 cm Medium resolution 13,500 15,900 0.95 cm High resolution 7,730 9,200
for 100% positron emission//uCi. Fraction of random coincidence is < 0 % . Amount of scattered radiation threshold is 100 KeV. lution values are the average of the inherent detector pair resolutions from all 363 lines of response in and 0.8 cm values are without and with the 2.3 and 1.5 cm wide shadow shields, respectively.
640 THE JOURNAL OF NUCLEAR MEDICINE
by on June 2, 2018. For personal use only. jnm.snmjournals.org Downloaded from

FOV than the 50 cm fiield of this system (i.e., systems designed to have maximum efficiency for a small FOV). The large FOV is employed to allow any portion of the human body to be examined without distortions due to field size limitations.
The efficiencies in Table 2 can be compared at the same resolution to the PETT III with the 3.8 cm shadow shields of 10,000 c/sec/^Ci/cc§ (corresponds to low resolution mode of EC AT in Table 2) with a 20-cm diameter phantomf and the ring system being developed by Derenzo and Budinger of 11,300 e/sec/>Ci/cc§ in a 20 cm phantom with a resolution that is about 8 mm (circular) at the center of the 30 cm FOV, 8 X 1 3 mm, and 8 X 19 mm (eliptical) at 10 and 15 cm from center, respectively (52). In the axial direction of the Derenzo-Budinger ring the resolution is about 50% better than the system described in this work.
Detection efficiency decreases as the exposed detector diameter is decreased with the shadow shields (Table 2) . This decrease is not as rapid as would be expected from geometric considerations (25), however, because the shielded or covered part of the detector acts as a "catcher" for the 511 KeV photons which enter through the holes in the shadow shields. This is an important consideration in choice of detector sizes (i.e., efficiency against resolution) due to the difficulty of detecting 511 KeV photons.
Rectilinear. The rectilinear scan efficiency is 0.09, 0.27, and 0.45 times the efficiency for ECT for the high, medium and low resolution rectilinear scan modes for a 20-cm diameter phantom. This phantom size, however, is not employing the total efficiency of the 50 cm FOV.
Linearity and count rate capability. The system linearity and count rate capability were evaluated by filling a uniform 20-cm diameter phantom with a water solution of [13N] ammonia and recording the system count rate as a function of time. The 10.0 min half-life decay of N-13 was used to examine the deviation from a true count rate. Figure 3 illustrates that the linearity is excellent in the count rate range of ^=20,000 c/sec, where it is typically used.
Random coincidence. The phantom used for linearity and count rate was also used in the measurement of random coincidence fraction at several different system count rates (Table 3). The random coincidence fraction increases with system count rate since the random coincidence count rate is proportional to the (amount of radioactivity)2, whereas the true coincidence count rate is directly proportional to amount of radioactivity.
Scatter coincidence. The magnitude of true coincidence resulting from scattered radiation occurring outside the FOV was measured with a phantom 16
Volume 19, Number 6
BASIC SCIENCES INSTRUMENTATION
F I G . 4 . Error estimate. Reconstructed images of 20 cm diam phantom containing uniform distribution of positron activity. Right: medium resolution; left: high resolution. Images contain 20 million counts. Experimental (exp) error | % s.d.) was calculated from center 15 cm diam section as shown by region of interest in image at left. Histogram profiles through center of images are shown. Theoretical (Theor) errors are calculated from Eq. 1.
cm long and 20 cm in diameter with a 4 cm long section in the center that could be filled separately. The entire phantom was initially filled with radioactivity and positioned (i.e., the 16-cm length in the axial direction) with the 4-cm section in the FOV. The total coincidence count rate was recorded, the activity in the 4-cm section then replaced with water, and the count rate again measured. The second count rate represents the coincidence events due to scattered radiation from the activity above and below the FOV and was found to be 5.2% of the true coincidence count rate.
TABLE 3. FRACTION OF TOTAL SYSTEM COUNTRATE DUE TO RANDOM COINCIDENCES*
Random coincidence
Total system countrate total coincidence
(counts/see) (%)
50,000 17
20,000 8.0 10,000 4.1 5,000 2.1 1,000 0.7
* Phantom was 20-cm diam X 5-cm long and contained a uniform distribution of 13NH;t in water.
641
by on June 2, 2018. For personal use only. jnm.snmjournals.org Downloaded from

PHELPS, HOFFMAN, HUANG, AND KUHL
The scatter from activity within the FOV (in plane scatter) was measured with a 20-cm X 4-cm diameter plastic phantom that contained a single line source. Separate measurements were performed with the line source at the center of the phantom, 5 cm from the center, and 9 cm from the center. The fraction of scatter was determined for selected linear scan profiles from the 72 angular projections by measuring the number of counts outside of the 3.8 cm (i.e., detector diameter) wide portion of the line spread function and dividing this value by the total number of counts recorded in the full FOV and the 20-cm diameter of the object. These values were found to be 10.3% and 6 .1%. Thus, the total scatter fractions (i.e., within and out of plane) is about 15.5 and 11.3% for the full 50-cm FOV and a 20-cm diameter object. Since these scatter fractions were measured in LR mode, the worst values were ascertained (i.e., MR and HR modes will have lower scatter fractions because they have lower solid angle efficiencies). These scatter fractions are simi-
F I G . 5 . Reduction of motion artifacts due to redundant sampling. Top left: Sketch of phantom is composed of outer cylinder with 19-cm diam., inner cylinder (off center) with 13.5 cm diam. and two small interior cylinders with 3-cm diam. Numbers in figure are relative activities. Top right: Reconstructed image of phantom. Histogram profile at position of -f- signs on image are shown. Note that image values are in excellent agreement with activity values and small plastic wall which divides the left and right sides is seen even though its thickness is only 2 mm. Bottom left: Reconstructed image with no motion. Bottom right: Reconstructed image in which phantom was moved in discrete 1.5 cm steps (i.e., worse than continuous motion over same distance) 20 times in one direction during scan. Note that only minor artifacts appear. Resolution was medium and images contain about 7 million to provide high definition of possible artifacts.
F I G . 6 . Effect of redundant sampling and use of recalibration to reduce and remove errors due to possible detector instabilities. Top left: Reconstructed image with system in calibration. Top right: Reconstructed image with 11 center coincidence lines of response (LOR) set to zero (disconnected). No significant artifacts are seen. Bottom left: 33 center LOR (11 on each bank) set to zero. Because of redundant sampling only modest artifacts are seen considering that 33 LOR are zero. Bottom right: System was recalibrated with 33 LOR still set to zero and data reconstructed. Note artifacts seen in bottom left image are removed. Resolution was medium and images contain about 7 million counts to provide high definition of possible artifacts.
lar to, although somewhat lower than, those reported by Derenzo of 18% for the 30 cm FOV Donner ring system (24). Since the EC AT has larger detectors with a higher 511 keV/low energy (i.e., scatter radiation) detection efficiency and a larger separation distance between detectors the lower values for the ECAT are understandable. The Donner ring system has better slit shielding, however, and therefore the differences are less than would be predicted. These scatter fractions are also considerably lower than the values of 40-60%, depending on the amount of pulse height analysis, for the Searle Radiographics** positron camera without slit shields (private communications, Harper P.). In the ECT mode the scatter and random coincidence fractions are substantially reduced in the final image as a result of an inherent de-emphasis (low weighing) in the reconstruction process because of their low-frequency nature (8). For example, if the scatter plus random coincidence fraction were 15% in the collected data, this fraction is reduced to about 6% in the reconstructed image of a 20-cm diameter object.
Accuracy and field uniformity. ECT. The accuracy of the reconstructed image is a function of many
642 THE JOURNAL OF NUCLEAR MEDICINE
by on June 2, 2018. For personal use only. jnm.snmjournals.org Downloaded from

BASIC SCIENCES INSTRUMENTATION
RECTILINEAR SCANS^'CO)
F I G . 7 . Left: Whole body rectilinear scan of human subject after inhalation of 10 mCi of u C O . Image shows general blood distribution and prominent vessels and blood pools (i.e., superior sagittal sinus, carotids, jugulars, heart chambers, spleen, iliacs, etc.). A-P and two ± 6 0 ° obliques are simultaneously recorded. Whole body transmission scan is also shown. Resolution was medium and total scan time for emission and transmission images were 40 min each.
EMISSION TRANSMISSION
factors (8-10,25-31,33-35). Since these factors are all interrelated and their magnitude is in great part a function of the particular tomographic design, it is difficult, if not impossible, to define them in a general way. Thus, phantom studies were carried out to examine the total effect of these factors rather than concentrate on them individually. A 20-cm diameter phantom containing a uniformity distributed source
of positron activity (Ga-68) was imaged three times to collect 20,000,000, 1,000,000, and 500,000 total counts. The standard deviation percentage (% s.d.) from the mean picture element value was calculated over the center 15-cm section of the image (to avoid edge effects). The average theoretical % s.d. was also calculated assuming the only source of error was statistical in origin by the equation:
F I G . 8 . Left: Whole body rectilinear bone scan of patient with Hodgkins lymphoma 2 hr after injection of 5 mCi of F-18. Resolution was medium resolution shadow shields—low resolution mode. Total scan time was 25 min {see text for description). Right: 12 ECT scan from 4 cm above iliac crest in 15 mm steps down toward greater trochanter. There is good definition of the vertebral body, spinus process, iliac bones, ischiac bone, S.I. joint, sachrum, femur, etc. Arrows indicate lesions in iliac crest and head of femur. Resolution was medium, scan times were 3 min/level and images contain from 530,000 to 1.8 million counts.
Volume 19, Number 6 643
by on June 2, 2018. For personal use only. jnm.snmjournals.org Downloaded from

PHELPS, HOFFMAN, HUANG, AND KUHL
A
k
t
F I G . 9 . Cerebral blood volume ECT images of human subject subsequent to single breath inhalation of 20 mCi of u C O . Images are from 4 cm above to 3.5 cm below (left to right) orbital meatal line. Images show blood distribution in the veins, arteries and grey and white matter structures. Resolution was high (9.5 mm), images contain from 750 to 1.7 million counts and scan was 4—5 min/level.
% s.d. = 0.75 [DV(2(AX)3N)]1/2 x 100, (1) where D, AX, and N are the object diameter, linear sampling distance and total number of counts in the image, respectively. Equation 1 assumes a Shepp (36) reconstruction filter function, with a cut-off frequency of ( 2 A X ) _ 1 and linear interpolation in the back projection. Equation 1 is similar to the equations derived by others (33-35). The measured
s.d. errors at 20 million, 1 million, and 0.5 million total counts were found to be less than or equal to the theoretical statistical predictions down to a value of about 1.4% (Fig. 4) , which indicates that the noise component in the ECT images is primarily due to photon statistics. A significant factor in the accuracy of this system results from the redundant sampling in which each point is repeatedly sampled by
F I G . 1 0 . Example of interactive capability between rectilinear and ECT scans. Left: transmission scans of thorax. Bottom: 3-min limited field rectilinear scan showing use of joy stick (X is position of cursor) to select levels which are automatically carried out in ECT mode (shown above). Right: Emission images of thorax subsequent to inhalation of 10 mCi of " C O . Bottom: Shows 3-min limited field rectilinear scan showing use of joy stick (X) to select levels which are then automatically studied with ECT as shown above. Emission images from top to bottom and left to right are from top of heart in 15-mm steps toward apex. Abbreviations: RV and LV, right and left ventricular chamber; RA and LA, right and left atrial chamber; OF, outflow tract; A, aorta; SV, superior venacava,- PA, pulmonary artery; IVS, interventricular septum; IVC, inferior venacava. Images are ungated, resolution was medium and images contain from 600,000 to 3 million/level. Scan times were 7 min/level (Adapted from Ref. 29).
644 THE JOURNAL OF NUCLEAR MEDICINE
by on June 2, 2018. For personal use only. jnm.snmjournals.org Downloaded from

BASIC SCIENCES INSTRUMENTATION
F I G . I T . Selected ECT images of cerebral " pe r fus ion " and glucose metabolism subsequent to i.v. injection of 13NHj (20 mCi) and 1SFDG (5 mCi), respectively. Images contain from 700,000 to 2 mil l ion counts/ ievel . Scan times for 13NHn were 3 min/ level and 7 min/ leve l wi th 1SFDG. Note del ineat ion of superficial cortex, visual cortex, left and r ight internal grey nuclei in region of basal gang l ia and infernal capsule. Photographs of brain slices are shown at left for anatomic comparisons. ' "NK: and FDG scans are from different subjects and therefore levels are not exactly comparable. Resolution was medium.
the blood distribution, A whole body transmission scan is included.
In a 26-year-old patient with Hodgkin lymphoma, a rectilinear scan was performed 2 hr after i.v. injection of 5 mCi of 1SF~ in physiologic saline (Fig. 8). Multiple metastases were observed in the calvarial region, lower thoracic and lumbar spine region, right greater trochanter, distal two-thirds of the left femor and left iliac crest. All of the confirmed lesions seen on the F-18 scan were also seen in a Tc-99m HEDSPA scan. Before the rectilinear studies (1 hr following injection) 12 ECT scans were taken from 4 cm above the iliac crest in 15-mm steps down to the greater trochanter (Fig. 8). Increased concentration of F-18 is seen in left iliac crest at the 7th level and in the head of the right femur of the 12th level.
Emission computed tomography. While the rectilinear images shown (Figs. 7 and 8) clearly display a wide range of information they are limited in detailed evaluations. This limitation is illustrated by comparing the n C O rectilinear scan in Fig. 7 with the n C O ECT scans of the brain and heart shown in Figs. 9 and 10. The ECT brain scans show the detailed distribution of cerebral blood volume (CBV). These data can be used to calculate the CBV in
different detectors throughout the scan (31). The redundant sampling also increases efficiency from the edge to the center of the object to offset partially the effects of photon attenuation and error propagation in CT which increase error from edge to center (31).
A phantom that simulated the brain was imaged under different conditions: a) stationary position with all detectors in calibration, stationary position with the center 11 and 33 coincidence lines of response (i.e., center positions where maximum reinforcement of error occurs) disconnected; and b) phantom was moved 20 times in discrete steps (i.e., toward and away from one detector bank pair; a worse case motion (over a total distance of 1.5 cm during the scan. The minor distortions that occurred during these studies (Figs. 5 and 6) result from the inherent protection provided by the redundant data sampling feature of this system. If a study is performed with the detectors out of calibration, any resulting artifacts can be removed by reconstructing the image after recalibration (Fig. 6).
Human studies. Rectilinear scan studies. Figure 7 shows a whole body rectilinear scan of a normal human subject 5 min after the inhalation of 10 mCi of n CO. Since n C O binds to hemoglobin, this shows
13 NH„ 68GaEDTA
0 Q 0M +5.5
0M +4.0
0M+2.5
0M-2.0
F I G . 1 2 . Selected images from patient w i th r ight occipital in farct. "NHa and Ga-68 EDTA images show perfusion and blood brain barr ier (BBB) defect. High level of activity seen in center-posterior region is b lood activity in superior sagittal sinus. Note that if a 8NH s images are superimposed on Ga-68 EDTA the BBB defect corresponds directly to perfusion defect. Brain slices (not same patient) are shown for anatomic comparison. X-ray CT scans wi th and wi thout radiographic contrast material were negative. Resolution was medium.
Volume 19, Number 6 645
by on June 2, 2018. For personal use only. jnm.snmjournals.org Downloaded from

PHELPS, HOFFMAN, HUANG, AND KUHL
units of cc of blood/gm of tissue (37-39). Figure 10 illustrates both the use of transmission and emission limited field rectilinear scans for the interactive selection of levels for ECT. Even though this study was ungated, the vascular structures of and surrounding the heart are well delineated. Gating of these studies will allow slice by slice determination of cardiac work functions on a chamber by chamber basis.
ECT images of the brain following an i.v. of 13NH3
and F-18 2-deoxyglucose (FDG) in the normal human subject are shown in Fig. 11. The 13NH3 images are considered to reflect the distribution of capillary density (and probably perfusion) in the brain (39,40), whereas FDG images represent the cerebral metabolic rate for glucose (41^43). Direct correspondence in the 13NH3 and FDG images have been observed in normal regions of the brain (44), as would be expected if 13NH3 represents cerebral perfusion, since perfusion is normally regulated by metabolism.
Figure 12 shows selected ECT levels from an ]3NH3 and Ga-68 EDTA studies of a 63-year-old patient with a right occipital infarct. The 13NH3 and Ga-68 EDTA clearly demonstrate a perfusion and blood brain barrier defect (arrow).
CONCLUSION
The ECAT is a positron imaging system capable of providing high contrast, high resolution, quantitative images in both a 2-dimensional and tomographic format. The flexibility of this system in its various image mode options allows it to be used for a wide variety of imaging problems.
FOOTNOTES
* J & P Engineering, England. + Union Carbide Imaging Systems, Norwood, Mass. t Ortec, Inc., Oak Ridge, Tenn. HPDP-11/45. § Efficiency value assumes 100% positron emission//^Ci. f Unpublished data (Hoffman, Phelps). ** Searle Radiographic, Chicago, 111.
ACKNOWLEDGMENTS
We thank Dr. Norman S. MacDonald and his cyclotron staff; Dr. Gerald Robinson and his chemistry staff for the production of the compounds used in this study; and JoAnn Miller, Francine Aguilar, and Carl Selin for technical help. Our thanks also to Lee Griswold and Hector Pimentel for illustration work. Acknowledgement is given to Dr. Wolfs group at Brookhaven National Laboratory who developed and built the targetry used for the production of 1SFDG.
This work was partially supported by ERDA contract EY-76-C-03-0012 GEN-12. NIH grant 7R01-GM 24839-01.
REFERENCES
1. KUHL DE, EDWARDS RQ. RICCI AR, et al: The MARK
IV System for radionuclide computed tomography of the brain. Radiology 121: 405-413, 1976
2. KUHL DE, HOFFMAN EJ, PHELPS ME, et al: Design
and application of the MARK IV Scanning System for radionuclide computed tomography of the brain. In IAEA SM-210/99 Medical Radionuclide Imaging, Vol 1, Vienna, IAEA, pp 309-320, 1977
3. BOWLEY AR, TAYLOR CG, CAUSER DA, et al: A ra
dioisotope scanner for rectilinear, arc, transverse section and longitudinal section scanning (ASS—The Aberdeen Section Scanner). Br J Radiol 46: 262-271, 1973
4. KEYES JW, ORELANDEA N, HEETDERKS WJ, et al: The
Humongotron—A Scintillation Camera Transaxial Tomograph. J Nucl Med 18: 381-387, 1977
5. BUDINGER T, GULLBERG GT: Three-dimensional re
construction in nuclear medicine by iterative least-squares and fourier transform techniques. IEEE Med Sci NS-21: 2-20, 1974
6. BUDINGER TF, GULLBERG FT: Transverse section reconstruction of gamma-ray emitting radionuclides in patients. In Reconstruction Tomography in Diagnostic Radiology and Nuclear Medicine. Ter-Pogossian MM, Phelps ME, Brownell GL, et al, eds. University Park Press, 1977, 315-342
7. JASZCAAK RJ, MURPHY PH, HUARD D, et al: Radio
nuclide emission computed tomography of the head with """Tc and a scintillation camera. / Nucl Med 18: 373-380, 1977
8. PHELPS ME, HOFFMAN EI, MULLANI NA, et al: Ap
plication of annihilation coincidence detection to transaxial reconstruction tomography. J Nucl Med 16: 210-224, 1975
9. PHELPS ME, HOFFMAN EJ, MULLANI N, et al: De
sign and performance characteristics of a whole body transaxial tomograph (PETT I I I ) . IEEE Nucl Sci NS-23: 516-522, 1976
10. HOFFMAN EJ, PHELPS ME, MULLANI N, et al: De
sign and performance characteristics of a whole body transaxial tomograph. / Nucl Med 17: 493-502, 1976
11. TER-POGOSSIAN MM, PHELPS ME, HOFFMAN EJ,
et al: A positron emission transaxial tomograph for nuclear medicine imaging (PETT) . Radiology 114: 89-98, 1975
12. TER-POGOSSIAN MM: Basic principles of computed axial tomograph. Sem Nucl Med 7: 109-127, 1977
13. BROWNELL GL, BURNHAM CA: In Tomographic Im
aging in Nuclear Medicine, Friedman GS, ed. New York, Society of Nuclear Medicine, 1973, pp 154-164
14. BROWNELL GL, BURNHAM CA, CHESLER DA, et al:
Transverse section imaging of radionuclide distributions in heart, lung, and brain. In Reconstruction Tomography In Diagnostic Radiology and Nuclear Medicine. Ter-Pogossian MM, Phelps ME, Brownell GL, et al, eds. Baltimore, University Park Press, 1977. pp 293-307
15. MUEHLLENHNER G. BUCHIN NP, DUBEK GH: Per
formance parameters of the positron imaging camera. IEEE Nucl Sci NS-23: 528-537, 1976
16. MUEHLLENHNER G, ATKINS F, HARPER PV: Positron
camera with longitudinal and transverse tomographic ability. IAEA-SN-210/84, 1975: in press
17. L I M CB, CHU D, KAUFMAN L, et al: Initial characterization of a mufti-wire proportional chamber positron camera. IEEE Nucl Sci NS-22: 388-394, 1975
75. HATTNER RS, L I M CB, SWANN SJ, et al: Cerebral
imaging using esGa-DTPA and the UCSF multi-wire proportional chamber positron camera. IEEE Nucl Sci NS-23: 523-525, 1976
19. ROBERTSON JS, MARR RB, ROSENBLUM B, et al: 32
crystal positron transverse section detector. In Tomographic
646 THE JOURNAL OF NUCLEAR MEDICINE
by on June 2, 2018. For personal use only. jnm.snmjournals.org Downloaded from
BASIC SCIENCES
Imaging in Nuclear Medicine, Freedman GS,'ed. New York, Society of Nuclear Medicine, 1973, pp 142-153
20. YAMAMOTO Y, THOMPSON CJ, MEYER E, et al: Dy
namic positron emission tomography for study of cerebral hemodynamics in a cross-section of the head using positron-emitting 08Ga-EDTA and 77 Kx. J Comput Assist Tomograph 1: 43-56, 1977
21. CHO ZH, ERIKSSON L, CHAN J: A circular ring transverse axial position camera. In Reconstruction Tomography in Diagnostic Radiology and Nuclear Medicine. Ter-Pogos-sian MM, Phelps ME, Brownell GL, et al, eds. Baltimore, University Park Press, 1977, pp 393-424
22. CHO ZH, COHEN MB, SINGH M, et al: Performance
and evaluation of the circular ring transverse axial positron camera (CRTAPC). IEEE NucI Sci NS-24, 530-543, 1977
23. DERENZO SE, ZAKLAD H, BUDINGER TF : Analytical
study of a high-resolution positron ring detector system for transaxial reconstruction tomography. / NucI Med 16: 1166-1173, 1975
24. DERENZO SE, BUDINGER TF, CAHOON JL, et al: High
resolution computed tomography of positron emitters. IEEE NucI Sci NS-24: 544-558, 1977
25. HOFFMAN EJ, PHELPS ME: An analysis of some of the physical aspects of positron transaxial tomography. Comput Biol Med 6: 345-360, 1976
26. PHELPS ME: What is the purpose of emission computer tomography in nuclear medicine. J NucI Med 18: 399-402, 1977
27. PHELPS ME, HOFFMAN EJ, KUHL DE: Physiologic
tomography: A new approach to in vivo measure of metabolism and physiological function. In Medical Radionuclide Imaging, Vol. 1, IAEA, Vienna, pp 233-253, 1977
28. PHELPS ME, HOFFMAN EJ, HUANG SC, et al: Positron
tomography: "In vivo" autoradiographic approach to measurement of cerebral hemodynamics and metabolism. In Cerebral Function, Metabolism and Circulation, Ingvar DH, Lassen NA, eds. Copenhagen, Munksgaard, 1977, pp 446-447
29. PHELPS ME: Emission computed tomography. Sem NucI Med 7: 337-365, 1977
30. PHELPS ME, HOFFMAN EJ, GADO M, et al: Compu
terized transaxial transmission reconstruction tomography. In Non-Invasive Brain Imaging, Computed Tomography and Radionuclides. DeBlanc H, Sorenson J, eds. New York, Society Nuclear Medicine, 1975, pp 111-146
31. PHELPS ME, HOFFMAN EJ, MULLANI NA, et al: Some
performance and design characteristics of PETT III. In Reconstruction Tomography in Diagnostic Radiology and Nuclear Medicine. Ter-Pogossian NM, Phelps ME, Brownell
Volume 19, Number 6
INSTRUMENTATION
GL, et al, eds. Baltimore, University Park Press, 1977, pp 371-392
32. DERENZO SE: Positron ring cameras for emission-computed tomography. IEEE, NS-24, 881-885, 1977
33. BUDINGER TF, DERENZO SE, GULLBERG GT, et al:
Emission computed axial tomography. / Compt Assist Tomog 1: 131-145, 1977
34. CHESLER DA, ARONOW S, CORRELL JE. et al: Statis
tical properties and stimulation studies of transverse section algorithms. In Reconstruction Tomography in Diagnostic Radiology and Nuclear Medicine. Ter-Pogossian MM, Phelps ME, Brownell GL, et al, eds. Baltimore, University Park Press, 1977, pp 49-58
35. ZACHER R: Resolution limit for reconstruction tomography based on photon attenuation. In Reconstruction Tomography in Diagnostic Radiology and Nuclear Medicine. Ter-Pogossian MM, Phelps ME, Brownell GL, et al, eds. Baltimore, University Park Press, 1977, pp 59-66
36. SHEPP LA, LOGAN BF: Some insights into the Fourier reconstruction of a head section. IEEE NucI Sci NS-21: 21-43, 1974
37. PHELPS ME, GRUBB RL, TER-POGOSSIAN MM: In
vivo cerebral blood volume by x-ray fluorescence: Validation of method. J Appl Physiol 35: 741-747, 1973
38. KUHL DE, REIVICH M, ALAVI A, et al: Local cere
bral blood volume determined by three-dimensional reconstruction of radionuclide scan data. Circulation Res 36: 610-619, 1975
39. PHELPS ME, HOFFMAN EJ, COLEMAN RE, et al: To
mographic images of blood pool and perfusion in brain and heart. J NucI Med 17: 603-612, 1976
40. PHELPS ME, RAICHLE ME, HOFFMAN EJ, et al: Fac
tors which affect uptake and retention of "NHn. Stroke 8: 694-701, 1977
41. SOKOLOFF L, REIVICH M, KENNEDY C, et al: The
(14C) deoxyglucose method of the measurement of local cerebral glucose utilization: Theory, procedure and normal values in the conscious and anesthetized albino rat. J Neu-rochem2%: 897-916, 1977
42. REIVICH M, KUHL DE, W O L F A, et al: Measurement
of local cerebral glucose metabolism in man with lsF-2-fluoro-2-deoxy-D-glucose. In Cerebral Function, Metabolism and Circulation. Ingvar DH, Lassen NA, eds, Copenhagen, Munksgaard, 1977, pp 190-191
43. KUHL DE, PHELPS ME, HOFFMAN EJ, et al: Initial
clinical experience with lvF-2-deoxy-D-glucose for determination of local cerebral glucose utilization by emission computed tomography. In Cerebral Function, Metabolism and Circulation. Ingvar DH, Lassen NA, eds, Copenhagen, Munksgaard, 1977, pp 192-193
647
by on June 2, 2018. For personal use only. jnm.snmjournals.org Downloaded from

1978;19:635-647.J Nucl Med. Michael E. Phelps, Edward J. Hoffman, Sung-Cheng Huang and David E. Kuhl RadiopharmaceuticalsECAT: A New Computerized Tomographic Imaging System for Positron-Emitting
http://jnm.snmjournals.org/content/19/6/635This article and updated information are available at:
http://jnm.snmjournals.org/site/subscriptions/online.xhtml
Information about subscriptions to JNM can be found at:
http://jnm.snmjournals.org/site/misc/permission.xhtmlInformation about reproducing figures, tables, or other portions of this article can be found online at:
(Print ISSN: 0161-5505, Online ISSN: 2159-662X)1850 Samuel Morse Drive, Reston, VA 20190.SNMMI | Society of Nuclear Medicine and Molecular Imaging
is published monthly.The Journal of Nuclear Medicine
© Copyright 1978 SNMMI; all rights reserved.
by on June 2, 2018. For personal use only. jnm.snmjournals.org Downloaded from