instrument development procedures for mathematics measures · pdf fileinstrument development...
TRANSCRIPT
Technical Report Number 08-02
Instrument Development Procedures for Mathematics Measures
Eunju Jung
Kimy Liu
Leanne R. Ketterlin-Geller
Gerald Tindal
University of Oregon
Behavioral Research and Teaching
Published by Behavioral Research and Teaching University of Oregon • 175 Education 5262 University of Oregon • Eugene, OR 97403-5262 Phone: 541-346-3535 • Fax: 541-346-5689 http://brt.uoregon.edu This research was supported by Project INFORM (H327B050013-07) from Office of Special Education Programs, U.S. Department of Education. BRT is affiliated with the College of Education, University of Oregon. Opinions expressed herein do not necessarily reflect those of the U.S. Department of Education or Offices within it.
Copyright © 2008. Behavioral Research and Teaching. All rights reserved. This publication, or parts thereof, may not be used or reproduced in any manner without written permission. The University of Oregon is committed to the policy that all persons shall have equal access to its programs, facilities, and employment without regard to race, color, creed, religion, national origin, sex, age, marital status, disability, public assistance status, veteran status, or sexual orientation. This document is available in alternative formats upon request.

Abstract
The purpose of this study was to develop general outcome measures (GOM) in mathematics so
that teachers could focus their instruction on needed prerequisite skills. We describe in detail, the
manner in which content-related evidence was established and then present a number of
statistical analyses conducted to evaluate the technical adequacy of these measures. The
outcomes support the test development process and reflect a series of measures that have
potential for use in elementary and middle school mathematics programs.

General Outcome Measures in Mathematics – Page 1
Introduction
Computation is a basic skill of mathematics. Students who have difficulty in computation
might have trouble in their daily life, as well as problems with other higher levels of mathematics
such as geometry, estimation, and statistics. Computation is an essential tool for studying other
demanding mathematical applications such as physics, chemistry, and computer science.
Considering the hierarchical nature of mathematics, speed and accuracy in computation play an
important role in overall mathematics abilities.
How can we assess computation skills? Researchers have reported that formative
evaluation enables teachers to tell if their instructional methods work for their students (Stecker
& Fuchs, 2000). Formative evaluation has several advantages for classroom teachers, including
easy administration and interpretation, as well as providing useful information about students’
performance with repeated and frequent measurement (Deno, 1985; Shinn, 1989; Thurber,
Shinn, & Smolkowski, 2002). CBM is well known as a good instrument to measure students’
reading proficiency (Deno, 1985; Shinn, 1989, 1998; Thurber, Shinn, & Smolkowski, 2002).
Unfortunately, compared with reading CBM, the technical adequacy of mathematics-curriculum-
based measurement (M-CBM) is not well known. Of the few studies conducted, Tindal, Marston,
and Deno (1983) reported that M-CBM presented high inter-rater agreement (.97), high 1-week
test-retest reliability (.87), and moderate alternate form reliability (.66).
The purpose of this technical report is to describe research conducted on computer-
administered M-CBM for students in grades 3-8. Students were administered a 15-item M-CBM.
Item-response theory (IRT) analyses indicate that the measures adequately fit the model
parameters and represent a range of difficulty levels. As such, evidence suggests that these

General Outcome Measures in Mathematics – Page 2
measures may be useful for providing information about students’ mathematics computation
ability.
Methods
Setting and Participants
Twelve elementary- and middle-schools in two large, suburban districts in the Pacific
Northwest participated in this study. Approximately 35 teachers from grades 3-8 participated in
this pilot testing. A total of over 1,300 students with more than 200 students in each grade took
the tests.
Testing took place either in the schools’ computer labs or in the teachers’ classrooms
if they had a mobile laptop lab. For each testing session, the teacher and students were assembled
with computers connected to the Internet. BRT staff members (two staff members for each
testing session) showed students how to access the test through a secure website. A BRT staff
member read the standardized Directions for Administration (Appendix A) to students and then
the students began testing. Testing took place during a four-week window from the last week of
February 2007 through the third week of March 2007.
Measurement/Instrument Development
A Research Assistant at BRT wrote all items. The item writer had a B.S. in
mathematics as well as a B.A. and a M.A in special education. She was concurrently enrolled in
a Ph.D. course in Special Education at the University of Oregon. The item writer had experience
in developing and validating mathematics CBM measures for grades 2 through 4 in her Master’s
program. She has a secondary special educator license with mathematics specialization.
The item writer created 15 computation items for each grade, for grades 3 to 8. These
items were written from grade level content standards in the domain of Numbers and Operations.

General Outcome Measures in Mathematics – Page 3
To do this, the item writer reviewed mathematics standards of NCTM, Oregon State, Washington
State, Hawaii State, and West Virginia State. Table 1 below indicates the specific number of
items by task type for each grade level.
Table 1.
Number of items by task type for each grade level.
Grade Task type # of Items Specific task type
3
Addition (whole numbers)
4
- Adding two three-digit numbers with renaming from tens to hundreds - Adding two three-digit numbers with renaming from ones to tens and tens to hundreds - Adding three two-digit numbers with renaming (one column totals less than 20) - Adding four numbers with renaming from ones to tens and from tens to hundreds (sums of columns below 20)
Subtraction (whole numbers)
5
- Subtracting a two-digit number from a three-digit number with renaming from hundreds to tens - Subtracting a three-digit number from a three-digit number with renaming from tens to ones and hundreds to tens - Subtracting a three-digit number from a three-digit number, zero in tens column with renaming from tens to ones and hundreds to tens - Subtracting a four-digit number from a four-digit number with renaming from thousands to hundreds - Subtracting a three-digit number from a four-digit number with renaming from thousands to hundreds
Multiplication (whole numbers)
3
- One-digit factor times two-digit factor with no carrying - One-digit factor times two-digit factor with carrying - One-digit factor times two-digit factor (problems written horizontally)
Division (whole numbers)
3 - Two-digit dividend; one-digit divisor; one-digit quotient; no remainder
4
Multiplication (whole numbers)
3 - Three-digit factor times one-digit factor - Three-digit factor times one-digit factor with zero in tens column - Three-digit factor times one-digit factor with horizontal alignment
Division (whole numbers)
4
- Three-digit dividend; one-digit divisor; no remainder - Three-digit dividend; one-digit divisor; remainder - Two-digit dividend; one-digit divisor; two-digit quotient; no remainder - Two-digit dividend; one-digit divisor; two-digit quotient; remainder
Addition (fractions) 2 - Adding fractions with like denominators
Subtraction (fractions) 2 - Subtracting fractions with like denominators
Addition (decimals) 2
- Adding tenths, hundredths and whole number - Adding tenths and two whole numbers
Subtraction (decimals) 2
- Subtracting tenths from whole number - Subtracting hundredths from whole number
5
Division (whole numbers)
4 - Two-digit divisor; one-digit quotient - Two-digit divisor; two-digit quotient
Addition (fractions) 3
- Adding two fractions with different denominators - Adding two fractions with reducing and converting to mixed numbers - Adding three fractions with different denominators, reducing, and converting to mixed numbers
Subtraction (fractions) 3
- Subtracting mixed numbers from whole number - Subtracting fractions with mixed numbers - Subtracting fractions with different denominators, mixed numbers and reducing
Multiplication (decimals) 2
- Multiplying decimals; one-digit factor times three-digit factor - Multiplying decimals; zero to be placed after decimal point
Division (decimals) 3
- Whole number divisor; no remainder - Divisor is decimal; adding zeros in dividend required - Divisor is decimal, no adding zeros in dividend necessary

General Outcome Measures in Mathematics – Page 4
6
Multiplication (fractions) 2 - Multiplying mixed numbers
Division (fractions) 6
- Dividing fractions - Dividing fractions by whole numbers - Dividing mixed numbers by whole numbers
Multiplication (decimals) 2 - Multiplying decimals; two digit factor times three digit factor
Division (decimals) 5
- Dividing decimals by whole number; quotient begins with zero (2) - Whole number divisor; zeros must be added to dividend after decimal point (3)
7
Addition (integers) 4
- Adding integers; two three-digit numbers - Adding integers; three two-digit numbers - Adding integers; four numbers - Adding integers; four-digit numbers
Subtraction (integers) 4
- Subtracting integers; three-digit number from a three-digit number - Subtracting integers; two-digit number from a three-digit number - Subtracting integers: four-digit number from a four-digit number - Subtracting integers: two-digit number from a three-digit number, zero in tens column
Multiplication (integers) 4
- Multiplying integers: two-digit factor times two-digit factor - Multiplying integers: two-digit factor times three-digit factor - Multiplying integers: three-digit factor times three-digit factor - Multiplying integers: three-digit factor times three-digit factor; zero in tens factor column of multiplier
Division (integers) 3
- Dividing integers: three-digit dividend; three-digit quotient - Dividing integers: four-digit quotient; one-digit divisor; four-digit dividend - Dividing integers: two-digit divisor; one digit quotient
8
Computation (whole numbers)
4
- Adding three four-digit numbers - Subtracting five-digit number form five-digit number - Three-digit factor times three-digit factor - Five-digit dividend; two-digit divisor; three-digit quotient; no remainder
Computation (decimals) 4
- Adding hundredths and tenths - Subtracting hundredths from hundredths - Multiplying decimals; three-digit factor times three-digit factor - Whole number divisor; no remainder
Computation (fractions) 4
- Adding three fractions with different denominators - Subtracting mixed number from whole number - Mixed number times whole number - Dividing fractions
Computation (integers) 3
- Subtraction with three integers - Multiplication with three integers - Four-digit dividend; two-digit divisor; three-digit quotient
Each item had four answer options with one correct answer and three distractors. The
distractors represented possible student errors. To find student error patterns, the item writer
referenced the book, Designing Effective Mathematics Instruction: A direct instruction approach
(Stein, Silbert, & Carnine, 1997). In addition, to keep students from determining the answer
based on position in the choices, the item writer randomly placed the correct answer choices,
with four in the first position, four in the second position, four in the third position, and three in
the fourth position.

General Outcome Measures in Mathematics – Page 5
Design and Operational Procedures
After the item writer created the measures, a BRT staff member reviewed the measures to
evaluate them for grade-level appropriateness and adherence to test specifications.
Internal Review
Qualifications of the internal reviewer. The internal reviewer was a third year Ph.D.
student in Special Education at the University of Oregon. She had an elementary teacher
certificate for grades 1 to 6 and finished her licensure training for special education teachers. The
internal reviewer worked as an ESL teacher for two years, during which time she helped
developed a reading curriculum for ESL students. She also worked as an elementary school
teacher for two years and a freelance curriculum developer for six months.
Internal review procedures and results. The internal reviewer first examined the test
items’ adherence to the test specifications provided by the instrument developing team. The
reviewer claimed that the division problem format was not familiar to students, and suggested a
change to an appropriate format. Additionally, she suggested changing several answer choices
for common student errors. Finally the reviewer indicated the need for numerals to be aligned by
place-value in computation problems in order to avoid students’ confusion.
The item writer revised the measures and incorporated the suggestions into the measures.
She changed the division format to what students are familiar with (for example, 9423 ). In
addition, the item writer revised the answer choices according to the internal reviewer’s
suggestions. Finally, she rearranged the column line of the test items.

General Outcome Measures in Mathematics – Page 6
External Review
Six teachers from local public schools participated in reviewing the mathematics
measures. They reviewed the items for grade-level appropriateness of language and vocabulary,
content and concepts, directions, and potential bias.
Qualifications of external reviewers. The external reviewers’ teaching experiences ranged
from less than one year to 28 years. They all have Master’s degrees. The specific teachers’
backgrounds and qualifications are listed in Table 2 below.
Table 2.
Teachers’ backgrounds and qualifications.
Teacher Current teaching position Education Teaching experience
1 SpED K-5 M. Ed 17 years
2 5th grade M. Ed 2 years
3 Reading Specialist M. Ed 4 years
4 6th and 7th grade M. Ed 0.5 year
5 8th grade M. Ed 3 years
6 7th grade M. A. 17 years
External review procedures and results. Each teacher reviewed measures for one grade
level by evaluating the grade-level appropriateness and rating them according to several criteria,
including language and vocabulary, content and concepts, directions, effectiveness of distractors,
and bias. Teachers rated the test items and distractors on a scale of 1 to 4 for each criterion. A
rating of 1 meant that the items were not at all appropriate in relation to the criterion; a rating of
2 meant that the items were somewhat appropriate in relation to the criterion; a rating of 3 meant

General Outcome Measures in Mathematics – Page 7
that the items were sufficiently appropriate in relation to the criterion; and a rating of 4 meant
that the items were extremely appropriate in relation to the criterion. Teachers were also asked to
provide additional suggestions and comments regarding the measures.
Teacher reviewers provided similar suggestions to the internal reviewer. First, they
pointed out that the division format needed to be changed to what students are familiar with.
Second, they gave specific suggestions for answer choices for common student errors. Finally,
one of the teacher reviewers indicated the column problems needed proper alignment. After
receiving teachers’ feedback on the measures, the item writer revised the distractors, fixed the
division problem format, and rearranged the column line based on the internal reviewer’s
suggestions.
To finalize the revision process, the item writer conducted a final review of all measures
prior to implementing the items in the pilot testing. She evaluated alignment of measures with
the test specifications and the appropriateness of content for the target grade level audience.
From this procedure, she found that a couple of items did not have correct answers among the
answer choices and immediately revised those items.
Results
The parameter files reported the intercepts, slopes and item difficulty for each item.
These numbers helped in calculating the likelihood of examinees of different skill levels
answering the test item correctly. The BILOG-MG excluded Item 10 of the Grade 4 measure
and Item 14 of the Grade 5 measure for the item calibration, because these two items were
negatively correlated with the rest of the test items in that particular grade. The authors
recommended reviewing these two test items.

General Outcome Measures in Mathematics – Page 8
Pilot Testing Findings
To evaluate the technical adequacy of the GOM Mathematics measures, three different
models of estimating item difficulty were compared: 1) the Classical Test Theory (CTT) Model,
2) the Rasch Model (1 PL model), and 3) the Two-parameter logistic model (2PL model).
CTT model. The authors calculated the p-value or “proportion passing” of all valid
responses. The p-value is the estimate of item difficulty of each item under Classical Test Theory
(CTT) (Embretson & Reise, 2000). In this study, the authors calculated the percentage of valid
responses that were correct. For example, there were 206 seventh grade students assigned to
take the GOM Mathematics measures. For Item 10 in Grade 7, twenty of the students did not
answer the question; 93 of the students gave the correct answer and 93 of students gave an
incorrect answer. The p-value of Item 10 in the Grade 7 measure is .5 (93 ÷ 186= .5).
The results indicated that the Grade 3 measures had the narrowest range (.63 - .88) of p-
value and Grade 5 had the widest range (.05 -.77). The p-value of items for Grades 3-8 is shown
in Appendix B. However, the p-values were not optimal estimates of respondents’ trait levels,
because the estimates of item difficulties under the CTT model are “population dependent.” In
other words, given the same items, the more skillful group will have lower estimates of item
difficulties, whereas the less skillful group will have higher estimates of item difficulties
(Embretson & Reise, 2000).
IRT models. The goal of assessment is exact estimation of the students’ abilities.
However, under the CTT model, the same item could be considered an easy or a difficult one
according to the characteristics of the examinees’ group. To the contrary, IRT provides both
invariant item statistics and ability estimates. That is, there is no difference between item
parameter estimates even though the data from two groups which have different characteristics

General Outcome Measures in Mathematics – Page 9
are analyzed. In IRT, we can estimate the examinee’s ability regardless of the difficulty of the
test.
In this context, the authors opted to use the IRT model to obtain the estimates of item
difficulties and respondents’ trait levels. Specifically, in the CTT model, the true scores only
applied to a specific set of items or their equivalent; item difficulty is influenced by the
respondents’ overall skill levels; the item difficulty and respondent’s trait levels could not be
estimated separately (Embretson & Reise, 2000).
Rasch model. The Rasch model predicts the probability of respondents’ giving correct
responses from two independent variables (a respondent’s trait level and an item difficulty). IRT
models place the trait level and item difficulty at the same scale. When the item difficulty
matches the trait level, the respondent has a 50-50 chance to answer that item correctly.
IRT models require two basic assumptions. The first assumption is that the item
characteristic curve specified by an IRT model must fit the test data. Under the Rasch model, the
values of outfit mean squares of responses in all but the three problematic items (Grade 3, item 1;
Grade 5, item 14; Grade 7, item 7) stay within the productive range (0.5 - 1.5) (see Appendices C
and F). This implies that the Rasch model fit the test data fairly well. This first assumption is
met.
The second assumption is local independence. Local independence means that item
parameters and person parameters fully account for interrelationships between items and persons.
No other factors will influence the interrelationship between items and persons. The authors did
not find evidence of violation of the second assumption as suggested in Yen’s (1993) examples.
Yen suggested local dependence could occur when (1) the respondent’s speed is a factor in their
performance, (2) there is differential exposure of the test items (e.g. unfamiliar vocabulary for

General Outcome Measures in Mathematics – Page 10
English language learners) or (3) the test items are chained together (so that answering one item
influences the answers of other items). GOM Mathematics measures are not timed tests. The
test items were not chained together. However we did not gather information about the
participants’ disability, English language learning, and SES status. We did not know whether
these extraneous factors would play into the interaction of persons and items. So the second
assumption is tentatively assumed not violated.
When the two required assumptions of IRT models are met and items are calibrated
appropriately following the IRT calibration procedures, “item invariance” and “person
invariance” under the chosen IRT model can be assumed (Embretson & Reise, 2000). “Item
invariance” means that, when items were calibrated appropriately, the person’s trait level can
remain stable, regardless of which items from the item bank were given. “Person invariance”
means that the item difficulty will remain unchanged, independent of the respondents’ ability
levels. Because of “item invariance” and “person invariance,” the comparison across persons
with different trait levels using different subtests from the same well-calibrated item bank, under
an appropriate IRT model, is meaningful. That is a significant advantage of using IRT models
over CTT models to estimate item difficulties.
Under the IRT models, the item difficulties and participants’ trait levels (abilities) were
placed on the same scale. The items provide the most informative estimates on the respondents’
trait levels when items are “on target,” or the distance between the person’s estimated trait level
and item difficulty of the selected item was short. When the items were “on target,” the
measurement errors were relatively small. Therefore, the estimates were more accurate than the
extreme scores. Providing items with a wide range of item difficulty increased the likelihood of
having items that are on target for respondents’ trait levels.

General Outcome Measures in Mathematics – Page 11
According to the WINSTEPS Help Manual, the items that have outfit means squares
between .5 and 1.5 are considered productive measurement, because they generated predictable
response patterns in which the students who gave correct answers were more skillful than their
counterparts were. The value of outfit mean squares exceeding 2.0 means that “off-variable
noises are greater than useful information.” The measurement can be degraded. The value of
outfit mean squares between 1.5 and 2.0 means there is noticeable off-variable noises. Although
it does not necessarily degrade the measurement, it did not construct the measurement either.
In the GOM Mathematics, all but three test items are considered “productive
measurements.” Two items (Grade 5, item 14; and Grade 7, item 7) had the value of outfit mean
squares exceeding 1.5; one item (Grade 3, item 1) had the value of outfit mean square exceeding
2.0. The first problematic item in the Grade 3 measure was an addition problem with regrouping.
(483 + 371 = ______). The question was presented in the column format. The value of outfit
mean square exceeds 2.0 suggesting that off-variable noises are greater than useful information.
The statistics in the item analysis (Appendix F) indicated that there were 192 students (88% of
sample population) who chose the correct answer. The variance of trait levels of the students
who answered correctly was narrow (Standard error mean for the trait level for students who
chose the correct answer was 1.14). There were 25 students (12% of sample population)
choosing distractors. The variances of trait levels between these 25 students were wide (Standard
error means of trait level for the students who chose these three distractors were 7.78, 5.70 and
5.53). The item analysis suggested there is an unstable or unpredictable response pattern that
was associated with this test item. While the overwhelming majority (88% of the students)
answered the question correctly, some very skillful respondents unexpectedly missed this
relatively easy question.
General Outcome Measures in Mathematics – Page 12
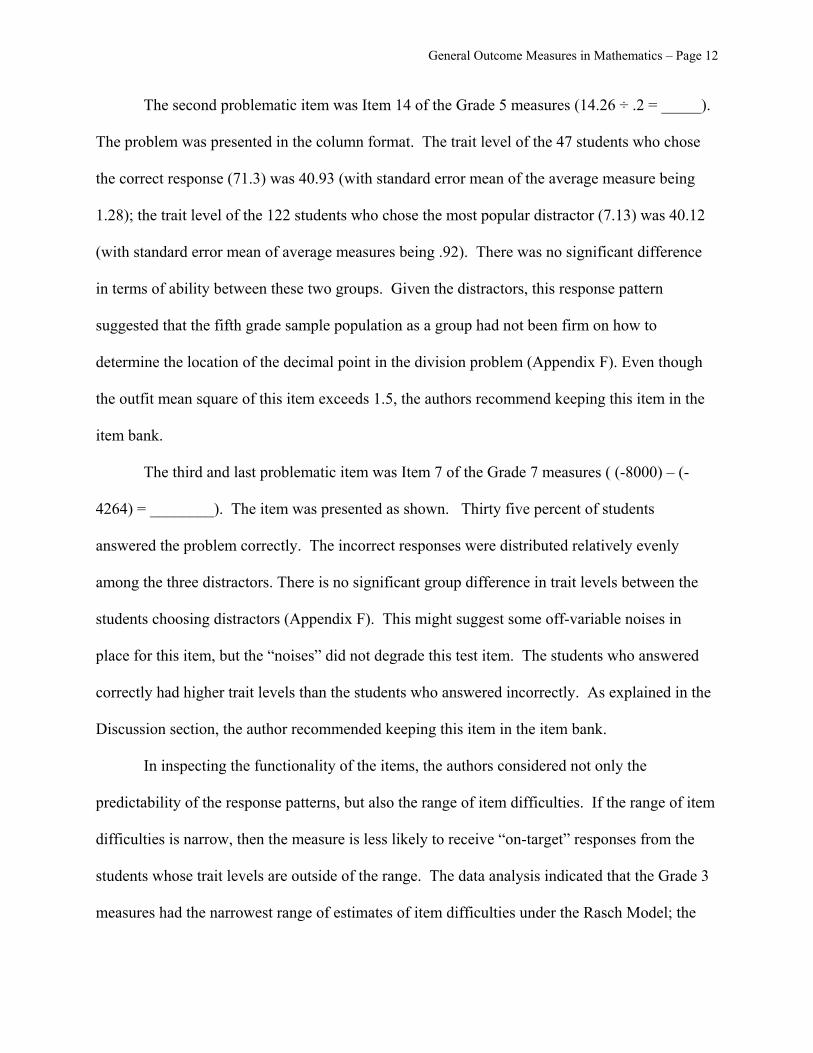
The second problematic item was Item 14 of the Grade 5 measures (14.26 ÷ .2 = _____).
The problem was presented in the column format. The trait level of the 47 students who chose
the correct response (71.3) was 40.93 (with standard error mean of the average measure being
1.28); the trait level of the 122 students who chose the most popular distractor (7.13) was 40.12
(with standard error mean of average measures being .92). There was no significant difference
in terms of ability between these two groups. Given the distractors, this response pattern
suggested that the fifth grade sample population as a group had not been firm on how to
determine the location of the decimal point in the division problem (Appendix F). Even though
the outfit mean square of this item exceeds 1.5, the authors recommend keeping this item in the
item bank.
The third and last problematic item was Item 7 of the Grade 7 measures ( (-8000) – (-
4264) = ________). The item was presented as shown. Thirty five percent of students
answered the problem correctly. The incorrect responses were distributed relatively evenly
among the three distractors. There is no significant group difference in trait levels between the
students choosing distractors (Appendix F). This might suggest some off-variable noises in
place for this item, but the “noises” did not degrade this test item. The students who answered
correctly had higher trait levels than the students who answered incorrectly. As explained in the
Discussion section, the author recommended keeping this item in the item bank.
In inspecting the functionality of the items, the authors considered not only the
predictability of the response patterns, but also the range of item difficulties. If the range of item
difficulties is narrow, then the measure is less likely to receive “on-target” responses from the
students whose trait levels are outside of the range. The data analysis indicated that the Grade 3
measures had the narrowest range of estimates of item difficulties under the Rasch Model; the

General Outcome Measures in Mathematics – Page 13
Grade 5 measures had the widest range of estimates of item difficulties. However, the authors
advised against comparing estimates of item difficulty across the grade levels because no proper
vertical scaling procedure was included in the item writing phase.
With the exception of three problematic items, all items in the GOM Mathematics
measures are considered productive measures. The data fit the Rasch model well; the raw score
is a sufficient estimate of students’ scale score.
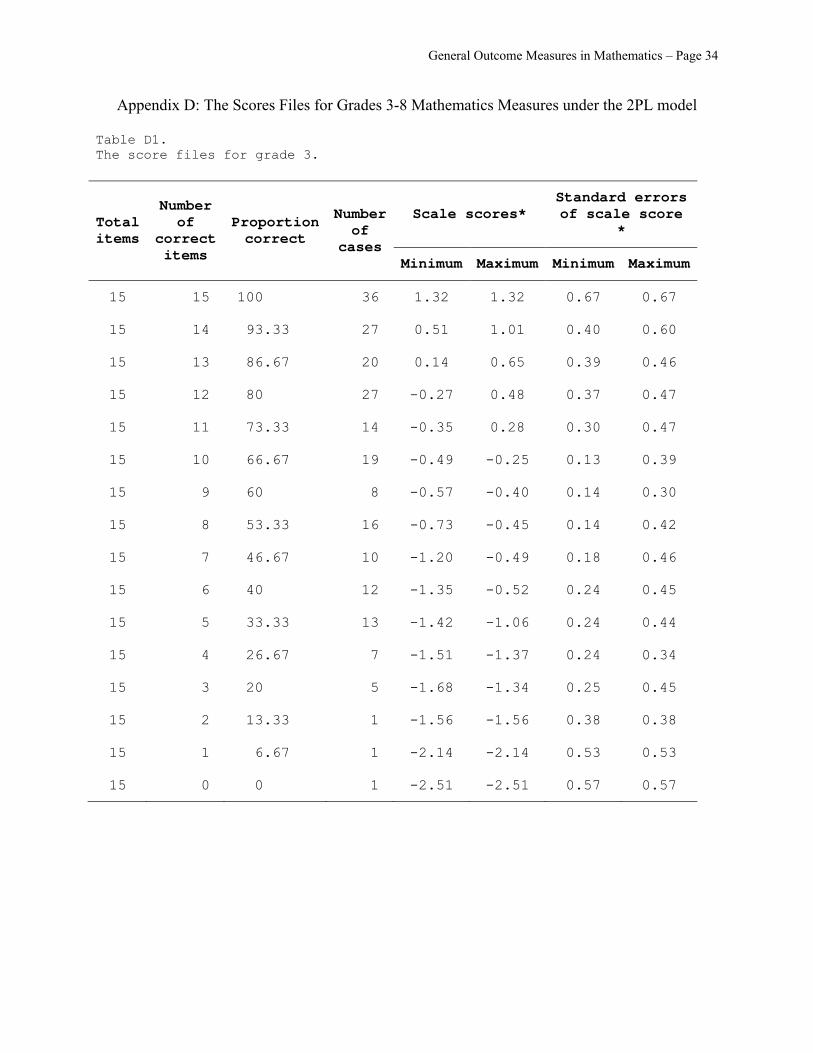
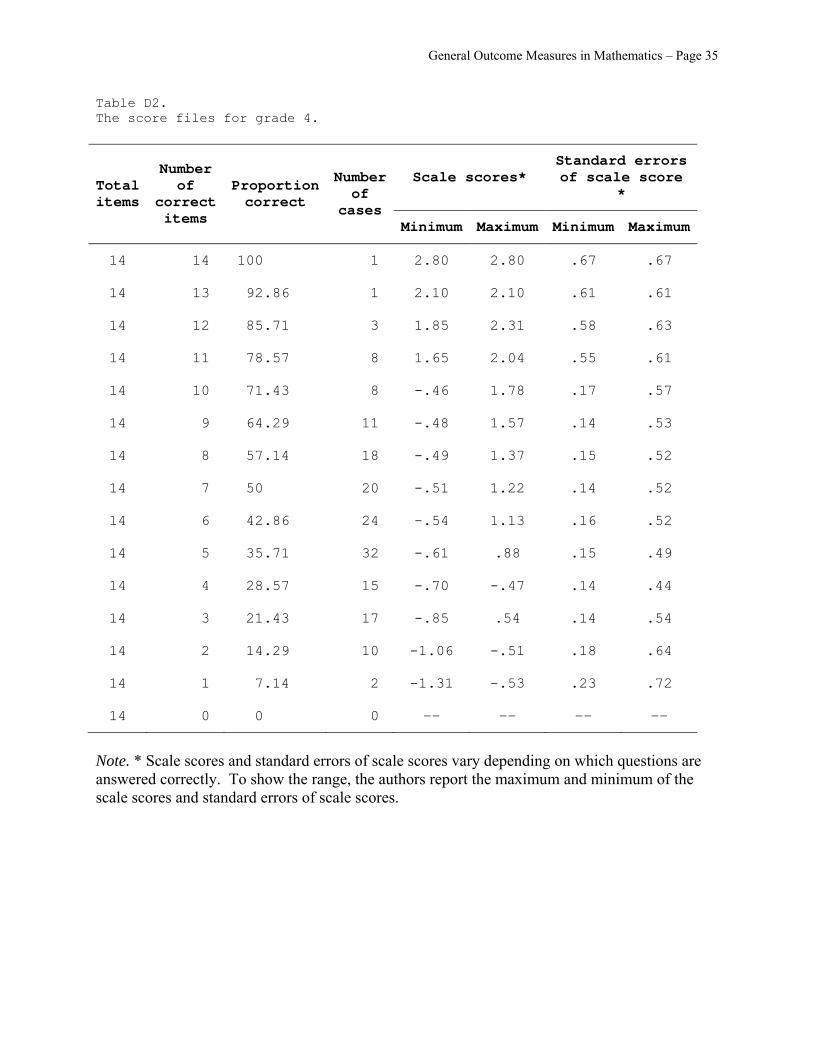
Two-parameter logistic model. The authors obtained the estimates of item difficulty and
item discrimination for each item under the 2PL model using BILOG-MG software. The scores
files under the 2PL model generated by BILOG-MG can be found in Appendix D. The scores
files reported the minimum and maximum of the scale scores as well as the minimum and
maximum of the standard errors of scale scores. They also report the distribution of scores
across different scores brackets. When there is only one case within a particular score bracket,
the minimum and maximum of scale scores are identical. The standard errors of the extreme
scores are larger than the standard errors of average scores.
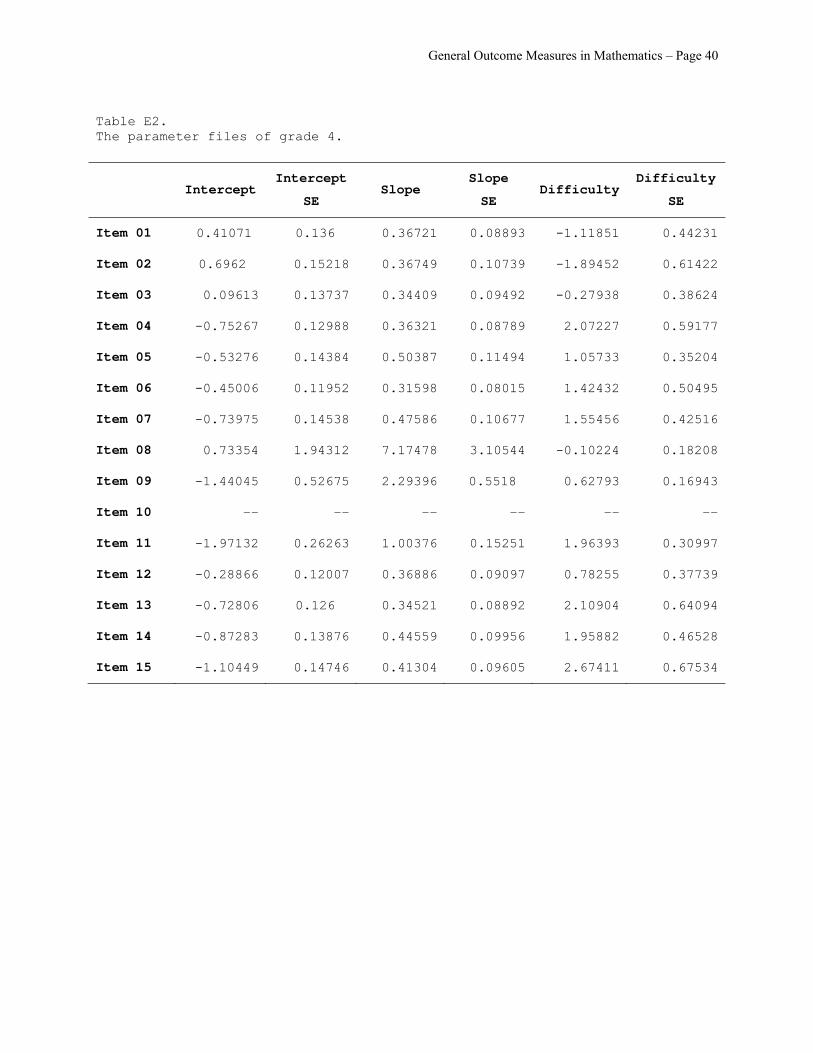
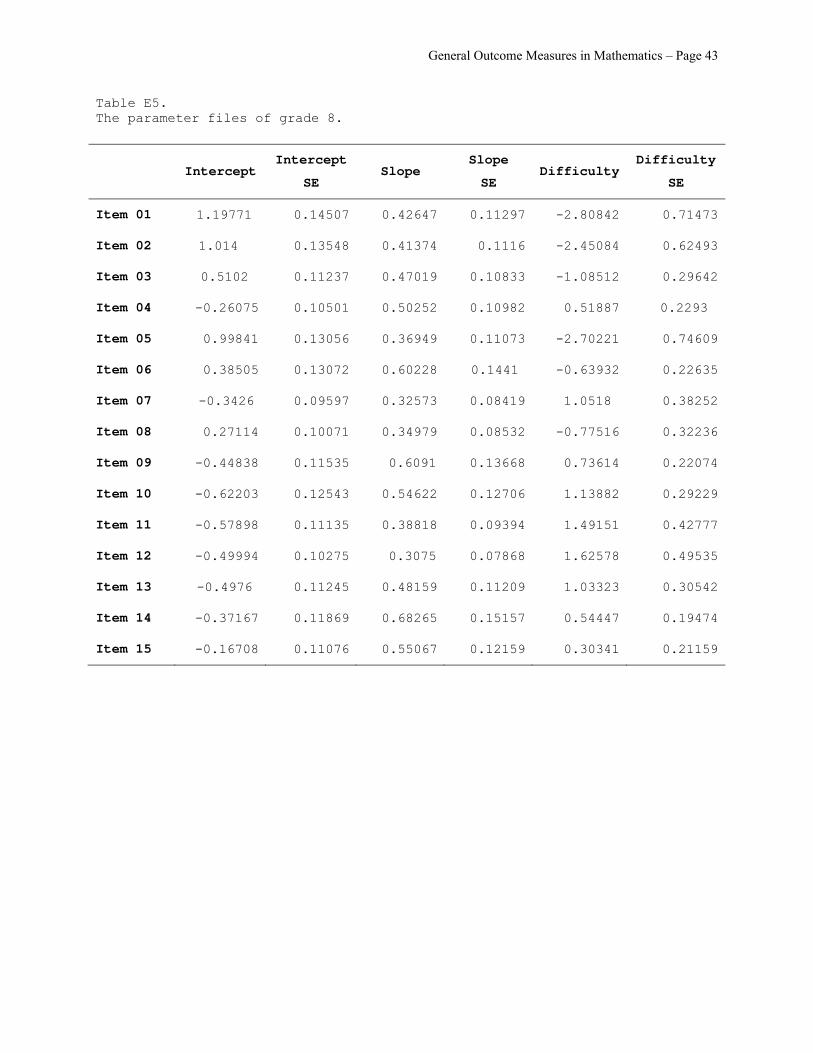
Appendix E is the parameter files under the 2PL model. The parameter files reported the
intercepts, slopes and item difficulty for each test item as well as the standard errors of the
intercepts, slopes and item difficulty.
We do not report the scores files and parameter scores for the Grade 7 measures because
the data would not converge. Inspecting the distribution of the scores for the measures in Grades
3, 4, 5, 6 and 8, we found the distributions were normal with the exception of the Grade 3
measure.
The authors inspected the scale scores and item characteristics of each item. The Rasch
model constrains the slopes to be identical (slope =1) for all items. The 2PL models tested the

General Outcome Measures in Mathematics – Page 14
assumption of the Rasch model. The review of parameter models in Appendix E indicated that
the Rasch assumption was not true; there were variances among slopes. For example, two test
items in Grade 4 measures had very steep slopes. The score files under the 2PL model attempt to
give more precise estimates of scale scores via raw scores.
The estimated scale scores and standard errors of scale scores vary depending on which
items the examinee answered correctly. For example, 184 students took the Grade 8 measure.
Thirty of the examinees answered eight of the fifteen test items correctly. Under the CTT model,
these students would receive identical scores (i.e., the p-value, 53.33% correct). Under the 1PL
model, although the likelihood of students answering each item correctly varies, the students’
raw scores were used as the robust indicators of scale scores. These 30 students would receive
similar scale scores. However, under the 2PL model, these students’ scale scores falls within the
range of .02 and .81 with the standard errors between .59 and .71. The variance in the scale
scores is rooted in the different answer patterns. The person who missed the easier half and the
person who missed the more difficult half of the questions would have two very different scale
scores. Moreover, the students with average skill levels who missed a very simple question
could render a less stable pattern and, therefore, the standard errors of his or her scale score
would be larger than the examinees who have predicable response patterns. The estimates under
the 2PL model are more useful than the single scores provided under the 1PL model.
Final Item Selection
Finally, for each grade 10 items out of 15 were selected. We tried to represent a range of
difficulty levels and a range of content covered. In instances where items did not fit into the
difficulty range specified, a balance between easy, medium, and difficult items was attempted.
Final items’ specific task type and item difficulty level were specified in Table 3 below.

General Outcome Measures in Mathematics – Page 15
Table 3.
Specific task type and item difficulty for final grade 3 measure.
Item number
Item difficulty
level Specific task type
2 -2.01 - Adding two three-digit numbers with renaming from ones to tens and tens to hundreds
12 -1.23 - One-digit factor times two-digit factor (problems written horizontally)
4 -0.95 - Adding four numbers with renaming from ones to tens and from tens to hundreds (sums of columns below 20)
14 -0.91 - Two-digit dividend; one-digit divisor; one-digit quotient; no remainder
10 -0.87 - One-digit factor times two-digit factor with no carrying
9 -0.64 - Subtracting a three-digit number from a four-digit number with renaming from thousands to hundreds
8 -0.60 - Subtracting a four-digit number from a four-digit number with renaming from thousands to hundreds
7 -0.59 - Subtracting a three-digit number from a three-digit number, zero in tens column with renaming from tens to ones and hundreds to tens
6 -0.41
- Subtracting a three-digit number from a three-digit number with renaming from tens to ones and hundreds to tens
13 -0.24 - Two-digit dividend; one-digit divisor; one-digit quotient; no remainder

General Outcome Measures in Mathematics – Page 16
Table 4.
Specific task type and item difficulty for final grade 4 measure.
Item number
Item difficulty
level Specific task type
2 -1.89 - Three-digit factor times one-digit factor with zero in tens column
3 -0.28 - Three-digit factor times one-digit factor with horizontal alignment
8 -0.10 - Adding fractions with like denominators
9 0.63 - Adding fractions with like denominators
12 0.78
-Adding tenths, hundredths and whole number
5 1.06 - Three-digit dividend; one-digit divisor; remainder
7 1.55 -Two-digit dividend; one-digit divisor; two-digit quotient; remainder
11 1.96 -Subtracting fractions with like denominators
14 1.96 - Subtracting tenths from whole number
15 2.67 - Subtracting hundredths from whole number

General Outcome Measures in Mathematics – Page 17
Table 5.
Specific task type and item difficulty for final grade 5 measure.
Item number
Item difficulty
level Specific task type
11 -1.99 - Multiplying decimals; one-digit factor times three-digit factor
1 -0.67 - Two-digit divisor; one-digit quotient
12 -0.12 - Whole number divisor; no remainder
15 0.06 - Multiplying decimals; zero to be placed after decimal point
3 0.30 - Two-digit divisor; two-digit quotient
9 0.37 - Subtracting fractions with mixed numbers
13 1.12 - Divisor is decimal; adding zeros in dividend required
8 1.70 - Subtracting mixed numbers from whole number
10 2.60 - Subtracting fractions with different denominators, mixed numbers and reducing
5 3.25 - Adding two fractions with different denominators

General Outcome Measures in Mathematics – Page 18
Table 6.
Specific task type and item difficulty for final grade 6 measure.
Item number
Item difficulty
level Specific task type
13 -3.06 - Whole number divisor; zeros must be added to dividend after decimal point
14 -1.73 - Whole number divisor; zeros must be added to dividend after decimal point
10 -0.76 - Multiplying decimals; two digit factor times three digit factor
7 -0.01 - Dividing mixed numbers by whole numbers
11 0.15 - Dividing decimals by whole number; quotient begins with zero
3 0.41 - Dividing fractions
15 0.85 - Whole number divisor; zeros must be added to dividend after decimal point
6 1.15 - Dividing fractions by whole numbers
1 1.77 - Multiplying mixed numbers
12 2.02 - Dividing decimals by whole number; quotient begins with zero
General Outcome Measures in Mathematics – Page 19
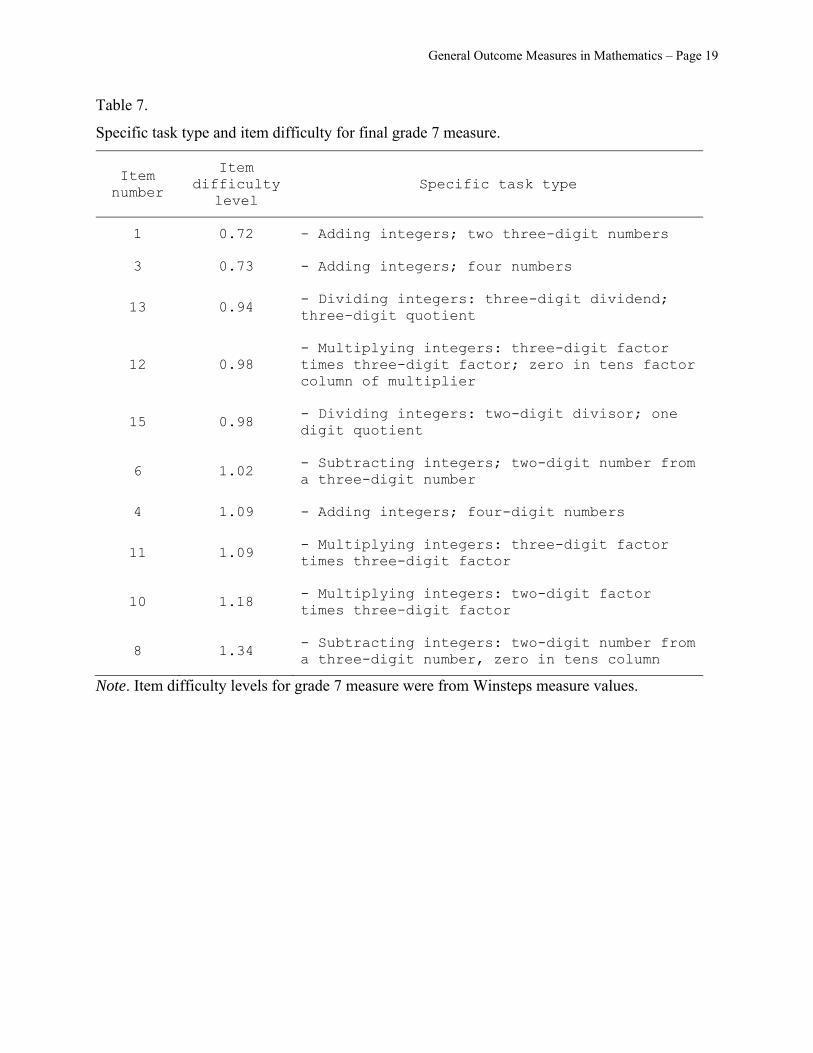
Table 7.
Specific task type and item difficulty for final grade 7 measure.
Item number
Item difficulty
level Specific task type
1 0.72 - Adding integers; two three-digit numbers
3 0.73 - Adding integers; four numbers
13 0.94 - Dividing integers: three-digit dividend; three-digit quotient
12 0.98 - Multiplying integers: three-digit factor times three-digit factor; zero in tens factor column of multiplier
15 0.98 - Dividing integers: two-digit divisor; one digit quotient
6 1.02 - Subtracting integers; two-digit number from a three-digit number
4 1.09 - Adding integers; four-digit numbers
11 1.09 - Multiplying integers: three-digit factor times three-digit factor
10 1.18 - Multiplying integers: two-digit factor times three-digit factor
8 1.34 - Subtracting integers: two-digit number from a three-digit number, zero in tens column
Note. Item difficulty levels for grade 7 measure were from Winsteps measure values.

General Outcome Measures in Mathematics – Page 20
Table 8.
Specific task type and item difficulty for final grade 8 measure.
Item number
Item difficulty
level Specific task type
5 -2.70 - Adding hundredths and tenths
3 -1.09 - Three-digit factor times three-digit factor
8 -0.78 - Whole number divisor; no remainder
15 0.30 - Four-digit dividend; two-digit divisor; three-digit quotient
14 0.54 - Multiplication with three integers
9 0.74 - Adding three fractions with different denominators
7 1.05 - Multiplying decimals; three-digit factor times three-digit factor
10 1.14 - Subtracting mixed number from whole number
11 1.49 - Mixed number times whole number
12 1.63 - Dividing fractions

General Outcome Measures in Mathematics – Page 21
Discussion
The GOM Mathematics is a set of M-CBM measures to assess computation proficiency
for students in grades 3 to 8. Fifteen items per grade were developed and each item was a
multiple-choice question with one correct answer and three distracters. The authors compared
three different models of analyzing students’ response patterns on pilot testing. The CTT model
provided the narrowest (Grade 3) and the widest (Grade 5) range of p-value. However,
considering that the CTT model is population dependent, the authors additionally selected IRT
models for this pilot testing analysis. The Rasch model analysis found that all items, except three
problematic items (Grade 3, item 1; Grade 5, item 14; Grade 7, item 7), were appropriate items
for each grade level. Finally, the authors examined the estimates of item difficulty and item
discrimination under the 2PL model. Based on a range of difficulty levels and a range of content
coverage, for each grade 10 items out of the initial 15 items were selected.

General Outcome Measures in Mathematics – Page 22
References
Deno, S. L. (1985). Curriculum-based measurement: The emerging alternative. Exceptional
Children, 52, 219-232.
Embertson, S. E., & Reise, S.P. (2000). The new rules of measurement. Item Response Theory
for Psychologist. Mahwah, NJ. : Lawrence Erlbaum Associates.
Shinn, M. R. (1989). Curriculum-based measurement: Assessing special children. New York:
Guilford.
Shinn, M. R. (Ed.). (1998). Advanced applications of curriculum-based measurement. New
York: Guilford.
Stecker, P. M., & Fuchs, L. S. (2000). Effecting superior achievement using curriculum-based
measurement: The importance of individual progress monitoring. Learning Disabilities
Research and Practice, 15 (3), 128-134.
Stein, M., Silbert, J., & Carnine, D. (1997), Designing Effective Mathematics Instruction: A
direct instruction approach. Columbus, OH: Merrill.
Thurber, R. S., Shinn, M. R., & Smolkowski, K. (2002). What is measured in mathematics test?
Construct validity of curriculum-based mathematics measures. School Psychology
Review, 31, 498-513.
Tindal, G., Marston, D., & Deno, S. (1983). The reliability of direct and repeated measurement
(Research Report No. 109). Minneapolis, MN: University of Minnesota Institute for
Research on Learning Disabilities.
Yen, W. M. (1993). Scaling performance assessments: Strategies for managing
local item dependence. Journal of Educational Measurement, 30, 187-213.
General Outcome Measures in Mathematics – Page 23
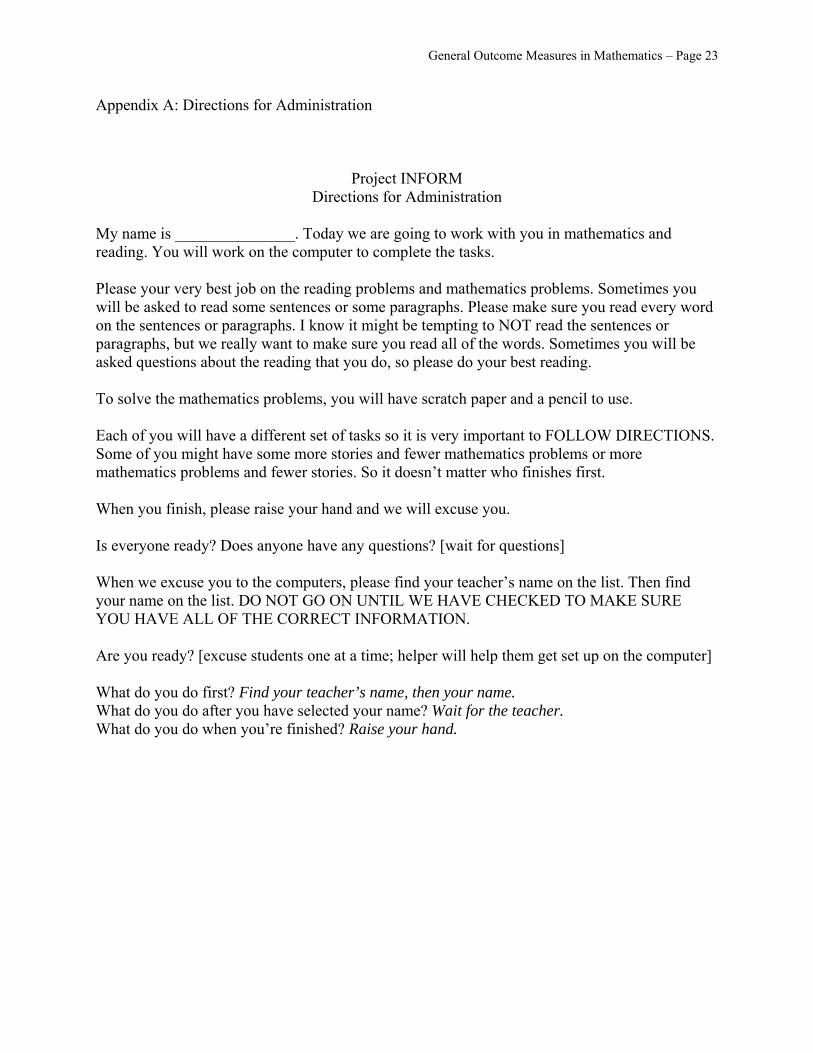
Appendix A: Directions for Administration
Project INFORM Directions for Administration
My name is _______________. Today we are going to work with you in mathematics and reading. You will work on the computer to complete the tasks. Please your very best job on the reading problems and mathematics problems. Sometimes you will be asked to read some sentences or some paragraphs. Please make sure you read every word on the sentences or paragraphs. I know it might be tempting to NOT read the sentences or paragraphs, but we really want to make sure you read all of the words. Sometimes you will be asked questions about the reading that you do, so please do your best reading. To solve the mathematics problems, you will have scratch paper and a pencil to use. Each of you will have a different set of tasks so it is very important to FOLLOW DIRECTIONS. Some of you might have some more stories and fewer mathematics problems or more mathematics problems and fewer stories. So it doesn’t matter who finishes first. When you finish, please raise your hand and we will excuse you. Is everyone ready? Does anyone have any questions? [wait for questions] When we excuse you to the computers, please find your teacher’s name on the list. Then find your name on the list. DO NOT GO ON UNTIL WE HAVE CHECKED TO MAKE SURE YOU HAVE ALL OF THE CORRECT INFORMATION. Are you ready? [excuse students one at a time; helper will help them get set up on the computer]
What do you do first? Find your teacher’s name, then your name. What do you do after you have selected your name? Wait for the teacher. What do you do when you’re finished? Raise your hand.

General Outcome Measures in Mathematics – Page 24
Appendix B: Estimates of item difficulty under Classical Test Theory (CTT) model
“Valid Percent” is the percentage of valid response that is the correct answer. The valid percent
is the estimates of item difficulty under the CTT model. The estimates under the CTT model are
“population dependent.” The “valid percent” gathered from a more skilled group is usually
higher than the valid percent gathered from a less skill group.

General Outcome Measures in Mathematics – Page 25
Table B1. Estimates of item difficulty for grade 3. Measure 1 2 3 4 5 6 7 8 9 10 11 12 13 14 15
Correct 192 181 175 154 140 139 147 149 149 158 141 155 136 142 141
Incorrect 25 36 42 63 77 78 70 68 68 59 76 62 81 75 76
Valid 217 217 217 217 217 217 217 217 217 217 217 217 217 217 217
Missing 22 22 22 22 22 22 22 22 22 22 22 22 22 22 22
Valid percent .88 .83 .81 .71 .65 .64 .68 .69 .69 .73 .65 .71 .63 .65 .65
Table B2. Estimates of item difficulty for grade 4. Measure 1 2 3 4 5 6 7 8 9 10 11 12 13 14 15
Correct 123 133 114 59 83 75 63 53 63 31 42 81 64 55 127
Incorrect 47 37 56 111 87 95 107 117 107 139 128 89 10 89 43
Valid 170 170 170 170 170 170 170 170 170 170 170 170 170 144 170
Missing 15 15 15 15 15 15 15 15 15 15 15 15 15 41 15
Valid percent .72 .78 .67 .35 .49 .44 .37 .31 .37 .23 .25 .48 .38 .38 .25

General Outcome Measures in Mathematics – Page 26
Table B3. Estimates of item difficulty for grade 5. Measure 1 2 3 4 5 6 7 8 9 10 11 12 13 14 15
Correct 160 153 117 81 14 13 28 69 114 24 181 131 85 47 80
Incorrect 95 102 138 174 241 242 227 186 141 231 74 124 170 208 175
Valid 255 255 255 255 255 255 255 255 255 255 255 255 255 255 255
Missing 18 18 18 18 18 18 18 18 18 18 18 18 18 18 18
Valid percent .63 .60 .46 .32 .05 .05 .11 .27 .45 .09 .71 .51 .33 .18 .31
Table B4. Estimates of item difficulty for grade 6. Measure 1 2 3 4 5 6 7 8 9 10 11 12 13 14 15
Correct 25 30 69 33 70 57 88 76 99 99 67 64 128 138 63
Incorrect 141 136 97 133 96 109 78 90 67 67 99 102 38 28 103
Valid 166 166 166 166 166 166 166 166 166 166 166 166 166 166 166
Missing 37 37 37 37 37 37 37 37 37 37 37 37 37 37 37
Valid percent .15 .18 .42 .20 .42 .34 .53 .46 .60 .60 .40 .39 .77 .83 .38

General Outcome Measures in Mathematics – Page 27
Table B5. Estimates of item difficulty for grade 7. Measure 1 2 3 4 5 6 7 8 9 10 11 12 13 14 15
Correct 114 96 98 78 55 63 83 48 78 93 79 84 83 91 115
Incorrect 72 90 88 108 131 123 103 138 108 93 107 101 102 94 70
Valid 186 186 186 186 186 186 186 186 186 186 186 185 185 185 185
Missing 20 20 20 20 20 20 20 20 20 20 20 21 21 21 21
Valid percent .61 .52 .53 .42 .30 .34 .45 .26 .42 .50 .42 .45 .45 .51 .38
Table B6. Estimates of item difficulty for grade 8. Measure 1 2 3 4 5 6 7 8 9 10 11 12 13 14 15
Correct 158 149 125 76 147 123 65 109 62 53 49 55 60 70 82
Incorrect 26 35 59 108 37 61 119 74 122 131 134 128 122 112 100
Valid 184 184 184 184 184 184 184 183 184 184 183 183 182 182 182
Missing 28 28 28 28 28 28 28 29 28 28 29 29 30 30 30
Valid percent .86 .81 .68 .41 .80 .67 .35 .60 .34 .29 .27 .30 .33 .38 .45

General Outcome Measures in Mathematics – Page 28
Appendix C: Estimates of Item Difficulty Under Rasch Model Table C1. Estimates of item difficulty for grade 3.
Entry Measure Count Score OUT.MSQ OUT.ZSTD PTME OBSMATCH EXPMATCH
1 34.77 180 156 2.36 3.14 0.3 87.80 87.10
2 40.23 180 145 1.48 1.81 0.39 80.60 82.10
3 42.73 180 139 1.08 0.45 0.44 82.20 79.60
4 50.17 180 118 1.18 1.28 0.48 69.40 74.60
5 54.53 180 104 1.03 0.33 0.55 71.70 72.80
6 54.84 180 103 0.78 -2.10 0.66 82.20 72.70
7 52.38 180 111 0.82 -1.46 0.62 80.00 73.50
8 51.76 180 113 0.73 -2.28 0.64 81.10 73.60
9 51.76 180 113 0.81 -1.53 0.62 80.00 73.60
10 48.86 180 122 0.89 -0.72 0.56 77.20 75.20
11 54.23 180 105 1.20 1.67 0.49 66.70 72.90
12 49.84 180 119 1.41 2.60 0.41 65.60 74.70
13 55.74 180 100 1.18 1.58 0.53 69.40 72.50
14 53.92 180 106 0.77 -2.14 0.64 77.20 73.00
15 54.23 180 105 0.90 -0.87 0.58 73.30 72.90

General Outcome Measures in Mathematics – Page 29
Table C2. Estimates of item difficulty for grade 4. Entry Measure Count Score OUT.MSQ OUT.ZSTD PTME OBSMATCH EXPMATCH
1 34.85 169 122 1.21 1.41 0.3 75.7 74.7
2 31.18 169 132 0.78 -1.24 0.43 82.2 79.2
3 37.79 169 113 0.87 -1.04 0.44 74.0 71.3
4 53.93 169 58 1.02 0.19 0.39 71.0 71.9
5 46.85 169 82 0.92 -1.00 0.46 69.8 67.2
6 49.14 169 74 1.17 1.86 0.32 58.6 67.8
7 52.69 169 62 0.92 -0.77 0.43 67.5 70.6
8 55.86 169 52 0.78 -1.87 0.56 82.2 73.9
9 52.69 169 62 0.94 -0.5 0.48 73.4 70.6
10 60.91 169 38 1.08 0.52 0.41 81.7 79.4
11 59.75 169 41 1.10 0.65 0.39 79.9 78.2
12 47.42 169 80 1.13 1.51 0.31 60.4 67.3
13 52.38 169 63 1.12 1.12 0.39 72.8 70.3
14 55.21 169 54 1.11 0.91 0.36 71.6 73.1
15 59.37 169 42 1.13 0.81 0.27 69.8 77.8

General Outcome Measures in Mathematics – Page 30
Table C3. Estimates of item difficulty for grade 5.
Entry Measure Count Score OUT.MSQ OUT.ZSTD PTME OBSMATCH EXPMATCH
1 33.52 254 160 0.93 -0.73 0.42 68.9 69.4
2 34.89 254 153 1.05 0.6 0.46 70.9 68.3
3 41.67 254 117 0.91 -1.28 0.48 72.4 66.6
4 48.76 254 81 0.81 -2.02 0.49 74.8 72.5
5 72.26 254 14 0.78 -0.48 0.32 94.9 94.5
6 73.10 254 13 0.66 -0.82 0.3 95.3 94.9
7 63.99 254 28 0.92 -0.23 0.32 90.2 89.3
8 51.42 254 69 0.97 -0.18 0.42 76.4 75.2
9 42.23 254 114 0.96 -0.49 0.42 66.5 66.9
10 65.9 254 24 1.15 0.6 0.28 91.7 90.8
11 29.13 254 181 1.1 0.91 0.27 70.1 74.1
12 39.05 254 131 1.1 1.43 0.36 66.1 66.2
13 47.92 254 85 0.97 -0.34 0.38 69.3 71.5
14 57.15 254 47 1.59 3.08 0.06 79.1 82.4
15 48.98 254 80 1.17 1.64 0.23 67.3 72.7

General Outcome Measures in Mathematics – Page 31
Table C4. Estimates of item difficulty for grade 6. Entry Measure Count Score OUT.MSQ OUT.ZSTD PTME OBSMATCH EXPMATCH
1 67.33 163 24 0.84 -0.65 0.38 84.70 85.90
2 64.79 163 29 0.83 -0.86 0.43 84.70 83.20
3 51.06 163 68 0.97 -0.32 0.40 69.30 66.30
4 63.41 163 32 0.97 -0.08 0.37 81.60 81.60
5 50.77 163 69 1.09 1.09 0.31 63.80 66.20
6 54.68 163 56 1.12 1.16 0.29 66.30 70.10
7 45.64 163 87 0.93 -0.86 0.42 64.40 65.10
8 49.05 163 75 1.08 1.02 0.33 63.80 65.20
9 42.47 163 98 0.95 -0.55 0.40 71.20 67.10
10 42.47 163 98 0.96 -0.39 0.39 67.50 67.10
11 51.65 163 66 0.94 -0.70 0.40 64.40 66.60
12 52.54 163 63 0.98 -0.23 0.39 68.10 67.60
13 32.86 163 127 1.88 4.00 0.18 76.70 78.20
14 28.44 163 137 0.80 -0.87 0.42 85.30 84.10
15 52.84 163 62 1.01 0.15 0.35 65.00 68.00

General Outcome Measures in Mathematics – Page 32
Table C5. Estimates of item difficulty for grade 7.
Entry Measure Count Score OUT.MSQ OUT.ZSTD PTME OBSMATCH EXPMATCH
1 39.89 178 107 0.72 -2 0.57 79.8 71.1
2 45.27 178 89 0.68 -2.84 0.64 82 71
3 44.67 178 91 0.73 -2.28 0.61 77.5 70.9
4 50.78 178 71 1.09 0.74 0.5 68.5 73.9
5 58.76 178 48 1.18 0.99 0.57 84.3 79.9
6 55.79 178 56 1.02 0.18 0.56 81.5 77.8
7 49.21 178 76 1.63 4.29 0.33 60.1 72.8
8 61.61 178 41 1.34 1.49 0.51 80.3 81.8
9 50.78 178 71 0.9 -0.76 0.56 76.4 73.9
10 46.17 178 86 1.18 1.4 0.47 69.7 71.3
11 50.46 178 72 1.09 0.74 0.52 74.7 73.7
12 48.72 177 77 0.98 -0.11 0.53 71.2 72.4
13 49.03 177 76 0.94 -0.41 0.54 74 72.7
14 45.67 177 87 1 0.08 0.52 70.6 71
15 53.22 177 63 0.98 -0.08 0.55 78 75.9

General Outcome Measures in Mathematics – Page 33
Table C6. Estimates of item difficulty for grade 8.
Entry Measure Count Score OUT.MSQ OUT.ZSTD PTME OBSMATCH EXPMATCH
1 29.37 183 157 1.34 1.29 0.26 86.3 86
2 33.37 183 148 1.03 0.22 0.31 80.9 81.5
3 41.45 183 124 1.00 0.05 0.38 72.7 71.5
4 54.73 183 75 1.03 0.35 0.41 69.4 69.3
5 34.15 183 146 0.86 -0.70 0.35 79.8 80.6
6 42.04 183 122 0.84 -1.38 0.48 77 71
7 57.82 183 64 1.05 0.46 0.37 68.3 71.9
8 45.77 182 108 1.17 1.66 0.32 64.8 68.3
9 58.69 183 61 0.86 -1.31 0.48 73.2 72.6
10 61.46 183 52 0.86 -1.04 0.49 77 75.4
11 62.60 182 48 1.23 1.52 0.3 73.1 76.5
12 60.65 182 54 1.28 2.02 0.29 72 74.7
13 59.01 181 59 0.96 -0.30 0.42 74.6 73
14 56.09 181 69 0.87 -1.36 0.51 74.6 70.5
15 52.79 181 81 0.98 -0.18 0.44 71.8 67.9
General Outcome Measures in Mathematics – Page 34
Appendix D: The Scores Files for Grades 3-8 Mathematics Measures under the 2PL model Table D1. The score files for grade 3.
Total items
Number of
correct items
Proportion correct
Number of
cases
Scale scores* Standard errors of scale score
*
Minimum Maximum Minimum Maximum
15 15 100 36 1.32 1.32 0.67 0.67
15 14 93.33 27 0.51 1.01 0.40 0.60
15 13 86.67 20 0.14 0.65 0.39 0.46
15 12 80 27 -0.27 0.48 0.37 0.47
15 11 73.33 14 -0.35 0.28 0.30 0.47
15 10 66.67 19 -0.49 -0.25 0.13 0.39
15 9 60 8 -0.57 -0.40 0.14 0.30
15 8 53.33 16 -0.73 -0.45 0.14 0.42
15 7 46.67 10 -1.20 -0.49 0.18 0.46
15 6 40 12 -1.35 -0.52 0.24 0.45
15 5 33.33 13 -1.42 -1.06 0.24 0.44
15 4 26.67 7 -1.51 -1.37 0.24 0.34
15 3 20 5 -1.68 -1.34 0.25 0.45
15 2 13.33 1 -1.56 -1.56 0.38 0.38
15 1 6.67 1 -2.14 -2.14 0.53 0.53
15 0 0 1 -2.51 -2.51 0.57 0.57
General Outcome Measures in Mathematics – Page 35
Table D2. The score files for grade 4.
Total items
Number of
correct items
Proportion correct
Number of
cases
Scale scores* Standard errors of scale score
*
Minimum Maximum Minimum Maximum
14 14 100 1 2.80 2.80 .67 .67
14 13 92.86 1 2.10 2.10 .61 .61
14 12 85.71 3 1.85 2.31 .58 .63
14 11 78.57 8 1.65 2.04 .55 .61
14 10 71.43 8 -.46 1.78 .17 .57
14 9 64.29 11 -.48 1.57 .14 .53
14 8 57.14 18 -.49 1.37 .15 .52
14 7 50 20 -.51 1.22 .14 .52
14 6 42.86 24 -.54 1.13 .16 .52
14 5 35.71 32 -.61 .88 .15 .49
14 4 28.57 15 -.70 -.47 .14 .44
14 3 21.43 17 -.85 .54 .14 .54
14 2 14.29 10 -1.06 -.51 .18 .64
14 1 7.14 2 -1.31 -.53 .23 .72
14 0 0 0 −− −− −− −−
Note. * Scale scores and standard errors of scale scores vary depending on which questions are answered correctly. To show the range, the authors report the maximum and minimum of the scale scores and standard errors of scale scores.

General Outcome Measures in Mathematics – Page 36
Table D3. The score files for grade 5.
Total items
Number of
correct items
Proportion correct
Number of
cases
Scale scores* Standard errors of scale score
*
Minimum Maximum Minimum Maximum
14 14 100 0 −− −− −− −−
14 13 92.86 1 2.75 2.75 .58 .58
14 12 85.71 1 2.74 2.74 .58 .58
14 11 78.57 1 1.91 1.91 .56 .56
14 10 71.43 5 1.37 2.06 .56 .56
14 9 64.29 8 1.04 1.83 .56 .59
14 8 57.14 22 .76 1.73 .56 .61
14 7 50 19 .47 1.28 .57 .62
14 6 42.86 30 .12 .89 .60 .64
14 5 35.71 54 -.29 .63 .61 .67
14 4 28.57 36 -.63 .37 .62 .69
14 3 21.43 44 -1.00 -.38 .67 .71
14 2 14.29 25 -1.30 -.79 .70 .73
14 1 7.14 6 -1.51 -1.32 .74 .75
14 0 0 2 -1.71 999.00 .77 77

General Outcome Measures in Mathematics – Page 37
Table D4. The score files for grade 6.
Total items
Number of
correct items
Proportion correct
Number of
cases
Scale scores* Standard errors of scale score
*
Minimum Maximum Minimum Maximum
15 15 100 1 2.65 2.65 0.68 0.68
15 14 93.33 1 2.43 2.43 0.66 0.66
15 13 86.67 2 1.8 1.89 0.63 0.64
15 12 80 3 1.32 1.88 0.61 0.64
15 11 73.33 6 1.18 1.54 0.61 0.62
15 10 66.67 5 0.92 0.98 0.61 0.61
15 9 60 14 0.57 0.93 0.60 0.61
15 8 53.33 27 0.18 0.76 0.60 0.61
15 7 46.67 27 -0.12 0.46 0.60 0.62
15 6 40 26 -0.56 0.22 0.61 0.62
15 5 33.33 22 -0.87 -0.25 0.62 0.64
15 4 26.67 14 -1.26 -0.58 0.62 0.66
15 3 20 14 -1.57 -0.86 0.64 0.67
15 2 13.33 2 -1.83 -1.83 0.69 0.69
15 1 6.67 0 −− −− −− −−
15 0 0 1 -2.27 -2.27 0.73 0.73
Note. * Scale scores and standard errors of scale scores vary depending on which questions are answered correctly. To show the range, the authors report the maximum and minimum of the scale scores and standard errors of scale scores.

General Outcome Measures in Mathematics – Page 38
Table D5. The scores files for grade 8.
Total items
Number of
correct items
Proportion correct
Number of
cases
Scale scores* Standard errors of scale score
*
Minimum Maximum Minimum Maximum
15 15 100 1 2.34 2.34 .70 .70
15 14 93.33 1 1.94 1.94 .67 .67
15 13 86.67 5 1.70 1.82 .64 .65
15 12 80 10 1.03 1.46 .61 .63
15 11 73.33 13 .90 1.26 .60 .62
15 10 66.67 14 .51 1.02 .58 .61
15 9 60 13 .33 .66 .58 .59
15 8 53.33 30 -.02 .81 .59 .71
15 7 46.67 28 -.45 .00 .60 .60
15 6 40 22 -.60 .02 .60 .68
15 5 33.33 26 -.98 -.59 .61 .63
15 4 26.67 11 -1.23 -.95 .63 .65
15 3 20 7 -1.52 -1.24 .65 .66
15 2 13.33 3 -1.80 -1.69 .67 .68
15 1 6.67 0 −− −− −− −−
15 0 0 0 −− −− −− −−
Note. * Scale scores and standard errors of scale scores vary depending on which questions are answered correctly. To show the range, the authors report the maximum and minimum of the scale scores and standard errors of scale

General Outcome Measures in Mathematics – Page 39
Appendix E: The Parameter files of Grades 3-8 measures under the 2PL model Table E1. The parameter files of grade 3.
Intercept Intercept
SE Slope
Slope
SE Difficulty
Difficulty
SE
Item 01 1.32085 0.15205 0.56668 0.11908 -2.33083 0.49993
Item 02 1.09815 0.13606 0.54736 0.12459 -2.00626 0.44097
Item 03 1.03764 0.15229 0.76334 0.15331 -1.35933 0.2732
Item 04 0.7214 0.12941 0.75728 0.13905 -0.95262 0.20902
Item 05 0.51843 0.13371 0.89424 0.15578 -0.57974 0.1558
Item 06 0.66304 0.20019 1.63523 0.29128 -0.40548 0.1223
Item 07 0.97314 0.21427 1.65698 0.2729 -0.5873 0.13171
Item 08 0.94397 0.21173 1.57452 0.29188 -0.59953 0.12758
Item 09 0.80838 0.1779 1.25344 0.23129 -0.64492 0.14284
Item 10 0.87152 0.16979 0.99932 0.18525 -0.87211 0.17376
Item 11 0.47678 0.11886 0.60958 0.1215 -0.78214 0.22823
Item 12 0.55606 0.10585 0.45377 0.10171 -1.22543 0.30967
Item 13 0.18503 0.12927 0.75663 0.14633 -0.24454 0.1737
Item 14 1.31942 0.20773 1.45443 0.24384 -0.90716 0.14583
Item 15 0.25947 0.13081 0.69926 0.16353 -0.37106 0.18126
General Outcome Measures in Mathematics – Page 40
Table E2. The parameter files of grade 4.
Intercept Intercept
SE Slope
Slope
SE Difficulty
Difficulty
SE
Item 01 0.41071 0.136 0.36721 0.08893 -1.11851 0.44231
Item 02 0.6962 0.15218 0.36749 0.10739 -1.89452 0.61422
Item 03 0.09613 0.13737 0.34409 0.09492 -0.27938 0.38624
Item 04 -0.75267 0.12988 0.36321 0.08789 2.07227 0.59177
Item 05 -0.53276 0.14384 0.50387 0.11494 1.05733 0.35204
Item 06 -0.45006 0.11952 0.31598 0.08015 1.42432 0.50495
Item 07 -0.73975 0.14538 0.47586 0.10677 1.55456 0.42516
Item 08 0.73354 1.94312 7.17478 3.10544 -0.10224 0.18208
Item 09 -1.44045 0.52675 2.29396 0.5518 0.62793 0.16943
Item 10 −− −− −− −− −− −−
Item 11 -1.97132 0.26263 1.00376 0.15251 1.96393 0.30997
Item 12 -0.28866 0.12007 0.36886 0.09097 0.78255 0.37739
Item 13 -0.72806 0.126 0.34521 0.08892 2.10904 0.64094
Item 14 -0.87283 0.13876 0.44559 0.09956 1.95882 0.46528
Item 15 -1.10449 0.14746 0.41304 0.09605 2.67411 0.67534

General Outcome Measures in Mathematics – Page 41
Table E3. The parameter files of grade 5.
Intercept Intercept
SE Slope
Slope
SE Difficulty
Difficulty
SE
Item 01 0.35347 0.0973 0.53034 0.10892 -0.66651 0.2038
Item 02 0.29714 0.09709 0.54826 0.11098 -0.54197 0.19012
Item 03 -0.13423 0.08724 0.44245 0.10451 0.30339 0.20663
Item 04 -0.60464 0.11078 0.60001 0.13423 1.00772 0.22542
Item 05 -2.39772 0.29547 0.73777 0.21226 3.24996 0.72685
Item 06 -2.39477 0.42077 1.09871 0.3513 2.17962 0.43306
Item 07 -1.52745 0.18008 0.70451 0.16514 2.16809 0.42182
Item 08 -0.78331 0.10342 0.46144 0.10675 1.69752 0.39121
Item 09 -0.16838 0.09047 0.44947 0.10085 0.37462 0.22117
Item 10 -1.56645 0.1703 0.60189 0.14253 2.60254 0.58349
Item 11 0.52011 0.08783 0.26093 0.06887 -1.99325 0.58791
Item 12 0.04089 0.08083 0.32766 0.07905 -0.12478 0.24673
Item 13 -0.51183 0.09633 0.45718 0.10122 1.11954 0.29568
Item 14 −− −− −− −− −− −−
Item 15 -0.01316 0.08071 0.23173 0.06092 0.05679
0.3484

General Outcome Measures in Mathematics – Page 42
Table E4. The parameter files of grade 6.
Intercept Intercept
SE Slope
Slope
SE Difficulty
Difficulty
SE
Item 01 -1.25614 0.24615 0.70966 0.18138 1.77005 0.40976
Item 02 -1.20315 0.22619 0.6623 0.17494 1.81662 0.41074
Item 03 -0.20064 0.12548 0.49535 0.11062 0.40504 0.24944
Item 04 -1.06479 0.15863 0.46791 0.11751 2.27561 0.57521
Item 05 -0.21761 0.11484 0.3686 0.09153 0.59038 0.33317
Item 06 -0.38075 0.10989 0.33158 0.08267 1.14829 0.43513
Item 07 0.00729 0.12947 0.53906 0.13025 -0.01352 0.22214
Item 08 -0.11564 0.1043 0.22611 0.06251 0.51142 0.48583
Item 09 0.15145 0.14269 0.63349 0.15439 -0.23906 0.20346
Item 10 0.30581 0.11685 0.40462 0.10907 -0.75579 0.30019
Item 11 -0.07535 0.14463 0.50592 0.13123 0.14895 0.28058
Item 12 -0.68266 0.11784 0.33756 0.0958 2.02236 0.65214
Item 13 0.86338 0.11738 0.28237 0.07567 -3.05765 0.85455
Item 14 1.31993 0.18917 0.76385 0.19961 -1.728 0.33243
Item 15 -0.33634 0.11595 0.39504 0.09802 0.85142 0.33422
General Outcome Measures in Mathematics – Page 43
Table E5. The parameter files of grade 8.
Intercept Intercept
SE Slope
Slope
SE Difficulty
Difficulty
SE
Item 01 1.19771 0.14507 0.42647 0.11297 -2.80842 0.71473
Item 02 1.014 0.13548 0.41374 0.1116 -2.45084 0.62493
Item 03 0.5102 0.11237 0.47019 0.10833 -1.08512 0.29642
Item 04 -0.26075 0.10501 0.50252 0.10982 0.51887 0.2293
Item 05 0.99841 0.13056 0.36949 0.11073 -2.70221 0.74609
Item 06 0.38505 0.13072 0.60228 0.1441 -0.63932 0.22635
Item 07 -0.3426 0.09597 0.32573 0.08419 1.0518 0.38252
Item 08 0.27114 0.10071 0.34979 0.08532 -0.77516 0.32236
Item 09 -0.44838 0.11535 0.6091 0.13668 0.73614 0.22074
Item 10 -0.62203 0.12543 0.54622 0.12706 1.13882 0.29229
Item 11 -0.57898 0.11135 0.38818 0.09394 1.49151 0.42777
Item 12 -0.49994 0.10275 0.3075 0.07868 1.62578 0.49535
Item 13 -0.4976 0.11245 0.48159 0.11209 1.03323 0.30542
Item 14 -0.37167 0.11869 0.68265 0.15157 0.54447 0.19474
Item 15 -0.16708 0.11076 0.55067 0.12159 0.30341 0.21159

General Outcome Measures in Mathematics – Page 44
Appendix F: Item analysis of problematic items Grade 3, Item 1:
4 8 3 + 3 7 1
Table F1. Item analysis for item 1 in grade 3.
Number Percent Average Measures
Standard Error Mean
Outfit Mean
Square
A 7154 9 4 41.68 5.53 0.8
C 753 9 4 52.92 5.70 3.3
D 112 7 3 55.81 7.78 3.6
B* 854 192 88 65.40 1.14 1.0
Missing 22 7
Grade 5, Item 14:
26.142.
Table F2. Item analysis for item 14 in grade 5.
Number Percent Average Measures
Standard Error Mean
Outfit Mean
Square
B 70.3 40 16 37.12 1.49 0.9
A 7.03 46 18 39.81 1.48 1.6
C 7.13 122 48 40.12 0.92 1.3
D* 71.3 47 18 40.93 1.28 1.7
Missing 18 7

General Outcome Measures in Mathematics – Page 45
Grade 7, Item 7: (−8000) – (−4264) =
Table F3. Item analysis for item 7 in grade 7.
Number Percent Average Measures
Standard Error Mean
Outfit Mean
Square
B -3736 29 16 43.15 1.65 0.6
A 3736 40 22 47.71 1.36 1.0
C 12264 50 27 50.71 1.27 1.4
D*-12264 65 35 55.81 1.31 1.0
Missing 28 13