instructional materials - rpdp 7 mathematics instruct onal mater als go on copyr ght © 2009 by the...
TRANSCRIPT

Nevada
DEPARTMENTOFEDUCATION
Ne
va
da
GRADE
7
Grade 7MATHEMATICS
Copyright © 2009 by the Nevada Department of Education
InstructionalMaterialsfor THE
CrITErIoNrEfErENCEDTEST

Page �Copyr�ght © 2009 by the Nevada Department of Educat�on
KEITH W. RHEAULT Superintendent of Public Instruction STATE OF NEVADA
SOUTHERN NEVADA OFFICE 1820 E. Sahara, Suite 205
Las Vegas, Nevada 89104-3746 GLORIA P. DOPF
Deputy Superintendent Instructional, Research and Evaluative
Services
(702) 486-6455 Fax: (702) 486-6450
JAMES R. WELLS Deputy Superintendent MOODY STREET OFFICE
Administrative and Fiscal ServicesDEPARTMENT OF EDUCATION
700 E. Fifth Street Carson City, Nevada 89701-5096 (775) 687-9200 · Fax: (775) 687-9101
1749 Moody Street, Suite 40 Carson City, Nevada 89706-2543
Dear Educators,
The following materials, developed as a collaborative effort between the Nevada Department of Education and WestEd, a nonprofit research, development, and service agency, are designed to be used as part of a guided instructional activity to support student performance on assessments. While these materials can provide students with practice in answering assessment items, we believe it is critical that these materials be used to help students understand the elements of the state assessment and to guide them in the use of effective strategies that will support their ability to comprehend and take a variety of assessments. If you choose, however, to use this support document solely as a practice activity, we highly recommend that you go back over each item with students and investigate each response to better understand their knowledge of the assessment.
Types of Items The math test includes two types of items—multiple choice items for all grades (3rd – 8th and high school) and constructed-response items for grades 4th – 8th. To help prepare students for the constructed-response items we have provided:
1. the student checklist (included in the student test booklet at grades 4 and 5) 2. the general student rubric (included in the student test booklet at grades 6 through 8) 3. item-specific rubrics
With the use of these materials, students can become familiar with the different types of items used on the state assessments. They can learn to use the checklist or rubric to determine if they have answered the constructed-response items completely. Familiarity with the tools provided as part of the assessment and the vocabulary of the standards can result in less anxiety on the part of students. Please note that the student checklist and general rubric can be on the walls of your classroom throughout the school year. As you assign constructed-response items, students can use these tools as they develop their answers. The types of items included in these instructional materials allow for the assessment of different levels of depth of knowledge in the content areas defined by the standards. The different Depth of Knowledge (DOK) levels are explained below. The items are developed so that students can demonstrate mathematical thinking at multiple DOK levels. Teaching students to identify, write, and use different levels of questioning skills as they assess various mathematical concepts will likely lead to improved student achievement on classroom, district, state, and national assessments. We hope that the use of these materials will assist in the creation of students who are powerful mathematical thinkers.
Depth of Knowledge (DOK) Levels In addition to measuring a broad spectrum of math content domains, the Nevada Proficiency Examination Program in math includes items to assess three Depth of Knowledge levels. These DOK levels are based on descriptions developed by Dr. Norman Webb and adapted for Nevada's mathematics assessments.

Page ��Copyr�ght © 2009 by the Nevada Department of Educat�on
The following are the three DOK levels used on state level assessments in mathematics on Nevada assessments:
DOK 1 - Recall - Items at the DOK Level 1 require the recall of information, such as a fact, definition, term, or simple procedure, as well as performing a simple algorithm, reading an uncomplicated data display, or applying a formula. A one-step, well-defined, and straight algorithmic procedure should be included at DOK Level 1.
DOK 2 - Skills and Concepts - Items at the DOK Level 2 require the engagement of some mental processing beyond a habitual response. The content knowledge or process involved is more complex than in Level 1. Interpreting information from a simple graph or reading information from the graph is at a DOK Level 2. DOK Level 2 activities are not limited only to number skills, but may involve probability skills.
DOK 3 - Strategic Thinking - Items at the DOK Level 3 require students to use reasoning, justifying, planning, using evidence, and a higher level of thinking than the previous two levels. Activities that require students to make conjectures are at this level. The cognitive demands at DOK Level 3 are complex and abstract. The complexity does not result from the fact that there are multiple answers, but because the task requires more demanding reasoning. Some additional DOK Level 3 activities include drawing conclusions from observations; citing evidence and developing a logical argument for concepts; explaining phenomena in terms of concepts; and deciding which concepts to apply in order to solve a complex non-routine problem.
Math Content LiteracyThe Department of Education believes that the breadth and depth of the content and vocabulary of the Nevada Mathematics Content and Achievement indicators present a continuing challenge for instruction at all grade levels. It is not unusual for grade-appropriate, content-specific terminology and vocabulary to be required for instruction prior to these same terms being used on assessments.
Students in Nevada, therefore, must have repeated experiences with hearing (oral vocabulary), reading,and writing the vocabulary of the standards in order to be successful on the state assessment as well as in classroom and district assessments. Make sure that your students know the language of the standards that are being assessed. They should be able to recognize the vocabulary of the standards when you discuss them in class and read them in assessments, and they should be able to effectively use the vocabulary in their writing. This will be especially useful when students are working on the constructed-response items of the state assessment.
We hope that interaction with these instructional support materials will lead to lowered anxiety and better understanding of the assessment tasks being presented to students. If you have questions about the math instructional materials or about how to embed this information into your curriculum, please contact David Brancamp at [email protected] or call (775) 687-9133, and he will work with you on making these documents beneficial to you and your students.
Cindy Sharp K–12 CRT/HSPE Consultant Nevada Department of Education

Page �Copyr�ght © 2009 by the Nevada Department of Educat�on
MathematicsGrade 7
Name:
Score Expectation
Full Credit Your response addresses all parts of the quest�on clearly and correctly. You use and label the proper math terms �n your answer.
Your response shows all the steps you took to solve the problem.
Partial Credit Your response addresses most parts of the quest�on correctly.
Your response does not show all of your work or does not completely expla�n the steps you took to solve the problem.
Minimal Credit Your response addresses only one part of the quest�on correctly and expla�ns the steps you took to solve that one part. In answer�ng the rema�n�ng parts of the quest�on, your response �s �ncomplete or �ncorrect.
Your response does not show all of your work or does not expla�n all of the steps you took to solve the problem.
No Credit Your response �s �ncorrect.
This booklet contains mathematics questions for you to answer. There are two types of questions in this booklet. For the multiple-choice questions, you will be given four answer choices—A, B, C, and D. You are to choose the correct answer from the four choices. Each question has only one right answer. The written-response questions require you to give a written response to a question as indicated in the booklet. You will be given a separate sheet of paper to answer these questions.
You may use the rubric below to help you do a good job when you are answering the written-response questions.
Grade 7 Mathematics� Instruct�onal Mater�als
Go OnCopyr�ght © 2009 by the Nevada Department of Educat�on Page 2
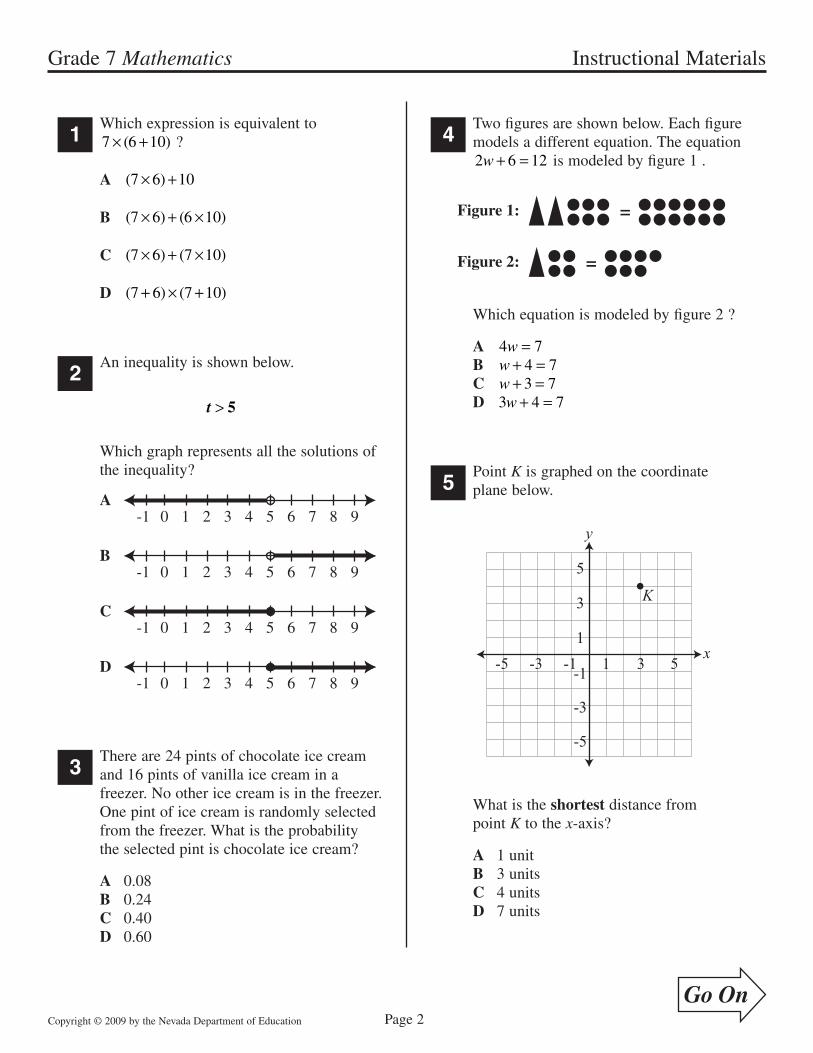
■1Wh�ch express�on �s equ�valent to 7 6 �0× +( ) ?
A ( )7 6 �0× +
B ( ) ( )7 6 6 �0× + ×
C ( ) ( )7 6 7 �0× + ×
D ( ) ( )7 6 7 �0+ × +
■2An �nequal�ty �s shown below.
t > 5
Wh�ch graph represents all the solut�ons of the �nequal�ty?
A 3-1 0 1 2 4 5 6 7 8 9
B 3-1 0 1 2 4 5 6 7 8 9
C 3-1 0 1 2 4 5 6 7 8 9
D 3-1 0 1 2 4 5 6 7 8 9
■3There are 24 p�nts of chocolate �ce cream and �6 p�nts of van�lla �ce cream �n a freezer. No other �ce cream �s �n the freezer. One p�nt of �ce cream �s randomly selected from the freezer. What �s the probab�l�ty the selected p�nt �s chocolate �ce cream?
A 0.08B 0.24C 0.40D 0.60
■4Two figures are shown below. Each figure models a d�fferent equat�on. The equat�on 2 6 �2w + = �s modeled by figure � .
Figure 1:
Figure 2:
=
=
Wh�ch equat�on �s modeled by figure 2 ?
A 4 7w =B w + =4 7C w + =3 7D 3 4 7w + =
■5Po�nt K �s graphed on the coord�nate plane below.
x
y
11
3
5
-3
-1
-5
-3 -1-5 3 5
K
What �s the shortest d�stance from po�nt K to the x-ax�s?
A � un�tB 3 un�tsC 4 un�tsD 7 un�ts

Grade 7 Mathematics� Instruct�onal Mater�als
Go OnCopyr�ght © 2009 by the Nevada Department of Educat�on Page 3
■6One day, the temperature �n a c�ty dropped from 20°F to -4°F . What was the total change �n the temperature, �n degrees Fahrenhe�t?
A -24B -�6C �6D 24
■7A proport�on �s shown below.
30 8
12x=
What value of x makes the proport�on true?
A 20B 34C 45D 50
■8L�sa works to find new cl�ents for a company. The bar graph below shows the number of new cl�ents L�sa found each month for 9 months.
Month
New Clients
Num
ber
of C
lient
s
0
5
10
15
20
25
30
1 2 3 4 5 6 7 8 9
Wh�ch �s the closest approx�mat�on of the mean of the number of cl�ents L�sa found each month?
A �� cl�entsB �5 cl�entsC 25 cl�entsD 30 cl�ents

Grade 7 Mathematics� Instruct�onal Mater�als
Go OnCopyr�ght © 2009 by the Nevada Department of Educat�on Page 4
■9The table below shows the number of months (m) that Jeremy has been collect�ng baseball cards and the total number of baseball cards (c) �n h�s collect�on at the end of each month.
1 2 3 4 5
6 10 14 18 ?
6
?
Number of Months (m)
Total Number of Cards (c)
Jeremy’s Baseball Card Collection
The total number of baseball cards �n Jeremy’s collect�on follows a pattern, and the pattern cont�nues.
A Us�ng the gr�d on your paper, copy the graph below. Graph the po�nts that represent the �nformat�on �n the table. Be sure to �nclude the total number of baseball cards for months 5 and 6 �n your graph.
2 310 4 5
c
m6
812
20
28
4
16
24
Number of Months
Tota
l Num
ber
of C
ards
Jeremy’s Baseball Card Collection
B Jeremy cont�nues to buy the same number of baseball cards each month. Expla�n why Jeremy w�ll never have �60 cards �n h�s collect�on at the end of any month (m).
Write your answer to Question 9 on a separate sheet of paper. Be sure to answer Parts A and B.

Grade 7 Mathematics� Instruct�onal Mater�als
Go OnCopyr�ght © 2009 by the Nevada Department of Educat�on Page 5
■10Mar�a has a red folder, a blue folder, and a yellow folder. She w�ll use one folder for math, one for sc�ence, and one for soc�al stud�es. In how many d�fferent ways can Mar�a p�ck one folder for each class?
A 3B 5C 6D 9
■11A l�st of numbers �s shown below.
78 0.63
34 85% 0.9
What �s the order of the numbers from least to greatest?
A 34
78 0.9 0.63 85%
B 34 0.63
78 85% 0.9
C 0.63 34
78 0.9 85%
D 0.63 34 85%
78 0.9
■12Look at the equat�on below.
y x = - + 12 2
In wh�ch l�st are all the ordered pa�rs solut�ons of the equat�on?
A (-�2, -�2) (0, 0) (2, 2)B (-�2, 0) (-8, 2) (0, 6)C (0, -�2) (2, -�2) (3, -�2)D (0, -�2) (3, -6) (6, 0)
■13Jack�e worked on her homework from 4:48 P.M. unt�l 5:25 P.M. She then spent 47 m�nutes eat�ng d�nner before beg�nn�ng to work on her homework aga�n. Jack�e fin�shed her homework at 6:24 P.M. What �s the total amount of t�me Jack�e worked on her homework?
A 37 m�nutesB 49 m�nutesC � hour 29 m�nutesD � hour 36 m�nutes
Grade 7 Mathematics� Instruct�onal Mater�als
Go OnCopyr�ght © 2009 by the Nevada Department of Educat�on Page 6
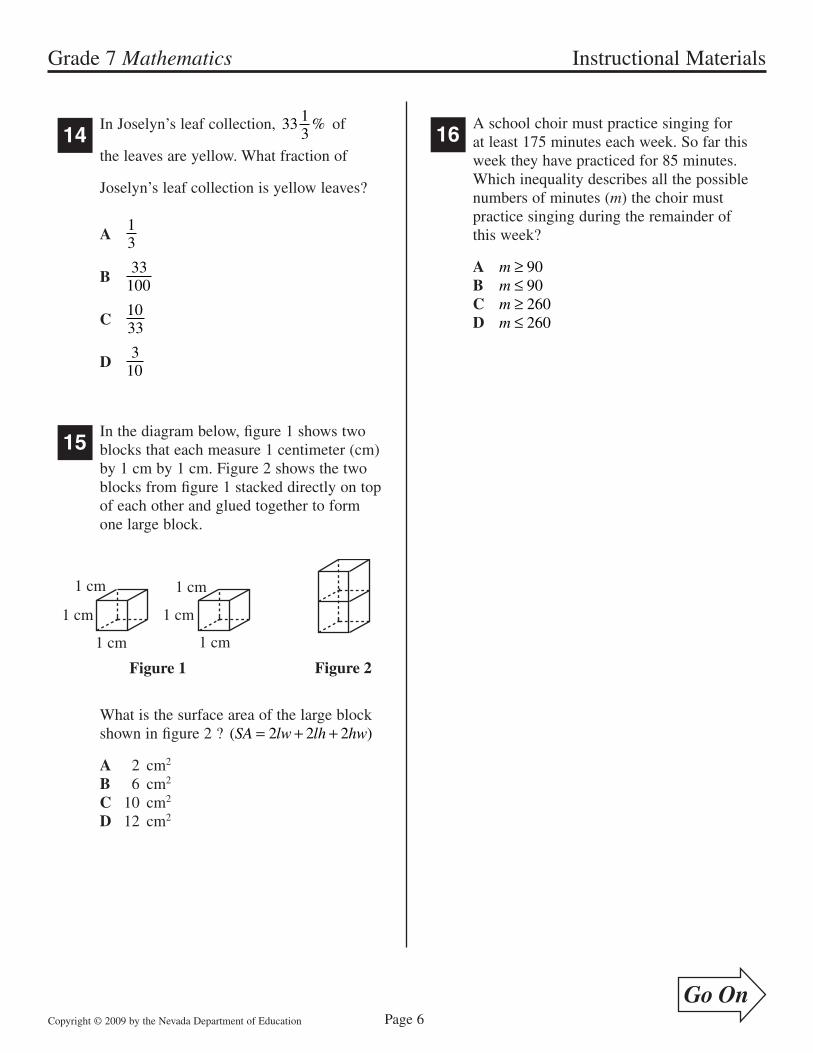
■14In Joselyn’s leaf collect�on, 33 �
3% of
the leaves are yellow. What fract�on of
Joselyn’s leaf collect�on �s yellow leaves?
A �3
B 33
�00
C �033
D 3
�0
■15In the d�agram below, figure � shows two blocks that each measure � cent�meter (cm) by � cm by � cm. F�gure 2 shows the two blocks from figure � stacked d�rectly on top of each other and glued together to form one large block.
1 cm
1 cm
1 cm
Figure 1 Figure 2
1 cm
1 cm
1 cm
What �s the surface area of the large block shown �n figure 2 ? ( )SA lw lh hw= + +2 2 2
A 2. cm2
B 6. cm2
C �0. cm2
D �2. cm2
■16A school cho�r must pract�ce s�ng�ng for at least �75 m�nutes each week. So far th�s week they have pract�ced for 85 m�nutes. Wh�ch �nequal�ty descr�bes all the poss�ble numbers of m�nutes (m) the cho�r must pract�ce s�ng�ng dur�ng the rema�nder of th�s week?
A m ≥ 90B m ≤ 90C m ≥ 260D m ≤ 260
Grade 7 Mathematics� Instruct�onal Mater�als
Go OnCopyr�ght © 2009 by the Nevada Department of Educat�on Page 7
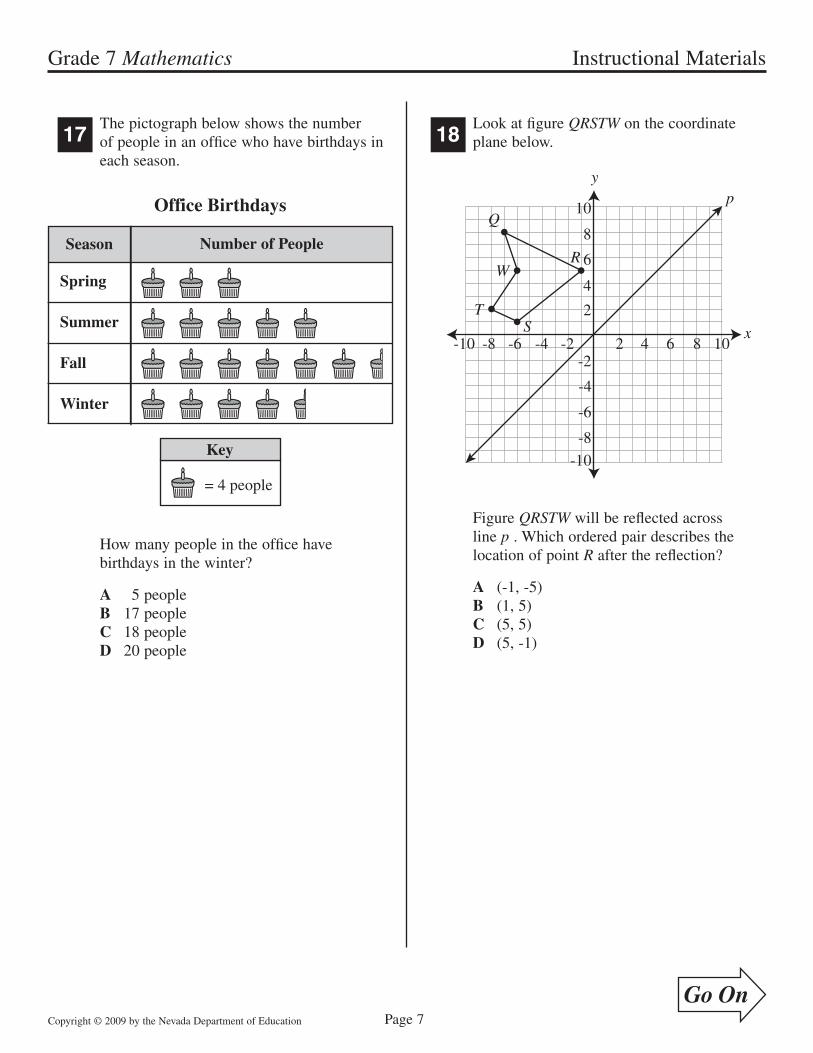
■17The p�ctograph below shows the number of people �n an office who have b�rthdays �n each season.
Spring
Summer
Fall
Winter
Office Birthdays
Season Number of People
= 4 people
Key
How many people �n the office have b�rthdays �n the w�nter?
A 5 peopleB �7 peopleC �8 peopleD 20 people
■18Look at figure QRSTW on the coord�nate plane below.
x
yp
Q
T
W
S
R
2 4 6 8 10-2-4-6-8-10
-4
-6
-8
-10
-2
2
4
6
8
10
F�gure QRSTW w�ll be reflected across l�ne p�. Wh�ch ordered pa�r descr�bes the locat�on of po�nt R after the reflect�on?
A (-�, -5)B (�, 5)C (5, 5)D (5, -�)

Grade 7 Mathematics� Instruct�onal Mater�als
Go OnCopyr�ght © 2009 by the Nevada Department of Educat�on Page 8
■19Carson �s grow�ng bean plants for a sc�ence exper�ment. He measures the he�ghts of the bean plants every five days. The results of h�s first measurement day and h�s second measurement day are shown �n the h�stograms below.
Num
ber
of
Bea
n P
lant
s
02468
101214
Plant Height (cm)
0 2 4 6 8 10 12 14 16 18 20
Heights of Bean Plants—First Measurement Day
Heights of Bean Plants—Second Measurement Day
Num
ber
of
Bea
n P
lant
s
02468
101214
Plant Height (cm)
0 2 4 6 8 10 12 14 16 18 20
A Descr�be how the median of the he�ghts of the bean plants changed between the first measurement day and the second measurement day.
B Descr�be how the range of the he�ghts of the bean plants changed between the first measurement day and the second measurement day.
C Expla�n what the change �n the range of the he�ghts of the bean plants from the first measurement day to the second measurement day tells you about the growth of the bean plants.
Write your answer to Question 19 on a separate sheet of paper. Be sure to answer Parts A, B, and C.

Grade 7 Mathematics� Instruct�onal Mater�als
Go OnCopyr�ght © 2009 by the Nevada Department of Educat�on Page 9
■20What �s the value of 4 6+ - ?
A -�0B -2C 2D �0
■21An �nvestor puts $�,500 �nto an account that earns s�mple �nterest at a rate of 6% per year. The �nvestor does not depos�t any add�t�onal money �nto or w�thdraw any money from the account for 3 years. What �s the total amount of s�mple �nterest the account earns over the 3 years?
A $90B $270C $�,770D $27,000
■22The l�ne graphed on the coord�nate plane shown below represents solut�ons of a l�near equat�on.
x
y
2 4 6 8-2-4-6-8
-4
-6
-8
-2
2
4
6
8
Wh�ch ordered pa�rs are solut�ons of the l�near equat�on?
A (-4, 0) and (-2, -2)B (-3, �) and (6, 2)C (�, 3) and (0, 4)D (�, 5) and (-6, -2)
Grade 7 Mathematics� Instruct�onal Mater�als
Go OnCopyr�ght © 2009 by the Nevada Department of Educat�on Page �0
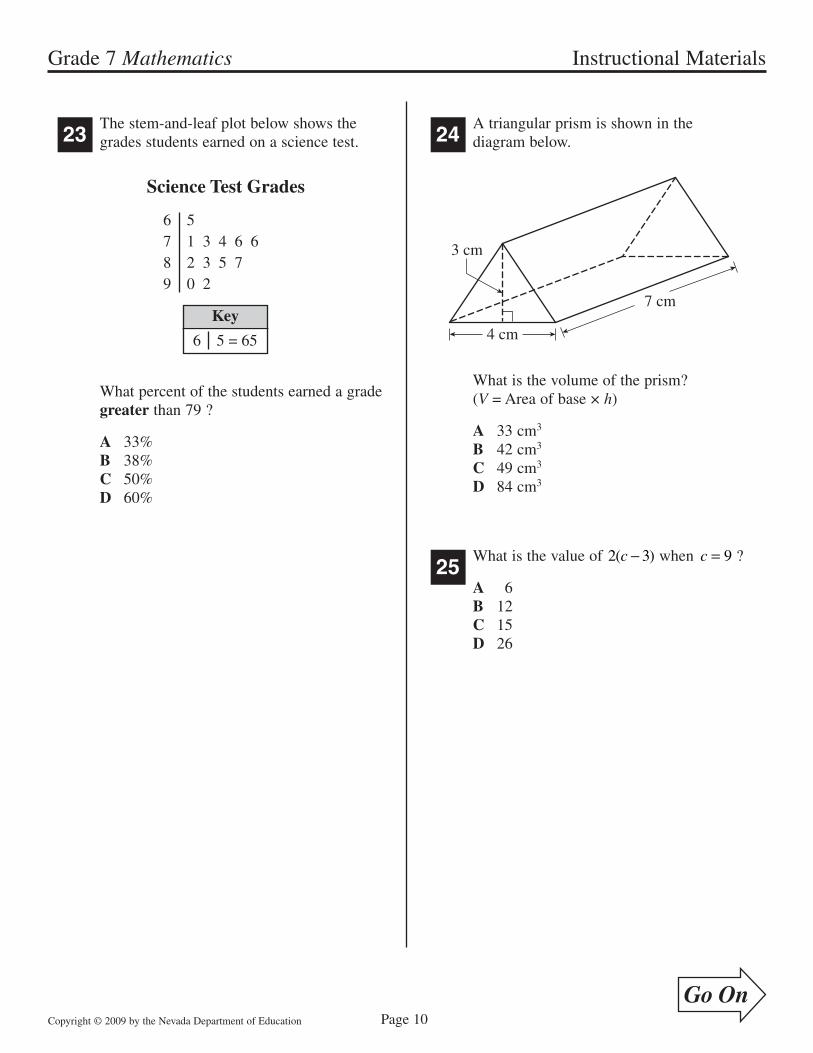
■23The stem-and-leaf plot below shows the grades students earned on a sc�ence test.
6789
51 3 4 6 6 2 3 5 70 2
6 5 = 65
Key
Science Test Grades
What percent of the students earned a grade greater than 79 ?
A 33%B 38%C 50%D 60%
■24A tr�angular pr�sm �s shown �n the d�agram below.
3 cm
7 cm
4 cm
What �s the volume of the pr�sm? (V = Area of base × h)
A 33 cm3
B 42 cm3
C 49 cm3
D 84 cm3
■25What �s the value of 2 3( )c − when c = 9 ?
A 6B �2C �5D 26

Grade 7 Mathematics� Instruct�onal Mater�als
Go OnCopyr�ght © 2009 by the Nevada Department of Educat�on Page ��
■26Peter needs �50 square meters of carpet. The carpet �s sold by the square foot. Wh�ch �s the best ESTIMATE of the number of square feet of carpet Peter needs?
A �7 square feetB �50 square feetC �,350 square feetD 2�,600 square feet
■27Look at the �nput/output table below.
1
3
5
7
Input
0
4
8
12
Output
What �s the output value when the �nput value �s �7 ?
A 32B 36C 64D 68
■28Wh�ch polygon �s regular?
A
B
C
D

Grade 7 Mathematics� Instruct�onal Mater�als
Go OnCopyr�ght © 2009 by the Nevada Department of Educat�on Page �2
■29Reg�na fin�shes school at 2:57 P.M. She plans to be at a football game at 7:�5 P.M. Some �nformat�on about how Reg�na w�ll spend the t�me between school and the game �s l�sted below.
• She w�ll spend 24 m�nutes walk�ng home from school.
• She w�ll spend � �4
hours do�ng homework.
• She w�ll spend some t�me play�ng basketball.
• She w�ll spend � hour 27 m�nutes dr�v�ng to the football game.
A What �s the greatest amount of t�me Reg�na can spend play�ng basketball and st�ll be at the game
at 7:�5 P.M.? Show your work.
B Reg�na arr�ves at the football game at 7:�5 P.M. She stays at the football game for 2 45
hours, and
then she dr�ves home. Her dr�ve home takes 35 m�nutes longer than her dr�ve to the game.
What �s the earl�est t�me that Reg�na w�ll arr�ve home after the game? Show your work. Be sure to
�nclude A.M. or P.M. �n your answer.
Write your answer to Question 29 on a separate sheet of paper. Be sure to answer Parts A and B.

Grade 7 Mathematics� Instruct�onal Mater�als
Go OnCopyr�ght © 2009 by the Nevada Department of Educat�on Page �3
■30Wendy w�ll sp�n the arrow on each of the sp�nners shown below one t�me.
2
43
1
Spinner A Spinner B
32
1
The poss�ble outcomes for her 2 sp�ns are shown �n the tree d�agram below.
Spinner A
Spinner B 1 2 3
1
1 2 3
2
1 2 3
3
1 2 3
4
What �s the probab�l�ty the numbers �n the sect�ons where the arrows stop are the same?
A �
�2
B �7
C �4
D �3
■31Sally’s puppy we�ghs �4 pounds. Approx�mately how many kilograms does the puppy we�gh?
A 7 k�logramsB �4 k�logramsC 2� k�logramsD 28 k�lograms
■32Beth, Mary, and Fel�x took turns dr�v�ng
from Parks�de to Anderson. F�rst, Beth
drove 40% of the d�stance, then Mary drove
35
of the remaining d�stance. Fel�x then
drove the final �08 m�les. What �s the total
d�stance from Parks�de to Anderson?
A �62 m�lesB 2�6 m�lesC 252 m�lesD 450 m�les
■33The ages of the performers �n a play are shown �n the stem-and-leaf plot below.
123456
0 2 21 3 5 6 795 7 8
8
4 7 = 47 years
Key
Ages of Performers
What �s the mode of the ages of the performers?
A �0 yearsB �2 yearsC 20 yearsD 26 years

Grade 7 Mathematics� Instruct�onal Mater�als
Go OnCopyr�ght © 2009 by the Nevada Department of Educat�on Page �4
■34Wh�ch graph represents the equat�on y x= +-2 4 ?
A
x
y
21 3 4 5-2-3-4-5
-4-5
-3-2
12345
-1-1
C
x
y
21 3 4 5-2-3-4-5
-4-5
-3-2
12345
-1-1
B
x
y
21 3 4 5-2-3-4-5
-4-5
-3-2
12345
-1-1
D
x
y
21 3 4 5-2-3-4-5
-4-5
-3-2
12345
-1-1

Grade 7 Mathematics� Instruct�onal Mater�als
Go OnCopyr�ght © 2009 by the Nevada Department of Educat�on Page �5
■35How many s�gn�ficant d�g�ts are �n the number 0.0072�40 ?
A 4 d�g�tsB 5 d�g�tsC 7 d�g�tsD 8 d�g�ts
■36L�am’s rec�pe requ�res �2 ounces of flour to make 60 cook�es. He only has �0 ounces of flour, so he w�ll need to adjust the rec�pe. How many cook�es can L�am make w�th �0 ounces of flour?
A 50 cook�esB 58 cook�esC 60 cook�esD 72 cook�es
■37Two pa�rs of parallel l�nes �ntersect to form parallelogram WXYZ, as shown �n the d�agram below.
Z Y
W
l m
Xs
t
100°
The measure of ∠ZWX �s �00° . What �s the measure of ∠WXY ?
A 70°B 80°C �00°D 260°

Grade 7 Mathematics� Instruct�onal Mater�als
Go OnCopyr�ght © 2009 by the Nevada Department of Educat�on Page �6
■38The bar graph below shows the number of po�nts Bryce scored �n each of the first 9 basketball games he played th�s year.
Game
Points Scored by Bryce in Basketball Games
Num
ber
of P
oint
s Sc
ored
0
2
4
6
8
10
12
14
16
1 2 3 4 5 6 7 8 9
Based on the graph, as Bryce played more games th�s year, the number of po�nts he scored �n each game
A cont�nually decreased.B cont�nually �ncreased.C decreased then �ncreased.D �ncreased then decreased.
■39Amber, Brandon, and Carolyn are the 7th grade class officers. The�r teacher w�ll randomly select who w�ll be the pres�dent, v�ce pres�dent, and secretary for the class. The chart below shows all the poss�ble comb�nat�ons of pres�dent, v�ce pres�dent, and secretary.
Amber Brandon Carolyn
Amber Carolyn Brandon
Brandon Amber Carolyn
Brandon Carolyn Amber
Carolyn Amber Brandon
Carolyn Brandon Amber
Class Officers
President SecretaryVice President
What �s the probab�l�ty the teacher w�ll select Brandon to be v�ce pres�dent?
A �9
B �6
C �3
D 23

Grade 7 Mathematics� Instruct�onal Mater�als
Go OnCopyr�ght © 2009 by the Nevada Department of Educat�on Page �7
■40John measures the depth of a pond near h�s house on the same day each week. The scatter plot below shows the data John recorded over a 20-week per�od.
4 620 8 10 12 14 16 18 20 22 24 26
8687
89
91
85
88
90
9293949596
Time (weeks)
Depth of a Pond
Dep
th o
f P
ond
(cm
)
John forgot to record the depth of the pond dur�ng week 9, week �0, week �5, and week �7 . However, John knows that the depth of the pond was 93 cent�meters (cm) dur�ng one of these weeks.
A Dur�ng wh�ch of these weeks was the depth of the pond most l�kely 93 cm? Use the data �n the scatter plot to expla�n your th�nk�ng.
B John used the data he recorded from week � through week 20 to pred�ct the depth of the pond dur�ng week 24 .
Expla�n why us�ng the data shown �n the scatter plot could lead to a pred�ct�on that �s not accurate.
Write your answer to Question 40 on a separate sheet of paper. Be sure to answer Parts A and B.

Grade 7 Mathematics� Instruct�onal Mater�als
Go OnCopyr�ght © 2009 by the Nevada Department of Educat�on Page �8
■41Look at the �nput/output table below.
2
4
6
8
10
Input(x)
Output(y)
-20
-34
-48
-62
?
What �s the output value (y) when the �nput value (x) �s �0 ?
A -72B -76C -�00D -��0
■42Four students w�ll present book reports to the�r class. In how many d�fferent orders can the students present the�r book reports?
A 4B �0C �6D 24
■43Jeffrey plans to spend between $2.25 and $3.75 on lunch each day of the school year. There are �80 days �n the school year. Wh�ch �s the best ESTIMATE of the amount of money Jeffrey w�ll spend on lunches for the ent�re school year?
A $�00 to $200B $200 to $400C $400 to $800D $800 to $�,600
■44A softball team �s play�ng on a softball field shaped l�ke a square. Player Y �s stand�ng 20 feet (ft) beyond first base and player X �s stand�ng by 3rd base, as shown �n the d�agram below.
60 ft 60 ft
60 ft60 ft
HomePlate
2nd base
1stbase
20 ft3rdbase
Player Y
Player X
Player Y throws the ball d�rectly to player X . Approx�mately how far does the ball travel from player Y to player X ?
A 60 ftB 80 ftC �00 ftD �20 ft

Grade 7 Mathematics� Instruct�onal Mater�als
Go OnCopyr�ght © 2009 by the Nevada Department of Educat�on Page �9
■45Rectangle PQST was translated to create the rectangle ′ ′ ′ ′P Q S T . Rectangle ′ ′ ′ ′P Q S T �s shown on the coord�nate gr�d below.
x
y
2 310 4 5 6 7 8
23
5
7
1
4
6
9
8
109
10
P′ Q′
S′T′
The or�g�nal rectangle PQST was translated r�ght 2 un�ts and up � un�t to make rectangle
′ ′ ′ ′P Q S T . Wh�ch ordered pa�r descr�bes the locat�on of vertex P on the or�g�nal rectangle?
A (0, 4)B (0, 6)C (4, 4)D (6, 4)
■46Mr. Jones opens a bank account w�th $�0,000 . The account earns 4% s�mple �nterest per year. Mr. Jones does not make any add�t�onal depos�ts or w�thdraw any money from the account for 2 years. What �s the total amount of money �n the account after 2 years?
A $�0,400B $�0,800C $�2,500D $�5,000
■47Look at the graph below.
-1 0 1 2 3 4 5 6 7 8 9 10 11 12
Wh�ch �nequal�ty descr�bes the graph?
A w < 4B w ≤ 4C w > 4D w ≥ 4
■48Zachary puts some cherry and some lemon jellybeans �nto each of 6 bags. He puts 50 cherry jellybeans and 4 lemon jellybeans �nto each bag. Wh�ch express�on could be used to determ�ne the total number of jellybeans of each flavor that Zachary puts �n the bags?
A 6 54×
B 6 50 4× +
C 6 50 4+ ×( )
D 6 50 4× +( )

Grade 7 Mathematics� Instruct�onal Mater�als
Go OnCopyr�ght © 2009 by the Nevada Department of Educat�on Page 20
■49Sean used a rule to create the �nput/output table shown below.
Input Output
2 5
3 9
4 13
5 17
Wh�ch rule descr�bes the relat�onsh�p between the �nput numbers and the output numbers?
A output �nput= +3B output �nput= ×3C output �nput= × +( )2 �D output �nput= × −( )4 3
■50A new recreat�on center opened �n a commun�ty. The table below shows the approx�mate number of v�s�tors to the recreat�on center each year for the first n�ne years �t was open.
1 16,000
2 24,000
3 30,500
4 34,000
5 35,000
6 35,500
7 35,000
8 36,000
9 35,500
Recreation Center Visitors
Approximate Number of
VisitorsYear
Based on the �nformat�on �n the table, wh�ch �s the best pred�ct�on of the approx�mate number of v�s�tors to the recreat�on center �n the ��th year �t �s open?
A 32,000 v�s�torsB 36,000 v�s�torsC 40,000 v�s�torsD 73,000 v�s�tors

You may want to go back and check your answers or answer quest�onsyou d�d not complete.
Grade 7 Mathematics� Instruct�onal Mater�als
Copyr�ght © 2009 by the Nevada Department of Educat�on Page 2�

Page 22Copyr�ght © 2009 by the Nevada Department of Educat�on
Nevada
DEPARTMENTOFEDUCATION
Ne
va
da
GRADE
7
Grade 7MATHEMATICS
Appendix I
ScoringSupportMaterials
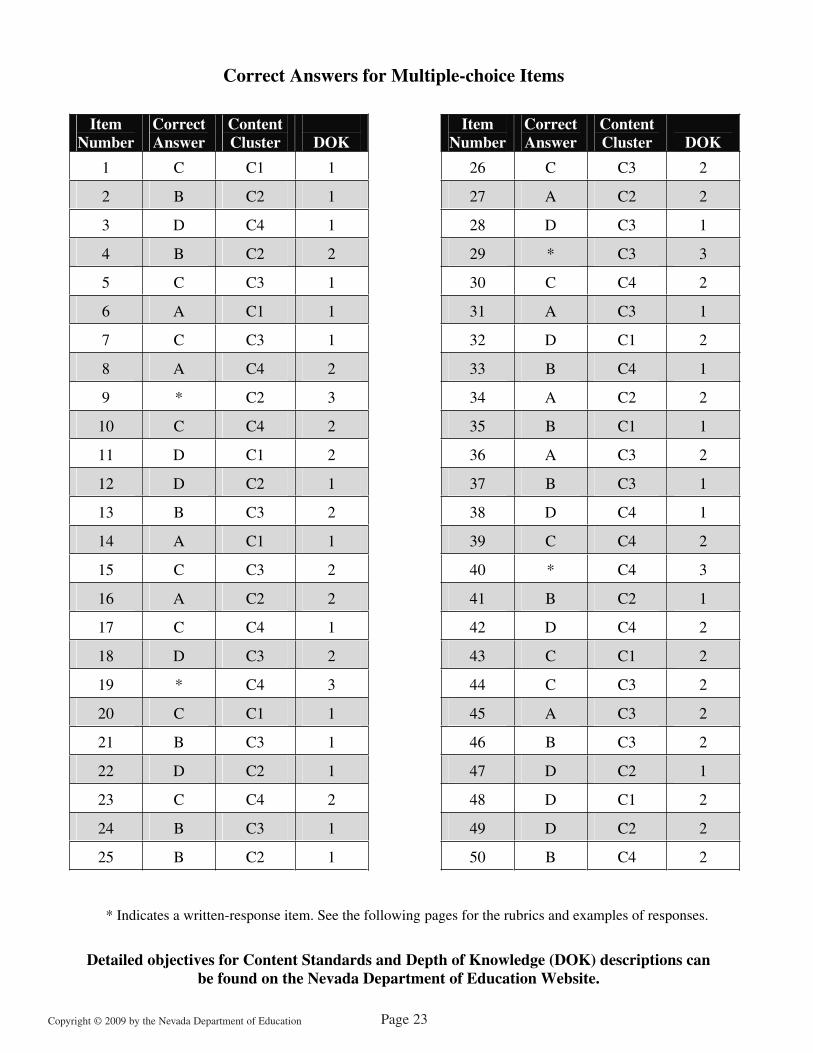
Correct Answers for Multiple-choice Items
ItemNumber
CorrectAnswer
ContentCluster DOK
ItemNumber
CorrectAnswer
ContentCluster DOK
1 C C1 1 26 C C3 2
2 B C2 1 27 A C2 2
3 D C4 1 28 D C3 1
4 B C2 2 29 * C3 3
5 C C3 1 30 C C4 2
6 A C1 1 31 A C3 1
7 C C3 1 32 D C1 2
8 A C4 2 33 B C4 1
9 * C2 3 34 A C2 2
10 C C4 2 35 B C1 1
11 D C1 2 36 A C3 2
12 D C2 1 37 B C3 1
13 B C3 2 38 D C4 1
14 A C1 1 39 C C4 2
15 C C3 2 40 * C4 3
16 A C2 2 41 B C2 1
17 C C4 1 42 D C4 2
18 D C3 2 43 C C1 2
19 * C4 3 44 C C3 2
20 C C1 1 45 A C3 2
21 B C3 1 46 B C3 2
22 D C2 1 47 D C2 1
23 C C4 2 48 D C1 2
24 B C3 1 49 D C2 2
25 B C2 1 50 B C4 2
* Indicates a written-response item. See the following pages for the rubrics and examples of responses.
es for Content Standards and Depth of Knowledge (DOK) dDetailed objectiv escriptions can be found on the Nevada Department of Education Website.
Detailed objectives for Content Standards and Depth of Knowledge (DOK) descriptions can be found on the Nevada Department of Education Website.
Copyr�ght © 2009 by the Nevada Department of Educat�on Page 23

Page 24Copyr�ght © 2009 by the Nevada Department of Educat�on
Question: 9
Score Description 3 Student scores 3 points. 2 Student scores 2–2.75 points. 1 Student scores 0.25–1.75 points. 0 Student’s response provides insufficient evidence of appropriate skills or
knowledge to successfully accomplish the task. Blank No student response.
Description of Score Points:
Part A: score 1.5 points correct and complete graph OR
score 1.0 point 5 correctly plotted points OR
score 0.5 point some correct procedure
Part B: score 1.5 points correct and complete explanation OR
score 1.0 point partially correct or incomplete explanation ORscore 0.5 point vague explanation only

Page 25Copyr�ght © 2009 by the Nevada Department of Educat�on
Sample 3-Point Answer:
Part A:
Part B: Accept all correct and complete explanations.
Sample explanation: The rule to find the number of cards in his collection at the end of any month (m) is 4m 2 . So then you set that equal to 160 and find m . 4m 2 60 , 4m 58 , m 14.5 . Since m is not a whole number he will not have 160 cards at the end of any month.
OR
At the end of 14 months he will have 4 14 2 158 cards in his collection. At the end of 15 months he will have 5 15 2 162 cards in his collection. So he will never have 160 cards in his collection at the end of any month.

Page 26Copyr�ght © 2009 by the Nevada Department of Educat�on
Question: 19
Score Description 3 Student scores 3 points. 2 Student scores 2–2.5 points. 1 Student scores 0.5–1.5 points. 0 Student’s response provides insufficient evidence of appropriate skills or
knowledge to successfully accomplish the task. Blank No student response.
Description of Score Points:
Part A: score 1.0 point correct and complete explanation OR
score 0.5 point incomplete or vague explanation
Part B: score 1.0 point correct and complete explanation OR
score 0.5 point incomplete or vague explanation
Part C: score 1.0 point correct and complete explanation OR
score 0.5 point incomplete or vague explanation
Sample 3-Point Answer:
Part A: Accept all correct and complete explanations.
Sample explanation: On the first measurement day, the median height is in the
6 to 8 cm interval. On the second measurement day, the median height is in the 10 to 12 cm interval. The median of the heights increased.

Page 27Copyr�ght © 2009 by the Nevada Department of Educat�on
Part B: Accept all correct and complete explanations. A complete explanation must include the idea that the heights are more spread out on the second measurement day.
Sample explanation: The heights of the bean plants are much more spread out on the second measurement day. On the first measurement day the range is between 6 and 10 . It could be just above 6 because the maximum plant height could be 10 cm and the minimum plant height could be a little less than 4 cm, and 10 4 6 . It could be just a little less than 10 cm because the maximum height could be just under 12 cm and the minimum height could be 2 cm, and 12 2 10 . On the second measurement day the range is between 12 and 16 .
Part C: Accept all correct and complete explanations. A complete explanation must include the idea that the plants grew at different rates.
Sample explanation: Some of the plants grew faster than others. You can tell because the maximum height range increased much faster than the minimum height range. Some plants must have grown at least 6 cm to get from the 10-12 cm interval to the 18-20 cm interval. Some plants in the 2-4 cm and 4-6 cm intervals on the first measurement day must have grown less than 4 cm because there are two plants in the 4-6 cm interval on the second measurement day. Those two plants must have been on the 2-7 cm or 4-6 cm intervals on the first measurement day because the plants can’t shrink.

Page 28Copyr�ght © 2009 by the Nevada Department of Educat�on
Question: 29
Score Description 3 Student scores 3 points. 2 Student scores 2–2.5 points. 1 Student scores 0.5–1.5 points. 0 Student’s response provides insufficient evidence of appropriate skills or
knowledge to successfully accomplish the task. Blank No student response.
Description of Score Points:
Part A: score 1.5 points correct answer with correct and complete work OR
score 1.0 point correct answer with incomplete work OR
incorrect answer due to a calculation error (work must be shown)
OR score 0.5 point correct answer with no work
OR some correct procedure
Part B: score 1.5 points correct answer with correct and complete work OR
score 1.0 point correct answer with incomplete work OR
incorrect answer due to a calculation error (work must be shown)
OR score 0.5 point correct answer with no work
OR some correct procedure
Note: A student who does not label their answer in Part B with A.M. cannot score a 3 .

Page 29Copyr�ght © 2009 by the Nevada Department of Educat�on
Sample 3-Point Answer:
Part A: 1 hour 12 minutesThe total time between getting out of school and beingat the game:
2:57 to 6:57 = 4 hours and 6:57 to 7:15 = 18 minutes, so 4 hours 18 minutes Time Regina will not use playing basketball:
24 minutes 1 hour 15 minutes +1 hour 27 minutes 2 hours 66 minutes, or 3 hours 6 minutes
Find greatest amount of time Regina can spend playing basketball:
4 hours 18 minutes –3 hours 6 minutes 1 hours 12 minutes
(or equivalent work)
Part B: 12:05 A.M.Add game time and drive time:
2 hours 48 minutes 1 hour 27 minutes
+ 35 minutes3 hours 110 minutes, or 4 hours 50 minutes
Starting at 7:15 P.M., 4 hours 50 minutes later is 5 minutes after midnight or 12:05 A.M.(or equivalent work)
Page 30Copyr�ght © 2009 by the Nevada Department of Educat�on
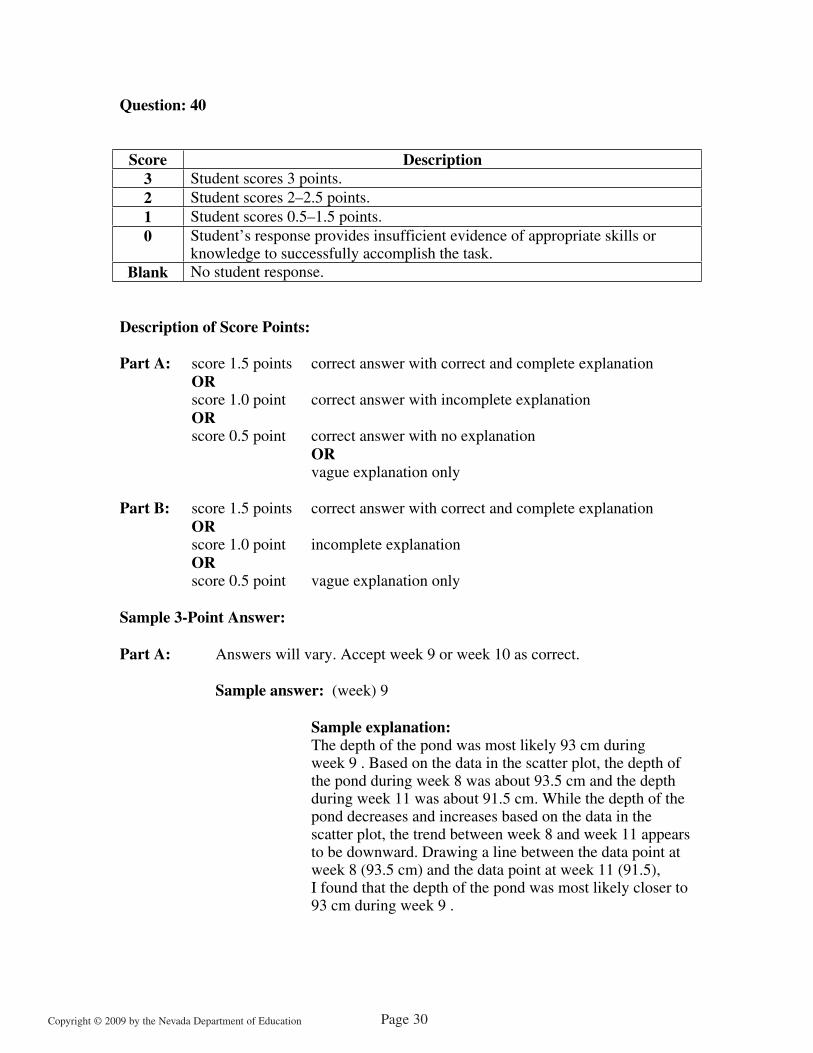
Question: 40
Score Description 3 Student scores 3 points. 2 Student scores 2–2.5 points. 1 Student scores 0.5–1.5 points. 0 Student’s response provides insufficient evidence of appropriate skills or
knowledge to successfully accomplish the task. Blank No student response.
Description of Score Points:
Part A: score 1.5 points correct answer with correct and complete explanationOR
score 1.0 point correct answer with incomplete explanationOR
score 0.5 point correct answer with no explanation OR
vague explanation only
Part B: score 1.5 points correct answer with correct and complete explanationOR
score 1.0 point incomplete explanation OR
score 0.5 point vague explanation only
Sample 3-Point Answer:
Part A: Answers will vary. Accept week 9 or week 10 as correct.
Sample answer: (week) 9
Sample explanation: The depth of the pond was most likely 93 cm duringweek 9 . Based on the data in the scatter plot, the depth of the pond during week 8 was about 93.5 cm and the depth during week 11 was about 91.5 cm. While the depth of the pond decreases and increases based on the data in the scatter plot, the trend between week 8 and week 11 appears to be downward. Drawing a line between the data point at week 8 (93.5 cm) and the data point at week 11 (91.5),I found that the depth of the pond was most likely closer to 93 cm during week 9 .
Page 3�Copyr�ght © 2009 by the Nevada Department of Educat�on
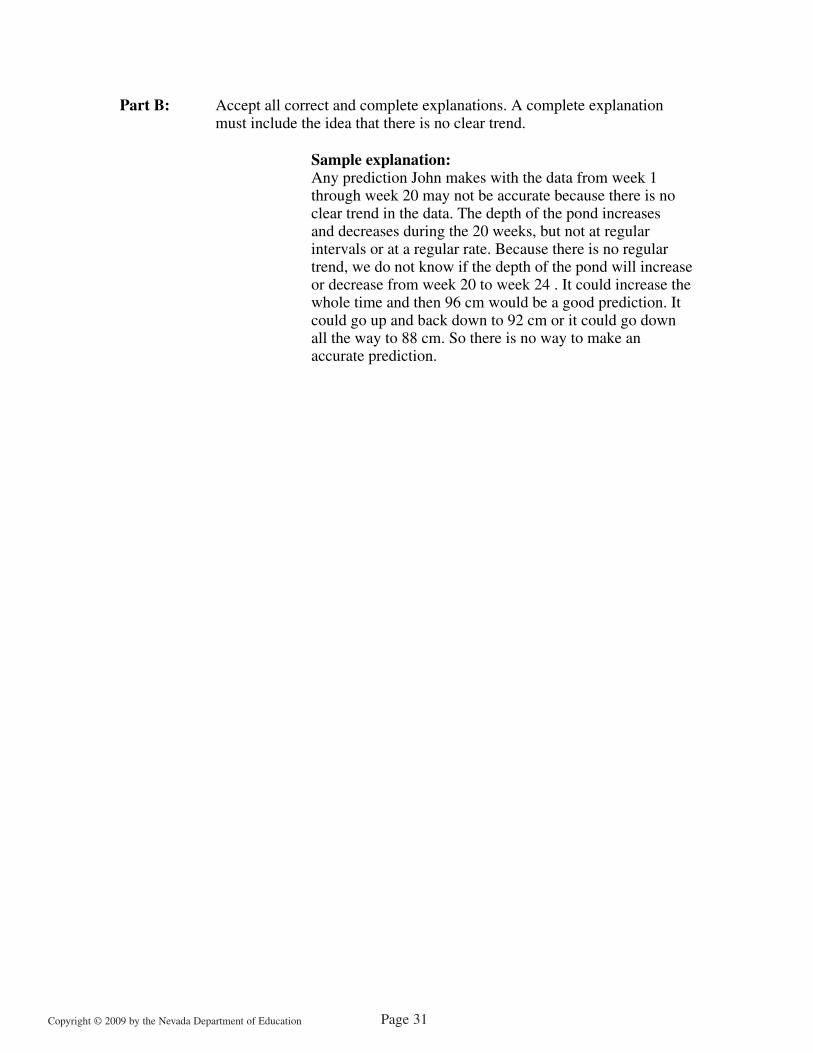
Part B: Accept all correct and complete explanations. A complete explanation must include the idea that there is no clear trend.
Sample explanation: Any prediction John makes with the data from week 1 through week 20 may not be accurate because there is no clear trend in the data. The depth of the pond increases and decreases during the 20 weeks, but not at regular intervals or at a regular rate. Because there is no regular trend, we do not know if the depth of the pond will increase or decrease from week 20 to week 24 . It could increase the whole time and then 96 cm would be a good prediction. It could go up and back down to 92 cm or it could go down all the way to 88 cm. So there is no way to make an accurate prediction.

Page 32Copyr�ght © 2009 by the Nevada Department of Educat�on
Nevada
DEPARTMENTOFEDUCATION
Ne
va
da
GRADE
7
Grade 7MATHEMATICS
Appendix II
AdministrativeSupportMaterials

Copyr�ght © 2009 by the Nevada Department of Educat�on Page 33
Mathematics
1.2.3.4.5.6.7.8.9.
10.
11.12.13.14.15.16.17.18.19.20.
A DCB
A DCB
A DCB
A DCB
A DCB
A DCB
A DCB
A DCB
A DCB
A DCB
A DCB
A DCB
A DCB
A DCB
A DCB
A DCB
A DCB
A DCB
A DCB
A DCB
A DCB
A DCB
A DCB
A DCB
A DCB
A DCB
A DCB
A DCB
A DCB
A DCB
A DCB
A DCB
A DCB
A DCB
21.22.23.24.25.26.27.28.29.30.
31.32.33.34.35.36.37.38.39.40.
A DCB
Written ResponseA DCB
Written Response Written Response
A DCB
A DCB
A DCB
A DCB
A DCB
A DCB
A DCB
A DCB
A DCB
A DCB
41.42.43.44.45.46.47.48.49.50.Written Response
Answer Document
Name:

DO NOT WRITE IN THIS SPACE
WRITTEN RESPONSEMATHEMATICS
DO
NOT
WRITE
IN
THIS
SPACE
STOP
Copyr�ght © 2009 by the Nevada Department of Educat�on Page 34

DO NOT WRITE IN THIS SPACE
WRITTEN RESPONSEMATHEMATICS
DO
NOT
WRITE
IN
THIS
SPACE
STOP
Copyr�ght © 2009 by the Nevada Department of Educat�on Page 35

DO NOT WRITE IN THIS SPACE
WRITTEN RESPONSEMATHEMATICS
DO
NOT
WRITE
IN
THIS
SPACE
STOP
Copyr�ght © 2009 by the Nevada Department of Educat�on Page 36

DO NOT WRITE IN THIS SPACE
WRITTEN RESPONSEMATHEMATICS
DO
NOT
WRITE
IN
THIS
SPACE
STOP
Copyr�ght © 2009 by the Nevada Department of Educat�on Page 37

Nev
ada
Dep
artm
ent
of E
duca
tion
CrT • Instructional Materials
GRADE
7Nevada
DEPARTMENTOFEDUCATION
Keith W. RheaultSuperintendent of Public Instruction
Office of Assessment, Program Accountability, and Curriculum 775-687-9188