instagram report
TRANSCRIPT
trackmaven.com @trackmaven
TrackMaven presents
The Fortune 500 Instagram Report
Table of Contents
What is Instagram? ........................................................................................................................................... 1!What Fortune 500 Companies use Instagram? .......................................................................................... 2
Fortune 500 Posting Strategies .................................................................................................................... 5
What Filters are the Fortune 500 Choosing? ............................................................................................. 12
How are followers interacting with the Fortune 500 on Instagram? ...................................................... 13
Case Study: FedEx Hashtagging their Way to Success ............................................................................ 17!Instagram as a Social Discovery Platform ................................................................................................... 17!
As Instagram rapidly expands to over 150 million users, there are many unanswered questions as to how big brands and companies are using it. TrackMaven explored and analyzed the rate of adoption, posting photos and videos, filters and interactions of the US Fortune 500 on Instagram. Looking at Fortune 500, there are identifiable trends, tactics, and strategies that map out the most effective ways other brands can use Instagram.
What is Instagram?
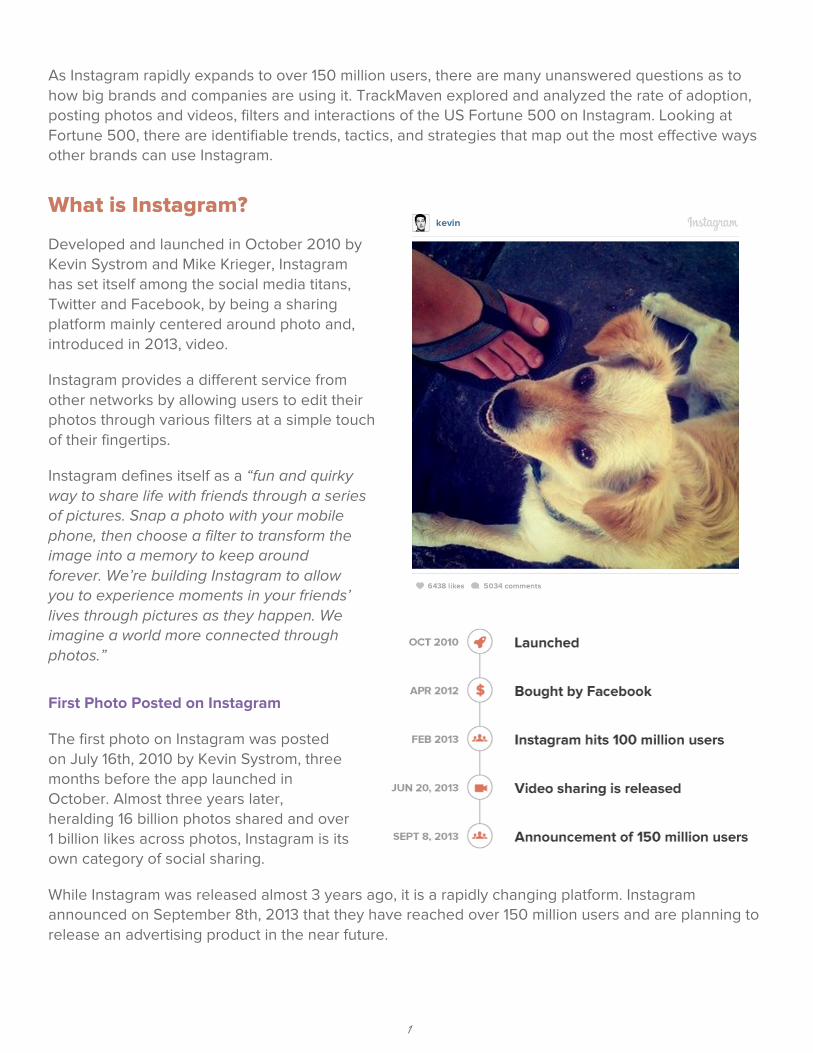
Developed and launched in October 2010 by Kevin Systrom and Mike Kri ger, Instagram has set itself among the social media titans Twitter and Facebook by being a sharing platform mainly centered around photo and, introduced in 2013, vid .
Instagram provides a different service from other networks by allowing users to edit their photos through various filters at a simple touch of their fingertips.
Instagram defines itself as a “fun and quirky way to share life with friends through a series of pictures. Snap a photo with your mobile phone, then choose a filter to transform the image into a memory to keep around forever. We’re building Instagram to allow you to experience moments in your friends’ lives through pictures as they happen. We imagine a world more connected through photos.”
First Photo Posted on Instagram
The first photo on Instagram was posted on July 16th, 2010 by Kevin Systrom, three months before the app launched in October. Almost three years later, heralding 16 billion photos shared and over 1 billion likes across photos, Instagram is its own category of social sharing.
While Instagram was released almost 3 years ago, it is a rapidly changing platform. Instagram announced on September 8th, 2013 that they have reached over 150 million users and are planning to release an advertising product in the near future.
1
The Fortune 500 Instagram Report
At TrackMaven, we aren’t strangers to Instagram. From brunches and latte art to the casual corgi walking by, we enjoy using Instagram for the ability to quickly capture an engaging photo.
For this report, we took the 2013 Fortune 500 list and loaded TrackMaven with the Instagram handles for every brand that had one. Out of these 500 companies, 123 have Instagram accounts. We collected all of the media posted by these companies over their entire history on Instagram through September 17, 2013 amounting to over 19,009 pictures and 243 videos.
For each photo and video, we captured the number of interactions on the post and meta information like which was used. Throughout this report, we will define the sum of comments and likes on a post as “interactions.”
What Fortune 500 Companies use Instagram?
A. The Rate of Adoption by the Fortune 500
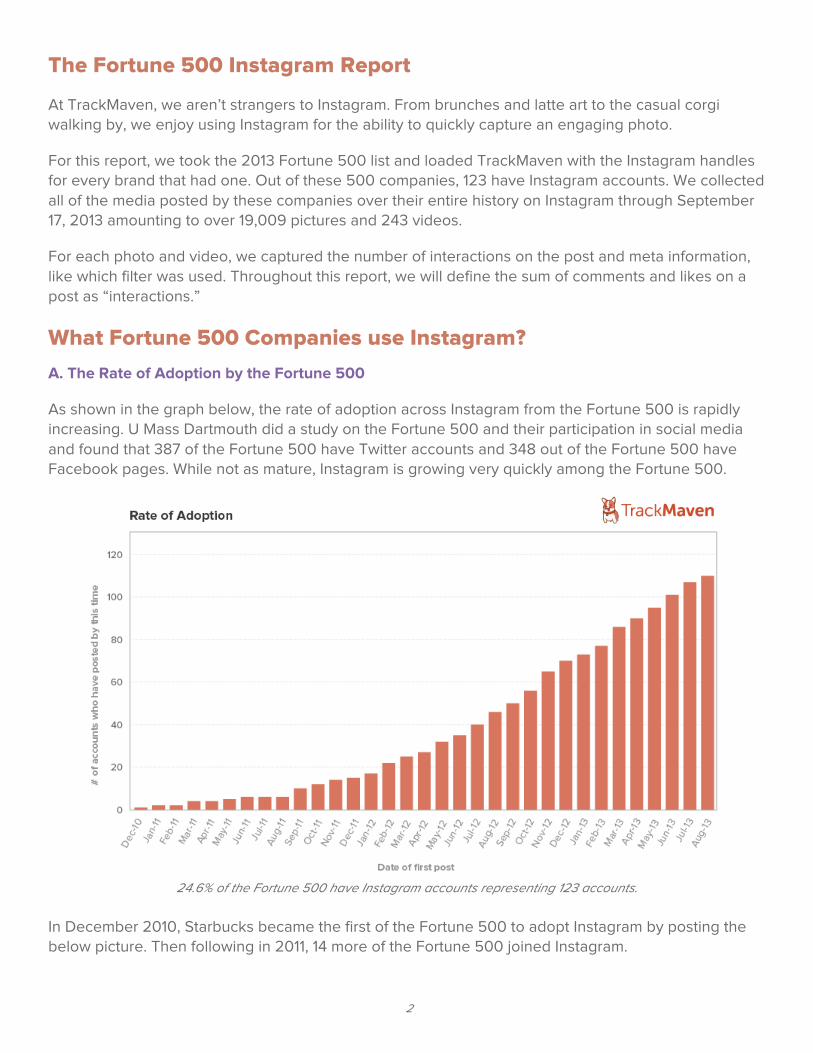
As shown in the graph below, the rate of adoption across Instagram from the Fortune 500 is rapidly increasing. U Mass Dartmouth did a study on the Fortune 500 and their participation in social media and found that 387 of the Fortune 500 have Twitter accounts and 348 out of the Fortune 500 have Facebook pages. While not as mature, Instagram is growing very quickly among the Fortune 500.
24.6% of the Fortune 500 have Instagram accounts representing 123 accounts.
In December 2010, Starbucks became the first of the Fortune 500 to adopt Instagram by posting the below picture. Then following in 2011, 14 more of the Fortune 500 joined Instagram.
2
F IR S T P H O T O S O F T H E F IR S T 3 F O R T U N E 5 0 0 B R A N D S T O A D O P T IN S T A G R A M :
Starbucks Southwest Airlines AutoNation
Out of the 123 Fortune 500 companies that have registered Instagram accounts, 91% (112 companies) have made at least one post on Instagram and 17% (85 companies) have posted at least one picture or video to Instagram over the past 30 days.
% W IT H IN S T A G R A M A C C O U N T S V S . % A C T IV E O N IN S T A G R A M
In this graph, you can see how active different segments of the Fortune 500 list are on Instagram
3
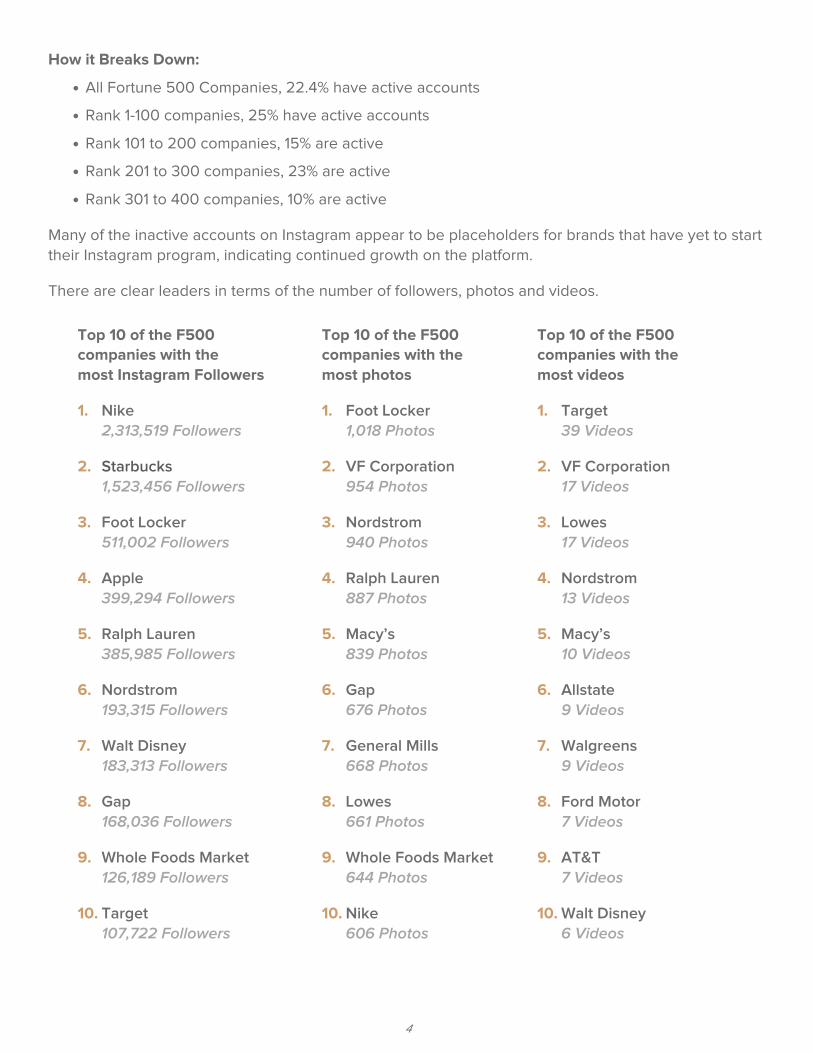
How it Breaks Down:
• All Fortune 500 Companies, 22.4% have active accounts
• Rank 1-100 companies, 25% have active accounts
• Rank 101 to 200 companies, 15% are active
• Rank 201 to 300 companies, 23% are active
• Rank 301 to 400 companies, 10% are active
Many of the inactive accounts on Instagram appear to be placeholders for brands that have yet to start their Instagram program, indicating continued growth on the platform.
There are clear leaders in terms of the number of followers, photos and videos.
Top 10 of the F500 companies with the most Instagram Followers
1. Nike2,313,519 Followers
2. Starbucks1,523,456 Followers
3. Foot Locker511,002 Followers
4. Apple399,294 Followers
5. Ralph Lauren385,985 Followers
6. Nordstrom193,315 Followers
7. Walt Disney183,313 Followers
8. Gap168,036 Followers
9. Whole Foods Market126,189 Followers
10. Target107,722 Followers
Top 10 of the F500 companies with the most photos
1. Foot Locker1,018 Photos
2. VF Corporation954 Photos
3. Nordstrom940 Photos
4. Ralph Lauren887 Photos
5. Macy’s839 Photos
6. Gap676 Photos
7. General Mills668 Photos
8. Lowes661 Photos
9. Whole Foods Market644 Photos
10. Nike606 Photos
Top 10 of the F500 companies with the most videos
1. Target39 Videos
2. VF Corporation17 Videos
3. Lowes17 Videos
4. Nordstrom13 Videos
5. Macy’s10 Videos
6. Allstate9 Videos
7. Walgreens9 Videos
8. Ford Motor7 Videos
9. AT&T7 Videos
10. Walt Disney6 Videos
4
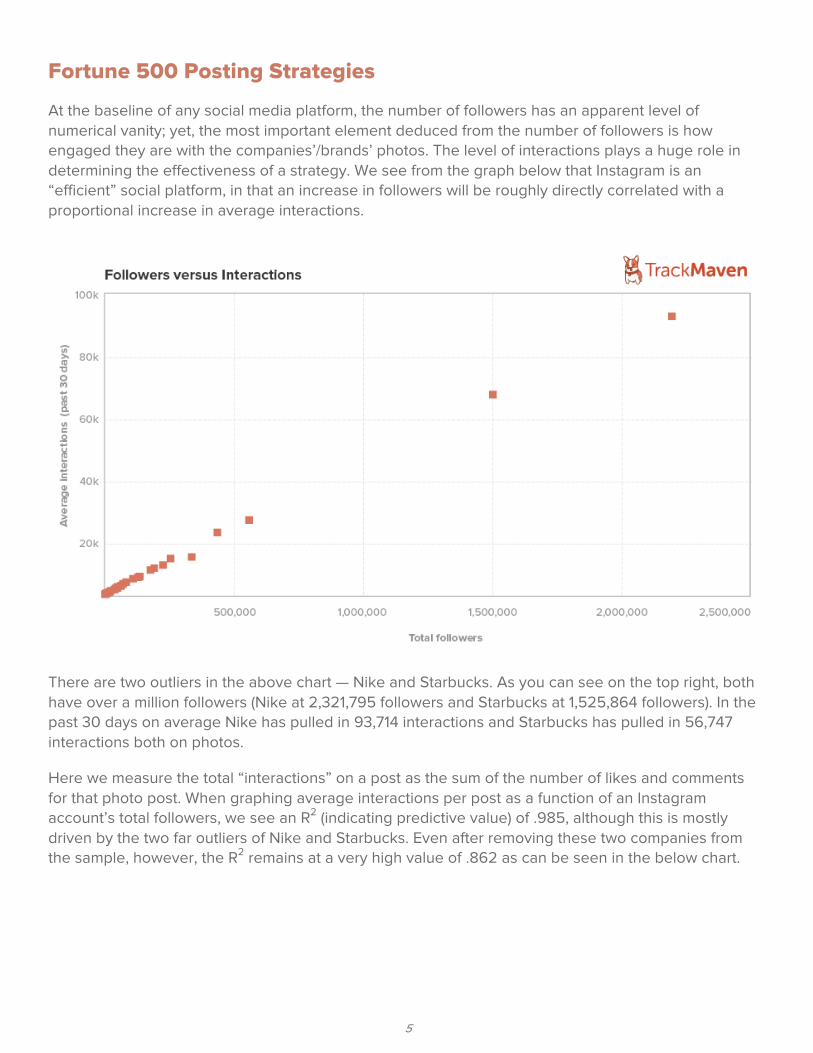
Fortune 500 Posting Strategies
At the baseline of any social media platform, the number of followers has an apparent level of numerical vanity; yet, the most important element deduced from the number of followers is how engaged they are with the companies’/brands’ photos. The level of interactions plays a huge role in determining the effectiveness of a strategy. We see from the graph below that Instagram is an “efficient” social platform, in that an increase in followers will be roughly directly correlated with a proportional increase in average interactions.
There are two outliers in the above chart — Nike and Starbucks. As you can see on the top right, both have over a million followers (Nike at 2,321,795 followers and Starbucks at 1,525,864 followers). In the past 30 days on average Nike has pulled in 93,714 interactions and Starbucks has pulled in 56,747 interactions both on photos.
Here we measure the total “interactions” on a post as the sum of the number of likes and comments for that photo post. When graphing average interactions per post as a function of an Instagram account’s total followers, we see an R2 (indicating predictive value) of .985, although this is mostly driven by the two far outliers of Nike and Starbucks. Even after removing these two companies from the sample, however, the R2 remains at a very high value of .862 as can be seen in the below chart.
5
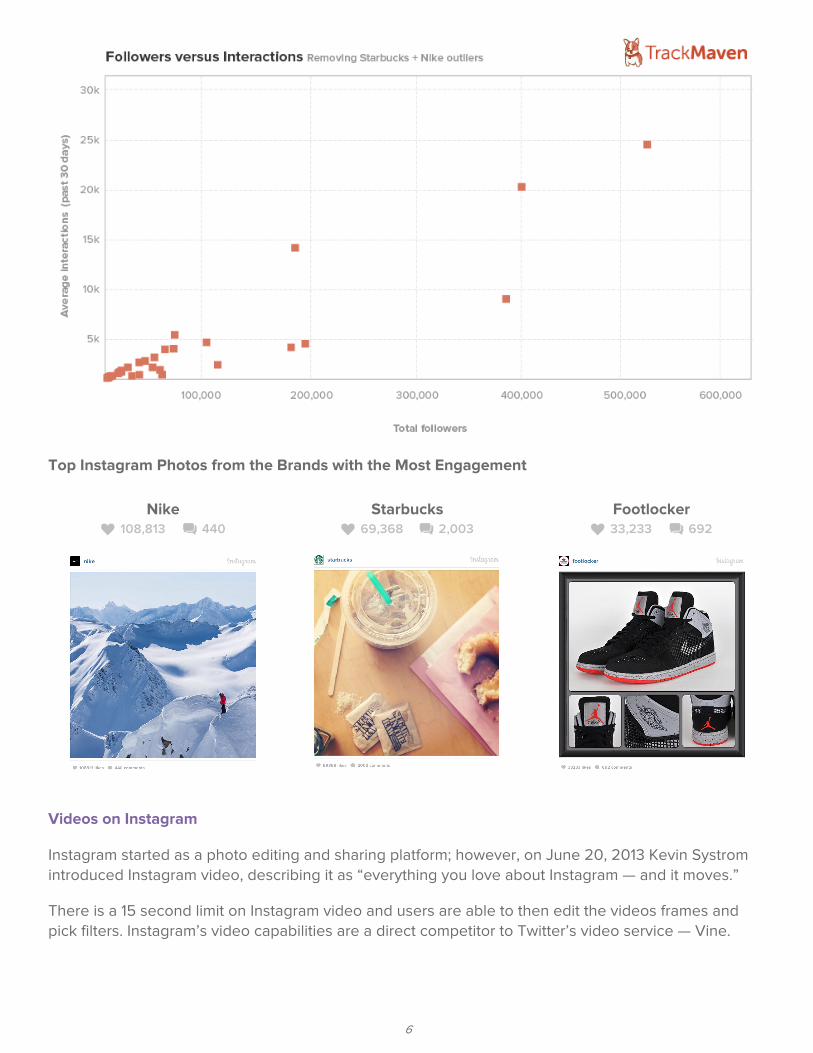
Top Instagram Photos from the Brands with the Most Engagement
Nike k 108,813 q 440
Starbucks k 69,368 q 2,003
Footlocker k 33,233 q 692
Videos on Instagram
Instagram started as a photo editing and sharing platform; however, on June 20, 2013 Kevin Systrom introduced Instagram video, describing it as “everything you love about Instagram — and it moves.”
There is a 15 second limit on Instagram video and users are able to then edit the videos frames and pick filters. Instagram’s video capabilities are a direct competitor to Twitter’s video service — Vine.
6
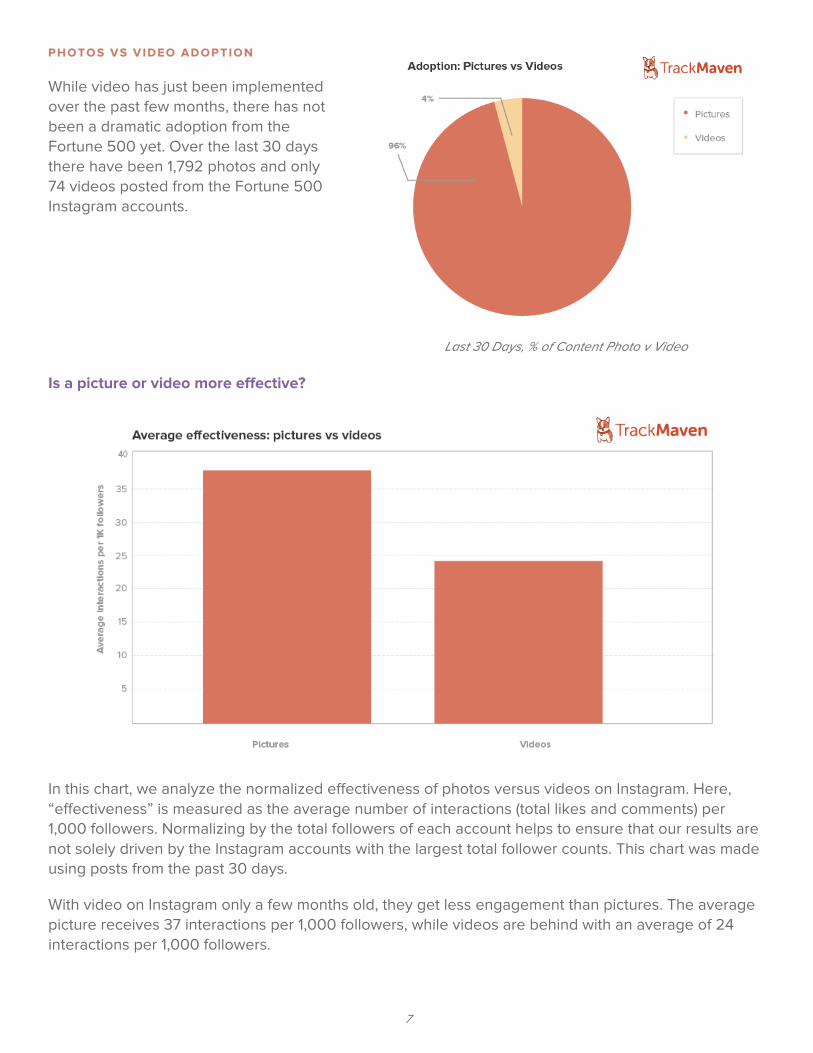
P H O T O S V S V ID E O A D O P T IO N
While video has just been implemented over the past few months, there has not been dramatic adoption from the Fortune 500 yet. Over the last 30 days there have been 1,792 photos and only 74 videos posted from the Fortune 500 Instagram accounts.
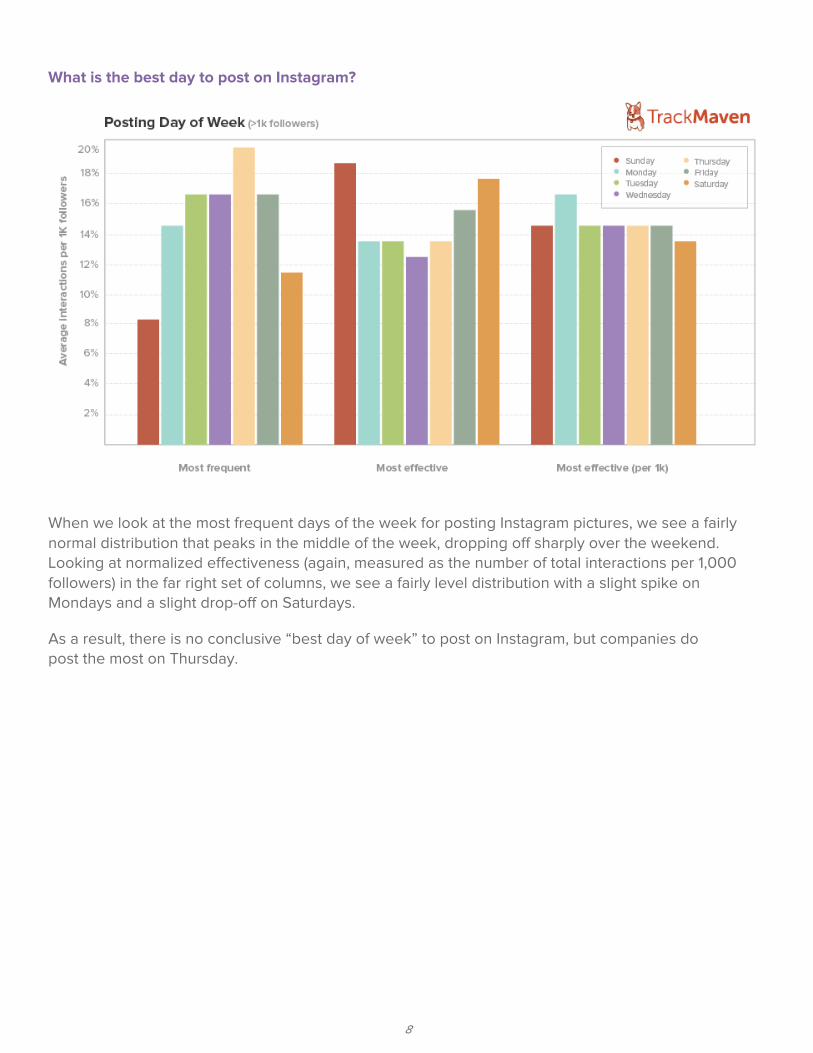
Is a picture or video more effective?
In this chart, we analyze the normalized effectiveness of photos versus videos on Instagram. Here, “effectiveness” is measured as the average number of interactions (total likes and comments) per 1,000 followers. Normalizing by the total followers of each account helps to ensure that our results are not solely driven by the Instagram accounts with the largest total follower counts. This chart was made using posts from the past 30 days.
With video on Instagram only a few months old, they get less engagement than pictures. The average p receives 37 interactions per 1 000 followers, while videos are behind with an average of 24 interactions per 1,000 followers.
Last 30 Days, % of Content Photo v Video
7
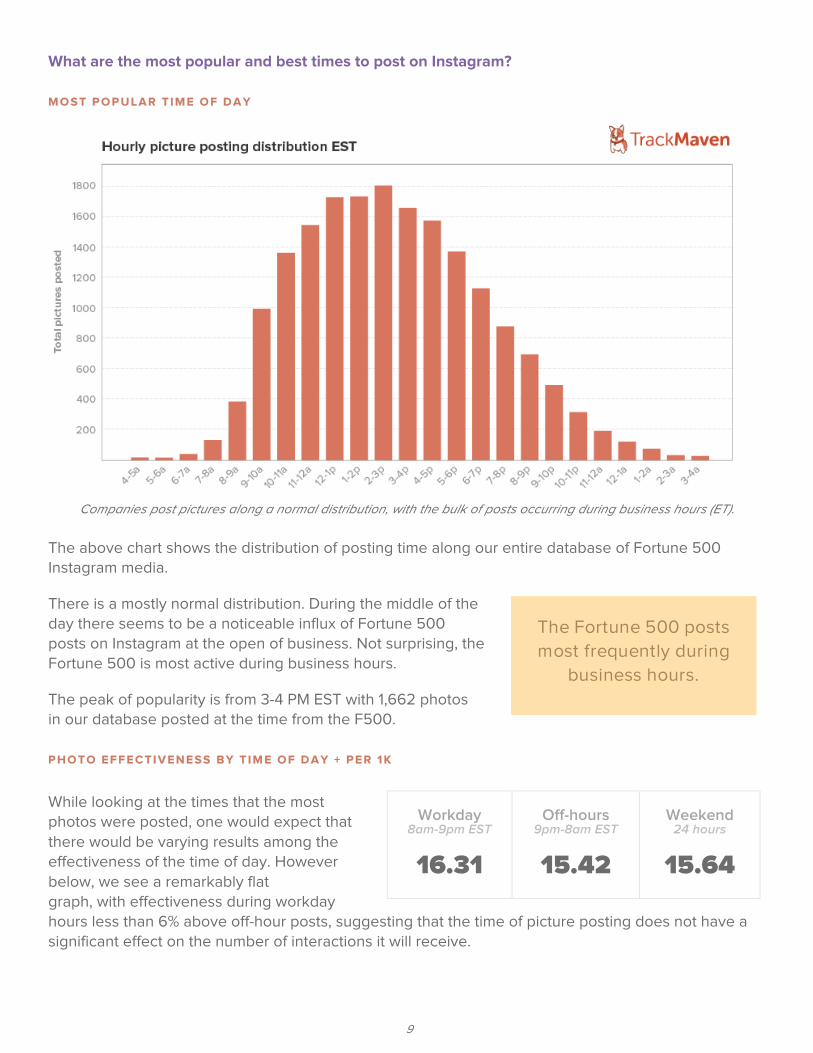
What is the best day to post on Instagram?
When we look at the most frequent days of the week for posting Instagram pictures, we see a fairly normal distribution that peaks in the middle of the week, dropping off sharply over the weekend. Looking at normalized effectiveness (again, measured as the number of total interactions per 1,000 followers) in the far right set of columns, we see a fairly level distribution with a slight spike on Mondays and a slight drop-off on Saturdays.
As a result, there is no conclusive “best day of week” to post on Instagram, but do post the most on Thursday.
8
What are the most popular and best times to post on Instagram?
M O S T P O P U L A R T IM E O F D A Y
Companies post pictures along a normal distribution, with the bulk of posts occurring during business hours (ET).
The above chart shows the distribution of posting time along our entire database of Fortune 500 Instagram media.
There is a mostly normal distribution. During the middle of the day there seems to be a noticeable influx of Fortune 500 posts on Instagram at the open of business. Not surprising, the Fortune 500 is most active during business hours.
The peak of popularity is from 3-4 PM E T with 1,662 photos in our database posted at the time from the F500.
P H O T O E F F E C T IV E N E S S B Y T IM E O F D A Y + P E R 1 K
While looking at the times that the most photos were posted, one would expect that there would be varying results among the effectiveness of the time of day. However
, we see a remarkably flat graph, with effectiveness during workday hours less than 6% above off-hour posts, suggesting that the time of picture posting does not have a significant effect on the number of interactions it will receive.
Workday 8am-9pm EST
16.31
Off-hours9pm-8am EST
15.42
Weekend 24 hours
15.64
The Fortune 500 posts most frequently during
business hours.
9
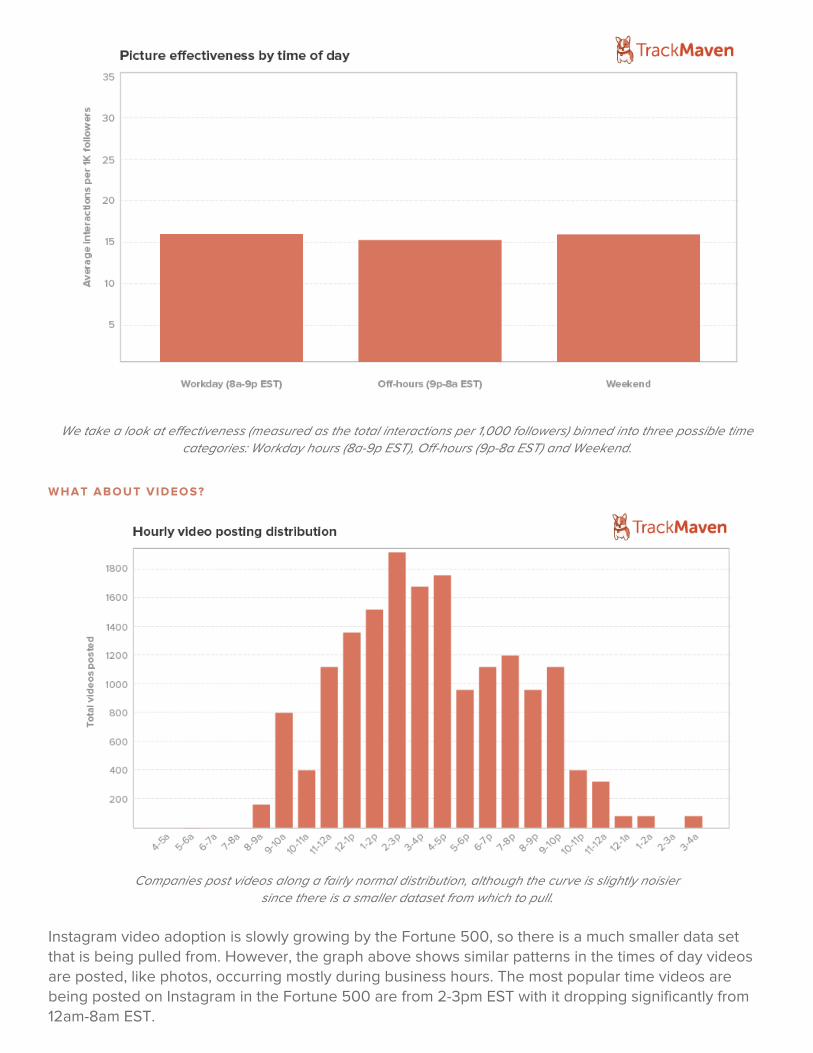
We take a look at effectiveness (measured as the total interactions per 1,000 followers) binned into three possible time categories: Workday hours (8a-9p EST), Off-hours (9p-8a EST) and Weekend.
W H A T A B O U T V ID E O S ?
Companies post videos along a fairly normal distribution, although the curve is slightly noisier since there is a smaller dataset from which to pull.
Instagram video adoption is slowly growing by the Fortune 500, so there is a much smaller data set that is being pulled from. However, the graph above shows similar patterns in the times of day videos are posted like photos occurring mostly during business hours. The most popular time videos are being posted on Instagram n the Fortune 500 from 2-3pm EST with it dropping significantly from 12am-8am EST.
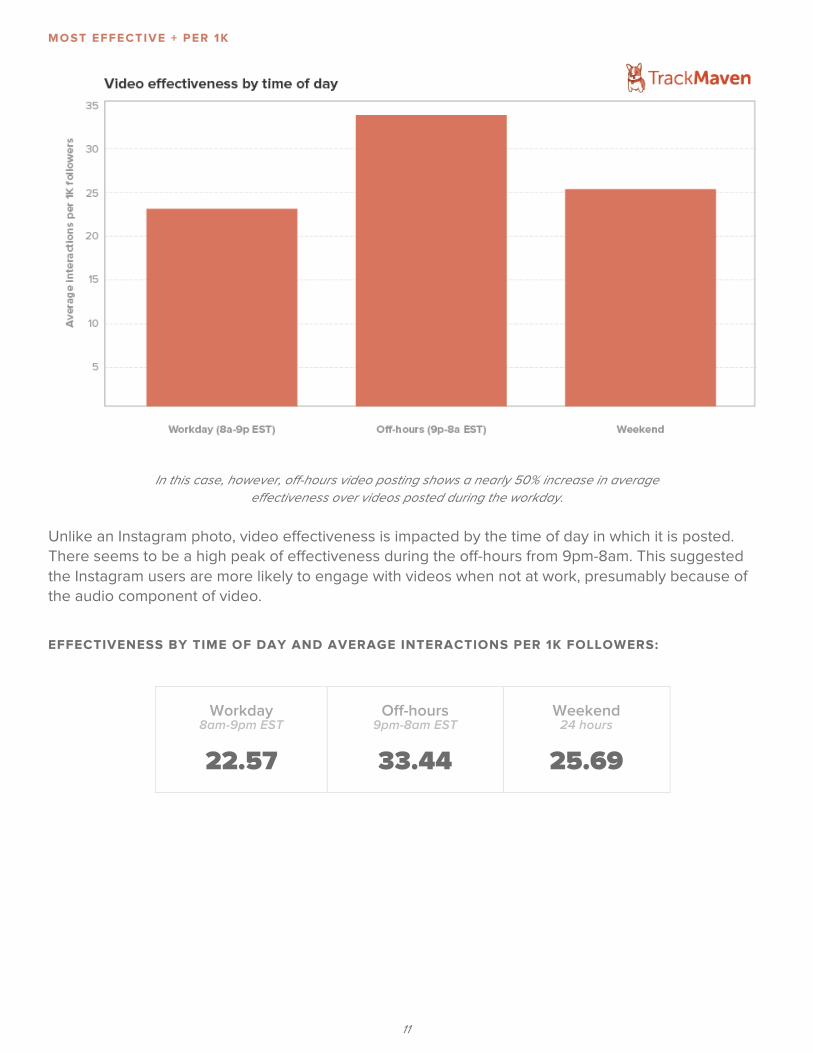
M O S T E F F E C T IV E + P E R 1 K
In this case, however, off-hours video posting shows a nearly 50% increase in average effectiveness over videos posted during the workday.
Unlike an Instagram photo, video effectiveness is impacted by the time of day in which it is posted. There seems to be a high peak of effectiveness during the off-hours from 9pm-8am. This suggested the Instagram users are more likely to engage with videos when not at work, presumably because of the audio component of video.
EFFECTIVENESS BY TIME OF DAY AND AVERAGE INTERACTIONS PER 1K FOLLOWERS:
Workday 8am-9pm EST
22.57
Off-hours 9pm-8am EST
33.44
Weekend 24 hours
25.69
11
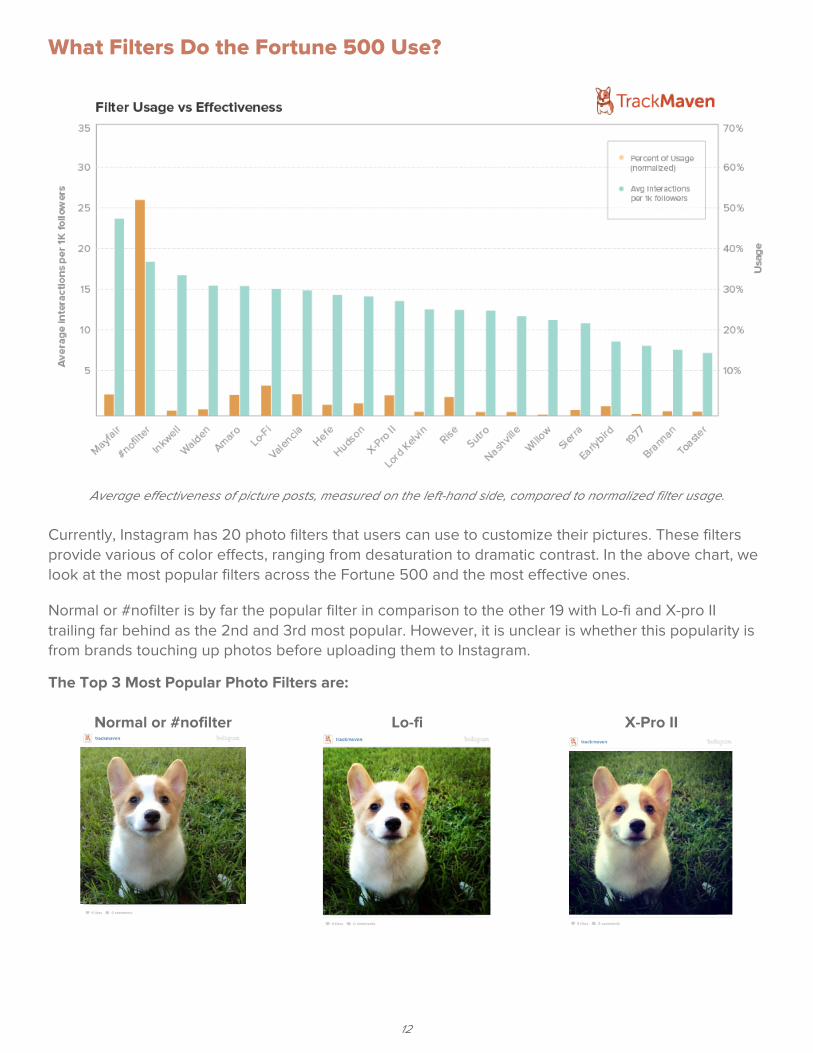
What Filters Do the Fortune 500 Use?
Average effectiveness of picture posts, measured on the left-hand side, compared to normalized filter usage.
Currently, Instagram has 20 photo filters that users can use to customize their pictures. These filters provide of color effects, ranging from desaturation to dramatic contrast. In the above chart, we look at the most popular filters across the Fortune 500 and the most effective ones.
Normal or #nofilter is by far the popular filter in comparison to the other 19 with Lo-fi and X-pro II trailing far behind as the 2nd and 3rd most popular. However, it is unclear is whether this popularity is from brands touching up photos before uploading them to Instagram.
The Top 3 Most Popular Photo Filters are:
Normal or #nofilter Lo-fi X-Pro II
12
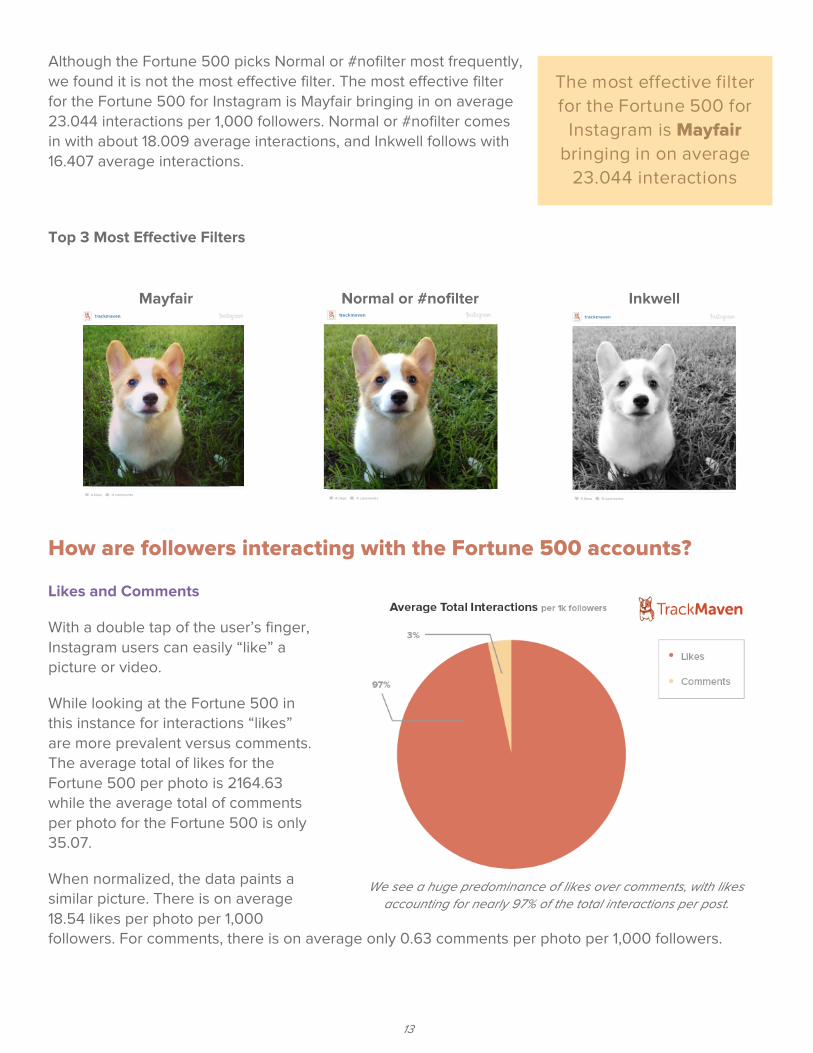
Although the Fortune 500 picks Normal or #nofilter most frequently, we found it is not the most effective filter. The most effective filter for the Fortune 500 for Instagram is Mayfair bringing in on average 23.044 interactions per 1 000 followers. Normal or #nofilter comes in with about 18.009 average interactions and Inkwell follows with 16.407 average interactions.
Top 3 Most Effective Filters
How are followers interacting with the Fortune 500 accounts?
Likes and Comments
With a double tap of the user’s finger, Instagram users can easily “like” a picture or video.
While looking at the Fortune 500 in this instance for interactions “likes” are more prevalent versus comments. The average total of likes for the Fortune 500 per photo is 2164.63 while the average total of comments per photo for the Fortune 500 is only 35.07.
When normalized, the data paints a similar picture. There is on average 18.54 likes per photo per 1,000 followers. For comments, there is on average only 0.63 comments per photo per 1,000 followers.
Mayfair Normal or #nofilter Inkwell
We see a huge predominance of likes over comments, with likes accounting for nearly 97% of the total interactions per post.
The most effective filter for the Fortune 500 for
Instagram is Mayfair bringing in on average
23.044 interactions
13
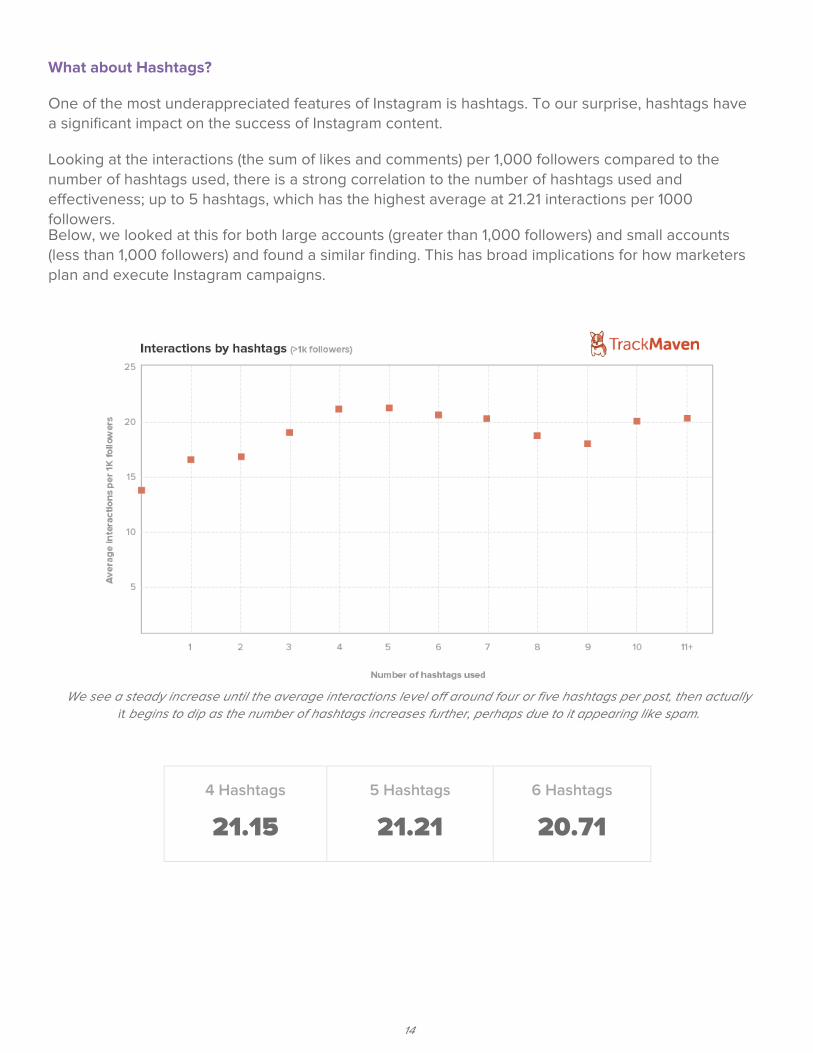
What about Hashtags?
One of the most underappreciated features of Instagram is hashtags. To our surprise, hashtags ha a significant impact on the success of Instagram content.
Looking at the interactions (the sum of likes and comments) per 1,000 followers compared to the number of hashtags used, there is a strong correlation to the number of hashtags used and effectiveness p to 5 hashtags which has the highest average at 21.21 interactions per 1000 followers. Below, we looked at this for both large accounts (greater than 1 000 followers) and small accounts (less than 1 000 followers) and found a similar finding. This has broad implications for how marketers plan and execute Instagram campaigns.
We see a steady increase until the average interactions level off around four or five hashtags per post, then actually begins to dip as the number of hashtags increases further perhaps due to it appearing like spam.
4 Hashtags
21.15
5 Hashtags
21.21
6 Hashtags
20.71
14
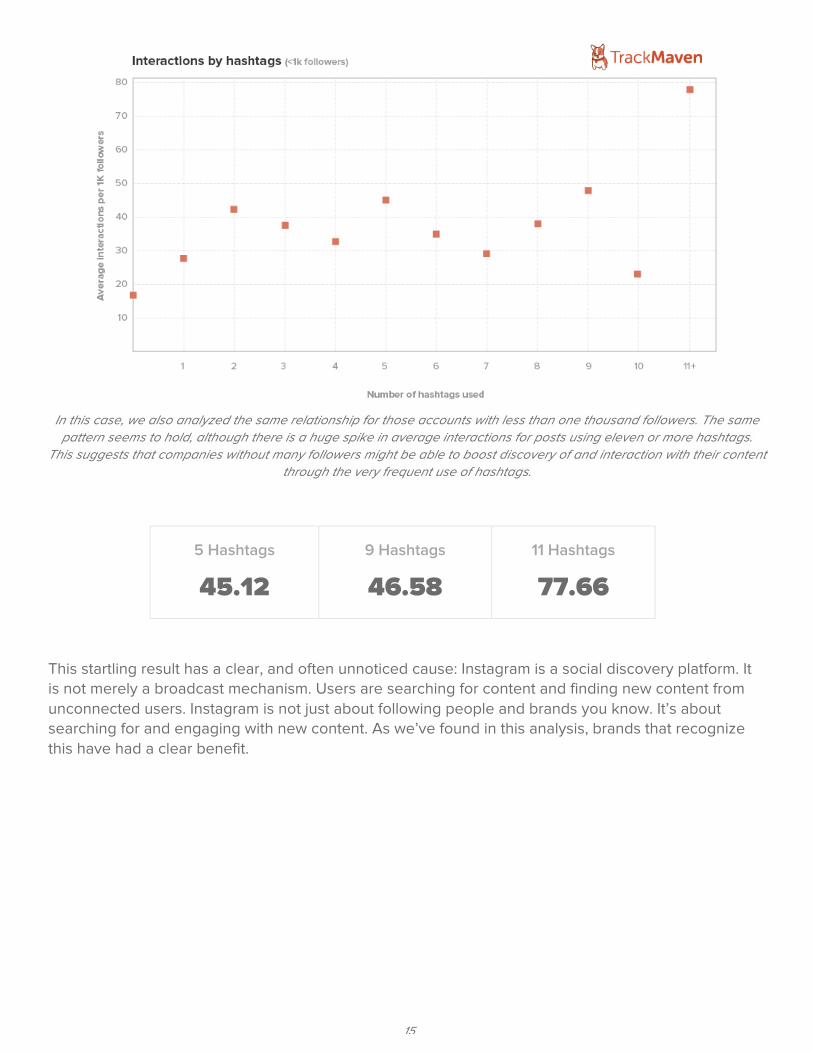
In this case, we also analyzed the same relationship for those accounts with less than one thousand followers. The same pattern seems to hold, although there is a huge spike in average interactions for posts using eleven or more hashtags.
This suggests that companies without many followers might be able to boost discovery of and interaction with their content through the very frequent use of hashtags.
5 Hashtags
45.12
9 Hashtags
46.58
11 Hashtags
77.66
This startling result has a clear, and often unnoticed cause: Instagram is a social discovery platform. It is not merely a broadcast mechanism. Users are searching for content and finding new content from unconnected users. Instagram is not just about following people and brands you know. It’s about searching for and engaging with new content. As we’ve found in this analysis, brands that recognize this have had a clear benefit.
15
Case Study: FedEx Hashtagging their Way to Success
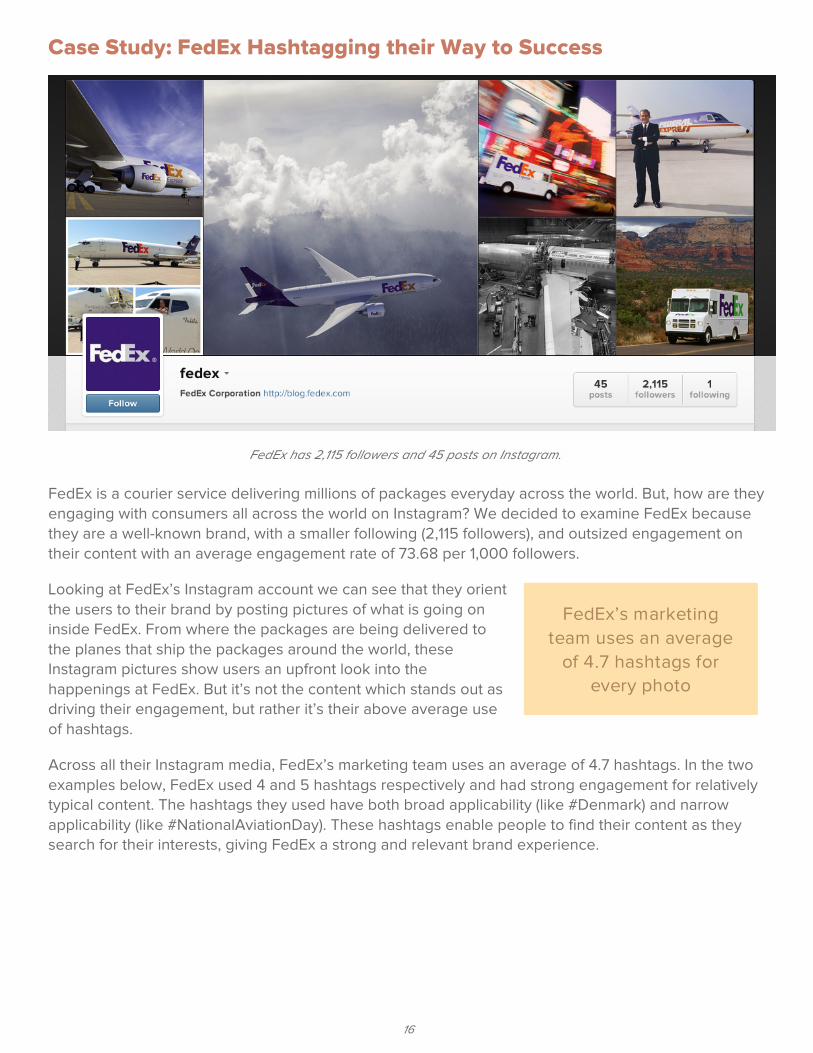
FedEx has 2,115 followers and 45 posts on Instagram.
FedEx is a courier service delivering millions of packages everyday across the world. But, how are they engaging with consumers all across the world on Instagram? We decided to examine FedEx because they are a well-known brand, with a smaller following (2,115 followers), and outsized engagement on their content with an average engagement rate of 73.68 per 1 000 followers.
Looking at FedEx’s Instagram account we can see that they orient the users to their brand by posting pictures of what is going on inside FedEx. From where the packages are being delivered to the planes that ship the packages around the world, these Instagram pictures show users an upfront look into the happenings at FedEx. But it’s not the content which stands out as driving their engagement, but rather it’s their above average use of hashtags.
Across all their Instagram media, FedEx’s marketing team uses an average of 4.7 hashtags. In the two examples below, FedEx used 4 and 5 hashtags respectively and had strong engagement for relatively typical content. The hashtags they used have both broad applicability (like #Denmark) and narrow applicability (like #NationalAviationDay). These hashtags enable people to find their content as they search for their interests, giving FedEx a strong and relevant brand experience.
FedEx’s marketing team uses an average
of 4.7 hashtags for every photo
16
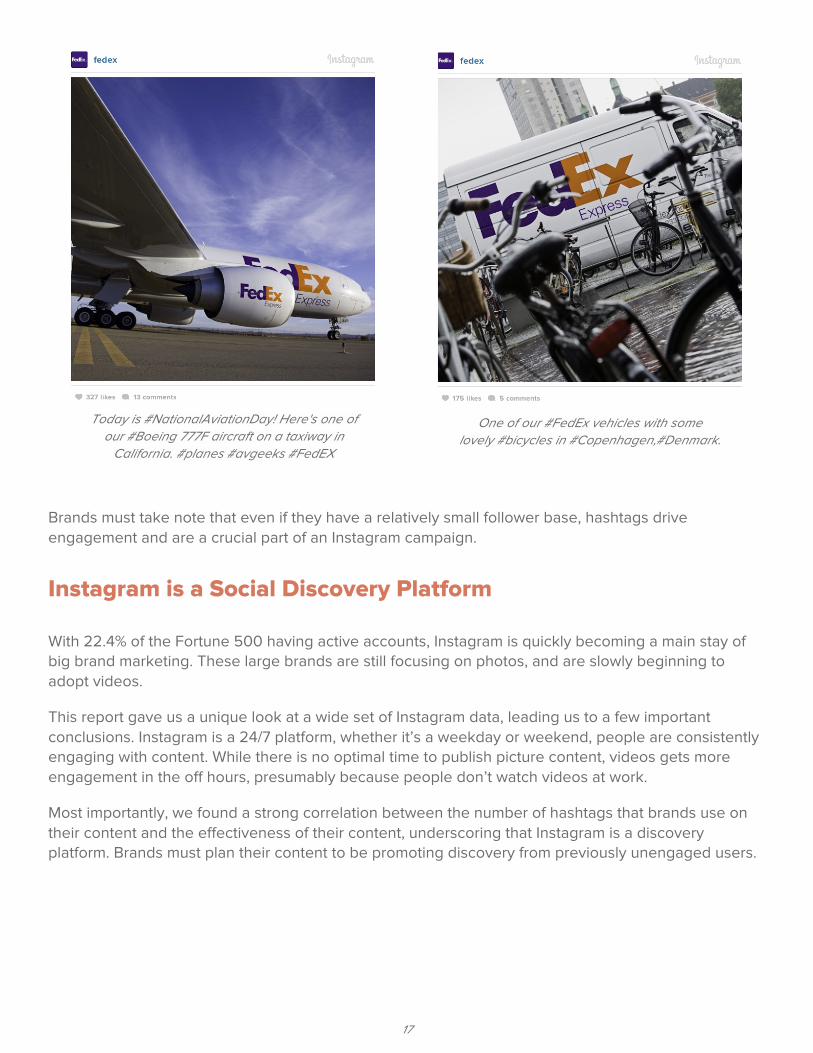
Today is #NationalAviationDay! Here's one of our #Boeing 777F aircraft on a taxiway in
California. #planes #avgeeks #FedEX
One of our #FedEx vehicles with some lovely #bicycles in #Copenhagen,#Denmark.
Brands must take note that even if they have a relatively small follower base, hashtags drive engagement and are a crucial part of an Instagram campaign.
Instagram is a Social Discovery Platform
With 22.4% of the Fortune 500 having active accounts, Instagram is quickly becoming a main stay of big brand marketing. These large brands are still focusing on photos, and are slowly beginning to adopt videos.
This report gave us a unique look at a wide set of Instagram data, leading us to a few important conclusions. Instagram is a 24/7 platform, whether it’s a weekday or weekend, people are consistently engaging with content. While there is no optimal time to publish picture content, videos gets more engagement in the off hours, presumably because people don’t watch videos at work.
Most importantly, we found a strong correlation between the number of hashtags that brands use on their content and the effectiveness of their content, underscoring that Instagram is a discovery platform. Brands must plan their content to be promoting discovery from previously unengaged users.
17