insights - mcshane partners
TRANSCRIPT

INVESTMENT TEAM
Daniele Donahoe, CFA
CEO & Chief Investment Officer
Elliott Van Ness, CFA
Director of Research & Portfolio Manager
Brittany Danahey, CFA
Portfolio Manager
Mary Rinehart, CFP®
Chairman & Portfolio Manager
WEALTH ADVISORY TEAM
Sandy Carlson, CFP®, CPA, CDFATM
President & Wealth Advisor
Brandon Davis, CFP®
Wealth Advisor
Leah Maybry, CPA
Wealth Advisor
Ryan Vaudrin, CFP®
Wealth Associate
Lorri Tomlin, RP®
Wealth Associate
Jeremy Williamson
Client Service Associate
SPECIAL POINTS OF INTEREST
Stock & Strategy Spotlight
Monthly Index Review
Around Rinehart
ELDER ABUSE: A GROWING SILENT CRIME
Elder abuse is being called the "Crime of the 21st Century." According to a U.S. Senate
Special Committee on Aging report, about 16 percent of America's elderly are
routinely abused. The problem is growing as longevity increases and the population of
seniors rise, creating more potential victims. Abuse can sometimes come in the form
of scams, such as strangers posing as agents from the Internal Revenue Service,
however, the majority of the time it comes from the hands of family members, friends,
or caregivers.
DIFFERENT TYPES OF ELDER ABUSE
The National Center on Elder Abuse distinguishes between several different types of
elder abuse. These include physical abuse, emotional abuse, neglect, healthcare and
financial/material exploitation.
Physical – Non-accidental use of force that results in physical pain, injury or
impairment. Includes inappropriate use of restraints or confinement.
Emotional/Psychological – Speaking or treating in ways that cause emotional pain
or distress including intimidation, humiliation, or threatening.
Page 1
INVESTMENT OVERVIEW
January 2017
Continued on page 8
FINDING VALUE IN 2017
By any measure, 2016 was a turbulent year for global financial markets, characterized
by exasperatingly persistent political and economic uncertainty. Mixed returns across
asset classes led to the awkward, but not entirely-unexpected, underperformance of
diversified portfolios relative to U.S. equities. With the S&P 500® returning +11.96%
in 2016, the performance of U.S. equities has been encouragingly resilient since the
election after a difficult start to the year. However, the S&P 500® is beginning to
exhibit traditional overbought signals and extended valuations relative to other out-of
-favor asset classes that might be positioned to outperform in 2017 as a result of mean
reversion and any disappointment with the implementation of the president-elect’s
pro-growth agenda.
The Shiller S&P 500® price-to-earnings (“PE”) ratio, which measures the price of the
S&P 500® relative to the index’s 10-year moving average earnings adjusted for
inflation, appears modestly expensive and is trading at 28.3x - a +17.92% premium to
its long-term average of 24.0x. In addition to being more-than-fully valued, the S&P
500® is approaching an overbought condition, as measured by several technical
indicators. For example, the S&P 500® is currently trading +2.00% above its 50-day
moving average (“MAVG”), well above the index’s historical average range. This
reflects pent-up buying activity fueled by renewed optimism for increased economic
growth. Moreover, in the weeks following the election, survey Continued on next page
insights
WEALTH ADVISORY OVERVIEW
data published by the American Association of Individual
Investors (“AAII”) showed a significant jump in the
percent of individual investors feeling “bullish” - from
23.6% on November 4th to 49.9% on November 25th. This
represents the highest level of bullishness since January
2nd 2015, at which point the S&P 500® proceeded to
decline -3.18% before bottoming on January 15th 2015.
Given the scarcity of value in U.S. equities and cautionary
contrarian indicators, the Investment Team is
concentrating on finding unique value opportunities in
2017 that provide long-term value to investors.
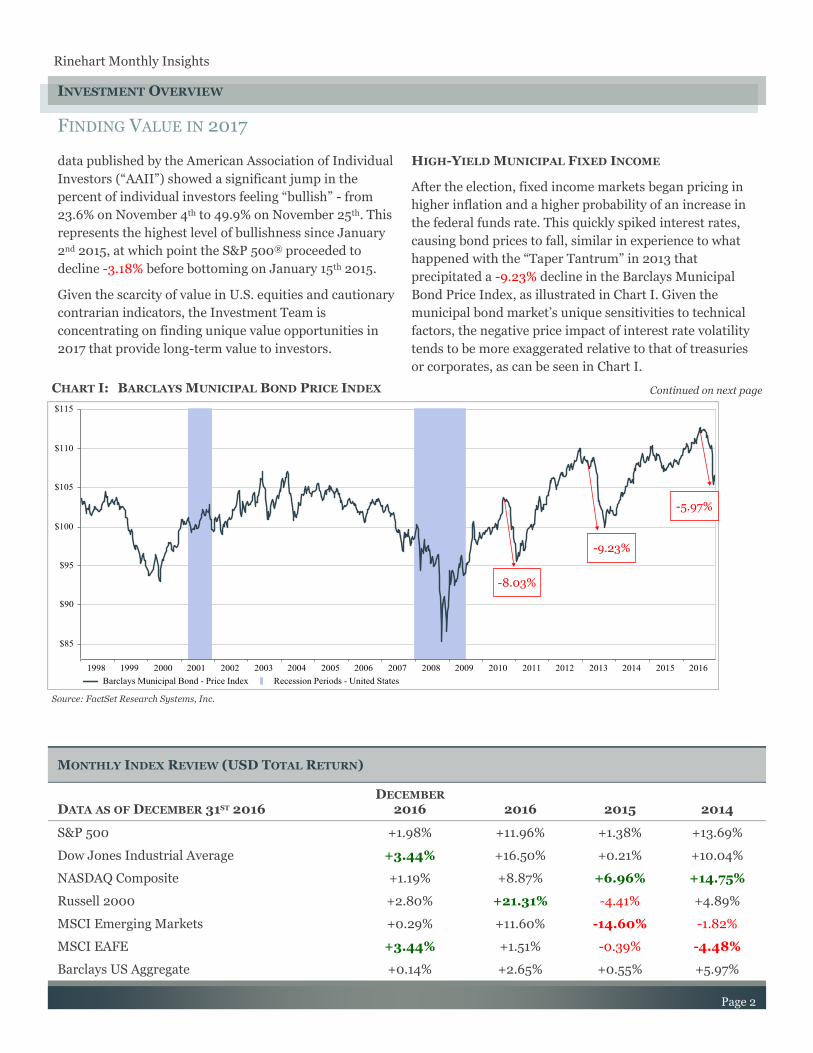
HIGH-YIELD MUNICIPAL FIXED INCOME
After the election, fixed income markets began pricing in
higher inflation and a higher probability of an increase in
the federal funds rate. This quickly spiked interest rates,
causing bond prices to fall, similar in experience to what
happened with the “Taper Tantrum” in 2013 that
precipitated a -9.23% decline in the Barclays Municipal
Bond Price Index, as illustrated in Chart I. Given the
municipal bond market’s unique sensitivities to technical
factors, the negative price impact of interest rate volatility
tends to be more exaggerated relative to that of treasuries
or corporates, as can be seen in Chart I.
Rinehart Monthly Insights
FINDING VALUE IN 2017
Page 2
INVESTMENT OVERVIEW
MONTHLY INDEX REVIEW (USD TOTAL RETURN)
DATA AS OF DECEMBER 31ST 2016 DECEMBER
2016 2015 2014 2016
S&P 500 +1.98% +1.38% +13.69% +11.96%
Dow Jones Industrial Average +3.44% +0.21% +10.04% +16.50%
NASDAQ Composite +1.19% +6.96% +14.75% +8.87%
Russell 2000 +2.80% -4.41% +4.89% +21.31%
MSCI Emerging Markets +0.29% -14.60% -1.82% +11.60%
MSCI EAFE +3.44% -0.39% -4.48% +1.51%
Barclays US Aggregate +0.14% +0.55% +5.97% +2.65%
Continued on next page
Source: FactSet Research Systems, Inc.
CHART I: BARCLAYS MUNICIPAL BOND PRICE INDEX
-9.23%
-8.03%
-5.97%
ABOUT RINEHART
Rinehart Wealth &
Investment Advisory is
an experienced,
boutique Registered
Investment Advisor
dedicated to
independent,
comprehensive wealth
management. Founded
in 1985 by Mary
Rinehart, the firm, from
its inception, has had a
singular focus: to
provide highly
customized investment
management and
financial planning
solutions to clients.
Boutique Firm:
Being a boutique wealth
management firm allows
us the flexibility to
provide more
personalized service and
offer unique investment
solutions to clients in a
Fee-Only environment.
Team Approach:
Because each client’s
situation is different, the
team of advisors is hand
-selected to ensure areas
of expertise are
appropriately aligned
with the client’s specific
needs and interests.
Proprietary Investment
Research:
The differentiating
factor of our portfolio
management process is
the proprietary
investment research
driving the portfolio
construction. All
investment research and
analysis is done entirely
in-house by our
Investment Team.
FINDING VALUE IN 2017
The inherent illiquidity and erratic trading
activity characteristic of the municipal bond
market are sources of frustration for long-
term investors during periods of elevated
volatility. Inevitably the selling momentum
subsides, but, before the pressure abates,
informed long-term investors have the
opportunity to increase municipal bond
exposure at increasingly attractive
valuations, as investors sell irrationally into
an illiquid market.
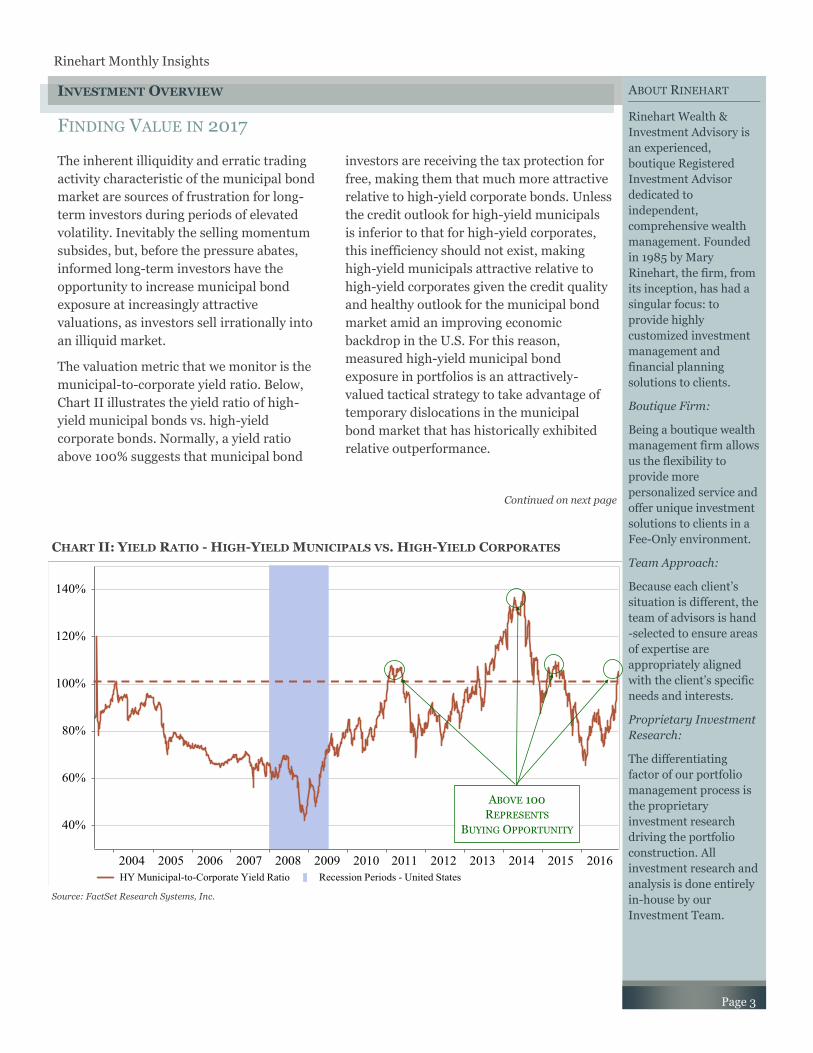
The valuation metric that we monitor is the
municipal-to-corporate yield ratio. Below,
Chart II illustrates the yield ratio of high-
yield municipal bonds vs. high-yield
corporate bonds. Normally, a yield ratio
above 100% suggests that municipal bond
investors are receiving the tax protection for
free, making them that much more attractive
relative to high-yield corporate bonds. Unless
the credit outlook for high-yield municipals
is inferior to that for high-yield corporates,
this inefficiency should not exist, making
high-yield municipals attractive relative to
high-yield corporates given the credit quality
and healthy outlook for the municipal bond
market amid an improving economic
backdrop in the U.S. For this reason,
measured high-yield municipal bond
exposure in portfolios is an attractively-
valued tactical strategy to take advantage of
temporary dislocations in the municipal
bond market that has historically exhibited
relative outperformance.
Page 3
Rinehart Monthly Insights
INVESTMENT OVERVIEW
Source: FactSet Research Systems, Inc.
CHART II: YIELD RATIO - HIGH-YIELD MUNICIPALS VS. HIGH-YIELD CORPORATES
Continued on next page
ABOVE 100
REPRESENTS
BUYING OPPORTUNITY
Rinehart Monthly Insights
FINDING VALUE IN 2017
Page 4
INVESTMENT OVERVIEW
STOCK & STRATEGY SPOTLIGHT
Name Ticker 2016 YTD
Nuveen High-Yield Municipal Bond Fund NHMAX +1.47%
Description & Investment Thesis
The recent sell-off in high-yield municipal bond markets has been driven by accelerated fund outflows year-to-date (“YTD”) due to
the aforementioned spike in interest rates, as well as increased uncertainty surrounding potential changes in the preferential tax
treatment of municipal bond interest. The Investment Team believes the extent of the selling pressure is excessive in light of the
improved fundamental outlook for and fiscal stability of municipal markets, as well as the continued need for tax-free income across
a broad base of investors. While rising rates represent an incremental headwind to domestic fixed income, we believe that the
current market environment and the elevated yield ratio relative to high-yield corporate bonds represents an attractive near-term
buying opportunity for long-term investors in high-yield municipal bonds.
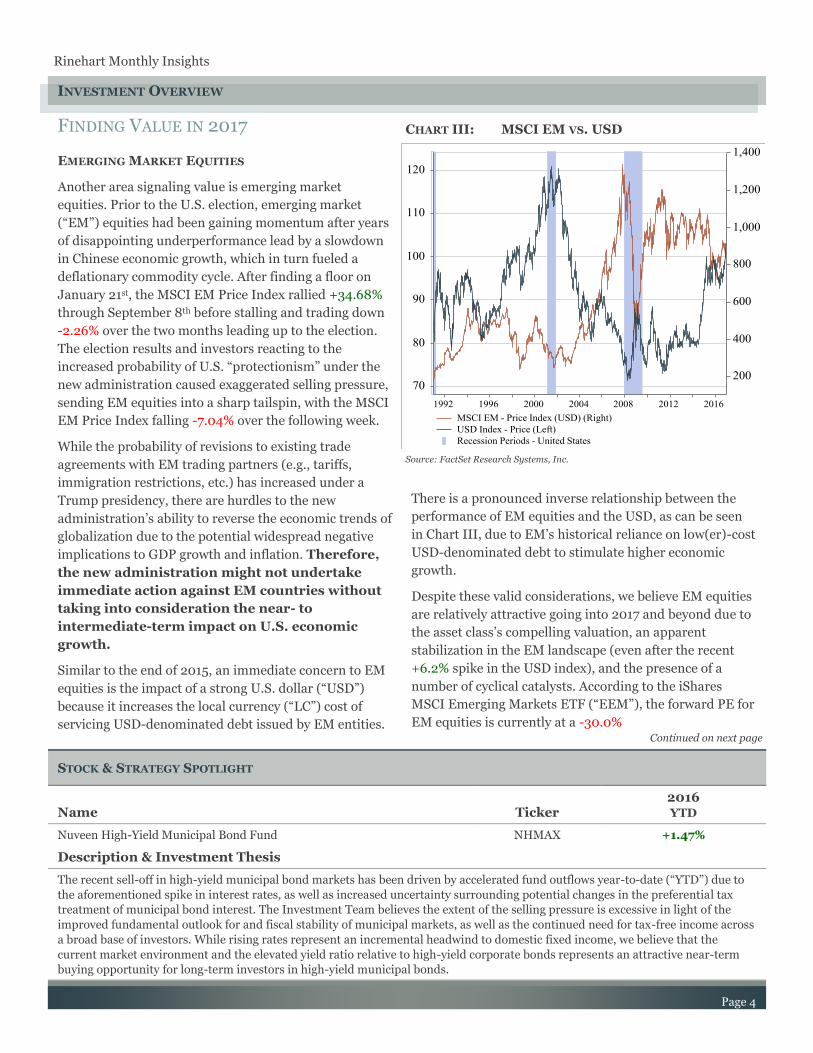
EMERGING MARKET EQUITIES
Another area signaling value is emerging market
equities. Prior to the U.S. election, emerging market
(“EM”) equities had been gaining momentum after years
of disappointing underperformance lead by a slowdown
in Chinese economic growth, which in turn fueled a
deflationary commodity cycle. After finding a floor on
January 21st, the MSCI EM Price Index rallied +34.68%
through September 8th before stalling and trading down
-2.26% over the two months leading up to the election.
The election results and investors reacting to the
increased probability of U.S. “protectionism” under the
new administration caused exaggerated selling pressure,
sending EM equities into a sharp tailspin, with the MSCI
EM Price Index falling -7.04% over the following week.
While the probability of revisions to existing trade
agreements with EM trading partners (e.g., tariffs,
immigration restrictions, etc.) has increased under a
Trump presidency, there are hurdles to the new
administration’s ability to reverse the economic trends of
globalization due to the potential widespread negative
implications to GDP growth and inflation. Therefore,
the new administration might not undertake
immediate action against EM countries without
taking into consideration the near- to
intermediate-term impact on U.S. economic
growth.
Similar to the end of 2015, an immediate concern to EM
equities is the impact of a strong U.S. dollar (“USD”)
because it increases the local currency (“LC”) cost of
servicing USD-denominated debt issued by EM entities.
There is a pronounced inverse relationship between the
performance of EM equities and the USD, as can be seen
in Chart III, due to EM’s historical reliance on low(er)-cost
USD-denominated debt to stimulate higher economic
growth.
Despite these valid considerations, we believe EM equities
are relatively attractive going into 2017 and beyond due to
the asset class’s compelling valuation, an apparent
stabilization in the EM landscape (even after the recent
+6.2% spike in the USD index), and the presence of a
number of cyclical catalysts. According to the iShares
MSCI Emerging Markets ETF (“EEM”), the forward PE for
EM equities is currently at a -30.0%
CHART III: MSCI EM VS. USD
Source: FactSet Research Systems, Inc.
Continued on next page
ABOUT RINEHART
Rinehart Wealth &
Investment Advisory is
an experienced,
boutique Registered
Investment Advisor
dedicated to
independent,
comprehensive wealth
management. Founded
in 1985 by Mary
Rinehart, the firm, from
its inception, has had a
singular focus: to
provide highly
customized investment
management and
financial planning
solutions to clients.
Boutique Firm:
Being a boutique wealth
management firm allows
us the flexibility to
provide more
personalized service and
offer unique investment
solutions to clients in a
Fee-Only environment.
Team Approach:
Because each client’s
situation is different, the
team of advisors is hand
-selected to ensure areas
of expertise are
appropriately aligned
with the client’s specific
needs and interests.
Proprietary Investment
Research:
The differentiating
factor of our portfolio
management process is
the proprietary
investment research
driving the portfolio
construction. All
investment research and
analysis is done entirely
in-house by our
Investment Team.
FINDING VALUE IN 2017
Page 5
discount relative to that of the S&P 500®,
while also trading at a -21.1% discount to its
prior late-stage cyclical peak forward PE of
14.9x. With relative and absolute valuations
at these levels, it will take very little positive
momentum to move stocks upward, and
there are several positive catalysts we see
over the next 12 months.
Due to the high degree of EM economic
sensitivity to commodities and related
industries, any growth generated by fiscal
stimulus in the U.S. under the new
administration should contribute to EM
economic growth, as well. Moreover, EM
exporters with exposure to the U.S. will
benefit from a currency tailwind, as revenues
generated and recorded in USD will be
translated into LC-terms at a higher
exchange rate. Concordantly, given EM
equity’s tendency to outperform during the
later stages of the market cycle, the asset
class should gain relative strength as we
move deeper into the economic cycle.
Given the multitude of concurrent conflicting
factors affecting EM assets, RWIA is hosting
an exclusive EM equity portfolio manager
panel on February 1st 2017 - for more
information or to RSVP for the event, please
contact Brittany Danahey.
EUROPEAN EQUITIES
European equities are one of the worst
performing asset classes in 2016, with the
MSCI Europe Price Index down -3.39% in
2016. The repeated bouts of elevated market
volatility in Europe afforded long-term
investors several opportunities to buy high-
quality companies at attractive absolute and
relative valuations. Following the unexpected
“Brexit” vote on June 24th, the MSCI Europe
Price Index experienced a steep two-day sell-
off of -13.42%, after which the index rallied
+12.66% through the end of the year.
Investors focusing on the uncertain
environment and short-term volatility missed
an opportunity to add long-term value to
their portfolios at discounted prices.
According to the FactSet Europe Equity
Market Index, European equities are
currently trading at a PE of 14.4x next-twelve
months’ (“NTM”) earnings per share (“EPS”),
a decline of -11.2% from its recent peak
multiple of 16.3x back in April 2015, and
representative of a -15.0% discount relative
to the S&P 500® vs. a 10-year historical
average discount of approximately -13.0%.
Despite lingering geopolitical uncertainties
and stagnant economic growth across the
European Union (“EU”), the Investment
Team believes that the continuation of easy
monetary policy by the European Central
Bank (“ECB”) should provide incremental
support for high-quality European equities
trading at irrational discounts to their U.S.
counterparts. For example, Netherlands-
based Unilever N.V. ADR (“UN”), a long-
term holding across our investment
portfolios, currently trades at a forward PE of
19.0x NTM EPS, while Procter & Gamble Co.
(“PG”) trades at a comparable multiple of
20.9x, meaning that UN is trading at a
relative discount of -9.1% to PG, despite
historically trading at an average discount of
approximately -5.0%.
Like their EM counterparts, European
companies selling into the U.S. with
diversified business portfolios should benefit
from the aforementioned currency tailwind,
with the Euro (“EUR”) trading at 10-year
lows vs. the USD. Unlike EM equities,
European equities are less reliant on
economic growth fueled by the issuance of
USD-denominated debt, so the cost of
servicing their debt is not a significant risk
factor.
Rinehart Monthly Insights
INVESTMENT OVERVIEW
Continued on next page

Rinehart Monthly Insights
FINDING VALUE IN 2017
Page 6
INVESTMENT OVERVIEW
UNDERPERFORMING SEGMENTS WITHIN U.S. EQUITY
Since the election, U.S. equity outperformance has been
notable, while the composition of that outperformance has
been extremely concentrated, driven by an extreme
increase in risk appetite, fueling a rotation into cyclical
sectors at the expense of the previously-outperforming
defensive sectors. Many of these cyclicals are now trading
at valuations and implied multiples reflective of perfect
policy execution by the president-elect and a potentially
impractical acceleration of GDP growth over a brief period
of time. This unilateral rational makes it imprudent to add
significant amounts of risk by chasing extended cyclical
equities at this juncture.
The prevailing pro-cyclical market trends appear
increasingly expensive and fundamentally less attractive
on an absolute and relative valuation basis. Over the past
two months, the forward PE multiple for the S&P 500®
Industrials Index jumped as much as +12.7% to 18.3x
NTM EPS, its highest level in over 10 years, after having
already expanded +16.8% from a multi-year low of 13.9x
in January. Within Industrials, the forward PE multiple
for the industry-level S&P 500® Construction &
Engineering Index expanded as much as +27.88% over the
past two months to 18.9x NTM EPS, representing its
highest level in over 5 years!
At the same time, our core universe of high-quality,
defensive companies with counter-cyclical business
models continue to trade down to increasingly attractive
valuations. For example, after reaching a relative premium
of +31.0% vs. the S&P 500® in February, the forward PE
multiple for the S&P 500® Consumer Staples Index
continued to expand up to 21.1x NTM EPS through the
beginning of July before compressing as much as -11.73%
to 18.6x. Despite trading above its long-term average
forward PE multiple, the index has retrenched below its 15
-year average relative premium of +16.0% vs. the S&P
500®, with several industry-level constituents trading at
or near their lowest relative valuations over the past five
years. Therefore, the Investment Team believes it will be
able to take advantage of lower valuations by adding
incremental exposure to those areas of the equity market
that have historically provided relative downside
protection during market downturns and exhibited
superior long-term risk-adjusted performance.
HEALTH CARE
After years of benefiting from transformative secular
growth and subsequent drug price inflation, Health Care
was the only sector within the S&P 500® to deliver a
negative return in 2016, resulting from election-related
headline risks and renewed regulatory scrutiny over drug
pricing, as well as a decline in high-profile M&A activity.
Health Care is now a sector rife with value and selective
investment opportunities. Absolute and relative valuation
is undemanding, with the forward PE multiple for the S&P
500® Health Care Index collapsing -21.74% from its peak
of 18.4x in March 2015 to its current level of 14.4x,
representing a -15.1% discount to the S&P 500®. Over the
past 15 years, Health Care has traded at an average
premium of +2.0% relative to the S&P 500®.
Despite a number of unknowns and severe drug price
deflation, we see several catalysts that could ignite much-
needed multiple expansion in stocks throughout the sector
in 2017.
While the ultimate fate of the Affordable Care Act (“ACA”)
remains uncertain under the new administration, curbing
the rising costs of health care is likely to remain a key
policy issue. As evidenced by the acceleration in drug
application approvals by the U.S. Food & Drug
Administration (“FDA”) in 2016 and the recent enactment
of the 21st Century Cures Act, the government is looking to
promote innovation by investing in a more efficient
regulatory framework for drug and medical devices, as
well as providing additional funding to the National
Institutes of Health (“NIH”) for innovation projects. We
believe these measures should help to reward companies
within the Health Care sector capable of delivering cost-
saving initiatives and innovative solutions via large,
diversified pipeline assets and advanced technologies.
Continued on next page
ABOUT RINEHART
Rinehart Wealth &
Investment Advisory is
an experienced,
boutique Registered
Investment Advisor
dedicated to
independent,
comprehensive wealth
management. Founded
in 1985 by Mary
Rinehart, the firm, from
its inception, has had a
singular focus: to
provide highly
customized investment
management and
financial planning
solutions to clients.
Boutique Firm:
Being a boutique wealth
management firm allows
us the flexibility to
provide more
personalized service and
offer unique investment
solutions to clients in a
Fee-Only environment.
Team Approach:
Because each client’s
situation is different, the
team of advisors is hand
-selected to ensure areas
of expertise are
appropriately aligned
with the client’s specific
needs and interests.
Proprietary Investment
Research:
The differentiating
factor of our portfolio
management process is
the proprietary
investment research
driving the portfolio
construction. All
investment research and
analysis is done entirely
in-house by our
Investment Team.
FINDING VALUE IN 2017
Page 7
INFORMATION TECHNOLOGY
Information Technology has been another
relative outperformer over the past several
years, with the sector broadly benefiting from
corporations seeking to enhance productivity
and efficiency in the absence of economic
growth. Prior to the election, the forward PE
for the S&P 500® Information Technology
Index hit 17.4x NTM: a five-year peak on an
absolute and relative basis. In the wake of the
election results, several segments of the
Information Technology (“IT”) sector sold off
in response to the strengthening USD, with
the forward PE multiple compressing as
much as -6.67% from its prior peak, due to
the sector’s historical sensitivity to a strong
USD given outsized exposure to international
markets.
Within the sector, we continue to favor high-
quality companies with established
businesses and recurring revenue models
capable of generating predictable free cash
flow and steady earnings growth. At this
stage in the market cycle, valuation is
extremely important, therefore we remain
focused on finding relative value amid those
currently out-of-favor names within our high
-quality universe.
U.S. MULTINATIONALS
Multinationals run the gamut of the various
sectors and industries under our coverage,
therefore their business models are subject to
different fundamental drivers. Several of
these companies fall within previously-
mentioned sectors (e.g., Consumer Staples,
Health Care, and IT), while others, such as
long-term Consumer Discretionary favorites
McDonalds Corp. (“MCD”) and Wal-Mart
Stores, Inc. (“WMT”), have experienced
substantial multiple compression of as much
as -20.54% and -9.35%, respectively, over the
past year. This is partly reflective of each
company’s sizeable exposure to revenue
generated outside the U.S.
Despite the aforementioned currency
headwinds related to a strong USD, U.S.
multinationals with significant exposure
outside the U.S. and large, diversified
business portfolios are logical beneficiaries of
economic growth. Furthermore, companies
with significant international exposure may
benefit from potential changes stemming
from U.S. tax reform under the incoming
administration, including the potential
repatriation of cash profits currently held
offshore.
Given the defensive characteristics of several
of our favorite high-quality multinationals,
the Investment Team believes that if these
names continue to trade down, we will
increase exposure to and add positions in
those companies with durable international
businesses at attractive valuations.
WHAT TO LOOK FOR IN 2017
Despite an increasingly extended U.S. equity
market, certain asset classes and selective
areas of the market are capable of adding
incremental value to investment portfolios
given relatively attractive valuations. It is our
belief that long-term risk-adjusted
outperformance is achieved through the
identification of undervalued assets and an
ability to look beyond near-term noise and
focus on investing for the long term. Going
into 2017, we are prepared with an arsenal of
underappreciated value that should benefit
portfolios over the long term.
Rinehart Monthly Insights
INVESTMENT OVERVIEW
“Investors may be quite willing to take the risk of being wrong in the company of others - while being much more reluctant to take the risk of being right alone.”
John Maynard Keynes

Rinehart Monthly Insights
ELDER ABUSE: A GROWING SILENT CRIME
Page 8
WEALTH ADVISORY OVERVIEW
Neglect – Withholding of food or medical attention or
leaving an elder in an unsafe or isolated place.
Healthcare – Not providing healthcare, but charging
for it; overcharging or double-billing for medical care
or services; over or under-medicating.
Financial/Material Exploitation – Unauthorized use of
funds or property; misusing Power of Attorney.
Elder financial abuse is widespread and happens in all
levels of society, from the very rich to the very poor. A 2011
MetLife study concluded that the annual financial loss to
seniors from this type of abuse equates to approximately
$2.9 billion dollars, and is growing each year. Financial
abuse can be life-threatening since the abuser steals assets
essential to the health and welfare of the elder.
KEY FINDINGS REGARDING VICTIMS OF ELDER ABUSE
Women were nearly twice as likely to be victims of
elder financial abuse as men.
Most victims were between the ages of 80 and 89,
lived alone, and required some level of help with
either health care or home maintenance.
Most victims were visible to potential perpetrators in
the community through activities at banks, grocery
stores, churches, or driving around town, and
exhibited some noticeable signs of mild to severe
cognitive or physical impairment.
Elder abuse is under-recognized because an elderly person
might not be aware that they are a victim of theft or
neglect. All too often, they are too embarrassed or
ashamed to report the abuse and even feel responsible for
the abuse they are experiencing. They also fear not being
believed, or do not know where or how to report the abuse.
Unfortunately, some types of abuse are not always easy to
spot. Some signs are obvious, some not so much. Abuse
happens most often in relationships based on trust, and
can be intentional or unintentional. Elders with cognitive
impairment are particularly vulnerable, both because
dementia behaviors can be extremely frustrating to
caregivers, and because elders with dementia can lose the
ability to recognize abuse and defend themselves.
WARNING SIGNS OF ELDER ABUSE
Physical – Unexplained signs of injury, such as
bruises, welts or scars, broken bones or dislocations.
Emotional - Frequent arguments or tension between
the caregiver and the elderly person.
Healthcare – Duplicate billings for the same medical
service or device; problems with the care facility such
as poorly trained, poorly paid or insufficient staff;
inadequate responses to questions about care.
Financial - Significant withdrawals from the elder’s
accounts or sudden changes in financial condition;
items or cash missing from the elder’s household.
STEPS THAT CAN BE TAKEN TO PREVENT ELDER ABUSE
Elder abuse occurs for a variety of reasons. If you can
identify risk factors, you will be more likely to spot and
prevent abuse. Here are some steps that can be taken to
prevent abuse:
Awareness – Learn the signs of elder abuse and
educate others about how to recognize the signs.
Avoid Isolation – Isolation can lead to loneliness and
depression and increase the possibility of abuse or
neglect, including self-neglect.
Observance – If your family member is being cared for
by a caregiver, remain involved and observant to be
assured they are receiving quality care and that there
are no signs of abuse or neglect.
Reporting – If you are informed of an abuse, take the
situation seriously and get as much detail as possible.
All states have reporting systems to accept and
investigate allegations of abuse. Most frequently,
abuse is reported to Adult Protective Services (“APS”).

RWIA WELCOMES RYAN VAUDRIN, CFP®
It is our pleasure to introduce to you
the newest member of our Rinehart
team: Ryan Vaudrin, CFP®. Ryan is
joining us as a Wealth Associate and
will be working closely with the
Wealth Advisory Team over the next
several months.
He is a native of Wilmington, North
Carolina and is a graduate of the
University of North Carolina at
Wilmington, where he earned a
double major in Finance and Economics. Prior to joining
Rinehart, Ryan worked for Vanguard as an Account
Representative in their Flagship High Net Worth
department. Ryan holds his CERTIFIED FINANCIAL
PLANNER™ designation and takes pride in helping
clients achieve their financial goals. In his spare time, he
enjoys being outdoors, playing golf, and spending time
with friends and family.
We look forward to introducing
him to you in person during your
next visit to the office or at our
next firm event!
KEEPIN’ IT CLASSY WITH
PAJAMA DAY!
Before heading home for the
holidays, Rinehart employees left
their business casual garb at
home and donned their finest
holiday-morning attire for the
office’s first (un)official RWIA
Pajama Day!
Sandy, Daniele, and Brittany were just some of the more
ardent participants in the inaugural event, with several
others taking advantage of the relaxed dress code to swap
out slacks and suits for sweats and slippers!
HOLIDAY PARTY FUN & FESTIVITIES!
The entire Rinehart family gathered
together for a fun-filled evening of
delicious food and plenty of holiday cheer,
as well as our annual holiday gift
exchange, at AQUA e VINO!
We would like to thank the amazing staff
for a wonderful night and the incredible
experience!
EMERGING MARKETS MANAGER PANEL EVENT
As a reminder, we are hosting an exclusive portfolio
manager panel featuring four emerging markets
investment professionals.
This premiere event will be held at Del Frisco’s of
Charlotte on Wednesday, February 1st at 5:30 PM.
To register for the event, please contact Brittany Danahey
directly at [email protected].
521 East Morehead Street Suite 580 Charlotte, NC 28202 Phone: 980-585-3373 Fax: 980-265-1274
Page 9
Rinehart Monthly Insights
AROUND RINEHART
Rinehart Wealth & Investment Advisory
Wealth management is our only business; therefore,
our attention is undivided and our intentions are
transparent.
Information provided in this newsletter should not be considered or interpreted as advice for
your particular financial situation. Please consult a professional advisor for advice regarding
your specific financial needs.
CIRCULAR 230 NOTICE: To comply with requirements imposed by the United States Treasury
Department, any information regarding any U.S. federal tax matters contained in this
communication (including any attachments) is not intended or written to be used, and cannot
be used, as advice for the purpose of (i) avoiding penalties under the Internal Revenue Code or
(ii) promoting, marketing or recommending to another party any transaction or matter
addressed herein.
This newsletter is for discussion purposes only and represents the opinions of Rinehart Wealth
Management.
Rinehart Wealth & Investment Advisory is a Registered Investment Advisor.