insight of thermo-mechanical and fire properties of an
TRANSCRIPT

UNIVERSITAacute DEGLI STUDI DI NAPOLI
FEDERICO II
Dipartimento di Ingegneria dei Materiali e della Produzione
Insight of thermo-mechanical and fire
properties of an aerospace epoxy matrix loaded with micro and nano fillers
CRISTINA FORMICOLA PhD Dissertation
TUTOR COORDINATOR Dr Michele Giordano Chmo Domenico Acierno Dr Mauro Zarrelli
December 2008
UNIVERSITAacute DEGLI STUDI DI NAPOLI
FEDERICO II
Dipartimento di Ingegneria dei Materiali e della Produzione Insight of thermo-mechanical and fire
properties of an aerospace epoxy matrix loaded with micro and nano fillers
CRISTINA FORMICOLA PhD Dissertation
TUTOR COORDINATOR Dr Michele Giordano Chmo Domenico Acierno Dr Mauro Zarrelli
December 2008
Technological District in Polymer
and Composite Engineering In collaboration with
i
Table of Contents Chapter 1 Introduction
11 Combustion mechanism
12 Fire test for composites materials
References
Chapter 2 Materials
21 Thermosetting resin RTM6
211 Characterization of RTM6
22 Micro materials Introduction on flame retardant
221 Zinc Borate
222 Aluminium Trihydrate
223 Zinc Hydroxystannate
224 Zinc Stannate
23 Nano materials Introduction on carbon nanotubes
231 Multi walled carbon nanotubes
References
Chapter 3 Experimental techniques
31 Methods
311 Micro particles Mechanical stirring
312 Nano particles Sonication
313 Vacuum infusion process
32 Characterization
321 Cone calorimeter
322 Scanning Electron Microscope
323 Thermal mechanical analysis
ii
324 Thermal gravimetric analysis
References
Chapter 4 Flame retardant of epoxy resin with inorganic compounds
41 The state of the art on flame retardant of inorganic compounds
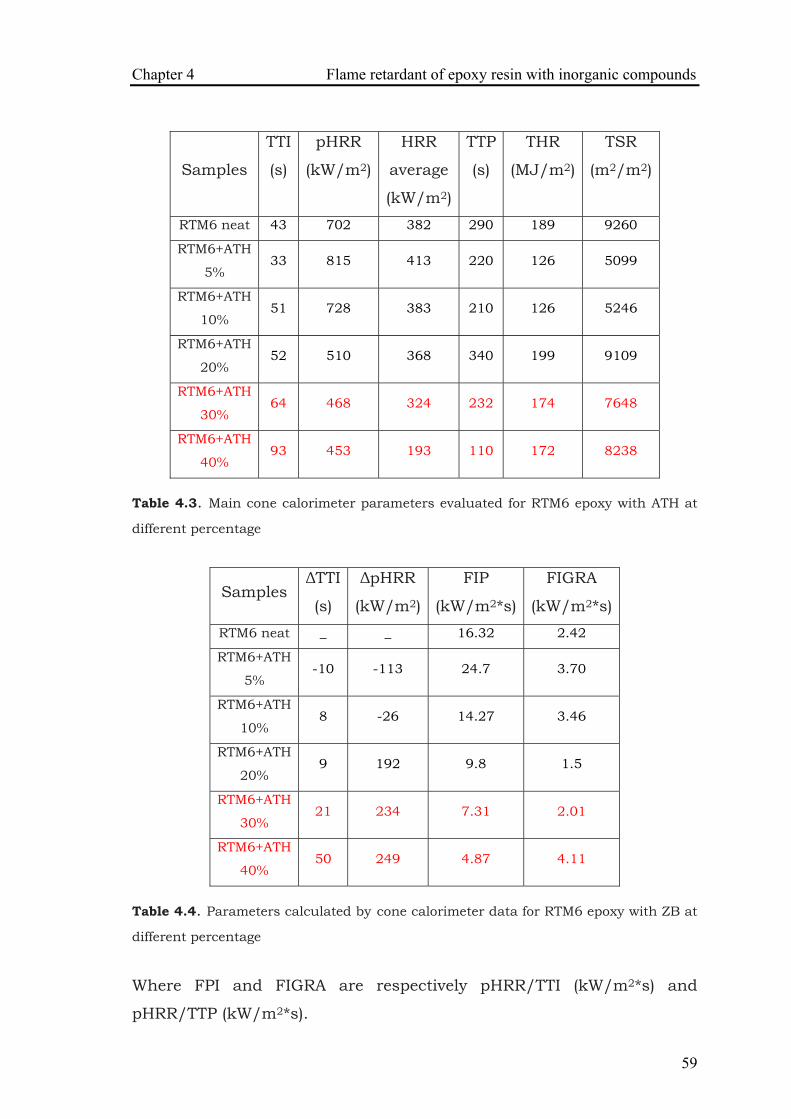
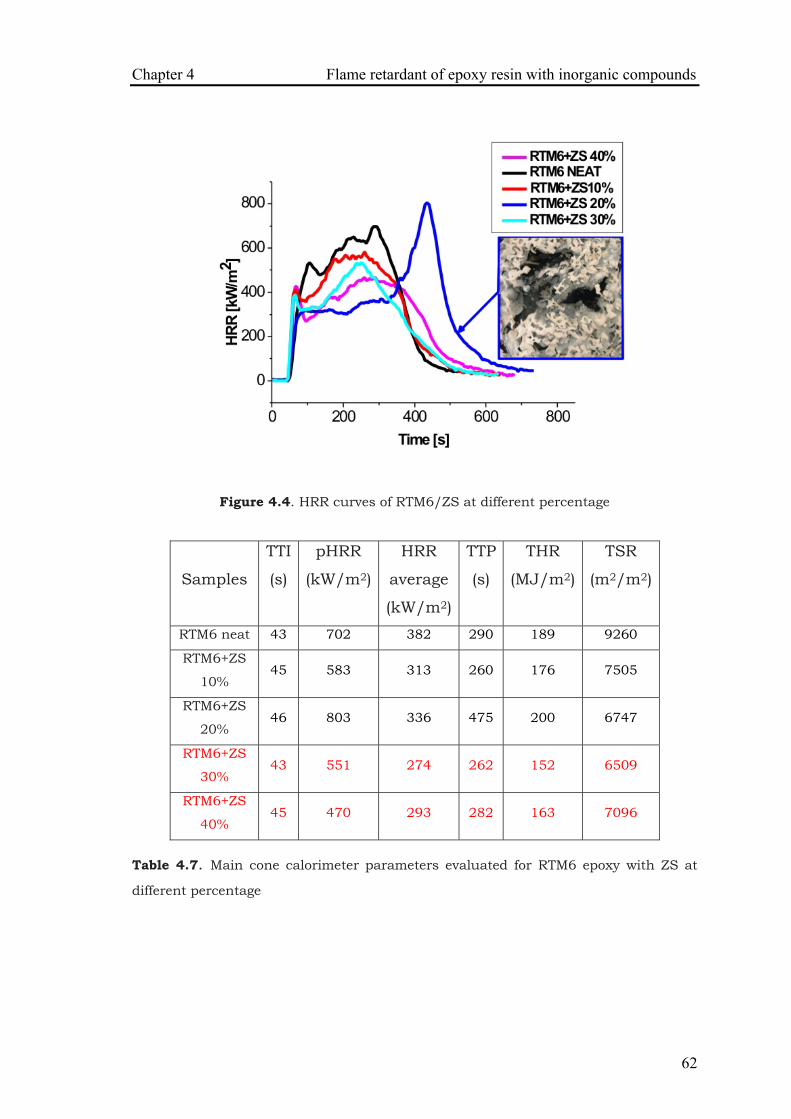
42 Cone calorimeter test
421 Flame retardant of RTM6 and inorganic compounds
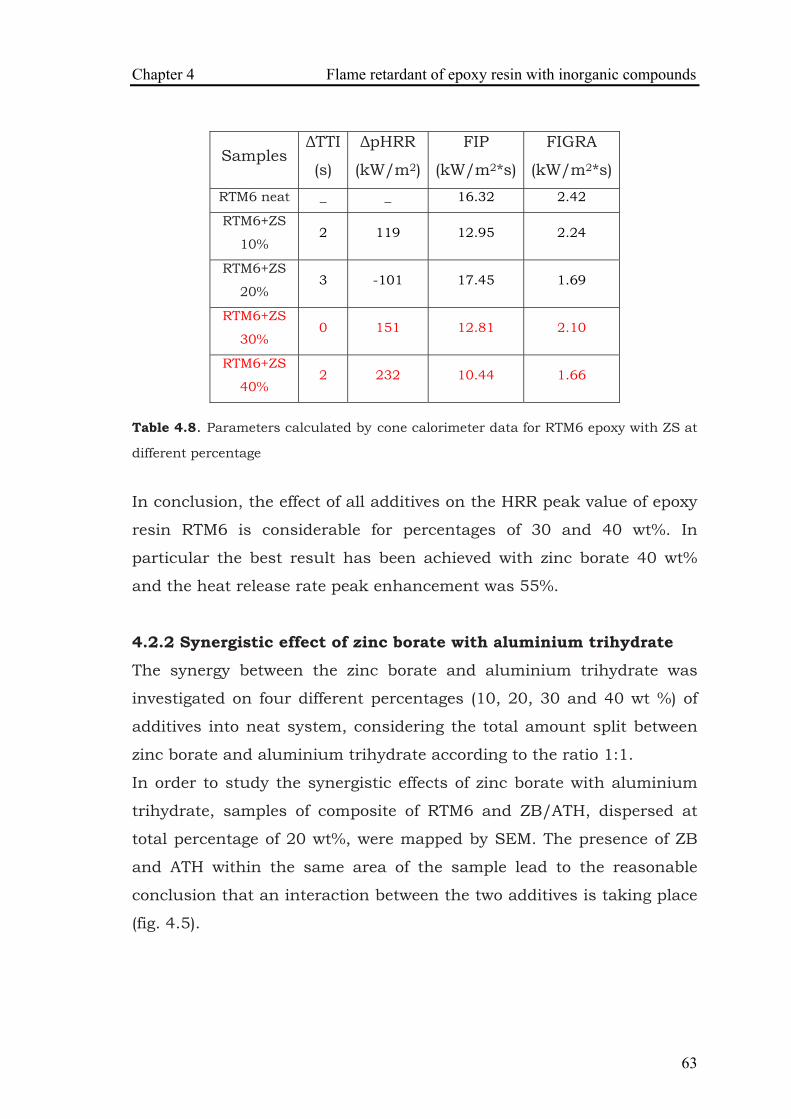
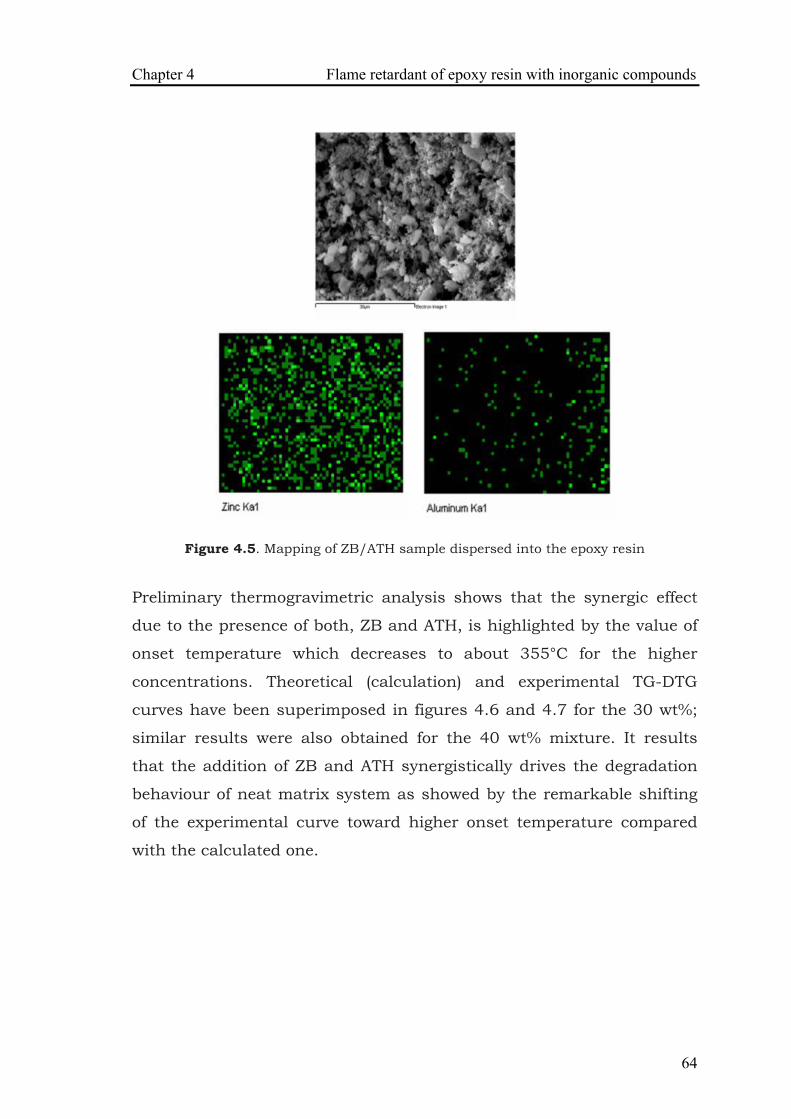
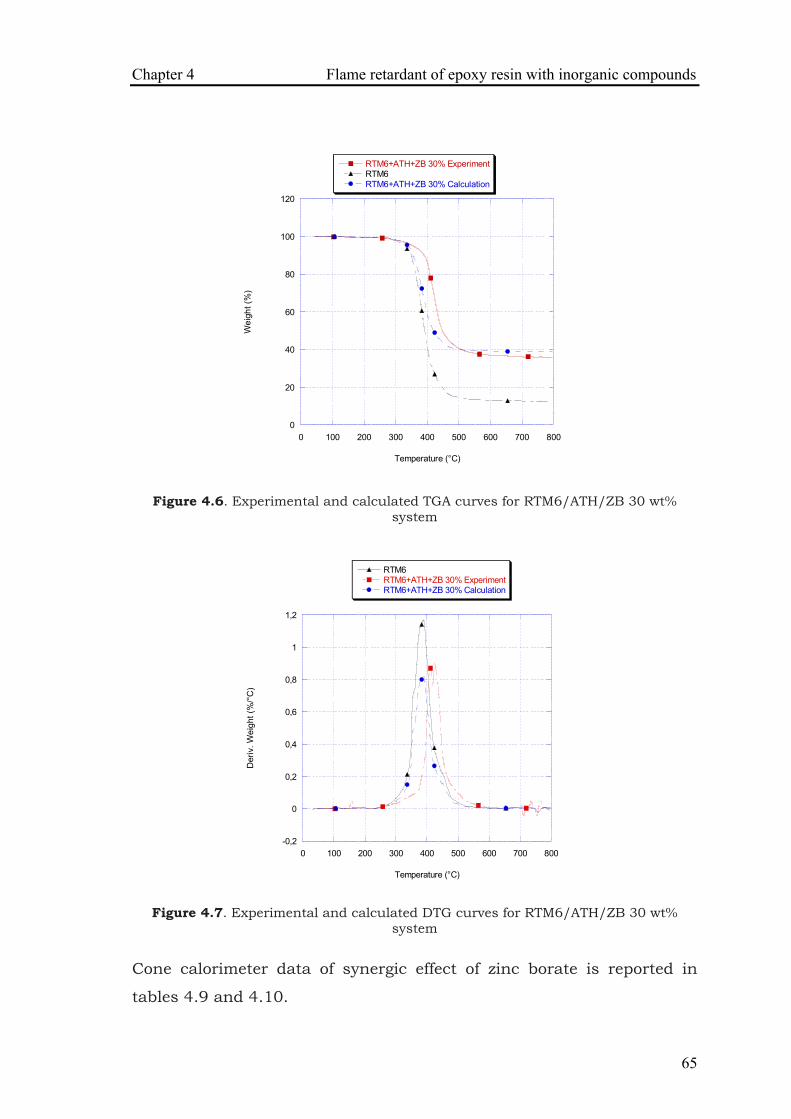
422 Synergistic effect of zinc borate
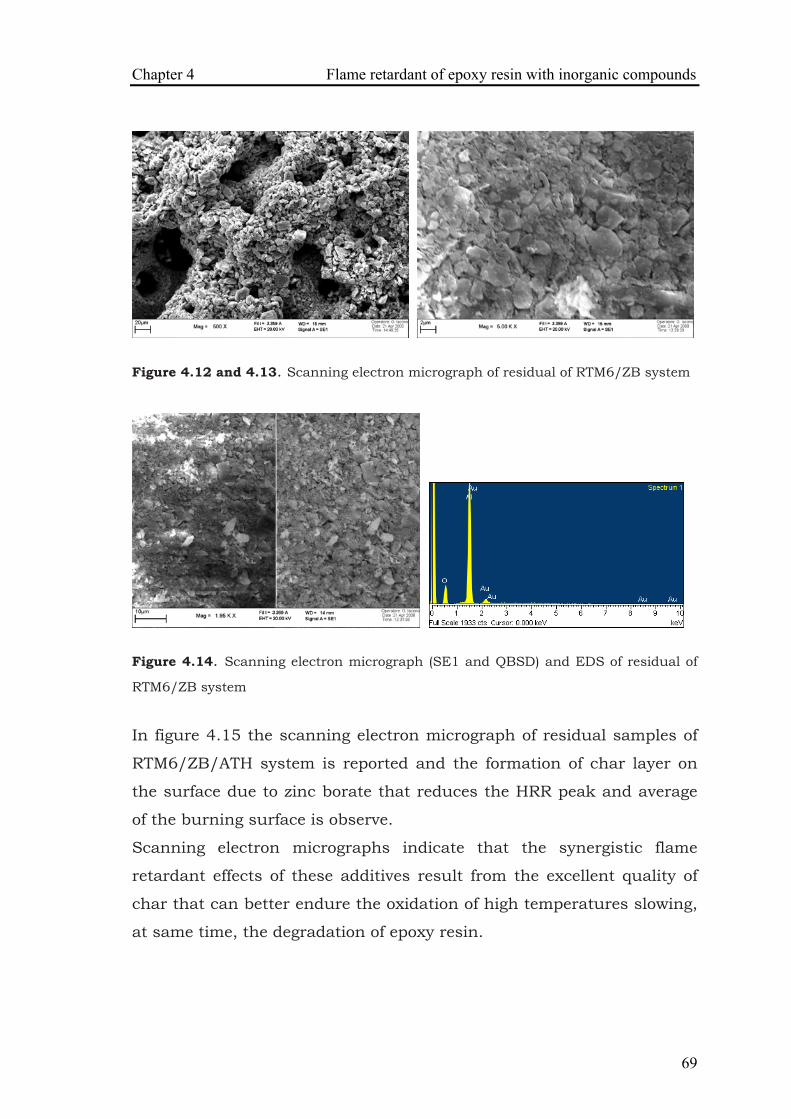
423 Scanning electron micrograph of residue
424 Flame retardant of panels of RTM6 and inorganic
compounds
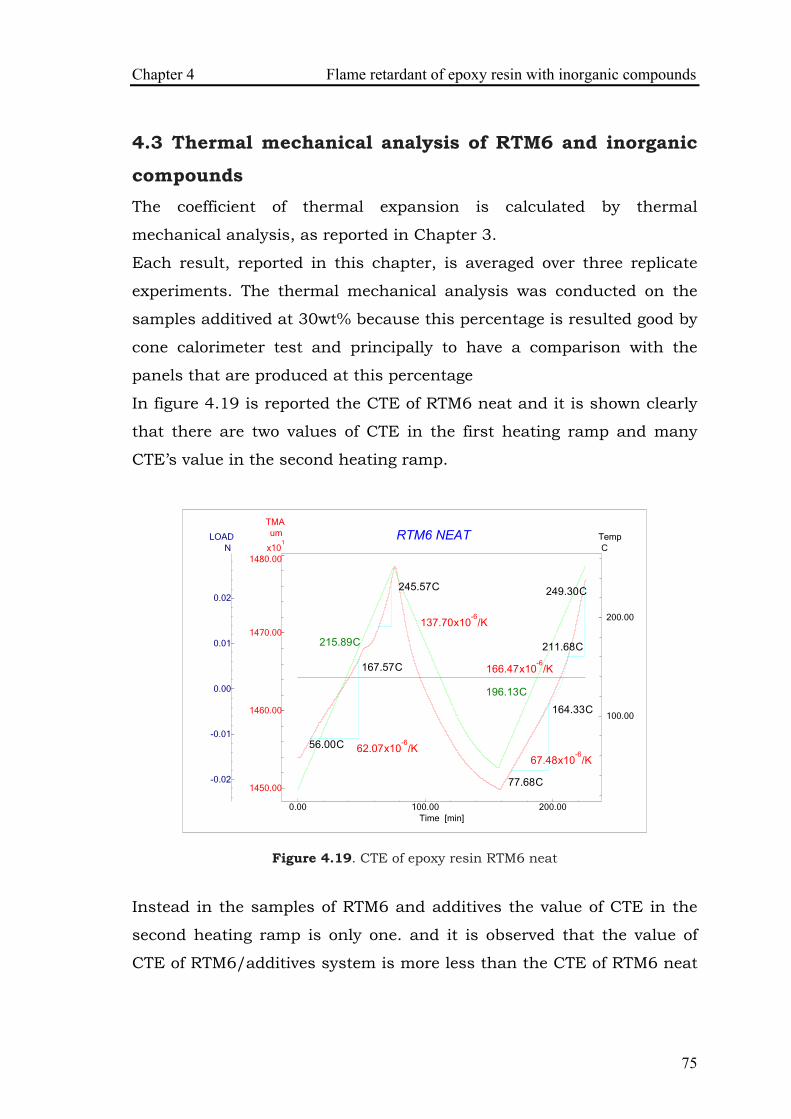
43 Thermal mechanical analysis of RTM6 and inorganic compounds
References
Chapter 5 Flame retardant of epoxy resin with carbon nanotubes
51 The state of the art on flame retardant of carbon nanotubes
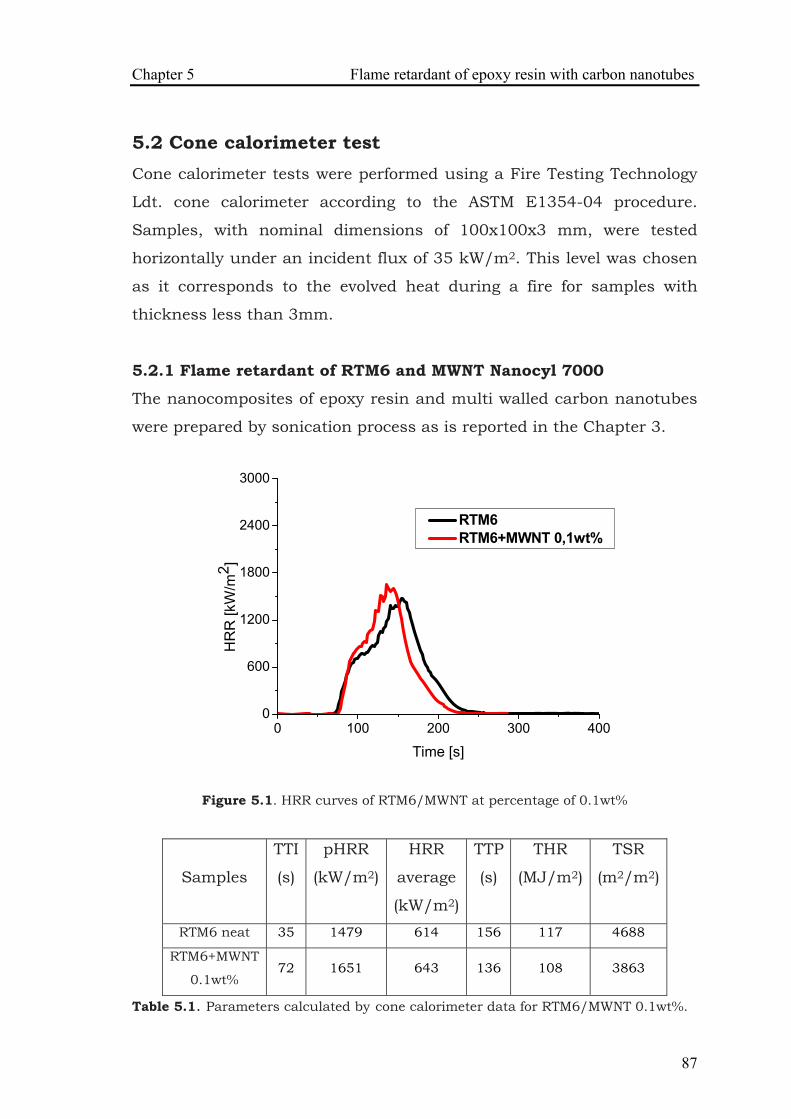
52 Cone calorimeter test
521 Flame retardant of RTM6 and multi walled carbon
nanotubes
522 Flame retardant of panels of RTM6 and carbon nanotubes
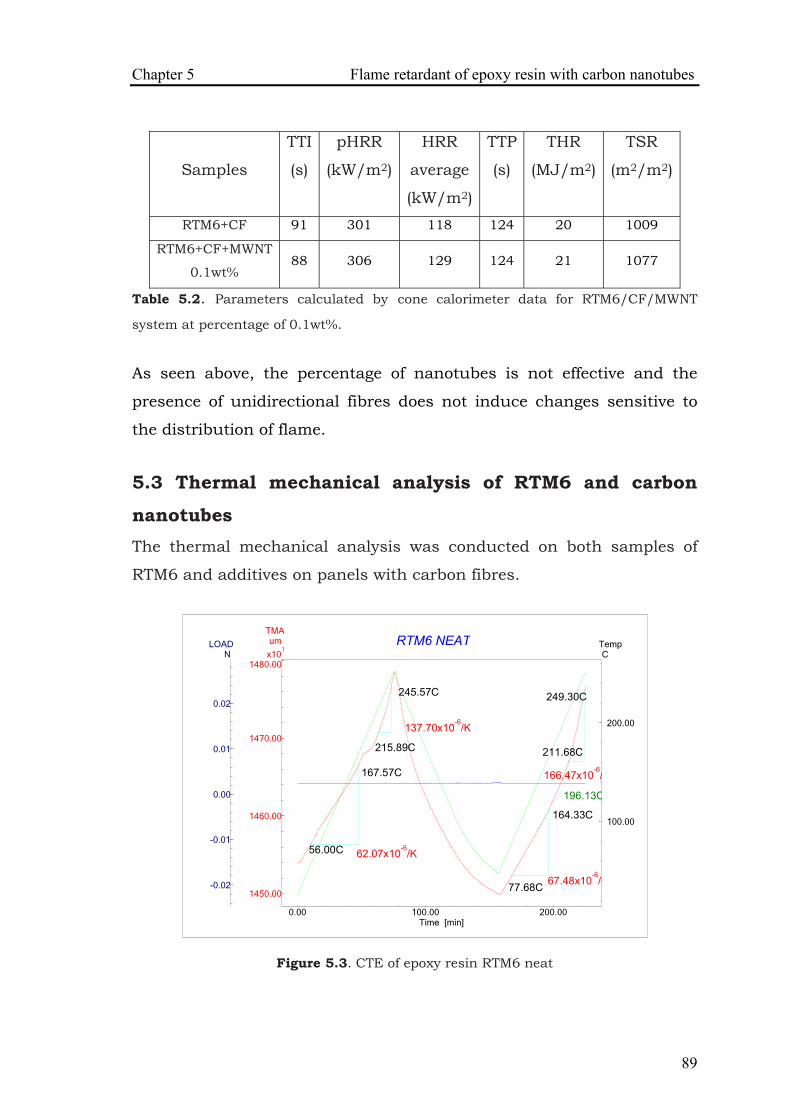
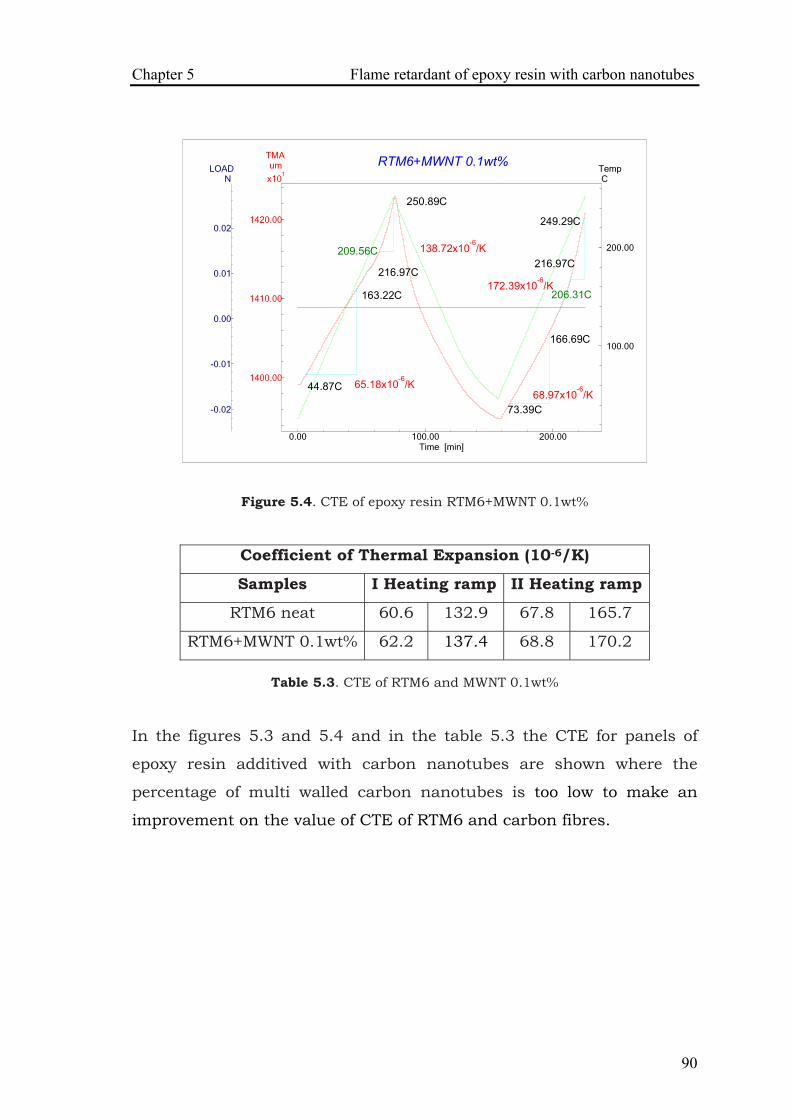
53 Thermal mechanical analysis of RTM6 and carbon nanotubes
References
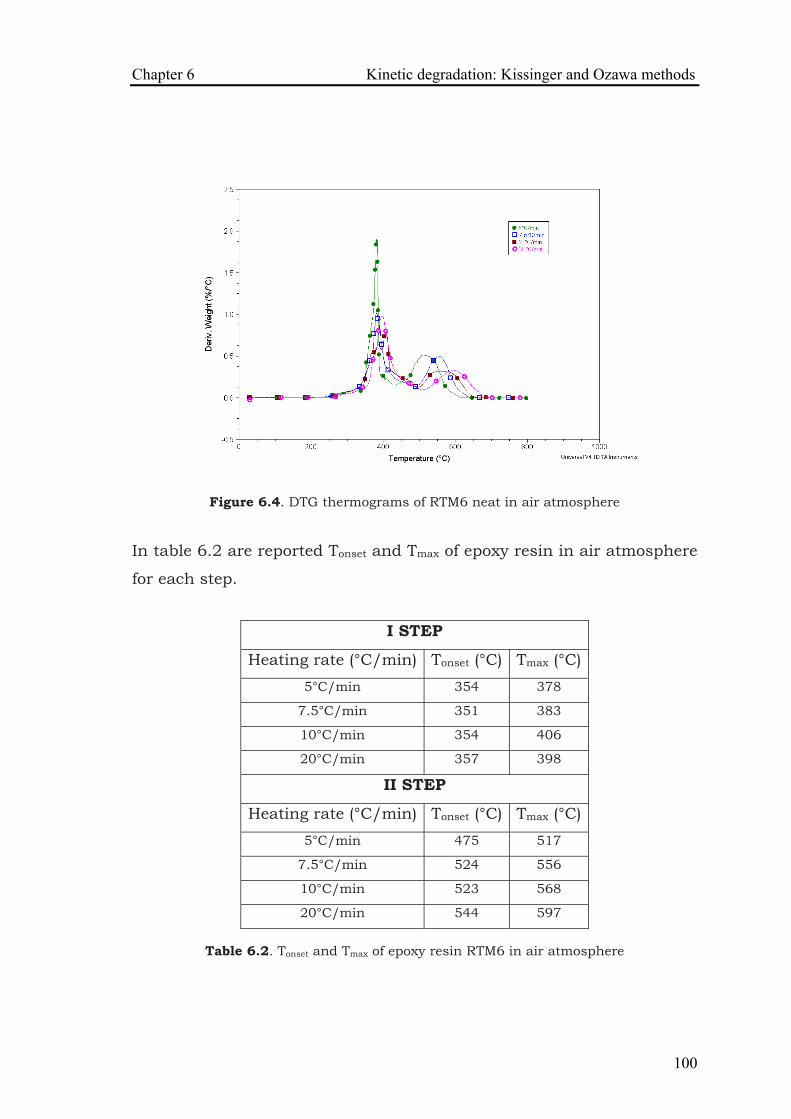
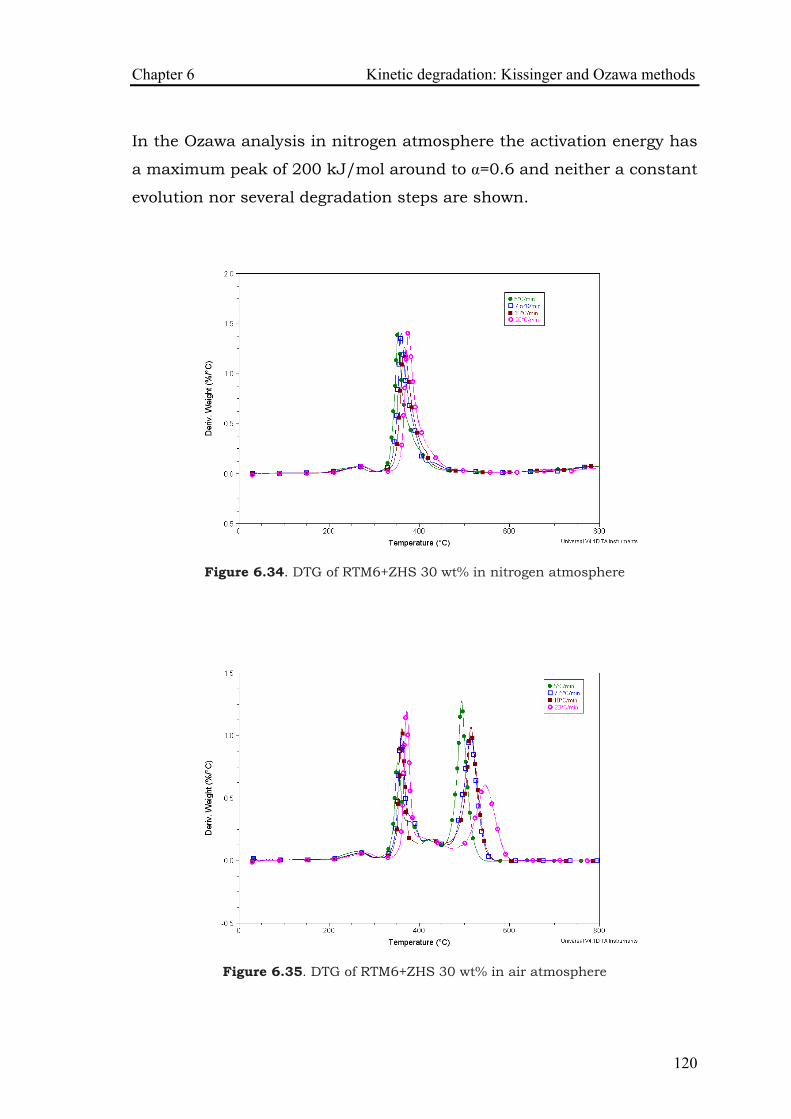
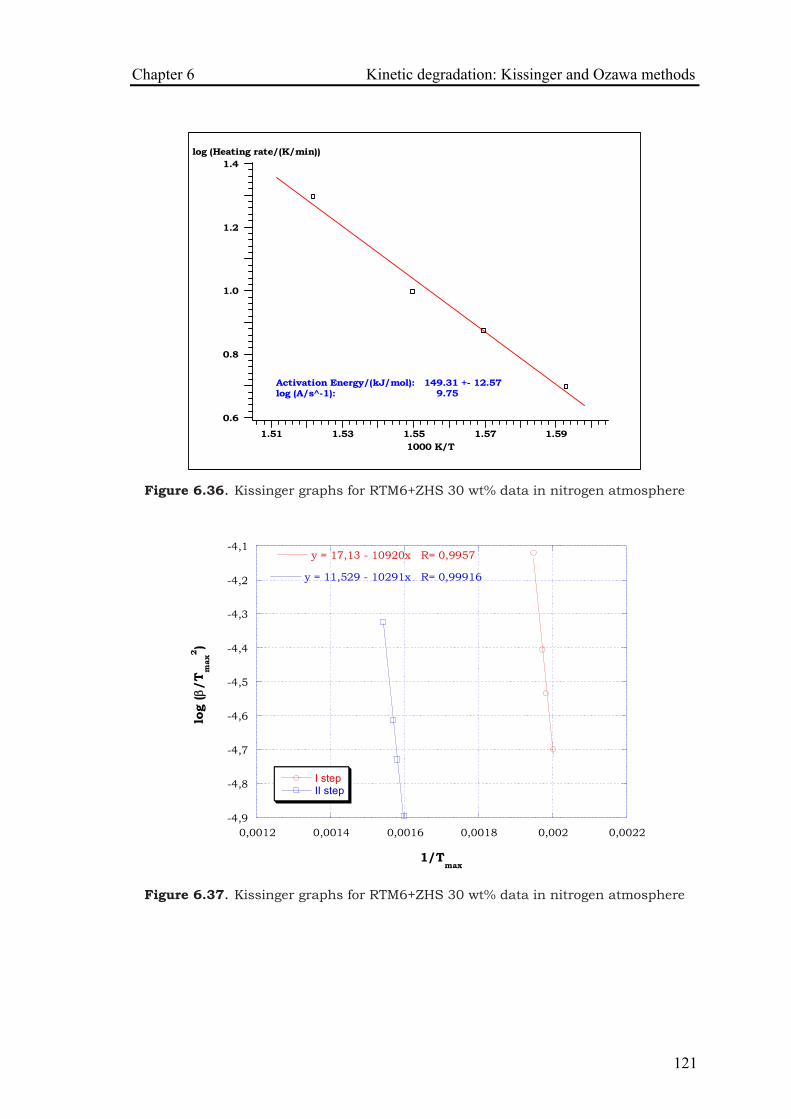
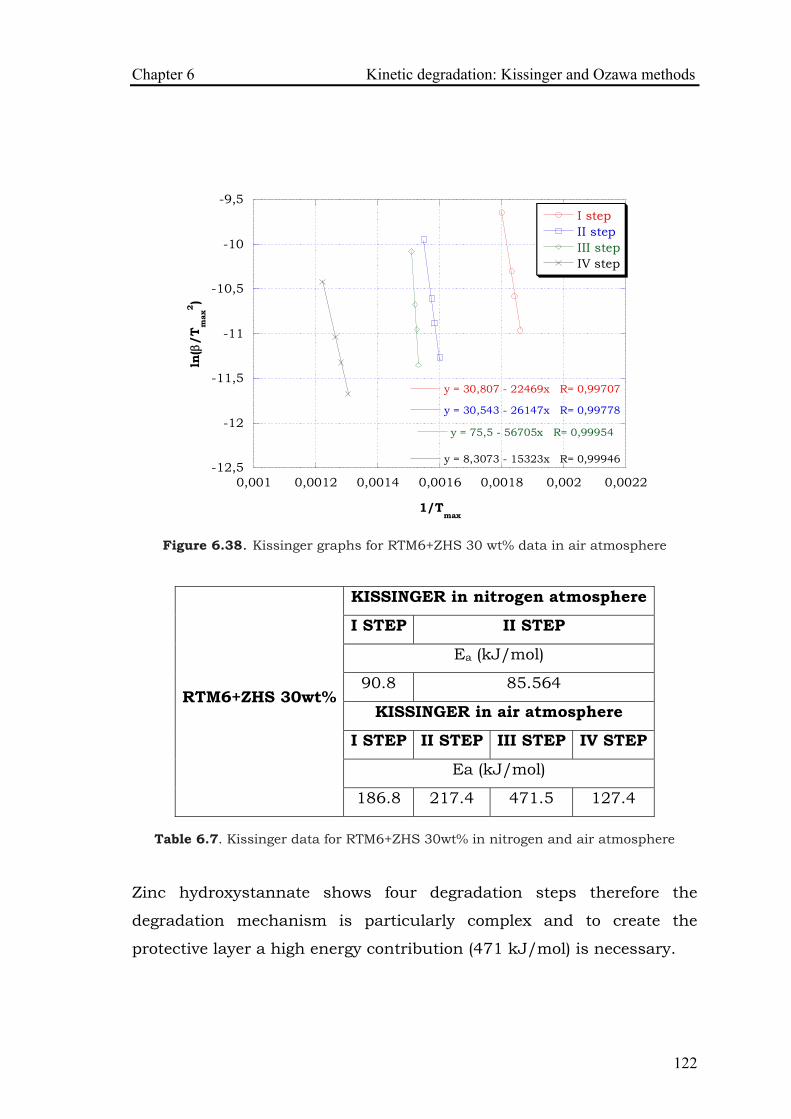
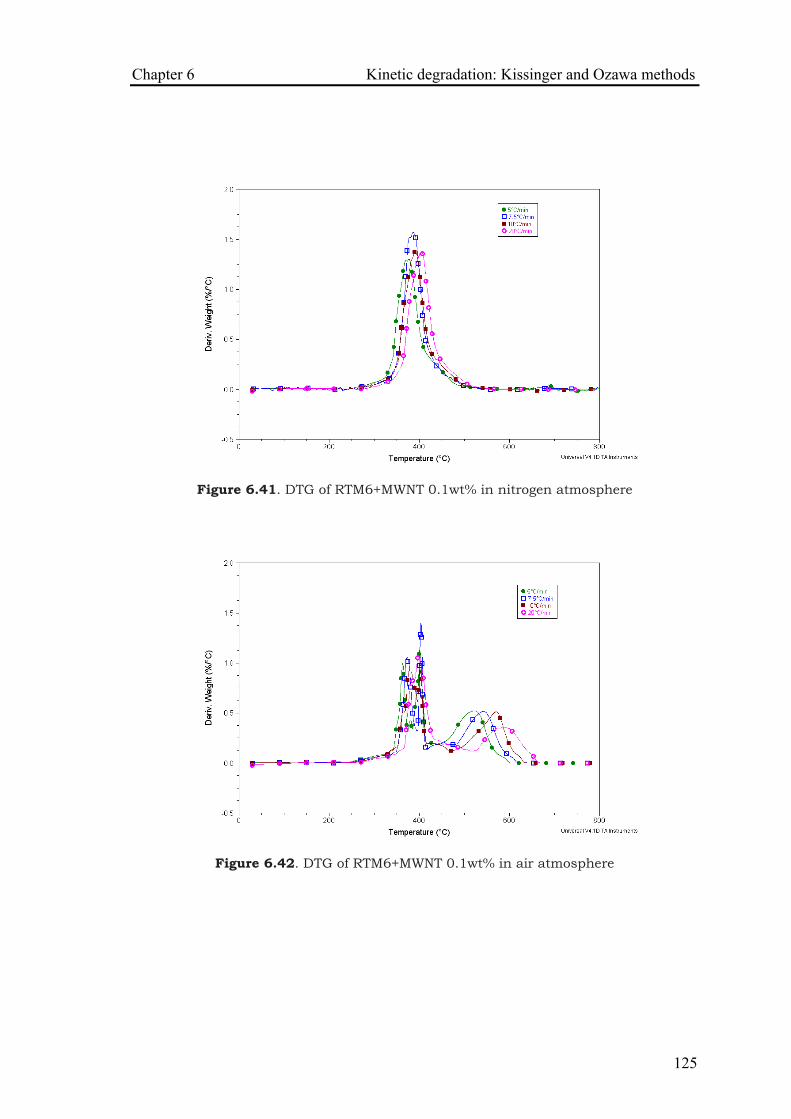
Chapter 6 Kinetic degradations Kissinger and Ozawa methods
61 The state of the art on Kissinger and Ozawa methods for epoxy
resin
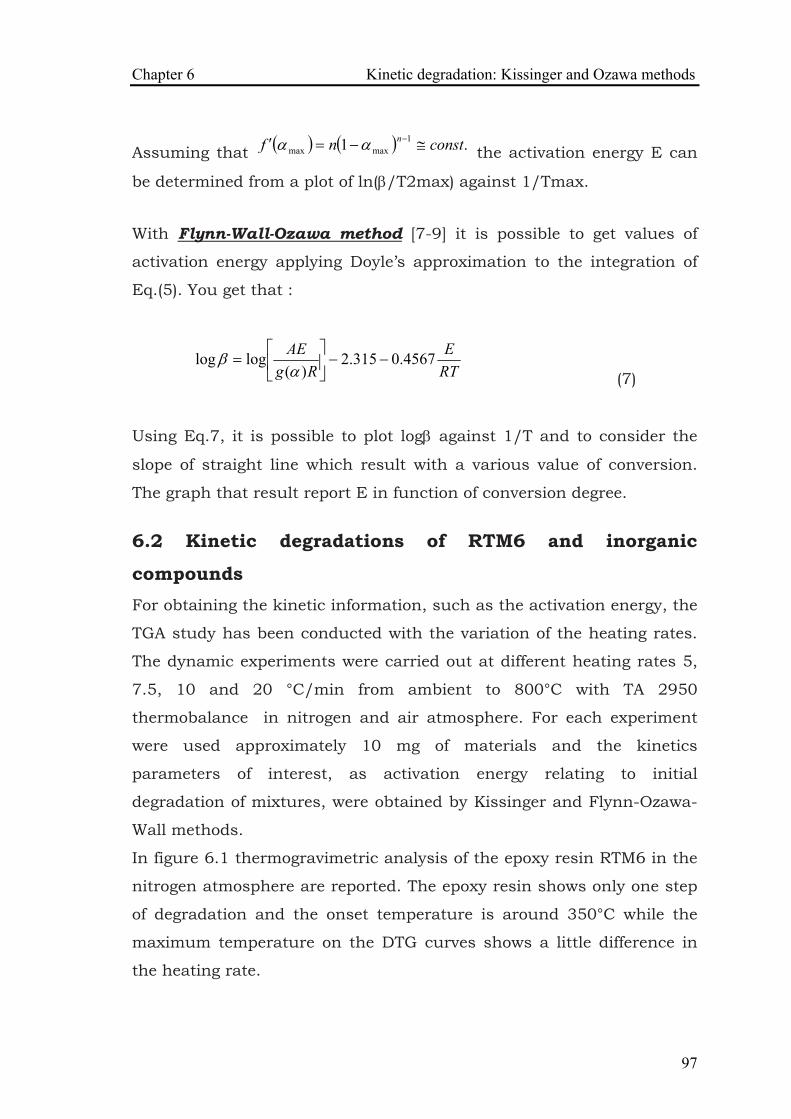
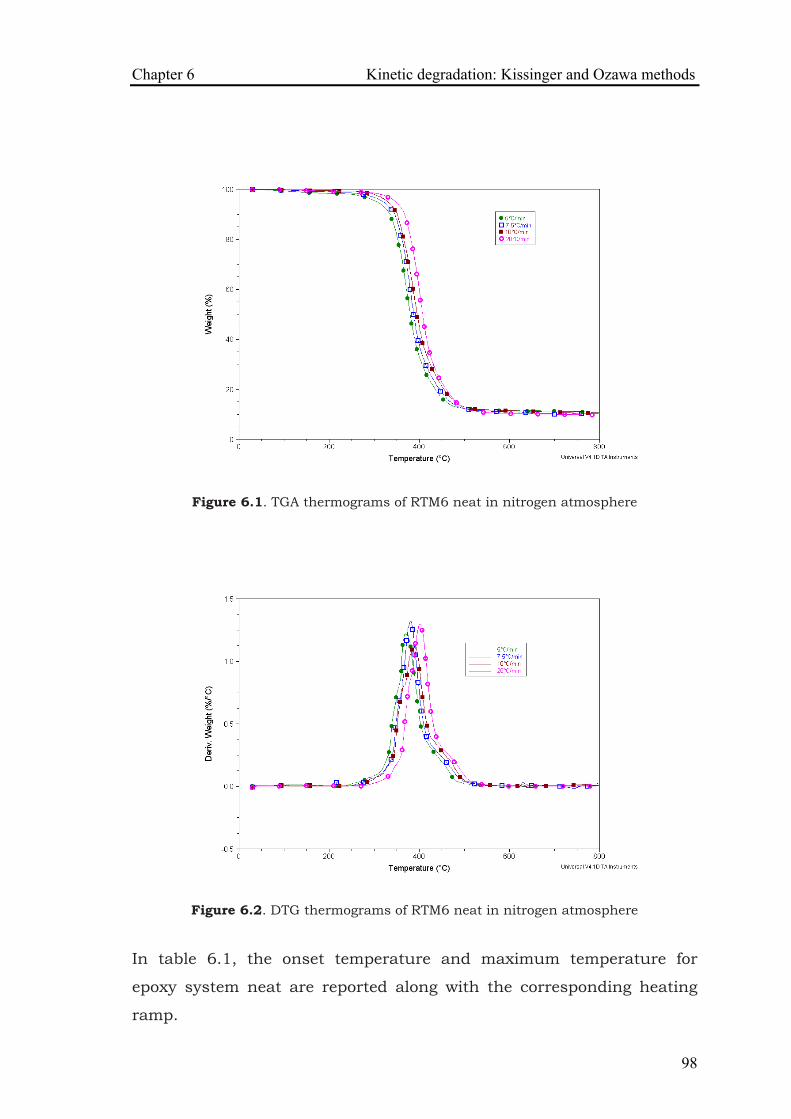
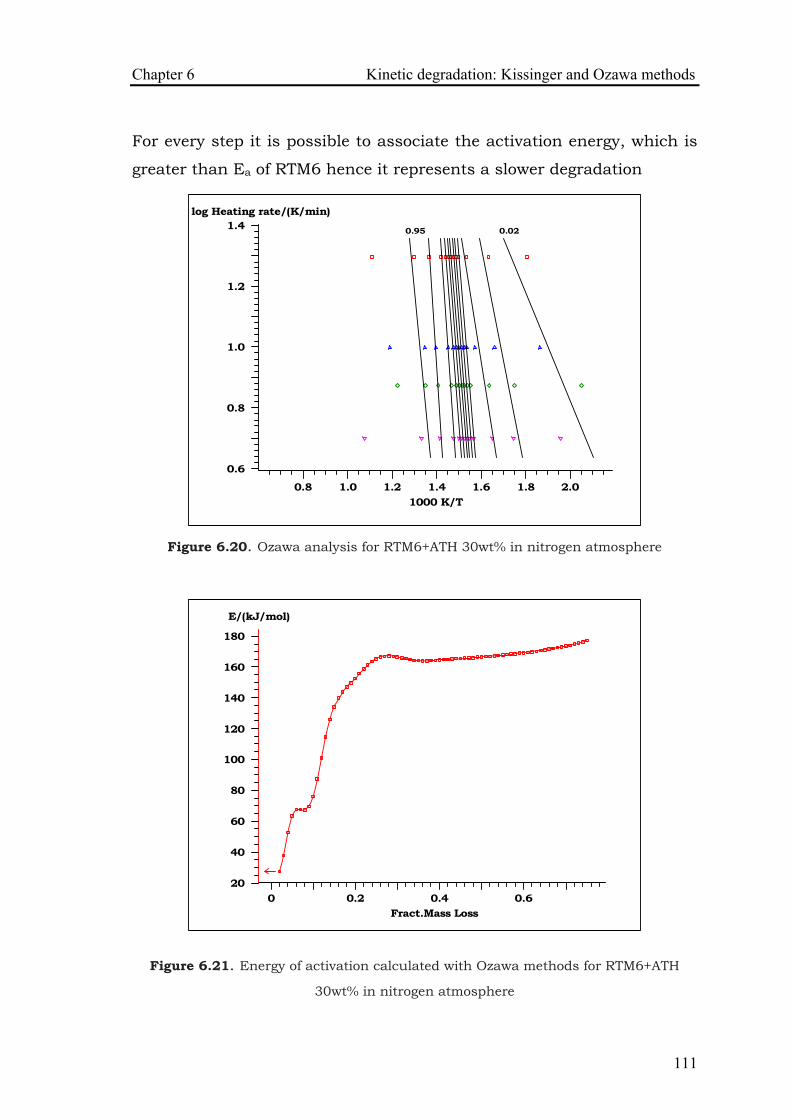
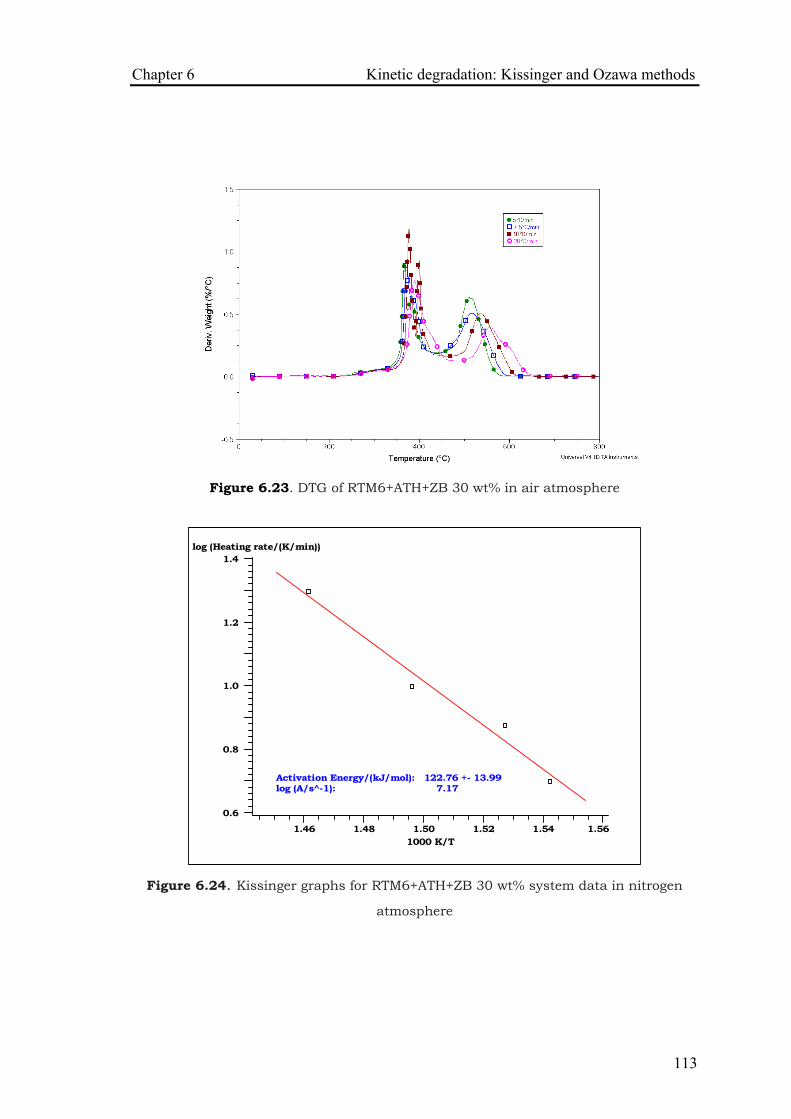
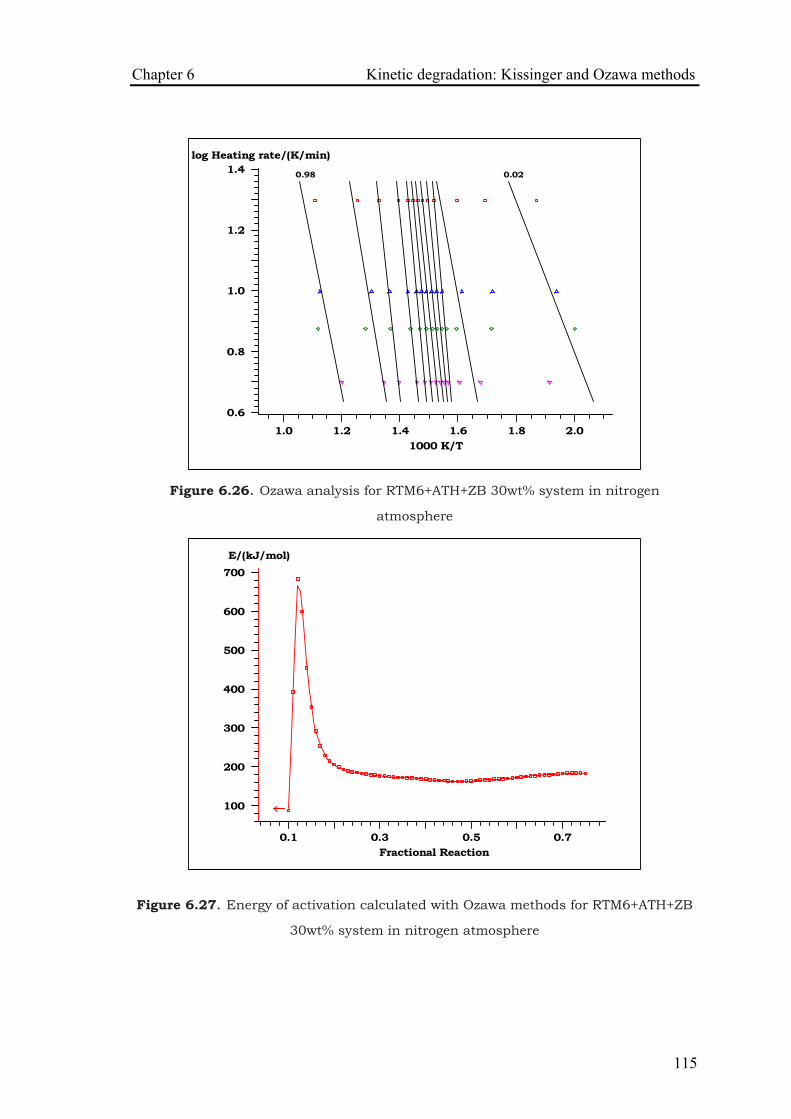
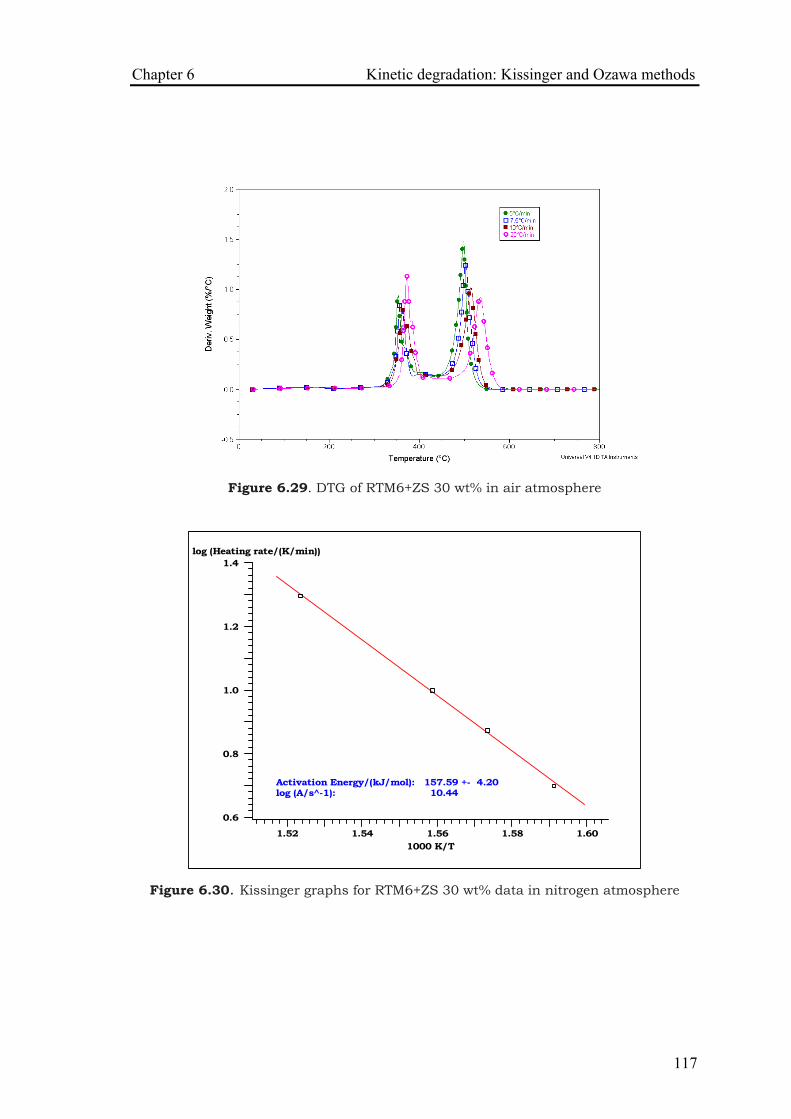
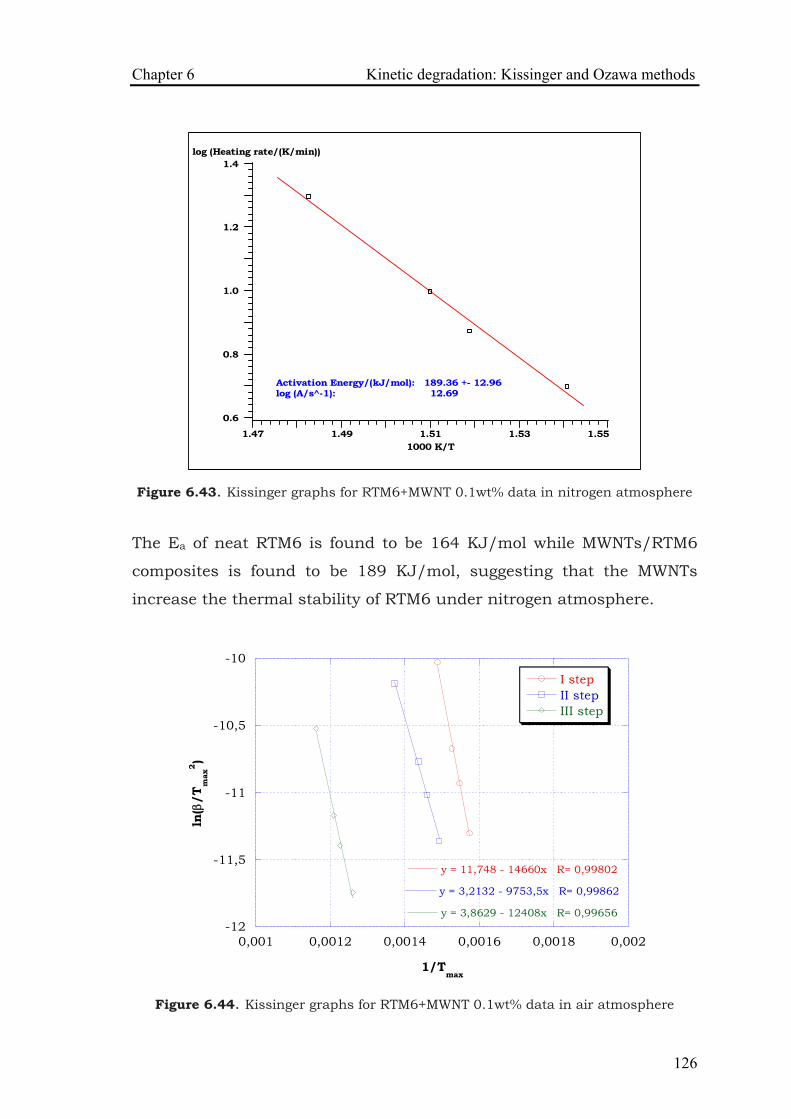
62 Kinetic degradations of RTM6 and inorganic compounds
63 Kinetic degradations of RTM6 and carbon nanotubes
iii
64 Analysis of residue
References
Chapter 7 Conclusions and future perspectives
71 Conclusions
72 Future Perspectives
ACKNOWLEDGMENTS
I want to thank Dr Engineer Giordano for this opportunity and to Dr Engineer Zarrelli for
having believed in my possibilities and for allowing me to fulfill them
To Professor Camino and Dr Engineer Frache of Turin Polytechnic for having welcomed me in
their structure with professionality and kindness To my family for their (also monetary) support To my friendscolleagues for their help and for
putting up with me and my temper and Especially ldquoThank yourdquo to my beloved Ciro who
has always been by my side despite everything To Daniele who supported me and was tortured
by me To Anna who has been a moral and professional
support and for not having sent me to hell yet
CHAPTER 1 INTRODUCTION
11 Combustion mechanisms The use of polymer composites has grown at a phenomenal rate since
the 1960s and these materials now have an impressive and diverse
range of applications in aircraft spacecraft boats ships automobiles
civil infrastructure sporting goods and consumer products The growth
in the use of composite materials by various industry sectors in the
United States since 1960 is reported in figure 11 Growth in the use of
composites has reached a level where they are now challenging the use
of traditional materials - most notably steels and aluminium alloys - in
many markets particularly the aircraft boat-building and chemical
processing industries
Figure 11 Growth in the (a) total use and (b) use by individual market sectors in the United States (Source Composite Fabrication Association)
Chapter 1 Introduction
2
The use of composites in a wide variety of applications is due to their
many outstanding physical thermal chemical and mechanical
properties Key advantages of composites over many metal alloys
include low density high specific stiffness and specific strength good
fatigue endurance excellent corrosion resistance outstanding thermal
insulation and low thermal expansion However there are several
disadvantages with composites that have impacted on their growth in
some markets Composites are plagued by problems such as low
through-thickness mechanical properties poor impact damage
tolerance and anisotropic properties A major disadvantage of many
composite materials is poor performance in fire When composites are
exposed to high temperatures (typically above 300-400degC) the organic
matrix decomposes with the release of heat smoke soot and toxic
volatiles Composites also soften creep and distort when heated to
moderate temperature (gt100-200degC) that can result in buckling and
failure of load-bearing composite structures The heat smoke and gases
released by a burning composite and the degradation in structural
integrity can make fire-fighting extremely hazardous and increase the
likelihood of serious injury and death The susceptibility of composites
to fire has been the key issue in curtailing their use in many
infrastructure and public transportation applications
Although many polymer composites are flammable their resistance to
pyrolysis can be improved Furthermore these materials possess some
potentially useful properties in fire that are not inherent with metals
Composites have excellent thermal insulation properties and slow burn-
through The rate of heat conduction through composites is much
slower than metals and this is a significant benefit is slowing the
spread of fire from room-to-room Composites can provide an effective
protective barrier against flame heat smoke and toxic fumes
Fire is a complicated phenomenon that can develop in stages of
increasing temperature and size before decaying The fire event becomes
Chapter 1 Introduction
3
more complex when a polymer composite material is involved because it
can control the temperature size and spread of the flame A turbulent
flame consists of three zones and from the base to top can be divided
into the solid flame region intermittent flame region and thermal plume
(Fig 12) The solid flame region near the plume base is where the
majority of the flammable vapours undergo exothermic chain-branching
reactions that generate most of the heat
The temperature within this zone is reasonably constant at about 830-
900degC for most types of solid fuels [1] although the maximum
temperature in hydrocarbon pool fires and natural gas flames can reach
1150-1250degC [2] Above the solid flame is the intermittent flame region
and the temperature drops continuously the higher up this zone The
average temperature at the visible tips of a flame is about 400degC [3]
although it can vary over a wide range from 300 to 600degC [1] The
boundary between the solid flame and intermittent regions is not well
defined in a turbulent flame and some overlap or changes in the
boundary location do occur Above the flame tips is the thermal plume
region where no flames are visible and the temperature drops with
height The thermal plume consists of hot gases vapours and soot
particles that can carried upwards by convective heat
Figure 12 Schematic showing the different zones within a turbulent plume
Chapter 1 Introduction
4
The initiation and growth of fire is determined by a multitude of factors
including the type (caloric value) of fuel fuel load fuel size (area)
oxygen content in the flame wind speed and whether the fire is within
an open or enclosed space In the case of polymer composites exposed
to fire the material itself can be a rich source of fuel that causes the
temperature to rise and the flame to spread
A serious concern with using composites in enclosed spaces such as an
aircraft cabin ship compartment or rail carriage is that the heat
smoke and toxic gases are trapped which seriously increases the fire
hazard It is therefore useful to examine the development of fire within a
closed compartment Figure 13 shows how the temperature can vary
with time for a closed compartment fire
Figure 13 Growth stages of a compartment fire
A fire can undergo several stages of growth and in order these are
1 Ignition This is the point when the fuel source ignites and
undergoes sustained flaming combustion
2 Growth The initial growth of a fire is dependent mainly on the
fuel itself with little or no influence from the combustible
materials within the compartment The fire will grow and the
compartment temperature will continue to rise if sufficient fuel
and oxygen are available It is often in this stage that composite
Chapter 1 Introduction
5
materials exposed to the flame will ignite when the temperature
exceeds 350-500degC
3 Flashover This occurs when the fire is fully developed and all
combustible items in the compartment (including any composite
materials) are involved in the fire Flashover usually occurs when
the average upper gas temperature in the room exceeds about
600degC
4 Fully developed fire This stage occurs when the heat release
rate and temperature of a fire are at their greatest The peak
temperature of a typical post-flashover room fire is 900-1000degC
although it can reach as high as 1200degC
5 Decay The final decay stage occurs as the fuel and combustible
materials become consumed causing the compartment
temperature to fall Obviously decay can also be caused by active
fire suppression systems such as sprinklers
When a composite is heated to a sufficiently high temperature the
polymer matrix and (if present) organic fibres will thermally decompose
Most polymer matrixes and organic fibres decompose over the
temperature range of about 350 to 600degC with the production of
flammable gases Decomposition occurs by a series of reactions that
breaks down the polymer chains into low molecular weight volatiles that
diffuse into the flame Depending on the chemical composition and
molecular structure of the polymer the thermal degradation reactions
may proceed by various paths The majority of organic resins and fibres
used in composites degrade thermally by a random chain scission
process This basically involves the break-down of the long organic
chains at the lowest-energy bond sites into small fragments Polymers
can also decompose by other processes including de-polymerisation
(that involves the breakdown of the chain into monomers) and chain-
end initiated scission (that involves the process starting from the chain
ends and propagating along the chain length until it is completely
degraded)
Chapter 1 Introduction
6
The combustion cycle of organic polymers is illustrated in fig 14 and
the cycle stops only when the fuel source has been exhausted which is
usually when the organic components in a composite have been
completely degraded
It is common practice by fire scientists to quantify the intensity of a fire
by the radiant heat flux rather than flame temperature
Figure 14 The combustion cycle of organic polymers
The diverse range of uses for composite materials means they can be
exposed to a variety of fire threats and their increasing use in high fire
risk applications raises the likelihood of severe fire incidents Several
case studies of fires in aircraft and ships are given to demonstrate the
importance of understanding the fire behaviour of composites and the
need for more flame resistant polymeric materials
The fire behaviour of composites materials is distinct by two important
properties Fire reaction and Fire resistant
Fire reaction describes the flammability and combustion properties of
a material from ignition to flashover and also explains the smoke
toxicity of a combustible material The fire reaction properties that
influence fire growth are the heat release rate time to ignition flame
spread rate and oxygen index
Chapter 1 Introduction
7
The heat release rate (HRR) is a quantitative measure of the amount
of thermal energy released by a material per unit area when exposed to
a fire radiating a constant heat flux (or temperature) and his unit is
kWm2 The heat release rate value of a composite material is
determined by the thermal energy liberated in several thermo-chemical
decomposition processes with the most important being exothermic
combustion at the compositeflame boundary of flammable gas
products released by the decomposing polymer matrix and (if present)
organic fibres Two parameters describe the heat release rate average
HRR and peak HRR The average heat release rate is the averaged
value over a certain period of time (usually three or five minutes) The
peak heat release rate is the maximum amount of heat liberated by a
material during the combustion process and it often occurs over a very
short period of time (less than a few seconds) The peak heat release
rate is considered a critical property controlling the maximum
temperature and flame spread rate
Time to ignition (TTI) is the period that a combustible material can
withstand exposure to a constant radiant heat flux before igniting and
undergoing sustained flaming combustion
Flame spread rate describes the speed at which the flame front will
travel over the surface of a combustible material The flame spread rate
is an experimentally measured value and various experimental
techniques with important differences in test configuration are used
Some tests are used to measure the rate of flame spread in a downward
direction while other techniques measure it in a vertical or inclined
direction Consequently the value for flame spread rate is test-
dependent Oxygen index is defined as the minimum oxygen content in
the fire environment required to sustain flaming combustion of a
material Materials with high oxygen index values should be used in
high fire risk applications particularly for internal structures and
components because they offer the potential to self-extinguish when
the fire becomes deprived of oxygen
Chapter 1 Introduction
8
Two other important fire reaction properties are smoke density and gas
toxicity because they have a major impact on the ability of humans to
survive a fire Smoke density is defined and measured in several ways
but basically it is the concentration of smoke particles (eg soot water
vapour) within the plume of a fire Gas toxicity is a generic term that
describes the concentration and lethality of gas products within the
smoke plume
While many fire reaction properties are important in the development of
fire up to the point of flashover the fire resistant properties are critical
when the fire has fully developed
Fire resistance defines the ability of a material or structure to impede
the spread of fire and retain mechanical integrity In other words fire
resistance describes the ability of a construction to prevent a fire from
spreading from one room to neighbouring rooms Fire resistance also
describes the ability of a construction to retain structural integrity (ie
shape load-bearing properties) in a fire The main fire resistant
properties are heat insulation burn-through resistance and structural
integrity Heat insulation is simply the resistive property that describes
the rate of heat conduction through a material when exposed to fire
Obviously materials that are good heat insulators are best suited for
slowing the spread of fire from room-to-room and this is one of the
attributes of composites compared to metals Burn-through resistance
is the time taken for a flame to penetrate a material and emerge from
the opposing side Composites generally have better burn-through
resistance than metals that melt at temperatures below the flame
temperature such as aluminium alloys Mechanical integrity is
another important fire resistant property and this defines the ability of
a material or structure to retain mechanical properties such as
stiffness creep resistance and strength when exposed to fire and after
the fire has been extinguished The behaviour of composites materials
in fire is based by chemical and thermal decomposition of the matrix
used In figure 15 is showed the decomposition process of polymer
Chapter 1 Introduction
9
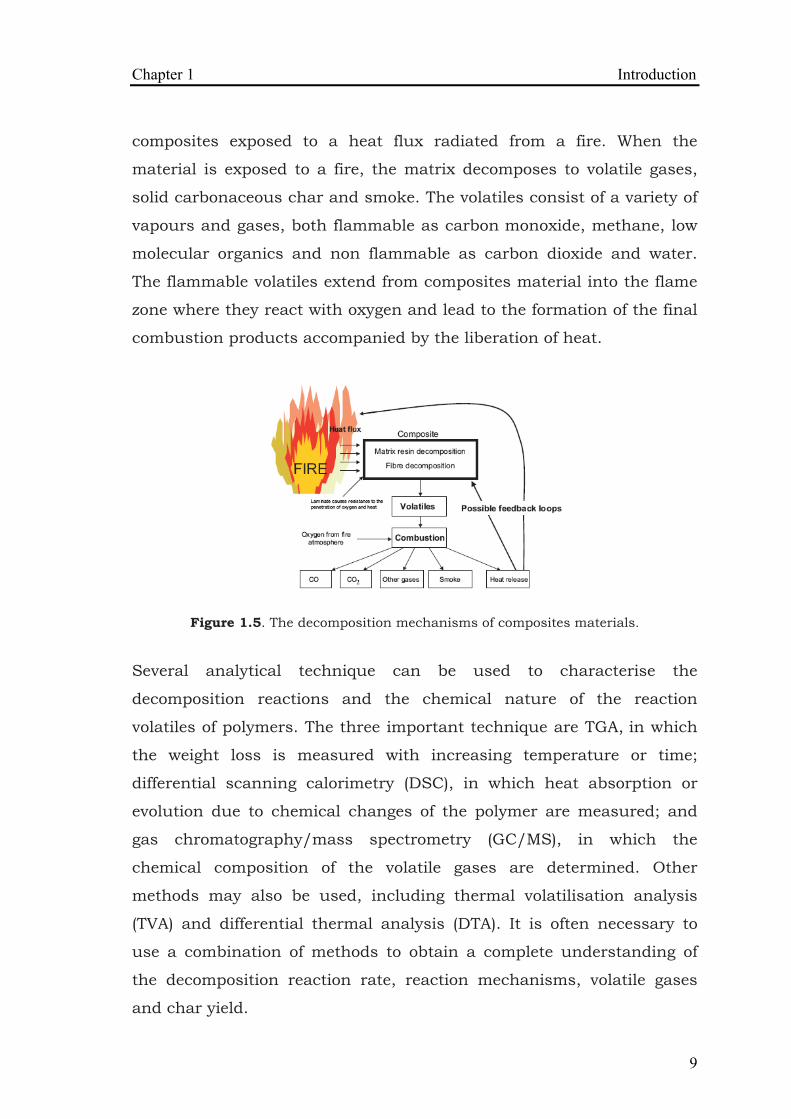
composites exposed to a heat flux radiated from a fire When the
material is exposed to a fire the matrix decomposes to volatile gases
solid carbonaceous char and smoke The volatiles consist of a variety of
vapours and gases both flammable as carbon monoxide methane low
molecular organics and non flammable as carbon dioxide and water
The flammable volatiles extend from composites material into the flame
zone where they react with oxygen and lead to the formation of the final
combustion products accompanied by the liberation of heat
Figure 15 The decomposition mechanisms of composites materials
Several analytical technique can be used to characterise the
decomposition reactions and the chemical nature of the reaction
volatiles of polymers The three important technique are TGA in which
the weight loss is measured with increasing temperature or time
differential scanning calorimetry (DSC) in which heat absorption or
evolution due to chemical changes of the polymer are measured and
gas chromatographymass spectrometry (GCMS) in which the
chemical composition of the volatile gases are determined Other
methods may also be used including thermal volatilisation analysis
(TVA) and differential thermal analysis (DTA) It is often necessary to
use a combination of methods to obtain a complete understanding of
the decomposition reaction rate reaction mechanisms volatile gases
and char yield
Chapter 1 Introduction
10
12 Fire test for composites materials
A large quantity of information is available on the fire reaction
properties of polymer composites and the level of fire hazard associated
with their use is known for a large number of materials We also have a
good understanding of the chemical thermal and physical mechanisms
that control reaction properties such as time-to-ignition heat release
rate flame spread rate smoke production and toxicity
In short we have quite a good quantitative understanding of the fire
reaction behavior of composites Unfortunately less is known about the
fire resisting properties such as burn-through resistance dimensional
stability and structural integrity especially when the structure is under
load Moreover it is not usually possible to estimate the fire resistive
behavior based solely on the known fire reaction properties A
composite that has good fire reaction properties such as low heat
release rate and smoke yield may not necessarily have good fire
resistive properties Composites with a polymer matrix having high
thermal stability decomposition temperature and char yield may not
necessarily have better fire resistive properties than more flammable
materials
The first fire test was developed in the early twentieth century and over
the last one hundred years a large number of tests have been used to
characterise the fire properties of combustible materials The number of
tests available to characterise fire reaction is now immense For
example the American Society for Testing and Materials (ASTM) have
over 80 fire test standards in the 1999 edition of their handbooks on
testing standards The standards are applicable to a wide range of
materials including building products woods plastics and other
combustible materials None of the ASTM fire standards are specific to
polymer composites but are instead generic to a wide range of
materials The ASTM is one of many international standardisation
organisations that publish fire test methods Not all of the tests of
Chapter 1 Introduction
11
course are relevant for testing composites many tests are only suitable
for evaluating building materials woods or some other type of
combustible material Only a relatively small number of tests are
suitable for determining the fire properties of composite materials or
structures
Experimental techniques used to measure the fire properties of
composites range in size from bench-top apparatus for testing small
specimens weighing only a few grams up to full-scale tests for large
structures
Regardless of scale it is important that fire reaction tests are performed
in conditions that closely replicate the type of fire to which the
composite will be exposed These fires range in heat flux from low
intensity fires were the radiant heat flux is under 20 kWm2 to intense
fires were the heat flux can exceed 150 kWm2
The range of test methods for determining the fire reaction and fire
resistive properties of composites is clearly very diverse although some
attempts are now being made to rationalize this situation The tests
vary in scale and complexity and considerable care must be exercised
when selecting the most appropriate procedure Most fire reaction
testing is performed using bench-scale apparatus because of the lower
cost and greater simplicity Test methods such as the cone calorimeter
OSU calorimeter and radiant flame spread technique have an excellent
track record and are widely used for determining the fire behaviour of
composites However the problem of scaling-up from small-scale test
results to fire performance of large structures in real fires is a major
difficulty
Problems common to bench-scale tests are that the ignition heating
and atmospheric (oxygen content) conditions are not representative of
an actual fire The growth and spread of fire cannot be accurately
replicated using these tests and it is usually not possible to achieve
flashover Further the specimens are rarely tested in the end-use
condition
Chapter 1 Introduction
12
Large-scale fire tests such as the room calorimeter avoid many of the
problems associated with small size and allow the composite article to
be tested in the end-use condition However large fire tests are
generally slow and expensive to perform and may only produce data
relevant to one particular situation [4]
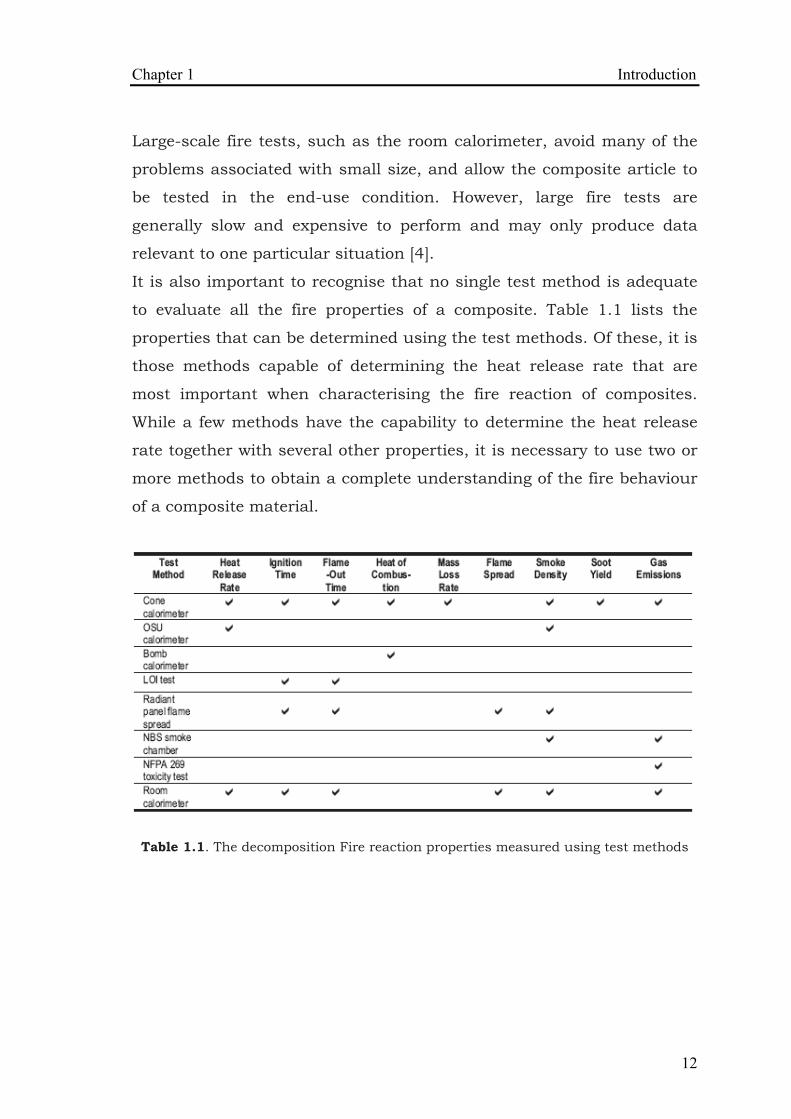
It is also important to recognise that no single test method is adequate
to evaluate all the fire properties of a composite Table 11 lists the
properties that can be determined using the test methods Of these it is
those methods capable of determining the heat release rate that are
most important when characterising the fire reaction of composites
While a few methods have the capability to determine the heat release
rate together with several other properties it is necessary to use two or
more methods to obtain a complete understanding of the fire behaviour
of a composite material
Table 11 The decomposition Fire reaction properties measured using test methods
Chapter 1 Introduction
13
References [1] HIngason Two dimensional rack storage fires Proceedings of the
Fourth International Symposium on Fire Safety Science 19941209-
1220
[2] KS Mudan and PA Croce Fire hazard calculations for large open
hydrocarbon fires in SFPE Handbook of Fire Protection Engineering
ed PJ DiNenno et al 1995 2-13
[3] H Inganson and J de Ris Flame heat transfer in storage
geometries Journal of Fire Safety 1997
[4] Mouritz AP Gibson AG Fire Properties of Polymer Composite
Materials Springer
CHAPTER 2 MATERIALS
21 Thermosetting resin RTM6 Epoxy resins are used worldwide on a large scale for adhesive
lamination coating casting applications and contain a very large
number of chemical types All such resins rely on the reactivity of the
three member epoxy group at both ends of the molecule Other more
complex types of epoxy resins are employed when a higher level of
functionality is needed ie when a grater number of cross-linking points
per epoxy group (fig21) is required as for instance in some of the
higher performance resins used in aerospace Traditionally epoxy
resins are cured by reacting them with amines or anhydrides these
materials being known as ldquohardenersrdquo There are also catalysts that will
polymerise the resin via the end groups and hydroxyls without the need
for a hardener
Figure 21 Epoxy group
Many epoxy resins and hardeners are viscous or even solid at room
temperature and may require preheating or dilution to lower their
viscosity prior to processing into composites Further heating
sometimes to temperatures up to 150-180degC is often needed to promote
resin gelation and curing Nevertheless epoxies are used in all the
traditional composite processes including wet laminating resin
transfer moulding and filament winding Decomposition of most epoxies
occurs via random chain scission reactions over the temperature range
of about 380 to 450degC
Chapter 2 Materials
15
HexFlowreg RTM6 provided by Hexcel is a premixed monocomponent
epoxy resin system specially developed to fulfil the requirements of the
aerospace and space industry in advanced resin transfer moulding
processes (RTM) The expected service temperatures of final products
range from -60degC to 180degC At room temperature RTM6 is a transluced
paste and its viscosity drops very quickly upon heating The uncured
resin has a density of 1117 gcm3 and the fully cured resin 1141
gcm3 When fully cured it exhibits high glass transition temperatures
excellent hot wet properties and low moisture absorption According to
the manufacturer the shelf life of this resin at 23degC is at least 15 days
whereas at -18degC it is approximately 9 months [1]
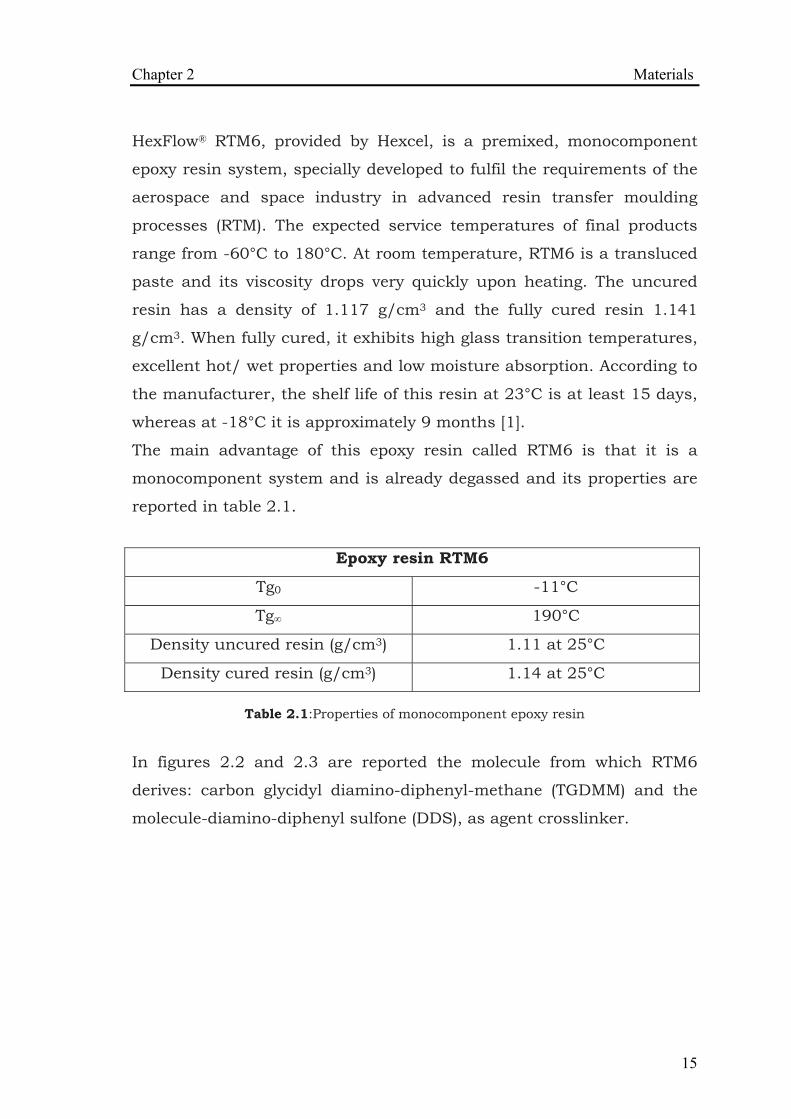
The main advantage of this epoxy resin called RTM6 is that it is a
monocomponent system and is already degassed and its properties are
reported in table 21
Epoxy resin RTM6
Tg0 -11degC
Tginfin 190degC
Density uncured resin (gcm3) 111 at 25degC
Density cured resin (gcm3) 114 at 25degC
Table 21Properties of monocomponent epoxy resin
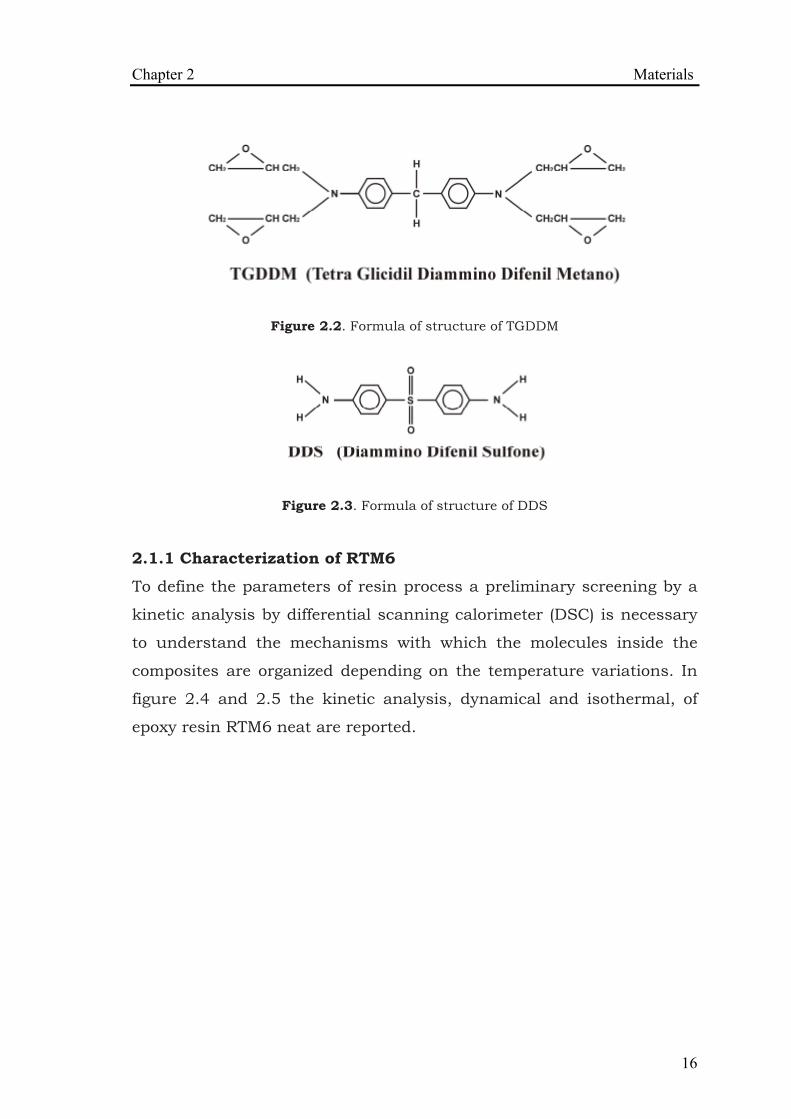
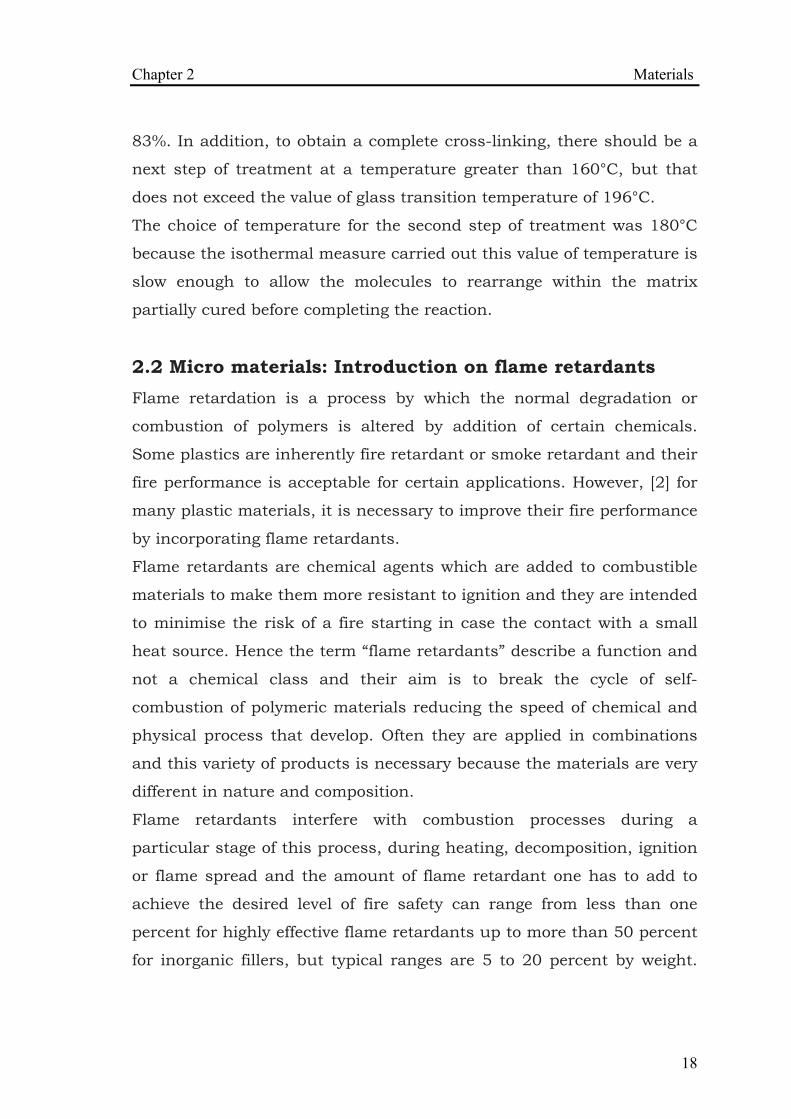
In figures 22 and 23 are reported the molecule from which RTM6
derives carbon glycidyl diamino-diphenyl-methane (TGDMM) and the
molecule-diamino-diphenyl sulfone (DDS) as agent crosslinker
Chapter 2 Materials
16
Figure 22 Formula of structure of TGDDM
Figure 23 Formula of structure of DDS
211 Characterization of RTM6
To define the parameters of resin process a preliminary screening by a
kinetic analysis by differential scanning calorimeter (DSC) is necessary
to understand the mechanisms with which the molecules inside the
composites are organized depending on the temperature variations In
figure 24 and 25 the kinetic analysis dynamical and isothermal of
epoxy resin RTM6 neat are reported
Chapter 2 Materials
17
-05
0
05
1
15
2
25
-100 0 100 200 300 400
10degCmin75degCmin5degCmin25degCmin1degCmin
Hea
t flo
w W
g
TemperaturedegC
Figure 24 Dynamic analysis of RTM6 neat
-01
0
01
02
03
04
05
06
07
0 50 100 150 200 250 300 350 400
120degC140degC160degC180degC190degC200degC
Hea
t flo
w W
g
Time min
Figure 25 Dynamic analysis of RTM6 neat
The dynamical analysis (fig24) show that the reticulation peak has a
maximum at the temperature 241degC and a energy amounted to 470Jg
From the data of the isotherm analysis (fig25) it is clear that curing for
90 minutes at 160degC results in a cross-linking of molecules equal to
Chapter 2 Materials
18
83 In addition to obtain a complete cross-linking there should be a
next step of treatment at a temperature greater than 160degC but that
does not exceed the value of glass transition temperature of 196degC
The choice of temperature for the second step of treatment was 180degC
because the isothermal measure carried out this value of temperature is
slow enough to allow the molecules to rearrange within the matrix
partially cured before completing the reaction
22 Micro materials Introduction on flame retardants Flame retardation is a process by which the normal degradation or
combustion of polymers is altered by addition of certain chemicals
Some plastics are inherently fire retardant or smoke retardant and their
fire performance is acceptable for certain applications However [2] for
many plastic materials it is necessary to improve their fire performance
by incorporating flame retardants
Flame retardants are chemical agents which are added to combustible
materials to make them more resistant to ignition and they are intended
to minimise the risk of a fire starting in case the contact with a small
heat source Hence the term ldquoflame retardantsrdquo describe a function and
not a chemical class and their aim is to break the cycle of self-
combustion of polymeric materials reducing the speed of chemical and
physical process that develop Often they are applied in combinations
and this variety of products is necessary because the materials are very
different in nature and composition
Flame retardants interfere with combustion processes during a
particular stage of this process during heating decomposition ignition
or flame spread and the amount of flame retardant one has to add to
achieve the desired level of fire safety can range from less than one
percent for highly effective flame retardants up to more than 50 percent
for inorganic fillers but typical ranges are 5 to 20 percent by weight
Chapter 2 Materials
19
Flame retardants acting by chemical and physical actions which are
divided into
bull Chemical action
1 Reaction in the gas phase The radical gas phase
combustion process is interrupted by flame retardant
resulting in cooling of the system reducing and eventually
suppressing the supply of flammable gases
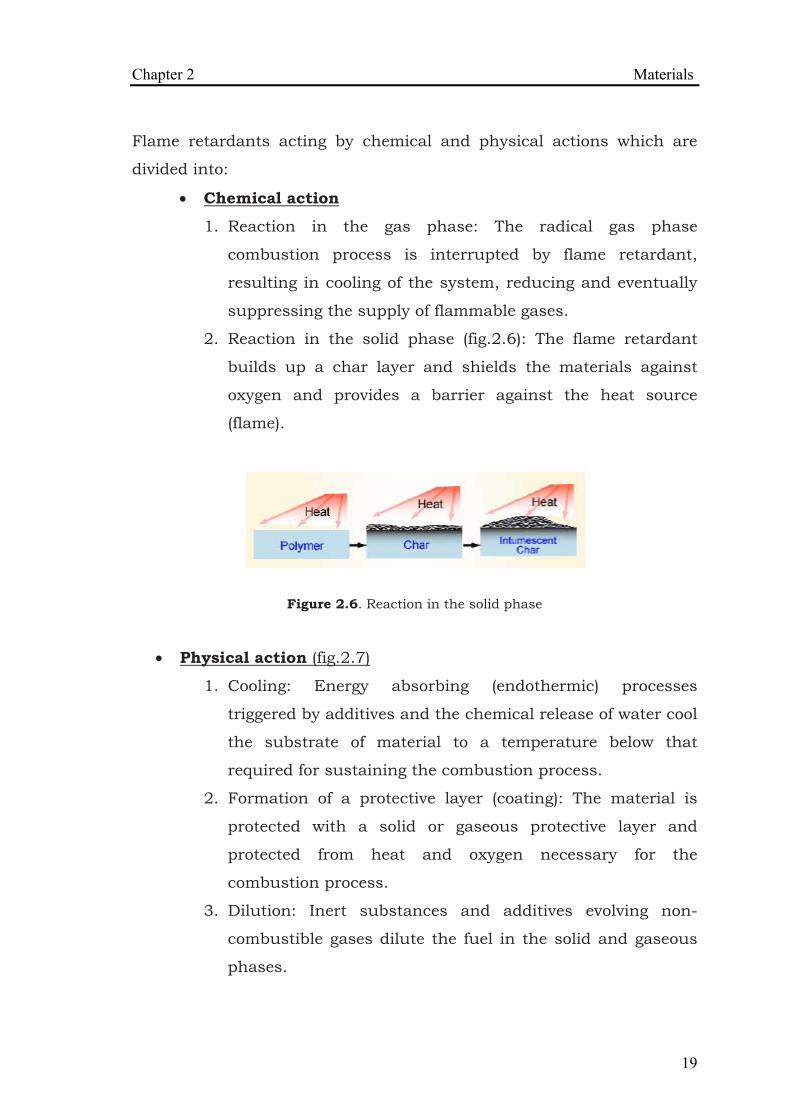
2 Reaction in the solid phase (fig26) The flame retardant
builds up a char layer and shields the materials against
oxygen and provides a barrier against the heat source
(flame)
Figure 26 Reaction in the solid phase
bull Physical action (fig27)
1 Cooling Energy absorbing (endothermic) processes
triggered by additives and the chemical release of water cool
the substrate of material to a temperature below that
required for sustaining the combustion process
2 Formation of a protective layer (coating) The material is
protected with a solid or gaseous protective layer and
protected from heat and oxygen necessary for the
combustion process
3 Dilution Inert substances and additives evolving non-
combustible gases dilute the fuel in the solid and gaseous
phases
Chapter 2 Materials
20
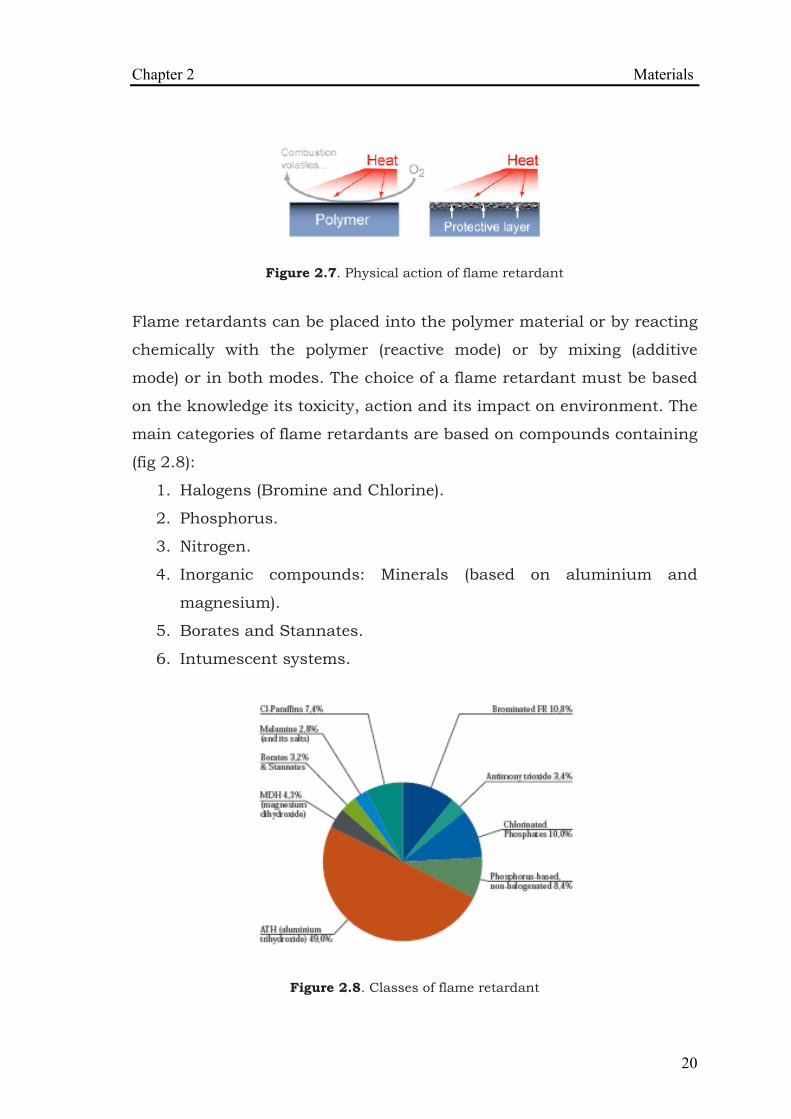
Figure 27 Physical action of flame retardant
Flame retardants can be placed into the polymer material or by reacting
chemically with the polymer (reactive mode) or by mixing (additive
mode) or in both modes The choice of a flame retardant must be based
on the knowledge its toxicity action and its impact on environment The
main categories of flame retardants are based on compounds containing
(fig 28)
1 Halogens (Bromine and Chlorine)
2 Phosphorus
3 Nitrogen
4 Inorganic compounds Minerals (based on aluminium and
magnesium)
5 Borates and Stannates
6 Intumescent systems
Figure 28 Classes of flame retardant
Chapter 2 Materials
21
Flame retardants work in a number of different ways in fact some flame
retardant are effective on their own but other are used mainly as
ldquosynergistsrdquo acting to increase the effect of other types of flame
retardants Almost all flame retardants generate a stable carbonaceous
barrier called ldquocharrdquo which protects and at the same time cools the
surface of the material
Halogenated flame retardants when exposed to high temperatures
release bromine (Br) or chlorine (Cl) as free radicals (Br- or Cl- ) which
react with hydrocarbon molecules (flammable gases) to give HBr or HCl
These then react with the high-energy H+ and OH- radicals to give water
and the much lower energy Br- or Cl- radicals which are then available
to begin a new cycle of H+ and OH- radical removal They act by
effectively removing the H+ and OH- radicals in the gas flame phase thus
reducing heat generation and so the production of further gaseous
flammable materials
Phosphorus-containing flame retardants when heated reacts to give
a polymeric form of phosphoric acid This acid crates a glass layer (char)
on the surface of the material and inhibits the pyrolysis process which
is necessary to feed flames Char plays an important role in fact it acts
as a two-way barrier that both prevents the passage of the combustible
gases and shields the polymer from the heat of the flame
A wide range of different phosphorus based flame retardants is
available including elemental red phosphorus which is oxidised to
phosphoric acid with heat ammonium polyphosphate melamine
polyphosphate phosphonates phosphinates and phosphate esters
Nitrogen-containing flame retardant (pure melamine and derivates)
are believed to act by several mechanisms In fact in the condensed
phase melamine is transformed into cross-linked structures which
promotes char formation releasing ammonia In conjunction with
phosphorus the nitrogen appears to enhance the attachment of the
phosphorus to the polymer A mechanism in the gas phase may be the
Chapter 2 Materials
22
release of molecular nitrogen which dilutes the volatile polymer
decomposition products
Antimony trioxide does not have flame retarding properties of its own
but is an effective synergist for halogenated flame retardants It acts as
a catalyst facilitating the breakdown of halogenated flame retardants
into active molecules It also reacts with the halogens to produce
volatile antimony halogen compounds which are themselves directly
effective in removing the high energy H+ and OH- radicals which feed
the flame phase of the fire thus reinforcing the flame suppressing effect
of the halogenated flame retardants When added to PVC antimony
trioxide acts to suppress flames by activating the chlorine present in the
plastic itself
Inorganic compounds are used as flame retardants interfering through
various physical processes with the burning process release of water or
non-flammable gases which dilute the gases feeding flames absorption
of heat energy thus cooling the fire production of a non-flammable and
resistant layer on the surface of material (char) These mechanisms of
inorganic compounds are however of a relatively low efficiency and the
products have to often be used in large concentrations or more usually
in combination with other types of flame retardants
Boron containing compounds act through the stepwise release of
water and the formation of a glassy coating protecting the surface Zinc
borate in halogen-free systems is normally used in conjunction with
aluminium trihydrate magnesium hydroxide or red phosphorus Zinc
stannate and zinc hydroxystannate are used to reduce smoke emission
from PVC to promote charring or as synergists to increase the
effectiveness of halogenated or nitrogen flame retardants
Finally intumescent coatings are fire protection systems which are
used to protect materials such as wood or plastic from fire but also to
protect steel and other materials from the high temperatures of fire The
coatings are made of a combination of products applied to the surface
Chapter 2 Materials
23
like a paint which are designed to expand to form an insulating and
fire-resistant covering when subject to heat
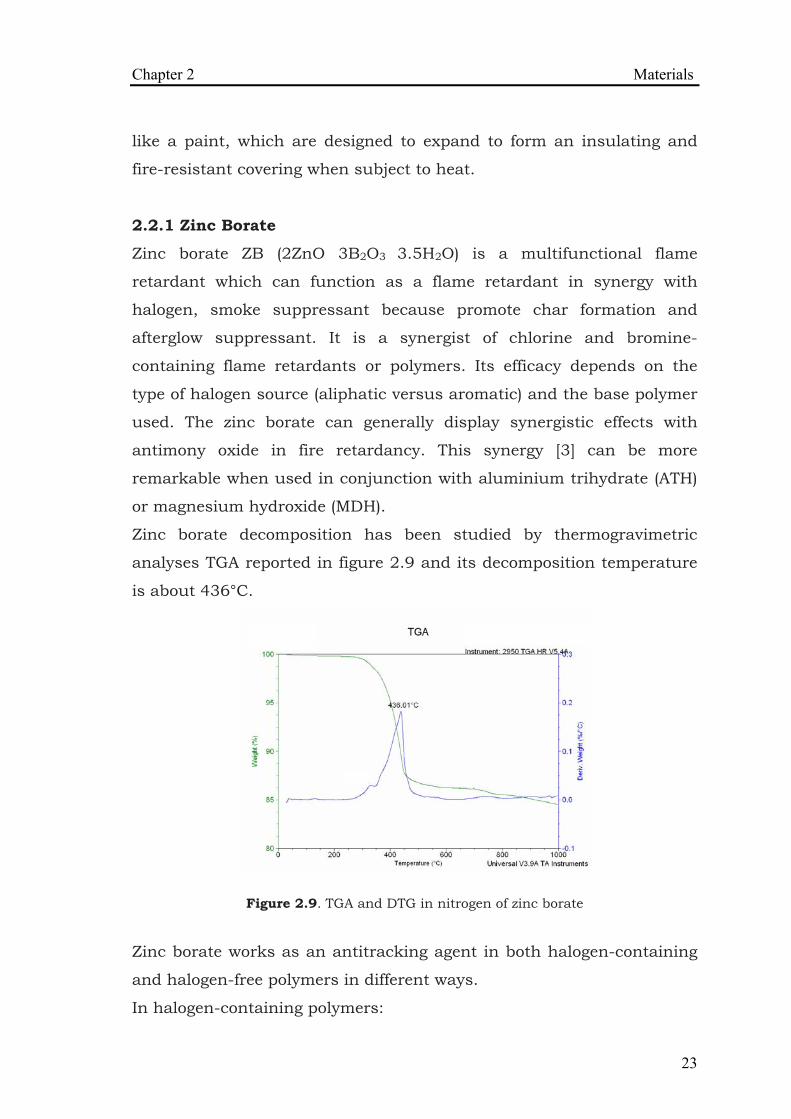
221 Zinc Borate
Zinc borate ZB (2ZnO 3B2O3 35H2O) is a multifunctional flame
retardant which can function as a flame retardant in synergy with
halogen smoke suppressant because promote char formation and
afterglow suppressant It is a synergist of chlorine and bromine-
containing flame retardants or polymers Its efficacy depends on the
type of halogen source (aliphatic versus aromatic) and the base polymer
used The zinc borate can generally display synergistic effects with
antimony oxide in fire retardancy This synergy [3] can be more
remarkable when used in conjunction with aluminium trihydrate (ATH)
or magnesium hydroxide (MDH)
Zinc borate decomposition has been studied by thermogravimetric
analyses TGA reported in figure 29 and its decomposition temperature
is about 436degC
Figure 29 TGA and DTG in nitrogen of zinc borate
Zinc borate works as an antitracking agent in both halogen-containing
and halogen-free polymers in different ways
In halogen-containing polymers
Chapter 2 Materials
24
bull Zinc borate possesses a synergistic effect with halogen sources
bull Zinc borate display synergistic effects with antimony oxide in fire
retardancy In the presence of ATH or MDH this synergy can be
augmented significantly
bull In some polymer systems zinc borate can completely replace
antimony oxide
bull In contrast to antimony oxide zinc borate is predominant in the
condensed phase and can work as a smoke suppressant
bull Zinc borate promotes char formation and prevents burning drips
The zinc oxide moiety can promote char formation with halogen
sources and B2O3 moiety can stabilize the char
bull Zinc borate can improve the thermal stability of polyamides
containing halogenantimony trioxide and improve the aged
elongation property of polyolefin
bull Improves corrosion resistance
In halogen-free polymers
bull Zinc borate are multifunctional fire retardants in halogen-free
polymers
bull When used in combination with metal hydroxides zinc borate can
work as a sintering aid to promote the formation of a strong
charceramic residue that can act as an insulator for underlying
polymer
bull Zinc borate can reduce the heat release rate smoke evolution
carbon monoxide generation and afterglow combustion
bull The use of a co-additive such as the siliconesilica melamine
polyphosphate talc or red phosphorous can increase the fire test
performance of zinc boratemetal hydroxide combination
bull Zinc borate alone can work as a flame retardant in certain
halogen-free systems
Chapter 2 Materials
25
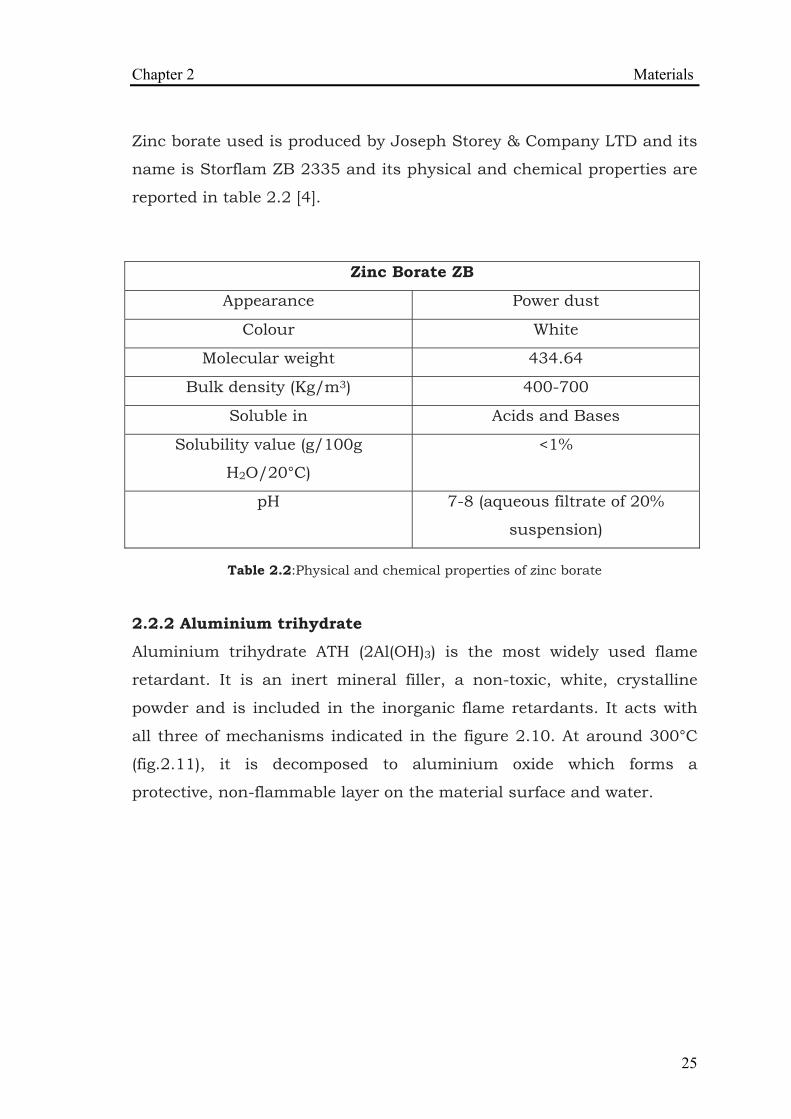
Zinc borate used is produced by Joseph Storey amp Company LTD and its
name is Storflam ZB 2335 and its physical and chemical properties are
reported in table 22 [4]
Zinc Borate ZB
Appearance Power dust
Colour White
Molecular weight 43464
Bulk density (Kgm3) 400-700
Soluble in Acids and Bases
Solubility value (g100g
H2O20degC)
lt1
pH 7-8 (aqueous filtrate of 20
suspension)
Table 22Physical and chemical properties of zinc borate
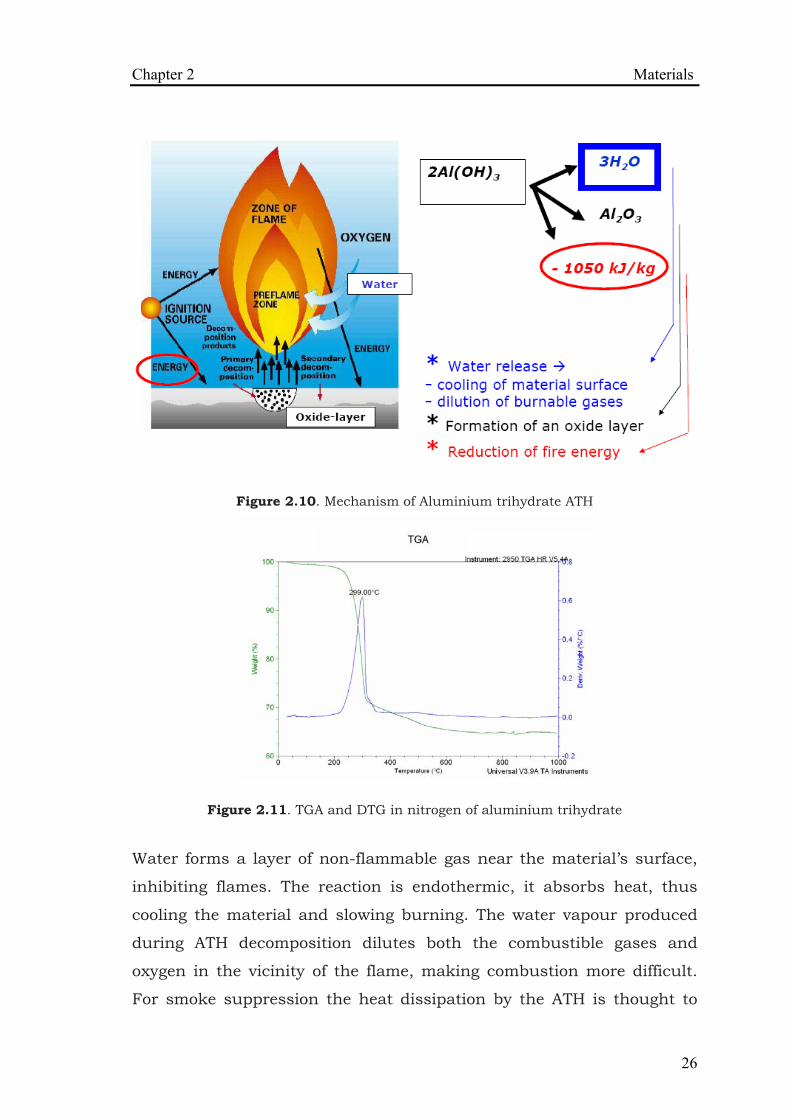
222 Aluminium trihydrate
Aluminium trihydrate ATH (2Al(OH)3) is the most widely used flame
retardant It is an inert mineral filler a non-toxic white crystalline
powder and is included in the inorganic flame retardants It acts with
all three of mechanisms indicated in the figure 210 At around 300degC
(fig211) it is decomposed to aluminium oxide which forms a
protective non-flammable layer on the material surface and water
Chapter 2 Materials
26
Figure 210 Mechanism of Aluminium trihydrate ATH
Figure 211 TGA and DTG in nitrogen of aluminium trihydrate
Water forms a layer of non-flammable gas near the materialrsquos surface
inhibiting flames The reaction is endothermic it absorbs heat thus
cooling the material and slowing burning The water vapour produced
during ATH decomposition dilutes both the combustible gases and
oxygen in the vicinity of the flame making combustion more difficult
For smoke suppression the heat dissipation by the ATH is thought to
Chapter 2 Materials
27
aid in forming char rather than forming smoke by favouring
crosslinking reactions over soot formation The char provides a fuel-
oxygen barrier on the surface of the burning polymer
Aluminium trihydrate used in this work is produced by Dadco and
provided by Joseph Storey amp Company LTD [4] and its physical and
chemical properties are reported in table 23
Aluminium trihydrate ATH
LOI (110degC-1100degC) () 346
Specific gravity (gcm3) 24
Whiteness () gt 91
Bulk density (Kgm3) 500-700
Medium grain size diameter (μm) 40-75
Boiling point (degC) 2700 (Al2O3 decomposition
product)
Density at 20degC (gml) 242
Table 23Physical and chemical properties of aluminium trihydrate
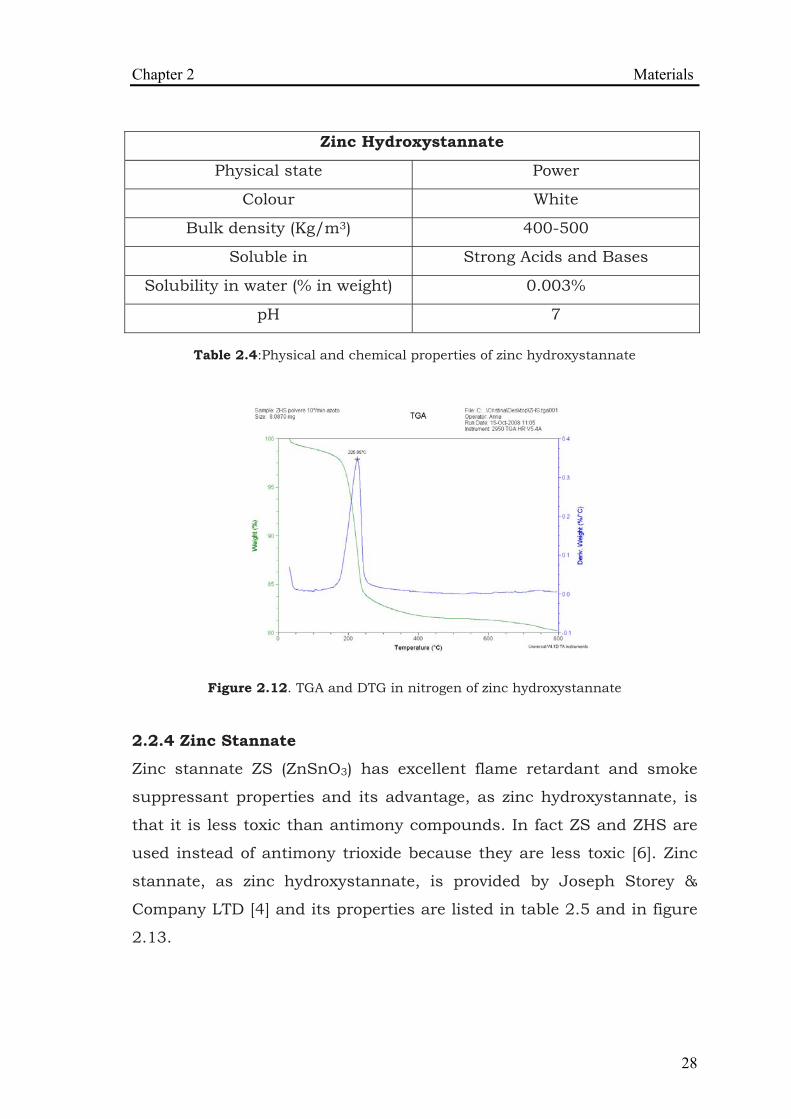
223 Zinc Hydroxystannate
Zinc hydroxystannate ZHS (ZnSn(OH)6) is a fire retardant and a smoke
suppressant additive for polymeric materials [5] It was developed as a
smoke suppressant for PVC but later it was found that it also acts as a
flame retardant in certain plastics mainly by promoting char formation
and can usually partly substitute antimony trioxide Recent studies to
develop flame retardants formation have used inorganic tin compounds
such as zinc hydroxystannate because it is less toxic [2] The physical
and chemical properties of ZHS are reported in table 24 and it is
provided by Joseph Storey amp Company LTD [4] and its decomposition
temperature (225degC) is reported in figure 212
Chapter 2 Materials
28
Zinc Hydroxystannate
Physical state Power
Colour White
Bulk density (Kgm3) 400-500
Soluble in Strong Acids and Bases
Solubility in water ( in weight) 0003
pH 7
Table 24Physical and chemical properties of zinc hydroxystannate
Figure 212 TGA and DTG in nitrogen of zinc hydroxystannate
224 Zinc Stannate
Zinc stannate ZS (ZnSnO3) has excellent flame retardant and smoke
suppressant properties and its advantage as zinc hydroxystannate is
that it is less toxic than antimony compounds In fact ZS and ZHS are
used instead of antimony trioxide because they are less toxic [6] Zinc
stannate as zinc hydroxystannate is provided by Joseph Storey amp
Company LTD [4] and its properties are listed in table 25 and in figure
213
Chapter 2 Materials
29
Zinc Stannate
Appearance Power dust
Colour White
Bulk density (Kgm3) 400-500
Soluble in Strong Acids and Bases
Solubility value (g100g
H2O20degC) 0003
pH 7
Molecular weight 23207
Table 25Physical and chemical properties of zinc stannate
Figure 213 TGA in nitrogen of zinc hydroxystannate
Zinc hydroxystannate shows several degradation steps and different
decomposition temperatures hence its DTG is not reported
23 Nano materials Introduction on carbon nanotubes
The discovery of carbon nanotubes can be traced back to the origin of
fullerene chemistry (buckyball C60) in 1985 [7] Fullerenes have
provided an exciting new insight into carbon nanostructures built from
sp2 carbon units based on geometric architectures In 1991 Iijima [8]
Chapter 2 Materials
30
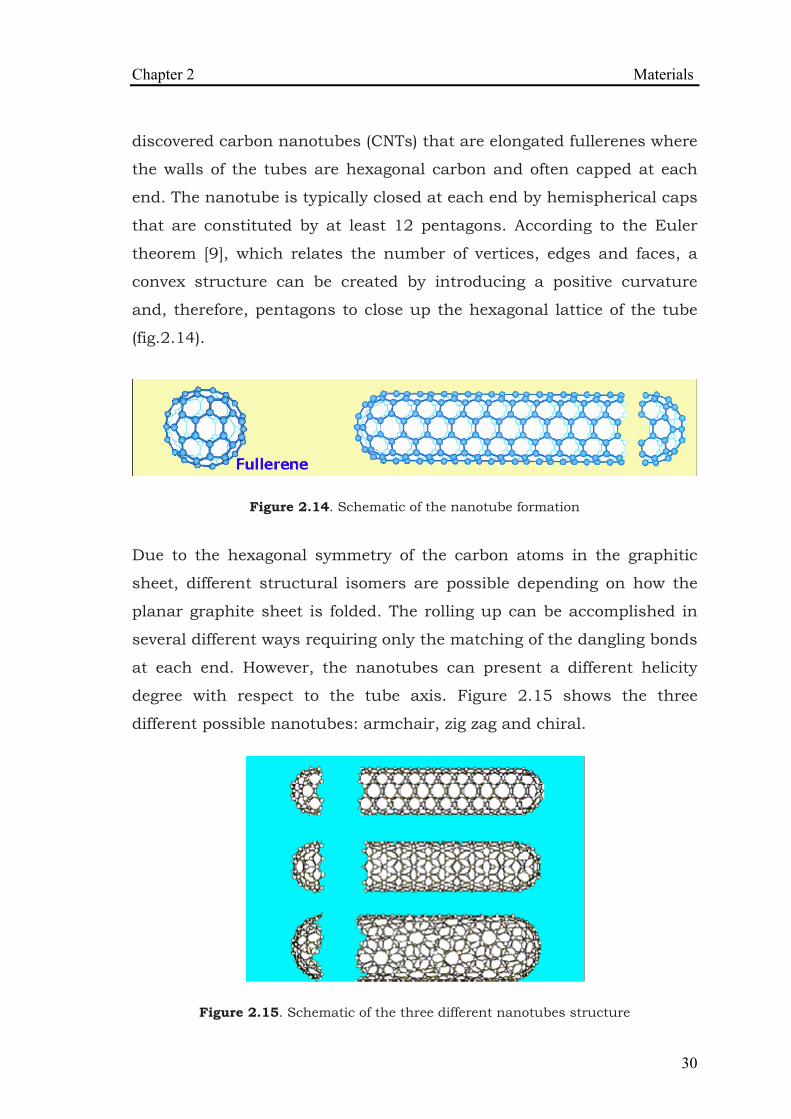
discovered carbon nanotubes (CNTs) that are elongated fullerenes where
the walls of the tubes are hexagonal carbon and often capped at each
end The nanotube is typically closed at each end by hemispherical caps
that are constituted by at least 12 pentagons According to the Euler
theorem [9] which relates the number of vertices edges and faces a
convex structure can be created by introducing a positive curvature
and therefore pentagons to close up the hexagonal lattice of the tube
(fig214)
Figure 214 Schematic of the nanotube formation
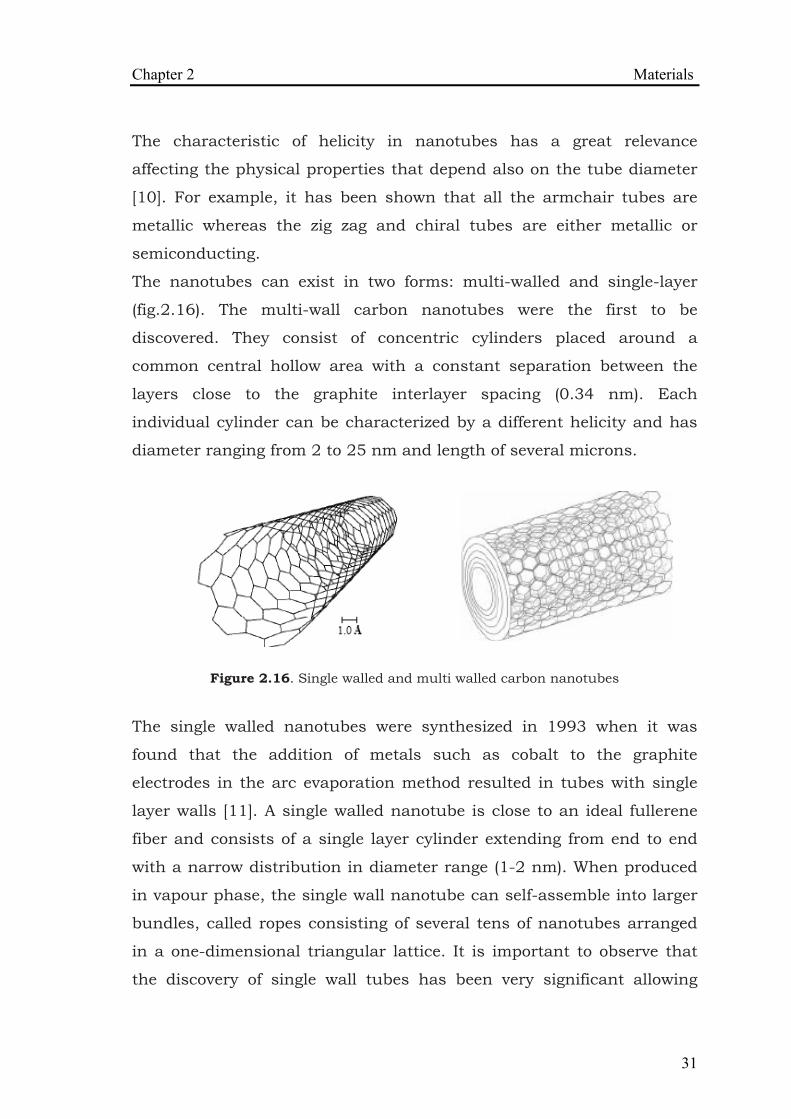
Due to the hexagonal symmetry of the carbon atoms in the graphitic
sheet different structural isomers are possible depending on how the
planar graphite sheet is folded The rolling up can be accomplished in
several different ways requiring only the matching of the dangling bonds
at each end However the nanotubes can present a different helicity
degree with respect to the tube axis Figure 215 shows the three
different possible nanotubes armchair zig zag and chiral
Figure 215 Schematic of the three different nanotubes structure
Chapter 2 Materials
31
The characteristic of helicity in nanotubes has a great relevance
affecting the physical properties that depend also on the tube diameter
[10] For example it has been shown that all the armchair tubes are
metallic whereas the zig zag and chiral tubes are either metallic or
semiconducting
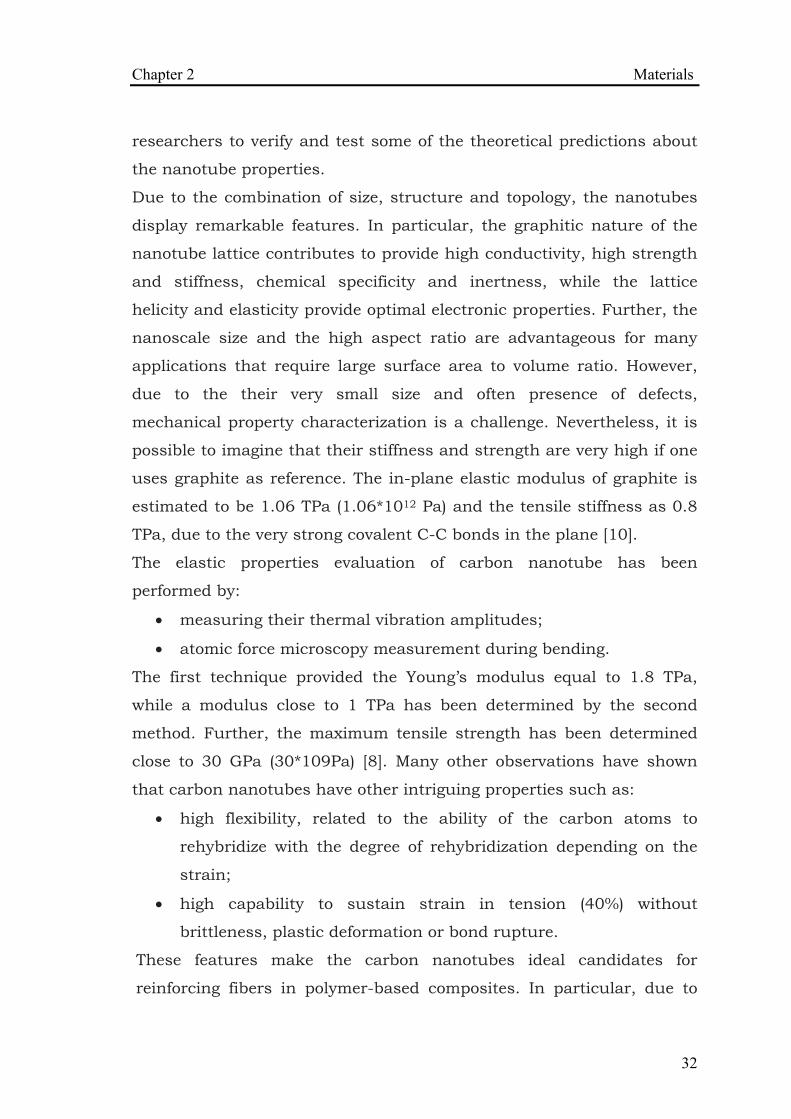
The nanotubes can exist in two forms multi-walled and single-layer
(fig216) The multi-wall carbon nanotubes were the first to be
discovered They consist of concentric cylinders placed around a
common central hollow area with a constant separation between the
layers close to the graphite interlayer spacing (034 nm) Each
individual cylinder can be characterized by a different helicity and has
diameter ranging from 2 to 25 nm and length of several microns
Figure 216 Single walled and multi walled carbon nanotubes
The single walled nanotubes were synthesized in 1993 when it was
found that the addition of metals such as cobalt to the graphite
electrodes in the arc evaporation method resulted in tubes with single
layer walls [11] A single walled nanotube is close to an ideal fullerene
fiber and consists of a single layer cylinder extending from end to end
with a narrow distribution in diameter range (1-2 nm) When produced
in vapour phase the single wall nanotube can self-assemble into larger
bundles called ropes consisting of several tens of nanotubes arranged
in a one-dimensional triangular lattice It is important to observe that
the discovery of single wall tubes has been very significant allowing
Chapter 2 Materials
32
researchers to verify and test some of the theoretical predictions about
the nanotube properties
Due to the combination of size structure and topology the nanotubes
display remarkable features In particular the graphitic nature of the
nanotube lattice contributes to provide high conductivity high strength
and stiffness chemical specificity and inertness while the lattice
helicity and elasticity provide optimal electronic properties Further the
nanoscale size and the high aspect ratio are advantageous for many
applications that require large surface area to volume ratio However
due to the their very small size and often presence of defects
mechanical property characterization is a challenge Nevertheless it is
possible to imagine that their stiffness and strength are very high if one
uses graphite as reference The in-plane elastic modulus of graphite is
estimated to be 106 TPa (1061012 Pa) and the tensile stiffness as 08
TPa due to the very strong covalent C-C bonds in the plane [10]
The elastic properties evaluation of carbon nanotube has been
performed by
bull measuring their thermal vibration amplitudes
bull atomic force microscopy measurement during bending
The first technique provided the Youngrsquos modulus equal to 18 TPa
while a modulus close to 1 TPa has been determined by the second
method Further the maximum tensile strength has been determined
close to 30 GPa (30109Pa) [8] Many other observations have shown
that carbon nanotubes have other intriguing properties such as
bull high flexibility related to the ability of the carbon atoms to
rehybridize with the degree of rehybridization depending on the
strain
bull high capability to sustain strain in tension (40) without
brittleness plastic deformation or bond rupture
These features make the carbon nanotubes ideal candidates for
reinforcing fibers in polymer-based composites In particular due to
Chapter 2 Materials
33
their ability to sustain high deformations they have a significant
advantage over carbon fibers in composites for structural and strength
applications However the effective reinforcement action due to the
nanotubes hinges on the success of the preparation techniques and
stable dispersion of the nanotubes in the polymer matrix In most
cases since the nanotubes have many entanglements it is a challenge
and an unresolved issue to disperse them effectively with polymer
systems to make strong and stiff components
Carbon nanotubes have extraordinary properties that have attracted the
attention of several researchers from diverse fields Substantial effort
has been devoted to the experimental evaluation and theoretical
calculation of their physical electronic magnetic electrical and
mechanical properties
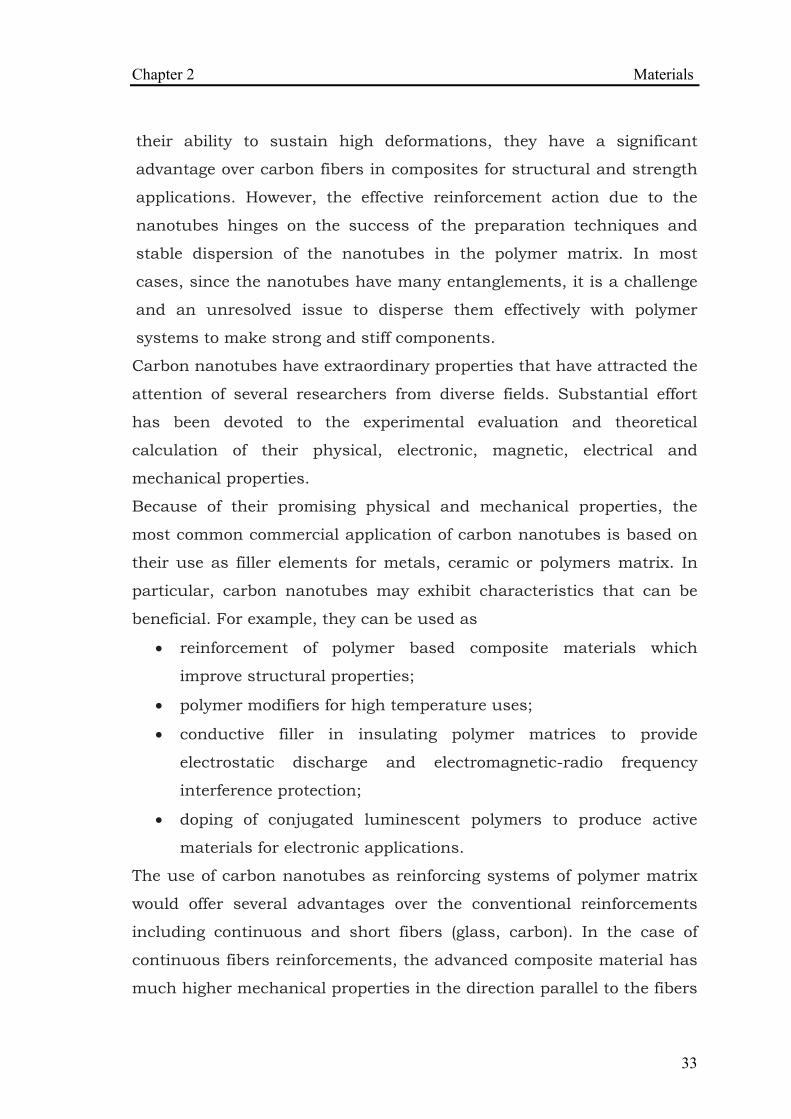
Because of their promising physical and mechanical properties the
most common commercial application of carbon nanotubes is based on
their use as filler elements for metals ceramic or polymers matrix In
particular carbon nanotubes may exhibit characteristics that can be
beneficial For example they can be used as
bull reinforcement of polymer based composite materials which
improve structural properties
bull polymer modifiers for high temperature uses
bull conductive filler in insulating polymer matrices to provide
electrostatic discharge and electromagnetic-radio frequency
interference protection
bull doping of conjugated luminescent polymers to produce active
materials for electronic applications
The use of carbon nanotubes as reinforcing systems of polymer matrix
would offer several advantages over the conventional reinforcements
including continuous and short fibers (glass carbon) In the case of
continuous fibers reinforcements the advanced composite material has
much higher mechanical properties in the direction parallel to the fibers
Chapter 2 Materials
34
or in the plane of the lamina than in the transverse direction
Furthermore since the conventional polymer processing equipment
cannot process the long continuous fibers their use is limited to simple
shapes and limited production On the other hand itrsquos established that
the fiber aspect ratio represents the critical factor affecting the resulting
structural properties of short fiber composites As the aspect ratio
increases the composite stiffness and strength increase However the
packing of short fibers in a polymer matrix is a percolation
phenomenon so the maximum packing decreases with increasing
aspect ratio (see figure 16) and may not be sufficient to manufacture a
very strong material [12]
Dispersion process of carbon nanotubes represents a very complex
phenomenon due to their natural tendency to bundle together due to
van der Walls interactions A non uniform dispersion can lead to many
defect sites and reach resin area limiting not only the efficiency of CNTs
as reinforcement filler for the polymer composite matrix [13-18] A good
dispersion and possibly the alignment of CNTs within a matrix is still a
challenge and it could play the main factor driving the diffusion of CNT
or MWCNT as nano-reinforcement on industrial scale [1718] in fact are
used several dispersion technique to separate the agglomerates into
individual nanotubes
Carbon nanotubes are another candidate as a FR additive because of
their highly elongated shape (high aspect ratio) The in situ formation of
a continuous network structured protective layer from the tubes is
critical for significant reduction in heat release rate because the layer
thus acts as a thermal shield from energy feedback from the flame [19]
231 Multi walled carbon nanotubes Nanocyl 7000
The multi walled carbon nanotubes used in this word are provided by
Nanocyl SA (Belgium) and are denominated Nanocyl 7000 This multi
walled carbon nanotubes are produced via the catalytic carbon vapour
deposition (ccvd) process Nanotubes exit the reactor with a purity of
Chapter 2 Materials
35
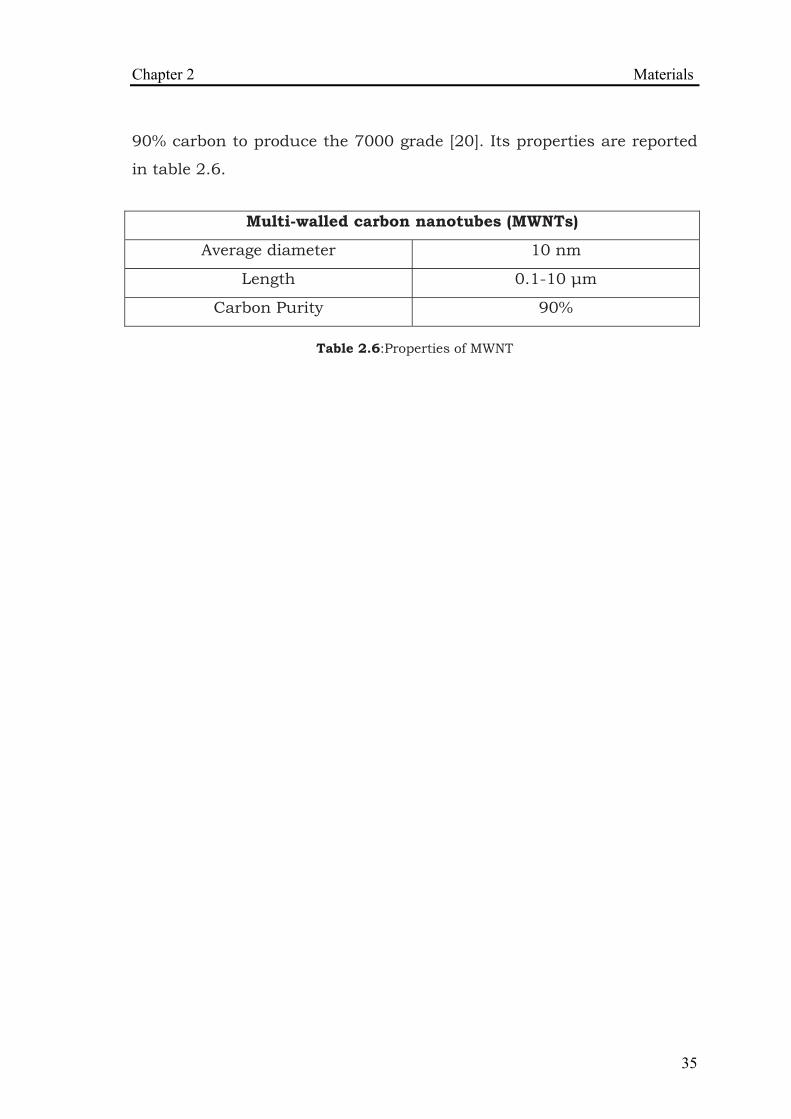
90 carbon to produce the 7000 grade [20] Its properties are reported
in table 26
Multi-walled carbon nanotubes (MWNTs)
Average diameter 10 nm
Length 01-10 μm
Carbon Purity 90
Table 26Properties of MWNT
Chapter 2 Materials
36
References [1] wwwhexcelcomHexFlowRTM6pdf
[2] Petsom A Roengsumran S Ariyaphattanakul A Sangvanich P
Polym Degrad Stab 2003(80)17-22
[3] Shen KK Kochesfahani S Jouffret F PolymAdvTechnol 2008
(19)469-474
[4] Data sheet provided by Joseph Storey amp Company LTD
[5] Hornsby PR Cusack PA Cross M Toth A Zelei B Marosi G
Journal of materials science 2003 (38)2893-2899
[6] Cusack PA Heer MS Monk AW Polymer Degradation and Stability
1997 (58)229-237
[7] Kroto HW Heath JR OrsquoBrien SC Curl RF Smalley RE Nature
1985 318 162
[8] Iijima S Nature 1991 354 56
[9] Ebbesen WT Physics Today 1996 26-32
[10] Ajayan PM Chem Rev 1999 (99)1787-1799
[11] Ebbesen WTCRC 1997
[12] Calvert P Nature 1999 (399)210-211
[13] Qian D Dickey EC Andrews R Rantell T Appl Phys Lett 2000
76 (20)2868-2870
[14] Park C et al Chemical Physical Letters 2002 (364)303-308
[15] Ham HT Choi YS Chung JI Journal of Col and Inter Science
2005 286 (1)216-223
[16] Salvetat JP Briggs AD Bonard JM Bacsa RR Kulik AJ Stockli
T Burnham NA Forroacute L Phys Rev Lett 1999 82 (5)944-947
[17] Jin L Bower C Zhou O Appl Phys Lett 1998 73 (9)1197-1199
[18] Choi ES Brooks JS Eaton DL Al-Haik MS Hussaini MY
Garmestani H Li D Dahmen KJ Appl Phys 2003 (94)5451-5473
[19] Kashiwagi T Du F Winey KI Groth KM Shields JR Bellayer
SP Kim H Douglas JF Polymer 2005 (46)471-481
[20] Data sheet provided by Nanocyl SA
CHAPTER 3 EXPERIMENTAL TECHNIQUES
31 Methods 311 Micro particles Mechanical stirring
The flame retardant composites were prepared by mixing the epoxy
resin RTM6 with zinc borate aluminium trihydrate zinc stannate and
zinc hydroxystannate at different percentage (5 wt 10 wt 20 wt
30 wt 40 wt) The mixing was made by using a Heidolph RZR
mechanical stirring equipment (fig 31) The additives were included
into the matrix at 400 rpm to avoid disperse the additive on the walls of
beaker [1]
Figure 31 Heidolph RZR mechanical stirring
Afterwards the mixing was continued for 10 minutes at 1050 rpm and
10 minutes at 2000 rpm and then the mixture were degassed for 30
minutes at 90degC in a vacuum oven to eliminate entrapped air and
humidity Finally the liquid system was poured in mould and cured at
160degC and 180degC respectively for 90 mins and 120 mins according to
the curing schedule sheet of the neat epoxy resin
Chapter 3 Experimental Techniques
38
The quality of dispersion of all additives into the epoxy resin after the
mixing process was observed by Scanning Electron Microscope (1450VP
LEO)
For example the SEM micrograph of zinc borate 20 wt is reported
where the dust of zinc borate (fig 32) is well dispersed into the epoxy
matrix and it maintains its original grain size Analogous behaviour is
noticed for the aluminium trihydrate zinc stannate and zinc
hydroxystannate (fig 33)
Figure 32 Scanning electron micrograph of zinc borate dust
Figure 33 Scanning electron micrograph of the composite of RTM6 and ZB 20wt
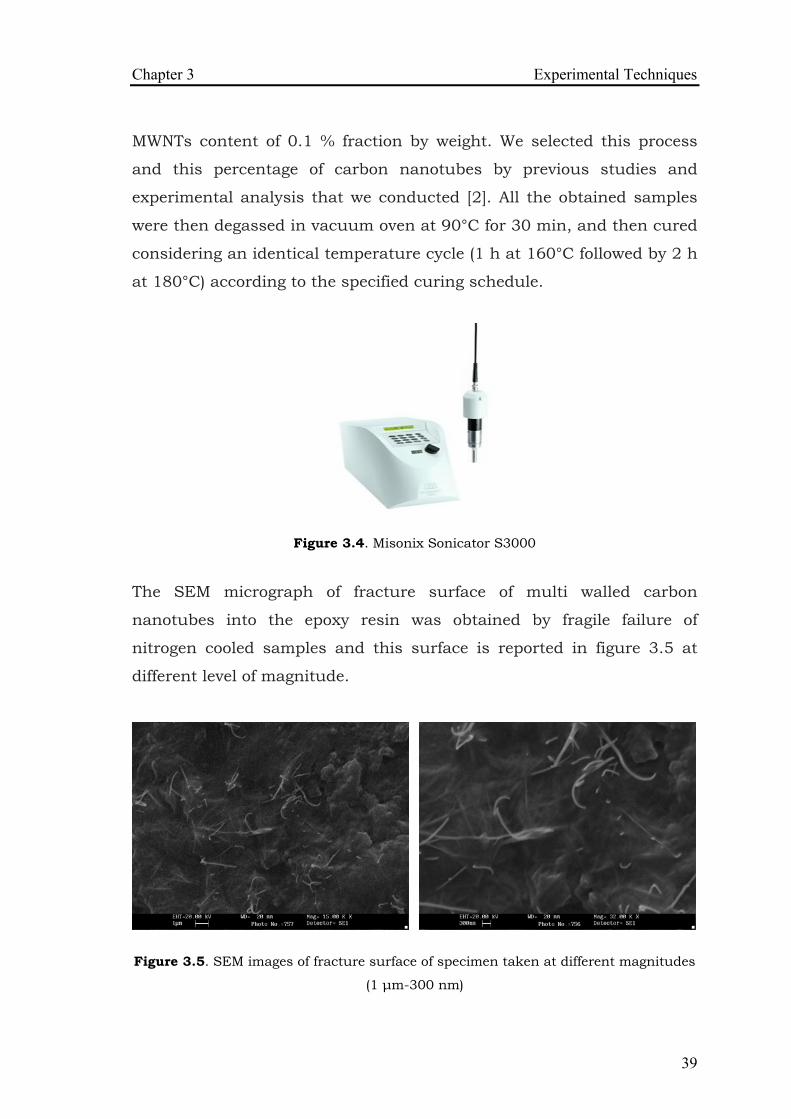
312 Nano particles Sonication
The nanocomposites were prepared by using sonication process (fig
34) for a constant time (1 hour) at temperature of 120degC with the
Chapter 3 Experimental Techniques
39
MWNTs content of 01 fraction by weight We selected this process
and this percentage of carbon nanotubes by previous studies and
experimental analysis that we conducted [2] All the obtained samples
were then degassed in vacuum oven at 90degC for 30 min and then cured
considering an identical temperature cycle (1 h at 160degC followed by 2 h
at 180degC) according to the specified curing schedule
Figure 34 Misonix Sonicator S3000
The SEM micrograph of fracture surface of multi walled carbon
nanotubes into the epoxy resin was obtained by fragile failure of
nitrogen cooled samples and this surface is reported in figure 35 at
different level of magnitude
Figure 35 SEM images of fracture surface of specimen taken at different magnitudes
(1 μm-300 nm)
Chapter 3 Experimental Techniques
40
The nanotubes reported in figure 35 are present and well separated
each other showing a good level of adhesion with the matrix in fact it
appears a satisfactory uniformity of single or agglomerated of nanotube
313 Vacuum infusion process
The vacuum infusion process (VIP) is a technique that uses vacuum
pressure to drive resin into a laminate Materials are laid dry into the
mould and the vacuum is applied before resin is introduced One a
complete vacuum is achieved resin is literally sucked into the laminate
via carefully placed tubing This process is aided by an assortment of
supplies and materials Vacuum infusion provides a number of
improvements over traditionally vacuum bagged parts These benefits
include
bull Better fiber-to-resin ratio
bull Less wasted resin
bull Very consistent resin usage
bull Unlimited set-up time
bull Cleaner
The samples were obtained by a preform of 8 plies of overlaid
unidirectional carbon fibres at zero degrees We chose 20x20cm
samples
Operations to prepare the samples are
1 Cleaning mould with acetone
2 Application of realising agent to make the mould hydrophobic
The realising agent used in this work is LOCTITEreg FREWAX
FREKOTEreg and adheres to the surface of the mould creating a
barrier between materials and mould
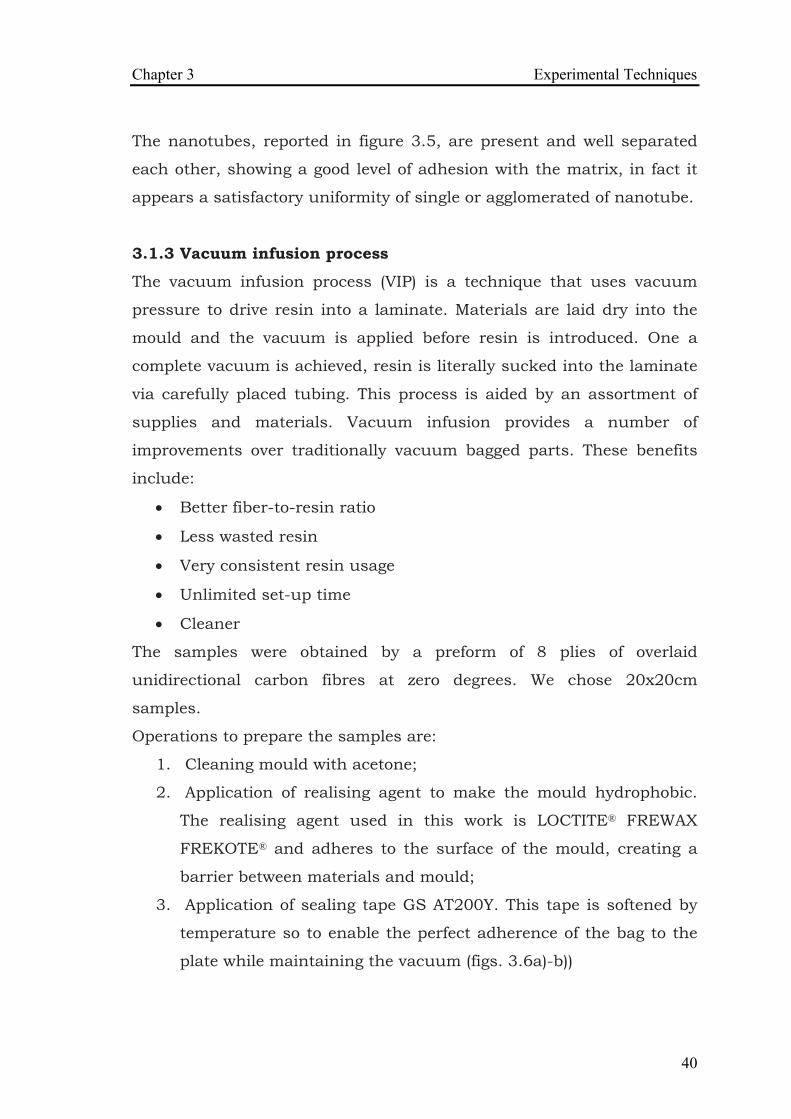
3 Application of sealing tape GS AT200Y This tape is softened by
temperature so to enable the perfect adherence of the bag to the
plate while maintaining the vacuum (figs 36a)-b))
Chapter 3 Experimental Techniques
41
Figures 36 Application of sealing tape a) and position of carbon plies b)
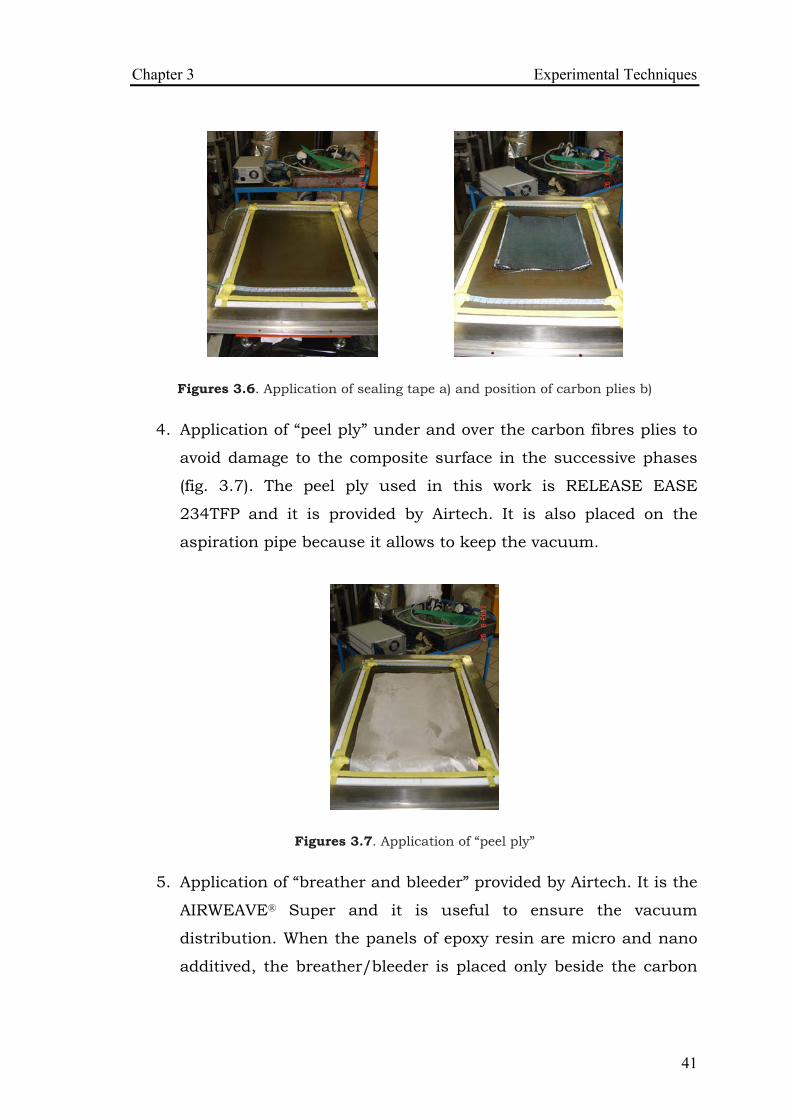
4 Application of ldquopeel plyrdquo under and over the carbon fibres plies to
avoid damage to the composite surface in the successive phases
(fig 37) The peel ply used in this work is RELEASE EASE
234TFP and it is provided by Airtech It is also placed on the
aspiration pipe because it allows to keep the vacuum
Figures 37 Application of ldquopeel plyrdquo
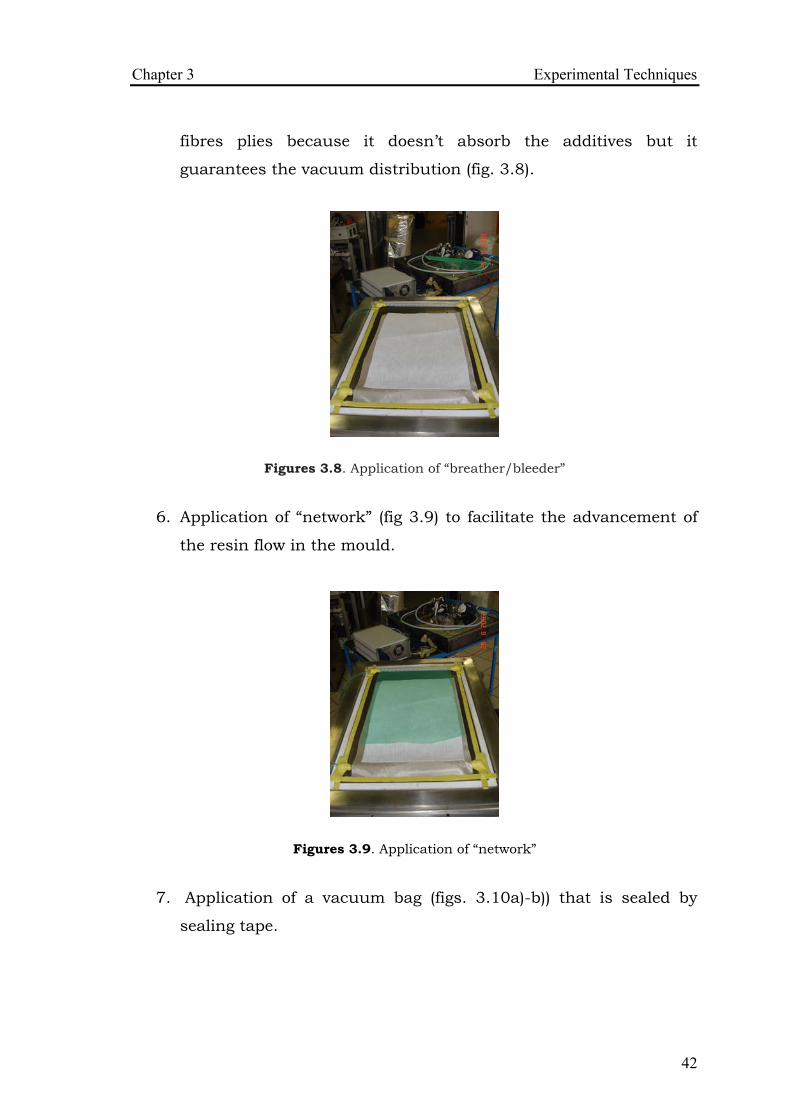
5 Application of ldquobreather and bleederrdquo provided by Airtech It is the
AIRWEAVEreg Super and it is useful to ensure the vacuum
distribution When the panels of epoxy resin are micro and nano
additived the breatherbleeder is placed only beside the carbon
Chapter 3 Experimental Techniques
42
fibres plies because it doesnrsquot absorb the additives but it
guarantees the vacuum distribution (fig 38)
Figures 38 Application of ldquobreatherbleederrdquo
6 Application of ldquonetworkrdquo (fig 39) to facilitate the advancement of
the resin flow in the mould
Figures 39 Application of ldquonetworkrdquo
7 Application of a vacuum bag (figs 310a)-b)) that is sealed by
sealing tape
Chapter 3 Experimental Techniques
43
Figures 310 Application of vacuum bag a) and creation of vacuum b)
At the end the vacuum is applied and a compaction of the different
layers is obtained (fig 310b)) and the breather allows the vacuum to
spread throughout the mould
32 Characterization 321 Cone Calorimeter
The cone calorimeter has become one of the most important and widely
used instruments for the research and development of fire retarded
polymeric materials The cone calorimeter is a performance-based
bench scale fire testing apparatus [3-7]
The cone calorimeter provides comprehensive insight into not only fire
risks such as heat release rate total heat release and time to ignition
but also fire hazards such as smoke release and CO production Cone
calorimeter investigations can be used as a universal approach to
ranking and comparing the fire behaviour of materials
However each experimental setup defines a specific fire scenario As is
typical for all fire tests samplesrsquo performance in the cone calorimeter
depends on the specific characteristics of the test including ignition
source ventilation irradiance (external heat flux) temperature and the
geometry of the specimen
Chapter 3 Experimental Techniques
44
The cone calorimeter test characterizes the performance resulting from
an interaction of material properties specimen and the defined fire
scenario
Lower external heat fluxes such as below 20 kWm2 target ignition and
flammability whereas higher external heat flux such as 50 kWm2
target flame spread and combustion properties The relevant and active
mechanisms can change significantly Hence the external heat flux
influences the conclusions implied by the cone calorimeter studies The
frequently used irradiances of 35 kWm2 or even 50 kWm2 deliver
reproducible results for forced flaming conditions with respect to flame
spread and combustion properties (fig 311)
Figure 311 Schematic diagram of the cone calorimeter
The main capability of the instrument is that the heat release response
of a burning material can be measured continuously to a high degree of
accuracy and values for peak and average heat release rate can be
determined The technique can also be used to measure time to ignition
time of sustained flaming effective heat of combustion smoke density
soot yield mass loss rate and yield of CO CO2 and other combustion
Chapter 3 Experimental Techniques
45
gases The only fire reaction property that cannot be directly determined
is the flame spread rate
Specimens tested within the cone calorimeter are flat plates that are
100mm long 100mm wide and up to 50mm thick The specimen is
placed inside a sample holder lined with a low-density refractory
material to minimise heat losses from the unexposed face It is also
necessary to insulate the specimen sides to minimise edge burning
which can give an artificially high heat release rate The sides of
composite specimens should also be sealed and insulated to avoid the
escape of volatile gases from the edges which can also affect the fire
reaction properties During fire testing the mass loss of the specimen is
recorded continuously using a load cell located beneath the sample
holder
The top surface of the specimen is positioned 25mm from the cone
heater (fig312)
Figure 312 Positioning of the sample
A spark igniter may be placed mid-way between the sample and heater
and is used to ignite combustible gases released from the thermally
decomposing material when the concentration reaches the critical level
needed to sustain flaming Most fire tests on composites are performed
Chapter 3 Experimental Techniques
46
using the igniters although it is possible not to use the igniters to study
the effect of auto-ignition on the reaction properties
During fire testing (fig313) a constant flow rate of air at 24 litres per
second is maintained in the heating chamber
This air flow rate is needed to force all the gaseous combustion
products released by the burning specimen up through the orifice of the
cone heater and into the gas exhaust system above the heating
chamber As the entrained air and combustion products enter the
exhaust system they are thoroughly mixed to avoid stratification of the
gases that can cause inaccurate heat release smoke or toxic gas
measurements
Figure 313 Burning of sample
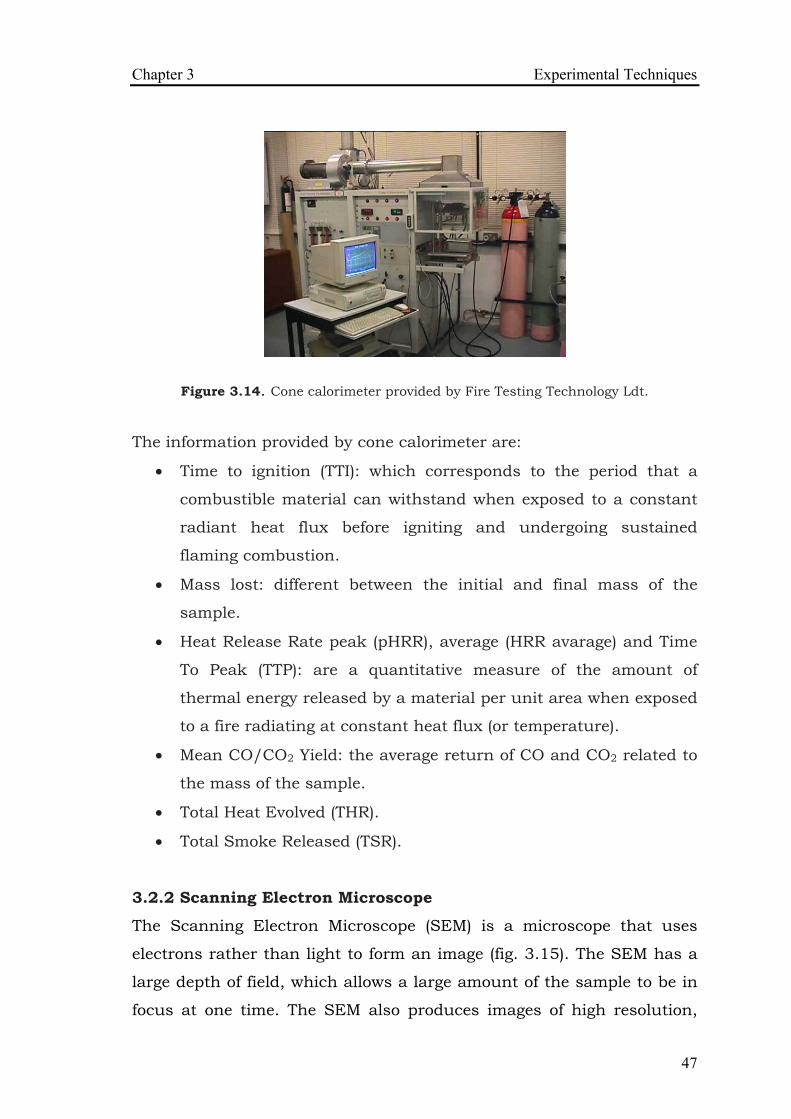
In this work the combustion tests [8] according to ASTM E 1354-04
are carried out with irradiance of 50 kWm2 for samples of a thickness
between 6-8mm and size 100times100mm using the cone calorimeter
produced by Fire Testing Technology Ldt (fig 314)
Chapter 3 Experimental Techniques
47
Figure 314 Cone calorimeter provided by Fire Testing Technology Ldt
The information provided by cone calorimeter are
bull Time to ignition (TTI) which corresponds to the period that a
combustible material can withstand when exposed to a constant
radiant heat flux before igniting and undergoing sustained
flaming combustion
bull Mass lost different between the initial and final mass of the
sample
bull Heat Release Rate peak (pHRR) average (HRR avarage) and Time
To Peak (TTP) are a quantitative measure of the amount of
thermal energy released by a material per unit area when exposed
to a fire radiating at constant heat flux (or temperature)
bull Mean COCO2 Yield the average return of CO and CO2 related to
the mass of the sample
bull Total Heat Evolved (THR)
bull Total Smoke Released (TSR)
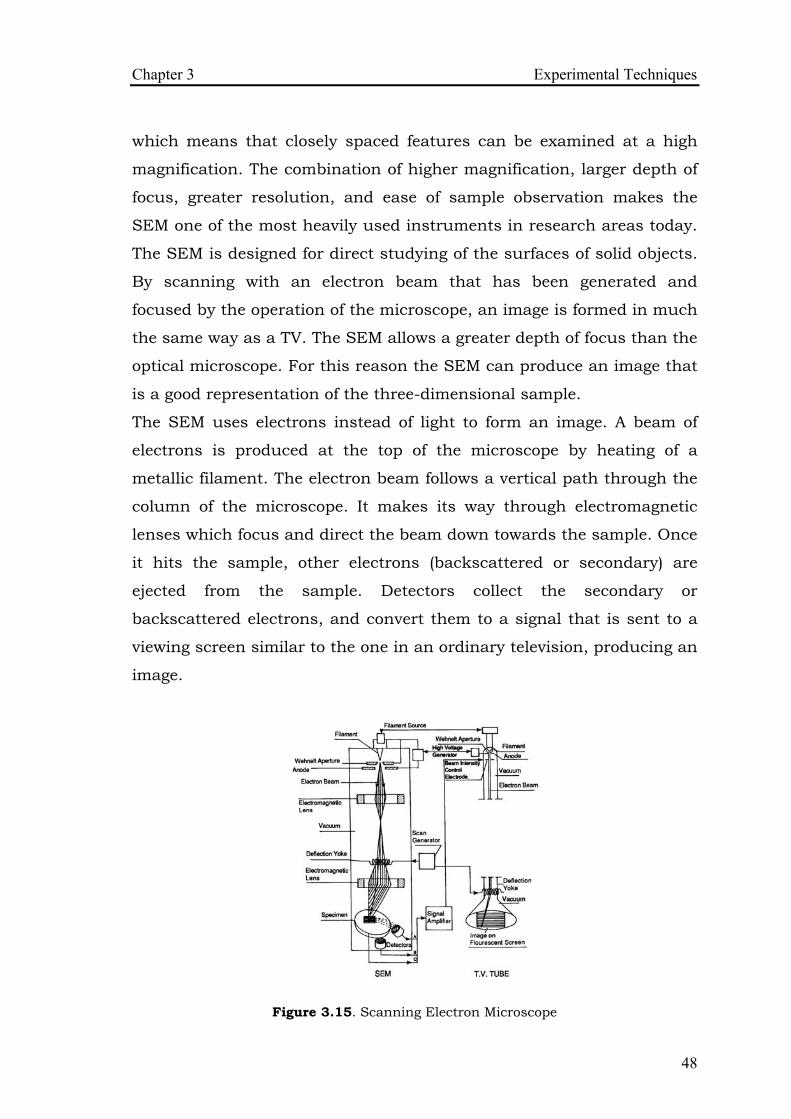
322 Scanning Electron Microscope
The Scanning Electron Microscope (SEM) is a microscope that uses
electrons rather than light to form an image (fig 315) The SEM has a
large depth of field which allows a large amount of the sample to be in
focus at one time The SEM also produces images of high resolution
Chapter 3 Experimental Techniques
48
which means that closely spaced features can be examined at a high
magnification The combination of higher magnification larger depth of
focus greater resolution and ease of sample observation makes the
SEM one of the most heavily used instruments in research areas today
The SEM is designed for direct studying of the surfaces of solid objects
By scanning with an electron beam that has been generated and
focused by the operation of the microscope an image is formed in much
the same way as a TV The SEM allows a greater depth of focus than the
optical microscope For this reason the SEM can produce an image that
is a good representation of the three-dimensional sample
The SEM uses electrons instead of light to form an image A beam of
electrons is produced at the top of the microscope by heating of a
metallic filament The electron beam follows a vertical path through the
column of the microscope It makes its way through electromagnetic
lenses which focus and direct the beam down towards the sample Once
it hits the sample other electrons (backscattered or secondary) are
ejected from the sample Detectors collect the secondary or
backscattered electrons and convert them to a signal that is sent to a
viewing screen similar to the one in an ordinary television producing an
image
Figure 315 Scanning Electron Microscope
Chapter 3 Experimental Techniques
49
When a SEM is used the column and sample must always be at
vacuum A vacuum environment means that most of the air molecules
have been removed from the inside of the microscope
Since the SEM uses electrons to produce an image most conventional
SEMs require that the samples be electrically conductive The sputter
coater uses argon gas and a small electric field The sample is placed in
a small chamber which is at vacuum Argon gas is then introduced and
an electric field is used to cause an electron to be removed from the
argon atoms to make the atoms ions with a positive charge The Ar ions
are then attracted to a negatively charged piece of gold foil The Ar ions
act like sand in a sandblaster knocking gold atoms from the surface of
the foil These gold atoms now settle onto the surface of the sample
producing a gold coating
323 Thermo mechanical analysis
Thermo mechanical analysis (TMA) is a well-known technique [9] that
measures linear or volumetric changes as a function of time
temperature and force TMA is the measurement of materials behaviour
expansion and or contraction as a function of an applied load or
temperature A scan of dimensional changes related to time or load
provides invaluable information about the samples mechanical
properties Most analyses are presented in the form of the coefficient of
thermal expansion
dL(dTL0)=CTE (coefficient of thermal expansion)
where dL is the change in length (microm) dT is the change in temperature
(degC) and L0 is the initial length (m) Thermo mechanical analysis were
conducted using a TMA-60WS (fig316) provided by SHIMADZU
We measured the CTE of epoxy resin with additives and panels obtained
by using VIP with a force of 003N from 25degC to 250degC at 3degCmin in
Chapter 3 Experimental Techniques
50
double scan and expansion mode The sample measure 3x3x15mm in
accordance to ASTM E831-06
Figure 316 TMA-60WS
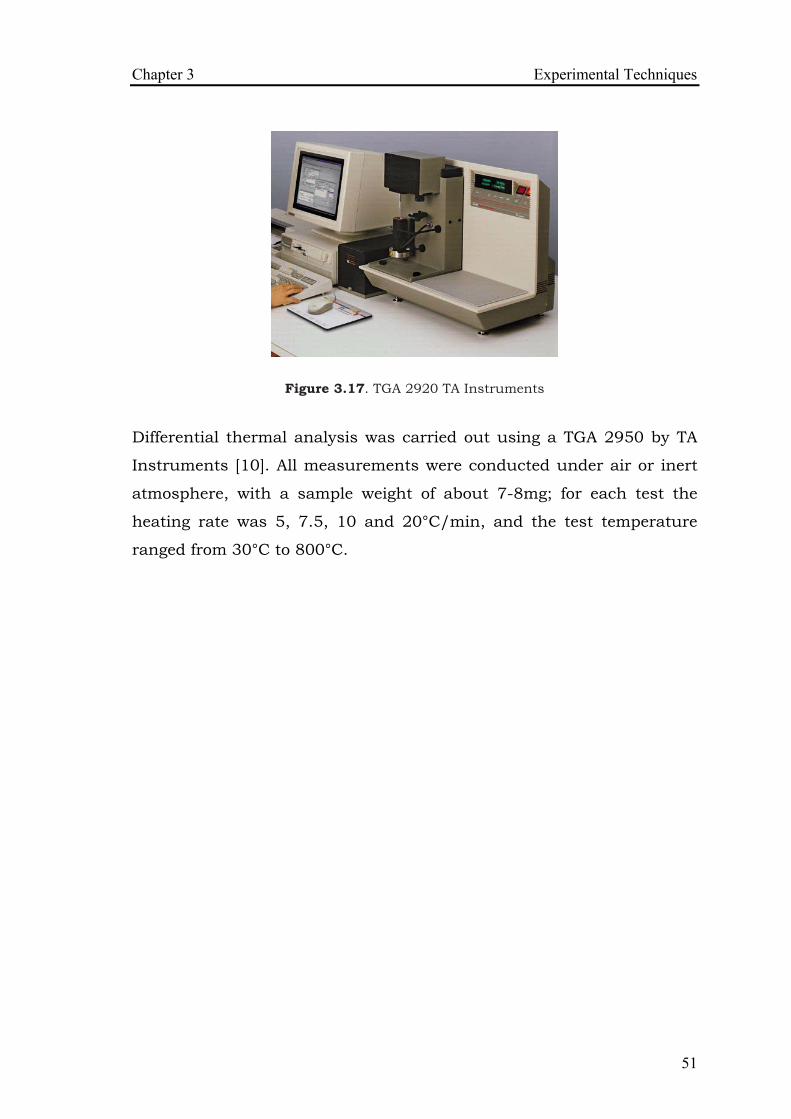
324 Thermal gravimetric analysis
Thermogravimetric analysis (TGA) (fig317) is an analytical technique
used to determine the thermal stability of a material and its fraction of
volatile components by monitoring the weight change that occurs when
a specimen is heated The measurement is normally carried out in air or
in an inert atmosphere and the weight loss is recorded as a function of
increasing temperature
Analysis of the TGA curves and DTG signals reports two temperature
bull The onset temperature (Tonset) calculated from the TGA curves by
extrapolating from the curve at the peak of degradation back to
the initial weight of the polymer
bull The temperature maximum (Tmax) calculated from the DTG curves
by extrapolating from the curve at the peak of degradation
forward to the final weight of the polymer
Chapter 3 Experimental Techniques
51
Figure 317 TGA 2920 TA Instruments
Differential thermal analysis was carried out using a TGA 2950 by TA
Instruments [10] All measurements were conducted under air or inert
atmosphere with a sample weight of about 7-8mg for each test the
heating rate was 5 75 10 and 20degCmin and the test temperature
ranged from 30degC to 800degC
Chapter 3 Experimental Techniques
52
References [1] wwwheidolphit
[2] Formicola C Martone A Zarrelli M Giordano M Dispersion of
carbon nanotubes in a monocomponent epoxy system 2008 proceeding
of AIDC workshop
[3] Schartel B Bartholmai M Knoll Some comments on the use of
cone calorimeter data Polym Degrad Stab 2005 (88)540ndash547
[4] Schartel B Hull TR Development of fire-retarded materials-
Interpretation of cone calorimeter data Fire and materials 2007
(31)327ndash354
[5] Fire Testing Technology Userrsquos Guide for the Cone Calorimeter
February 2000
[6] Grant GB Quick operation procedure for the cone calorimeter Unit
of fire safety engineering Edinburgh University 2nd edition January
1993
[7] Babrauskas V and Grayson SJ Heat Release in Fires Elsevier
Applied Science 1992
[8] Committee E0521 on Smoke Combustion Products ASTM 1354-03
Standard test methods for heat and visible smoke release for materials
and products using an oxygen consumption calorimeter ASTM 10
February 2003
[9] wwwshimadzuit
[10] wwwtainstrumentscom
CHAPTER 4 FLAME RETARDANT OF EPOXY RESIN WITH
INORGANIC COMPOUNDS
41 The state of the art on flame retardant of inorganic
compounds Flame retardants are chemical agents which are added to combustible
materials to make them more resistant to ignition and they are intended
to minimise the risk of a fire starting in case of contact with a small
heat source
Inorganic flame retardant as zinc borate aluminium trihydrate zinc
stannate and zinc hydroxystannate are used in this study because they
have shown very low toxicity they are compatible with a variety of flame
retardants while acting as smoke suppressants for various polymer
systems Synergistic effects are envisaged when these smoke
suppressants are combined with conventional flame retardants andor
nanoclays Recent studies to develop flame retardants formation have
used inorganic compounds because they have less toxicity Bourbigot et
al [1] demonstrated that zinc borates are useful synergistic agents in
Ethylene vinyl acetate EVA and aluminium trihydrate ATH and
magnesium hydroxide Mg(OH)2 formulations and that they act as smoke
suppressant Moreover they demonstrated that zinc borate develops a
vitreous protective residual layer which reduces the combustion rate
Carpentier et al [2] studied the synergistic effect of zinc borate on EVA8
filled with magnesium hydroxide (MH) by LOI cone calorimeter and
TGA Solid-state NMR was employed to study the carbon in the residues
collected after thermal treatment It is suggested that zinc borate slows
the degradation of the polymer and creates a vitreous protective
Chapter 4 Flame retardant of epoxy resin with inorganic compounds
54
residual layer which could act as a physical barrier and a glassy cage
for polyethylene chains
Wu et al [3] studied the synergistic flame retarding effect of ultrafine
zinc borate on LDPEIFR based on LOI UL94 test and cone calorimeter
and established that the flame retardancy is improved when
incorporating zinc borate to LDPEIFR system in fact HRR THR and
mass loss is reduced significantly
Petsom et al [4] described a study on zinc hydroxystannate and zinc
stannate in combination with 12 bis-tribromophenoxy ethane (BTBPE)
to increase flame retardancy and reduce smoke emission in an
acrylonitrile-butadiene-styrene (ABS) copolymer They concluded that
the combination of tin compounds and BTBPE was found more effective
as flame retardant than the individual components when used alone
Cusak et al [5] found that zinc hydroxystannate is a good synergist
alternative to antimony trioxide particularly with regard to reducing
heat release rates and smoke generation They demonstrated that ZHS
is the best alternative synergist to Sb2O3 in halogen-containing
polyester resins
Ning et al [6] studied the effects of zinc borate aluminium trihydrate
and their mixture on the flame retardant and smoke suppressant
properties of polyvinyl chloride PVC as well as their mechanism for
flame retardancy and smoke suppression They concluded that ZB and
ZB-ATH reduced the activation energy of PVC and their mixture had a
good synergistic effect on the flame retardance and smoke suppression
of PVC
Itrsquos clear that different authors [1-11] analyzed the fire and smoke
behaviour of zinc borate zinc stannate aluminium trihydrate zinc
hydroxystannate and their synergist effect in thermoplastic matrix or in
thermosetting bi-component matrix
Chapter 4 Flame retardant of epoxy resin with inorganic compounds
55
42 Cone calorimeter test Cone calorimeter represents a small-scale testing configuration which
provides important correlating parameters with real fire scenario data
obtained from cone calorimeter can provide plentiful information on fire
scenario material behaviour [12]
The values provided by cone calorimeter are mainly Time To Ignition
(TTI) which corresponds to the period that a combustible material can
withstand when exposure to a constant radiant heat flux before igniting
and undergoing sustained flaming combustion Heat Release Rate peak
(pHRR) average (HRRavarage) and Time To Peak (TTP) are a
quantitative measure of the amount of thermal energy released by a
material per unit area when exposed to a fire radiating at constant heat
flux (or temperature) Total Heat Evolved (THR) Total Smoke Released
(TSR)
Cone calorimeter tests were performed using a Fire Testing Technology
Ldt cone calorimeter according to the ASTM E1354-04 procedure
Samples with nominal dimensions of 100x100x7 mm were tested
horizontally under an incident flux of 50 kWm2 This level was chosen
as it corresponds to the evolved heat during a fire
421 Flame retardant of epoxy resin with inorganic compounds
The composite flame retardant were prepared by mixing the epoxy resin
RTM6 with zinc borate aluminium trihydrate zinc stannate and zinc
hydroxystannate at different percentage (5 wt 10 wt 20 wt 30
wt 40 wt) using a Heidolph RZR mechanical stirring equipment
(Chap 3)
Cone calorimeter data reported in tables 41 and 42 show that the
presence of zinc borate at 5 and 10 wt does not change substantially
the flame behaviour of the matrix as drawn by analysing the time to
ignition and heat release rate peak values Instead the presence of zinc
borate at 20 30 40 wt induces the flame retardant effect as
Chapter 4 Flame retardant of epoxy resin with inorganic compounds
56
supported by the recorded values of pHRR and HRR average The cone
calorimeter data reported in table 41 are averaged over two replicate
experiments
Samples
TTI
(s)
pHRR
(kWm2)
HRR
average
(kWm2)
TTP
(s)
THR
(MJm2)
TSR
(m2m2)
RTM6
neat 43 702 382 290 189 9260
RTM6+ZB
5wt 48 523 265 297 176 8282
RTM6+ZB
10wt 44 682 354 325 1842 8442
RTM6+ZB
20wt 49 428 251 455 188 9275
RTM6+ZB
30wt 47 396 193 65 186 10296
RTM6+ZB
40wt 63 315 148 82 161 7474
Table 41 Main cone calorimeter parameters evaluated for RTM6 epoxy with ZB at
different percentage
Samples ΔTTI
(s)
ΔpHRR
(kWm2)
FIP
(kWm2s)
FIGRA
(kWm2s) RTM6
neat _ _ 1632 242
RTM6+ZB
5wt 5 179 1079 175
RTM6+ZB
10wt 1 20 155 209
RTM6+ZB
20wt 6 274 861 094
RTM6+ZB
30wt 4 306 842 609
RTM6+ZB
40wt 20 387 5 384
Table 42 Parameters calculated by cone calorimeter data for RTM6 epoxy with ZB at
different percentage
Chapter 4 Flame retardant of epoxy resin with inorganic compounds
57
Where FPI and FIGRA are respectively pHRRTTI (kWm2s) and
pHRRTTP (kWm2s)
Decreasing values for the pHRR and HRR average may be correlated
with the formation of a char layer over the surface of tested sample
during the combustion process
A visual inspection of the final residual sample reports the presence of
the char layer (fig 41)
In figure 41 the HRR peak of RTM6ZB 10 wt system is higher than
corresponding peak for the ZB 5 wt system this curversquos behaviour
could be attributed to a local instability of the heat flux during the test
which lead to a wider cracked area and therefore a localised
combustion growth
Figure 41 HRR curves of RTM6ZB at different percentage
Whereas the aluminium trihydrate shows a negative effect as showed
by preliminary thermo-gravimetric analysis probably due an
acceleration of decomposition of the epoxy resin the presence of ATH
from 20 to 40 wt reduced the HRR peak and the HRR average (fig
42)
Chapter 4 Flame retardant of epoxy resin with inorganic compounds
58
In figure 42 the images of the residues of 30 and 40 wt RTM6-ATH
system with the whitish surface characteristic of the aluminium
trihydrate are reported
Figure 42 HRR curves of RTM6ATH at different percentage
The cone calorimeter data for ATH are reported in table 43 and FPI and
FIGRA in table 44 and are averaged over two replicate experiments
Chapter 4 Flame retardant of epoxy resin with inorganic compounds
59
Samples
TTI
(s)
pHRR
(kWm2)
HRR
average
(kWm2)
TTP
(s)
THR
(MJm2)
TSR
(m2m2)
RTM6 neat 43 702 382 290 189 9260
RTM6+ATH
5 33 815 413 220 126 5099
RTM6+ATH
10 51 728 383 210 126 5246
RTM6+ATH
20 52 510 368 340 199 9109
RTM6+ATH
30 64 468 324 232 174 7648
RTM6+ATH
40 93 453 193 110 172 8238
Table 43 Main cone calorimeter parameters evaluated for RTM6 epoxy with ATH at
different percentage
Samples ΔTTI
(s)
ΔpHRR
(kWm2)
FIP
(kWm2s)
FIGRA
(kWm2s) RTM6 neat _ _ 1632 242
RTM6+ATH
5 -10 -113 247 370
RTM6+ATH
10 8 -26 1427 346
RTM6+ATH
20 9 192 98 15
RTM6+ATH
30 21 234 731 201
RTM6+ATH
40 50 249 487 411
Table 44 Parameters calculated by cone calorimeter data for RTM6 epoxy with ZB at
different percentage
Where FPI and FIGRA are respectively pHRRTTI (kWm2s) and
pHRRTTP (kWm2s)
Chapter 4 Flame retardant of epoxy resin with inorganic compounds
60
Zinc hydroxystannate and zinc stannate such as zinc borate and
aluminium trihydrate reduced HRR peak and HRR average with the
presence of ZS and ZHS of 30 and 40 wt ZS and ZHS werenrsquot
prepared at 5 wt percentage because previously test on zinc borate
and aluminium trihydrate have failed the cone calorimeter tests
Cone calorimeter data are reported in table 45 for ZHS and in table 47
for ZS
In figure 43 HRR curves of ZHS at different percentage are reported
and the residual image shows a densified structure (char) that forms a
barrier to inhibit combustible gases
Figure 43 HRR curves of RTM6ZHS at different percentage
Chapter 4 Flame retardant of epoxy resin with inorganic compounds
61
Samples
TTI
(s)
pHRR
(kWm2)
HRR
average
(kWm2)
TTP
(s)
THR
(MJm2)
TSR
(m2m2)
RTM6 neat 43 702 382 290 189 9260
RTM6+ZHS
10 44 469 203 255 202 9070
RTM6+ZHS
20 43 465 286 417 194 7092
RTM6+ZHS
30 52 379 192 70 153 6726
RTM6+ZHS
40 51 329 214 75 153 72
Table 45 Main cone calorimeter parameters evaluated for RTM6 epoxy with ZHS at
different percentage
Samples ΔTTI
(s)
ΔpHRR
(kWm2)
FIP
(kWm2s)
FIGRA
(kWm2s)
RTM6 neat _ _ 1632 242
RTM6+ZHS
10 1 233 1065 184
RTM6+ZHS
20 0 237 1082 111
RTM6+ZHS
30 9 323 728 541
RTM6+ZHS
40 8 373 645 438
Table 46 Parameters calculated by cone calorimeter data for RTM6 epoxy with ZHS
at different percentage
Instead in the residual image of ZS (fig 44) a crack on the surface is
observed probably due to a local instability of the heat flux during the
test which lead to a wider cracked area and therefore a localised
combustion growth such as zinc borate
Chapter 4 Flame retardant of epoxy resin with inorganic compounds
62
Figure 44 HRR curves of RTM6ZS at different percentage
Samples
TTI
(s)
pHRR
(kWm2)
HRR
average
(kWm2)
TTP
(s)
THR
(MJm2)
TSR
(m2m2)
RTM6 neat 43 702 382 290 189 9260
RTM6+ZS
10 45 583 313 260 176 7505
RTM6+ZS
20 46 803 336 475 200 6747
RTM6+ZS
30 43 551 274 262 152 6509
RTM6+ZS
40 45 470 293 282 163 7096
Table 47 Main cone calorimeter parameters evaluated for RTM6 epoxy with ZS at
different percentage
Chapter 4 Flame retardant of epoxy resin with inorganic compounds
63
Samples ΔTTI
(s)
ΔpHRR
(kWm2)
FIP
(kWm2s)
FIGRA
(kWm2s)
RTM6 neat _ _ 1632 242
RTM6+ZS
10 2 119 1295 224
RTM6+ZS
20 3 -101 1745 169
RTM6+ZS
30 0 151 1281 210
RTM6+ZS
40 2 232 1044 166
Table 48 Parameters calculated by cone calorimeter data for RTM6 epoxy with ZS at
different percentage
In conclusion the effect of all additives on the HRR peak value of epoxy
resin RTM6 is considerable for percentages of 30 and 40 wt In
particular the best result has been achieved with zinc borate 40 wt
and the heat release rate peak enhancement was 55
422 Synergistic effect of zinc borate with aluminium trihydrate
The synergy between the zinc borate and aluminium trihydrate was
investigated on four different percentages (10 20 30 and 40 wt ) of
additives into neat system considering the total amount split between
zinc borate and aluminium trihydrate according to the ratio 11
In order to study the synergistic effects of zinc borate with aluminium
trihydrate samples of composite of RTM6 and ZBATH dispersed at
total percentage of 20 wt were mapped by SEM The presence of ZB
and ATH within the same area of the sample lead to the reasonable
conclusion that an interaction between the two additives is taking place
(fig 45)
Chapter 4 Flame retardant of epoxy resin with inorganic compounds
64
Figure 45 Mapping of ZBATH sample dispersed into the epoxy resin
Preliminary thermogravimetric analysis shows that the synergic effect
due to the presence of both ZB and ATH is highlighted by the value of
onset temperature which decreases to about 355degC for the higher
concentrations Theoretical (calculation) and experimental TG-DTG
curves have been superimposed in figures 46 and 47 for the 30 wt
similar results were also obtained for the 40 wt mixture It results
that the addition of ZB and ATH synergistically drives the degradation
behaviour of neat matrix system as showed by the remarkable shifting
of the experimental curve toward higher onset temperature compared
with the calculated one
Chapter 4 Flame retardant of epoxy resin with inorganic compounds
65
0
20
40
60
80
100
120
0 100 200 300 400 500 600 700 800
RTM6+ATH+ZB 30 ExperimentRTM6RTM6+ATH+ZB 30 Calculation
Wei
ght (
)
Temperature (degC)
Figure 46 Experimental and calculated TGA curves for RTM6ATHZB 30 wt system
-02
0
02
04
06
08
1
12
0 100 200 300 400 500 600 700 800
RTM6RTM6+ATH+ZB 30 ExperimentRTM6+ATH+ZB 30 Calculation
Der
iv W
eigh
t (
degC
)
Temperature (degC)
Figure 47 Experimental and calculated DTG curves for RTM6ATHZB 30 wt system
Cone calorimeter data of synergic effect of zinc borate is reported in
tables 49 and 410
Chapter 4 Flame retardant of epoxy resin with inorganic compounds
66
Samples
TTI
(s)
pHRR
(kWm2)
HRR
average
(kWm2)
TTP
(s)
THR
(MJm2)
TSR
(m2m2)
RTM6 neat 43 702 382 290 189 9260
RTM6+ZB+ATH
10 52 679 285 200 122 5702
RTM6+ZB+ATH
20 52 468 337 140 195 10086
RTM6+ZB+ATH
30 55 431 249 95 174 8966
RTM6+ZB+ATH
40 87 437 74 100 173 7184
Table 49 Main cone calorimeter parameters evaluated for RTM6ZBATH system at
different percentage
Samples ΔTTI
(s)
ΔpHRR
(kWm2)
FIP
(kWm2s)
FIGRA
(kWm2s)
RTM6 neat _ _ 1632 242
RTM6+ZB+ATH
10 9 23 1305 34
RTM6+ZB+ATH
20 9 234 917 334
RTM6+ZB+ATH
30 12 271 783 453
RTM6+ZB+ATH
40 44 265 502 437
Table 410 Parameters calculated by cone calorimeter data for RTM6ZBATH
system at different percentage
The synergy of zinc borate is effective above content of 20 wt in fact
the heat release rate average undergoes a significant decrease by 382
kWm2 for epoxy resin to 249 kWm2 for system ZBATH 30 wt and
74 kWm2 for ZBATH 40 wt (fig 48) Comparing the ΔTTI and the
Chapter 4 Flame retardant of epoxy resin with inorganic compounds
67
HRR average values for RTM6ZB 20 wt RTM6ATH 20 wt and
RTM6ZBATH system at 40 wt the effect synergic of zinc borate and
aluminium trihydrate improves significantly the flame retardancy
respectively from 6 to 44 sec for TTI and from 251 kWm2 to 74 kWm2
for HRR compared
Figure 48 HRR curves of RTM6ZBATH system at different percentage
423 Scanning electron micrograph of residual
The scanning electron micrographs of dust cryogenically fractured
composite samples and their residuals were taken by a 1450VP LEO
The analyses made with the electronic scanning microscope were made
to observe the morphology of the material both before and after the
combustion process occurred in the cone calorimeter
We used two different methodologies one for observing the morphology
of the material (ion secondary SE1) and the other for the phase
difference (ions scatter QBSD) and the EDS analysis was also carried
out to view the compounds contained in the sample examined
Chapter 4 Flame retardant of epoxy resin with inorganic compounds
68
Analysis of SEM micrographs on residual of system of epoxy resin zinc
borate and aluminium trihydrate indicates that char topography varies
from a compact like-amalgam structure for the RTM6+ZB (fig49-411)
to a granular porous-like structure characterized by very small particles
of degraded resin and additive for the ATH mixture (fig412-414)
Reported SEM image are taken for the 20 wt content system as this
percentage represents the first useful composition to observe a delayed
effect of flame retardancy
Figure 49 and 410 Scanning electron micrograph of residual of RTM6ZB system
Figure 411 Scanning electron micrograph (SE1 and QBSD) and EDS of residual of
RTM6ZB system
Chapter 4 Flame retardant of epoxy resin with inorganic compounds
69
Figure 412 and 413 Scanning electron micrograph of residual of RTM6ZB system
Figure 414 Scanning electron micrograph (SE1 and QBSD) and EDS of residual of
RTM6ZB system
In figure 415 the scanning electron micrograph of residual samples of
RTM6ZBATH system is reported and the formation of char layer on
the surface due to zinc borate that reduces the HRR peak and average
of the burning surface is observe
Scanning electron micrographs indicate that the synergistic flame
retardant effects of these additives result from the excellent quality of
char that can better endure the oxidation of high temperatures slowing
at same time the degradation of epoxy resin
Chapter 4 Flame retardant of epoxy resin with inorganic compounds
70
Figure 415 Scanning electron micrograph and EDS of residual of RTM6ZBATH
system
424 Flame retardant of panels of RTM6 and inorganic compounds
The composites were prepared by mixing the epoxy resin RTM6 with all
additives at percentage of 30 wt and then the mixture was degassed
for 30 minutes at 90degC in a vacuum oven to eliminate entrapped air and
humidity Afterwards the mixture was injected in the preform of
20x20cm by vacuum infusion process
Flame retardants of panels of RTM6 and inorganic compounds were
investigated by cone calorimeter under an incident flux of 35 kWm2 in
according to the ASTM E1354-04 procedure for samples with thickness
less than 3mm Samples have dimensions of 100x100mm with
thickness of about 3mm because they were manufactured with 8 plies
of carbon fibres overlaid unidirectional at zero degree with thickness of
03mm each one
Cone calorimeter data show how the best results for the flame retardant
properties is at percentage of 40 wt but rheology test prepared at 5
degCmin demonstrates high viscosity for this percentage and hence
there are troubles during infusion For this reason the panels were
manufactured with percentage additives of 30 wt (fig 416)
Chapter 4 Flame retardant of epoxy resin with inorganic compounds
71
Figures 416 Rheology test viscosity vs time of RTM6 neat (green) RTM6ZB 30 wt
(blue) and RTM6ZB 40 wt (red)
In figure 417 are reported HRR curves of panels of RTM6 with carbon
fibres and all additives at percentage of 30 wt
0 100 200 300 4000
200
400
HR
R [k
Wm
2 ]
Time [s]
RTM6+CF RTM6+CF+ZB 30wt RTM6+CF+ATH 30wt RTM6+CF+ZHS 30wt RTM6+CF+ZS 30wt
Figure 417 HRR curves of RTM6CFAdditives system at percentage of 30 wt
Chapter 4 Flame retardant of epoxy resin with inorganic compounds
72
In the figure it is shown that zinc borate retarded the time to ignition
and reduced heat release rate respect to epoxy resin with carbon fibres
as is reported in table 411
Samples
TTI
(s)
pHRR
(kWm2)
HRR
average
(kWm2)
TTP
(s)
THR
(MJm2)
TSR
(m2m2)
RTM6+CF 91 301 119 124 20 1009
RTM6+CF+ZB
30 106 284 132 134 12 612
RTM6+CF+ATH
30 90 303 121 122 21 969
RTM6+CF+ZHS
30 81 344 139 110 18 876
RTM6+CF+ZS
30 73 278 114 114 16 766
Table 411 Main cone calorimeter parameters evaluated for RTM6Carbon
FibersAdditives system at percentage of 30 wt
Samples ΔTTI
(s)
ΔpHRR
(kWm2)
FIP
(kWm2s)
FIGRA
(kWm2s)
RTM6 neat _ _ 33 24
RTM6+CF+ZB
30 15 17 27 21
RTM6+CF+ATH
30 -1 -2 34 25
RTM6+CF+ZHS
30 -10 -43 42 32
RTM6+CF+ZS
40 -18 23 38 24
Table 412 Parameters calculated by cone calorimeter data for RTM6Carbon
FibersAdditives system at percentage of 30 wt
Chapter 4 Flame retardant of epoxy resin with inorganic compounds
73
In the table itrsquos shown clearly that the panels with zinc borate
augmented the flame retardant properties of RTM6 and carbon fibers in
fact increased the TTI reduced significantly the TSR and reduced FIP
and FIGRA (table 412)
The synergistic effect of zinc borate with aluminium trihydrate on
panels of RTM6 and carbon fibers is shown in figure 418
0 100 200 300 4000
200
400
HR
R [k
Wm
2 ]
Time [s]
RTM6+CF RTM6+CF+ZB 30wt RTM6+CF+ATH 30wt RTM6+CF+ZB+ATH 30wt
Figure 418 HRR curves of RTM6CFZBATH system
In this case itrsquos shown that the synergistic effect of zinc borate didnrsquot
produce any improvement on the flame retardant properties of RTM6
and Carbon Fibers as is reported in tables 413 and 414
Zinc borate from chemical in the combustion phase is able to slow
down the effect of carbon fibres because the zinc borate creates a layer
of char on the surface of sample more compact than was in the
presence of ZB with ATH
Chapter 4 Flame retardant of epoxy resin with inorganic compounds
74
Samples
TTI
(s)
pHRR
(kWm2)
HRR
average
(kWm2)
TTP
(s)
THR
(MJm2)
TSR
(m2m2)
RTM6+CF 91 301 119 124 20 1009
RTM6+CF+ZB 30 106 284 132 134 12 612
RTM6+CF+ATH
30 90 303 121 122 21 969
RTM6+CF+ZB+ATH
30 79 311 126 104 17 788
Table 413 Main cone calorimeter parameters evaluated for RTM6Carbon
FibersZBATH system at percentage of 30 wt
Samples ΔTTI
(s)
ΔpHRR
(kWm2)
FIP
(kWm2s)
FIGRA
(kWm2s) RTM6 neat _ _ 33 24
RTM6+CF+ZB 30 15 17 27 21
RTM6+CF+ATH
30 -1 -2 34 25
RTM6+CF+ZB+ATH
30 -12 -10 38 29
Table 414 Parameters calculated by cone calorimeter data for RTM6Carbon
FibersZBATH system at percentage of 30 wt
Chapter 4 Flame retardant of epoxy resin with inorganic compounds
75
43 Thermal mechanical analysis of RTM6 and inorganic
compounds The coefficient of thermal expansion is calculated by thermal
mechanical analysis as reported in Chapter 3
Each result reported in this chapter is averaged over three replicate
experiments The thermal mechanical analysis was conducted on the
samples additived at 30wt because this percentage is resulted good by
cone calorimeter test and principally to have a comparison with the
panels that are produced at this percentage
In figure 419 is reported the CTE of RTM6 neat and it is shown clearly
that there are two values of CTE in the first heating ramp and many
CTErsquos value in the second heating ramp
000 10000 20000Time [min]
145000
146000
147000
148000x10
1um
TMA
-002
-001
000
001
002
NLOAD
10000
20000
CTemp
19613C
5600C
16757C
6207x10-6
K
21589C
24557C
13770x10-6
K
7768C
16433C
6748x10-6
K
21168C
24930C
16647x10-6
K
RTM6 NEAT
Figure 419 CTE of epoxy resin RTM6 neat
Instead in the samples of RTM6 and additives the value of CTE in the
second heating ramp is only one and it is observed that the value of
CTE of RTM6additives system is more less than the CTE of RTM6 neat
Chapter 4 Flame retardant of epoxy resin with inorganic compounds
76
hence the influence of additives on the thermal mechanical properties of
matrix is clear
000 5000 10000 15000Time [min]
117000
117500
118000
x101
umTMA
-002
-001
000
001
002
NLOAD
5000
10000
15000
20000
CTemp
8451 C
18561 C
6615 x10-6
5238 C
15885 C
5781 x10-6
K
17844 C
18051 C
19565 C
12254 x10-6
K
RTM6+ZB 30 wt
Figure 420 CTE of epoxy resin RTM6+ZB 30wt
000 5000 10000 15000Time [min]
155000
155500
156000
156500x10
1um
TMA
-002
-001
000
001
002
NLOAD
5000
10000
15000
20000
CTemp
17557C
5017C
13426C
6051x10-6
K
18608C
19618C
9987x10-6
K
7391C
19130C
6231x10-6
K
RTM6+ATH 30wt
Figure 421 CTE of epoxy resin RTM6+ATH 30wt
Chapter 4 Flame retardant of epoxy resin with inorganic compounds
77
To observe the synergistic effect of zinc borate is calculated the CTE of
RTM6ZBATH 30wt system and the results are reported in table
415
000 5000 10000 15000Time [min]
121000
121500
122000
x101
umTMA
-002
-001
000
001
002
NLOAD
5000
10000
15000
20000
CTemp
4876C
12672C
6051x10-6
K7127C
19539C
6471x10-6K
15421C
17853C
12050x10-6K
RTM6+ZB+ATH 30wt
Figure 422 CTE of epoxy resin RTM6+ATH+ZB 30wt
Coefficient of Thermal Expansion (10-6K)
Samples I Heating ramp II Heating ramp
RTM6 neat 606 1329 678 1657
RTM6+ZB 30wt 595 1767 656 -
RTM6+ATH 30wt 605 1149 612 -
RTM6+ATH+ZB 30wt 612 1157 671 -
Table 415 CTE of synergistic effect of zinc borate
Instead in the graph of TMA of ZS and ZHS there are two values in the
second heating ramp and rather than as a ZB and ATH This confirms
as previously seen from the cone that the protective structure that is
created is different because chemically boron and aluminium will
Chapter 4 Flame retardant of epoxy resin with inorganic compounds
78
oxidize more easily creating alumina and boron oxide (ceramic) hence
tighten the structure
000 10000 20000Time [min]
150000
151000
x101
umTMA
-002
-001
000
001
002
NLOAD
10000
20000
CTemp
7767C
17204C
5787x10-6K
21699C
24925C
12096x10-6
K
19957C
4559C
13757C
6488x10-6
K
18170C
24788C
6759x10-6
K
RTM6+ZS 30wt
Figure 423 CTE of epoxy resin RTM6+ZS 30wt
000 10000 20000Time [min]
165000
166000
167000
168000
x101
umTMA
-002
-001
000
001
002
NLOAD
10000
20000
CTemp
6060C
15393C
6330x10-6
K
20830C
23721C
29456x10-6
K
20725C
7879C
15387C
6242x10-6
K
22040C
24930C
12702x10-6
K
RTM6+ZHS 30wt
Figure 424 CTE of epoxy resin RTM6+ZHS 30wt
In conclusion the values of coefficient of thermal expansion for both
heating ramp are reported in table 416
Chapter 4 Flame retardant of epoxy resin with inorganic compounds
79
Coefficient of Thermal Expansion (10-6K)
Samples I Heating ramp II Heating ramp
RTM6 neat 606 1329 678 1657
RTM6+ZB 30wt 595 2038 656 -
RTM6+ATH 30wt 605 1149 612 -
RTM6+ATH+ZB 30wt 612 1157 671 -
RTM6+ZS 30wt 636 7040 574 1276
RTM6+ZHS 30wt 621 2898 617 1268
Table 416 CTE of all samples of RTM6 and additives
In table 416 the values of CTE for all additives are reported and it is
clearly observed that the influence of additives on the matrix is able to
lower the CTE of epoxy resin neat
Furthermore it is shown the thermal mechanical analysis of panels of
epoxy resin with additives produced by VIP with carbon fibres The
samples were cut to 90 degrees in the transverse direction fibres to
observe the effect of carbon fibres and additives on the properties of
thermal mechanical of matrix
In the figures below the values of CTE of epoxy resin RTM6 with carbon
fibres and all additives are illustrated and it is shown that the values of
CTE are always lower than the CTE of single resin with fibres This
results are reported in the table 417
Chapter 4 Flame retardant of epoxy resin with inorganic compounds
80
000 10000 20000Time [min]
177500
178000
178500
x101
umTMA
-002
-001
000
001
002
NLOAD
10000
20000
CTemp
5090C
16755C
3325x10-6
K
22481C22314C
25029C
3085x10-6
K
17544C
7034C
15384C
3377x10-6
K
19683C
24476C
4543x10-6K
RTM6+CF
Figure 425 CTE of epoxy resin RTM6+CF
000 10000 20000Time [min]
138500
139000
139500
x101
umTMA
-002
-001
000
001
002
NLOAD
10000
20000
CTemp
5309C
15389C
2840x10-6K
21889C
24945C
2723x10-6
K
21278C
7875C
14546C
3036x10-6
K
18119C
19872C
24356C
3873x10-6
K
RTM6+CF+ZB 30 wt
Figure 426 CTE of epoxy resin RTM6+CF+ZB 30wt
Chapter 4 Flame retardant of epoxy resin with inorganic compounds
81
000 10000 20000Time [min]
162000
162500
163000
x101
umTMA
-002
-001
000
001
002
NLOAD
10000
20000
CTemp
22411C
5525C
16456C
3264x10-6
K
23409C24942C
2832x10-6K
17556C
7234C
14428C
3385x10-6K
20098C
24285C
3699x10-6
K
RTM6+CF+ATH 30 wt
Figure 427 CTE of epoxy resin RTM6+CF+ATH 30wt
000 10000 20000Time [min]
165500
166000
166500
x101
umTMA
-002
-001
000
001
002
NLOAD
10000
20000
CTemp
22639C
4575C
15467C
3111x10-6K
22316C
25085C
4058x10-6K
7993C
14547C
3240x10-6
K
17252C19766C
24360C
4942x10-6K
RTM6+CF+ATH+ZB 30 wt
Figure 428 CTE of epoxy resin RTM6+CF+ATH+ZB 30wt
Chapter 4 Flame retardant of epoxy resin with inorganic compounds
82
000 10000 20000Time [min]
155500
156000
x101
umTMA
-002
-001
000
001
002
NLOAD
10000
20000
CTemp
22262C
5082C
16873C
2888x10-6
K
22845C
25089C
3534x10-6
K
15935C
7235C
14962C
3211x10-6
K
18924C
23941C
4176x10-6
K
RTM6+ZS 30wt
Figure 429 CTE of epoxy resin RTM6+CF+ZS 30wt
000 10000 20000Time [min]
174000
174500
x101
umTMA
-002
-001
000
001
002
NLOAD
10000
20000
CTemp
24089C
5721C
18578C
2851x10-6
K
23944C25021C
2451x10-6K
16347C
6501C
14321C
3085x10-6
K
19681C
24287C
3625x10-6K
RTM6+ZHS 30wt
Figure 430 CTE of epoxy resin RTM6+CF+ZHS 30wt
Chapter 4 Flame retardant of epoxy resin with inorganic compounds
83
Coefficient of Thermal Expansion (10-6K)
Samples I Heating ramp II Heating ramp
RTM6+CF 332 319 346 452
RTM6+CF+ZB 30wt 265 317 311 386
RTM6+CF+ATH 30wt 326 306 339 389
RTM6+CF+ATH+ZB 30wt 292 299 306 398
RTM6+CF+ZS 30wt 296 318 318 378
RTM6+CF+ZHS 30wt 276 364 318 406
Table 417 CTE of all samples of RTM6+CF and all additives
In the table the thermal mechanical data of panels are reported and it is
shown that the carbon fibers and the additives reduced the CTE hence
increase the thermal mechanical properties of epoxy resin RTM6
Chapter 4 Flame retardant of epoxy resin with inorganic compounds
84
References [1] Bourbigot S Le Bras M Leeuwendal R Shen KK Schubert D
Polym Degrad Stab 1999 (64)419-425
[2] Carpentier F Bourbigot S Le Bras M Delobel R Foulon M Polym
Degrad Stab 2000 69 1 83-92
[3] Wu Z Shu W Hu Y Journal of Applied Polymer Science 2007
1033667-3674
[4] Petsom A Roengsumran S Ariyaphattanakul A Sangvanich P
Polym Degrad Stab 2003(80)17-22
[5] Cusack PA Heer MS Monk AW Polymer Degradation and Stability
1997 (58)229-237
[6] Ning Y Guo S J of App Pol Sc 2000 77 3119-3127
[7] Wu S Cong P Yu J Luo X Mo L Fuel 2006 85 1298-1304
[8] Bourbigot S Le Bras M Duquesne S Rochery M Macromol Mater
Eng 2004 289 499-511
[9] Le Bras M Bourbigot S Duquesne S Jama C Wilkie CA Royal
Society of Chemistry Press Cambridge 2005
[10] Genovese A Shanks RA Polym Degrad Stab 2007 92 2-13
[11] Samyn F Bourbigot S Duquesne S Delobel R Thermochimica
2007 456 134-144
[12] Schartel B Hull TR Fire and Materials 2007 31 327-354
CHAPTER 5 FLAME RETARDANT OF EPOXY RESIN WITH
CARBON NANOTUBES
51 The state of the art on flame retardant of carbon
nanotubes Fire retardancy is one of the fields where the nanomaterials could be
used successfully Nanoparticles embedded in various polymer matrices
are reported to reduce considerably the heat released from these
materials [1] The investigation of size shape interfaces and
concentration of nanoscale silica nano-flakes nanotubes and other
nanoparticles on the flame retardant performance increased the role of
fire protected polymers within the science of materials There is a high
level of interest in using filler particles having at least one nano-
dimensional scale for making polymeric nanocomposite materials with
exceptional properties One of the promising applications involves the
improvement in flammability properties of polymers with nanofillers
because one weak aspect of polymers is that they are combustible
under certain conditions These filled systems are attractive as possible
alternatives to conventional flame retardants and furthermore they
could simultaneously improve both physical and flammability
properties of polymers [2]
Carbon nanotubes are candidates as flame retardant additives because
of their highly elongated shape (high aspect ratio)
In literature [2-6] different authors analyzed the fire behaviours of
carbon nanotubes in several matrices
Kashiwagi et al [2-4] found that nanocomposites based on carbon
nanotubes are likewise capable of forming a continuous structured
network as a protective layer without the formation of cracks that
compromise the flame-retardant effectiveness This resulted in a
Chapter 5 Flame retardant of epoxy resin with carbon nanotubes
86
significant reduction in the heat release rate (a flammability measure
related to the fire intensity) with a carbon nanotube mass concentration
as low as 05 This protective layer consisted mainly of carbon
nanotubes and it seemed to act as a heat shield for the virgin polymer
below the layer Poorly dispersed carbon nanotubes resulted in the
formation of a discontinuous layer consisting of fragmented islands
rather than the continuous protective network layer Very low
concentrations of the tubes yielded the same fragmented island
structures as found in the clay nanocomposite measurements The
flame retardant performance of the nanocomposites containing the
island structure was much poorer than that of the nanocomposites
forming a continuous protective network layer Thus the formation of
the network structured protective layer during burning without any
openings or cracks seems to be crucial for the large reduction in heat
release rate Furthermore Kashiwagi et al [5] suggested that this
network is formed in the original sample under appropriate fabrication
conditions and that this structure provides the main source of the
protective layer that is formed during the burning process This
hypothesis was systematically tested with various sizes and
concentrations of carbon-based nanoparticles in a PMMA matrix
Cipiriano et al [6] studied the effects of the aspect ratio of multi-walled
carbon nanotubes (MWNTs) on the rheology and flammability of
polystyreneMWNT nanocomposites using two MWNTs having average
aspect ratios (length to outer diameter) of 49 and 150 In flammability
experiments they demonstrated that the larger aspect ratio particles
lead to a greater reduction in mass loss rate hence they are more
effective in reducing flammability
Chapter 5 Flame retardant of epoxy resin with carbon nanotubes
87
52 Cone calorimeter test Cone calorimeter tests were performed using a Fire Testing Technology
Ldt cone calorimeter according to the ASTM E1354-04 procedure
Samples with nominal dimensions of 100x100x3 mm were tested
horizontally under an incident flux of 35 kWm2 This level was chosen
as it corresponds to the evolved heat during a fire for samples with
thickness less than 3mm
521 Flame retardant of RTM6 and MWNT Nanocyl 7000
The nanocomposites of epoxy resin and multi walled carbon nanotubes
were prepared by sonication process as is reported in the Chapter 3
0 100 200 300 4000
600
1200
1800
2400
3000
HR
R [k
Wm
2 ]
Time [s]
RTM6 RTM6+MWNT 01wt
Figure 51 HRR curves of RTM6MWNT at percentage of 01wt
Samples
TTI
(s)
pHRR
(kWm2)
HRR
average
(kWm2)
TTP
(s)
THR
(MJm2)
TSR
(m2m2)
RTM6 neat 35 1479 614 156 117 4688
RTM6+MWNT
01wt 72 1651 643 136 108 3863
Table 51 Parameters calculated by cone calorimeter data for RTM6MWNT 01wt
Chapter 5 Flame retardant of epoxy resin with carbon nanotubes
88
In figure 51 it is shown that the carbon nanotubes donrsquot influence the
properties of flame retardants of matrices because the percentage used
in this work is low A small effect is shown only for the value of TTI as
reported in table 51
523 Flame retardant of panels of RTM6 and carbon nanotubes
The nanocomposites were prepared by sonication process (Chap3) the
epoxy resin RTM6 with multi walled carbon nanotubes at percentage of
01 wt and then the mixture was degassed for 30 minutes at 90degC in a
vacuum oven to eliminate entrapped air and humidity Afterwards the
mixture was injected in the preform of 20x20cm by vacuum infusion
process Samples were manufactured with 8 plies of overlaid
unidirectional carbon fibres at zero degrees with thickness of 03mm
each one
0 100 200 300 4000
200
400
600
800
HR
R [k
Wm
2 ]
Time [s]
RTM6+CF RTM6+CF+MWNT 01wt
Figure 52 HRR curves of RTM6CFMWNT 01wt
Chapter 5 Flame retardant of epoxy resin with carbon nanotubes
89
Samples
TTI
(s)
pHRR
(kWm2)
HRR
average
(kWm2)
TTP
(s)
THR
(MJm2)
TSR
(m2m2)
RTM6+CF 91 301 118 124 20 1009
RTM6+CF+MWNT
01wt 88 306 129 124 21 1077
Table 52 Parameters calculated by cone calorimeter data for RTM6CFMWNT
system at percentage of 01wt
As seen above the percentage of nanotubes is not effective and the
presence of unidirectional fibres does not induce changes sensitive to
the distribution of flame
53 Thermal mechanical analysis of RTM6 and carbon
nanotubes The thermal mechanical analysis was conducted on both samples of
RTM6 and additives on panels with carbon fibres
000 10000 20000Time [min]
145000
146000
147000
148000x10
1um
TMA
-002
-001
000
001
002
NLOAD
10000
20000
CTemp
19613C
5600C
16757C
6207x10-6
K
21589C
24557C
13770x10-6
K
7768C
16433C
6748x10-6K
21168C
24930C
16647x10-6
RTM6 NEAT
Figure 53 CTE of epoxy resin RTM6 neat
Chapter 5 Flame retardant of epoxy resin with carbon nanotubes
90
000 10000 20000Time [min]
140000
141000
142000
x101
umTMA
-002
-001
000
001
002
NLOAD
10000
20000
CTemp
20956C
4487C
16322C
6518x10-6K
21697C
25089C
13872x10-6
K
7339C
16669C
6897x10-6
K
20631C
21697C
24929C
17239x10-6K
RTM6+MWNT 01wt
Figure 54 CTE of epoxy resin RTM6+MWNT 01wt
Coefficient of Thermal Expansion (10-6K)
Samples I Heating ramp II Heating ramp
RTM6 neat 606 1329 678 1657
RTM6+MWNT 01wt 622 1374 688 1702
Table 53 CTE of RTM6 and MWNT 01wt
In the figures 53 and 54 and in the table 53 the CTE for panels of
epoxy resin additived with carbon nanotubes are shown where the
percentage of multi walled carbon nanotubes is too low to make an
improvement on the value of CTE of RTM6 and carbon fibres
Chapter 5 Flame retardant of epoxy resin with carbon nanotubes
91
000 10000 20000Time [min]
177500
178000
178500
x101
umTMA
-002
-001
000
001
002
NLOAD
10000
20000
CTemp
5090C
16755C
3325x10-6
K
22481C22314C
25029C
3085x10-6
K
17544C
7034C
15384C
3377x10-6
K
19683C
24476C
4543x10-6K
RTM6+CF
Figure 55 CTE of epoxy resin RTM6+CF
000 10000 20000Time [min]
153500
154000
154500
x101
umTMA
-002
-001
000
001
002
NLOAD
10000
20000
CTemp
6828C
19462C
3758x10-6
K
22996C25074C
5327x10-6K
8314C
14215C
3810x10-6
K
19996C
24591C
5725x10-6K
RTM6+CF+MWNT 01wt
Figure 56 CTE of epoxy resin RTM6+CF+MWNT 01wt
Chapter 5 Flame retardant of epoxy resin with carbon nanotubes
92
Coefficient of Thermal Expansion (10-6K)
Samples I Heating ramp II Heating ramp
RTM6+CF 332 319 346 452
RTM6+CF+MWNT
01wt 367 577 383 553
Table 54 CTE of RTM6+CF+MWNT 01wt system
Similar values are obtained for the sample with carbon fibres and
carbon nanotubes in fact in table 54 it is shown clearly that both
nanotubes and fibers donrsquot influence CTE of RTM6CF system
Chapter 5 Flame retardant of epoxy resin with carbon nanotubes
93
References [1] Marosfoi B Matko Sz Marosi PAnnaGy Current Applied Physics
2006 (6)259-261
[2] Kashiwagi T Du F Winey KI Groth KM Shields JR Bellayer SP
Kim H Douglas JF Polymer 2005 (46)471-481
[3] Kashiwagi T Grulke E Hilding J Groth K Harris R Butler K
Shields J Kharchenko S Douglas J Polymer 2004 (45) 4227-4239
[4] Kashiwagi et al Macromol Rapid Commun 2002 (23) 761-765
[5] Kashiwagi T Du F Douglas JF Winey KI Harris RHJr Shields
JR Nature materials 2005 (4) 5-10
[6] Cipiriano BH Kashiwagi T Raghavan SR Yang Y Grulke EA
Yamamoto K Shields JR Douglas JF Polymer 2007 486086-6096
[7] Qian D Dickey EC Andrews R Rantell T Appl Phys Lett 200076
(20)2868-2870
[8] Park C et al Chemical Physical Letters 2002364303-308
[9] Ham HT Choi YS Chung JI Journal of Colloid and Interface
Science 2005286 (1)216-223
[10] Salvetat JP Briggs AD Bonard JM Bacsa RR Kulik AJ Stockli T
Burnham NA Forroacute L Phys Rev Lett 199982 (5)944-947
[11] Choi ES Brooks JS Eaton DL Haik MS Hussaini MY Garmestani
H Li D Dahmen KJ Appl Phys 2003946034-
[12] Sandler J Shaffer MSP Prasse T Bauhofer W Schulte K Windle
AH Polymer 199940(21)5967-5971
[13] Xiao-Lin X Yiu-Wing M Xing-Ping Z Materials Science and
Engineering R 20054989-112
[14] Jin L Bower C Zhou O Appl Phys Lett 199873 (9)1197-1199
[15] Choi ES Brooks JS Eaton DL Al-Haik MS Hussaini MY
Garmestani H Li D Dahmen KJ Appl Phys 2003945451-5473
CHAPTER 6 KINETIC DEGRADATIONS KISSINGER AND OZAWA
METHODS
61 The state of the art on Kissinger and Ozawa methods
for epoxy resin To study the accelerated ageing of polymers and to obtain the kinetic
parameters of decomposition such as the apparent activation energy we
must to extrapolate according to the environment where the materials
are used It is important to consider the degradation mechanisms both
in the environments where they are used both when they are under
accelerated ageing conditions
Thermogravimetric analysis is often used to determine decomposition
reactions and to evaluate the thermal stability The mass loss is
controlled by time in isothermal conditions or by temperature during
the heating rate Changes in mass can be associated with solvent or
water desorptionabsorption oxidation or reduction and decomposition
Dynamic TG tests tend to be shorter and the mechanism of degradation
may be studied over a large temperature range with typical heating rate
Regnier et al [1] in a previously work on polyimide polymer system
compared several methods to calculate thermal kinetic parameters
They showed that Van Krevelen Horowitz-Metzger Coats Redfern and
Mac-Callum-Tanner methods gave a similar apparent activation energy
All kinetic parameters calculated by using these methods showed
equally good agreement with the experimental data Afterwards Regnier
et al [2] investigated the thermal degradation of epoxycarbon
composites in dynamic conditions The activation energy have been
evaluated employing Kissingerrsquos method assuming first order reaction or
the Osawarsquos method which gives an estimated activation energy for the
overall degradation
Chapter 6 Kinetic degradation Kissinger and Ozawa methods
95
Kiefer et al [3] mentioned that the sample preparation had an effect on
the kinetic results It does seem that the kinetic parameters are divided
into two groups however depending whether or not the sample
contained fibres He observed that the resin is affecting the fibre
Wang et al [4] studied the degradation behaviours of epoxy resins
containing various flame retardant components by Kissinger Flynn-
Wall-Ozawa and Horowitz-Metzger methods They demonstrated that
the activation energy at lower degree of the degradation decreased by
incorporation of flame retardant components while increased at higher
degree of the degradation
Chiang et al [5] prepared epoxy nanocomposites containing silicon and
phosphorus and compared with pure epoxy by Kissingerrsquos method They
found that the activation energies of thermo-oxidative degradation for
epoxy nanocomposites are less than those of thermo-oxidative
degradation for pure epoxy in first stage of thermo-oxidative
degradation However the activation energies of thermo-oxidative
degradation for epoxy nanocomposites are more than those of thermo-
oxidative degradation for pure epoxy in second stage of thermo-oxidative
degradation
In the dynamic and isothermal TGA measurements the mass loss is
detected in function of temperature and kinetic of degradation is based
on nth order reaction mechanism and in the many cases the rate of
degradation is a linear function of temperature by a constant
dependent of temperature by Arrhenius equation
)(αα Kfdtd
= (1)
with
⎟⎠⎞
⎜⎝⎛ minus=
RTEAfk exp)(α
(2)
Chapter 6 Kinetic degradation Kissinger and Ozawa methods
96
The combination of (1) e (2) gives
⎟⎠⎞
⎜⎝⎛ minus=
RTEAf
dtd exp)(αα
(3)
If heating rate β=dTdt is constant the variation in degree of conversion
can be analysed as a function of temperature and this temperature
being dependent on the time of heating
⎟⎠⎞
⎜⎝⎛ minus=
RTEfA
dTd exp)(α
βα
(4)
The integrated form of this equation generally is expressed as
int int ⎟⎠⎞
⎜⎝⎛minus==
α
βααα
0 0
exp)(
)( dTRTEA
fdg
T
(5)
where g(α) is the integrated form of the conversion dependence function
Different kinetics methods (differential and integral) were applied in this
study
Kissinger method [6] makes it possible to determine the values of
activation energy without a precise knowledge of the reaction
mechanism and analyzes the changes in the thermo-gravimetric data
through the change of scan rate of heating β depending on the
temperature of the maximum peak in DTG curve That way you get
that
( )[ ]max
1max2
max
1lnlnlnRT
EnE
ART
n minus⎭⎬⎫
⎩⎨⎧ minus+=⎟⎟
⎠
⎞⎜⎜⎝
⎛ minusαβ
(6)
where Tmax is the temperature corresponding to the inflection point of
thermo degradation curves which corresponds to the maximum reaction
rate αmax is the conversion at Tmax and n is the reaction order
Chapter 6 Kinetic degradation Kissinger and Ozawa methods
97
Assuming that ( ) ( ) 1 1maxmax constnf n congminus=prime minusαα the activation energy E can
be determined from a plot of ln(βT2max) against 1Tmax
With Flynn-Wall-Ozawa method [7-9] it is possible to get values of
activation energy applying Doylersquos approximation to the integration of
Eq(5) You get that
RTE
RgAE 456703152
)(loglog minusminus⎥
⎦
⎤⎢⎣
⎡=
αβ
(7)
Using Eq7 it is possible to plot logβ against 1T and to consider the
slope of straight line which result with a various value of conversion
The graph that result report E in function of conversion degree
62 Kinetic degradations of RTM6 and inorganic
compounds For obtaining the kinetic information such as the activation energy the
TGA study has been conducted with the variation of the heating rates
The dynamic experiments were carried out at different heating rates 5
75 10 and 20 degCmin from ambient to 800degC with TA 2950
thermobalance in nitrogen and air atmosphere For each experiment
were used approximately 10 mg of materials and the kinetics
parameters of interest as activation energy relating to initial
degradation of mixtures were obtained by Kissinger and Flynn-Ozawa-
Wall methods
In figure 61 thermogravimetric analysis of the epoxy resin RTM6 in the
nitrogen atmosphere are reported The epoxy resin shows only one step
of degradation and the onset temperature is around 350degC while the
maximum temperature on the DTG curves shows a little difference in
the heating rate
Chapter 6 Kinetic degradation Kissinger and Ozawa methods
98
Figure 61 TGA thermograms of RTM6 neat in nitrogen atmosphere
Figure 62 DTG thermograms of RTM6 neat in nitrogen atmosphere
In table 61 the onset temperature and maximum temperature for
epoxy system neat are reported along with the corresponding heating
ramp
Chapter 6 Kinetic degradation Kissinger and Ozawa methods
99
Heating rate (degCmin) Tonset (degC) Tmax (degC) 5degCmin 305 372
75degCmin 320 381
10degCmin 330 388
20degCmin 348 403
Table 61 Tonset and Tmax of epoxy resin RTM6 in nitrogen atmosphere
In air atmosphere two different degradation steps spanning the whole
investigated temperature range are noticeable the first step occurring
at 350degC and a second much broader step within around 500-550degC
(fig 63 and 64) The second step was attributed to a decomposition of
the non-volatile residues formed in the first step
Figure 63 TGA thermograms of RTM6 neat in air atmosphere
Chapter 6 Kinetic degradation Kissinger and Ozawa methods
100
Figure 64 DTG thermograms of RTM6 neat in air atmosphere
In table 62 are reported Tonset and Tmax of epoxy resin in air atmosphere
for each step
I STEP
Heating rate (degCmin) Tonset (degC) Tmax (degC) 5degCmin 354 378
75degCmin 351 383
10degCmin 354 406
20degCmin 357 398
II STEP
Heating rate (degCmin) Tonset (degC) Tmax (degC) 5degCmin 475 517
75degCmin 524 556
10degCmin 523 568
20degCmin 544 597
Table 62 Tonset and Tmax of epoxy resin RTM6 in air atmosphere
Chapter 6 Kinetic degradation Kissinger and Ozawa methods
101
The Kissinger method was employed to obtain the apparent activation
energy (Ea) in air or nitrogen from several scan with different heating
rate (q) Figures 65 and 66 represent the Kissinger plots of the epoxy
resin degraded in nitrogen and air atmosphere
150 152 154 156 158 160 162 1641000 KT
0
02
04
06
08
10
log (Heating rate(Kmin))
Activation Energy(kJmol) 16452 +- 351log (As^-1) 1070
Figure 65 Kissinger graphs for RTM6 data in nitrogen atmosphere
-1 2
-1 1 5
-1 1
-1 0 5
-1 0
-9 5
-9
-8 5
0 0 0 1 1 0 0 0 1 2 0 0 0 1 3 0 0 0 1 4 0 0 0 1 5 0 0 0 1 6
I S tepII s tep
y = 68 38 3 - 5 2 03 6 x R = 0 9 9 9 4 3
y = 0 4 01 9 5 - 9 69 1 x R = 0 9 9 7 4 3
ln ( β
T max
2 )
1 Tm a x
degK -1
Figure 66 Kissinger graphs for RTM6 data in air atmosphere
Chapter 6 Kinetic degradation Kissinger and Ozawa methods
102
KISSINGER in nitrogen atmosphere
Ea (kJmol) 16452
KISSINGER in air atmosphere
I STEP II STEP
Ea (kJmol)
RTM6 NEAT
816 1157
Table 63 Kissinger data for epoxy resin RTM6 in nitrogen and air atmosphere
The kinetic parameters calculated in nitrogen flow present activation
energy values higher than Ea obtained in air flow In fact activation
energy value in nitrogen flow is 16452 kJmol instead in air flow is
816 kJmol for first step and 1157 KJmol for second step
The Flynn-Ozawa-Wall method was also carried out for calculating the
activation energy only in nitrogen atmosphere In figures 67 and 68 it
is reported respectively the Ozawa analysis and activation energy
calculated with Ozawa methods for epoxy resin RTM6 It is possible to
notice that in the nitrogen atmosphere the Ea increase from conversion
zero to 20 after Ea is a constant from =02 to =07 and than
increase until to =085
Chapter 6 Kinetic degradation Kissinger and Ozawa methods
103
10 12 14 16 18 201000 KT
06
08
10
12
14log Heating rate(Kmin)
002 098
Figure 67 Ozawa analysis for RTM6 in nitrogen atmosphere
0 02 04 06 08 10 FractMass Loss
40
80
120
160
200
E(kJmol)
Figure 68 Energy of activation calculated with Ozawa method for RTM6 in nitrogen
atmosphere
The thermogravimetric derivate signal for RTM6ZB 30 wt system is
showed in figure 69 for nitrogen atmosphere and in figure 610 for air
atmosphere
Chapter 6 Kinetic degradation Kissinger and Ozawa methods
104
Figure 69 DTG thermograms of RTM6+ZB 30wt in nitrogen atmosphere
Figure 610 DTG thermograms of RTM6+ZB 30wt in air atmosphere
Chapter 6 Kinetic degradation Kissinger and Ozawa methods
105
145 147 149 151 1531000 KT
06
08
10
12
14log (Heating rate(Kmin))
Activation Energy(kJmol) 15425 +- 2201log (As^-1) 971
Figure 611 Kissinger graphs for RTM6+ZB 30wt data in nitrogen atmosphere
-12
-115
-11
-105
-10
0001 00012 00014 00016 00018 0002
I stepII step
y = 15735 - 17745x R= 099679
y = 15931 - 21603x R= 099919
ln(β
Tm
ax2 )
1Tmax
Figure 612 Kissinger graphs for RTM6+ZB 30wt data in air atmosphere
The Kissinger analysis in nitrogen atmosphere has demonstrated that
the activation energy Ea is less than the value of epoxy resin hence it
doesnrsquot achieve the energy for the degradation of RTM6 neat Instead in
the Kissinger analysis in air atmosphere it is shown that the value of
Chapter 6 Kinetic degradation Kissinger and Ozawa methods
106
Ea in the second step is higher than the value of RTM6 in fact at the
temperature lower 500degC a char on the surface that protects the matrix
is produce
KISSINGER in nitrogen atmosphere
Ea (kJmol) 15425
KISSINGER in air atmosphere
I STEP II STEP
Ea (kJmol)
RTM6+ZB 30wt
14754 17962
Table 64 Kissinger data for RTM6+ZB 30wt in nitrogen and air atmosphere
10 12 14 16 18 201000 KT
06
08
10
12
14log Heating rate(Kmin)
002 098
Figure 613 Ozawa analysis for RTM6+ZB 30wt in nitrogen atmosphere
Chapter 6 Kinetic degradation Kissinger and Ozawa methods
107
0 02 04 06 08 FractMass Loss
40
60
80
100
120
140
160
E(kJmol)
Figure 614 Energy of activation calculated with Ozawa method for RTM6+ZB 30wt
in nitrogen atmosphere
In the nitrogen atmosphere the Ozawa analysis confirms the positive
effect of zinc borate on the epoxy resin RTM6 because with low
conversion values the activation energy Ea is less than 50kJmol while
for conversion degrees between 01 and 08 a multi-step degradation
process is shown The presence of this step means that several layers of
char on the surface of the RTM6 have been created
Chapter 6 Kinetic degradation Kissinger and Ozawa methods
108
Figure 615 DTG of RTM6+ATH 30 wt in nitrogen atmosphere
Figure 616 DTG of RTM6+ATH 30 wt in air atmosphere
Chapter 6 Kinetic degradation Kissinger and Ozawa methods
109
147 149 151 1531000 KT
06
08
10
12
14log (Heating rate(Kmin))
Activation Energy(kJmol) 18731 +- 971log (As^-1) 1247
Figure 617 Kissinger graphs for RTM6+ATH 30 wt data in nitrogen atmosphere
-5
-49
-48
-47
-46
-45
-44
-43
-42
00012 00014 00016 00018 0002 00022
I stepII step
y = -071912 - 22661x R= 099682
y = 80558 - 84061x R= 097719
log
(βT
max
2 )
1Tmax
Figure 618 Kissinger graphs for RTM6+ATH 30 wt data in nitrogen atmosphere
Chapter 6 Kinetic degradation Kissinger and Ozawa methods
110
-12
-115
-11
-105
-10
-95
0001 00012 00014 00016 00018 0002
I stepII stepIII step
y = 11477 - 12954x R= 099948
y = 23102 - 22194x R= 099906
y = 66365 - 14480x R= 099861
ln(β
Tm
ax2 )
1Tmax
Figure 619 Kissinger graphs for RTM6+ATH 30 wt data in air atmosphere
KISSINGER in nitrogen atmosphere
I STEP II STEP
Ea (kJmol)
18841 6989
KISSINGER in air atmosphere
I STEP II STEP III STEP
Ea (kJmol)
RTM6+ATH 30wt
1077 1845 1204
Table 65 Kissinger data for RTM6+ATH 30wt in nitrogen and air atmosphere
In this case there are three degradation steps in the Kissinger analysis
in air atmosphere of aluminium trihydrate By varying the temperature
the following process occurred sequentially
bull dehydration of hydroxyl groups
bull formation of aluminized layer protection
bull pyrolysis of char
Chapter 6 Kinetic degradation Kissinger and Ozawa methods
111
For every step it is possible to associate the activation energy which is
greater than Ea of RTM6 hence it represents a slower degradation
08 10 12 14 16 18 201000 KT
06
08
10
12
14log Heating rate(Kmin)
002 095
Figure 620 Ozawa analysis for RTM6+ATH 30wt in nitrogen atmosphere
0 02 04 06 FractMass Loss
20
40
60
80
100
120
140
160
180
E(kJmol)
Figure 621 Energy of activation calculated with Ozawa methods for RTM6+ATH
30wt in nitrogen atmosphere
Chapter 6 Kinetic degradation Kissinger and Ozawa methods
112
In the Ozawa analysis it is demonstrated that the Ea starts to lower
values than both RTM6 and ZB in fact Ea starts to 25 kJmol and two
different steps are observed In the first step Ea is 70 kJmol for =01
while in the second step Ea is 160 kJmol with conversation degree
between 02 and 07
The TGA thermograms of the epoxy resin containing zinc borate and
aluminium trihydrate is reported in figures 622 and 623 to study the
kinetic parameters for synergistic effects of zinc borate
Figure 622 DTG of RTM6+ATH+ZB 30 wt in air atmosphere
Chapter 6 Kinetic degradation Kissinger and Ozawa methods
113
Figure 623 DTG of RTM6+ATH+ZB 30 wt in air atmosphere
146 148 150 152 154 1561000 KT
06
08
10
12
14log (Heating rate(Kmin))
Activation Energy(kJmol) 12276 +- 1399log (As^-1) 717
Figure 624 Kissinger graphs for RTM6+ATH+ZB 30 wt system data in nitrogen
atmosphere
Chapter 6 Kinetic degradation Kissinger and Ozawa methods
114
-125
-12
-115
-11
-105
-10
-95
-9
0001 00012 00014 00016 00018 0002 00022
I stepII stepIII step
y = 27768 - 24989x R= 099954
y = 26545 - 24952x R= 099876
y = 11444 - 18156x R= 099963
ln(β
Tm
ax2 )
1Tmax
Figure 625 Kissinger graphs for RTM6+ATH+ZB 30wt system data in air
atmosphere
KISSINGER in nitrogen atmosphere
Ea (kJmol) 12276
KISSINGER in air atmosphere
I STEP II STEP III STEP
Ea (kJmol)
RTM6+ATH+ZB 30wt
2077 2075 1509
Table 66 Kissinger data for RTM6+ATH+ZB 30wt in nitrogen and air atmosphere
Chapter 6 Kinetic degradation Kissinger and Ozawa methods
115
10 12 14 16 18 201000 KT
06
08
10
12
14log Heating rate(Kmin)
002 098
Figure 626 Ozawa analysis for RTM6+ATH+ZB 30wt system in nitrogen
atmosphere
01 03 05 07 Fractional Reaction
100
200
300
400
500
600
700E(kJmol)
Figure 627 Energy of activation calculated with Ozawa methods for RTM6+ATH+ZB
30wt system in nitrogen atmosphere
Chapter 6 Kinetic degradation Kissinger and Ozawa methods
116
The presence of both additives is clear in the Kissinger analysis and the
synergistic effect is shown in the Ozawa analysis because at low levels
of alpha Ea is higher In fact Ea increases for values of alpha around 01
and remains constant value of 200 kJmol throughout the range of
conversion Consequently it is necessary a higher energy than in
respect to the same additives taken individually and RTM6 neat to
complete the degradation process
Figure 628 DTG of RTM6+ZS 30 wt in nitrogen atmosphere
Chapter 6 Kinetic degradation Kissinger and Ozawa methods
117
Figure 629 DTG of RTM6+ZS 30 wt in air atmosphere
152 154 156 158 1601000 KT
06
08
10
12
14log (Heating rate(Kmin))
Activation Energy(kJmol) 15759 +- 420log (As^-1) 1044
Figure 630 Kissinger graphs for RTM6+ZS 30 wt data in nitrogen atmosphere
Chapter 6 Kinetic degradation Kissinger and Ozawa methods
118
-12
-115
-11
-105
-10
-95
0001 00012 00014 00016 00018 0002
I stepII stepIII step
y = 31646 - 26873x R= 099793
y = 11934 - 15035x R= 099848
y = 79213 - 15008x R= 099838
ln(β
Tm
ax2 )
1Tmax
Figure 631 Kissinger graphs for RTM6+ZS 30 wt data in air atmosphere
KISSINGER in nitrogen atmosphere
Ea (kJmol) 1576
KISSINGER in air atmosphere
I STEP II STEP III STEP
Ea (kJmol)
RTM6+ZS 30wt
2234 125 1248
Table 66 Kissinger data for RTM6+ZS 30wt in nitrogen and air atmosphere
Zinc stannate is similar to ATH for Kissinger analysis because also in
this case there are three degradation steps The discussion on the
structure of char isnrsquot like ATH because there isnrsquot the aluminium and
because the second and third degradation step need a lower energy to
be completed hence it is explained that the protection action is partly
missing
Chapter 6 Kinetic degradation Kissinger and Ozawa methods
119
10 12 14 16 18 20 22 24 261000 KT
06
08
10
12
14
log Heating rate(Kmin)
002 098
Figure 632 Ozawa analysis for RTM6+ZS 30wt in nitrogen atmosphere
0 02 04 06 08 FractMass Loss
0
40
80
120
160
200
E(kJmol)
Figure 633 Energy of activation calculated with Ozawa methods for RTM6+ZS in
nitrogen atmosphere
Chapter 6 Kinetic degradation Kissinger and Ozawa methods
120
In the Ozawa analysis in nitrogen atmosphere the activation energy has
a maximum peak of 200 kJmol around to =06 and neither a constant
evolution nor several degradation steps are shown
Figure 634 DTG of RTM6+ZHS 30 wt in nitrogen atmosphere
Figure 635 DTG of RTM6+ZHS 30 wt in air atmosphere
Chapter 6 Kinetic degradation Kissinger and Ozawa methods
121
151 153 155 157 1591000 KT
06
08
10
12
14log (Heating rate(Kmin))
Activation Energy(kJmol) 14931 +- 1257log (As^-1) 975
Figure 636 Kissinger graphs for RTM6+ZHS 30 wt data in nitrogen atmosphere
-49
-48
-47
-46
-45
-44
-43
-42
-41
00012 00014 00016 00018 0002 00022
I stepII step
y = 1713 - 10920x R= 09957
y = 11529 - 10291x R= 099916
log
(βT
max
2 )
1Tmax
Figure 637 Kissinger graphs for RTM6+ZHS 30 wt data in nitrogen atmosphere
Chapter 6 Kinetic degradation Kissinger and Ozawa methods
122
-125
-12
-115
-11
-105
-10
-95
0001 00012 00014 00016 00018 0002 00022
I stepII stepIII stepIV step
y = 30807 - 22469x R= 099707
y = 30543 - 26147x R= 099778
y = 755 - 56705x R= 099954
y = 83073 - 15323x R= 099946
ln(β
Tm
ax2 )
1Tmax
Figure 638 Kissinger graphs for RTM6+ZHS 30 wt data in air atmosphere
KISSINGER in nitrogen atmosphere
I STEP II STEP
Ea (kJmol)
908 85564
KISSINGER in air atmosphere
I STEP II STEP III STEP IV STEP
Ea (kJmol)
RTM6+ZHS 30wt
1868 2174 4715 1274
Table 67 Kissinger data for RTM6+ZHS 30wt in nitrogen and air atmosphere
Zinc hydroxystannate shows four degradation steps therefore the
degradation mechanism is particularly complex and to create the
protective layer a high energy contribution (471 kJmol) is necessary
Chapter 6 Kinetic degradation Kissinger and Ozawa methods
123
14 16 18 20 221000 KT
06
08
10
12
14log Heating rate(Kmin)
002 080
Figure 639 Ozawa analysis for RTM6+ZHS 30wt in nitrogen atmosphere
0 02 04 06 FractMass Loss
60
100
140
180
220
260
E(kJmol)
Figure 640 Energy of activation calculated with Ozawa methods for RTM6+ZHS in
nitrogen atmosphere
In the Ozawa analysis there are several steps and Ea is constant at the
value of 180 kJmol between alpha 01 to 05 and Ea increases until
Chapter 6 Kinetic degradation Kissinger and Ozawa methods
124
270 kJmol where is obtained to complete the degradation process of
degradation
63 Kinetic degradations of RTM6 and carbon nanotubes The thermal properties of CNTspolymer composites also attracted
many attentions from polymer scientists because CNTs have very high
thermal stability [10-14] Yang et al [11] reported the effect of single-
walled carbon nanotubes (SWNTs) on the thermal stability of
acrylonitrileebutadienee styrene (ABS)SWNTs composites They found
that the addition of SWNTs destabilized ABS and caused the composites
to degrade at lower temperatures Probst et al [12] revealed that
MWNTs promote the degradation of polyvinyl alcohol In contrast
Kashiwagi et al [13] observed an increased thermal stability of
MWNTspolypropylene (PP) composites The same effect of MWNTs on
PP was found by Yang et al [14] From the above publications both
promoting and hindering effects of CNTs on the thermal stability of
polymer are found The structure of the polymer matrix and the
interaction between CNTs and the matrix may be the key factors for the
thermal degradation behaviour of CNTs filled polymer composites
DTG curves of RTM6 with 01wt MWNTs under nitrogen and air
environments are showed in figures 639 and 640 respectively One
step decomposition is found under nitrogen atmosphere while two step
decomposition (second step from 450degC to 700degC) are found under air
atmosphere
Heating rate (degCmin) Tonset (degC) Tmax (degC) 5degCmin 317 376
75degCmin 334 387
10degCmin 334 391
20degCmin 348 404
Table 68 Tonset and Tmax of RTM6+MWNT 01wt in nitrogen atmosphere
Chapter 6 Kinetic degradation Kissinger and Ozawa methods
125
Figure 641 DTG of RTM6+MWNT 01wt in nitrogen atmosphere
Figure 642 DTG of RTM6+MWNT 01wt in air atmosphere
Chapter 6 Kinetic degradation Kissinger and Ozawa methods
126
147 149 151 153 1551000 KT
06
08
10
12
14log (Heating rate(Kmin))
Activation Energy(kJmol) 18936 +- 1296log (As^-1) 1269
Figure 643 Kissinger graphs for RTM6+MWNT 01wt data in nitrogen atmosphere
The Ea of neat RTM6 is found to be 164 KJmol while MWNTsRTM6
composites is found to be 189 KJmol suggesting that the MWNTs
increase the thermal stability of RTM6 under nitrogen atmosphere
-12
-115
-11
-105
-10
0001 00012 00014 00016 00018 0002
I stepII stepIII step
y = 11748 - 14660x R= 099802
y = 32132 - 97535x R= 099862
y = 38629 - 12408x R= 099656
ln(β
Tm
ax2 )
1Tmax
Figure 644 Kissinger graphs for RTM6+MWNT 01wt data in air atmosphere
Chapter 6 Kinetic degradation Kissinger and Ozawa methods
127
There are three steps although the small amount of carbon nanotubes
demonstrates that the degradation process has been altered The first
step is given by the of epoxy resin with carbon nanotubes The second
step is divided in two steps where in the first is lower than of the resin
and the second step is the pyrolysis of the char that happens with an
additional energy contribution
12 14 16 18 201000 KT
06
08
10
12
14log Heating rate(Kmin)
002 095
Figure 645 Ozawa analysis for RTM6+MWNT 01 wt in nitrogen atmosphere
In the Ozawa data a higher thermal stability than RTM6 is shown
because Ea starts by higher values but it is stable at about 200 kJmol
for alpha between 01 and 09
Chapter 6 Kinetic degradation Kissinger and Ozawa methods
128
0 02 04 06 08 FractMass Loss
60
80
100
120
140
160
180
200
E(kJmol)
Figure 646 Energy of activation calculated with Ozawa methods for RTM6+MWNT
01 wt in nitrogen atmosphere
64 Analysis of residue In the figure 647 a graph comparing dynamic measurements carried
out with scan rate of 10degCmin in air flow on all the samples tested in
this study is reported It is possible to notice that addition of zinc
compounds in the epoxy matrix does not induce big differences in the
first two stages of degradation except for the initial temperature of
degradation that increase for samples containing ZS and ZB For the
samples containing ZHS and ATH there is a difference in the first step
of degradation which occurs at around 220degC and these temperature is
characteristic of dehydration of crystallisation water For the samples
with ZS and ZB the loss of crystallisation water occur at higher
temperatures and this process is concomitant with the first step of
epoxy matrix degradation which happens in airflow at a temperature of
about 350degC and concern the dehydration of hydroxyl functions
The char oxidation stage occurs for the RTM6 neat in the temperature
range (513-627degC) instead for the samples containing flame retardant
Chapter 6 Kinetic degradation Kissinger and Ozawa methods
129
zinc compounds this range of temperature decrease It is possible to
notice larges differences for the residue of dynamic experiments carried
on samples flame retardants in oxidant atmosphere (tab 69) The flame
retardant zinc based promote char formation more efficiently at
temperatures lower than the epoxy RTM6 Zinc borate in the epoxy
matrix RTM6 induce formation of stable char at 554degC and residue is
about 32 of initial weight with weight loss in the third stage of 24
RTM6 with ZS form the char stable at the same temperature of sample
containing ZB but the residue in this case is lower than ZB (27)
Similarly RTM6 with ZHS show a residue equal at 14 lower than the
initial addition of flame retardant in the resin matrix (20) and the char
formation occurs at temperatures of 551degC
Figure 647 Comparison of additives at 10degCmin in dynamic mode and in air
atmosphere
Chapter 6 Kinetic degradation Kissinger and Ozawa methods
130
Temperature (degC)
Sample at 10
weight
loss
charring
stage
initial char
formation
weight
loss
III stage
of
char
at
800degC
RTM6 357 530-604 636 38 1
RTM6+ZS 359 492-527 555 35 24
RTM6+ZHS 356 498-530 559 40 17
RTM6+ZB 376 485-558 554 24 32
RTM6+ATH 374 509-582 628 36 9
Table 69 Analysis of last step of degradation in air flow
According to the Flynn-Ozawa-Wall analysis data it is possible to notice
that in air flow for RTM6 during the first stage of degradation occur
chain scission by thermolysis and there is the formation of thermally
more stable molecular compounds To destroy this compound it is
needed another stage of degradation that occurs with activation energy
and temperatures higher than first stage In the presence of flame
retardant compounds the second and third stage of degradation
concerns the segments of chain liberated that migrates in the surface of
samples A parts of these segments are volatiles but most of these
segments react with zinc compounds and form a layer of char stable
that delay the oxidation of matrix The sample containing ZB shows
higher efficiency of this process in the formation of char in the epoxy
matrix
Chapter 6 Kinetic degradation Kissinger and Ozawa methods
131
References [1] Regnier N Guibe C Polymer Degradation and Stability 1997
55165
[2] Regnier N Fontaine S Journal of Thermal Analysis and Calorimetry
2001 64789
[3] Kiefer R Yue J Hinkley J Journal of Advanced Materials 1995
2655
[4] Wang Q Shi W Polymer Degradation and Stability 2006 911747-
1754
[5] Chiang CL Ma CCM Wang FY Kuan HC European Polymer
Journal 2003 39825-830
[6] Kissinger HE Anal Chem 1957 291702-1706
[7] Flynn JH Wall LA J Res Nat Bur Stand A Phys Chem 1996
70A487
[8] Ozawa T Bull Chem Soc Jpn 1965 381881
[9] Doyle CD Nature 1965 207240
[10] Beyer G Fire Mater 200226(6)291-3
[11] Yang SY Castilleja JR Barrera EV Lozano K Polym Degrad Stab
200483383-8
[12] Probst O Moore EM Reasaco DE Grady BP Polymer 200454437-
43
[13] Kashiwagi T Grulke E Hilding J Harris R Awad W Douglas J
Macromol Rapid Commun 200223(13)761-5
[14] Yang J Lin YH Wang JF Lai MF Li J Liu JJ et al J Appl Polym
Sci 200598 1087-91
CHAPTER 7 CONCLUSIONS AND FUTURE PERSPECTIVES
71 Conclusions In this work the flame retardant and thermal mechanical properties of
an monocomponent epoxy resin additived with micro and nano fillers
are studied The experimental study is based on cone calorimeter
analysis and thermo-mechanical analysis and on the study of kinetic
parameters by Kissinger and Ozawa methods
Through the cone calorimeter test it has been demonstrated that the
zinc borate resulted as the best additive as it concerns the 30 and
40 percentages Furthermore the flame retardant effect of zinc borate
on the Epoxy resin neat is highlighted when it is synergistically used
with ATH instead as ZS and ZHS are concerned ZHS performs better
at the above mentioned percentages This comes up also by Kissinger
analysis (performed both in nitrogen atmosphere and in air atmosphere)
as ZHS shows two steps in nitrogen atmosphere (so as ATH does) and
epoxy resin neat shows one step In air atmosphere ZHS shows four
steps and epoxy resin neat shows two steps As the Ozawa model is
concerned the union of ZB and ATH improves the activation energy
From the residue analysis we can notice that ZB is the best additive
both regarding the char-formation temperature both regarding the
morphology
Thermo-mechanical analysis shows that all the additives provide an
improvement of the composites thermal expansion coefficient such as it
decreases upon the addition of additives respect to the neat resin
About nanotubes the used percentage is too low to observe any
meaningful effects in all of the analyses undertaken in this study
To conclude zinc borate is in the light of all performed analyses the
best additive the percentages where the effect of the additive can be
sensibly observed are 30 and 40
Chapter 7 Conclusions and future perspectives
133
72 Future Perspectives From our conclusions it is possible to suggest further studies on ZHS
and on its synergistic effect and an investigation on a possible synergy
between the used additives and the nanotubes As for nanotubes they
should be chosen with a higher statistical percolation threshold so to
use a higher additivation percentage
Moreover an interesting topic for future work is the comprehension of
the degradative mechanisms related to additives in terms of their
chemical properties and their interaction with the resin This study can
be carried out by means of FTIR and XRD analysis The study of the
actual mechanisms of degradation during the different heating steps
could lead to a better knowledge of kinetic parameters of the composite
systems
About fibres reinforced resin composites the study of the effects of
different lay-up methods on the thermal properties of the additivated
composites could lead to the improvement of their flame retardant
properties
- 1pdf
- 2cpdf
- 3bpdf
- 4pdf
- 5pdf
- 6pdf
- 7pdf
- 8bpdf
- 9pdf
- 10bpdf
- 11pdf
-
UNIVERSITAacute DEGLI STUDI DI NAPOLI
FEDERICO II
Dipartimento di Ingegneria dei Materiali e della Produzione Insight of thermo-mechanical and fire
properties of an aerospace epoxy matrix loaded with micro and nano fillers
CRISTINA FORMICOLA PhD Dissertation
TUTOR COORDINATOR Dr Michele Giordano Chmo Domenico Acierno Dr Mauro Zarrelli
December 2008
Technological District in Polymer
and Composite Engineering In collaboration with
i
Table of Contents Chapter 1 Introduction
11 Combustion mechanism
12 Fire test for composites materials
References
Chapter 2 Materials
21 Thermosetting resin RTM6
211 Characterization of RTM6
22 Micro materials Introduction on flame retardant
221 Zinc Borate
222 Aluminium Trihydrate
223 Zinc Hydroxystannate
224 Zinc Stannate
23 Nano materials Introduction on carbon nanotubes
231 Multi walled carbon nanotubes
References
Chapter 3 Experimental techniques
31 Methods
311 Micro particles Mechanical stirring
312 Nano particles Sonication
313 Vacuum infusion process
32 Characterization
321 Cone calorimeter
322 Scanning Electron Microscope
323 Thermal mechanical analysis
ii
324 Thermal gravimetric analysis
References
Chapter 4 Flame retardant of epoxy resin with inorganic compounds
41 The state of the art on flame retardant of inorganic compounds
42 Cone calorimeter test
421 Flame retardant of RTM6 and inorganic compounds
422 Synergistic effect of zinc borate
423 Scanning electron micrograph of residue
424 Flame retardant of panels of RTM6 and inorganic
compounds
43 Thermal mechanical analysis of RTM6 and inorganic compounds
References
Chapter 5 Flame retardant of epoxy resin with carbon nanotubes
51 The state of the art on flame retardant of carbon nanotubes
52 Cone calorimeter test
521 Flame retardant of RTM6 and multi walled carbon
nanotubes
522 Flame retardant of panels of RTM6 and carbon nanotubes
53 Thermal mechanical analysis of RTM6 and carbon nanotubes
References
Chapter 6 Kinetic degradations Kissinger and Ozawa methods
61 The state of the art on Kissinger and Ozawa methods for epoxy
resin
62 Kinetic degradations of RTM6 and inorganic compounds
63 Kinetic degradations of RTM6 and carbon nanotubes
iii
64 Analysis of residue
References
Chapter 7 Conclusions and future perspectives
71 Conclusions
72 Future Perspectives
ACKNOWLEDGMENTS
I want to thank Dr Engineer Giordano for this opportunity and to Dr Engineer Zarrelli for
having believed in my possibilities and for allowing me to fulfill them
To Professor Camino and Dr Engineer Frache of Turin Polytechnic for having welcomed me in
their structure with professionality and kindness To my family for their (also monetary) support To my friendscolleagues for their help and for
putting up with me and my temper and Especially ldquoThank yourdquo to my beloved Ciro who
has always been by my side despite everything To Daniele who supported me and was tortured
by me To Anna who has been a moral and professional
support and for not having sent me to hell yet
CHAPTER 1 INTRODUCTION
11 Combustion mechanisms The use of polymer composites has grown at a phenomenal rate since
the 1960s and these materials now have an impressive and diverse
range of applications in aircraft spacecraft boats ships automobiles
civil infrastructure sporting goods and consumer products The growth
in the use of composite materials by various industry sectors in the
United States since 1960 is reported in figure 11 Growth in the use of
composites has reached a level where they are now challenging the use
of traditional materials - most notably steels and aluminium alloys - in
many markets particularly the aircraft boat-building and chemical
processing industries
Figure 11 Growth in the (a) total use and (b) use by individual market sectors in the United States (Source Composite Fabrication Association)
Chapter 1 Introduction
2
The use of composites in a wide variety of applications is due to their
many outstanding physical thermal chemical and mechanical
properties Key advantages of composites over many metal alloys
include low density high specific stiffness and specific strength good
fatigue endurance excellent corrosion resistance outstanding thermal
insulation and low thermal expansion However there are several
disadvantages with composites that have impacted on their growth in
some markets Composites are plagued by problems such as low
through-thickness mechanical properties poor impact damage
tolerance and anisotropic properties A major disadvantage of many
composite materials is poor performance in fire When composites are
exposed to high temperatures (typically above 300-400degC) the organic
matrix decomposes with the release of heat smoke soot and toxic
volatiles Composites also soften creep and distort when heated to
moderate temperature (gt100-200degC) that can result in buckling and
failure of load-bearing composite structures The heat smoke and gases
released by a burning composite and the degradation in structural
integrity can make fire-fighting extremely hazardous and increase the
likelihood of serious injury and death The susceptibility of composites
to fire has been the key issue in curtailing their use in many
infrastructure and public transportation applications
Although many polymer composites are flammable their resistance to
pyrolysis can be improved Furthermore these materials possess some
potentially useful properties in fire that are not inherent with metals
Composites have excellent thermal insulation properties and slow burn-
through The rate of heat conduction through composites is much
slower than metals and this is a significant benefit is slowing the
spread of fire from room-to-room Composites can provide an effective
protective barrier against flame heat smoke and toxic fumes
Fire is a complicated phenomenon that can develop in stages of
increasing temperature and size before decaying The fire event becomes
Chapter 1 Introduction
3
more complex when a polymer composite material is involved because it
can control the temperature size and spread of the flame A turbulent
flame consists of three zones and from the base to top can be divided
into the solid flame region intermittent flame region and thermal plume
(Fig 12) The solid flame region near the plume base is where the
majority of the flammable vapours undergo exothermic chain-branching
reactions that generate most of the heat
The temperature within this zone is reasonably constant at about 830-
900degC for most types of solid fuels [1] although the maximum
temperature in hydrocarbon pool fires and natural gas flames can reach
1150-1250degC [2] Above the solid flame is the intermittent flame region
and the temperature drops continuously the higher up this zone The
average temperature at the visible tips of a flame is about 400degC [3]
although it can vary over a wide range from 300 to 600degC [1] The
boundary between the solid flame and intermittent regions is not well
defined in a turbulent flame and some overlap or changes in the
boundary location do occur Above the flame tips is the thermal plume
region where no flames are visible and the temperature drops with
height The thermal plume consists of hot gases vapours and soot
particles that can carried upwards by convective heat
Figure 12 Schematic showing the different zones within a turbulent plume
Chapter 1 Introduction
4
The initiation and growth of fire is determined by a multitude of factors
including the type (caloric value) of fuel fuel load fuel size (area)
oxygen content in the flame wind speed and whether the fire is within
an open or enclosed space In the case of polymer composites exposed
to fire the material itself can be a rich source of fuel that causes the
temperature to rise and the flame to spread
A serious concern with using composites in enclosed spaces such as an
aircraft cabin ship compartment or rail carriage is that the heat
smoke and toxic gases are trapped which seriously increases the fire
hazard It is therefore useful to examine the development of fire within a
closed compartment Figure 13 shows how the temperature can vary
with time for a closed compartment fire
Figure 13 Growth stages of a compartment fire
A fire can undergo several stages of growth and in order these are
1 Ignition This is the point when the fuel source ignites and
undergoes sustained flaming combustion
2 Growth The initial growth of a fire is dependent mainly on the
fuel itself with little or no influence from the combustible
materials within the compartment The fire will grow and the
compartment temperature will continue to rise if sufficient fuel
and oxygen are available It is often in this stage that composite
Chapter 1 Introduction
5
materials exposed to the flame will ignite when the temperature
exceeds 350-500degC
3 Flashover This occurs when the fire is fully developed and all
combustible items in the compartment (including any composite
materials) are involved in the fire Flashover usually occurs when
the average upper gas temperature in the room exceeds about
600degC
4 Fully developed fire This stage occurs when the heat release
rate and temperature of a fire are at their greatest The peak
temperature of a typical post-flashover room fire is 900-1000degC
although it can reach as high as 1200degC
5 Decay The final decay stage occurs as the fuel and combustible
materials become consumed causing the compartment
temperature to fall Obviously decay can also be caused by active
fire suppression systems such as sprinklers
When a composite is heated to a sufficiently high temperature the
polymer matrix and (if present) organic fibres will thermally decompose
Most polymer matrixes and organic fibres decompose over the
temperature range of about 350 to 600degC with the production of
flammable gases Decomposition occurs by a series of reactions that
breaks down the polymer chains into low molecular weight volatiles that
diffuse into the flame Depending on the chemical composition and
molecular structure of the polymer the thermal degradation reactions
may proceed by various paths The majority of organic resins and fibres
used in composites degrade thermally by a random chain scission
process This basically involves the break-down of the long organic
chains at the lowest-energy bond sites into small fragments Polymers
can also decompose by other processes including de-polymerisation
(that involves the breakdown of the chain into monomers) and chain-
end initiated scission (that involves the process starting from the chain
ends and propagating along the chain length until it is completely
degraded)
Chapter 1 Introduction
6
The combustion cycle of organic polymers is illustrated in fig 14 and
the cycle stops only when the fuel source has been exhausted which is
usually when the organic components in a composite have been
completely degraded
It is common practice by fire scientists to quantify the intensity of a fire
by the radiant heat flux rather than flame temperature
Figure 14 The combustion cycle of organic polymers
The diverse range of uses for composite materials means they can be
exposed to a variety of fire threats and their increasing use in high fire
risk applications raises the likelihood of severe fire incidents Several
case studies of fires in aircraft and ships are given to demonstrate the
importance of understanding the fire behaviour of composites and the
need for more flame resistant polymeric materials
The fire behaviour of composites materials is distinct by two important
properties Fire reaction and Fire resistant
Fire reaction describes the flammability and combustion properties of
a material from ignition to flashover and also explains the smoke
toxicity of a combustible material The fire reaction properties that
influence fire growth are the heat release rate time to ignition flame
spread rate and oxygen index
Chapter 1 Introduction
7
The heat release rate (HRR) is a quantitative measure of the amount
of thermal energy released by a material per unit area when exposed to
a fire radiating a constant heat flux (or temperature) and his unit is
kWm2 The heat release rate value of a composite material is
determined by the thermal energy liberated in several thermo-chemical
decomposition processes with the most important being exothermic
combustion at the compositeflame boundary of flammable gas
products released by the decomposing polymer matrix and (if present)
organic fibres Two parameters describe the heat release rate average
HRR and peak HRR The average heat release rate is the averaged
value over a certain period of time (usually three or five minutes) The
peak heat release rate is the maximum amount of heat liberated by a
material during the combustion process and it often occurs over a very
short period of time (less than a few seconds) The peak heat release
rate is considered a critical property controlling the maximum
temperature and flame spread rate
Time to ignition (TTI) is the period that a combustible material can
withstand exposure to a constant radiant heat flux before igniting and
undergoing sustained flaming combustion
Flame spread rate describes the speed at which the flame front will
travel over the surface of a combustible material The flame spread rate
is an experimentally measured value and various experimental
techniques with important differences in test configuration are used
Some tests are used to measure the rate of flame spread in a downward
direction while other techniques measure it in a vertical or inclined
direction Consequently the value for flame spread rate is test-
dependent Oxygen index is defined as the minimum oxygen content in
the fire environment required to sustain flaming combustion of a
material Materials with high oxygen index values should be used in
high fire risk applications particularly for internal structures and
components because they offer the potential to self-extinguish when
the fire becomes deprived of oxygen
Chapter 1 Introduction
8
Two other important fire reaction properties are smoke density and gas
toxicity because they have a major impact on the ability of humans to
survive a fire Smoke density is defined and measured in several ways
but basically it is the concentration of smoke particles (eg soot water
vapour) within the plume of a fire Gas toxicity is a generic term that
describes the concentration and lethality of gas products within the
smoke plume
While many fire reaction properties are important in the development of
fire up to the point of flashover the fire resistant properties are critical
when the fire has fully developed
Fire resistance defines the ability of a material or structure to impede
the spread of fire and retain mechanical integrity In other words fire
resistance describes the ability of a construction to prevent a fire from
spreading from one room to neighbouring rooms Fire resistance also
describes the ability of a construction to retain structural integrity (ie
shape load-bearing properties) in a fire The main fire resistant
properties are heat insulation burn-through resistance and structural
integrity Heat insulation is simply the resistive property that describes
the rate of heat conduction through a material when exposed to fire
Obviously materials that are good heat insulators are best suited for
slowing the spread of fire from room-to-room and this is one of the
attributes of composites compared to metals Burn-through resistance
is the time taken for a flame to penetrate a material and emerge from
the opposing side Composites generally have better burn-through
resistance than metals that melt at temperatures below the flame
temperature such as aluminium alloys Mechanical integrity is
another important fire resistant property and this defines the ability of
a material or structure to retain mechanical properties such as
stiffness creep resistance and strength when exposed to fire and after
the fire has been extinguished The behaviour of composites materials
in fire is based by chemical and thermal decomposition of the matrix
used In figure 15 is showed the decomposition process of polymer
Chapter 1 Introduction
9
composites exposed to a heat flux radiated from a fire When the
material is exposed to a fire the matrix decomposes to volatile gases
solid carbonaceous char and smoke The volatiles consist of a variety of
vapours and gases both flammable as carbon monoxide methane low
molecular organics and non flammable as carbon dioxide and water
The flammable volatiles extend from composites material into the flame
zone where they react with oxygen and lead to the formation of the final
combustion products accompanied by the liberation of heat
Figure 15 The decomposition mechanisms of composites materials
Several analytical technique can be used to characterise the
decomposition reactions and the chemical nature of the reaction
volatiles of polymers The three important technique are TGA in which
the weight loss is measured with increasing temperature or time
differential scanning calorimetry (DSC) in which heat absorption or
evolution due to chemical changes of the polymer are measured and
gas chromatographymass spectrometry (GCMS) in which the
chemical composition of the volatile gases are determined Other
methods may also be used including thermal volatilisation analysis
(TVA) and differential thermal analysis (DTA) It is often necessary to
use a combination of methods to obtain a complete understanding of
the decomposition reaction rate reaction mechanisms volatile gases
and char yield
Chapter 1 Introduction
10
12 Fire test for composites materials
A large quantity of information is available on the fire reaction
properties of polymer composites and the level of fire hazard associated
with their use is known for a large number of materials We also have a
good understanding of the chemical thermal and physical mechanisms
that control reaction properties such as time-to-ignition heat release
rate flame spread rate smoke production and toxicity
In short we have quite a good quantitative understanding of the fire
reaction behavior of composites Unfortunately less is known about the
fire resisting properties such as burn-through resistance dimensional
stability and structural integrity especially when the structure is under
load Moreover it is not usually possible to estimate the fire resistive
behavior based solely on the known fire reaction properties A
composite that has good fire reaction properties such as low heat
release rate and smoke yield may not necessarily have good fire
resistive properties Composites with a polymer matrix having high
thermal stability decomposition temperature and char yield may not
necessarily have better fire resistive properties than more flammable
materials
The first fire test was developed in the early twentieth century and over
the last one hundred years a large number of tests have been used to
characterise the fire properties of combustible materials The number of
tests available to characterise fire reaction is now immense For
example the American Society for Testing and Materials (ASTM) have
over 80 fire test standards in the 1999 edition of their handbooks on
testing standards The standards are applicable to a wide range of
materials including building products woods plastics and other
combustible materials None of the ASTM fire standards are specific to
polymer composites but are instead generic to a wide range of
materials The ASTM is one of many international standardisation
organisations that publish fire test methods Not all of the tests of
Chapter 1 Introduction
11
course are relevant for testing composites many tests are only suitable
for evaluating building materials woods or some other type of
combustible material Only a relatively small number of tests are
suitable for determining the fire properties of composite materials or
structures
Experimental techniques used to measure the fire properties of
composites range in size from bench-top apparatus for testing small
specimens weighing only a few grams up to full-scale tests for large
structures
Regardless of scale it is important that fire reaction tests are performed
in conditions that closely replicate the type of fire to which the
composite will be exposed These fires range in heat flux from low
intensity fires were the radiant heat flux is under 20 kWm2 to intense
fires were the heat flux can exceed 150 kWm2
The range of test methods for determining the fire reaction and fire
resistive properties of composites is clearly very diverse although some
attempts are now being made to rationalize this situation The tests
vary in scale and complexity and considerable care must be exercised
when selecting the most appropriate procedure Most fire reaction
testing is performed using bench-scale apparatus because of the lower
cost and greater simplicity Test methods such as the cone calorimeter
OSU calorimeter and radiant flame spread technique have an excellent
track record and are widely used for determining the fire behaviour of
composites However the problem of scaling-up from small-scale test
results to fire performance of large structures in real fires is a major
difficulty
Problems common to bench-scale tests are that the ignition heating
and atmospheric (oxygen content) conditions are not representative of
an actual fire The growth and spread of fire cannot be accurately
replicated using these tests and it is usually not possible to achieve
flashover Further the specimens are rarely tested in the end-use
condition
Chapter 1 Introduction
12
Large-scale fire tests such as the room calorimeter avoid many of the
problems associated with small size and allow the composite article to
be tested in the end-use condition However large fire tests are
generally slow and expensive to perform and may only produce data
relevant to one particular situation [4]
It is also important to recognise that no single test method is adequate
to evaluate all the fire properties of a composite Table 11 lists the
properties that can be determined using the test methods Of these it is
those methods capable of determining the heat release rate that are
most important when characterising the fire reaction of composites
While a few methods have the capability to determine the heat release
rate together with several other properties it is necessary to use two or
more methods to obtain a complete understanding of the fire behaviour
of a composite material
Table 11 The decomposition Fire reaction properties measured using test methods
Chapter 1 Introduction
13
References [1] HIngason Two dimensional rack storage fires Proceedings of the
Fourth International Symposium on Fire Safety Science 19941209-
1220
[2] KS Mudan and PA Croce Fire hazard calculations for large open
hydrocarbon fires in SFPE Handbook of Fire Protection Engineering
ed PJ DiNenno et al 1995 2-13
[3] H Inganson and J de Ris Flame heat transfer in storage
geometries Journal of Fire Safety 1997
[4] Mouritz AP Gibson AG Fire Properties of Polymer Composite
Materials Springer
CHAPTER 2 MATERIALS
21 Thermosetting resin RTM6 Epoxy resins are used worldwide on a large scale for adhesive
lamination coating casting applications and contain a very large
number of chemical types All such resins rely on the reactivity of the
three member epoxy group at both ends of the molecule Other more
complex types of epoxy resins are employed when a higher level of
functionality is needed ie when a grater number of cross-linking points
per epoxy group (fig21) is required as for instance in some of the
higher performance resins used in aerospace Traditionally epoxy
resins are cured by reacting them with amines or anhydrides these
materials being known as ldquohardenersrdquo There are also catalysts that will
polymerise the resin via the end groups and hydroxyls without the need
for a hardener
Figure 21 Epoxy group
Many epoxy resins and hardeners are viscous or even solid at room
temperature and may require preheating or dilution to lower their
viscosity prior to processing into composites Further heating
sometimes to temperatures up to 150-180degC is often needed to promote
resin gelation and curing Nevertheless epoxies are used in all the
traditional composite processes including wet laminating resin
transfer moulding and filament winding Decomposition of most epoxies
occurs via random chain scission reactions over the temperature range
of about 380 to 450degC
Chapter 2 Materials
15
HexFlowreg RTM6 provided by Hexcel is a premixed monocomponent
epoxy resin system specially developed to fulfil the requirements of the
aerospace and space industry in advanced resin transfer moulding
processes (RTM) The expected service temperatures of final products
range from -60degC to 180degC At room temperature RTM6 is a transluced
paste and its viscosity drops very quickly upon heating The uncured
resin has a density of 1117 gcm3 and the fully cured resin 1141
gcm3 When fully cured it exhibits high glass transition temperatures
excellent hot wet properties and low moisture absorption According to
the manufacturer the shelf life of this resin at 23degC is at least 15 days
whereas at -18degC it is approximately 9 months [1]
The main advantage of this epoxy resin called RTM6 is that it is a
monocomponent system and is already degassed and its properties are
reported in table 21
Epoxy resin RTM6
Tg0 -11degC
Tginfin 190degC
Density uncured resin (gcm3) 111 at 25degC
Density cured resin (gcm3) 114 at 25degC
Table 21Properties of monocomponent epoxy resin
In figures 22 and 23 are reported the molecule from which RTM6
derives carbon glycidyl diamino-diphenyl-methane (TGDMM) and the
molecule-diamino-diphenyl sulfone (DDS) as agent crosslinker
Chapter 2 Materials
16
Figure 22 Formula of structure of TGDDM
Figure 23 Formula of structure of DDS
211 Characterization of RTM6
To define the parameters of resin process a preliminary screening by a
kinetic analysis by differential scanning calorimeter (DSC) is necessary
to understand the mechanisms with which the molecules inside the
composites are organized depending on the temperature variations In
figure 24 and 25 the kinetic analysis dynamical and isothermal of
epoxy resin RTM6 neat are reported
Chapter 2 Materials
17
-05
0
05
1
15
2
25
-100 0 100 200 300 400
10degCmin75degCmin5degCmin25degCmin1degCmin
Hea
t flo
w W
g
TemperaturedegC
Figure 24 Dynamic analysis of RTM6 neat
-01
0
01
02
03
04
05
06
07
0 50 100 150 200 250 300 350 400
120degC140degC160degC180degC190degC200degC
Hea
t flo
w W
g
Time min
Figure 25 Dynamic analysis of RTM6 neat
The dynamical analysis (fig24) show that the reticulation peak has a
maximum at the temperature 241degC and a energy amounted to 470Jg
From the data of the isotherm analysis (fig25) it is clear that curing for
90 minutes at 160degC results in a cross-linking of molecules equal to
Chapter 2 Materials
18
83 In addition to obtain a complete cross-linking there should be a
next step of treatment at a temperature greater than 160degC but that
does not exceed the value of glass transition temperature of 196degC
The choice of temperature for the second step of treatment was 180degC
because the isothermal measure carried out this value of temperature is
slow enough to allow the molecules to rearrange within the matrix
partially cured before completing the reaction
22 Micro materials Introduction on flame retardants Flame retardation is a process by which the normal degradation or
combustion of polymers is altered by addition of certain chemicals
Some plastics are inherently fire retardant or smoke retardant and their
fire performance is acceptable for certain applications However [2] for
many plastic materials it is necessary to improve their fire performance
by incorporating flame retardants
Flame retardants are chemical agents which are added to combustible
materials to make them more resistant to ignition and they are intended
to minimise the risk of a fire starting in case the contact with a small
heat source Hence the term ldquoflame retardantsrdquo describe a function and
not a chemical class and their aim is to break the cycle of self-
combustion of polymeric materials reducing the speed of chemical and
physical process that develop Often they are applied in combinations
and this variety of products is necessary because the materials are very
different in nature and composition
Flame retardants interfere with combustion processes during a
particular stage of this process during heating decomposition ignition
or flame spread and the amount of flame retardant one has to add to
achieve the desired level of fire safety can range from less than one
percent for highly effective flame retardants up to more than 50 percent
for inorganic fillers but typical ranges are 5 to 20 percent by weight
Chapter 2 Materials
19
Flame retardants acting by chemical and physical actions which are
divided into
bull Chemical action
1 Reaction in the gas phase The radical gas phase
combustion process is interrupted by flame retardant
resulting in cooling of the system reducing and eventually
suppressing the supply of flammable gases
2 Reaction in the solid phase (fig26) The flame retardant
builds up a char layer and shields the materials against
oxygen and provides a barrier against the heat source
(flame)
Figure 26 Reaction in the solid phase
bull Physical action (fig27)
1 Cooling Energy absorbing (endothermic) processes
triggered by additives and the chemical release of water cool
the substrate of material to a temperature below that
required for sustaining the combustion process
2 Formation of a protective layer (coating) The material is
protected with a solid or gaseous protective layer and
protected from heat and oxygen necessary for the
combustion process
3 Dilution Inert substances and additives evolving non-
combustible gases dilute the fuel in the solid and gaseous
phases
Chapter 2 Materials
20
Figure 27 Physical action of flame retardant
Flame retardants can be placed into the polymer material or by reacting
chemically with the polymer (reactive mode) or by mixing (additive
mode) or in both modes The choice of a flame retardant must be based
on the knowledge its toxicity action and its impact on environment The
main categories of flame retardants are based on compounds containing
(fig 28)
1 Halogens (Bromine and Chlorine)
2 Phosphorus
3 Nitrogen
4 Inorganic compounds Minerals (based on aluminium and
magnesium)
5 Borates and Stannates
6 Intumescent systems
Figure 28 Classes of flame retardant
Chapter 2 Materials
21
Flame retardants work in a number of different ways in fact some flame
retardant are effective on their own but other are used mainly as
ldquosynergistsrdquo acting to increase the effect of other types of flame
retardants Almost all flame retardants generate a stable carbonaceous
barrier called ldquocharrdquo which protects and at the same time cools the
surface of the material
Halogenated flame retardants when exposed to high temperatures
release bromine (Br) or chlorine (Cl) as free radicals (Br- or Cl- ) which
react with hydrocarbon molecules (flammable gases) to give HBr or HCl
These then react with the high-energy H+ and OH- radicals to give water
and the much lower energy Br- or Cl- radicals which are then available
to begin a new cycle of H+ and OH- radical removal They act by
effectively removing the H+ and OH- radicals in the gas flame phase thus
reducing heat generation and so the production of further gaseous
flammable materials
Phosphorus-containing flame retardants when heated reacts to give
a polymeric form of phosphoric acid This acid crates a glass layer (char)
on the surface of the material and inhibits the pyrolysis process which
is necessary to feed flames Char plays an important role in fact it acts
as a two-way barrier that both prevents the passage of the combustible
gases and shields the polymer from the heat of the flame
A wide range of different phosphorus based flame retardants is
available including elemental red phosphorus which is oxidised to
phosphoric acid with heat ammonium polyphosphate melamine
polyphosphate phosphonates phosphinates and phosphate esters
Nitrogen-containing flame retardant (pure melamine and derivates)
are believed to act by several mechanisms In fact in the condensed
phase melamine is transformed into cross-linked structures which
promotes char formation releasing ammonia In conjunction with
phosphorus the nitrogen appears to enhance the attachment of the
phosphorus to the polymer A mechanism in the gas phase may be the
Chapter 2 Materials
22
release of molecular nitrogen which dilutes the volatile polymer
decomposition products
Antimony trioxide does not have flame retarding properties of its own
but is an effective synergist for halogenated flame retardants It acts as
a catalyst facilitating the breakdown of halogenated flame retardants
into active molecules It also reacts with the halogens to produce
volatile antimony halogen compounds which are themselves directly
effective in removing the high energy H+ and OH- radicals which feed
the flame phase of the fire thus reinforcing the flame suppressing effect
of the halogenated flame retardants When added to PVC antimony
trioxide acts to suppress flames by activating the chlorine present in the
plastic itself
Inorganic compounds are used as flame retardants interfering through
various physical processes with the burning process release of water or
non-flammable gases which dilute the gases feeding flames absorption
of heat energy thus cooling the fire production of a non-flammable and
resistant layer on the surface of material (char) These mechanisms of
inorganic compounds are however of a relatively low efficiency and the
products have to often be used in large concentrations or more usually
in combination with other types of flame retardants
Boron containing compounds act through the stepwise release of
water and the formation of a glassy coating protecting the surface Zinc
borate in halogen-free systems is normally used in conjunction with
aluminium trihydrate magnesium hydroxide or red phosphorus Zinc
stannate and zinc hydroxystannate are used to reduce smoke emission
from PVC to promote charring or as synergists to increase the
effectiveness of halogenated or nitrogen flame retardants
Finally intumescent coatings are fire protection systems which are
used to protect materials such as wood or plastic from fire but also to
protect steel and other materials from the high temperatures of fire The
coatings are made of a combination of products applied to the surface
Chapter 2 Materials
23
like a paint which are designed to expand to form an insulating and
fire-resistant covering when subject to heat
221 Zinc Borate
Zinc borate ZB (2ZnO 3B2O3 35H2O) is a multifunctional flame
retardant which can function as a flame retardant in synergy with
halogen smoke suppressant because promote char formation and
afterglow suppressant It is a synergist of chlorine and bromine-
containing flame retardants or polymers Its efficacy depends on the
type of halogen source (aliphatic versus aromatic) and the base polymer
used The zinc borate can generally display synergistic effects with
antimony oxide in fire retardancy This synergy [3] can be more
remarkable when used in conjunction with aluminium trihydrate (ATH)
or magnesium hydroxide (MDH)
Zinc borate decomposition has been studied by thermogravimetric
analyses TGA reported in figure 29 and its decomposition temperature
is about 436degC
Figure 29 TGA and DTG in nitrogen of zinc borate
Zinc borate works as an antitracking agent in both halogen-containing
and halogen-free polymers in different ways
In halogen-containing polymers
Chapter 2 Materials
24
bull Zinc borate possesses a synergistic effect with halogen sources
bull Zinc borate display synergistic effects with antimony oxide in fire
retardancy In the presence of ATH or MDH this synergy can be
augmented significantly
bull In some polymer systems zinc borate can completely replace
antimony oxide
bull In contrast to antimony oxide zinc borate is predominant in the
condensed phase and can work as a smoke suppressant
bull Zinc borate promotes char formation and prevents burning drips
The zinc oxide moiety can promote char formation with halogen
sources and B2O3 moiety can stabilize the char
bull Zinc borate can improve the thermal stability of polyamides
containing halogenantimony trioxide and improve the aged
elongation property of polyolefin
bull Improves corrosion resistance
In halogen-free polymers
bull Zinc borate are multifunctional fire retardants in halogen-free
polymers
bull When used in combination with metal hydroxides zinc borate can
work as a sintering aid to promote the formation of a strong
charceramic residue that can act as an insulator for underlying
polymer
bull Zinc borate can reduce the heat release rate smoke evolution
carbon monoxide generation and afterglow combustion
bull The use of a co-additive such as the siliconesilica melamine
polyphosphate talc or red phosphorous can increase the fire test
performance of zinc boratemetal hydroxide combination
bull Zinc borate alone can work as a flame retardant in certain
halogen-free systems
Chapter 2 Materials
25
Zinc borate used is produced by Joseph Storey amp Company LTD and its
name is Storflam ZB 2335 and its physical and chemical properties are
reported in table 22 [4]
Zinc Borate ZB
Appearance Power dust
Colour White
Molecular weight 43464
Bulk density (Kgm3) 400-700
Soluble in Acids and Bases
Solubility value (g100g
H2O20degC)
lt1
pH 7-8 (aqueous filtrate of 20
suspension)
Table 22Physical and chemical properties of zinc borate
222 Aluminium trihydrate
Aluminium trihydrate ATH (2Al(OH)3) is the most widely used flame
retardant It is an inert mineral filler a non-toxic white crystalline
powder and is included in the inorganic flame retardants It acts with
all three of mechanisms indicated in the figure 210 At around 300degC
(fig211) it is decomposed to aluminium oxide which forms a
protective non-flammable layer on the material surface and water
Chapter 2 Materials
26
Figure 210 Mechanism of Aluminium trihydrate ATH
Figure 211 TGA and DTG in nitrogen of aluminium trihydrate
Water forms a layer of non-flammable gas near the materialrsquos surface
inhibiting flames The reaction is endothermic it absorbs heat thus
cooling the material and slowing burning The water vapour produced
during ATH decomposition dilutes both the combustible gases and
oxygen in the vicinity of the flame making combustion more difficult
For smoke suppression the heat dissipation by the ATH is thought to
Chapter 2 Materials
27
aid in forming char rather than forming smoke by favouring
crosslinking reactions over soot formation The char provides a fuel-
oxygen barrier on the surface of the burning polymer
Aluminium trihydrate used in this work is produced by Dadco and
provided by Joseph Storey amp Company LTD [4] and its physical and
chemical properties are reported in table 23
Aluminium trihydrate ATH
LOI (110degC-1100degC) () 346
Specific gravity (gcm3) 24
Whiteness () gt 91
Bulk density (Kgm3) 500-700
Medium grain size diameter (μm) 40-75
Boiling point (degC) 2700 (Al2O3 decomposition
product)
Density at 20degC (gml) 242
Table 23Physical and chemical properties of aluminium trihydrate
223 Zinc Hydroxystannate
Zinc hydroxystannate ZHS (ZnSn(OH)6) is a fire retardant and a smoke
suppressant additive for polymeric materials [5] It was developed as a
smoke suppressant for PVC but later it was found that it also acts as a
flame retardant in certain plastics mainly by promoting char formation
and can usually partly substitute antimony trioxide Recent studies to
develop flame retardants formation have used inorganic tin compounds
such as zinc hydroxystannate because it is less toxic [2] The physical
and chemical properties of ZHS are reported in table 24 and it is
provided by Joseph Storey amp Company LTD [4] and its decomposition
temperature (225degC) is reported in figure 212
Chapter 2 Materials
28
Zinc Hydroxystannate
Physical state Power
Colour White
Bulk density (Kgm3) 400-500
Soluble in Strong Acids and Bases
Solubility in water ( in weight) 0003
pH 7
Table 24Physical and chemical properties of zinc hydroxystannate
Figure 212 TGA and DTG in nitrogen of zinc hydroxystannate
224 Zinc Stannate
Zinc stannate ZS (ZnSnO3) has excellent flame retardant and smoke
suppressant properties and its advantage as zinc hydroxystannate is
that it is less toxic than antimony compounds In fact ZS and ZHS are
used instead of antimony trioxide because they are less toxic [6] Zinc
stannate as zinc hydroxystannate is provided by Joseph Storey amp
Company LTD [4] and its properties are listed in table 25 and in figure
213
Chapter 2 Materials
29
Zinc Stannate
Appearance Power dust
Colour White
Bulk density (Kgm3) 400-500
Soluble in Strong Acids and Bases
Solubility value (g100g
H2O20degC) 0003
pH 7
Molecular weight 23207
Table 25Physical and chemical properties of zinc stannate
Figure 213 TGA in nitrogen of zinc hydroxystannate
Zinc hydroxystannate shows several degradation steps and different
decomposition temperatures hence its DTG is not reported
23 Nano materials Introduction on carbon nanotubes
The discovery of carbon nanotubes can be traced back to the origin of
fullerene chemistry (buckyball C60) in 1985 [7] Fullerenes have
provided an exciting new insight into carbon nanostructures built from
sp2 carbon units based on geometric architectures In 1991 Iijima [8]
Chapter 2 Materials
30
discovered carbon nanotubes (CNTs) that are elongated fullerenes where
the walls of the tubes are hexagonal carbon and often capped at each
end The nanotube is typically closed at each end by hemispherical caps
that are constituted by at least 12 pentagons According to the Euler
theorem [9] which relates the number of vertices edges and faces a
convex structure can be created by introducing a positive curvature
and therefore pentagons to close up the hexagonal lattice of the tube
(fig214)
Figure 214 Schematic of the nanotube formation
Due to the hexagonal symmetry of the carbon atoms in the graphitic
sheet different structural isomers are possible depending on how the
planar graphite sheet is folded The rolling up can be accomplished in
several different ways requiring only the matching of the dangling bonds
at each end However the nanotubes can present a different helicity
degree with respect to the tube axis Figure 215 shows the three
different possible nanotubes armchair zig zag and chiral
Figure 215 Schematic of the three different nanotubes structure
Chapter 2 Materials
31
The characteristic of helicity in nanotubes has a great relevance
affecting the physical properties that depend also on the tube diameter
[10] For example it has been shown that all the armchair tubes are
metallic whereas the zig zag and chiral tubes are either metallic or
semiconducting
The nanotubes can exist in two forms multi-walled and single-layer
(fig216) The multi-wall carbon nanotubes were the first to be
discovered They consist of concentric cylinders placed around a
common central hollow area with a constant separation between the
layers close to the graphite interlayer spacing (034 nm) Each
individual cylinder can be characterized by a different helicity and has
diameter ranging from 2 to 25 nm and length of several microns
Figure 216 Single walled and multi walled carbon nanotubes
The single walled nanotubes were synthesized in 1993 when it was
found that the addition of metals such as cobalt to the graphite
electrodes in the arc evaporation method resulted in tubes with single
layer walls [11] A single walled nanotube is close to an ideal fullerene
fiber and consists of a single layer cylinder extending from end to end
with a narrow distribution in diameter range (1-2 nm) When produced
in vapour phase the single wall nanotube can self-assemble into larger
bundles called ropes consisting of several tens of nanotubes arranged
in a one-dimensional triangular lattice It is important to observe that
the discovery of single wall tubes has been very significant allowing
Chapter 2 Materials
32
researchers to verify and test some of the theoretical predictions about
the nanotube properties
Due to the combination of size structure and topology the nanotubes
display remarkable features In particular the graphitic nature of the
nanotube lattice contributes to provide high conductivity high strength
and stiffness chemical specificity and inertness while the lattice
helicity and elasticity provide optimal electronic properties Further the
nanoscale size and the high aspect ratio are advantageous for many
applications that require large surface area to volume ratio However
due to the their very small size and often presence of defects
mechanical property characterization is a challenge Nevertheless it is
possible to imagine that their stiffness and strength are very high if one
uses graphite as reference The in-plane elastic modulus of graphite is
estimated to be 106 TPa (1061012 Pa) and the tensile stiffness as 08
TPa due to the very strong covalent C-C bonds in the plane [10]
The elastic properties evaluation of carbon nanotube has been
performed by
bull measuring their thermal vibration amplitudes
bull atomic force microscopy measurement during bending
The first technique provided the Youngrsquos modulus equal to 18 TPa
while a modulus close to 1 TPa has been determined by the second
method Further the maximum tensile strength has been determined
close to 30 GPa (30109Pa) [8] Many other observations have shown
that carbon nanotubes have other intriguing properties such as
bull high flexibility related to the ability of the carbon atoms to
rehybridize with the degree of rehybridization depending on the
strain
bull high capability to sustain strain in tension (40) without
brittleness plastic deformation or bond rupture
These features make the carbon nanotubes ideal candidates for
reinforcing fibers in polymer-based composites In particular due to
Chapter 2 Materials
33
their ability to sustain high deformations they have a significant
advantage over carbon fibers in composites for structural and strength
applications However the effective reinforcement action due to the
nanotubes hinges on the success of the preparation techniques and
stable dispersion of the nanotubes in the polymer matrix In most
cases since the nanotubes have many entanglements it is a challenge
and an unresolved issue to disperse them effectively with polymer
systems to make strong and stiff components
Carbon nanotubes have extraordinary properties that have attracted the
attention of several researchers from diverse fields Substantial effort
has been devoted to the experimental evaluation and theoretical
calculation of their physical electronic magnetic electrical and
mechanical properties
Because of their promising physical and mechanical properties the
most common commercial application of carbon nanotubes is based on
their use as filler elements for metals ceramic or polymers matrix In
particular carbon nanotubes may exhibit characteristics that can be
beneficial For example they can be used as
bull reinforcement of polymer based composite materials which
improve structural properties
bull polymer modifiers for high temperature uses
bull conductive filler in insulating polymer matrices to provide
electrostatic discharge and electromagnetic-radio frequency
interference protection
bull doping of conjugated luminescent polymers to produce active
materials for electronic applications
The use of carbon nanotubes as reinforcing systems of polymer matrix
would offer several advantages over the conventional reinforcements
including continuous and short fibers (glass carbon) In the case of
continuous fibers reinforcements the advanced composite material has
much higher mechanical properties in the direction parallel to the fibers
Chapter 2 Materials
34
or in the plane of the lamina than in the transverse direction
Furthermore since the conventional polymer processing equipment
cannot process the long continuous fibers their use is limited to simple
shapes and limited production On the other hand itrsquos established that
the fiber aspect ratio represents the critical factor affecting the resulting
structural properties of short fiber composites As the aspect ratio
increases the composite stiffness and strength increase However the
packing of short fibers in a polymer matrix is a percolation
phenomenon so the maximum packing decreases with increasing
aspect ratio (see figure 16) and may not be sufficient to manufacture a
very strong material [12]
Dispersion process of carbon nanotubes represents a very complex
phenomenon due to their natural tendency to bundle together due to
van der Walls interactions A non uniform dispersion can lead to many
defect sites and reach resin area limiting not only the efficiency of CNTs
as reinforcement filler for the polymer composite matrix [13-18] A good
dispersion and possibly the alignment of CNTs within a matrix is still a
challenge and it could play the main factor driving the diffusion of CNT
or MWCNT as nano-reinforcement on industrial scale [1718] in fact are
used several dispersion technique to separate the agglomerates into
individual nanotubes
Carbon nanotubes are another candidate as a FR additive because of
their highly elongated shape (high aspect ratio) The in situ formation of
a continuous network structured protective layer from the tubes is
critical for significant reduction in heat release rate because the layer
thus acts as a thermal shield from energy feedback from the flame [19]
231 Multi walled carbon nanotubes Nanocyl 7000
The multi walled carbon nanotubes used in this word are provided by
Nanocyl SA (Belgium) and are denominated Nanocyl 7000 This multi
walled carbon nanotubes are produced via the catalytic carbon vapour
deposition (ccvd) process Nanotubes exit the reactor with a purity of
Chapter 2 Materials
35
90 carbon to produce the 7000 grade [20] Its properties are reported
in table 26
Multi-walled carbon nanotubes (MWNTs)
Average diameter 10 nm
Length 01-10 μm
Carbon Purity 90
Table 26Properties of MWNT
Chapter 2 Materials
36
References [1] wwwhexcelcomHexFlowRTM6pdf
[2] Petsom A Roengsumran S Ariyaphattanakul A Sangvanich P
Polym Degrad Stab 2003(80)17-22
[3] Shen KK Kochesfahani S Jouffret F PolymAdvTechnol 2008
(19)469-474
[4] Data sheet provided by Joseph Storey amp Company LTD
[5] Hornsby PR Cusack PA Cross M Toth A Zelei B Marosi G
Journal of materials science 2003 (38)2893-2899
[6] Cusack PA Heer MS Monk AW Polymer Degradation and Stability
1997 (58)229-237
[7] Kroto HW Heath JR OrsquoBrien SC Curl RF Smalley RE Nature
1985 318 162
[8] Iijima S Nature 1991 354 56
[9] Ebbesen WT Physics Today 1996 26-32
[10] Ajayan PM Chem Rev 1999 (99)1787-1799
[11] Ebbesen WTCRC 1997
[12] Calvert P Nature 1999 (399)210-211
[13] Qian D Dickey EC Andrews R Rantell T Appl Phys Lett 2000
76 (20)2868-2870
[14] Park C et al Chemical Physical Letters 2002 (364)303-308
[15] Ham HT Choi YS Chung JI Journal of Col and Inter Science
2005 286 (1)216-223
[16] Salvetat JP Briggs AD Bonard JM Bacsa RR Kulik AJ Stockli
T Burnham NA Forroacute L Phys Rev Lett 1999 82 (5)944-947
[17] Jin L Bower C Zhou O Appl Phys Lett 1998 73 (9)1197-1199
[18] Choi ES Brooks JS Eaton DL Al-Haik MS Hussaini MY
Garmestani H Li D Dahmen KJ Appl Phys 2003 (94)5451-5473
[19] Kashiwagi T Du F Winey KI Groth KM Shields JR Bellayer
SP Kim H Douglas JF Polymer 2005 (46)471-481
[20] Data sheet provided by Nanocyl SA
CHAPTER 3 EXPERIMENTAL TECHNIQUES
31 Methods 311 Micro particles Mechanical stirring
The flame retardant composites were prepared by mixing the epoxy
resin RTM6 with zinc borate aluminium trihydrate zinc stannate and
zinc hydroxystannate at different percentage (5 wt 10 wt 20 wt
30 wt 40 wt) The mixing was made by using a Heidolph RZR
mechanical stirring equipment (fig 31) The additives were included
into the matrix at 400 rpm to avoid disperse the additive on the walls of
beaker [1]
Figure 31 Heidolph RZR mechanical stirring
Afterwards the mixing was continued for 10 minutes at 1050 rpm and
10 minutes at 2000 rpm and then the mixture were degassed for 30
minutes at 90degC in a vacuum oven to eliminate entrapped air and
humidity Finally the liquid system was poured in mould and cured at
160degC and 180degC respectively for 90 mins and 120 mins according to
the curing schedule sheet of the neat epoxy resin
Chapter 3 Experimental Techniques
38
The quality of dispersion of all additives into the epoxy resin after the
mixing process was observed by Scanning Electron Microscope (1450VP
LEO)
For example the SEM micrograph of zinc borate 20 wt is reported
where the dust of zinc borate (fig 32) is well dispersed into the epoxy
matrix and it maintains its original grain size Analogous behaviour is
noticed for the aluminium trihydrate zinc stannate and zinc
hydroxystannate (fig 33)
Figure 32 Scanning electron micrograph of zinc borate dust
Figure 33 Scanning electron micrograph of the composite of RTM6 and ZB 20wt
312 Nano particles Sonication
The nanocomposites were prepared by using sonication process (fig
34) for a constant time (1 hour) at temperature of 120degC with the
Chapter 3 Experimental Techniques
39
MWNTs content of 01 fraction by weight We selected this process
and this percentage of carbon nanotubes by previous studies and
experimental analysis that we conducted [2] All the obtained samples
were then degassed in vacuum oven at 90degC for 30 min and then cured
considering an identical temperature cycle (1 h at 160degC followed by 2 h
at 180degC) according to the specified curing schedule
Figure 34 Misonix Sonicator S3000
The SEM micrograph of fracture surface of multi walled carbon
nanotubes into the epoxy resin was obtained by fragile failure of
nitrogen cooled samples and this surface is reported in figure 35 at
different level of magnitude
Figure 35 SEM images of fracture surface of specimen taken at different magnitudes
(1 μm-300 nm)
Chapter 3 Experimental Techniques
40
The nanotubes reported in figure 35 are present and well separated
each other showing a good level of adhesion with the matrix in fact it
appears a satisfactory uniformity of single or agglomerated of nanotube
313 Vacuum infusion process
The vacuum infusion process (VIP) is a technique that uses vacuum
pressure to drive resin into a laminate Materials are laid dry into the
mould and the vacuum is applied before resin is introduced One a
complete vacuum is achieved resin is literally sucked into the laminate
via carefully placed tubing This process is aided by an assortment of
supplies and materials Vacuum infusion provides a number of
improvements over traditionally vacuum bagged parts These benefits
include
bull Better fiber-to-resin ratio
bull Less wasted resin
bull Very consistent resin usage
bull Unlimited set-up time
bull Cleaner
The samples were obtained by a preform of 8 plies of overlaid
unidirectional carbon fibres at zero degrees We chose 20x20cm
samples
Operations to prepare the samples are
1 Cleaning mould with acetone
2 Application of realising agent to make the mould hydrophobic
The realising agent used in this work is LOCTITEreg FREWAX
FREKOTEreg and adheres to the surface of the mould creating a
barrier between materials and mould
3 Application of sealing tape GS AT200Y This tape is softened by
temperature so to enable the perfect adherence of the bag to the
plate while maintaining the vacuum (figs 36a)-b))
Chapter 3 Experimental Techniques
41
Figures 36 Application of sealing tape a) and position of carbon plies b)
4 Application of ldquopeel plyrdquo under and over the carbon fibres plies to
avoid damage to the composite surface in the successive phases
(fig 37) The peel ply used in this work is RELEASE EASE
234TFP and it is provided by Airtech It is also placed on the
aspiration pipe because it allows to keep the vacuum
Figures 37 Application of ldquopeel plyrdquo
5 Application of ldquobreather and bleederrdquo provided by Airtech It is the
AIRWEAVEreg Super and it is useful to ensure the vacuum
distribution When the panels of epoxy resin are micro and nano
additived the breatherbleeder is placed only beside the carbon
Chapter 3 Experimental Techniques
42
fibres plies because it doesnrsquot absorb the additives but it
guarantees the vacuum distribution (fig 38)
Figures 38 Application of ldquobreatherbleederrdquo
6 Application of ldquonetworkrdquo (fig 39) to facilitate the advancement of
the resin flow in the mould
Figures 39 Application of ldquonetworkrdquo
7 Application of a vacuum bag (figs 310a)-b)) that is sealed by
sealing tape
Chapter 3 Experimental Techniques
43
Figures 310 Application of vacuum bag a) and creation of vacuum b)
At the end the vacuum is applied and a compaction of the different
layers is obtained (fig 310b)) and the breather allows the vacuum to
spread throughout the mould
32 Characterization 321 Cone Calorimeter
The cone calorimeter has become one of the most important and widely
used instruments for the research and development of fire retarded
polymeric materials The cone calorimeter is a performance-based
bench scale fire testing apparatus [3-7]
The cone calorimeter provides comprehensive insight into not only fire
risks such as heat release rate total heat release and time to ignition
but also fire hazards such as smoke release and CO production Cone
calorimeter investigations can be used as a universal approach to
ranking and comparing the fire behaviour of materials
However each experimental setup defines a specific fire scenario As is
typical for all fire tests samplesrsquo performance in the cone calorimeter
depends on the specific characteristics of the test including ignition
source ventilation irradiance (external heat flux) temperature and the
geometry of the specimen
Chapter 3 Experimental Techniques
44
The cone calorimeter test characterizes the performance resulting from
an interaction of material properties specimen and the defined fire
scenario
Lower external heat fluxes such as below 20 kWm2 target ignition and
flammability whereas higher external heat flux such as 50 kWm2
target flame spread and combustion properties The relevant and active
mechanisms can change significantly Hence the external heat flux
influences the conclusions implied by the cone calorimeter studies The
frequently used irradiances of 35 kWm2 or even 50 kWm2 deliver
reproducible results for forced flaming conditions with respect to flame
spread and combustion properties (fig 311)
Figure 311 Schematic diagram of the cone calorimeter
The main capability of the instrument is that the heat release response
of a burning material can be measured continuously to a high degree of
accuracy and values for peak and average heat release rate can be
determined The technique can also be used to measure time to ignition
time of sustained flaming effective heat of combustion smoke density
soot yield mass loss rate and yield of CO CO2 and other combustion
Chapter 3 Experimental Techniques
45
gases The only fire reaction property that cannot be directly determined
is the flame spread rate
Specimens tested within the cone calorimeter are flat plates that are
100mm long 100mm wide and up to 50mm thick The specimen is
placed inside a sample holder lined with a low-density refractory
material to minimise heat losses from the unexposed face It is also
necessary to insulate the specimen sides to minimise edge burning
which can give an artificially high heat release rate The sides of
composite specimens should also be sealed and insulated to avoid the
escape of volatile gases from the edges which can also affect the fire
reaction properties During fire testing the mass loss of the specimen is
recorded continuously using a load cell located beneath the sample
holder
The top surface of the specimen is positioned 25mm from the cone
heater (fig312)
Figure 312 Positioning of the sample
A spark igniter may be placed mid-way between the sample and heater
and is used to ignite combustible gases released from the thermally
decomposing material when the concentration reaches the critical level
needed to sustain flaming Most fire tests on composites are performed
Chapter 3 Experimental Techniques
46
using the igniters although it is possible not to use the igniters to study
the effect of auto-ignition on the reaction properties
During fire testing (fig313) a constant flow rate of air at 24 litres per
second is maintained in the heating chamber
This air flow rate is needed to force all the gaseous combustion
products released by the burning specimen up through the orifice of the
cone heater and into the gas exhaust system above the heating
chamber As the entrained air and combustion products enter the
exhaust system they are thoroughly mixed to avoid stratification of the
gases that can cause inaccurate heat release smoke or toxic gas
measurements
Figure 313 Burning of sample
In this work the combustion tests [8] according to ASTM E 1354-04
are carried out with irradiance of 50 kWm2 for samples of a thickness
between 6-8mm and size 100times100mm using the cone calorimeter
produced by Fire Testing Technology Ldt (fig 314)
Chapter 3 Experimental Techniques
47
Figure 314 Cone calorimeter provided by Fire Testing Technology Ldt
The information provided by cone calorimeter are
bull Time to ignition (TTI) which corresponds to the period that a
combustible material can withstand when exposed to a constant
radiant heat flux before igniting and undergoing sustained
flaming combustion
bull Mass lost different between the initial and final mass of the
sample
bull Heat Release Rate peak (pHRR) average (HRR avarage) and Time
To Peak (TTP) are a quantitative measure of the amount of
thermal energy released by a material per unit area when exposed
to a fire radiating at constant heat flux (or temperature)
bull Mean COCO2 Yield the average return of CO and CO2 related to
the mass of the sample
bull Total Heat Evolved (THR)
bull Total Smoke Released (TSR)
322 Scanning Electron Microscope
The Scanning Electron Microscope (SEM) is a microscope that uses
electrons rather than light to form an image (fig 315) The SEM has a
large depth of field which allows a large amount of the sample to be in
focus at one time The SEM also produces images of high resolution
Chapter 3 Experimental Techniques
48
which means that closely spaced features can be examined at a high
magnification The combination of higher magnification larger depth of
focus greater resolution and ease of sample observation makes the
SEM one of the most heavily used instruments in research areas today
The SEM is designed for direct studying of the surfaces of solid objects
By scanning with an electron beam that has been generated and
focused by the operation of the microscope an image is formed in much
the same way as a TV The SEM allows a greater depth of focus than the
optical microscope For this reason the SEM can produce an image that
is a good representation of the three-dimensional sample
The SEM uses electrons instead of light to form an image A beam of
electrons is produced at the top of the microscope by heating of a
metallic filament The electron beam follows a vertical path through the
column of the microscope It makes its way through electromagnetic
lenses which focus and direct the beam down towards the sample Once
it hits the sample other electrons (backscattered or secondary) are
ejected from the sample Detectors collect the secondary or
backscattered electrons and convert them to a signal that is sent to a
viewing screen similar to the one in an ordinary television producing an
image
Figure 315 Scanning Electron Microscope
Chapter 3 Experimental Techniques
49
When a SEM is used the column and sample must always be at
vacuum A vacuum environment means that most of the air molecules
have been removed from the inside of the microscope
Since the SEM uses electrons to produce an image most conventional
SEMs require that the samples be electrically conductive The sputter
coater uses argon gas and a small electric field The sample is placed in
a small chamber which is at vacuum Argon gas is then introduced and
an electric field is used to cause an electron to be removed from the
argon atoms to make the atoms ions with a positive charge The Ar ions
are then attracted to a negatively charged piece of gold foil The Ar ions
act like sand in a sandblaster knocking gold atoms from the surface of
the foil These gold atoms now settle onto the surface of the sample
producing a gold coating
323 Thermo mechanical analysis
Thermo mechanical analysis (TMA) is a well-known technique [9] that
measures linear or volumetric changes as a function of time
temperature and force TMA is the measurement of materials behaviour
expansion and or contraction as a function of an applied load or
temperature A scan of dimensional changes related to time or load
provides invaluable information about the samples mechanical
properties Most analyses are presented in the form of the coefficient of
thermal expansion
dL(dTL0)=CTE (coefficient of thermal expansion)
where dL is the change in length (microm) dT is the change in temperature
(degC) and L0 is the initial length (m) Thermo mechanical analysis were
conducted using a TMA-60WS (fig316) provided by SHIMADZU
We measured the CTE of epoxy resin with additives and panels obtained
by using VIP with a force of 003N from 25degC to 250degC at 3degCmin in
Chapter 3 Experimental Techniques
50
double scan and expansion mode The sample measure 3x3x15mm in
accordance to ASTM E831-06
Figure 316 TMA-60WS
324 Thermal gravimetric analysis
Thermogravimetric analysis (TGA) (fig317) is an analytical technique
used to determine the thermal stability of a material and its fraction of
volatile components by monitoring the weight change that occurs when
a specimen is heated The measurement is normally carried out in air or
in an inert atmosphere and the weight loss is recorded as a function of
increasing temperature
Analysis of the TGA curves and DTG signals reports two temperature
bull The onset temperature (Tonset) calculated from the TGA curves by
extrapolating from the curve at the peak of degradation back to
the initial weight of the polymer
bull The temperature maximum (Tmax) calculated from the DTG curves
by extrapolating from the curve at the peak of degradation
forward to the final weight of the polymer
Chapter 3 Experimental Techniques
51
Figure 317 TGA 2920 TA Instruments
Differential thermal analysis was carried out using a TGA 2950 by TA
Instruments [10] All measurements were conducted under air or inert
atmosphere with a sample weight of about 7-8mg for each test the
heating rate was 5 75 10 and 20degCmin and the test temperature
ranged from 30degC to 800degC
Chapter 3 Experimental Techniques
52
References [1] wwwheidolphit
[2] Formicola C Martone A Zarrelli M Giordano M Dispersion of
carbon nanotubes in a monocomponent epoxy system 2008 proceeding
of AIDC workshop
[3] Schartel B Bartholmai M Knoll Some comments on the use of
cone calorimeter data Polym Degrad Stab 2005 (88)540ndash547
[4] Schartel B Hull TR Development of fire-retarded materials-
Interpretation of cone calorimeter data Fire and materials 2007
(31)327ndash354
[5] Fire Testing Technology Userrsquos Guide for the Cone Calorimeter
February 2000
[6] Grant GB Quick operation procedure for the cone calorimeter Unit
of fire safety engineering Edinburgh University 2nd edition January
1993
[7] Babrauskas V and Grayson SJ Heat Release in Fires Elsevier
Applied Science 1992
[8] Committee E0521 on Smoke Combustion Products ASTM 1354-03
Standard test methods for heat and visible smoke release for materials
and products using an oxygen consumption calorimeter ASTM 10
February 2003
[9] wwwshimadzuit
[10] wwwtainstrumentscom
CHAPTER 4 FLAME RETARDANT OF EPOXY RESIN WITH
INORGANIC COMPOUNDS
41 The state of the art on flame retardant of inorganic
compounds Flame retardants are chemical agents which are added to combustible
materials to make them more resistant to ignition and they are intended
to minimise the risk of a fire starting in case of contact with a small
heat source
Inorganic flame retardant as zinc borate aluminium trihydrate zinc
stannate and zinc hydroxystannate are used in this study because they
have shown very low toxicity they are compatible with a variety of flame
retardants while acting as smoke suppressants for various polymer
systems Synergistic effects are envisaged when these smoke
suppressants are combined with conventional flame retardants andor
nanoclays Recent studies to develop flame retardants formation have
used inorganic compounds because they have less toxicity Bourbigot et
al [1] demonstrated that zinc borates are useful synergistic agents in
Ethylene vinyl acetate EVA and aluminium trihydrate ATH and
magnesium hydroxide Mg(OH)2 formulations and that they act as smoke
suppressant Moreover they demonstrated that zinc borate develops a
vitreous protective residual layer which reduces the combustion rate
Carpentier et al [2] studied the synergistic effect of zinc borate on EVA8
filled with magnesium hydroxide (MH) by LOI cone calorimeter and
TGA Solid-state NMR was employed to study the carbon in the residues
collected after thermal treatment It is suggested that zinc borate slows
the degradation of the polymer and creates a vitreous protective
Chapter 4 Flame retardant of epoxy resin with inorganic compounds
54
residual layer which could act as a physical barrier and a glassy cage
for polyethylene chains
Wu et al [3] studied the synergistic flame retarding effect of ultrafine
zinc borate on LDPEIFR based on LOI UL94 test and cone calorimeter
and established that the flame retardancy is improved when
incorporating zinc borate to LDPEIFR system in fact HRR THR and
mass loss is reduced significantly
Petsom et al [4] described a study on zinc hydroxystannate and zinc
stannate in combination with 12 bis-tribromophenoxy ethane (BTBPE)
to increase flame retardancy and reduce smoke emission in an
acrylonitrile-butadiene-styrene (ABS) copolymer They concluded that
the combination of tin compounds and BTBPE was found more effective
as flame retardant than the individual components when used alone
Cusak et al [5] found that zinc hydroxystannate is a good synergist
alternative to antimony trioxide particularly with regard to reducing
heat release rates and smoke generation They demonstrated that ZHS
is the best alternative synergist to Sb2O3 in halogen-containing
polyester resins
Ning et al [6] studied the effects of zinc borate aluminium trihydrate
and their mixture on the flame retardant and smoke suppressant
properties of polyvinyl chloride PVC as well as their mechanism for
flame retardancy and smoke suppression They concluded that ZB and
ZB-ATH reduced the activation energy of PVC and their mixture had a
good synergistic effect on the flame retardance and smoke suppression
of PVC
Itrsquos clear that different authors [1-11] analyzed the fire and smoke
behaviour of zinc borate zinc stannate aluminium trihydrate zinc
hydroxystannate and their synergist effect in thermoplastic matrix or in
thermosetting bi-component matrix
Chapter 4 Flame retardant of epoxy resin with inorganic compounds
55
42 Cone calorimeter test Cone calorimeter represents a small-scale testing configuration which
provides important correlating parameters with real fire scenario data
obtained from cone calorimeter can provide plentiful information on fire
scenario material behaviour [12]
The values provided by cone calorimeter are mainly Time To Ignition
(TTI) which corresponds to the period that a combustible material can
withstand when exposure to a constant radiant heat flux before igniting
and undergoing sustained flaming combustion Heat Release Rate peak
(pHRR) average (HRRavarage) and Time To Peak (TTP) are a
quantitative measure of the amount of thermal energy released by a
material per unit area when exposed to a fire radiating at constant heat
flux (or temperature) Total Heat Evolved (THR) Total Smoke Released
(TSR)
Cone calorimeter tests were performed using a Fire Testing Technology
Ldt cone calorimeter according to the ASTM E1354-04 procedure
Samples with nominal dimensions of 100x100x7 mm were tested
horizontally under an incident flux of 50 kWm2 This level was chosen
as it corresponds to the evolved heat during a fire
421 Flame retardant of epoxy resin with inorganic compounds
The composite flame retardant were prepared by mixing the epoxy resin
RTM6 with zinc borate aluminium trihydrate zinc stannate and zinc
hydroxystannate at different percentage (5 wt 10 wt 20 wt 30
wt 40 wt) using a Heidolph RZR mechanical stirring equipment
(Chap 3)
Cone calorimeter data reported in tables 41 and 42 show that the
presence of zinc borate at 5 and 10 wt does not change substantially
the flame behaviour of the matrix as drawn by analysing the time to
ignition and heat release rate peak values Instead the presence of zinc
borate at 20 30 40 wt induces the flame retardant effect as
Chapter 4 Flame retardant of epoxy resin with inorganic compounds
56
supported by the recorded values of pHRR and HRR average The cone
calorimeter data reported in table 41 are averaged over two replicate
experiments
Samples
TTI
(s)
pHRR
(kWm2)
HRR
average
(kWm2)
TTP
(s)
THR
(MJm2)
TSR
(m2m2)
RTM6
neat 43 702 382 290 189 9260
RTM6+ZB
5wt 48 523 265 297 176 8282
RTM6+ZB
10wt 44 682 354 325 1842 8442
RTM6+ZB
20wt 49 428 251 455 188 9275
RTM6+ZB
30wt 47 396 193 65 186 10296
RTM6+ZB
40wt 63 315 148 82 161 7474
Table 41 Main cone calorimeter parameters evaluated for RTM6 epoxy with ZB at
different percentage
Samples ΔTTI
(s)
ΔpHRR
(kWm2)
FIP
(kWm2s)
FIGRA
(kWm2s) RTM6
neat _ _ 1632 242
RTM6+ZB
5wt 5 179 1079 175
RTM6+ZB
10wt 1 20 155 209
RTM6+ZB
20wt 6 274 861 094
RTM6+ZB
30wt 4 306 842 609
RTM6+ZB
40wt 20 387 5 384
Table 42 Parameters calculated by cone calorimeter data for RTM6 epoxy with ZB at
different percentage
Chapter 4 Flame retardant of epoxy resin with inorganic compounds
57
Where FPI and FIGRA are respectively pHRRTTI (kWm2s) and
pHRRTTP (kWm2s)
Decreasing values for the pHRR and HRR average may be correlated
with the formation of a char layer over the surface of tested sample
during the combustion process
A visual inspection of the final residual sample reports the presence of
the char layer (fig 41)
In figure 41 the HRR peak of RTM6ZB 10 wt system is higher than
corresponding peak for the ZB 5 wt system this curversquos behaviour
could be attributed to a local instability of the heat flux during the test
which lead to a wider cracked area and therefore a localised
combustion growth
Figure 41 HRR curves of RTM6ZB at different percentage
Whereas the aluminium trihydrate shows a negative effect as showed
by preliminary thermo-gravimetric analysis probably due an
acceleration of decomposition of the epoxy resin the presence of ATH
from 20 to 40 wt reduced the HRR peak and the HRR average (fig
42)
Chapter 4 Flame retardant of epoxy resin with inorganic compounds
58
In figure 42 the images of the residues of 30 and 40 wt RTM6-ATH
system with the whitish surface characteristic of the aluminium
trihydrate are reported
Figure 42 HRR curves of RTM6ATH at different percentage
The cone calorimeter data for ATH are reported in table 43 and FPI and
FIGRA in table 44 and are averaged over two replicate experiments
Chapter 4 Flame retardant of epoxy resin with inorganic compounds
59
Samples
TTI
(s)
pHRR
(kWm2)
HRR
average
(kWm2)
TTP
(s)
THR
(MJm2)
TSR
(m2m2)
RTM6 neat 43 702 382 290 189 9260
RTM6+ATH
5 33 815 413 220 126 5099
RTM6+ATH
10 51 728 383 210 126 5246
RTM6+ATH
20 52 510 368 340 199 9109
RTM6+ATH
30 64 468 324 232 174 7648
RTM6+ATH
40 93 453 193 110 172 8238
Table 43 Main cone calorimeter parameters evaluated for RTM6 epoxy with ATH at
different percentage
Samples ΔTTI
(s)
ΔpHRR
(kWm2)
FIP
(kWm2s)
FIGRA
(kWm2s) RTM6 neat _ _ 1632 242
RTM6+ATH
5 -10 -113 247 370
RTM6+ATH
10 8 -26 1427 346
RTM6+ATH
20 9 192 98 15
RTM6+ATH
30 21 234 731 201
RTM6+ATH
40 50 249 487 411
Table 44 Parameters calculated by cone calorimeter data for RTM6 epoxy with ZB at
different percentage
Where FPI and FIGRA are respectively pHRRTTI (kWm2s) and
pHRRTTP (kWm2s)
Chapter 4 Flame retardant of epoxy resin with inorganic compounds
60
Zinc hydroxystannate and zinc stannate such as zinc borate and
aluminium trihydrate reduced HRR peak and HRR average with the
presence of ZS and ZHS of 30 and 40 wt ZS and ZHS werenrsquot
prepared at 5 wt percentage because previously test on zinc borate
and aluminium trihydrate have failed the cone calorimeter tests
Cone calorimeter data are reported in table 45 for ZHS and in table 47
for ZS
In figure 43 HRR curves of ZHS at different percentage are reported
and the residual image shows a densified structure (char) that forms a
barrier to inhibit combustible gases
Figure 43 HRR curves of RTM6ZHS at different percentage
Chapter 4 Flame retardant of epoxy resin with inorganic compounds
61
Samples
TTI
(s)
pHRR
(kWm2)
HRR
average
(kWm2)
TTP
(s)
THR
(MJm2)
TSR
(m2m2)
RTM6 neat 43 702 382 290 189 9260
RTM6+ZHS
10 44 469 203 255 202 9070
RTM6+ZHS
20 43 465 286 417 194 7092
RTM6+ZHS
30 52 379 192 70 153 6726
RTM6+ZHS
40 51 329 214 75 153 72
Table 45 Main cone calorimeter parameters evaluated for RTM6 epoxy with ZHS at
different percentage
Samples ΔTTI
(s)
ΔpHRR
(kWm2)
FIP
(kWm2s)
FIGRA
(kWm2s)
RTM6 neat _ _ 1632 242
RTM6+ZHS
10 1 233 1065 184
RTM6+ZHS
20 0 237 1082 111
RTM6+ZHS
30 9 323 728 541
RTM6+ZHS
40 8 373 645 438
Table 46 Parameters calculated by cone calorimeter data for RTM6 epoxy with ZHS
at different percentage
Instead in the residual image of ZS (fig 44) a crack on the surface is
observed probably due to a local instability of the heat flux during the
test which lead to a wider cracked area and therefore a localised
combustion growth such as zinc borate
Chapter 4 Flame retardant of epoxy resin with inorganic compounds
62
Figure 44 HRR curves of RTM6ZS at different percentage
Samples
TTI
(s)
pHRR
(kWm2)
HRR
average
(kWm2)
TTP
(s)
THR
(MJm2)
TSR
(m2m2)
RTM6 neat 43 702 382 290 189 9260
RTM6+ZS
10 45 583 313 260 176 7505
RTM6+ZS
20 46 803 336 475 200 6747
RTM6+ZS
30 43 551 274 262 152 6509
RTM6+ZS
40 45 470 293 282 163 7096
Table 47 Main cone calorimeter parameters evaluated for RTM6 epoxy with ZS at
different percentage
Chapter 4 Flame retardant of epoxy resin with inorganic compounds
63
Samples ΔTTI
(s)
ΔpHRR
(kWm2)
FIP
(kWm2s)
FIGRA
(kWm2s)
RTM6 neat _ _ 1632 242
RTM6+ZS
10 2 119 1295 224
RTM6+ZS
20 3 -101 1745 169
RTM6+ZS
30 0 151 1281 210
RTM6+ZS
40 2 232 1044 166
Table 48 Parameters calculated by cone calorimeter data for RTM6 epoxy with ZS at
different percentage
In conclusion the effect of all additives on the HRR peak value of epoxy
resin RTM6 is considerable for percentages of 30 and 40 wt In
particular the best result has been achieved with zinc borate 40 wt
and the heat release rate peak enhancement was 55
422 Synergistic effect of zinc borate with aluminium trihydrate
The synergy between the zinc borate and aluminium trihydrate was
investigated on four different percentages (10 20 30 and 40 wt ) of
additives into neat system considering the total amount split between
zinc borate and aluminium trihydrate according to the ratio 11
In order to study the synergistic effects of zinc borate with aluminium
trihydrate samples of composite of RTM6 and ZBATH dispersed at
total percentage of 20 wt were mapped by SEM The presence of ZB
and ATH within the same area of the sample lead to the reasonable
conclusion that an interaction between the two additives is taking place
(fig 45)
Chapter 4 Flame retardant of epoxy resin with inorganic compounds
64
Figure 45 Mapping of ZBATH sample dispersed into the epoxy resin
Preliminary thermogravimetric analysis shows that the synergic effect
due to the presence of both ZB and ATH is highlighted by the value of
onset temperature which decreases to about 355degC for the higher
concentrations Theoretical (calculation) and experimental TG-DTG
curves have been superimposed in figures 46 and 47 for the 30 wt
similar results were also obtained for the 40 wt mixture It results
that the addition of ZB and ATH synergistically drives the degradation
behaviour of neat matrix system as showed by the remarkable shifting
of the experimental curve toward higher onset temperature compared
with the calculated one
Chapter 4 Flame retardant of epoxy resin with inorganic compounds
65
0
20
40
60
80
100
120
0 100 200 300 400 500 600 700 800
RTM6+ATH+ZB 30 ExperimentRTM6RTM6+ATH+ZB 30 Calculation
Wei
ght (
)
Temperature (degC)
Figure 46 Experimental and calculated TGA curves for RTM6ATHZB 30 wt system
-02
0
02
04
06
08
1
12
0 100 200 300 400 500 600 700 800
RTM6RTM6+ATH+ZB 30 ExperimentRTM6+ATH+ZB 30 Calculation
Der
iv W
eigh
t (
degC
)
Temperature (degC)
Figure 47 Experimental and calculated DTG curves for RTM6ATHZB 30 wt system
Cone calorimeter data of synergic effect of zinc borate is reported in
tables 49 and 410
Chapter 4 Flame retardant of epoxy resin with inorganic compounds
66
Samples
TTI
(s)
pHRR
(kWm2)
HRR
average
(kWm2)
TTP
(s)
THR
(MJm2)
TSR
(m2m2)
RTM6 neat 43 702 382 290 189 9260
RTM6+ZB+ATH
10 52 679 285 200 122 5702
RTM6+ZB+ATH
20 52 468 337 140 195 10086
RTM6+ZB+ATH
30 55 431 249 95 174 8966
RTM6+ZB+ATH
40 87 437 74 100 173 7184
Table 49 Main cone calorimeter parameters evaluated for RTM6ZBATH system at
different percentage
Samples ΔTTI
(s)
ΔpHRR
(kWm2)
FIP
(kWm2s)
FIGRA
(kWm2s)
RTM6 neat _ _ 1632 242
RTM6+ZB+ATH
10 9 23 1305 34
RTM6+ZB+ATH
20 9 234 917 334
RTM6+ZB+ATH
30 12 271 783 453
RTM6+ZB+ATH
40 44 265 502 437
Table 410 Parameters calculated by cone calorimeter data for RTM6ZBATH
system at different percentage
The synergy of zinc borate is effective above content of 20 wt in fact
the heat release rate average undergoes a significant decrease by 382
kWm2 for epoxy resin to 249 kWm2 for system ZBATH 30 wt and
74 kWm2 for ZBATH 40 wt (fig 48) Comparing the ΔTTI and the
Chapter 4 Flame retardant of epoxy resin with inorganic compounds
67
HRR average values for RTM6ZB 20 wt RTM6ATH 20 wt and
RTM6ZBATH system at 40 wt the effect synergic of zinc borate and
aluminium trihydrate improves significantly the flame retardancy
respectively from 6 to 44 sec for TTI and from 251 kWm2 to 74 kWm2
for HRR compared
Figure 48 HRR curves of RTM6ZBATH system at different percentage
423 Scanning electron micrograph of residual
The scanning electron micrographs of dust cryogenically fractured
composite samples and their residuals were taken by a 1450VP LEO
The analyses made with the electronic scanning microscope were made
to observe the morphology of the material both before and after the
combustion process occurred in the cone calorimeter
We used two different methodologies one for observing the morphology
of the material (ion secondary SE1) and the other for the phase
difference (ions scatter QBSD) and the EDS analysis was also carried
out to view the compounds contained in the sample examined
Chapter 4 Flame retardant of epoxy resin with inorganic compounds
68
Analysis of SEM micrographs on residual of system of epoxy resin zinc
borate and aluminium trihydrate indicates that char topography varies
from a compact like-amalgam structure for the RTM6+ZB (fig49-411)
to a granular porous-like structure characterized by very small particles
of degraded resin and additive for the ATH mixture (fig412-414)
Reported SEM image are taken for the 20 wt content system as this
percentage represents the first useful composition to observe a delayed
effect of flame retardancy
Figure 49 and 410 Scanning electron micrograph of residual of RTM6ZB system
Figure 411 Scanning electron micrograph (SE1 and QBSD) and EDS of residual of
RTM6ZB system
Chapter 4 Flame retardant of epoxy resin with inorganic compounds
69
Figure 412 and 413 Scanning electron micrograph of residual of RTM6ZB system
Figure 414 Scanning electron micrograph (SE1 and QBSD) and EDS of residual of
RTM6ZB system
In figure 415 the scanning electron micrograph of residual samples of
RTM6ZBATH system is reported and the formation of char layer on
the surface due to zinc borate that reduces the HRR peak and average
of the burning surface is observe
Scanning electron micrographs indicate that the synergistic flame
retardant effects of these additives result from the excellent quality of
char that can better endure the oxidation of high temperatures slowing
at same time the degradation of epoxy resin
Chapter 4 Flame retardant of epoxy resin with inorganic compounds
70
Figure 415 Scanning electron micrograph and EDS of residual of RTM6ZBATH
system
424 Flame retardant of panels of RTM6 and inorganic compounds
The composites were prepared by mixing the epoxy resin RTM6 with all
additives at percentage of 30 wt and then the mixture was degassed
for 30 minutes at 90degC in a vacuum oven to eliminate entrapped air and
humidity Afterwards the mixture was injected in the preform of
20x20cm by vacuum infusion process
Flame retardants of panels of RTM6 and inorganic compounds were
investigated by cone calorimeter under an incident flux of 35 kWm2 in
according to the ASTM E1354-04 procedure for samples with thickness
less than 3mm Samples have dimensions of 100x100mm with
thickness of about 3mm because they were manufactured with 8 plies
of carbon fibres overlaid unidirectional at zero degree with thickness of
03mm each one
Cone calorimeter data show how the best results for the flame retardant
properties is at percentage of 40 wt but rheology test prepared at 5
degCmin demonstrates high viscosity for this percentage and hence
there are troubles during infusion For this reason the panels were
manufactured with percentage additives of 30 wt (fig 416)
Chapter 4 Flame retardant of epoxy resin with inorganic compounds
71
Figures 416 Rheology test viscosity vs time of RTM6 neat (green) RTM6ZB 30 wt
(blue) and RTM6ZB 40 wt (red)
In figure 417 are reported HRR curves of panels of RTM6 with carbon
fibres and all additives at percentage of 30 wt
0 100 200 300 4000
200
400
HR
R [k
Wm
2 ]
Time [s]
RTM6+CF RTM6+CF+ZB 30wt RTM6+CF+ATH 30wt RTM6+CF+ZHS 30wt RTM6+CF+ZS 30wt
Figure 417 HRR curves of RTM6CFAdditives system at percentage of 30 wt
Chapter 4 Flame retardant of epoxy resin with inorganic compounds
72
In the figure it is shown that zinc borate retarded the time to ignition
and reduced heat release rate respect to epoxy resin with carbon fibres
as is reported in table 411
Samples
TTI
(s)
pHRR
(kWm2)
HRR
average
(kWm2)
TTP
(s)
THR
(MJm2)
TSR
(m2m2)
RTM6+CF 91 301 119 124 20 1009
RTM6+CF+ZB
30 106 284 132 134 12 612
RTM6+CF+ATH
30 90 303 121 122 21 969
RTM6+CF+ZHS
30 81 344 139 110 18 876
RTM6+CF+ZS
30 73 278 114 114 16 766
Table 411 Main cone calorimeter parameters evaluated for RTM6Carbon
FibersAdditives system at percentage of 30 wt
Samples ΔTTI
(s)
ΔpHRR
(kWm2)
FIP
(kWm2s)
FIGRA
(kWm2s)
RTM6 neat _ _ 33 24
RTM6+CF+ZB
30 15 17 27 21
RTM6+CF+ATH
30 -1 -2 34 25
RTM6+CF+ZHS
30 -10 -43 42 32
RTM6+CF+ZS
40 -18 23 38 24
Table 412 Parameters calculated by cone calorimeter data for RTM6Carbon
FibersAdditives system at percentage of 30 wt
Chapter 4 Flame retardant of epoxy resin with inorganic compounds
73
In the table itrsquos shown clearly that the panels with zinc borate
augmented the flame retardant properties of RTM6 and carbon fibers in
fact increased the TTI reduced significantly the TSR and reduced FIP
and FIGRA (table 412)
The synergistic effect of zinc borate with aluminium trihydrate on
panels of RTM6 and carbon fibers is shown in figure 418
0 100 200 300 4000
200
400
HR
R [k
Wm
2 ]
Time [s]
RTM6+CF RTM6+CF+ZB 30wt RTM6+CF+ATH 30wt RTM6+CF+ZB+ATH 30wt
Figure 418 HRR curves of RTM6CFZBATH system
In this case itrsquos shown that the synergistic effect of zinc borate didnrsquot
produce any improvement on the flame retardant properties of RTM6
and Carbon Fibers as is reported in tables 413 and 414
Zinc borate from chemical in the combustion phase is able to slow
down the effect of carbon fibres because the zinc borate creates a layer
of char on the surface of sample more compact than was in the
presence of ZB with ATH
Chapter 4 Flame retardant of epoxy resin with inorganic compounds
74
Samples
TTI
(s)
pHRR
(kWm2)
HRR
average
(kWm2)
TTP
(s)
THR
(MJm2)
TSR
(m2m2)
RTM6+CF 91 301 119 124 20 1009
RTM6+CF+ZB 30 106 284 132 134 12 612
RTM6+CF+ATH
30 90 303 121 122 21 969
RTM6+CF+ZB+ATH
30 79 311 126 104 17 788
Table 413 Main cone calorimeter parameters evaluated for RTM6Carbon
FibersZBATH system at percentage of 30 wt
Samples ΔTTI
(s)
ΔpHRR
(kWm2)
FIP
(kWm2s)
FIGRA
(kWm2s) RTM6 neat _ _ 33 24
RTM6+CF+ZB 30 15 17 27 21
RTM6+CF+ATH
30 -1 -2 34 25
RTM6+CF+ZB+ATH
30 -12 -10 38 29
Table 414 Parameters calculated by cone calorimeter data for RTM6Carbon
FibersZBATH system at percentage of 30 wt
Chapter 4 Flame retardant of epoxy resin with inorganic compounds
75
43 Thermal mechanical analysis of RTM6 and inorganic
compounds The coefficient of thermal expansion is calculated by thermal
mechanical analysis as reported in Chapter 3
Each result reported in this chapter is averaged over three replicate
experiments The thermal mechanical analysis was conducted on the
samples additived at 30wt because this percentage is resulted good by
cone calorimeter test and principally to have a comparison with the
panels that are produced at this percentage
In figure 419 is reported the CTE of RTM6 neat and it is shown clearly
that there are two values of CTE in the first heating ramp and many
CTErsquos value in the second heating ramp
000 10000 20000Time [min]
145000
146000
147000
148000x10
1um
TMA
-002
-001
000
001
002
NLOAD
10000
20000
CTemp
19613C
5600C
16757C
6207x10-6
K
21589C
24557C
13770x10-6
K
7768C
16433C
6748x10-6
K
21168C
24930C
16647x10-6
K
RTM6 NEAT
Figure 419 CTE of epoxy resin RTM6 neat
Instead in the samples of RTM6 and additives the value of CTE in the
second heating ramp is only one and it is observed that the value of
CTE of RTM6additives system is more less than the CTE of RTM6 neat
Chapter 4 Flame retardant of epoxy resin with inorganic compounds
76
hence the influence of additives on the thermal mechanical properties of
matrix is clear
000 5000 10000 15000Time [min]
117000
117500
118000
x101
umTMA
-002
-001
000
001
002
NLOAD
5000
10000
15000
20000
CTemp
8451 C
18561 C
6615 x10-6
5238 C
15885 C
5781 x10-6
K
17844 C
18051 C
19565 C
12254 x10-6
K
RTM6+ZB 30 wt
Figure 420 CTE of epoxy resin RTM6+ZB 30wt
000 5000 10000 15000Time [min]
155000
155500
156000
156500x10
1um
TMA
-002
-001
000
001
002
NLOAD
5000
10000
15000
20000
CTemp
17557C
5017C
13426C
6051x10-6
K
18608C
19618C
9987x10-6
K
7391C
19130C
6231x10-6
K
RTM6+ATH 30wt
Figure 421 CTE of epoxy resin RTM6+ATH 30wt
Chapter 4 Flame retardant of epoxy resin with inorganic compounds
77
To observe the synergistic effect of zinc borate is calculated the CTE of
RTM6ZBATH 30wt system and the results are reported in table
415
000 5000 10000 15000Time [min]
121000
121500
122000
x101
umTMA
-002
-001
000
001
002
NLOAD
5000
10000
15000
20000
CTemp
4876C
12672C
6051x10-6
K7127C
19539C
6471x10-6K
15421C
17853C
12050x10-6K
RTM6+ZB+ATH 30wt
Figure 422 CTE of epoxy resin RTM6+ATH+ZB 30wt
Coefficient of Thermal Expansion (10-6K)
Samples I Heating ramp II Heating ramp
RTM6 neat 606 1329 678 1657
RTM6+ZB 30wt 595 1767 656 -
RTM6+ATH 30wt 605 1149 612 -
RTM6+ATH+ZB 30wt 612 1157 671 -
Table 415 CTE of synergistic effect of zinc borate
Instead in the graph of TMA of ZS and ZHS there are two values in the
second heating ramp and rather than as a ZB and ATH This confirms
as previously seen from the cone that the protective structure that is
created is different because chemically boron and aluminium will
Chapter 4 Flame retardant of epoxy resin with inorganic compounds
78
oxidize more easily creating alumina and boron oxide (ceramic) hence
tighten the structure
000 10000 20000Time [min]
150000
151000
x101
umTMA
-002
-001
000
001
002
NLOAD
10000
20000
CTemp
7767C
17204C
5787x10-6K
21699C
24925C
12096x10-6
K
19957C
4559C
13757C
6488x10-6
K
18170C
24788C
6759x10-6
K
RTM6+ZS 30wt
Figure 423 CTE of epoxy resin RTM6+ZS 30wt
000 10000 20000Time [min]
165000
166000
167000
168000
x101
umTMA
-002
-001
000
001
002
NLOAD
10000
20000
CTemp
6060C
15393C
6330x10-6
K
20830C
23721C
29456x10-6
K
20725C
7879C
15387C
6242x10-6
K
22040C
24930C
12702x10-6
K
RTM6+ZHS 30wt
Figure 424 CTE of epoxy resin RTM6+ZHS 30wt
In conclusion the values of coefficient of thermal expansion for both
heating ramp are reported in table 416
Chapter 4 Flame retardant of epoxy resin with inorganic compounds
79
Coefficient of Thermal Expansion (10-6K)
Samples I Heating ramp II Heating ramp
RTM6 neat 606 1329 678 1657
RTM6+ZB 30wt 595 2038 656 -
RTM6+ATH 30wt 605 1149 612 -
RTM6+ATH+ZB 30wt 612 1157 671 -
RTM6+ZS 30wt 636 7040 574 1276
RTM6+ZHS 30wt 621 2898 617 1268
Table 416 CTE of all samples of RTM6 and additives
In table 416 the values of CTE for all additives are reported and it is
clearly observed that the influence of additives on the matrix is able to
lower the CTE of epoxy resin neat
Furthermore it is shown the thermal mechanical analysis of panels of
epoxy resin with additives produced by VIP with carbon fibres The
samples were cut to 90 degrees in the transverse direction fibres to
observe the effect of carbon fibres and additives on the properties of
thermal mechanical of matrix
In the figures below the values of CTE of epoxy resin RTM6 with carbon
fibres and all additives are illustrated and it is shown that the values of
CTE are always lower than the CTE of single resin with fibres This
results are reported in the table 417
Chapter 4 Flame retardant of epoxy resin with inorganic compounds
80
000 10000 20000Time [min]
177500
178000
178500
x101
umTMA
-002
-001
000
001
002
NLOAD
10000
20000
CTemp
5090C
16755C
3325x10-6
K
22481C22314C
25029C
3085x10-6
K
17544C
7034C
15384C
3377x10-6
K
19683C
24476C
4543x10-6K
RTM6+CF
Figure 425 CTE of epoxy resin RTM6+CF
000 10000 20000Time [min]
138500
139000
139500
x101
umTMA
-002
-001
000
001
002
NLOAD
10000
20000
CTemp
5309C
15389C
2840x10-6K
21889C
24945C
2723x10-6
K
21278C
7875C
14546C
3036x10-6
K
18119C
19872C
24356C
3873x10-6
K
RTM6+CF+ZB 30 wt
Figure 426 CTE of epoxy resin RTM6+CF+ZB 30wt
Chapter 4 Flame retardant of epoxy resin with inorganic compounds
81
000 10000 20000Time [min]
162000
162500
163000
x101
umTMA
-002
-001
000
001
002
NLOAD
10000
20000
CTemp
22411C
5525C
16456C
3264x10-6
K
23409C24942C
2832x10-6K
17556C
7234C
14428C
3385x10-6K
20098C
24285C
3699x10-6
K
RTM6+CF+ATH 30 wt
Figure 427 CTE of epoxy resin RTM6+CF+ATH 30wt
000 10000 20000Time [min]
165500
166000
166500
x101
umTMA
-002
-001
000
001
002
NLOAD
10000
20000
CTemp
22639C
4575C
15467C
3111x10-6K
22316C
25085C
4058x10-6K
7993C
14547C
3240x10-6
K
17252C19766C
24360C
4942x10-6K
RTM6+CF+ATH+ZB 30 wt
Figure 428 CTE of epoxy resin RTM6+CF+ATH+ZB 30wt
Chapter 4 Flame retardant of epoxy resin with inorganic compounds
82
000 10000 20000Time [min]
155500
156000
x101
umTMA
-002
-001
000
001
002
NLOAD
10000
20000
CTemp
22262C
5082C
16873C
2888x10-6
K
22845C
25089C
3534x10-6
K
15935C
7235C
14962C
3211x10-6
K
18924C
23941C
4176x10-6
K
RTM6+ZS 30wt
Figure 429 CTE of epoxy resin RTM6+CF+ZS 30wt
000 10000 20000Time [min]
174000
174500
x101
umTMA
-002
-001
000
001
002
NLOAD
10000
20000
CTemp
24089C
5721C
18578C
2851x10-6
K
23944C25021C
2451x10-6K
16347C
6501C
14321C
3085x10-6
K
19681C
24287C
3625x10-6K
RTM6+ZHS 30wt
Figure 430 CTE of epoxy resin RTM6+CF+ZHS 30wt
Chapter 4 Flame retardant of epoxy resin with inorganic compounds
83
Coefficient of Thermal Expansion (10-6K)
Samples I Heating ramp II Heating ramp
RTM6+CF 332 319 346 452
RTM6+CF+ZB 30wt 265 317 311 386
RTM6+CF+ATH 30wt 326 306 339 389
RTM6+CF+ATH+ZB 30wt 292 299 306 398
RTM6+CF+ZS 30wt 296 318 318 378
RTM6+CF+ZHS 30wt 276 364 318 406
Table 417 CTE of all samples of RTM6+CF and all additives
In the table the thermal mechanical data of panels are reported and it is
shown that the carbon fibers and the additives reduced the CTE hence
increase the thermal mechanical properties of epoxy resin RTM6
Chapter 4 Flame retardant of epoxy resin with inorganic compounds
84
References [1] Bourbigot S Le Bras M Leeuwendal R Shen KK Schubert D
Polym Degrad Stab 1999 (64)419-425
[2] Carpentier F Bourbigot S Le Bras M Delobel R Foulon M Polym
Degrad Stab 2000 69 1 83-92
[3] Wu Z Shu W Hu Y Journal of Applied Polymer Science 2007
1033667-3674
[4] Petsom A Roengsumran S Ariyaphattanakul A Sangvanich P
Polym Degrad Stab 2003(80)17-22
[5] Cusack PA Heer MS Monk AW Polymer Degradation and Stability
1997 (58)229-237
[6] Ning Y Guo S J of App Pol Sc 2000 77 3119-3127
[7] Wu S Cong P Yu J Luo X Mo L Fuel 2006 85 1298-1304
[8] Bourbigot S Le Bras M Duquesne S Rochery M Macromol Mater
Eng 2004 289 499-511
[9] Le Bras M Bourbigot S Duquesne S Jama C Wilkie CA Royal
Society of Chemistry Press Cambridge 2005
[10] Genovese A Shanks RA Polym Degrad Stab 2007 92 2-13
[11] Samyn F Bourbigot S Duquesne S Delobel R Thermochimica
2007 456 134-144
[12] Schartel B Hull TR Fire and Materials 2007 31 327-354
CHAPTER 5 FLAME RETARDANT OF EPOXY RESIN WITH
CARBON NANOTUBES
51 The state of the art on flame retardant of carbon
nanotubes Fire retardancy is one of the fields where the nanomaterials could be
used successfully Nanoparticles embedded in various polymer matrices
are reported to reduce considerably the heat released from these
materials [1] The investigation of size shape interfaces and
concentration of nanoscale silica nano-flakes nanotubes and other
nanoparticles on the flame retardant performance increased the role of
fire protected polymers within the science of materials There is a high
level of interest in using filler particles having at least one nano-
dimensional scale for making polymeric nanocomposite materials with
exceptional properties One of the promising applications involves the
improvement in flammability properties of polymers with nanofillers
because one weak aspect of polymers is that they are combustible
under certain conditions These filled systems are attractive as possible
alternatives to conventional flame retardants and furthermore they
could simultaneously improve both physical and flammability
properties of polymers [2]
Carbon nanotubes are candidates as flame retardant additives because
of their highly elongated shape (high aspect ratio)
In literature [2-6] different authors analyzed the fire behaviours of
carbon nanotubes in several matrices
Kashiwagi et al [2-4] found that nanocomposites based on carbon
nanotubes are likewise capable of forming a continuous structured
network as a protective layer without the formation of cracks that
compromise the flame-retardant effectiveness This resulted in a
Chapter 5 Flame retardant of epoxy resin with carbon nanotubes
86
significant reduction in the heat release rate (a flammability measure
related to the fire intensity) with a carbon nanotube mass concentration
as low as 05 This protective layer consisted mainly of carbon
nanotubes and it seemed to act as a heat shield for the virgin polymer
below the layer Poorly dispersed carbon nanotubes resulted in the
formation of a discontinuous layer consisting of fragmented islands
rather than the continuous protective network layer Very low
concentrations of the tubes yielded the same fragmented island
structures as found in the clay nanocomposite measurements The
flame retardant performance of the nanocomposites containing the
island structure was much poorer than that of the nanocomposites
forming a continuous protective network layer Thus the formation of
the network structured protective layer during burning without any
openings or cracks seems to be crucial for the large reduction in heat
release rate Furthermore Kashiwagi et al [5] suggested that this
network is formed in the original sample under appropriate fabrication
conditions and that this structure provides the main source of the
protective layer that is formed during the burning process This
hypothesis was systematically tested with various sizes and
concentrations of carbon-based nanoparticles in a PMMA matrix
Cipiriano et al [6] studied the effects of the aspect ratio of multi-walled
carbon nanotubes (MWNTs) on the rheology and flammability of
polystyreneMWNT nanocomposites using two MWNTs having average
aspect ratios (length to outer diameter) of 49 and 150 In flammability
experiments they demonstrated that the larger aspect ratio particles
lead to a greater reduction in mass loss rate hence they are more
effective in reducing flammability
Chapter 5 Flame retardant of epoxy resin with carbon nanotubes
87
52 Cone calorimeter test Cone calorimeter tests were performed using a Fire Testing Technology
Ldt cone calorimeter according to the ASTM E1354-04 procedure
Samples with nominal dimensions of 100x100x3 mm were tested
horizontally under an incident flux of 35 kWm2 This level was chosen
as it corresponds to the evolved heat during a fire for samples with
thickness less than 3mm
521 Flame retardant of RTM6 and MWNT Nanocyl 7000
The nanocomposites of epoxy resin and multi walled carbon nanotubes
were prepared by sonication process as is reported in the Chapter 3
0 100 200 300 4000
600
1200
1800
2400
3000
HR
R [k
Wm
2 ]
Time [s]
RTM6 RTM6+MWNT 01wt
Figure 51 HRR curves of RTM6MWNT at percentage of 01wt
Samples
TTI
(s)
pHRR
(kWm2)
HRR
average
(kWm2)
TTP
(s)
THR
(MJm2)
TSR
(m2m2)
RTM6 neat 35 1479 614 156 117 4688
RTM6+MWNT
01wt 72 1651 643 136 108 3863
Table 51 Parameters calculated by cone calorimeter data for RTM6MWNT 01wt
Chapter 5 Flame retardant of epoxy resin with carbon nanotubes
88
In figure 51 it is shown that the carbon nanotubes donrsquot influence the
properties of flame retardants of matrices because the percentage used
in this work is low A small effect is shown only for the value of TTI as
reported in table 51
523 Flame retardant of panels of RTM6 and carbon nanotubes
The nanocomposites were prepared by sonication process (Chap3) the
epoxy resin RTM6 with multi walled carbon nanotubes at percentage of
01 wt and then the mixture was degassed for 30 minutes at 90degC in a
vacuum oven to eliminate entrapped air and humidity Afterwards the
mixture was injected in the preform of 20x20cm by vacuum infusion
process Samples were manufactured with 8 plies of overlaid
unidirectional carbon fibres at zero degrees with thickness of 03mm
each one
0 100 200 300 4000
200
400
600
800
HR
R [k
Wm
2 ]
Time [s]
RTM6+CF RTM6+CF+MWNT 01wt
Figure 52 HRR curves of RTM6CFMWNT 01wt
Chapter 5 Flame retardant of epoxy resin with carbon nanotubes
89
Samples
TTI
(s)
pHRR
(kWm2)
HRR
average
(kWm2)
TTP
(s)
THR
(MJm2)
TSR
(m2m2)
RTM6+CF 91 301 118 124 20 1009
RTM6+CF+MWNT
01wt 88 306 129 124 21 1077
Table 52 Parameters calculated by cone calorimeter data for RTM6CFMWNT
system at percentage of 01wt
As seen above the percentage of nanotubes is not effective and the
presence of unidirectional fibres does not induce changes sensitive to
the distribution of flame
53 Thermal mechanical analysis of RTM6 and carbon
nanotubes The thermal mechanical analysis was conducted on both samples of
RTM6 and additives on panels with carbon fibres
000 10000 20000Time [min]
145000
146000
147000
148000x10
1um
TMA
-002
-001
000
001
002
NLOAD
10000
20000
CTemp
19613C
5600C
16757C
6207x10-6
K
21589C
24557C
13770x10-6
K
7768C
16433C
6748x10-6K
21168C
24930C
16647x10-6
RTM6 NEAT
Figure 53 CTE of epoxy resin RTM6 neat
Chapter 5 Flame retardant of epoxy resin with carbon nanotubes
90
000 10000 20000Time [min]
140000
141000
142000
x101
umTMA
-002
-001
000
001
002
NLOAD
10000
20000
CTemp
20956C
4487C
16322C
6518x10-6K
21697C
25089C
13872x10-6
K
7339C
16669C
6897x10-6
K
20631C
21697C
24929C
17239x10-6K
RTM6+MWNT 01wt
Figure 54 CTE of epoxy resin RTM6+MWNT 01wt
Coefficient of Thermal Expansion (10-6K)
Samples I Heating ramp II Heating ramp
RTM6 neat 606 1329 678 1657
RTM6+MWNT 01wt 622 1374 688 1702
Table 53 CTE of RTM6 and MWNT 01wt
In the figures 53 and 54 and in the table 53 the CTE for panels of
epoxy resin additived with carbon nanotubes are shown where the
percentage of multi walled carbon nanotubes is too low to make an
improvement on the value of CTE of RTM6 and carbon fibres
Chapter 5 Flame retardant of epoxy resin with carbon nanotubes
91
000 10000 20000Time [min]
177500
178000
178500
x101
umTMA
-002
-001
000
001
002
NLOAD
10000
20000
CTemp
5090C
16755C
3325x10-6
K
22481C22314C
25029C
3085x10-6
K
17544C
7034C
15384C
3377x10-6
K
19683C
24476C
4543x10-6K
RTM6+CF
Figure 55 CTE of epoxy resin RTM6+CF
000 10000 20000Time [min]
153500
154000
154500
x101
umTMA
-002
-001
000
001
002
NLOAD
10000
20000
CTemp
6828C
19462C
3758x10-6
K
22996C25074C
5327x10-6K
8314C
14215C
3810x10-6
K
19996C
24591C
5725x10-6K
RTM6+CF+MWNT 01wt
Figure 56 CTE of epoxy resin RTM6+CF+MWNT 01wt
Chapter 5 Flame retardant of epoxy resin with carbon nanotubes
92
Coefficient of Thermal Expansion (10-6K)
Samples I Heating ramp II Heating ramp
RTM6+CF 332 319 346 452
RTM6+CF+MWNT
01wt 367 577 383 553
Table 54 CTE of RTM6+CF+MWNT 01wt system
Similar values are obtained for the sample with carbon fibres and
carbon nanotubes in fact in table 54 it is shown clearly that both
nanotubes and fibers donrsquot influence CTE of RTM6CF system
Chapter 5 Flame retardant of epoxy resin with carbon nanotubes
93
References [1] Marosfoi B Matko Sz Marosi PAnnaGy Current Applied Physics
2006 (6)259-261
[2] Kashiwagi T Du F Winey KI Groth KM Shields JR Bellayer SP
Kim H Douglas JF Polymer 2005 (46)471-481
[3] Kashiwagi T Grulke E Hilding J Groth K Harris R Butler K
Shields J Kharchenko S Douglas J Polymer 2004 (45) 4227-4239
[4] Kashiwagi et al Macromol Rapid Commun 2002 (23) 761-765
[5] Kashiwagi T Du F Douglas JF Winey KI Harris RHJr Shields
JR Nature materials 2005 (4) 5-10
[6] Cipiriano BH Kashiwagi T Raghavan SR Yang Y Grulke EA
Yamamoto K Shields JR Douglas JF Polymer 2007 486086-6096
[7] Qian D Dickey EC Andrews R Rantell T Appl Phys Lett 200076
(20)2868-2870
[8] Park C et al Chemical Physical Letters 2002364303-308
[9] Ham HT Choi YS Chung JI Journal of Colloid and Interface
Science 2005286 (1)216-223
[10] Salvetat JP Briggs AD Bonard JM Bacsa RR Kulik AJ Stockli T
Burnham NA Forroacute L Phys Rev Lett 199982 (5)944-947
[11] Choi ES Brooks JS Eaton DL Haik MS Hussaini MY Garmestani
H Li D Dahmen KJ Appl Phys 2003946034-
[12] Sandler J Shaffer MSP Prasse T Bauhofer W Schulte K Windle
AH Polymer 199940(21)5967-5971
[13] Xiao-Lin X Yiu-Wing M Xing-Ping Z Materials Science and
Engineering R 20054989-112
[14] Jin L Bower C Zhou O Appl Phys Lett 199873 (9)1197-1199
[15] Choi ES Brooks JS Eaton DL Al-Haik MS Hussaini MY
Garmestani H Li D Dahmen KJ Appl Phys 2003945451-5473
CHAPTER 6 KINETIC DEGRADATIONS KISSINGER AND OZAWA
METHODS
61 The state of the art on Kissinger and Ozawa methods
for epoxy resin To study the accelerated ageing of polymers and to obtain the kinetic
parameters of decomposition such as the apparent activation energy we
must to extrapolate according to the environment where the materials
are used It is important to consider the degradation mechanisms both
in the environments where they are used both when they are under
accelerated ageing conditions
Thermogravimetric analysis is often used to determine decomposition
reactions and to evaluate the thermal stability The mass loss is
controlled by time in isothermal conditions or by temperature during
the heating rate Changes in mass can be associated with solvent or
water desorptionabsorption oxidation or reduction and decomposition
Dynamic TG tests tend to be shorter and the mechanism of degradation
may be studied over a large temperature range with typical heating rate
Regnier et al [1] in a previously work on polyimide polymer system
compared several methods to calculate thermal kinetic parameters
They showed that Van Krevelen Horowitz-Metzger Coats Redfern and
Mac-Callum-Tanner methods gave a similar apparent activation energy
All kinetic parameters calculated by using these methods showed
equally good agreement with the experimental data Afterwards Regnier
et al [2] investigated the thermal degradation of epoxycarbon
composites in dynamic conditions The activation energy have been
evaluated employing Kissingerrsquos method assuming first order reaction or
the Osawarsquos method which gives an estimated activation energy for the
overall degradation
Chapter 6 Kinetic degradation Kissinger and Ozawa methods
95
Kiefer et al [3] mentioned that the sample preparation had an effect on
the kinetic results It does seem that the kinetic parameters are divided
into two groups however depending whether or not the sample
contained fibres He observed that the resin is affecting the fibre
Wang et al [4] studied the degradation behaviours of epoxy resins
containing various flame retardant components by Kissinger Flynn-
Wall-Ozawa and Horowitz-Metzger methods They demonstrated that
the activation energy at lower degree of the degradation decreased by
incorporation of flame retardant components while increased at higher
degree of the degradation
Chiang et al [5] prepared epoxy nanocomposites containing silicon and
phosphorus and compared with pure epoxy by Kissingerrsquos method They
found that the activation energies of thermo-oxidative degradation for
epoxy nanocomposites are less than those of thermo-oxidative
degradation for pure epoxy in first stage of thermo-oxidative
degradation However the activation energies of thermo-oxidative
degradation for epoxy nanocomposites are more than those of thermo-
oxidative degradation for pure epoxy in second stage of thermo-oxidative
degradation
In the dynamic and isothermal TGA measurements the mass loss is
detected in function of temperature and kinetic of degradation is based
on nth order reaction mechanism and in the many cases the rate of
degradation is a linear function of temperature by a constant
dependent of temperature by Arrhenius equation
)(αα Kfdtd
= (1)
with
⎟⎠⎞
⎜⎝⎛ minus=
RTEAfk exp)(α
(2)
Chapter 6 Kinetic degradation Kissinger and Ozawa methods
96
The combination of (1) e (2) gives
⎟⎠⎞
⎜⎝⎛ minus=
RTEAf
dtd exp)(αα
(3)
If heating rate β=dTdt is constant the variation in degree of conversion
can be analysed as a function of temperature and this temperature
being dependent on the time of heating
⎟⎠⎞
⎜⎝⎛ minus=
RTEfA
dTd exp)(α
βα
(4)
The integrated form of this equation generally is expressed as
int int ⎟⎠⎞
⎜⎝⎛minus==
α
βααα
0 0
exp)(
)( dTRTEA
fdg
T
(5)
where g(α) is the integrated form of the conversion dependence function
Different kinetics methods (differential and integral) were applied in this
study
Kissinger method [6] makes it possible to determine the values of
activation energy without a precise knowledge of the reaction
mechanism and analyzes the changes in the thermo-gravimetric data
through the change of scan rate of heating β depending on the
temperature of the maximum peak in DTG curve That way you get
that
( )[ ]max
1max2
max
1lnlnlnRT
EnE
ART
n minus⎭⎬⎫
⎩⎨⎧ minus+=⎟⎟
⎠
⎞⎜⎜⎝
⎛ minusαβ
(6)
where Tmax is the temperature corresponding to the inflection point of
thermo degradation curves which corresponds to the maximum reaction
rate αmax is the conversion at Tmax and n is the reaction order
Chapter 6 Kinetic degradation Kissinger and Ozawa methods
97
Assuming that ( ) ( ) 1 1maxmax constnf n congminus=prime minusαα the activation energy E can
be determined from a plot of ln(βT2max) against 1Tmax
With Flynn-Wall-Ozawa method [7-9] it is possible to get values of
activation energy applying Doylersquos approximation to the integration of
Eq(5) You get that
RTE
RgAE 456703152
)(loglog minusminus⎥
⎦
⎤⎢⎣
⎡=
αβ
(7)
Using Eq7 it is possible to plot logβ against 1T and to consider the
slope of straight line which result with a various value of conversion
The graph that result report E in function of conversion degree
62 Kinetic degradations of RTM6 and inorganic
compounds For obtaining the kinetic information such as the activation energy the
TGA study has been conducted with the variation of the heating rates
The dynamic experiments were carried out at different heating rates 5
75 10 and 20 degCmin from ambient to 800degC with TA 2950
thermobalance in nitrogen and air atmosphere For each experiment
were used approximately 10 mg of materials and the kinetics
parameters of interest as activation energy relating to initial
degradation of mixtures were obtained by Kissinger and Flynn-Ozawa-
Wall methods
In figure 61 thermogravimetric analysis of the epoxy resin RTM6 in the
nitrogen atmosphere are reported The epoxy resin shows only one step
of degradation and the onset temperature is around 350degC while the
maximum temperature on the DTG curves shows a little difference in
the heating rate
Chapter 6 Kinetic degradation Kissinger and Ozawa methods
98
Figure 61 TGA thermograms of RTM6 neat in nitrogen atmosphere
Figure 62 DTG thermograms of RTM6 neat in nitrogen atmosphere
In table 61 the onset temperature and maximum temperature for
epoxy system neat are reported along with the corresponding heating
ramp
Chapter 6 Kinetic degradation Kissinger and Ozawa methods
99
Heating rate (degCmin) Tonset (degC) Tmax (degC) 5degCmin 305 372
75degCmin 320 381
10degCmin 330 388
20degCmin 348 403
Table 61 Tonset and Tmax of epoxy resin RTM6 in nitrogen atmosphere
In air atmosphere two different degradation steps spanning the whole
investigated temperature range are noticeable the first step occurring
at 350degC and a second much broader step within around 500-550degC
(fig 63 and 64) The second step was attributed to a decomposition of
the non-volatile residues formed in the first step
Figure 63 TGA thermograms of RTM6 neat in air atmosphere
Chapter 6 Kinetic degradation Kissinger and Ozawa methods
100
Figure 64 DTG thermograms of RTM6 neat in air atmosphere
In table 62 are reported Tonset and Tmax of epoxy resin in air atmosphere
for each step
I STEP
Heating rate (degCmin) Tonset (degC) Tmax (degC) 5degCmin 354 378
75degCmin 351 383
10degCmin 354 406
20degCmin 357 398
II STEP
Heating rate (degCmin) Tonset (degC) Tmax (degC) 5degCmin 475 517
75degCmin 524 556
10degCmin 523 568
20degCmin 544 597
Table 62 Tonset and Tmax of epoxy resin RTM6 in air atmosphere
Chapter 6 Kinetic degradation Kissinger and Ozawa methods
101
The Kissinger method was employed to obtain the apparent activation
energy (Ea) in air or nitrogen from several scan with different heating
rate (q) Figures 65 and 66 represent the Kissinger plots of the epoxy
resin degraded in nitrogen and air atmosphere
150 152 154 156 158 160 162 1641000 KT
0
02
04
06
08
10
log (Heating rate(Kmin))
Activation Energy(kJmol) 16452 +- 351log (As^-1) 1070
Figure 65 Kissinger graphs for RTM6 data in nitrogen atmosphere
-1 2
-1 1 5
-1 1
-1 0 5
-1 0
-9 5
-9
-8 5
0 0 0 1 1 0 0 0 1 2 0 0 0 1 3 0 0 0 1 4 0 0 0 1 5 0 0 0 1 6
I S tepII s tep
y = 68 38 3 - 5 2 03 6 x R = 0 9 9 9 4 3
y = 0 4 01 9 5 - 9 69 1 x R = 0 9 9 7 4 3
ln ( β
T max
2 )
1 Tm a x
degK -1
Figure 66 Kissinger graphs for RTM6 data in air atmosphere
Chapter 6 Kinetic degradation Kissinger and Ozawa methods
102
KISSINGER in nitrogen atmosphere
Ea (kJmol) 16452
KISSINGER in air atmosphere
I STEP II STEP
Ea (kJmol)
RTM6 NEAT
816 1157
Table 63 Kissinger data for epoxy resin RTM6 in nitrogen and air atmosphere
The kinetic parameters calculated in nitrogen flow present activation
energy values higher than Ea obtained in air flow In fact activation
energy value in nitrogen flow is 16452 kJmol instead in air flow is
816 kJmol for first step and 1157 KJmol for second step
The Flynn-Ozawa-Wall method was also carried out for calculating the
activation energy only in nitrogen atmosphere In figures 67 and 68 it
is reported respectively the Ozawa analysis and activation energy
calculated with Ozawa methods for epoxy resin RTM6 It is possible to
notice that in the nitrogen atmosphere the Ea increase from conversion
zero to 20 after Ea is a constant from =02 to =07 and than
increase until to =085
Chapter 6 Kinetic degradation Kissinger and Ozawa methods
103
10 12 14 16 18 201000 KT
06
08
10
12
14log Heating rate(Kmin)
002 098
Figure 67 Ozawa analysis for RTM6 in nitrogen atmosphere
0 02 04 06 08 10 FractMass Loss
40
80
120
160
200
E(kJmol)
Figure 68 Energy of activation calculated with Ozawa method for RTM6 in nitrogen
atmosphere
The thermogravimetric derivate signal for RTM6ZB 30 wt system is
showed in figure 69 for nitrogen atmosphere and in figure 610 for air
atmosphere
Chapter 6 Kinetic degradation Kissinger and Ozawa methods
104
Figure 69 DTG thermograms of RTM6+ZB 30wt in nitrogen atmosphere
Figure 610 DTG thermograms of RTM6+ZB 30wt in air atmosphere
Chapter 6 Kinetic degradation Kissinger and Ozawa methods
105
145 147 149 151 1531000 KT
06
08
10
12
14log (Heating rate(Kmin))
Activation Energy(kJmol) 15425 +- 2201log (As^-1) 971
Figure 611 Kissinger graphs for RTM6+ZB 30wt data in nitrogen atmosphere
-12
-115
-11
-105
-10
0001 00012 00014 00016 00018 0002
I stepII step
y = 15735 - 17745x R= 099679
y = 15931 - 21603x R= 099919
ln(β
Tm
ax2 )
1Tmax
Figure 612 Kissinger graphs for RTM6+ZB 30wt data in air atmosphere
The Kissinger analysis in nitrogen atmosphere has demonstrated that
the activation energy Ea is less than the value of epoxy resin hence it
doesnrsquot achieve the energy for the degradation of RTM6 neat Instead in
the Kissinger analysis in air atmosphere it is shown that the value of
Chapter 6 Kinetic degradation Kissinger and Ozawa methods
106
Ea in the second step is higher than the value of RTM6 in fact at the
temperature lower 500degC a char on the surface that protects the matrix
is produce
KISSINGER in nitrogen atmosphere
Ea (kJmol) 15425
KISSINGER in air atmosphere
I STEP II STEP
Ea (kJmol)
RTM6+ZB 30wt
14754 17962
Table 64 Kissinger data for RTM6+ZB 30wt in nitrogen and air atmosphere
10 12 14 16 18 201000 KT
06
08
10
12
14log Heating rate(Kmin)
002 098
Figure 613 Ozawa analysis for RTM6+ZB 30wt in nitrogen atmosphere
Chapter 6 Kinetic degradation Kissinger and Ozawa methods
107
0 02 04 06 08 FractMass Loss
40
60
80
100
120
140
160
E(kJmol)
Figure 614 Energy of activation calculated with Ozawa method for RTM6+ZB 30wt
in nitrogen atmosphere
In the nitrogen atmosphere the Ozawa analysis confirms the positive
effect of zinc borate on the epoxy resin RTM6 because with low
conversion values the activation energy Ea is less than 50kJmol while
for conversion degrees between 01 and 08 a multi-step degradation
process is shown The presence of this step means that several layers of
char on the surface of the RTM6 have been created
Chapter 6 Kinetic degradation Kissinger and Ozawa methods
108
Figure 615 DTG of RTM6+ATH 30 wt in nitrogen atmosphere
Figure 616 DTG of RTM6+ATH 30 wt in air atmosphere
Chapter 6 Kinetic degradation Kissinger and Ozawa methods
109
147 149 151 1531000 KT
06
08
10
12
14log (Heating rate(Kmin))
Activation Energy(kJmol) 18731 +- 971log (As^-1) 1247
Figure 617 Kissinger graphs for RTM6+ATH 30 wt data in nitrogen atmosphere
-5
-49
-48
-47
-46
-45
-44
-43
-42
00012 00014 00016 00018 0002 00022
I stepII step
y = -071912 - 22661x R= 099682
y = 80558 - 84061x R= 097719
log
(βT
max
2 )
1Tmax
Figure 618 Kissinger graphs for RTM6+ATH 30 wt data in nitrogen atmosphere
Chapter 6 Kinetic degradation Kissinger and Ozawa methods
110
-12
-115
-11
-105
-10
-95
0001 00012 00014 00016 00018 0002
I stepII stepIII step
y = 11477 - 12954x R= 099948
y = 23102 - 22194x R= 099906
y = 66365 - 14480x R= 099861
ln(β
Tm
ax2 )
1Tmax
Figure 619 Kissinger graphs for RTM6+ATH 30 wt data in air atmosphere
KISSINGER in nitrogen atmosphere
I STEP II STEP
Ea (kJmol)
18841 6989
KISSINGER in air atmosphere
I STEP II STEP III STEP
Ea (kJmol)
RTM6+ATH 30wt
1077 1845 1204
Table 65 Kissinger data for RTM6+ATH 30wt in nitrogen and air atmosphere
In this case there are three degradation steps in the Kissinger analysis
in air atmosphere of aluminium trihydrate By varying the temperature
the following process occurred sequentially
bull dehydration of hydroxyl groups
bull formation of aluminized layer protection
bull pyrolysis of char
Chapter 6 Kinetic degradation Kissinger and Ozawa methods
111
For every step it is possible to associate the activation energy which is
greater than Ea of RTM6 hence it represents a slower degradation
08 10 12 14 16 18 201000 KT
06
08
10
12
14log Heating rate(Kmin)
002 095
Figure 620 Ozawa analysis for RTM6+ATH 30wt in nitrogen atmosphere
0 02 04 06 FractMass Loss
20
40
60
80
100
120
140
160
180
E(kJmol)
Figure 621 Energy of activation calculated with Ozawa methods for RTM6+ATH
30wt in nitrogen atmosphere
Chapter 6 Kinetic degradation Kissinger and Ozawa methods
112
In the Ozawa analysis it is demonstrated that the Ea starts to lower
values than both RTM6 and ZB in fact Ea starts to 25 kJmol and two
different steps are observed In the first step Ea is 70 kJmol for =01
while in the second step Ea is 160 kJmol with conversation degree
between 02 and 07
The TGA thermograms of the epoxy resin containing zinc borate and
aluminium trihydrate is reported in figures 622 and 623 to study the
kinetic parameters for synergistic effects of zinc borate
Figure 622 DTG of RTM6+ATH+ZB 30 wt in air atmosphere
Chapter 6 Kinetic degradation Kissinger and Ozawa methods
113
Figure 623 DTG of RTM6+ATH+ZB 30 wt in air atmosphere
146 148 150 152 154 1561000 KT
06
08
10
12
14log (Heating rate(Kmin))
Activation Energy(kJmol) 12276 +- 1399log (As^-1) 717
Figure 624 Kissinger graphs for RTM6+ATH+ZB 30 wt system data in nitrogen
atmosphere
Chapter 6 Kinetic degradation Kissinger and Ozawa methods
114
-125
-12
-115
-11
-105
-10
-95
-9
0001 00012 00014 00016 00018 0002 00022
I stepII stepIII step
y = 27768 - 24989x R= 099954
y = 26545 - 24952x R= 099876
y = 11444 - 18156x R= 099963
ln(β
Tm
ax2 )
1Tmax
Figure 625 Kissinger graphs for RTM6+ATH+ZB 30wt system data in air
atmosphere
KISSINGER in nitrogen atmosphere
Ea (kJmol) 12276
KISSINGER in air atmosphere
I STEP II STEP III STEP
Ea (kJmol)
RTM6+ATH+ZB 30wt
2077 2075 1509
Table 66 Kissinger data for RTM6+ATH+ZB 30wt in nitrogen and air atmosphere
Chapter 6 Kinetic degradation Kissinger and Ozawa methods
115
10 12 14 16 18 201000 KT
06
08
10
12
14log Heating rate(Kmin)
002 098
Figure 626 Ozawa analysis for RTM6+ATH+ZB 30wt system in nitrogen
atmosphere
01 03 05 07 Fractional Reaction
100
200
300
400
500
600
700E(kJmol)
Figure 627 Energy of activation calculated with Ozawa methods for RTM6+ATH+ZB
30wt system in nitrogen atmosphere
Chapter 6 Kinetic degradation Kissinger and Ozawa methods
116
The presence of both additives is clear in the Kissinger analysis and the
synergistic effect is shown in the Ozawa analysis because at low levels
of alpha Ea is higher In fact Ea increases for values of alpha around 01
and remains constant value of 200 kJmol throughout the range of
conversion Consequently it is necessary a higher energy than in
respect to the same additives taken individually and RTM6 neat to
complete the degradation process
Figure 628 DTG of RTM6+ZS 30 wt in nitrogen atmosphere
Chapter 6 Kinetic degradation Kissinger and Ozawa methods
117
Figure 629 DTG of RTM6+ZS 30 wt in air atmosphere
152 154 156 158 1601000 KT
06
08
10
12
14log (Heating rate(Kmin))
Activation Energy(kJmol) 15759 +- 420log (As^-1) 1044
Figure 630 Kissinger graphs for RTM6+ZS 30 wt data in nitrogen atmosphere
Chapter 6 Kinetic degradation Kissinger and Ozawa methods
118
-12
-115
-11
-105
-10
-95
0001 00012 00014 00016 00018 0002
I stepII stepIII step
y = 31646 - 26873x R= 099793
y = 11934 - 15035x R= 099848
y = 79213 - 15008x R= 099838
ln(β
Tm
ax2 )
1Tmax
Figure 631 Kissinger graphs for RTM6+ZS 30 wt data in air atmosphere
KISSINGER in nitrogen atmosphere
Ea (kJmol) 1576
KISSINGER in air atmosphere
I STEP II STEP III STEP
Ea (kJmol)
RTM6+ZS 30wt
2234 125 1248
Table 66 Kissinger data for RTM6+ZS 30wt in nitrogen and air atmosphere
Zinc stannate is similar to ATH for Kissinger analysis because also in
this case there are three degradation steps The discussion on the
structure of char isnrsquot like ATH because there isnrsquot the aluminium and
because the second and third degradation step need a lower energy to
be completed hence it is explained that the protection action is partly
missing
Chapter 6 Kinetic degradation Kissinger and Ozawa methods
119
10 12 14 16 18 20 22 24 261000 KT
06
08
10
12
14
log Heating rate(Kmin)
002 098
Figure 632 Ozawa analysis for RTM6+ZS 30wt in nitrogen atmosphere
0 02 04 06 08 FractMass Loss
0
40
80
120
160
200
E(kJmol)
Figure 633 Energy of activation calculated with Ozawa methods for RTM6+ZS in
nitrogen atmosphere
Chapter 6 Kinetic degradation Kissinger and Ozawa methods
120
In the Ozawa analysis in nitrogen atmosphere the activation energy has
a maximum peak of 200 kJmol around to =06 and neither a constant
evolution nor several degradation steps are shown
Figure 634 DTG of RTM6+ZHS 30 wt in nitrogen atmosphere
Figure 635 DTG of RTM6+ZHS 30 wt in air atmosphere
Chapter 6 Kinetic degradation Kissinger and Ozawa methods
121
151 153 155 157 1591000 KT
06
08
10
12
14log (Heating rate(Kmin))
Activation Energy(kJmol) 14931 +- 1257log (As^-1) 975
Figure 636 Kissinger graphs for RTM6+ZHS 30 wt data in nitrogen atmosphere
-49
-48
-47
-46
-45
-44
-43
-42
-41
00012 00014 00016 00018 0002 00022
I stepII step
y = 1713 - 10920x R= 09957
y = 11529 - 10291x R= 099916
log
(βT
max
2 )
1Tmax
Figure 637 Kissinger graphs for RTM6+ZHS 30 wt data in nitrogen atmosphere
Chapter 6 Kinetic degradation Kissinger and Ozawa methods
122
-125
-12
-115
-11
-105
-10
-95
0001 00012 00014 00016 00018 0002 00022
I stepII stepIII stepIV step
y = 30807 - 22469x R= 099707
y = 30543 - 26147x R= 099778
y = 755 - 56705x R= 099954
y = 83073 - 15323x R= 099946
ln(β
Tm
ax2 )
1Tmax
Figure 638 Kissinger graphs for RTM6+ZHS 30 wt data in air atmosphere
KISSINGER in nitrogen atmosphere
I STEP II STEP
Ea (kJmol)
908 85564
KISSINGER in air atmosphere
I STEP II STEP III STEP IV STEP
Ea (kJmol)
RTM6+ZHS 30wt
1868 2174 4715 1274
Table 67 Kissinger data for RTM6+ZHS 30wt in nitrogen and air atmosphere
Zinc hydroxystannate shows four degradation steps therefore the
degradation mechanism is particularly complex and to create the
protective layer a high energy contribution (471 kJmol) is necessary
Chapter 6 Kinetic degradation Kissinger and Ozawa methods
123
14 16 18 20 221000 KT
06
08
10
12
14log Heating rate(Kmin)
002 080
Figure 639 Ozawa analysis for RTM6+ZHS 30wt in nitrogen atmosphere
0 02 04 06 FractMass Loss
60
100
140
180
220
260
E(kJmol)
Figure 640 Energy of activation calculated with Ozawa methods for RTM6+ZHS in
nitrogen atmosphere
In the Ozawa analysis there are several steps and Ea is constant at the
value of 180 kJmol between alpha 01 to 05 and Ea increases until
Chapter 6 Kinetic degradation Kissinger and Ozawa methods
124
270 kJmol where is obtained to complete the degradation process of
degradation
63 Kinetic degradations of RTM6 and carbon nanotubes The thermal properties of CNTspolymer composites also attracted
many attentions from polymer scientists because CNTs have very high
thermal stability [10-14] Yang et al [11] reported the effect of single-
walled carbon nanotubes (SWNTs) on the thermal stability of
acrylonitrileebutadienee styrene (ABS)SWNTs composites They found
that the addition of SWNTs destabilized ABS and caused the composites
to degrade at lower temperatures Probst et al [12] revealed that
MWNTs promote the degradation of polyvinyl alcohol In contrast
Kashiwagi et al [13] observed an increased thermal stability of
MWNTspolypropylene (PP) composites The same effect of MWNTs on
PP was found by Yang et al [14] From the above publications both
promoting and hindering effects of CNTs on the thermal stability of
polymer are found The structure of the polymer matrix and the
interaction between CNTs and the matrix may be the key factors for the
thermal degradation behaviour of CNTs filled polymer composites
DTG curves of RTM6 with 01wt MWNTs under nitrogen and air
environments are showed in figures 639 and 640 respectively One
step decomposition is found under nitrogen atmosphere while two step
decomposition (second step from 450degC to 700degC) are found under air
atmosphere
Heating rate (degCmin) Tonset (degC) Tmax (degC) 5degCmin 317 376
75degCmin 334 387
10degCmin 334 391
20degCmin 348 404
Table 68 Tonset and Tmax of RTM6+MWNT 01wt in nitrogen atmosphere
Chapter 6 Kinetic degradation Kissinger and Ozawa methods
125
Figure 641 DTG of RTM6+MWNT 01wt in nitrogen atmosphere
Figure 642 DTG of RTM6+MWNT 01wt in air atmosphere
Chapter 6 Kinetic degradation Kissinger and Ozawa methods
126
147 149 151 153 1551000 KT
06
08
10
12
14log (Heating rate(Kmin))
Activation Energy(kJmol) 18936 +- 1296log (As^-1) 1269
Figure 643 Kissinger graphs for RTM6+MWNT 01wt data in nitrogen atmosphere
The Ea of neat RTM6 is found to be 164 KJmol while MWNTsRTM6
composites is found to be 189 KJmol suggesting that the MWNTs
increase the thermal stability of RTM6 under nitrogen atmosphere
-12
-115
-11
-105
-10
0001 00012 00014 00016 00018 0002
I stepII stepIII step
y = 11748 - 14660x R= 099802
y = 32132 - 97535x R= 099862
y = 38629 - 12408x R= 099656
ln(β
Tm
ax2 )
1Tmax
Figure 644 Kissinger graphs for RTM6+MWNT 01wt data in air atmosphere
Chapter 6 Kinetic degradation Kissinger and Ozawa methods
127
There are three steps although the small amount of carbon nanotubes
demonstrates that the degradation process has been altered The first
step is given by the of epoxy resin with carbon nanotubes The second
step is divided in two steps where in the first is lower than of the resin
and the second step is the pyrolysis of the char that happens with an
additional energy contribution
12 14 16 18 201000 KT
06
08
10
12
14log Heating rate(Kmin)
002 095
Figure 645 Ozawa analysis for RTM6+MWNT 01 wt in nitrogen atmosphere
In the Ozawa data a higher thermal stability than RTM6 is shown
because Ea starts by higher values but it is stable at about 200 kJmol
for alpha between 01 and 09
Chapter 6 Kinetic degradation Kissinger and Ozawa methods
128
0 02 04 06 08 FractMass Loss
60
80
100
120
140
160
180
200
E(kJmol)
Figure 646 Energy of activation calculated with Ozawa methods for RTM6+MWNT
01 wt in nitrogen atmosphere
64 Analysis of residue In the figure 647 a graph comparing dynamic measurements carried
out with scan rate of 10degCmin in air flow on all the samples tested in
this study is reported It is possible to notice that addition of zinc
compounds in the epoxy matrix does not induce big differences in the
first two stages of degradation except for the initial temperature of
degradation that increase for samples containing ZS and ZB For the
samples containing ZHS and ATH there is a difference in the first step
of degradation which occurs at around 220degC and these temperature is
characteristic of dehydration of crystallisation water For the samples
with ZS and ZB the loss of crystallisation water occur at higher
temperatures and this process is concomitant with the first step of
epoxy matrix degradation which happens in airflow at a temperature of
about 350degC and concern the dehydration of hydroxyl functions
The char oxidation stage occurs for the RTM6 neat in the temperature
range (513-627degC) instead for the samples containing flame retardant
Chapter 6 Kinetic degradation Kissinger and Ozawa methods
129
zinc compounds this range of temperature decrease It is possible to
notice larges differences for the residue of dynamic experiments carried
on samples flame retardants in oxidant atmosphere (tab 69) The flame
retardant zinc based promote char formation more efficiently at
temperatures lower than the epoxy RTM6 Zinc borate in the epoxy
matrix RTM6 induce formation of stable char at 554degC and residue is
about 32 of initial weight with weight loss in the third stage of 24
RTM6 with ZS form the char stable at the same temperature of sample
containing ZB but the residue in this case is lower than ZB (27)
Similarly RTM6 with ZHS show a residue equal at 14 lower than the
initial addition of flame retardant in the resin matrix (20) and the char
formation occurs at temperatures of 551degC
Figure 647 Comparison of additives at 10degCmin in dynamic mode and in air
atmosphere
Chapter 6 Kinetic degradation Kissinger and Ozawa methods
130
Temperature (degC)
Sample at 10
weight
loss
charring
stage
initial char
formation
weight
loss
III stage
of
char
at
800degC
RTM6 357 530-604 636 38 1
RTM6+ZS 359 492-527 555 35 24
RTM6+ZHS 356 498-530 559 40 17
RTM6+ZB 376 485-558 554 24 32
RTM6+ATH 374 509-582 628 36 9
Table 69 Analysis of last step of degradation in air flow
According to the Flynn-Ozawa-Wall analysis data it is possible to notice
that in air flow for RTM6 during the first stage of degradation occur
chain scission by thermolysis and there is the formation of thermally
more stable molecular compounds To destroy this compound it is
needed another stage of degradation that occurs with activation energy
and temperatures higher than first stage In the presence of flame
retardant compounds the second and third stage of degradation
concerns the segments of chain liberated that migrates in the surface of
samples A parts of these segments are volatiles but most of these
segments react with zinc compounds and form a layer of char stable
that delay the oxidation of matrix The sample containing ZB shows
higher efficiency of this process in the formation of char in the epoxy
matrix
Chapter 6 Kinetic degradation Kissinger and Ozawa methods
131
References [1] Regnier N Guibe C Polymer Degradation and Stability 1997
55165
[2] Regnier N Fontaine S Journal of Thermal Analysis and Calorimetry
2001 64789
[3] Kiefer R Yue J Hinkley J Journal of Advanced Materials 1995
2655
[4] Wang Q Shi W Polymer Degradation and Stability 2006 911747-
1754
[5] Chiang CL Ma CCM Wang FY Kuan HC European Polymer
Journal 2003 39825-830
[6] Kissinger HE Anal Chem 1957 291702-1706
[7] Flynn JH Wall LA J Res Nat Bur Stand A Phys Chem 1996
70A487
[8] Ozawa T Bull Chem Soc Jpn 1965 381881
[9] Doyle CD Nature 1965 207240
[10] Beyer G Fire Mater 200226(6)291-3
[11] Yang SY Castilleja JR Barrera EV Lozano K Polym Degrad Stab
200483383-8
[12] Probst O Moore EM Reasaco DE Grady BP Polymer 200454437-
43
[13] Kashiwagi T Grulke E Hilding J Harris R Awad W Douglas J
Macromol Rapid Commun 200223(13)761-5
[14] Yang J Lin YH Wang JF Lai MF Li J Liu JJ et al J Appl Polym
Sci 200598 1087-91
CHAPTER 7 CONCLUSIONS AND FUTURE PERSPECTIVES
71 Conclusions In this work the flame retardant and thermal mechanical properties of
an monocomponent epoxy resin additived with micro and nano fillers
are studied The experimental study is based on cone calorimeter
analysis and thermo-mechanical analysis and on the study of kinetic
parameters by Kissinger and Ozawa methods
Through the cone calorimeter test it has been demonstrated that the
zinc borate resulted as the best additive as it concerns the 30 and
40 percentages Furthermore the flame retardant effect of zinc borate
on the Epoxy resin neat is highlighted when it is synergistically used
with ATH instead as ZS and ZHS are concerned ZHS performs better
at the above mentioned percentages This comes up also by Kissinger
analysis (performed both in nitrogen atmosphere and in air atmosphere)
as ZHS shows two steps in nitrogen atmosphere (so as ATH does) and
epoxy resin neat shows one step In air atmosphere ZHS shows four
steps and epoxy resin neat shows two steps As the Ozawa model is
concerned the union of ZB and ATH improves the activation energy
From the residue analysis we can notice that ZB is the best additive
both regarding the char-formation temperature both regarding the
morphology
Thermo-mechanical analysis shows that all the additives provide an
improvement of the composites thermal expansion coefficient such as it
decreases upon the addition of additives respect to the neat resin
About nanotubes the used percentage is too low to observe any
meaningful effects in all of the analyses undertaken in this study
To conclude zinc borate is in the light of all performed analyses the
best additive the percentages where the effect of the additive can be
sensibly observed are 30 and 40
Chapter 7 Conclusions and future perspectives
133
72 Future Perspectives From our conclusions it is possible to suggest further studies on ZHS
and on its synergistic effect and an investigation on a possible synergy
between the used additives and the nanotubes As for nanotubes they
should be chosen with a higher statistical percolation threshold so to
use a higher additivation percentage
Moreover an interesting topic for future work is the comprehension of
the degradative mechanisms related to additives in terms of their
chemical properties and their interaction with the resin This study can
be carried out by means of FTIR and XRD analysis The study of the
actual mechanisms of degradation during the different heating steps
could lead to a better knowledge of kinetic parameters of the composite
systems
About fibres reinforced resin composites the study of the effects of
different lay-up methods on the thermal properties of the additivated
composites could lead to the improvement of their flame retardant
properties
- 1pdf
- 2cpdf
- 3bpdf
- 4pdf
- 5pdf
- 6pdf
- 7pdf
- 8bpdf
- 9pdf
- 10bpdf
- 11pdf
-
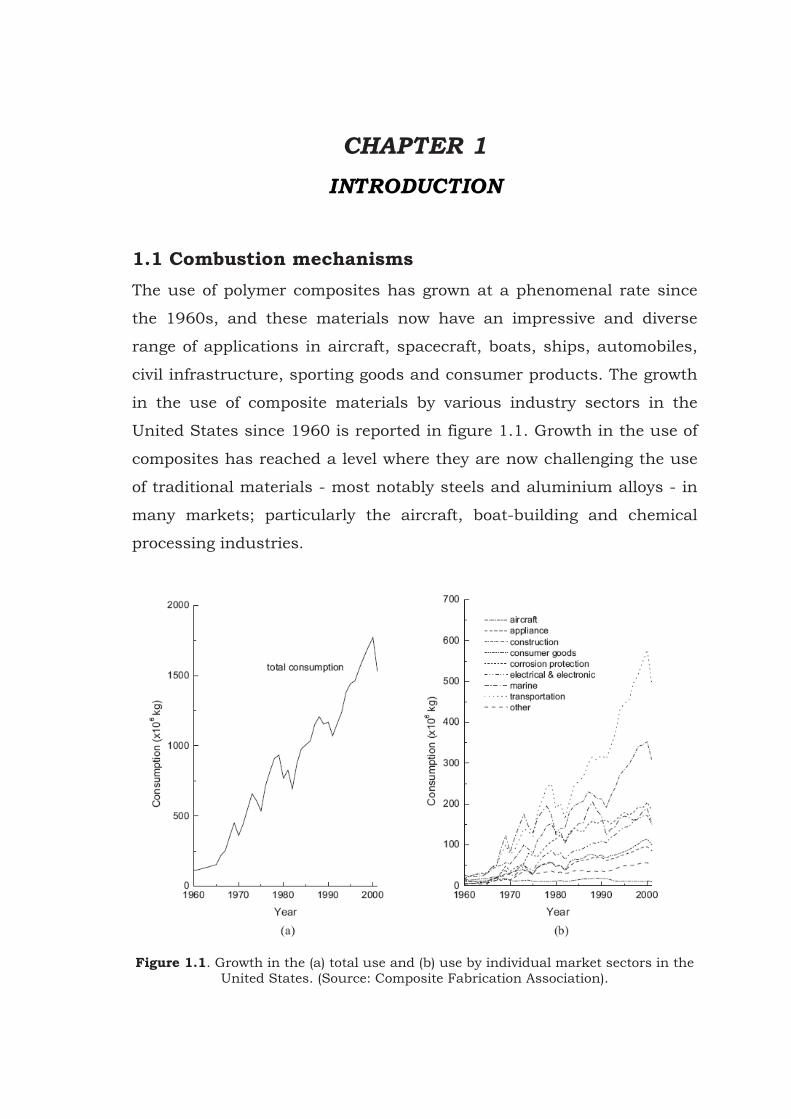

Chapter 1 Introduction
2
The use of composites in a wide variety of applications is due to their
many outstanding physical thermal chemical and mechanical
properties Key advantages of composites over many metal alloys
include low density high specific stiffness and specific strength good
fatigue endurance excellent corrosion resistance outstanding thermal
insulation and low thermal expansion However there are several
disadvantages with composites that have impacted on their growth in
some markets Composites are plagued by problems such as low
through-thickness mechanical properties poor impact damage
tolerance and anisotropic properties A major disadvantage of many
composite materials is poor performance in fire When composites are
exposed to high temperatures (typically above 300-400degC) the organic
matrix decomposes with the release of heat smoke soot and toxic
volatiles Composites also soften creep and distort when heated to
moderate temperature (gt100-200degC) that can result in buckling and
failure of load-bearing composite structures The heat smoke and gases
released by a burning composite and the degradation in structural
integrity can make fire-fighting extremely hazardous and increase the
likelihood of serious injury and death The susceptibility of composites
to fire has been the key issue in curtailing their use in many
infrastructure and public transportation applications
Although many polymer composites are flammable their resistance to
pyrolysis can be improved Furthermore these materials possess some
potentially useful properties in fire that are not inherent with metals
Composites have excellent thermal insulation properties and slow burn-
through The rate of heat conduction through composites is much
slower than metals and this is a significant benefit is slowing the
spread of fire from room-to-room Composites can provide an effective
protective barrier against flame heat smoke and toxic fumes
Fire is a complicated phenomenon that can develop in stages of
increasing temperature and size before decaying The fire event becomes
Chapter 1 Introduction
3
more complex when a polymer composite material is involved because it
can control the temperature size and spread of the flame A turbulent
flame consists of three zones and from the base to top can be divided
into the solid flame region intermittent flame region and thermal plume
(Fig 12) The solid flame region near the plume base is where the
majority of the flammable vapours undergo exothermic chain-branching
reactions that generate most of the heat
The temperature within this zone is reasonably constant at about 830-
900degC for most types of solid fuels [1] although the maximum
temperature in hydrocarbon pool fires and natural gas flames can reach
1150-1250degC [2] Above the solid flame is the intermittent flame region
and the temperature drops continuously the higher up this zone The
average temperature at the visible tips of a flame is about 400degC [3]
although it can vary over a wide range from 300 to 600degC [1] The
boundary between the solid flame and intermittent regions is not well
defined in a turbulent flame and some overlap or changes in the
boundary location do occur Above the flame tips is the thermal plume
region where no flames are visible and the temperature drops with
height The thermal plume consists of hot gases vapours and soot
particles that can carried upwards by convective heat
Figure 12 Schematic showing the different zones within a turbulent plume
Chapter 1 Introduction
4
The initiation and growth of fire is determined by a multitude of factors
including the type (caloric value) of fuel fuel load fuel size (area)
oxygen content in the flame wind speed and whether the fire is within
an open or enclosed space In the case of polymer composites exposed
to fire the material itself can be a rich source of fuel that causes the
temperature to rise and the flame to spread
A serious concern with using composites in enclosed spaces such as an
aircraft cabin ship compartment or rail carriage is that the heat
smoke and toxic gases are trapped which seriously increases the fire
hazard It is therefore useful to examine the development of fire within a
closed compartment Figure 13 shows how the temperature can vary
with time for a closed compartment fire
Figure 13 Growth stages of a compartment fire
A fire can undergo several stages of growth and in order these are
1 Ignition This is the point when the fuel source ignites and
undergoes sustained flaming combustion
2 Growth The initial growth of a fire is dependent mainly on the
fuel itself with little or no influence from the combustible
materials within the compartment The fire will grow and the
compartment temperature will continue to rise if sufficient fuel
and oxygen are available It is often in this stage that composite
Chapter 1 Introduction
5
materials exposed to the flame will ignite when the temperature
exceeds 350-500degC
3 Flashover This occurs when the fire is fully developed and all
combustible items in the compartment (including any composite
materials) are involved in the fire Flashover usually occurs when
the average upper gas temperature in the room exceeds about
600degC
4 Fully developed fire This stage occurs when the heat release
rate and temperature of a fire are at their greatest The peak
temperature of a typical post-flashover room fire is 900-1000degC
although it can reach as high as 1200degC
5 Decay The final decay stage occurs as the fuel and combustible
materials become consumed causing the compartment
temperature to fall Obviously decay can also be caused by active
fire suppression systems such as sprinklers
When a composite is heated to a sufficiently high temperature the
polymer matrix and (if present) organic fibres will thermally decompose
Most polymer matrixes and organic fibres decompose over the
temperature range of about 350 to 600degC with the production of
flammable gases Decomposition occurs by a series of reactions that
breaks down the polymer chains into low molecular weight volatiles that
diffuse into the flame Depending on the chemical composition and
molecular structure of the polymer the thermal degradation reactions
may proceed by various paths The majority of organic resins and fibres
used in composites degrade thermally by a random chain scission
process This basically involves the break-down of the long organic
chains at the lowest-energy bond sites into small fragments Polymers
can also decompose by other processes including de-polymerisation
(that involves the breakdown of the chain into monomers) and chain-
end initiated scission (that involves the process starting from the chain
ends and propagating along the chain length until it is completely
degraded)
Chapter 1 Introduction
6
The combustion cycle of organic polymers is illustrated in fig 14 and
the cycle stops only when the fuel source has been exhausted which is
usually when the organic components in a composite have been
completely degraded
It is common practice by fire scientists to quantify the intensity of a fire
by the radiant heat flux rather than flame temperature
Figure 14 The combustion cycle of organic polymers
The diverse range of uses for composite materials means they can be
exposed to a variety of fire threats and their increasing use in high fire
risk applications raises the likelihood of severe fire incidents Several
case studies of fires in aircraft and ships are given to demonstrate the
importance of understanding the fire behaviour of composites and the
need for more flame resistant polymeric materials
The fire behaviour of composites materials is distinct by two important
properties Fire reaction and Fire resistant
Fire reaction describes the flammability and combustion properties of
a material from ignition to flashover and also explains the smoke
toxicity of a combustible material The fire reaction properties that
influence fire growth are the heat release rate time to ignition flame
spread rate and oxygen index
Chapter 1 Introduction
7
The heat release rate (HRR) is a quantitative measure of the amount
of thermal energy released by a material per unit area when exposed to
a fire radiating a constant heat flux (or temperature) and his unit is
kWm2 The heat release rate value of a composite material is
determined by the thermal energy liberated in several thermo-chemical
decomposition processes with the most important being exothermic
combustion at the compositeflame boundary of flammable gas
products released by the decomposing polymer matrix and (if present)
organic fibres Two parameters describe the heat release rate average
HRR and peak HRR The average heat release rate is the averaged
value over a certain period of time (usually three or five minutes) The
peak heat release rate is the maximum amount of heat liberated by a
material during the combustion process and it often occurs over a very
short period of time (less than a few seconds) The peak heat release
rate is considered a critical property controlling the maximum
temperature and flame spread rate
Time to ignition (TTI) is the period that a combustible material can
withstand exposure to a constant radiant heat flux before igniting and
undergoing sustained flaming combustion
Flame spread rate describes the speed at which the flame front will
travel over the surface of a combustible material The flame spread rate
is an experimentally measured value and various experimental
techniques with important differences in test configuration are used
Some tests are used to measure the rate of flame spread in a downward
direction while other techniques measure it in a vertical or inclined
direction Consequently the value for flame spread rate is test-
dependent Oxygen index is defined as the minimum oxygen content in
the fire environment required to sustain flaming combustion of a
material Materials with high oxygen index values should be used in
high fire risk applications particularly for internal structures and
components because they offer the potential to self-extinguish when
the fire becomes deprived of oxygen
Chapter 1 Introduction
8
Two other important fire reaction properties are smoke density and gas
toxicity because they have a major impact on the ability of humans to
survive a fire Smoke density is defined and measured in several ways
but basically it is the concentration of smoke particles (eg soot water
vapour) within the plume of a fire Gas toxicity is a generic term that
describes the concentration and lethality of gas products within the
smoke plume
While many fire reaction properties are important in the development of
fire up to the point of flashover the fire resistant properties are critical
when the fire has fully developed
Fire resistance defines the ability of a material or structure to impede
the spread of fire and retain mechanical integrity In other words fire
resistance describes the ability of a construction to prevent a fire from
spreading from one room to neighbouring rooms Fire resistance also
describes the ability of a construction to retain structural integrity (ie
shape load-bearing properties) in a fire The main fire resistant
properties are heat insulation burn-through resistance and structural
integrity Heat insulation is simply the resistive property that describes
the rate of heat conduction through a material when exposed to fire
Obviously materials that are good heat insulators are best suited for
slowing the spread of fire from room-to-room and this is one of the
attributes of composites compared to metals Burn-through resistance
is the time taken for a flame to penetrate a material and emerge from
the opposing side Composites generally have better burn-through
resistance than metals that melt at temperatures below the flame
temperature such as aluminium alloys Mechanical integrity is
another important fire resistant property and this defines the ability of
a material or structure to retain mechanical properties such as
stiffness creep resistance and strength when exposed to fire and after
the fire has been extinguished The behaviour of composites materials
in fire is based by chemical and thermal decomposition of the matrix
used In figure 15 is showed the decomposition process of polymer
Chapter 1 Introduction
9
composites exposed to a heat flux radiated from a fire When the
material is exposed to a fire the matrix decomposes to volatile gases
solid carbonaceous char and smoke The volatiles consist of a variety of
vapours and gases both flammable as carbon monoxide methane low
molecular organics and non flammable as carbon dioxide and water
The flammable volatiles extend from composites material into the flame
zone where they react with oxygen and lead to the formation of the final
combustion products accompanied by the liberation of heat
Figure 15 The decomposition mechanisms of composites materials
Several analytical technique can be used to characterise the
decomposition reactions and the chemical nature of the reaction
volatiles of polymers The three important technique are TGA in which
the weight loss is measured with increasing temperature or time
differential scanning calorimetry (DSC) in which heat absorption or
evolution due to chemical changes of the polymer are measured and
gas chromatographymass spectrometry (GCMS) in which the
chemical composition of the volatile gases are determined Other
methods may also be used including thermal volatilisation analysis
(TVA) and differential thermal analysis (DTA) It is often necessary to
use a combination of methods to obtain a complete understanding of
the decomposition reaction rate reaction mechanisms volatile gases
and char yield
Chapter 1 Introduction
10
12 Fire test for composites materials
A large quantity of information is available on the fire reaction
properties of polymer composites and the level of fire hazard associated
with their use is known for a large number of materials We also have a
good understanding of the chemical thermal and physical mechanisms
that control reaction properties such as time-to-ignition heat release
rate flame spread rate smoke production and toxicity
In short we have quite a good quantitative understanding of the fire
reaction behavior of composites Unfortunately less is known about the
fire resisting properties such as burn-through resistance dimensional
stability and structural integrity especially when the structure is under
load Moreover it is not usually possible to estimate the fire resistive
behavior based solely on the known fire reaction properties A
composite that has good fire reaction properties such as low heat
release rate and smoke yield may not necessarily have good fire
resistive properties Composites with a polymer matrix having high
thermal stability decomposition temperature and char yield may not
necessarily have better fire resistive properties than more flammable
materials
The first fire test was developed in the early twentieth century and over
the last one hundred years a large number of tests have been used to
characterise the fire properties of combustible materials The number of
tests available to characterise fire reaction is now immense For
example the American Society for Testing and Materials (ASTM) have
over 80 fire test standards in the 1999 edition of their handbooks on
testing standards The standards are applicable to a wide range of
materials including building products woods plastics and other
combustible materials None of the ASTM fire standards are specific to
polymer composites but are instead generic to a wide range of
materials The ASTM is one of many international standardisation
organisations that publish fire test methods Not all of the tests of
Chapter 1 Introduction
11
course are relevant for testing composites many tests are only suitable
for evaluating building materials woods or some other type of
combustible material Only a relatively small number of tests are
suitable for determining the fire properties of composite materials or
structures
Experimental techniques used to measure the fire properties of
composites range in size from bench-top apparatus for testing small
specimens weighing only a few grams up to full-scale tests for large
structures
Regardless of scale it is important that fire reaction tests are performed
in conditions that closely replicate the type of fire to which the
composite will be exposed These fires range in heat flux from low
intensity fires were the radiant heat flux is under 20 kWm2 to intense
fires were the heat flux can exceed 150 kWm2
The range of test methods for determining the fire reaction and fire
resistive properties of composites is clearly very diverse although some
attempts are now being made to rationalize this situation The tests
vary in scale and complexity and considerable care must be exercised
when selecting the most appropriate procedure Most fire reaction
testing is performed using bench-scale apparatus because of the lower
cost and greater simplicity Test methods such as the cone calorimeter
OSU calorimeter and radiant flame spread technique have an excellent
track record and are widely used for determining the fire behaviour of
composites However the problem of scaling-up from small-scale test
results to fire performance of large structures in real fires is a major
difficulty
Problems common to bench-scale tests are that the ignition heating
and atmospheric (oxygen content) conditions are not representative of
an actual fire The growth and spread of fire cannot be accurately
replicated using these tests and it is usually not possible to achieve
flashover Further the specimens are rarely tested in the end-use
condition
Chapter 1 Introduction
12
Large-scale fire tests such as the room calorimeter avoid many of the
problems associated with small size and allow the composite article to
be tested in the end-use condition However large fire tests are
generally slow and expensive to perform and may only produce data
relevant to one particular situation [4]
It is also important to recognise that no single test method is adequate
to evaluate all the fire properties of a composite Table 11 lists the
properties that can be determined using the test methods Of these it is
those methods capable of determining the heat release rate that are
most important when characterising the fire reaction of composites
While a few methods have the capability to determine the heat release
rate together with several other properties it is necessary to use two or
more methods to obtain a complete understanding of the fire behaviour
of a composite material
Table 11 The decomposition Fire reaction properties measured using test methods
Chapter 1 Introduction
13
References [1] HIngason Two dimensional rack storage fires Proceedings of the
Fourth International Symposium on Fire Safety Science 19941209-
1220
[2] KS Mudan and PA Croce Fire hazard calculations for large open
hydrocarbon fires in SFPE Handbook of Fire Protection Engineering
ed PJ DiNenno et al 1995 2-13
[3] H Inganson and J de Ris Flame heat transfer in storage
geometries Journal of Fire Safety 1997
[4] Mouritz AP Gibson AG Fire Properties of Polymer Composite
Materials Springer
CHAPTER 2 MATERIALS
21 Thermosetting resin RTM6 Epoxy resins are used worldwide on a large scale for adhesive
lamination coating casting applications and contain a very large
number of chemical types All such resins rely on the reactivity of the
three member epoxy group at both ends of the molecule Other more
complex types of epoxy resins are employed when a higher level of
functionality is needed ie when a grater number of cross-linking points
per epoxy group (fig21) is required as for instance in some of the
higher performance resins used in aerospace Traditionally epoxy
resins are cured by reacting them with amines or anhydrides these
materials being known as ldquohardenersrdquo There are also catalysts that will
polymerise the resin via the end groups and hydroxyls without the need
for a hardener
Figure 21 Epoxy group
Many epoxy resins and hardeners are viscous or even solid at room
temperature and may require preheating or dilution to lower their
viscosity prior to processing into composites Further heating
sometimes to temperatures up to 150-180degC is often needed to promote
resin gelation and curing Nevertheless epoxies are used in all the
traditional composite processes including wet laminating resin
transfer moulding and filament winding Decomposition of most epoxies
occurs via random chain scission reactions over the temperature range
of about 380 to 450degC
Chapter 2 Materials
15
HexFlowreg RTM6 provided by Hexcel is a premixed monocomponent
epoxy resin system specially developed to fulfil the requirements of the
aerospace and space industry in advanced resin transfer moulding
processes (RTM) The expected service temperatures of final products
range from -60degC to 180degC At room temperature RTM6 is a transluced
paste and its viscosity drops very quickly upon heating The uncured
resin has a density of 1117 gcm3 and the fully cured resin 1141
gcm3 When fully cured it exhibits high glass transition temperatures
excellent hot wet properties and low moisture absorption According to
the manufacturer the shelf life of this resin at 23degC is at least 15 days
whereas at -18degC it is approximately 9 months [1]
The main advantage of this epoxy resin called RTM6 is that it is a
monocomponent system and is already degassed and its properties are
reported in table 21
Epoxy resin RTM6
Tg0 -11degC
Tginfin 190degC
Density uncured resin (gcm3) 111 at 25degC
Density cured resin (gcm3) 114 at 25degC
Table 21Properties of monocomponent epoxy resin
In figures 22 and 23 are reported the molecule from which RTM6
derives carbon glycidyl diamino-diphenyl-methane (TGDMM) and the
molecule-diamino-diphenyl sulfone (DDS) as agent crosslinker
Chapter 2 Materials
16
Figure 22 Formula of structure of TGDDM
Figure 23 Formula of structure of DDS
211 Characterization of RTM6
To define the parameters of resin process a preliminary screening by a
kinetic analysis by differential scanning calorimeter (DSC) is necessary
to understand the mechanisms with which the molecules inside the
composites are organized depending on the temperature variations In
figure 24 and 25 the kinetic analysis dynamical and isothermal of
epoxy resin RTM6 neat are reported
Chapter 2 Materials
17
-05
0
05
1
15
2
25
-100 0 100 200 300 400
10degCmin75degCmin5degCmin25degCmin1degCmin
Hea
t flo
w W
g
TemperaturedegC
Figure 24 Dynamic analysis of RTM6 neat
-01
0
01
02
03
04
05
06
07
0 50 100 150 200 250 300 350 400
120degC140degC160degC180degC190degC200degC
Hea
t flo
w W
g
Time min
Figure 25 Dynamic analysis of RTM6 neat
The dynamical analysis (fig24) show that the reticulation peak has a
maximum at the temperature 241degC and a energy amounted to 470Jg
From the data of the isotherm analysis (fig25) it is clear that curing for
90 minutes at 160degC results in a cross-linking of molecules equal to
Chapter 2 Materials
18
83 In addition to obtain a complete cross-linking there should be a
next step of treatment at a temperature greater than 160degC but that
does not exceed the value of glass transition temperature of 196degC
The choice of temperature for the second step of treatment was 180degC
because the isothermal measure carried out this value of temperature is
slow enough to allow the molecules to rearrange within the matrix
partially cured before completing the reaction
22 Micro materials Introduction on flame retardants Flame retardation is a process by which the normal degradation or
combustion of polymers is altered by addition of certain chemicals
Some plastics are inherently fire retardant or smoke retardant and their
fire performance is acceptable for certain applications However [2] for
many plastic materials it is necessary to improve their fire performance
by incorporating flame retardants
Flame retardants are chemical agents which are added to combustible
materials to make them more resistant to ignition and they are intended
to minimise the risk of a fire starting in case the contact with a small
heat source Hence the term ldquoflame retardantsrdquo describe a function and
not a chemical class and their aim is to break the cycle of self-
combustion of polymeric materials reducing the speed of chemical and
physical process that develop Often they are applied in combinations
and this variety of products is necessary because the materials are very
different in nature and composition
Flame retardants interfere with combustion processes during a
particular stage of this process during heating decomposition ignition
or flame spread and the amount of flame retardant one has to add to
achieve the desired level of fire safety can range from less than one
percent for highly effective flame retardants up to more than 50 percent
for inorganic fillers but typical ranges are 5 to 20 percent by weight
Chapter 2 Materials
19
Flame retardants acting by chemical and physical actions which are
divided into
bull Chemical action
1 Reaction in the gas phase The radical gas phase
combustion process is interrupted by flame retardant
resulting in cooling of the system reducing and eventually
suppressing the supply of flammable gases
2 Reaction in the solid phase (fig26) The flame retardant
builds up a char layer and shields the materials against
oxygen and provides a barrier against the heat source
(flame)
Figure 26 Reaction in the solid phase
bull Physical action (fig27)
1 Cooling Energy absorbing (endothermic) processes
triggered by additives and the chemical release of water cool
the substrate of material to a temperature below that
required for sustaining the combustion process
2 Formation of a protective layer (coating) The material is
protected with a solid or gaseous protective layer and
protected from heat and oxygen necessary for the
combustion process
3 Dilution Inert substances and additives evolving non-
combustible gases dilute the fuel in the solid and gaseous
phases
Chapter 2 Materials
20
Figure 27 Physical action of flame retardant
Flame retardants can be placed into the polymer material or by reacting
chemically with the polymer (reactive mode) or by mixing (additive
mode) or in both modes The choice of a flame retardant must be based
on the knowledge its toxicity action and its impact on environment The
main categories of flame retardants are based on compounds containing
(fig 28)
1 Halogens (Bromine and Chlorine)
2 Phosphorus
3 Nitrogen
4 Inorganic compounds Minerals (based on aluminium and
magnesium)
5 Borates and Stannates
6 Intumescent systems
Figure 28 Classes of flame retardant
Chapter 2 Materials
21
Flame retardants work in a number of different ways in fact some flame
retardant are effective on their own but other are used mainly as
ldquosynergistsrdquo acting to increase the effect of other types of flame
retardants Almost all flame retardants generate a stable carbonaceous
barrier called ldquocharrdquo which protects and at the same time cools the
surface of the material
Halogenated flame retardants when exposed to high temperatures
release bromine (Br) or chlorine (Cl) as free radicals (Br- or Cl- ) which
react with hydrocarbon molecules (flammable gases) to give HBr or HCl
These then react with the high-energy H+ and OH- radicals to give water
and the much lower energy Br- or Cl- radicals which are then available
to begin a new cycle of H+ and OH- radical removal They act by
effectively removing the H+ and OH- radicals in the gas flame phase thus
reducing heat generation and so the production of further gaseous
flammable materials
Phosphorus-containing flame retardants when heated reacts to give
a polymeric form of phosphoric acid This acid crates a glass layer (char)
on the surface of the material and inhibits the pyrolysis process which
is necessary to feed flames Char plays an important role in fact it acts
as a two-way barrier that both prevents the passage of the combustible
gases and shields the polymer from the heat of the flame
A wide range of different phosphorus based flame retardants is
available including elemental red phosphorus which is oxidised to
phosphoric acid with heat ammonium polyphosphate melamine
polyphosphate phosphonates phosphinates and phosphate esters
Nitrogen-containing flame retardant (pure melamine and derivates)
are believed to act by several mechanisms In fact in the condensed
phase melamine is transformed into cross-linked structures which
promotes char formation releasing ammonia In conjunction with
phosphorus the nitrogen appears to enhance the attachment of the
phosphorus to the polymer A mechanism in the gas phase may be the
Chapter 2 Materials
22
release of molecular nitrogen which dilutes the volatile polymer
decomposition products
Antimony trioxide does not have flame retarding properties of its own
but is an effective synergist for halogenated flame retardants It acts as
a catalyst facilitating the breakdown of halogenated flame retardants
into active molecules It also reacts with the halogens to produce
volatile antimony halogen compounds which are themselves directly
effective in removing the high energy H+ and OH- radicals which feed
the flame phase of the fire thus reinforcing the flame suppressing effect
of the halogenated flame retardants When added to PVC antimony
trioxide acts to suppress flames by activating the chlorine present in the
plastic itself
Inorganic compounds are used as flame retardants interfering through
various physical processes with the burning process release of water or
non-flammable gases which dilute the gases feeding flames absorption
of heat energy thus cooling the fire production of a non-flammable and
resistant layer on the surface of material (char) These mechanisms of
inorganic compounds are however of a relatively low efficiency and the
products have to often be used in large concentrations or more usually
in combination with other types of flame retardants
Boron containing compounds act through the stepwise release of
water and the formation of a glassy coating protecting the surface Zinc
borate in halogen-free systems is normally used in conjunction with
aluminium trihydrate magnesium hydroxide or red phosphorus Zinc
stannate and zinc hydroxystannate are used to reduce smoke emission
from PVC to promote charring or as synergists to increase the
effectiveness of halogenated or nitrogen flame retardants
Finally intumescent coatings are fire protection systems which are
used to protect materials such as wood or plastic from fire but also to
protect steel and other materials from the high temperatures of fire The
coatings are made of a combination of products applied to the surface
Chapter 2 Materials
23
like a paint which are designed to expand to form an insulating and
fire-resistant covering when subject to heat
221 Zinc Borate
Zinc borate ZB (2ZnO 3B2O3 35H2O) is a multifunctional flame
retardant which can function as a flame retardant in synergy with
halogen smoke suppressant because promote char formation and
afterglow suppressant It is a synergist of chlorine and bromine-
containing flame retardants or polymers Its efficacy depends on the
type of halogen source (aliphatic versus aromatic) and the base polymer
used The zinc borate can generally display synergistic effects with
antimony oxide in fire retardancy This synergy [3] can be more
remarkable when used in conjunction with aluminium trihydrate (ATH)
or magnesium hydroxide (MDH)
Zinc borate decomposition has been studied by thermogravimetric
analyses TGA reported in figure 29 and its decomposition temperature
is about 436degC
Figure 29 TGA and DTG in nitrogen of zinc borate
Zinc borate works as an antitracking agent in both halogen-containing
and halogen-free polymers in different ways
In halogen-containing polymers
Chapter 2 Materials
24
bull Zinc borate possesses a synergistic effect with halogen sources
bull Zinc borate display synergistic effects with antimony oxide in fire
retardancy In the presence of ATH or MDH this synergy can be
augmented significantly
bull In some polymer systems zinc borate can completely replace
antimony oxide
bull In contrast to antimony oxide zinc borate is predominant in the
condensed phase and can work as a smoke suppressant
bull Zinc borate promotes char formation and prevents burning drips
The zinc oxide moiety can promote char formation with halogen
sources and B2O3 moiety can stabilize the char
bull Zinc borate can improve the thermal stability of polyamides
containing halogenantimony trioxide and improve the aged
elongation property of polyolefin
bull Improves corrosion resistance
In halogen-free polymers
bull Zinc borate are multifunctional fire retardants in halogen-free
polymers
bull When used in combination with metal hydroxides zinc borate can
work as a sintering aid to promote the formation of a strong
charceramic residue that can act as an insulator for underlying
polymer
bull Zinc borate can reduce the heat release rate smoke evolution
carbon monoxide generation and afterglow combustion
bull The use of a co-additive such as the siliconesilica melamine
polyphosphate talc or red phosphorous can increase the fire test
performance of zinc boratemetal hydroxide combination
bull Zinc borate alone can work as a flame retardant in certain
halogen-free systems
Chapter 2 Materials
25
Zinc borate used is produced by Joseph Storey amp Company LTD and its
name is Storflam ZB 2335 and its physical and chemical properties are
reported in table 22 [4]
Zinc Borate ZB
Appearance Power dust
Colour White
Molecular weight 43464
Bulk density (Kgm3) 400-700
Soluble in Acids and Bases
Solubility value (g100g
H2O20degC)
lt1
pH 7-8 (aqueous filtrate of 20
suspension)
Table 22Physical and chemical properties of zinc borate
222 Aluminium trihydrate
Aluminium trihydrate ATH (2Al(OH)3) is the most widely used flame
retardant It is an inert mineral filler a non-toxic white crystalline
powder and is included in the inorganic flame retardants It acts with
all three of mechanisms indicated in the figure 210 At around 300degC
(fig211) it is decomposed to aluminium oxide which forms a
protective non-flammable layer on the material surface and water
Chapter 2 Materials
26
Figure 210 Mechanism of Aluminium trihydrate ATH
Figure 211 TGA and DTG in nitrogen of aluminium trihydrate
Water forms a layer of non-flammable gas near the materialrsquos surface
inhibiting flames The reaction is endothermic it absorbs heat thus
cooling the material and slowing burning The water vapour produced
during ATH decomposition dilutes both the combustible gases and
oxygen in the vicinity of the flame making combustion more difficult
For smoke suppression the heat dissipation by the ATH is thought to
Chapter 2 Materials
27
aid in forming char rather than forming smoke by favouring
crosslinking reactions over soot formation The char provides a fuel-
oxygen barrier on the surface of the burning polymer
Aluminium trihydrate used in this work is produced by Dadco and
provided by Joseph Storey amp Company LTD [4] and its physical and
chemical properties are reported in table 23
Aluminium trihydrate ATH
LOI (110degC-1100degC) () 346
Specific gravity (gcm3) 24
Whiteness () gt 91
Bulk density (Kgm3) 500-700
Medium grain size diameter (μm) 40-75
Boiling point (degC) 2700 (Al2O3 decomposition
product)
Density at 20degC (gml) 242
Table 23Physical and chemical properties of aluminium trihydrate
223 Zinc Hydroxystannate
Zinc hydroxystannate ZHS (ZnSn(OH)6) is a fire retardant and a smoke
suppressant additive for polymeric materials [5] It was developed as a
smoke suppressant for PVC but later it was found that it also acts as a
flame retardant in certain plastics mainly by promoting char formation
and can usually partly substitute antimony trioxide Recent studies to
develop flame retardants formation have used inorganic tin compounds
such as zinc hydroxystannate because it is less toxic [2] The physical
and chemical properties of ZHS are reported in table 24 and it is
provided by Joseph Storey amp Company LTD [4] and its decomposition
temperature (225degC) is reported in figure 212
Chapter 2 Materials
28
Zinc Hydroxystannate
Physical state Power
Colour White
Bulk density (Kgm3) 400-500
Soluble in Strong Acids and Bases
Solubility in water ( in weight) 0003
pH 7
Table 24Physical and chemical properties of zinc hydroxystannate
Figure 212 TGA and DTG in nitrogen of zinc hydroxystannate
224 Zinc Stannate
Zinc stannate ZS (ZnSnO3) has excellent flame retardant and smoke
suppressant properties and its advantage as zinc hydroxystannate is
that it is less toxic than antimony compounds In fact ZS and ZHS are
used instead of antimony trioxide because they are less toxic [6] Zinc
stannate as zinc hydroxystannate is provided by Joseph Storey amp
Company LTD [4] and its properties are listed in table 25 and in figure
213
Chapter 2 Materials
29
Zinc Stannate
Appearance Power dust
Colour White
Bulk density (Kgm3) 400-500
Soluble in Strong Acids and Bases
Solubility value (g100g
H2O20degC) 0003
pH 7
Molecular weight 23207
Table 25Physical and chemical properties of zinc stannate
Figure 213 TGA in nitrogen of zinc hydroxystannate
Zinc hydroxystannate shows several degradation steps and different
decomposition temperatures hence its DTG is not reported
23 Nano materials Introduction on carbon nanotubes
The discovery of carbon nanotubes can be traced back to the origin of
fullerene chemistry (buckyball C60) in 1985 [7] Fullerenes have
provided an exciting new insight into carbon nanostructures built from
sp2 carbon units based on geometric architectures In 1991 Iijima [8]
Chapter 2 Materials
30
discovered carbon nanotubes (CNTs) that are elongated fullerenes where
the walls of the tubes are hexagonal carbon and often capped at each
end The nanotube is typically closed at each end by hemispherical caps
that are constituted by at least 12 pentagons According to the Euler
theorem [9] which relates the number of vertices edges and faces a
convex structure can be created by introducing a positive curvature
and therefore pentagons to close up the hexagonal lattice of the tube
(fig214)
Figure 214 Schematic of the nanotube formation
Due to the hexagonal symmetry of the carbon atoms in the graphitic
sheet different structural isomers are possible depending on how the
planar graphite sheet is folded The rolling up can be accomplished in
several different ways requiring only the matching of the dangling bonds
at each end However the nanotubes can present a different helicity
degree with respect to the tube axis Figure 215 shows the three
different possible nanotubes armchair zig zag and chiral
Figure 215 Schematic of the three different nanotubes structure
Chapter 2 Materials
31
The characteristic of helicity in nanotubes has a great relevance
affecting the physical properties that depend also on the tube diameter
[10] For example it has been shown that all the armchair tubes are
metallic whereas the zig zag and chiral tubes are either metallic or
semiconducting
The nanotubes can exist in two forms multi-walled and single-layer
(fig216) The multi-wall carbon nanotubes were the first to be
discovered They consist of concentric cylinders placed around a
common central hollow area with a constant separation between the
layers close to the graphite interlayer spacing (034 nm) Each
individual cylinder can be characterized by a different helicity and has
diameter ranging from 2 to 25 nm and length of several microns
Figure 216 Single walled and multi walled carbon nanotubes
The single walled nanotubes were synthesized in 1993 when it was
found that the addition of metals such as cobalt to the graphite
electrodes in the arc evaporation method resulted in tubes with single
layer walls [11] A single walled nanotube is close to an ideal fullerene
fiber and consists of a single layer cylinder extending from end to end
with a narrow distribution in diameter range (1-2 nm) When produced
in vapour phase the single wall nanotube can self-assemble into larger
bundles called ropes consisting of several tens of nanotubes arranged
in a one-dimensional triangular lattice It is important to observe that
the discovery of single wall tubes has been very significant allowing
Chapter 2 Materials
32
researchers to verify and test some of the theoretical predictions about
the nanotube properties
Due to the combination of size structure and topology the nanotubes
display remarkable features In particular the graphitic nature of the
nanotube lattice contributes to provide high conductivity high strength
and stiffness chemical specificity and inertness while the lattice
helicity and elasticity provide optimal electronic properties Further the
nanoscale size and the high aspect ratio are advantageous for many
applications that require large surface area to volume ratio However
due to the their very small size and often presence of defects
mechanical property characterization is a challenge Nevertheless it is
possible to imagine that their stiffness and strength are very high if one
uses graphite as reference The in-plane elastic modulus of graphite is
estimated to be 106 TPa (1061012 Pa) and the tensile stiffness as 08
TPa due to the very strong covalent C-C bonds in the plane [10]
The elastic properties evaluation of carbon nanotube has been
performed by
bull measuring their thermal vibration amplitudes
bull atomic force microscopy measurement during bending
The first technique provided the Youngrsquos modulus equal to 18 TPa
while a modulus close to 1 TPa has been determined by the second
method Further the maximum tensile strength has been determined
close to 30 GPa (30109Pa) [8] Many other observations have shown
that carbon nanotubes have other intriguing properties such as
bull high flexibility related to the ability of the carbon atoms to
rehybridize with the degree of rehybridization depending on the
strain
bull high capability to sustain strain in tension (40) without
brittleness plastic deformation or bond rupture
These features make the carbon nanotubes ideal candidates for
reinforcing fibers in polymer-based composites In particular due to
Chapter 2 Materials
33
their ability to sustain high deformations they have a significant
advantage over carbon fibers in composites for structural and strength
applications However the effective reinforcement action due to the
nanotubes hinges on the success of the preparation techniques and
stable dispersion of the nanotubes in the polymer matrix In most
cases since the nanotubes have many entanglements it is a challenge
and an unresolved issue to disperse them effectively with polymer
systems to make strong and stiff components
Carbon nanotubes have extraordinary properties that have attracted the
attention of several researchers from diverse fields Substantial effort
has been devoted to the experimental evaluation and theoretical
calculation of their physical electronic magnetic electrical and
mechanical properties
Because of their promising physical and mechanical properties the
most common commercial application of carbon nanotubes is based on
their use as filler elements for metals ceramic or polymers matrix In
particular carbon nanotubes may exhibit characteristics that can be
beneficial For example they can be used as
bull reinforcement of polymer based composite materials which
improve structural properties
bull polymer modifiers for high temperature uses
bull conductive filler in insulating polymer matrices to provide
electrostatic discharge and electromagnetic-radio frequency
interference protection
bull doping of conjugated luminescent polymers to produce active
materials for electronic applications
The use of carbon nanotubes as reinforcing systems of polymer matrix
would offer several advantages over the conventional reinforcements
including continuous and short fibers (glass carbon) In the case of
continuous fibers reinforcements the advanced composite material has
much higher mechanical properties in the direction parallel to the fibers
Chapter 2 Materials
34
or in the plane of the lamina than in the transverse direction
Furthermore since the conventional polymer processing equipment
cannot process the long continuous fibers their use is limited to simple
shapes and limited production On the other hand itrsquos established that
the fiber aspect ratio represents the critical factor affecting the resulting
structural properties of short fiber composites As the aspect ratio
increases the composite stiffness and strength increase However the
packing of short fibers in a polymer matrix is a percolation
phenomenon so the maximum packing decreases with increasing
aspect ratio (see figure 16) and may not be sufficient to manufacture a
very strong material [12]
Dispersion process of carbon nanotubes represents a very complex
phenomenon due to their natural tendency to bundle together due to
van der Walls interactions A non uniform dispersion can lead to many
defect sites and reach resin area limiting not only the efficiency of CNTs
as reinforcement filler for the polymer composite matrix [13-18] A good
dispersion and possibly the alignment of CNTs within a matrix is still a
challenge and it could play the main factor driving the diffusion of CNT
or MWCNT as nano-reinforcement on industrial scale [1718] in fact are
used several dispersion technique to separate the agglomerates into
individual nanotubes
Carbon nanotubes are another candidate as a FR additive because of
their highly elongated shape (high aspect ratio) The in situ formation of
a continuous network structured protective layer from the tubes is
critical for significant reduction in heat release rate because the layer
thus acts as a thermal shield from energy feedback from the flame [19]
231 Multi walled carbon nanotubes Nanocyl 7000
The multi walled carbon nanotubes used in this word are provided by
Nanocyl SA (Belgium) and are denominated Nanocyl 7000 This multi
walled carbon nanotubes are produced via the catalytic carbon vapour
deposition (ccvd) process Nanotubes exit the reactor with a purity of
Chapter 2 Materials
35
90 carbon to produce the 7000 grade [20] Its properties are reported
in table 26
Multi-walled carbon nanotubes (MWNTs)
Average diameter 10 nm
Length 01-10 μm
Carbon Purity 90
Table 26Properties of MWNT
Chapter 2 Materials
36
References [1] wwwhexcelcomHexFlowRTM6pdf
[2] Petsom A Roengsumran S Ariyaphattanakul A Sangvanich P
Polym Degrad Stab 2003(80)17-22
[3] Shen KK Kochesfahani S Jouffret F PolymAdvTechnol 2008
(19)469-474
[4] Data sheet provided by Joseph Storey amp Company LTD
[5] Hornsby PR Cusack PA Cross M Toth A Zelei B Marosi G
Journal of materials science 2003 (38)2893-2899
[6] Cusack PA Heer MS Monk AW Polymer Degradation and Stability
1997 (58)229-237
[7] Kroto HW Heath JR OrsquoBrien SC Curl RF Smalley RE Nature
1985 318 162
[8] Iijima S Nature 1991 354 56
[9] Ebbesen WT Physics Today 1996 26-32
[10] Ajayan PM Chem Rev 1999 (99)1787-1799
[11] Ebbesen WTCRC 1997
[12] Calvert P Nature 1999 (399)210-211
[13] Qian D Dickey EC Andrews R Rantell T Appl Phys Lett 2000
76 (20)2868-2870
[14] Park C et al Chemical Physical Letters 2002 (364)303-308
[15] Ham HT Choi YS Chung JI Journal of Col and Inter Science
2005 286 (1)216-223
[16] Salvetat JP Briggs AD Bonard JM Bacsa RR Kulik AJ Stockli
T Burnham NA Forroacute L Phys Rev Lett 1999 82 (5)944-947
[17] Jin L Bower C Zhou O Appl Phys Lett 1998 73 (9)1197-1199
[18] Choi ES Brooks JS Eaton DL Al-Haik MS Hussaini MY
Garmestani H Li D Dahmen KJ Appl Phys 2003 (94)5451-5473
[19] Kashiwagi T Du F Winey KI Groth KM Shields JR Bellayer
SP Kim H Douglas JF Polymer 2005 (46)471-481
[20] Data sheet provided by Nanocyl SA
CHAPTER 3 EXPERIMENTAL TECHNIQUES
31 Methods 311 Micro particles Mechanical stirring
The flame retardant composites were prepared by mixing the epoxy
resin RTM6 with zinc borate aluminium trihydrate zinc stannate and
zinc hydroxystannate at different percentage (5 wt 10 wt 20 wt
30 wt 40 wt) The mixing was made by using a Heidolph RZR
mechanical stirring equipment (fig 31) The additives were included
into the matrix at 400 rpm to avoid disperse the additive on the walls of
beaker [1]
Figure 31 Heidolph RZR mechanical stirring
Afterwards the mixing was continued for 10 minutes at 1050 rpm and
10 minutes at 2000 rpm and then the mixture were degassed for 30
minutes at 90degC in a vacuum oven to eliminate entrapped air and
humidity Finally the liquid system was poured in mould and cured at
160degC and 180degC respectively for 90 mins and 120 mins according to
the curing schedule sheet of the neat epoxy resin
Chapter 3 Experimental Techniques
38
The quality of dispersion of all additives into the epoxy resin after the
mixing process was observed by Scanning Electron Microscope (1450VP
LEO)
For example the SEM micrograph of zinc borate 20 wt is reported
where the dust of zinc borate (fig 32) is well dispersed into the epoxy
matrix and it maintains its original grain size Analogous behaviour is
noticed for the aluminium trihydrate zinc stannate and zinc
hydroxystannate (fig 33)
Figure 32 Scanning electron micrograph of zinc borate dust
Figure 33 Scanning electron micrograph of the composite of RTM6 and ZB 20wt
312 Nano particles Sonication
The nanocomposites were prepared by using sonication process (fig
34) for a constant time (1 hour) at temperature of 120degC with the
Chapter 3 Experimental Techniques
39
MWNTs content of 01 fraction by weight We selected this process
and this percentage of carbon nanotubes by previous studies and
experimental analysis that we conducted [2] All the obtained samples
were then degassed in vacuum oven at 90degC for 30 min and then cured
considering an identical temperature cycle (1 h at 160degC followed by 2 h
at 180degC) according to the specified curing schedule
Figure 34 Misonix Sonicator S3000
The SEM micrograph of fracture surface of multi walled carbon
nanotubes into the epoxy resin was obtained by fragile failure of
nitrogen cooled samples and this surface is reported in figure 35 at
different level of magnitude
Figure 35 SEM images of fracture surface of specimen taken at different magnitudes
(1 μm-300 nm)
Chapter 3 Experimental Techniques
40
The nanotubes reported in figure 35 are present and well separated
each other showing a good level of adhesion with the matrix in fact it
appears a satisfactory uniformity of single or agglomerated of nanotube
313 Vacuum infusion process
The vacuum infusion process (VIP) is a technique that uses vacuum
pressure to drive resin into a laminate Materials are laid dry into the
mould and the vacuum is applied before resin is introduced One a
complete vacuum is achieved resin is literally sucked into the laminate
via carefully placed tubing This process is aided by an assortment of
supplies and materials Vacuum infusion provides a number of
improvements over traditionally vacuum bagged parts These benefits
include
bull Better fiber-to-resin ratio
bull Less wasted resin
bull Very consistent resin usage
bull Unlimited set-up time
bull Cleaner
The samples were obtained by a preform of 8 plies of overlaid
unidirectional carbon fibres at zero degrees We chose 20x20cm
samples
Operations to prepare the samples are
1 Cleaning mould with acetone
2 Application of realising agent to make the mould hydrophobic
The realising agent used in this work is LOCTITEreg FREWAX
FREKOTEreg and adheres to the surface of the mould creating a
barrier between materials and mould
3 Application of sealing tape GS AT200Y This tape is softened by
temperature so to enable the perfect adherence of the bag to the
plate while maintaining the vacuum (figs 36a)-b))
Chapter 3 Experimental Techniques
41
Figures 36 Application of sealing tape a) and position of carbon plies b)
4 Application of ldquopeel plyrdquo under and over the carbon fibres plies to
avoid damage to the composite surface in the successive phases
(fig 37) The peel ply used in this work is RELEASE EASE
234TFP and it is provided by Airtech It is also placed on the
aspiration pipe because it allows to keep the vacuum
Figures 37 Application of ldquopeel plyrdquo
5 Application of ldquobreather and bleederrdquo provided by Airtech It is the
AIRWEAVEreg Super and it is useful to ensure the vacuum
distribution When the panels of epoxy resin are micro and nano
additived the breatherbleeder is placed only beside the carbon
Chapter 3 Experimental Techniques
42
fibres plies because it doesnrsquot absorb the additives but it
guarantees the vacuum distribution (fig 38)
Figures 38 Application of ldquobreatherbleederrdquo
6 Application of ldquonetworkrdquo (fig 39) to facilitate the advancement of
the resin flow in the mould
Figures 39 Application of ldquonetworkrdquo
7 Application of a vacuum bag (figs 310a)-b)) that is sealed by
sealing tape
Chapter 3 Experimental Techniques
43
Figures 310 Application of vacuum bag a) and creation of vacuum b)
At the end the vacuum is applied and a compaction of the different
layers is obtained (fig 310b)) and the breather allows the vacuum to
spread throughout the mould
32 Characterization 321 Cone Calorimeter
The cone calorimeter has become one of the most important and widely
used instruments for the research and development of fire retarded
polymeric materials The cone calorimeter is a performance-based
bench scale fire testing apparatus [3-7]
The cone calorimeter provides comprehensive insight into not only fire
risks such as heat release rate total heat release and time to ignition
but also fire hazards such as smoke release and CO production Cone
calorimeter investigations can be used as a universal approach to
ranking and comparing the fire behaviour of materials
However each experimental setup defines a specific fire scenario As is
typical for all fire tests samplesrsquo performance in the cone calorimeter
depends on the specific characteristics of the test including ignition
source ventilation irradiance (external heat flux) temperature and the
geometry of the specimen
Chapter 3 Experimental Techniques
44
The cone calorimeter test characterizes the performance resulting from
an interaction of material properties specimen and the defined fire
scenario
Lower external heat fluxes such as below 20 kWm2 target ignition and
flammability whereas higher external heat flux such as 50 kWm2
target flame spread and combustion properties The relevant and active
mechanisms can change significantly Hence the external heat flux
influences the conclusions implied by the cone calorimeter studies The
frequently used irradiances of 35 kWm2 or even 50 kWm2 deliver
reproducible results for forced flaming conditions with respect to flame
spread and combustion properties (fig 311)
Figure 311 Schematic diagram of the cone calorimeter
The main capability of the instrument is that the heat release response
of a burning material can be measured continuously to a high degree of
accuracy and values for peak and average heat release rate can be
determined The technique can also be used to measure time to ignition
time of sustained flaming effective heat of combustion smoke density
soot yield mass loss rate and yield of CO CO2 and other combustion
Chapter 3 Experimental Techniques
45
gases The only fire reaction property that cannot be directly determined
is the flame spread rate
Specimens tested within the cone calorimeter are flat plates that are
100mm long 100mm wide and up to 50mm thick The specimen is
placed inside a sample holder lined with a low-density refractory
material to minimise heat losses from the unexposed face It is also
necessary to insulate the specimen sides to minimise edge burning
which can give an artificially high heat release rate The sides of
composite specimens should also be sealed and insulated to avoid the
escape of volatile gases from the edges which can also affect the fire
reaction properties During fire testing the mass loss of the specimen is
recorded continuously using a load cell located beneath the sample
holder
The top surface of the specimen is positioned 25mm from the cone
heater (fig312)
Figure 312 Positioning of the sample
A spark igniter may be placed mid-way between the sample and heater
and is used to ignite combustible gases released from the thermally
decomposing material when the concentration reaches the critical level
needed to sustain flaming Most fire tests on composites are performed
Chapter 3 Experimental Techniques
46
using the igniters although it is possible not to use the igniters to study
the effect of auto-ignition on the reaction properties
During fire testing (fig313) a constant flow rate of air at 24 litres per
second is maintained in the heating chamber
This air flow rate is needed to force all the gaseous combustion
products released by the burning specimen up through the orifice of the
cone heater and into the gas exhaust system above the heating
chamber As the entrained air and combustion products enter the
exhaust system they are thoroughly mixed to avoid stratification of the
gases that can cause inaccurate heat release smoke or toxic gas
measurements
Figure 313 Burning of sample
In this work the combustion tests [8] according to ASTM E 1354-04
are carried out with irradiance of 50 kWm2 for samples of a thickness
between 6-8mm and size 100times100mm using the cone calorimeter
produced by Fire Testing Technology Ldt (fig 314)
Chapter 3 Experimental Techniques
47
Figure 314 Cone calorimeter provided by Fire Testing Technology Ldt
The information provided by cone calorimeter are
bull Time to ignition (TTI) which corresponds to the period that a
combustible material can withstand when exposed to a constant
radiant heat flux before igniting and undergoing sustained
flaming combustion
bull Mass lost different between the initial and final mass of the
sample
bull Heat Release Rate peak (pHRR) average (HRR avarage) and Time
To Peak (TTP) are a quantitative measure of the amount of
thermal energy released by a material per unit area when exposed
to a fire radiating at constant heat flux (or temperature)
bull Mean COCO2 Yield the average return of CO and CO2 related to
the mass of the sample
bull Total Heat Evolved (THR)
bull Total Smoke Released (TSR)
322 Scanning Electron Microscope
The Scanning Electron Microscope (SEM) is a microscope that uses
electrons rather than light to form an image (fig 315) The SEM has a
large depth of field which allows a large amount of the sample to be in
focus at one time The SEM also produces images of high resolution
Chapter 3 Experimental Techniques
48
which means that closely spaced features can be examined at a high
magnification The combination of higher magnification larger depth of
focus greater resolution and ease of sample observation makes the
SEM one of the most heavily used instruments in research areas today
The SEM is designed for direct studying of the surfaces of solid objects
By scanning with an electron beam that has been generated and
focused by the operation of the microscope an image is formed in much
the same way as a TV The SEM allows a greater depth of focus than the
optical microscope For this reason the SEM can produce an image that
is a good representation of the three-dimensional sample
The SEM uses electrons instead of light to form an image A beam of
electrons is produced at the top of the microscope by heating of a
metallic filament The electron beam follows a vertical path through the
column of the microscope It makes its way through electromagnetic
lenses which focus and direct the beam down towards the sample Once
it hits the sample other electrons (backscattered or secondary) are
ejected from the sample Detectors collect the secondary or
backscattered electrons and convert them to a signal that is sent to a
viewing screen similar to the one in an ordinary television producing an
image
Figure 315 Scanning Electron Microscope
Chapter 3 Experimental Techniques
49
When a SEM is used the column and sample must always be at
vacuum A vacuum environment means that most of the air molecules
have been removed from the inside of the microscope
Since the SEM uses electrons to produce an image most conventional
SEMs require that the samples be electrically conductive The sputter
coater uses argon gas and a small electric field The sample is placed in
a small chamber which is at vacuum Argon gas is then introduced and
an electric field is used to cause an electron to be removed from the
argon atoms to make the atoms ions with a positive charge The Ar ions
are then attracted to a negatively charged piece of gold foil The Ar ions
act like sand in a sandblaster knocking gold atoms from the surface of
the foil These gold atoms now settle onto the surface of the sample
producing a gold coating
323 Thermo mechanical analysis
Thermo mechanical analysis (TMA) is a well-known technique [9] that
measures linear or volumetric changes as a function of time
temperature and force TMA is the measurement of materials behaviour
expansion and or contraction as a function of an applied load or
temperature A scan of dimensional changes related to time or load
provides invaluable information about the samples mechanical
properties Most analyses are presented in the form of the coefficient of
thermal expansion
dL(dTL0)=CTE (coefficient of thermal expansion)
where dL is the change in length (microm) dT is the change in temperature
(degC) and L0 is the initial length (m) Thermo mechanical analysis were
conducted using a TMA-60WS (fig316) provided by SHIMADZU
We measured the CTE of epoxy resin with additives and panels obtained
by using VIP with a force of 003N from 25degC to 250degC at 3degCmin in
Chapter 3 Experimental Techniques
50
double scan and expansion mode The sample measure 3x3x15mm in
accordance to ASTM E831-06
Figure 316 TMA-60WS
324 Thermal gravimetric analysis
Thermogravimetric analysis (TGA) (fig317) is an analytical technique
used to determine the thermal stability of a material and its fraction of
volatile components by monitoring the weight change that occurs when
a specimen is heated The measurement is normally carried out in air or
in an inert atmosphere and the weight loss is recorded as a function of
increasing temperature
Analysis of the TGA curves and DTG signals reports two temperature
bull The onset temperature (Tonset) calculated from the TGA curves by
extrapolating from the curve at the peak of degradation back to
the initial weight of the polymer
bull The temperature maximum (Tmax) calculated from the DTG curves
by extrapolating from the curve at the peak of degradation
forward to the final weight of the polymer
Chapter 3 Experimental Techniques
51
Figure 317 TGA 2920 TA Instruments
Differential thermal analysis was carried out using a TGA 2950 by TA
Instruments [10] All measurements were conducted under air or inert
atmosphere with a sample weight of about 7-8mg for each test the
heating rate was 5 75 10 and 20degCmin and the test temperature
ranged from 30degC to 800degC
Chapter 3 Experimental Techniques
52
References [1] wwwheidolphit
[2] Formicola C Martone A Zarrelli M Giordano M Dispersion of
carbon nanotubes in a monocomponent epoxy system 2008 proceeding
of AIDC workshop
[3] Schartel B Bartholmai M Knoll Some comments on the use of
cone calorimeter data Polym Degrad Stab 2005 (88)540ndash547
[4] Schartel B Hull TR Development of fire-retarded materials-
Interpretation of cone calorimeter data Fire and materials 2007
(31)327ndash354
[5] Fire Testing Technology Userrsquos Guide for the Cone Calorimeter
February 2000
[6] Grant GB Quick operation procedure for the cone calorimeter Unit
of fire safety engineering Edinburgh University 2nd edition January
1993
[7] Babrauskas V and Grayson SJ Heat Release in Fires Elsevier
Applied Science 1992
[8] Committee E0521 on Smoke Combustion Products ASTM 1354-03
Standard test methods for heat and visible smoke release for materials
and products using an oxygen consumption calorimeter ASTM 10
February 2003
[9] wwwshimadzuit
[10] wwwtainstrumentscom
CHAPTER 4 FLAME RETARDANT OF EPOXY RESIN WITH
INORGANIC COMPOUNDS
41 The state of the art on flame retardant of inorganic
compounds Flame retardants are chemical agents which are added to combustible
materials to make them more resistant to ignition and they are intended
to minimise the risk of a fire starting in case of contact with a small
heat source
Inorganic flame retardant as zinc borate aluminium trihydrate zinc
stannate and zinc hydroxystannate are used in this study because they
have shown very low toxicity they are compatible with a variety of flame
retardants while acting as smoke suppressants for various polymer
systems Synergistic effects are envisaged when these smoke
suppressants are combined with conventional flame retardants andor
nanoclays Recent studies to develop flame retardants formation have
used inorganic compounds because they have less toxicity Bourbigot et
al [1] demonstrated that zinc borates are useful synergistic agents in
Ethylene vinyl acetate EVA and aluminium trihydrate ATH and
magnesium hydroxide Mg(OH)2 formulations and that they act as smoke
suppressant Moreover they demonstrated that zinc borate develops a
vitreous protective residual layer which reduces the combustion rate
Carpentier et al [2] studied the synergistic effect of zinc borate on EVA8
filled with magnesium hydroxide (MH) by LOI cone calorimeter and
TGA Solid-state NMR was employed to study the carbon in the residues
collected after thermal treatment It is suggested that zinc borate slows
the degradation of the polymer and creates a vitreous protective
Chapter 4 Flame retardant of epoxy resin with inorganic compounds
54
residual layer which could act as a physical barrier and a glassy cage
for polyethylene chains
Wu et al [3] studied the synergistic flame retarding effect of ultrafine
zinc borate on LDPEIFR based on LOI UL94 test and cone calorimeter
and established that the flame retardancy is improved when
incorporating zinc borate to LDPEIFR system in fact HRR THR and
mass loss is reduced significantly
Petsom et al [4] described a study on zinc hydroxystannate and zinc
stannate in combination with 12 bis-tribromophenoxy ethane (BTBPE)
to increase flame retardancy and reduce smoke emission in an
acrylonitrile-butadiene-styrene (ABS) copolymer They concluded that
the combination of tin compounds and BTBPE was found more effective
as flame retardant than the individual components when used alone
Cusak et al [5] found that zinc hydroxystannate is a good synergist
alternative to antimony trioxide particularly with regard to reducing
heat release rates and smoke generation They demonstrated that ZHS
is the best alternative synergist to Sb2O3 in halogen-containing
polyester resins
Ning et al [6] studied the effects of zinc borate aluminium trihydrate
and their mixture on the flame retardant and smoke suppressant
properties of polyvinyl chloride PVC as well as their mechanism for
flame retardancy and smoke suppression They concluded that ZB and
ZB-ATH reduced the activation energy of PVC and their mixture had a
good synergistic effect on the flame retardance and smoke suppression
of PVC
Itrsquos clear that different authors [1-11] analyzed the fire and smoke
behaviour of zinc borate zinc stannate aluminium trihydrate zinc
hydroxystannate and their synergist effect in thermoplastic matrix or in
thermosetting bi-component matrix
Chapter 4 Flame retardant of epoxy resin with inorganic compounds
55
42 Cone calorimeter test Cone calorimeter represents a small-scale testing configuration which
provides important correlating parameters with real fire scenario data
obtained from cone calorimeter can provide plentiful information on fire
scenario material behaviour [12]
The values provided by cone calorimeter are mainly Time To Ignition
(TTI) which corresponds to the period that a combustible material can
withstand when exposure to a constant radiant heat flux before igniting
and undergoing sustained flaming combustion Heat Release Rate peak
(pHRR) average (HRRavarage) and Time To Peak (TTP) are a
quantitative measure of the amount of thermal energy released by a
material per unit area when exposed to a fire radiating at constant heat
flux (or temperature) Total Heat Evolved (THR) Total Smoke Released
(TSR)
Cone calorimeter tests were performed using a Fire Testing Technology
Ldt cone calorimeter according to the ASTM E1354-04 procedure
Samples with nominal dimensions of 100x100x7 mm were tested
horizontally under an incident flux of 50 kWm2 This level was chosen
as it corresponds to the evolved heat during a fire
421 Flame retardant of epoxy resin with inorganic compounds
The composite flame retardant were prepared by mixing the epoxy resin
RTM6 with zinc borate aluminium trihydrate zinc stannate and zinc
hydroxystannate at different percentage (5 wt 10 wt 20 wt 30
wt 40 wt) using a Heidolph RZR mechanical stirring equipment
(Chap 3)
Cone calorimeter data reported in tables 41 and 42 show that the
presence of zinc borate at 5 and 10 wt does not change substantially
the flame behaviour of the matrix as drawn by analysing the time to
ignition and heat release rate peak values Instead the presence of zinc
borate at 20 30 40 wt induces the flame retardant effect as
Chapter 4 Flame retardant of epoxy resin with inorganic compounds
56
supported by the recorded values of pHRR and HRR average The cone
calorimeter data reported in table 41 are averaged over two replicate
experiments
Samples
TTI
(s)
pHRR
(kWm2)
HRR
average
(kWm2)
TTP
(s)
THR
(MJm2)
TSR
(m2m2)
RTM6
neat 43 702 382 290 189 9260
RTM6+ZB
5wt 48 523 265 297 176 8282
RTM6+ZB
10wt 44 682 354 325 1842 8442
RTM6+ZB
20wt 49 428 251 455 188 9275
RTM6+ZB
30wt 47 396 193 65 186 10296
RTM6+ZB
40wt 63 315 148 82 161 7474
Table 41 Main cone calorimeter parameters evaluated for RTM6 epoxy with ZB at
different percentage
Samples ΔTTI
(s)
ΔpHRR
(kWm2)
FIP
(kWm2s)
FIGRA
(kWm2s) RTM6
neat _ _ 1632 242
RTM6+ZB
5wt 5 179 1079 175
RTM6+ZB
10wt 1 20 155 209
RTM6+ZB
20wt 6 274 861 094
RTM6+ZB
30wt 4 306 842 609
RTM6+ZB
40wt 20 387 5 384
Table 42 Parameters calculated by cone calorimeter data for RTM6 epoxy with ZB at
different percentage
Chapter 4 Flame retardant of epoxy resin with inorganic compounds
57
Where FPI and FIGRA are respectively pHRRTTI (kWm2s) and
pHRRTTP (kWm2s)
Decreasing values for the pHRR and HRR average may be correlated
with the formation of a char layer over the surface of tested sample
during the combustion process
A visual inspection of the final residual sample reports the presence of
the char layer (fig 41)
In figure 41 the HRR peak of RTM6ZB 10 wt system is higher than
corresponding peak for the ZB 5 wt system this curversquos behaviour
could be attributed to a local instability of the heat flux during the test
which lead to a wider cracked area and therefore a localised
combustion growth
Figure 41 HRR curves of RTM6ZB at different percentage
Whereas the aluminium trihydrate shows a negative effect as showed
by preliminary thermo-gravimetric analysis probably due an
acceleration of decomposition of the epoxy resin the presence of ATH
from 20 to 40 wt reduced the HRR peak and the HRR average (fig
42)
Chapter 4 Flame retardant of epoxy resin with inorganic compounds
58
In figure 42 the images of the residues of 30 and 40 wt RTM6-ATH
system with the whitish surface characteristic of the aluminium
trihydrate are reported
Figure 42 HRR curves of RTM6ATH at different percentage
The cone calorimeter data for ATH are reported in table 43 and FPI and
FIGRA in table 44 and are averaged over two replicate experiments
Chapter 4 Flame retardant of epoxy resin with inorganic compounds
59
Samples
TTI
(s)
pHRR
(kWm2)
HRR
average
(kWm2)
TTP
(s)
THR
(MJm2)
TSR
(m2m2)
RTM6 neat 43 702 382 290 189 9260
RTM6+ATH
5 33 815 413 220 126 5099
RTM6+ATH
10 51 728 383 210 126 5246
RTM6+ATH
20 52 510 368 340 199 9109
RTM6+ATH
30 64 468 324 232 174 7648
RTM6+ATH
40 93 453 193 110 172 8238
Table 43 Main cone calorimeter parameters evaluated for RTM6 epoxy with ATH at
different percentage
Samples ΔTTI
(s)
ΔpHRR
(kWm2)
FIP
(kWm2s)
FIGRA
(kWm2s) RTM6 neat _ _ 1632 242
RTM6+ATH
5 -10 -113 247 370
RTM6+ATH
10 8 -26 1427 346
RTM6+ATH
20 9 192 98 15
RTM6+ATH
30 21 234 731 201
RTM6+ATH
40 50 249 487 411
Table 44 Parameters calculated by cone calorimeter data for RTM6 epoxy with ZB at
different percentage
Where FPI and FIGRA are respectively pHRRTTI (kWm2s) and
pHRRTTP (kWm2s)
Chapter 4 Flame retardant of epoxy resin with inorganic compounds
60
Zinc hydroxystannate and zinc stannate such as zinc borate and
aluminium trihydrate reduced HRR peak and HRR average with the
presence of ZS and ZHS of 30 and 40 wt ZS and ZHS werenrsquot
prepared at 5 wt percentage because previously test on zinc borate
and aluminium trihydrate have failed the cone calorimeter tests
Cone calorimeter data are reported in table 45 for ZHS and in table 47
for ZS
In figure 43 HRR curves of ZHS at different percentage are reported
and the residual image shows a densified structure (char) that forms a
barrier to inhibit combustible gases
Figure 43 HRR curves of RTM6ZHS at different percentage
Chapter 4 Flame retardant of epoxy resin with inorganic compounds
61
Samples
TTI
(s)
pHRR
(kWm2)
HRR
average
(kWm2)
TTP
(s)
THR
(MJm2)
TSR
(m2m2)
RTM6 neat 43 702 382 290 189 9260
RTM6+ZHS
10 44 469 203 255 202 9070
RTM6+ZHS
20 43 465 286 417 194 7092
RTM6+ZHS
30 52 379 192 70 153 6726
RTM6+ZHS
40 51 329 214 75 153 72
Table 45 Main cone calorimeter parameters evaluated for RTM6 epoxy with ZHS at
different percentage
Samples ΔTTI
(s)
ΔpHRR
(kWm2)
FIP
(kWm2s)
FIGRA
(kWm2s)
RTM6 neat _ _ 1632 242
RTM6+ZHS
10 1 233 1065 184
RTM6+ZHS
20 0 237 1082 111
RTM6+ZHS
30 9 323 728 541
RTM6+ZHS
40 8 373 645 438
Table 46 Parameters calculated by cone calorimeter data for RTM6 epoxy with ZHS
at different percentage
Instead in the residual image of ZS (fig 44) a crack on the surface is
observed probably due to a local instability of the heat flux during the
test which lead to a wider cracked area and therefore a localised
combustion growth such as zinc borate
Chapter 4 Flame retardant of epoxy resin with inorganic compounds
62
Figure 44 HRR curves of RTM6ZS at different percentage
Samples
TTI
(s)
pHRR
(kWm2)
HRR
average
(kWm2)
TTP
(s)
THR
(MJm2)
TSR
(m2m2)
RTM6 neat 43 702 382 290 189 9260
RTM6+ZS
10 45 583 313 260 176 7505
RTM6+ZS
20 46 803 336 475 200 6747
RTM6+ZS
30 43 551 274 262 152 6509
RTM6+ZS
40 45 470 293 282 163 7096
Table 47 Main cone calorimeter parameters evaluated for RTM6 epoxy with ZS at
different percentage
Chapter 4 Flame retardant of epoxy resin with inorganic compounds
63
Samples ΔTTI
(s)
ΔpHRR
(kWm2)
FIP
(kWm2s)
FIGRA
(kWm2s)
RTM6 neat _ _ 1632 242
RTM6+ZS
10 2 119 1295 224
RTM6+ZS
20 3 -101 1745 169
RTM6+ZS
30 0 151 1281 210
RTM6+ZS
40 2 232 1044 166
Table 48 Parameters calculated by cone calorimeter data for RTM6 epoxy with ZS at
different percentage
In conclusion the effect of all additives on the HRR peak value of epoxy
resin RTM6 is considerable for percentages of 30 and 40 wt In
particular the best result has been achieved with zinc borate 40 wt
and the heat release rate peak enhancement was 55
422 Synergistic effect of zinc borate with aluminium trihydrate
The synergy between the zinc borate and aluminium trihydrate was
investigated on four different percentages (10 20 30 and 40 wt ) of
additives into neat system considering the total amount split between
zinc borate and aluminium trihydrate according to the ratio 11
In order to study the synergistic effects of zinc borate with aluminium
trihydrate samples of composite of RTM6 and ZBATH dispersed at
total percentage of 20 wt were mapped by SEM The presence of ZB
and ATH within the same area of the sample lead to the reasonable
conclusion that an interaction between the two additives is taking place
(fig 45)
Chapter 4 Flame retardant of epoxy resin with inorganic compounds
64
Figure 45 Mapping of ZBATH sample dispersed into the epoxy resin
Preliminary thermogravimetric analysis shows that the synergic effect
due to the presence of both ZB and ATH is highlighted by the value of
onset temperature which decreases to about 355degC for the higher
concentrations Theoretical (calculation) and experimental TG-DTG
curves have been superimposed in figures 46 and 47 for the 30 wt
similar results were also obtained for the 40 wt mixture It results
that the addition of ZB and ATH synergistically drives the degradation
behaviour of neat matrix system as showed by the remarkable shifting
of the experimental curve toward higher onset temperature compared
with the calculated one
Chapter 4 Flame retardant of epoxy resin with inorganic compounds
65
0
20
40
60
80
100
120
0 100 200 300 400 500 600 700 800
RTM6+ATH+ZB 30 ExperimentRTM6RTM6+ATH+ZB 30 Calculation
Wei
ght (
)
Temperature (degC)
Figure 46 Experimental and calculated TGA curves for RTM6ATHZB 30 wt system
-02
0
02
04
06
08
1
12
0 100 200 300 400 500 600 700 800
RTM6RTM6+ATH+ZB 30 ExperimentRTM6+ATH+ZB 30 Calculation
Der
iv W
eigh
t (
degC
)
Temperature (degC)
Figure 47 Experimental and calculated DTG curves for RTM6ATHZB 30 wt system
Cone calorimeter data of synergic effect of zinc borate is reported in
tables 49 and 410
Chapter 4 Flame retardant of epoxy resin with inorganic compounds
66
Samples
TTI
(s)
pHRR
(kWm2)
HRR
average
(kWm2)
TTP
(s)
THR
(MJm2)
TSR
(m2m2)
RTM6 neat 43 702 382 290 189 9260
RTM6+ZB+ATH
10 52 679 285 200 122 5702
RTM6+ZB+ATH
20 52 468 337 140 195 10086
RTM6+ZB+ATH
30 55 431 249 95 174 8966
RTM6+ZB+ATH
40 87 437 74 100 173 7184
Table 49 Main cone calorimeter parameters evaluated for RTM6ZBATH system at
different percentage
Samples ΔTTI
(s)
ΔpHRR
(kWm2)
FIP
(kWm2s)
FIGRA
(kWm2s)
RTM6 neat _ _ 1632 242
RTM6+ZB+ATH
10 9 23 1305 34
RTM6+ZB+ATH
20 9 234 917 334
RTM6+ZB+ATH
30 12 271 783 453
RTM6+ZB+ATH
40 44 265 502 437
Table 410 Parameters calculated by cone calorimeter data for RTM6ZBATH
system at different percentage
The synergy of zinc borate is effective above content of 20 wt in fact
the heat release rate average undergoes a significant decrease by 382
kWm2 for epoxy resin to 249 kWm2 for system ZBATH 30 wt and
74 kWm2 for ZBATH 40 wt (fig 48) Comparing the ΔTTI and the
Chapter 4 Flame retardant of epoxy resin with inorganic compounds
67
HRR average values for RTM6ZB 20 wt RTM6ATH 20 wt and
RTM6ZBATH system at 40 wt the effect synergic of zinc borate and
aluminium trihydrate improves significantly the flame retardancy
respectively from 6 to 44 sec for TTI and from 251 kWm2 to 74 kWm2
for HRR compared
Figure 48 HRR curves of RTM6ZBATH system at different percentage
423 Scanning electron micrograph of residual
The scanning electron micrographs of dust cryogenically fractured
composite samples and their residuals were taken by a 1450VP LEO
The analyses made with the electronic scanning microscope were made
to observe the morphology of the material both before and after the
combustion process occurred in the cone calorimeter
We used two different methodologies one for observing the morphology
of the material (ion secondary SE1) and the other for the phase
difference (ions scatter QBSD) and the EDS analysis was also carried
out to view the compounds contained in the sample examined
Chapter 4 Flame retardant of epoxy resin with inorganic compounds
68
Analysis of SEM micrographs on residual of system of epoxy resin zinc
borate and aluminium trihydrate indicates that char topography varies
from a compact like-amalgam structure for the RTM6+ZB (fig49-411)
to a granular porous-like structure characterized by very small particles
of degraded resin and additive for the ATH mixture (fig412-414)
Reported SEM image are taken for the 20 wt content system as this
percentage represents the first useful composition to observe a delayed
effect of flame retardancy
Figure 49 and 410 Scanning electron micrograph of residual of RTM6ZB system
Figure 411 Scanning electron micrograph (SE1 and QBSD) and EDS of residual of
RTM6ZB system
Chapter 4 Flame retardant of epoxy resin with inorganic compounds
69
Figure 412 and 413 Scanning electron micrograph of residual of RTM6ZB system
Figure 414 Scanning electron micrograph (SE1 and QBSD) and EDS of residual of
RTM6ZB system
In figure 415 the scanning electron micrograph of residual samples of
RTM6ZBATH system is reported and the formation of char layer on
the surface due to zinc borate that reduces the HRR peak and average
of the burning surface is observe
Scanning electron micrographs indicate that the synergistic flame
retardant effects of these additives result from the excellent quality of
char that can better endure the oxidation of high temperatures slowing
at same time the degradation of epoxy resin
Chapter 4 Flame retardant of epoxy resin with inorganic compounds
70
Figure 415 Scanning electron micrograph and EDS of residual of RTM6ZBATH
system
424 Flame retardant of panels of RTM6 and inorganic compounds
The composites were prepared by mixing the epoxy resin RTM6 with all
additives at percentage of 30 wt and then the mixture was degassed
for 30 minutes at 90degC in a vacuum oven to eliminate entrapped air and
humidity Afterwards the mixture was injected in the preform of
20x20cm by vacuum infusion process
Flame retardants of panels of RTM6 and inorganic compounds were
investigated by cone calorimeter under an incident flux of 35 kWm2 in
according to the ASTM E1354-04 procedure for samples with thickness
less than 3mm Samples have dimensions of 100x100mm with
thickness of about 3mm because they were manufactured with 8 plies
of carbon fibres overlaid unidirectional at zero degree with thickness of
03mm each one
Cone calorimeter data show how the best results for the flame retardant
properties is at percentage of 40 wt but rheology test prepared at 5
degCmin demonstrates high viscosity for this percentage and hence
there are troubles during infusion For this reason the panels were
manufactured with percentage additives of 30 wt (fig 416)
Chapter 4 Flame retardant of epoxy resin with inorganic compounds
71
Figures 416 Rheology test viscosity vs time of RTM6 neat (green) RTM6ZB 30 wt
(blue) and RTM6ZB 40 wt (red)
In figure 417 are reported HRR curves of panels of RTM6 with carbon
fibres and all additives at percentage of 30 wt
0 100 200 300 4000
200
400
HR
R [k
Wm
2 ]
Time [s]
RTM6+CF RTM6+CF+ZB 30wt RTM6+CF+ATH 30wt RTM6+CF+ZHS 30wt RTM6+CF+ZS 30wt
Figure 417 HRR curves of RTM6CFAdditives system at percentage of 30 wt
Chapter 4 Flame retardant of epoxy resin with inorganic compounds
72
In the figure it is shown that zinc borate retarded the time to ignition
and reduced heat release rate respect to epoxy resin with carbon fibres
as is reported in table 411
Samples
TTI
(s)
pHRR
(kWm2)
HRR
average
(kWm2)
TTP
(s)
THR
(MJm2)
TSR
(m2m2)
RTM6+CF 91 301 119 124 20 1009
RTM6+CF+ZB
30 106 284 132 134 12 612
RTM6+CF+ATH
30 90 303 121 122 21 969
RTM6+CF+ZHS
30 81 344 139 110 18 876
RTM6+CF+ZS
30 73 278 114 114 16 766
Table 411 Main cone calorimeter parameters evaluated for RTM6Carbon
FibersAdditives system at percentage of 30 wt
Samples ΔTTI
(s)
ΔpHRR
(kWm2)
FIP
(kWm2s)
FIGRA
(kWm2s)
RTM6 neat _ _ 33 24
RTM6+CF+ZB
30 15 17 27 21
RTM6+CF+ATH
30 -1 -2 34 25
RTM6+CF+ZHS
30 -10 -43 42 32
RTM6+CF+ZS
40 -18 23 38 24
Table 412 Parameters calculated by cone calorimeter data for RTM6Carbon
FibersAdditives system at percentage of 30 wt
Chapter 4 Flame retardant of epoxy resin with inorganic compounds
73
In the table itrsquos shown clearly that the panels with zinc borate
augmented the flame retardant properties of RTM6 and carbon fibers in
fact increased the TTI reduced significantly the TSR and reduced FIP
and FIGRA (table 412)
The synergistic effect of zinc borate with aluminium trihydrate on
panels of RTM6 and carbon fibers is shown in figure 418
0 100 200 300 4000
200
400
HR
R [k
Wm
2 ]
Time [s]
RTM6+CF RTM6+CF+ZB 30wt RTM6+CF+ATH 30wt RTM6+CF+ZB+ATH 30wt
Figure 418 HRR curves of RTM6CFZBATH system
In this case itrsquos shown that the synergistic effect of zinc borate didnrsquot
produce any improvement on the flame retardant properties of RTM6
and Carbon Fibers as is reported in tables 413 and 414
Zinc borate from chemical in the combustion phase is able to slow
down the effect of carbon fibres because the zinc borate creates a layer
of char on the surface of sample more compact than was in the
presence of ZB with ATH
Chapter 4 Flame retardant of epoxy resin with inorganic compounds
74
Samples
TTI
(s)
pHRR
(kWm2)
HRR
average
(kWm2)
TTP
(s)
THR
(MJm2)
TSR
(m2m2)
RTM6+CF 91 301 119 124 20 1009
RTM6+CF+ZB 30 106 284 132 134 12 612
RTM6+CF+ATH
30 90 303 121 122 21 969
RTM6+CF+ZB+ATH
30 79 311 126 104 17 788
Table 413 Main cone calorimeter parameters evaluated for RTM6Carbon
FibersZBATH system at percentage of 30 wt
Samples ΔTTI
(s)
ΔpHRR
(kWm2)
FIP
(kWm2s)
FIGRA
(kWm2s) RTM6 neat _ _ 33 24
RTM6+CF+ZB 30 15 17 27 21
RTM6+CF+ATH
30 -1 -2 34 25
RTM6+CF+ZB+ATH
30 -12 -10 38 29
Table 414 Parameters calculated by cone calorimeter data for RTM6Carbon
FibersZBATH system at percentage of 30 wt
Chapter 4 Flame retardant of epoxy resin with inorganic compounds
75
43 Thermal mechanical analysis of RTM6 and inorganic
compounds The coefficient of thermal expansion is calculated by thermal
mechanical analysis as reported in Chapter 3
Each result reported in this chapter is averaged over three replicate
experiments The thermal mechanical analysis was conducted on the
samples additived at 30wt because this percentage is resulted good by
cone calorimeter test and principally to have a comparison with the
panels that are produced at this percentage
In figure 419 is reported the CTE of RTM6 neat and it is shown clearly
that there are two values of CTE in the first heating ramp and many
CTErsquos value in the second heating ramp
000 10000 20000Time [min]
145000
146000
147000
148000x10
1um
TMA
-002
-001
000
001
002
NLOAD
10000
20000
CTemp
19613C
5600C
16757C
6207x10-6
K
21589C
24557C
13770x10-6
K
7768C
16433C
6748x10-6
K
21168C
24930C
16647x10-6
K
RTM6 NEAT
Figure 419 CTE of epoxy resin RTM6 neat
Instead in the samples of RTM6 and additives the value of CTE in the
second heating ramp is only one and it is observed that the value of
CTE of RTM6additives system is more less than the CTE of RTM6 neat
Chapter 4 Flame retardant of epoxy resin with inorganic compounds
76
hence the influence of additives on the thermal mechanical properties of
matrix is clear
000 5000 10000 15000Time [min]
117000
117500
118000
x101
umTMA
-002
-001
000
001
002
NLOAD
5000
10000
15000
20000
CTemp
8451 C
18561 C
6615 x10-6
5238 C
15885 C
5781 x10-6
K
17844 C
18051 C
19565 C
12254 x10-6
K
RTM6+ZB 30 wt
Figure 420 CTE of epoxy resin RTM6+ZB 30wt
000 5000 10000 15000Time [min]
155000
155500
156000
156500x10
1um
TMA
-002
-001
000
001
002
NLOAD
5000
10000
15000
20000
CTemp
17557C
5017C
13426C
6051x10-6
K
18608C
19618C
9987x10-6
K
7391C
19130C
6231x10-6
K
RTM6+ATH 30wt
Figure 421 CTE of epoxy resin RTM6+ATH 30wt
Chapter 4 Flame retardant of epoxy resin with inorganic compounds
77
To observe the synergistic effect of zinc borate is calculated the CTE of
RTM6ZBATH 30wt system and the results are reported in table
415
000 5000 10000 15000Time [min]
121000
121500
122000
x101
umTMA
-002
-001
000
001
002
NLOAD
5000
10000
15000
20000
CTemp
4876C
12672C
6051x10-6
K7127C
19539C
6471x10-6K
15421C
17853C
12050x10-6K
RTM6+ZB+ATH 30wt
Figure 422 CTE of epoxy resin RTM6+ATH+ZB 30wt
Coefficient of Thermal Expansion (10-6K)
Samples I Heating ramp II Heating ramp
RTM6 neat 606 1329 678 1657
RTM6+ZB 30wt 595 1767 656 -
RTM6+ATH 30wt 605 1149 612 -
RTM6+ATH+ZB 30wt 612 1157 671 -
Table 415 CTE of synergistic effect of zinc borate
Instead in the graph of TMA of ZS and ZHS there are two values in the
second heating ramp and rather than as a ZB and ATH This confirms
as previously seen from the cone that the protective structure that is
created is different because chemically boron and aluminium will
Chapter 4 Flame retardant of epoxy resin with inorganic compounds
78
oxidize more easily creating alumina and boron oxide (ceramic) hence
tighten the structure
000 10000 20000Time [min]
150000
151000
x101
umTMA
-002
-001
000
001
002
NLOAD
10000
20000
CTemp
7767C
17204C
5787x10-6K
21699C
24925C
12096x10-6
K
19957C
4559C
13757C
6488x10-6
K
18170C
24788C
6759x10-6
K
RTM6+ZS 30wt
Figure 423 CTE of epoxy resin RTM6+ZS 30wt
000 10000 20000Time [min]
165000
166000
167000
168000
x101
umTMA
-002
-001
000
001
002
NLOAD
10000
20000
CTemp
6060C
15393C
6330x10-6
K
20830C
23721C
29456x10-6
K
20725C
7879C
15387C
6242x10-6
K
22040C
24930C
12702x10-6
K
RTM6+ZHS 30wt
Figure 424 CTE of epoxy resin RTM6+ZHS 30wt
In conclusion the values of coefficient of thermal expansion for both
heating ramp are reported in table 416
Chapter 4 Flame retardant of epoxy resin with inorganic compounds
79
Coefficient of Thermal Expansion (10-6K)
Samples I Heating ramp II Heating ramp
RTM6 neat 606 1329 678 1657
RTM6+ZB 30wt 595 2038 656 -
RTM6+ATH 30wt 605 1149 612 -
RTM6+ATH+ZB 30wt 612 1157 671 -
RTM6+ZS 30wt 636 7040 574 1276
RTM6+ZHS 30wt 621 2898 617 1268
Table 416 CTE of all samples of RTM6 and additives
In table 416 the values of CTE for all additives are reported and it is
clearly observed that the influence of additives on the matrix is able to
lower the CTE of epoxy resin neat
Furthermore it is shown the thermal mechanical analysis of panels of
epoxy resin with additives produced by VIP with carbon fibres The
samples were cut to 90 degrees in the transverse direction fibres to
observe the effect of carbon fibres and additives on the properties of
thermal mechanical of matrix
In the figures below the values of CTE of epoxy resin RTM6 with carbon
fibres and all additives are illustrated and it is shown that the values of
CTE are always lower than the CTE of single resin with fibres This
results are reported in the table 417
Chapter 4 Flame retardant of epoxy resin with inorganic compounds
80
000 10000 20000Time [min]
177500
178000
178500
x101
umTMA
-002
-001
000
001
002
NLOAD
10000
20000
CTemp
5090C
16755C
3325x10-6
K
22481C22314C
25029C
3085x10-6
K
17544C
7034C
15384C
3377x10-6
K
19683C
24476C
4543x10-6K
RTM6+CF
Figure 425 CTE of epoxy resin RTM6+CF
000 10000 20000Time [min]
138500
139000
139500
x101
umTMA
-002
-001
000
001
002
NLOAD
10000
20000
CTemp
5309C
15389C
2840x10-6K
21889C
24945C
2723x10-6
K
21278C
7875C
14546C
3036x10-6
K
18119C
19872C
24356C
3873x10-6
K
RTM6+CF+ZB 30 wt
Figure 426 CTE of epoxy resin RTM6+CF+ZB 30wt
Chapter 4 Flame retardant of epoxy resin with inorganic compounds
81
000 10000 20000Time [min]
162000
162500
163000
x101
umTMA
-002
-001
000
001
002
NLOAD
10000
20000
CTemp
22411C
5525C
16456C
3264x10-6
K
23409C24942C
2832x10-6K
17556C
7234C
14428C
3385x10-6K
20098C
24285C
3699x10-6
K
RTM6+CF+ATH 30 wt
Figure 427 CTE of epoxy resin RTM6+CF+ATH 30wt
000 10000 20000Time [min]
165500
166000
166500
x101
umTMA
-002
-001
000
001
002
NLOAD
10000
20000
CTemp
22639C
4575C
15467C
3111x10-6K
22316C
25085C
4058x10-6K
7993C
14547C
3240x10-6
K
17252C19766C
24360C
4942x10-6K
RTM6+CF+ATH+ZB 30 wt
Figure 428 CTE of epoxy resin RTM6+CF+ATH+ZB 30wt
Chapter 4 Flame retardant of epoxy resin with inorganic compounds
82
000 10000 20000Time [min]
155500
156000
x101
umTMA
-002
-001
000
001
002
NLOAD
10000
20000
CTemp
22262C
5082C
16873C
2888x10-6
K
22845C
25089C
3534x10-6
K
15935C
7235C
14962C
3211x10-6
K
18924C
23941C
4176x10-6
K
RTM6+ZS 30wt
Figure 429 CTE of epoxy resin RTM6+CF+ZS 30wt
000 10000 20000Time [min]
174000
174500
x101
umTMA
-002
-001
000
001
002
NLOAD
10000
20000
CTemp
24089C
5721C
18578C
2851x10-6
K
23944C25021C
2451x10-6K
16347C
6501C
14321C
3085x10-6
K
19681C
24287C
3625x10-6K
RTM6+ZHS 30wt
Figure 430 CTE of epoxy resin RTM6+CF+ZHS 30wt
Chapter 4 Flame retardant of epoxy resin with inorganic compounds
83
Coefficient of Thermal Expansion (10-6K)
Samples I Heating ramp II Heating ramp
RTM6+CF 332 319 346 452
RTM6+CF+ZB 30wt 265 317 311 386
RTM6+CF+ATH 30wt 326 306 339 389
RTM6+CF+ATH+ZB 30wt 292 299 306 398
RTM6+CF+ZS 30wt 296 318 318 378
RTM6+CF+ZHS 30wt 276 364 318 406
Table 417 CTE of all samples of RTM6+CF and all additives
In the table the thermal mechanical data of panels are reported and it is
shown that the carbon fibers and the additives reduced the CTE hence
increase the thermal mechanical properties of epoxy resin RTM6
Chapter 4 Flame retardant of epoxy resin with inorganic compounds
84
References [1] Bourbigot S Le Bras M Leeuwendal R Shen KK Schubert D
Polym Degrad Stab 1999 (64)419-425
[2] Carpentier F Bourbigot S Le Bras M Delobel R Foulon M Polym
Degrad Stab 2000 69 1 83-92
[3] Wu Z Shu W Hu Y Journal of Applied Polymer Science 2007
1033667-3674
[4] Petsom A Roengsumran S Ariyaphattanakul A Sangvanich P
Polym Degrad Stab 2003(80)17-22
[5] Cusack PA Heer MS Monk AW Polymer Degradation and Stability
1997 (58)229-237
[6] Ning Y Guo S J of App Pol Sc 2000 77 3119-3127
[7] Wu S Cong P Yu J Luo X Mo L Fuel 2006 85 1298-1304
[8] Bourbigot S Le Bras M Duquesne S Rochery M Macromol Mater
Eng 2004 289 499-511
[9] Le Bras M Bourbigot S Duquesne S Jama C Wilkie CA Royal
Society of Chemistry Press Cambridge 2005
[10] Genovese A Shanks RA Polym Degrad Stab 2007 92 2-13
[11] Samyn F Bourbigot S Duquesne S Delobel R Thermochimica
2007 456 134-144
[12] Schartel B Hull TR Fire and Materials 2007 31 327-354
CHAPTER 5 FLAME RETARDANT OF EPOXY RESIN WITH
CARBON NANOTUBES
51 The state of the art on flame retardant of carbon
nanotubes Fire retardancy is one of the fields where the nanomaterials could be
used successfully Nanoparticles embedded in various polymer matrices
are reported to reduce considerably the heat released from these
materials [1] The investigation of size shape interfaces and
concentration of nanoscale silica nano-flakes nanotubes and other
nanoparticles on the flame retardant performance increased the role of
fire protected polymers within the science of materials There is a high
level of interest in using filler particles having at least one nano-
dimensional scale for making polymeric nanocomposite materials with
exceptional properties One of the promising applications involves the
improvement in flammability properties of polymers with nanofillers
because one weak aspect of polymers is that they are combustible
under certain conditions These filled systems are attractive as possible
alternatives to conventional flame retardants and furthermore they
could simultaneously improve both physical and flammability
properties of polymers [2]
Carbon nanotubes are candidates as flame retardant additives because
of their highly elongated shape (high aspect ratio)
In literature [2-6] different authors analyzed the fire behaviours of
carbon nanotubes in several matrices
Kashiwagi et al [2-4] found that nanocomposites based on carbon
nanotubes are likewise capable of forming a continuous structured
network as a protective layer without the formation of cracks that
compromise the flame-retardant effectiveness This resulted in a
Chapter 5 Flame retardant of epoxy resin with carbon nanotubes
86
significant reduction in the heat release rate (a flammability measure
related to the fire intensity) with a carbon nanotube mass concentration
as low as 05 This protective layer consisted mainly of carbon
nanotubes and it seemed to act as a heat shield for the virgin polymer
below the layer Poorly dispersed carbon nanotubes resulted in the
formation of a discontinuous layer consisting of fragmented islands
rather than the continuous protective network layer Very low
concentrations of the tubes yielded the same fragmented island
structures as found in the clay nanocomposite measurements The
flame retardant performance of the nanocomposites containing the
island structure was much poorer than that of the nanocomposites
forming a continuous protective network layer Thus the formation of
the network structured protective layer during burning without any
openings or cracks seems to be crucial for the large reduction in heat
release rate Furthermore Kashiwagi et al [5] suggested that this
network is formed in the original sample under appropriate fabrication
conditions and that this structure provides the main source of the
protective layer that is formed during the burning process This
hypothesis was systematically tested with various sizes and
concentrations of carbon-based nanoparticles in a PMMA matrix
Cipiriano et al [6] studied the effects of the aspect ratio of multi-walled
carbon nanotubes (MWNTs) on the rheology and flammability of
polystyreneMWNT nanocomposites using two MWNTs having average
aspect ratios (length to outer diameter) of 49 and 150 In flammability
experiments they demonstrated that the larger aspect ratio particles
lead to a greater reduction in mass loss rate hence they are more
effective in reducing flammability
Chapter 5 Flame retardant of epoxy resin with carbon nanotubes
87
52 Cone calorimeter test Cone calorimeter tests were performed using a Fire Testing Technology
Ldt cone calorimeter according to the ASTM E1354-04 procedure
Samples with nominal dimensions of 100x100x3 mm were tested
horizontally under an incident flux of 35 kWm2 This level was chosen
as it corresponds to the evolved heat during a fire for samples with
thickness less than 3mm
521 Flame retardant of RTM6 and MWNT Nanocyl 7000
The nanocomposites of epoxy resin and multi walled carbon nanotubes
were prepared by sonication process as is reported in the Chapter 3
0 100 200 300 4000
600
1200
1800
2400
3000
HR
R [k
Wm
2 ]
Time [s]
RTM6 RTM6+MWNT 01wt
Figure 51 HRR curves of RTM6MWNT at percentage of 01wt
Samples
TTI
(s)
pHRR
(kWm2)
HRR
average
(kWm2)
TTP
(s)
THR
(MJm2)
TSR
(m2m2)
RTM6 neat 35 1479 614 156 117 4688
RTM6+MWNT
01wt 72 1651 643 136 108 3863
Table 51 Parameters calculated by cone calorimeter data for RTM6MWNT 01wt
Chapter 5 Flame retardant of epoxy resin with carbon nanotubes
88
In figure 51 it is shown that the carbon nanotubes donrsquot influence the
properties of flame retardants of matrices because the percentage used
in this work is low A small effect is shown only for the value of TTI as
reported in table 51
523 Flame retardant of panels of RTM6 and carbon nanotubes
The nanocomposites were prepared by sonication process (Chap3) the
epoxy resin RTM6 with multi walled carbon nanotubes at percentage of
01 wt and then the mixture was degassed for 30 minutes at 90degC in a
vacuum oven to eliminate entrapped air and humidity Afterwards the
mixture was injected in the preform of 20x20cm by vacuum infusion
process Samples were manufactured with 8 plies of overlaid
unidirectional carbon fibres at zero degrees with thickness of 03mm
each one
0 100 200 300 4000
200
400
600
800
HR
R [k
Wm
2 ]
Time [s]
RTM6+CF RTM6+CF+MWNT 01wt
Figure 52 HRR curves of RTM6CFMWNT 01wt
Chapter 5 Flame retardant of epoxy resin with carbon nanotubes
89
Samples
TTI
(s)
pHRR
(kWm2)
HRR
average
(kWm2)
TTP
(s)
THR
(MJm2)
TSR
(m2m2)
RTM6+CF 91 301 118 124 20 1009
RTM6+CF+MWNT
01wt 88 306 129 124 21 1077
Table 52 Parameters calculated by cone calorimeter data for RTM6CFMWNT
system at percentage of 01wt
As seen above the percentage of nanotubes is not effective and the
presence of unidirectional fibres does not induce changes sensitive to
the distribution of flame
53 Thermal mechanical analysis of RTM6 and carbon
nanotubes The thermal mechanical analysis was conducted on both samples of
RTM6 and additives on panels with carbon fibres
000 10000 20000Time [min]
145000
146000
147000
148000x10
1um
TMA
-002
-001
000
001
002
NLOAD
10000
20000
CTemp
19613C
5600C
16757C
6207x10-6
K
21589C
24557C
13770x10-6
K
7768C
16433C
6748x10-6K
21168C
24930C
16647x10-6
RTM6 NEAT
Figure 53 CTE of epoxy resin RTM6 neat
Chapter 5 Flame retardant of epoxy resin with carbon nanotubes
90
000 10000 20000Time [min]
140000
141000
142000
x101
umTMA
-002
-001
000
001
002
NLOAD
10000
20000
CTemp
20956C
4487C
16322C
6518x10-6K
21697C
25089C
13872x10-6
K
7339C
16669C
6897x10-6
K
20631C
21697C
24929C
17239x10-6K
RTM6+MWNT 01wt
Figure 54 CTE of epoxy resin RTM6+MWNT 01wt
Coefficient of Thermal Expansion (10-6K)
Samples I Heating ramp II Heating ramp
RTM6 neat 606 1329 678 1657
RTM6+MWNT 01wt 622 1374 688 1702
Table 53 CTE of RTM6 and MWNT 01wt
In the figures 53 and 54 and in the table 53 the CTE for panels of
epoxy resin additived with carbon nanotubes are shown where the
percentage of multi walled carbon nanotubes is too low to make an
improvement on the value of CTE of RTM6 and carbon fibres
Chapter 5 Flame retardant of epoxy resin with carbon nanotubes
91
000 10000 20000Time [min]
177500
178000
178500
x101
umTMA
-002
-001
000
001
002
NLOAD
10000
20000
CTemp
5090C
16755C
3325x10-6
K
22481C22314C
25029C
3085x10-6
K
17544C
7034C
15384C
3377x10-6
K
19683C
24476C
4543x10-6K
RTM6+CF
Figure 55 CTE of epoxy resin RTM6+CF
000 10000 20000Time [min]
153500
154000
154500
x101
umTMA
-002
-001
000
001
002
NLOAD
10000
20000
CTemp
6828C
19462C
3758x10-6
K
22996C25074C
5327x10-6K
8314C
14215C
3810x10-6
K
19996C
24591C
5725x10-6K
RTM6+CF+MWNT 01wt
Figure 56 CTE of epoxy resin RTM6+CF+MWNT 01wt
Chapter 5 Flame retardant of epoxy resin with carbon nanotubes
92
Coefficient of Thermal Expansion (10-6K)
Samples I Heating ramp II Heating ramp
RTM6+CF 332 319 346 452
RTM6+CF+MWNT
01wt 367 577 383 553
Table 54 CTE of RTM6+CF+MWNT 01wt system
Similar values are obtained for the sample with carbon fibres and
carbon nanotubes in fact in table 54 it is shown clearly that both
nanotubes and fibers donrsquot influence CTE of RTM6CF system
Chapter 5 Flame retardant of epoxy resin with carbon nanotubes
93
References [1] Marosfoi B Matko Sz Marosi PAnnaGy Current Applied Physics
2006 (6)259-261
[2] Kashiwagi T Du F Winey KI Groth KM Shields JR Bellayer SP
Kim H Douglas JF Polymer 2005 (46)471-481
[3] Kashiwagi T Grulke E Hilding J Groth K Harris R Butler K
Shields J Kharchenko S Douglas J Polymer 2004 (45) 4227-4239
[4] Kashiwagi et al Macromol Rapid Commun 2002 (23) 761-765
[5] Kashiwagi T Du F Douglas JF Winey KI Harris RHJr Shields
JR Nature materials 2005 (4) 5-10
[6] Cipiriano BH Kashiwagi T Raghavan SR Yang Y Grulke EA
Yamamoto K Shields JR Douglas JF Polymer 2007 486086-6096
[7] Qian D Dickey EC Andrews R Rantell T Appl Phys Lett 200076
(20)2868-2870
[8] Park C et al Chemical Physical Letters 2002364303-308
[9] Ham HT Choi YS Chung JI Journal of Colloid and Interface
Science 2005286 (1)216-223
[10] Salvetat JP Briggs AD Bonard JM Bacsa RR Kulik AJ Stockli T
Burnham NA Forroacute L Phys Rev Lett 199982 (5)944-947
[11] Choi ES Brooks JS Eaton DL Haik MS Hussaini MY Garmestani
H Li D Dahmen KJ Appl Phys 2003946034-
[12] Sandler J Shaffer MSP Prasse T Bauhofer W Schulte K Windle
AH Polymer 199940(21)5967-5971
[13] Xiao-Lin X Yiu-Wing M Xing-Ping Z Materials Science and
Engineering R 20054989-112
[14] Jin L Bower C Zhou O Appl Phys Lett 199873 (9)1197-1199
[15] Choi ES Brooks JS Eaton DL Al-Haik MS Hussaini MY
Garmestani H Li D Dahmen KJ Appl Phys 2003945451-5473
CHAPTER 6 KINETIC DEGRADATIONS KISSINGER AND OZAWA
METHODS
61 The state of the art on Kissinger and Ozawa methods
for epoxy resin To study the accelerated ageing of polymers and to obtain the kinetic
parameters of decomposition such as the apparent activation energy we
must to extrapolate according to the environment where the materials
are used It is important to consider the degradation mechanisms both
in the environments where they are used both when they are under
accelerated ageing conditions
Thermogravimetric analysis is often used to determine decomposition
reactions and to evaluate the thermal stability The mass loss is
controlled by time in isothermal conditions or by temperature during
the heating rate Changes in mass can be associated with solvent or
water desorptionabsorption oxidation or reduction and decomposition
Dynamic TG tests tend to be shorter and the mechanism of degradation
may be studied over a large temperature range with typical heating rate
Regnier et al [1] in a previously work on polyimide polymer system
compared several methods to calculate thermal kinetic parameters
They showed that Van Krevelen Horowitz-Metzger Coats Redfern and
Mac-Callum-Tanner methods gave a similar apparent activation energy
All kinetic parameters calculated by using these methods showed
equally good agreement with the experimental data Afterwards Regnier
et al [2] investigated the thermal degradation of epoxycarbon
composites in dynamic conditions The activation energy have been
evaluated employing Kissingerrsquos method assuming first order reaction or
the Osawarsquos method which gives an estimated activation energy for the
overall degradation
Chapter 6 Kinetic degradation Kissinger and Ozawa methods
95
Kiefer et al [3] mentioned that the sample preparation had an effect on
the kinetic results It does seem that the kinetic parameters are divided
into two groups however depending whether or not the sample
contained fibres He observed that the resin is affecting the fibre
Wang et al [4] studied the degradation behaviours of epoxy resins
containing various flame retardant components by Kissinger Flynn-
Wall-Ozawa and Horowitz-Metzger methods They demonstrated that
the activation energy at lower degree of the degradation decreased by
incorporation of flame retardant components while increased at higher
degree of the degradation
Chiang et al [5] prepared epoxy nanocomposites containing silicon and
phosphorus and compared with pure epoxy by Kissingerrsquos method They
found that the activation energies of thermo-oxidative degradation for
epoxy nanocomposites are less than those of thermo-oxidative
degradation for pure epoxy in first stage of thermo-oxidative
degradation However the activation energies of thermo-oxidative
degradation for epoxy nanocomposites are more than those of thermo-
oxidative degradation for pure epoxy in second stage of thermo-oxidative
degradation
In the dynamic and isothermal TGA measurements the mass loss is
detected in function of temperature and kinetic of degradation is based
on nth order reaction mechanism and in the many cases the rate of
degradation is a linear function of temperature by a constant
dependent of temperature by Arrhenius equation
)(αα Kfdtd
= (1)
with
⎟⎠⎞
⎜⎝⎛ minus=
RTEAfk exp)(α
(2)
Chapter 6 Kinetic degradation Kissinger and Ozawa methods
96
The combination of (1) e (2) gives
⎟⎠⎞
⎜⎝⎛ minus=
RTEAf
dtd exp)(αα
(3)
If heating rate β=dTdt is constant the variation in degree of conversion
can be analysed as a function of temperature and this temperature
being dependent on the time of heating
⎟⎠⎞
⎜⎝⎛ minus=
RTEfA
dTd exp)(α
βα
(4)
The integrated form of this equation generally is expressed as
int int ⎟⎠⎞
⎜⎝⎛minus==
α
βααα
0 0
exp)(
)( dTRTEA
fdg
T
(5)
where g(α) is the integrated form of the conversion dependence function
Different kinetics methods (differential and integral) were applied in this
study
Kissinger method [6] makes it possible to determine the values of
activation energy without a precise knowledge of the reaction
mechanism and analyzes the changes in the thermo-gravimetric data
through the change of scan rate of heating β depending on the
temperature of the maximum peak in DTG curve That way you get
that
( )[ ]max
1max2
max
1lnlnlnRT
EnE
ART
n minus⎭⎬⎫
⎩⎨⎧ minus+=⎟⎟
⎠
⎞⎜⎜⎝
⎛ minusαβ
(6)
where Tmax is the temperature corresponding to the inflection point of
thermo degradation curves which corresponds to the maximum reaction
rate αmax is the conversion at Tmax and n is the reaction order
Chapter 6 Kinetic degradation Kissinger and Ozawa methods
97
Assuming that ( ) ( ) 1 1maxmax constnf n congminus=prime minusαα the activation energy E can
be determined from a plot of ln(βT2max) against 1Tmax
With Flynn-Wall-Ozawa method [7-9] it is possible to get values of
activation energy applying Doylersquos approximation to the integration of
Eq(5) You get that
RTE
RgAE 456703152
)(loglog minusminus⎥
⎦
⎤⎢⎣
⎡=
αβ
(7)
Using Eq7 it is possible to plot logβ against 1T and to consider the
slope of straight line which result with a various value of conversion
The graph that result report E in function of conversion degree
62 Kinetic degradations of RTM6 and inorganic
compounds For obtaining the kinetic information such as the activation energy the
TGA study has been conducted with the variation of the heating rates
The dynamic experiments were carried out at different heating rates 5
75 10 and 20 degCmin from ambient to 800degC with TA 2950
thermobalance in nitrogen and air atmosphere For each experiment
were used approximately 10 mg of materials and the kinetics
parameters of interest as activation energy relating to initial
degradation of mixtures were obtained by Kissinger and Flynn-Ozawa-
Wall methods
In figure 61 thermogravimetric analysis of the epoxy resin RTM6 in the
nitrogen atmosphere are reported The epoxy resin shows only one step
of degradation and the onset temperature is around 350degC while the
maximum temperature on the DTG curves shows a little difference in
the heating rate
Chapter 6 Kinetic degradation Kissinger and Ozawa methods
98
Figure 61 TGA thermograms of RTM6 neat in nitrogen atmosphere
Figure 62 DTG thermograms of RTM6 neat in nitrogen atmosphere
In table 61 the onset temperature and maximum temperature for
epoxy system neat are reported along with the corresponding heating
ramp
Chapter 6 Kinetic degradation Kissinger and Ozawa methods
99
Heating rate (degCmin) Tonset (degC) Tmax (degC) 5degCmin 305 372
75degCmin 320 381
10degCmin 330 388
20degCmin 348 403
Table 61 Tonset and Tmax of epoxy resin RTM6 in nitrogen atmosphere
In air atmosphere two different degradation steps spanning the whole
investigated temperature range are noticeable the first step occurring
at 350degC and a second much broader step within around 500-550degC
(fig 63 and 64) The second step was attributed to a decomposition of
the non-volatile residues formed in the first step
Figure 63 TGA thermograms of RTM6 neat in air atmosphere
Chapter 6 Kinetic degradation Kissinger and Ozawa methods
100
Figure 64 DTG thermograms of RTM6 neat in air atmosphere
In table 62 are reported Tonset and Tmax of epoxy resin in air atmosphere
for each step
I STEP
Heating rate (degCmin) Tonset (degC) Tmax (degC) 5degCmin 354 378
75degCmin 351 383
10degCmin 354 406
20degCmin 357 398
II STEP
Heating rate (degCmin) Tonset (degC) Tmax (degC) 5degCmin 475 517
75degCmin 524 556
10degCmin 523 568
20degCmin 544 597
Table 62 Tonset and Tmax of epoxy resin RTM6 in air atmosphere
Chapter 6 Kinetic degradation Kissinger and Ozawa methods
101
The Kissinger method was employed to obtain the apparent activation
energy (Ea) in air or nitrogen from several scan with different heating
rate (q) Figures 65 and 66 represent the Kissinger plots of the epoxy
resin degraded in nitrogen and air atmosphere
150 152 154 156 158 160 162 1641000 KT
0
02
04
06
08
10
log (Heating rate(Kmin))
Activation Energy(kJmol) 16452 +- 351log (As^-1) 1070
Figure 65 Kissinger graphs for RTM6 data in nitrogen atmosphere
-1 2
-1 1 5
-1 1
-1 0 5
-1 0
-9 5
-9
-8 5
0 0 0 1 1 0 0 0 1 2 0 0 0 1 3 0 0 0 1 4 0 0 0 1 5 0 0 0 1 6
I S tepII s tep
y = 68 38 3 - 5 2 03 6 x R = 0 9 9 9 4 3
y = 0 4 01 9 5 - 9 69 1 x R = 0 9 9 7 4 3
ln ( β
T max
2 )
1 Tm a x
degK -1
Figure 66 Kissinger graphs for RTM6 data in air atmosphere
Chapter 6 Kinetic degradation Kissinger and Ozawa methods
102
KISSINGER in nitrogen atmosphere
Ea (kJmol) 16452
KISSINGER in air atmosphere
I STEP II STEP
Ea (kJmol)
RTM6 NEAT
816 1157
Table 63 Kissinger data for epoxy resin RTM6 in nitrogen and air atmosphere
The kinetic parameters calculated in nitrogen flow present activation
energy values higher than Ea obtained in air flow In fact activation
energy value in nitrogen flow is 16452 kJmol instead in air flow is
816 kJmol for first step and 1157 KJmol for second step
The Flynn-Ozawa-Wall method was also carried out for calculating the
activation energy only in nitrogen atmosphere In figures 67 and 68 it
is reported respectively the Ozawa analysis and activation energy
calculated with Ozawa methods for epoxy resin RTM6 It is possible to
notice that in the nitrogen atmosphere the Ea increase from conversion
zero to 20 after Ea is a constant from =02 to =07 and than
increase until to =085
Chapter 6 Kinetic degradation Kissinger and Ozawa methods
103
10 12 14 16 18 201000 KT
06
08
10
12
14log Heating rate(Kmin)
002 098
Figure 67 Ozawa analysis for RTM6 in nitrogen atmosphere
0 02 04 06 08 10 FractMass Loss
40
80
120
160
200
E(kJmol)
Figure 68 Energy of activation calculated with Ozawa method for RTM6 in nitrogen
atmosphere
The thermogravimetric derivate signal for RTM6ZB 30 wt system is
showed in figure 69 for nitrogen atmosphere and in figure 610 for air
atmosphere
Chapter 6 Kinetic degradation Kissinger and Ozawa methods
104
Figure 69 DTG thermograms of RTM6+ZB 30wt in nitrogen atmosphere
Figure 610 DTG thermograms of RTM6+ZB 30wt in air atmosphere
Chapter 6 Kinetic degradation Kissinger and Ozawa methods
105
145 147 149 151 1531000 KT
06
08
10
12
14log (Heating rate(Kmin))
Activation Energy(kJmol) 15425 +- 2201log (As^-1) 971
Figure 611 Kissinger graphs for RTM6+ZB 30wt data in nitrogen atmosphere
-12
-115
-11
-105
-10
0001 00012 00014 00016 00018 0002
I stepII step
y = 15735 - 17745x R= 099679
y = 15931 - 21603x R= 099919
ln(β
Tm
ax2 )
1Tmax
Figure 612 Kissinger graphs for RTM6+ZB 30wt data in air atmosphere
The Kissinger analysis in nitrogen atmosphere has demonstrated that
the activation energy Ea is less than the value of epoxy resin hence it
doesnrsquot achieve the energy for the degradation of RTM6 neat Instead in
the Kissinger analysis in air atmosphere it is shown that the value of
Chapter 6 Kinetic degradation Kissinger and Ozawa methods
106
Ea in the second step is higher than the value of RTM6 in fact at the
temperature lower 500degC a char on the surface that protects the matrix
is produce
KISSINGER in nitrogen atmosphere
Ea (kJmol) 15425
KISSINGER in air atmosphere
I STEP II STEP
Ea (kJmol)
RTM6+ZB 30wt
14754 17962
Table 64 Kissinger data for RTM6+ZB 30wt in nitrogen and air atmosphere
10 12 14 16 18 201000 KT
06
08
10
12
14log Heating rate(Kmin)
002 098
Figure 613 Ozawa analysis for RTM6+ZB 30wt in nitrogen atmosphere
Chapter 6 Kinetic degradation Kissinger and Ozawa methods
107
0 02 04 06 08 FractMass Loss
40
60
80
100
120
140
160
E(kJmol)
Figure 614 Energy of activation calculated with Ozawa method for RTM6+ZB 30wt
in nitrogen atmosphere
In the nitrogen atmosphere the Ozawa analysis confirms the positive
effect of zinc borate on the epoxy resin RTM6 because with low
conversion values the activation energy Ea is less than 50kJmol while
for conversion degrees between 01 and 08 a multi-step degradation
process is shown The presence of this step means that several layers of
char on the surface of the RTM6 have been created
Chapter 6 Kinetic degradation Kissinger and Ozawa methods
108
Figure 615 DTG of RTM6+ATH 30 wt in nitrogen atmosphere
Figure 616 DTG of RTM6+ATH 30 wt in air atmosphere
Chapter 6 Kinetic degradation Kissinger and Ozawa methods
109
147 149 151 1531000 KT
06
08
10
12
14log (Heating rate(Kmin))
Activation Energy(kJmol) 18731 +- 971log (As^-1) 1247
Figure 617 Kissinger graphs for RTM6+ATH 30 wt data in nitrogen atmosphere
-5
-49
-48
-47
-46
-45
-44
-43
-42
00012 00014 00016 00018 0002 00022
I stepII step
y = -071912 - 22661x R= 099682
y = 80558 - 84061x R= 097719
log
(βT
max
2 )
1Tmax
Figure 618 Kissinger graphs for RTM6+ATH 30 wt data in nitrogen atmosphere
Chapter 6 Kinetic degradation Kissinger and Ozawa methods
110
-12
-115
-11
-105
-10
-95
0001 00012 00014 00016 00018 0002
I stepII stepIII step
y = 11477 - 12954x R= 099948
y = 23102 - 22194x R= 099906
y = 66365 - 14480x R= 099861
ln(β
Tm
ax2 )
1Tmax
Figure 619 Kissinger graphs for RTM6+ATH 30 wt data in air atmosphere
KISSINGER in nitrogen atmosphere
I STEP II STEP
Ea (kJmol)
18841 6989
KISSINGER in air atmosphere
I STEP II STEP III STEP
Ea (kJmol)
RTM6+ATH 30wt
1077 1845 1204
Table 65 Kissinger data for RTM6+ATH 30wt in nitrogen and air atmosphere
In this case there are three degradation steps in the Kissinger analysis
in air atmosphere of aluminium trihydrate By varying the temperature
the following process occurred sequentially
bull dehydration of hydroxyl groups
bull formation of aluminized layer protection
bull pyrolysis of char
Chapter 6 Kinetic degradation Kissinger and Ozawa methods
111
For every step it is possible to associate the activation energy which is
greater than Ea of RTM6 hence it represents a slower degradation
08 10 12 14 16 18 201000 KT
06
08
10
12
14log Heating rate(Kmin)
002 095
Figure 620 Ozawa analysis for RTM6+ATH 30wt in nitrogen atmosphere
0 02 04 06 FractMass Loss
20
40
60
80
100
120
140
160
180
E(kJmol)
Figure 621 Energy of activation calculated with Ozawa methods for RTM6+ATH
30wt in nitrogen atmosphere
Chapter 6 Kinetic degradation Kissinger and Ozawa methods
112
In the Ozawa analysis it is demonstrated that the Ea starts to lower
values than both RTM6 and ZB in fact Ea starts to 25 kJmol and two
different steps are observed In the first step Ea is 70 kJmol for =01
while in the second step Ea is 160 kJmol with conversation degree
between 02 and 07
The TGA thermograms of the epoxy resin containing zinc borate and
aluminium trihydrate is reported in figures 622 and 623 to study the
kinetic parameters for synergistic effects of zinc borate
Figure 622 DTG of RTM6+ATH+ZB 30 wt in air atmosphere
Chapter 6 Kinetic degradation Kissinger and Ozawa methods
113
Figure 623 DTG of RTM6+ATH+ZB 30 wt in air atmosphere
146 148 150 152 154 1561000 KT
06
08
10
12
14log (Heating rate(Kmin))
Activation Energy(kJmol) 12276 +- 1399log (As^-1) 717
Figure 624 Kissinger graphs for RTM6+ATH+ZB 30 wt system data in nitrogen
atmosphere
Chapter 6 Kinetic degradation Kissinger and Ozawa methods
114
-125
-12
-115
-11
-105
-10
-95
-9
0001 00012 00014 00016 00018 0002 00022
I stepII stepIII step
y = 27768 - 24989x R= 099954
y = 26545 - 24952x R= 099876
y = 11444 - 18156x R= 099963
ln(β
Tm
ax2 )
1Tmax
Figure 625 Kissinger graphs for RTM6+ATH+ZB 30wt system data in air
atmosphere
KISSINGER in nitrogen atmosphere
Ea (kJmol) 12276
KISSINGER in air atmosphere
I STEP II STEP III STEP
Ea (kJmol)
RTM6+ATH+ZB 30wt
2077 2075 1509
Table 66 Kissinger data for RTM6+ATH+ZB 30wt in nitrogen and air atmosphere
Chapter 6 Kinetic degradation Kissinger and Ozawa methods
115
10 12 14 16 18 201000 KT
06
08
10
12
14log Heating rate(Kmin)
002 098
Figure 626 Ozawa analysis for RTM6+ATH+ZB 30wt system in nitrogen
atmosphere
01 03 05 07 Fractional Reaction
100
200
300
400
500
600
700E(kJmol)
Figure 627 Energy of activation calculated with Ozawa methods for RTM6+ATH+ZB
30wt system in nitrogen atmosphere
Chapter 6 Kinetic degradation Kissinger and Ozawa methods
116
The presence of both additives is clear in the Kissinger analysis and the
synergistic effect is shown in the Ozawa analysis because at low levels
of alpha Ea is higher In fact Ea increases for values of alpha around 01
and remains constant value of 200 kJmol throughout the range of
conversion Consequently it is necessary a higher energy than in
respect to the same additives taken individually and RTM6 neat to
complete the degradation process
Figure 628 DTG of RTM6+ZS 30 wt in nitrogen atmosphere
Chapter 6 Kinetic degradation Kissinger and Ozawa methods
117
Figure 629 DTG of RTM6+ZS 30 wt in air atmosphere
152 154 156 158 1601000 KT
06
08
10
12
14log (Heating rate(Kmin))
Activation Energy(kJmol) 15759 +- 420log (As^-1) 1044
Figure 630 Kissinger graphs for RTM6+ZS 30 wt data in nitrogen atmosphere
Chapter 6 Kinetic degradation Kissinger and Ozawa methods
118
-12
-115
-11
-105
-10
-95
0001 00012 00014 00016 00018 0002
I stepII stepIII step
y = 31646 - 26873x R= 099793
y = 11934 - 15035x R= 099848
y = 79213 - 15008x R= 099838
ln(β
Tm
ax2 )
1Tmax
Figure 631 Kissinger graphs for RTM6+ZS 30 wt data in air atmosphere
KISSINGER in nitrogen atmosphere
Ea (kJmol) 1576
KISSINGER in air atmosphere
I STEP II STEP III STEP
Ea (kJmol)
RTM6+ZS 30wt
2234 125 1248
Table 66 Kissinger data for RTM6+ZS 30wt in nitrogen and air atmosphere
Zinc stannate is similar to ATH for Kissinger analysis because also in
this case there are three degradation steps The discussion on the
structure of char isnrsquot like ATH because there isnrsquot the aluminium and
because the second and third degradation step need a lower energy to
be completed hence it is explained that the protection action is partly
missing
Chapter 6 Kinetic degradation Kissinger and Ozawa methods
119
10 12 14 16 18 20 22 24 261000 KT
06
08
10
12
14
log Heating rate(Kmin)
002 098
Figure 632 Ozawa analysis for RTM6+ZS 30wt in nitrogen atmosphere
0 02 04 06 08 FractMass Loss
0
40
80
120
160
200
E(kJmol)
Figure 633 Energy of activation calculated with Ozawa methods for RTM6+ZS in
nitrogen atmosphere
Chapter 6 Kinetic degradation Kissinger and Ozawa methods
120
In the Ozawa analysis in nitrogen atmosphere the activation energy has
a maximum peak of 200 kJmol around to =06 and neither a constant
evolution nor several degradation steps are shown
Figure 634 DTG of RTM6+ZHS 30 wt in nitrogen atmosphere
Figure 635 DTG of RTM6+ZHS 30 wt in air atmosphere
Chapter 6 Kinetic degradation Kissinger and Ozawa methods
121
151 153 155 157 1591000 KT
06
08
10
12
14log (Heating rate(Kmin))
Activation Energy(kJmol) 14931 +- 1257log (As^-1) 975
Figure 636 Kissinger graphs for RTM6+ZHS 30 wt data in nitrogen atmosphere
-49
-48
-47
-46
-45
-44
-43
-42
-41
00012 00014 00016 00018 0002 00022
I stepII step
y = 1713 - 10920x R= 09957
y = 11529 - 10291x R= 099916
log
(βT
max
2 )
1Tmax
Figure 637 Kissinger graphs for RTM6+ZHS 30 wt data in nitrogen atmosphere
Chapter 6 Kinetic degradation Kissinger and Ozawa methods
122
-125
-12
-115
-11
-105
-10
-95
0001 00012 00014 00016 00018 0002 00022
I stepII stepIII stepIV step
y = 30807 - 22469x R= 099707
y = 30543 - 26147x R= 099778
y = 755 - 56705x R= 099954
y = 83073 - 15323x R= 099946
ln(β
Tm
ax2 )
1Tmax
Figure 638 Kissinger graphs for RTM6+ZHS 30 wt data in air atmosphere
KISSINGER in nitrogen atmosphere
I STEP II STEP
Ea (kJmol)
908 85564
KISSINGER in air atmosphere
I STEP II STEP III STEP IV STEP
Ea (kJmol)
RTM6+ZHS 30wt
1868 2174 4715 1274
Table 67 Kissinger data for RTM6+ZHS 30wt in nitrogen and air atmosphere
Zinc hydroxystannate shows four degradation steps therefore the
degradation mechanism is particularly complex and to create the
protective layer a high energy contribution (471 kJmol) is necessary
Chapter 6 Kinetic degradation Kissinger and Ozawa methods
123
14 16 18 20 221000 KT
06
08
10
12
14log Heating rate(Kmin)
002 080
Figure 639 Ozawa analysis for RTM6+ZHS 30wt in nitrogen atmosphere
0 02 04 06 FractMass Loss
60
100
140
180
220
260
E(kJmol)
Figure 640 Energy of activation calculated with Ozawa methods for RTM6+ZHS in
nitrogen atmosphere
In the Ozawa analysis there are several steps and Ea is constant at the
value of 180 kJmol between alpha 01 to 05 and Ea increases until
Chapter 6 Kinetic degradation Kissinger and Ozawa methods
124
270 kJmol where is obtained to complete the degradation process of
degradation
63 Kinetic degradations of RTM6 and carbon nanotubes The thermal properties of CNTspolymer composites also attracted
many attentions from polymer scientists because CNTs have very high
thermal stability [10-14] Yang et al [11] reported the effect of single-
walled carbon nanotubes (SWNTs) on the thermal stability of
acrylonitrileebutadienee styrene (ABS)SWNTs composites They found
that the addition of SWNTs destabilized ABS and caused the composites
to degrade at lower temperatures Probst et al [12] revealed that
MWNTs promote the degradation of polyvinyl alcohol In contrast
Kashiwagi et al [13] observed an increased thermal stability of
MWNTspolypropylene (PP) composites The same effect of MWNTs on
PP was found by Yang et al [14] From the above publications both
promoting and hindering effects of CNTs on the thermal stability of
polymer are found The structure of the polymer matrix and the
interaction between CNTs and the matrix may be the key factors for the
thermal degradation behaviour of CNTs filled polymer composites
DTG curves of RTM6 with 01wt MWNTs under nitrogen and air
environments are showed in figures 639 and 640 respectively One
step decomposition is found under nitrogen atmosphere while two step
decomposition (second step from 450degC to 700degC) are found under air
atmosphere
Heating rate (degCmin) Tonset (degC) Tmax (degC) 5degCmin 317 376
75degCmin 334 387
10degCmin 334 391
20degCmin 348 404
Table 68 Tonset and Tmax of RTM6+MWNT 01wt in nitrogen atmosphere
Chapter 6 Kinetic degradation Kissinger and Ozawa methods
125
Figure 641 DTG of RTM6+MWNT 01wt in nitrogen atmosphere
Figure 642 DTG of RTM6+MWNT 01wt in air atmosphere
Chapter 6 Kinetic degradation Kissinger and Ozawa methods
126
147 149 151 153 1551000 KT
06
08
10
12
14log (Heating rate(Kmin))
Activation Energy(kJmol) 18936 +- 1296log (As^-1) 1269
Figure 643 Kissinger graphs for RTM6+MWNT 01wt data in nitrogen atmosphere
The Ea of neat RTM6 is found to be 164 KJmol while MWNTsRTM6
composites is found to be 189 KJmol suggesting that the MWNTs
increase the thermal stability of RTM6 under nitrogen atmosphere
-12
-115
-11
-105
-10
0001 00012 00014 00016 00018 0002
I stepII stepIII step
y = 11748 - 14660x R= 099802
y = 32132 - 97535x R= 099862
y = 38629 - 12408x R= 099656
ln(β
Tm
ax2 )
1Tmax
Figure 644 Kissinger graphs for RTM6+MWNT 01wt data in air atmosphere
Chapter 6 Kinetic degradation Kissinger and Ozawa methods
127
There are three steps although the small amount of carbon nanotubes
demonstrates that the degradation process has been altered The first
step is given by the of epoxy resin with carbon nanotubes The second
step is divided in two steps where in the first is lower than of the resin
and the second step is the pyrolysis of the char that happens with an
additional energy contribution
12 14 16 18 201000 KT
06
08
10
12
14log Heating rate(Kmin)
002 095
Figure 645 Ozawa analysis for RTM6+MWNT 01 wt in nitrogen atmosphere
In the Ozawa data a higher thermal stability than RTM6 is shown
because Ea starts by higher values but it is stable at about 200 kJmol
for alpha between 01 and 09
Chapter 6 Kinetic degradation Kissinger and Ozawa methods
128
0 02 04 06 08 FractMass Loss
60
80
100
120
140
160
180
200
E(kJmol)
Figure 646 Energy of activation calculated with Ozawa methods for RTM6+MWNT
01 wt in nitrogen atmosphere
64 Analysis of residue In the figure 647 a graph comparing dynamic measurements carried
out with scan rate of 10degCmin in air flow on all the samples tested in
this study is reported It is possible to notice that addition of zinc
compounds in the epoxy matrix does not induce big differences in the
first two stages of degradation except for the initial temperature of
degradation that increase for samples containing ZS and ZB For the
samples containing ZHS and ATH there is a difference in the first step
of degradation which occurs at around 220degC and these temperature is
characteristic of dehydration of crystallisation water For the samples
with ZS and ZB the loss of crystallisation water occur at higher
temperatures and this process is concomitant with the first step of
epoxy matrix degradation which happens in airflow at a temperature of
about 350degC and concern the dehydration of hydroxyl functions
The char oxidation stage occurs for the RTM6 neat in the temperature
range (513-627degC) instead for the samples containing flame retardant
Chapter 6 Kinetic degradation Kissinger and Ozawa methods
129
zinc compounds this range of temperature decrease It is possible to
notice larges differences for the residue of dynamic experiments carried
on samples flame retardants in oxidant atmosphere (tab 69) The flame
retardant zinc based promote char formation more efficiently at
temperatures lower than the epoxy RTM6 Zinc borate in the epoxy
matrix RTM6 induce formation of stable char at 554degC and residue is
about 32 of initial weight with weight loss in the third stage of 24
RTM6 with ZS form the char stable at the same temperature of sample
containing ZB but the residue in this case is lower than ZB (27)
Similarly RTM6 with ZHS show a residue equal at 14 lower than the
initial addition of flame retardant in the resin matrix (20) and the char
formation occurs at temperatures of 551degC
Figure 647 Comparison of additives at 10degCmin in dynamic mode and in air
atmosphere
Chapter 6 Kinetic degradation Kissinger and Ozawa methods
130
Temperature (degC)
Sample at 10
weight
loss
charring
stage
initial char
formation
weight
loss
III stage
of
char
at
800degC
RTM6 357 530-604 636 38 1
RTM6+ZS 359 492-527 555 35 24
RTM6+ZHS 356 498-530 559 40 17
RTM6+ZB 376 485-558 554 24 32
RTM6+ATH 374 509-582 628 36 9
Table 69 Analysis of last step of degradation in air flow
According to the Flynn-Ozawa-Wall analysis data it is possible to notice
that in air flow for RTM6 during the first stage of degradation occur
chain scission by thermolysis and there is the formation of thermally
more stable molecular compounds To destroy this compound it is
needed another stage of degradation that occurs with activation energy
and temperatures higher than first stage In the presence of flame
retardant compounds the second and third stage of degradation
concerns the segments of chain liberated that migrates in the surface of
samples A parts of these segments are volatiles but most of these
segments react with zinc compounds and form a layer of char stable
that delay the oxidation of matrix The sample containing ZB shows
higher efficiency of this process in the formation of char in the epoxy
matrix
Chapter 6 Kinetic degradation Kissinger and Ozawa methods
131
References [1] Regnier N Guibe C Polymer Degradation and Stability 1997
55165
[2] Regnier N Fontaine S Journal of Thermal Analysis and Calorimetry
2001 64789
[3] Kiefer R Yue J Hinkley J Journal of Advanced Materials 1995
2655
[4] Wang Q Shi W Polymer Degradation and Stability 2006 911747-
1754
[5] Chiang CL Ma CCM Wang FY Kuan HC European Polymer
Journal 2003 39825-830
[6] Kissinger HE Anal Chem 1957 291702-1706
[7] Flynn JH Wall LA J Res Nat Bur Stand A Phys Chem 1996
70A487
[8] Ozawa T Bull Chem Soc Jpn 1965 381881
[9] Doyle CD Nature 1965 207240
[10] Beyer G Fire Mater 200226(6)291-3
[11] Yang SY Castilleja JR Barrera EV Lozano K Polym Degrad Stab
200483383-8
[12] Probst O Moore EM Reasaco DE Grady BP Polymer 200454437-
43
[13] Kashiwagi T Grulke E Hilding J Harris R Awad W Douglas J
Macromol Rapid Commun 200223(13)761-5
[14] Yang J Lin YH Wang JF Lai MF Li J Liu JJ et al J Appl Polym
Sci 200598 1087-91
CHAPTER 7 CONCLUSIONS AND FUTURE PERSPECTIVES
71 Conclusions In this work the flame retardant and thermal mechanical properties of
an monocomponent epoxy resin additived with micro and nano fillers
are studied The experimental study is based on cone calorimeter
analysis and thermo-mechanical analysis and on the study of kinetic
parameters by Kissinger and Ozawa methods
Through the cone calorimeter test it has been demonstrated that the
zinc borate resulted as the best additive as it concerns the 30 and
40 percentages Furthermore the flame retardant effect of zinc borate
on the Epoxy resin neat is highlighted when it is synergistically used
with ATH instead as ZS and ZHS are concerned ZHS performs better
at the above mentioned percentages This comes up also by Kissinger
analysis (performed both in nitrogen atmosphere and in air atmosphere)
as ZHS shows two steps in nitrogen atmosphere (so as ATH does) and
epoxy resin neat shows one step In air atmosphere ZHS shows four
steps and epoxy resin neat shows two steps As the Ozawa model is
concerned the union of ZB and ATH improves the activation energy
From the residue analysis we can notice that ZB is the best additive
both regarding the char-formation temperature both regarding the
morphology
Thermo-mechanical analysis shows that all the additives provide an
improvement of the composites thermal expansion coefficient such as it
decreases upon the addition of additives respect to the neat resin
About nanotubes the used percentage is too low to observe any
meaningful effects in all of the analyses undertaken in this study
To conclude zinc borate is in the light of all performed analyses the
best additive the percentages where the effect of the additive can be
sensibly observed are 30 and 40
Chapter 7 Conclusions and future perspectives
133
72 Future Perspectives From our conclusions it is possible to suggest further studies on ZHS
and on its synergistic effect and an investigation on a possible synergy
between the used additives and the nanotubes As for nanotubes they
should be chosen with a higher statistical percolation threshold so to
use a higher additivation percentage
Moreover an interesting topic for future work is the comprehension of
the degradative mechanisms related to additives in terms of their
chemical properties and their interaction with the resin This study can
be carried out by means of FTIR and XRD analysis The study of the
actual mechanisms of degradation during the different heating steps
could lead to a better knowledge of kinetic parameters of the composite
systems
About fibres reinforced resin composites the study of the effects of
different lay-up methods on the thermal properties of the additivated
composites could lead to the improvement of their flame retardant
properties
- 1pdf
- 2cpdf
- 3bpdf
- 4pdf
- 5pdf
- 6pdf
- 7pdf
- 8bpdf
- 9pdf
- 10bpdf
- 11pdf
-
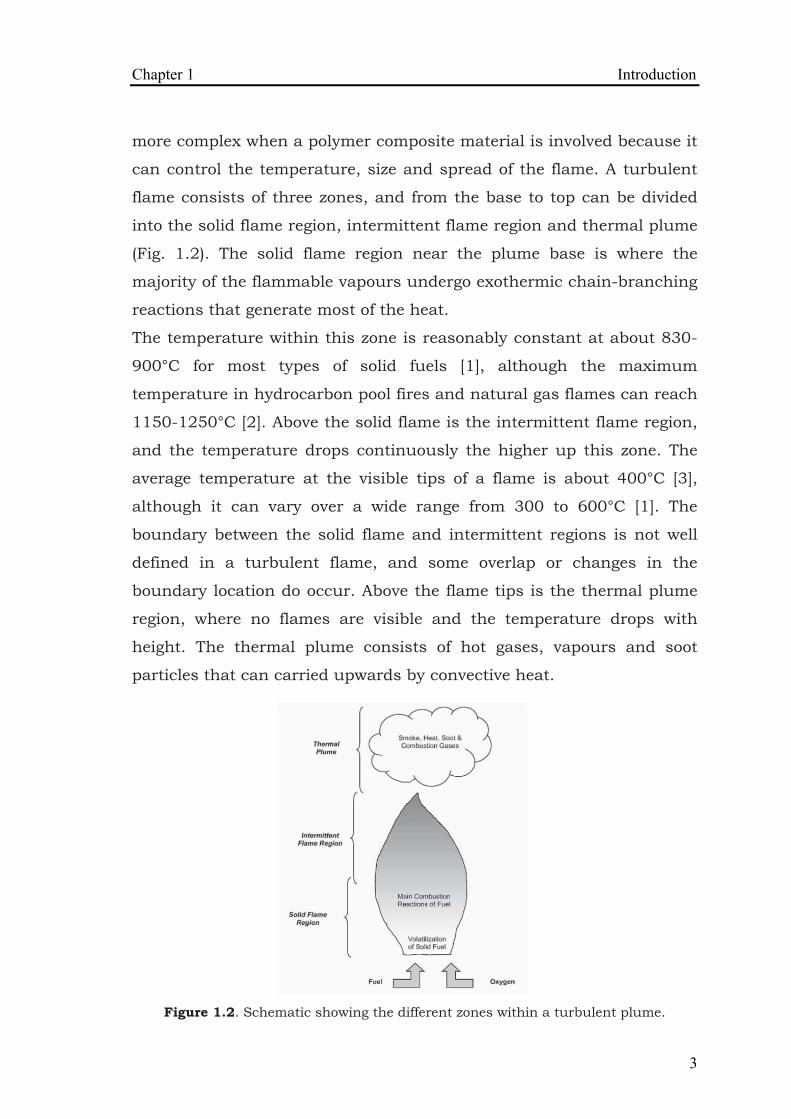
Chapter 1 Introduction
6
The combustion cycle of organic polymers is illustrated in fig 14 and
the cycle stops only when the fuel source has been exhausted which is
usually when the organic components in a composite have been
completely degraded
It is common practice by fire scientists to quantify the intensity of a fire
by the radiant heat flux rather than flame temperature
Figure 14 The combustion cycle of organic polymers
The diverse range of uses for composite materials means they can be
exposed to a variety of fire threats and their increasing use in high fire
risk applications raises the likelihood of severe fire incidents Several
case studies of fires in aircraft and ships are given to demonstrate the
importance of understanding the fire behaviour of composites and the
need for more flame resistant polymeric materials
The fire behaviour of composites materials is distinct by two important
properties Fire reaction and Fire resistant
Fire reaction describes the flammability and combustion properties of
a material from ignition to flashover and also explains the smoke
toxicity of a combustible material The fire reaction properties that
influence fire growth are the heat release rate time to ignition flame
spread rate and oxygen index
Chapter 1 Introduction
7
The heat release rate (HRR) is a quantitative measure of the amount
of thermal energy released by a material per unit area when exposed to
a fire radiating a constant heat flux (or temperature) and his unit is
kWm2 The heat release rate value of a composite material is
determined by the thermal energy liberated in several thermo-chemical
decomposition processes with the most important being exothermic
combustion at the compositeflame boundary of flammable gas
products released by the decomposing polymer matrix and (if present)
organic fibres Two parameters describe the heat release rate average
HRR and peak HRR The average heat release rate is the averaged
value over a certain period of time (usually three or five minutes) The
peak heat release rate is the maximum amount of heat liberated by a
material during the combustion process and it often occurs over a very
short period of time (less than a few seconds) The peak heat release
rate is considered a critical property controlling the maximum
temperature and flame spread rate
Time to ignition (TTI) is the period that a combustible material can
withstand exposure to a constant radiant heat flux before igniting and
undergoing sustained flaming combustion
Flame spread rate describes the speed at which the flame front will
travel over the surface of a combustible material The flame spread rate
is an experimentally measured value and various experimental
techniques with important differences in test configuration are used
Some tests are used to measure the rate of flame spread in a downward
direction while other techniques measure it in a vertical or inclined
direction Consequently the value for flame spread rate is test-
dependent Oxygen index is defined as the minimum oxygen content in
the fire environment required to sustain flaming combustion of a
material Materials with high oxygen index values should be used in
high fire risk applications particularly for internal structures and
components because they offer the potential to self-extinguish when
the fire becomes deprived of oxygen
Chapter 1 Introduction
8
Two other important fire reaction properties are smoke density and gas
toxicity because they have a major impact on the ability of humans to
survive a fire Smoke density is defined and measured in several ways
but basically it is the concentration of smoke particles (eg soot water
vapour) within the plume of a fire Gas toxicity is a generic term that
describes the concentration and lethality of gas products within the
smoke plume
While many fire reaction properties are important in the development of
fire up to the point of flashover the fire resistant properties are critical
when the fire has fully developed
Fire resistance defines the ability of a material or structure to impede
the spread of fire and retain mechanical integrity In other words fire
resistance describes the ability of a construction to prevent a fire from
spreading from one room to neighbouring rooms Fire resistance also
describes the ability of a construction to retain structural integrity (ie
shape load-bearing properties) in a fire The main fire resistant
properties are heat insulation burn-through resistance and structural
integrity Heat insulation is simply the resistive property that describes
the rate of heat conduction through a material when exposed to fire
Obviously materials that are good heat insulators are best suited for
slowing the spread of fire from room-to-room and this is one of the
attributes of composites compared to metals Burn-through resistance
is the time taken for a flame to penetrate a material and emerge from
the opposing side Composites generally have better burn-through
resistance than metals that melt at temperatures below the flame
temperature such as aluminium alloys Mechanical integrity is
another important fire resistant property and this defines the ability of
a material or structure to retain mechanical properties such as
stiffness creep resistance and strength when exposed to fire and after
the fire has been extinguished The behaviour of composites materials
in fire is based by chemical and thermal decomposition of the matrix
used In figure 15 is showed the decomposition process of polymer
Chapter 1 Introduction
9
composites exposed to a heat flux radiated from a fire When the
material is exposed to a fire the matrix decomposes to volatile gases
solid carbonaceous char and smoke The volatiles consist of a variety of
vapours and gases both flammable as carbon monoxide methane low
molecular organics and non flammable as carbon dioxide and water
The flammable volatiles extend from composites material into the flame
zone where they react with oxygen and lead to the formation of the final
combustion products accompanied by the liberation of heat
Figure 15 The decomposition mechanisms of composites materials
Several analytical technique can be used to characterise the
decomposition reactions and the chemical nature of the reaction
volatiles of polymers The three important technique are TGA in which
the weight loss is measured with increasing temperature or time
differential scanning calorimetry (DSC) in which heat absorption or
evolution due to chemical changes of the polymer are measured and
gas chromatographymass spectrometry (GCMS) in which the
chemical composition of the volatile gases are determined Other
methods may also be used including thermal volatilisation analysis
(TVA) and differential thermal analysis (DTA) It is often necessary to
use a combination of methods to obtain a complete understanding of
the decomposition reaction rate reaction mechanisms volatile gases
and char yield
Chapter 1 Introduction
10
12 Fire test for composites materials
A large quantity of information is available on the fire reaction
properties of polymer composites and the level of fire hazard associated
with their use is known for a large number of materials We also have a
good understanding of the chemical thermal and physical mechanisms
that control reaction properties such as time-to-ignition heat release
rate flame spread rate smoke production and toxicity
In short we have quite a good quantitative understanding of the fire
reaction behavior of composites Unfortunately less is known about the
fire resisting properties such as burn-through resistance dimensional
stability and structural integrity especially when the structure is under
load Moreover it is not usually possible to estimate the fire resistive
behavior based solely on the known fire reaction properties A
composite that has good fire reaction properties such as low heat
release rate and smoke yield may not necessarily have good fire
resistive properties Composites with a polymer matrix having high
thermal stability decomposition temperature and char yield may not
necessarily have better fire resistive properties than more flammable
materials
The first fire test was developed in the early twentieth century and over
the last one hundred years a large number of tests have been used to
characterise the fire properties of combustible materials The number of
tests available to characterise fire reaction is now immense For
example the American Society for Testing and Materials (ASTM) have
over 80 fire test standards in the 1999 edition of their handbooks on
testing standards The standards are applicable to a wide range of
materials including building products woods plastics and other
combustible materials None of the ASTM fire standards are specific to
polymer composites but are instead generic to a wide range of
materials The ASTM is one of many international standardisation
organisations that publish fire test methods Not all of the tests of
Chapter 1 Introduction
11
course are relevant for testing composites many tests are only suitable
for evaluating building materials woods or some other type of
combustible material Only a relatively small number of tests are
suitable for determining the fire properties of composite materials or
structures
Experimental techniques used to measure the fire properties of
composites range in size from bench-top apparatus for testing small
specimens weighing only a few grams up to full-scale tests for large
structures
Regardless of scale it is important that fire reaction tests are performed
in conditions that closely replicate the type of fire to which the
composite will be exposed These fires range in heat flux from low
intensity fires were the radiant heat flux is under 20 kWm2 to intense
fires were the heat flux can exceed 150 kWm2
The range of test methods for determining the fire reaction and fire
resistive properties of composites is clearly very diverse although some
attempts are now being made to rationalize this situation The tests
vary in scale and complexity and considerable care must be exercised
when selecting the most appropriate procedure Most fire reaction
testing is performed using bench-scale apparatus because of the lower
cost and greater simplicity Test methods such as the cone calorimeter
OSU calorimeter and radiant flame spread technique have an excellent
track record and are widely used for determining the fire behaviour of
composites However the problem of scaling-up from small-scale test
results to fire performance of large structures in real fires is a major
difficulty
Problems common to bench-scale tests are that the ignition heating
and atmospheric (oxygen content) conditions are not representative of
an actual fire The growth and spread of fire cannot be accurately
replicated using these tests and it is usually not possible to achieve
flashover Further the specimens are rarely tested in the end-use
condition
Chapter 1 Introduction
12
Large-scale fire tests such as the room calorimeter avoid many of the
problems associated with small size and allow the composite article to
be tested in the end-use condition However large fire tests are
generally slow and expensive to perform and may only produce data
relevant to one particular situation [4]
It is also important to recognise that no single test method is adequate
to evaluate all the fire properties of a composite Table 11 lists the
properties that can be determined using the test methods Of these it is
those methods capable of determining the heat release rate that are
most important when characterising the fire reaction of composites
While a few methods have the capability to determine the heat release
rate together with several other properties it is necessary to use two or
more methods to obtain a complete understanding of the fire behaviour
of a composite material
Table 11 The decomposition Fire reaction properties measured using test methods
Chapter 1 Introduction
13
References [1] HIngason Two dimensional rack storage fires Proceedings of the
Fourth International Symposium on Fire Safety Science 19941209-
1220
[2] KS Mudan and PA Croce Fire hazard calculations for large open
hydrocarbon fires in SFPE Handbook of Fire Protection Engineering
ed PJ DiNenno et al 1995 2-13
[3] H Inganson and J de Ris Flame heat transfer in storage
geometries Journal of Fire Safety 1997
[4] Mouritz AP Gibson AG Fire Properties of Polymer Composite
Materials Springer
CHAPTER 2 MATERIALS
21 Thermosetting resin RTM6 Epoxy resins are used worldwide on a large scale for adhesive
lamination coating casting applications and contain a very large
number of chemical types All such resins rely on the reactivity of the
three member epoxy group at both ends of the molecule Other more
complex types of epoxy resins are employed when a higher level of
functionality is needed ie when a grater number of cross-linking points
per epoxy group (fig21) is required as for instance in some of the
higher performance resins used in aerospace Traditionally epoxy
resins are cured by reacting them with amines or anhydrides these
materials being known as ldquohardenersrdquo There are also catalysts that will
polymerise the resin via the end groups and hydroxyls without the need
for a hardener
Figure 21 Epoxy group
Many epoxy resins and hardeners are viscous or even solid at room
temperature and may require preheating or dilution to lower their
viscosity prior to processing into composites Further heating
sometimes to temperatures up to 150-180degC is often needed to promote
resin gelation and curing Nevertheless epoxies are used in all the
traditional composite processes including wet laminating resin
transfer moulding and filament winding Decomposition of most epoxies
occurs via random chain scission reactions over the temperature range
of about 380 to 450degC
Chapter 2 Materials
15
HexFlowreg RTM6 provided by Hexcel is a premixed monocomponent
epoxy resin system specially developed to fulfil the requirements of the
aerospace and space industry in advanced resin transfer moulding
processes (RTM) The expected service temperatures of final products
range from -60degC to 180degC At room temperature RTM6 is a transluced
paste and its viscosity drops very quickly upon heating The uncured
resin has a density of 1117 gcm3 and the fully cured resin 1141
gcm3 When fully cured it exhibits high glass transition temperatures
excellent hot wet properties and low moisture absorption According to
the manufacturer the shelf life of this resin at 23degC is at least 15 days
whereas at -18degC it is approximately 9 months [1]
The main advantage of this epoxy resin called RTM6 is that it is a
monocomponent system and is already degassed and its properties are
reported in table 21
Epoxy resin RTM6
Tg0 -11degC
Tginfin 190degC
Density uncured resin (gcm3) 111 at 25degC
Density cured resin (gcm3) 114 at 25degC
Table 21Properties of monocomponent epoxy resin
In figures 22 and 23 are reported the molecule from which RTM6
derives carbon glycidyl diamino-diphenyl-methane (TGDMM) and the
molecule-diamino-diphenyl sulfone (DDS) as agent crosslinker
Chapter 2 Materials
16
Figure 22 Formula of structure of TGDDM
Figure 23 Formula of structure of DDS
211 Characterization of RTM6
To define the parameters of resin process a preliminary screening by a
kinetic analysis by differential scanning calorimeter (DSC) is necessary
to understand the mechanisms with which the molecules inside the
composites are organized depending on the temperature variations In
figure 24 and 25 the kinetic analysis dynamical and isothermal of
epoxy resin RTM6 neat are reported
Chapter 2 Materials
17
-05
0
05
1
15
2
25
-100 0 100 200 300 400
10degCmin75degCmin5degCmin25degCmin1degCmin
Hea
t flo
w W
g
TemperaturedegC
Figure 24 Dynamic analysis of RTM6 neat
-01
0
01
02
03
04
05
06
07
0 50 100 150 200 250 300 350 400
120degC140degC160degC180degC190degC200degC
Hea
t flo
w W
g
Time min
Figure 25 Dynamic analysis of RTM6 neat
The dynamical analysis (fig24) show that the reticulation peak has a
maximum at the temperature 241degC and a energy amounted to 470Jg
From the data of the isotherm analysis (fig25) it is clear that curing for
90 minutes at 160degC results in a cross-linking of molecules equal to
Chapter 2 Materials
18
83 In addition to obtain a complete cross-linking there should be a
next step of treatment at a temperature greater than 160degC but that
does not exceed the value of glass transition temperature of 196degC
The choice of temperature for the second step of treatment was 180degC
because the isothermal measure carried out this value of temperature is
slow enough to allow the molecules to rearrange within the matrix
partially cured before completing the reaction
22 Micro materials Introduction on flame retardants Flame retardation is a process by which the normal degradation or
combustion of polymers is altered by addition of certain chemicals
Some plastics are inherently fire retardant or smoke retardant and their
fire performance is acceptable for certain applications However [2] for
many plastic materials it is necessary to improve their fire performance
by incorporating flame retardants
Flame retardants are chemical agents which are added to combustible
materials to make them more resistant to ignition and they are intended
to minimise the risk of a fire starting in case the contact with a small
heat source Hence the term ldquoflame retardantsrdquo describe a function and
not a chemical class and their aim is to break the cycle of self-
combustion of polymeric materials reducing the speed of chemical and
physical process that develop Often they are applied in combinations
and this variety of products is necessary because the materials are very
different in nature and composition
Flame retardants interfere with combustion processes during a
particular stage of this process during heating decomposition ignition
or flame spread and the amount of flame retardant one has to add to
achieve the desired level of fire safety can range from less than one
percent for highly effective flame retardants up to more than 50 percent
for inorganic fillers but typical ranges are 5 to 20 percent by weight
Chapter 2 Materials
19
Flame retardants acting by chemical and physical actions which are
divided into
bull Chemical action
1 Reaction in the gas phase The radical gas phase
combustion process is interrupted by flame retardant
resulting in cooling of the system reducing and eventually
suppressing the supply of flammable gases
2 Reaction in the solid phase (fig26) The flame retardant
builds up a char layer and shields the materials against
oxygen and provides a barrier against the heat source
(flame)
Figure 26 Reaction in the solid phase
bull Physical action (fig27)
1 Cooling Energy absorbing (endothermic) processes
triggered by additives and the chemical release of water cool
the substrate of material to a temperature below that
required for sustaining the combustion process
2 Formation of a protective layer (coating) The material is
protected with a solid or gaseous protective layer and
protected from heat and oxygen necessary for the
combustion process
3 Dilution Inert substances and additives evolving non-
combustible gases dilute the fuel in the solid and gaseous
phases
Chapter 2 Materials
20
Figure 27 Physical action of flame retardant
Flame retardants can be placed into the polymer material or by reacting
chemically with the polymer (reactive mode) or by mixing (additive
mode) or in both modes The choice of a flame retardant must be based
on the knowledge its toxicity action and its impact on environment The
main categories of flame retardants are based on compounds containing
(fig 28)
1 Halogens (Bromine and Chlorine)
2 Phosphorus
3 Nitrogen
4 Inorganic compounds Minerals (based on aluminium and
magnesium)
5 Borates and Stannates
6 Intumescent systems
Figure 28 Classes of flame retardant
Chapter 2 Materials
21
Flame retardants work in a number of different ways in fact some flame
retardant are effective on their own but other are used mainly as
ldquosynergistsrdquo acting to increase the effect of other types of flame
retardants Almost all flame retardants generate a stable carbonaceous
barrier called ldquocharrdquo which protects and at the same time cools the
surface of the material
Halogenated flame retardants when exposed to high temperatures
release bromine (Br) or chlorine (Cl) as free radicals (Br- or Cl- ) which
react with hydrocarbon molecules (flammable gases) to give HBr or HCl
These then react with the high-energy H+ and OH- radicals to give water
and the much lower energy Br- or Cl- radicals which are then available
to begin a new cycle of H+ and OH- radical removal They act by
effectively removing the H+ and OH- radicals in the gas flame phase thus
reducing heat generation and so the production of further gaseous
flammable materials
Phosphorus-containing flame retardants when heated reacts to give
a polymeric form of phosphoric acid This acid crates a glass layer (char)
on the surface of the material and inhibits the pyrolysis process which
is necessary to feed flames Char plays an important role in fact it acts
as a two-way barrier that both prevents the passage of the combustible
gases and shields the polymer from the heat of the flame
A wide range of different phosphorus based flame retardants is
available including elemental red phosphorus which is oxidised to
phosphoric acid with heat ammonium polyphosphate melamine
polyphosphate phosphonates phosphinates and phosphate esters
Nitrogen-containing flame retardant (pure melamine and derivates)
are believed to act by several mechanisms In fact in the condensed
phase melamine is transformed into cross-linked structures which
promotes char formation releasing ammonia In conjunction with
phosphorus the nitrogen appears to enhance the attachment of the
phosphorus to the polymer A mechanism in the gas phase may be the
Chapter 2 Materials
22
release of molecular nitrogen which dilutes the volatile polymer
decomposition products
Antimony trioxide does not have flame retarding properties of its own
but is an effective synergist for halogenated flame retardants It acts as
a catalyst facilitating the breakdown of halogenated flame retardants
into active molecules It also reacts with the halogens to produce
volatile antimony halogen compounds which are themselves directly
effective in removing the high energy H+ and OH- radicals which feed
the flame phase of the fire thus reinforcing the flame suppressing effect
of the halogenated flame retardants When added to PVC antimony
trioxide acts to suppress flames by activating the chlorine present in the
plastic itself
Inorganic compounds are used as flame retardants interfering through
various physical processes with the burning process release of water or
non-flammable gases which dilute the gases feeding flames absorption
of heat energy thus cooling the fire production of a non-flammable and
resistant layer on the surface of material (char) These mechanisms of
inorganic compounds are however of a relatively low efficiency and the
products have to often be used in large concentrations or more usually
in combination with other types of flame retardants
Boron containing compounds act through the stepwise release of
water and the formation of a glassy coating protecting the surface Zinc
borate in halogen-free systems is normally used in conjunction with
aluminium trihydrate magnesium hydroxide or red phosphorus Zinc
stannate and zinc hydroxystannate are used to reduce smoke emission
from PVC to promote charring or as synergists to increase the
effectiveness of halogenated or nitrogen flame retardants
Finally intumescent coatings are fire protection systems which are
used to protect materials such as wood or plastic from fire but also to
protect steel and other materials from the high temperatures of fire The
coatings are made of a combination of products applied to the surface
Chapter 2 Materials
23
like a paint which are designed to expand to form an insulating and
fire-resistant covering when subject to heat
221 Zinc Borate
Zinc borate ZB (2ZnO 3B2O3 35H2O) is a multifunctional flame
retardant which can function as a flame retardant in synergy with
halogen smoke suppressant because promote char formation and
afterglow suppressant It is a synergist of chlorine and bromine-
containing flame retardants or polymers Its efficacy depends on the
type of halogen source (aliphatic versus aromatic) and the base polymer
used The zinc borate can generally display synergistic effects with
antimony oxide in fire retardancy This synergy [3] can be more
remarkable when used in conjunction with aluminium trihydrate (ATH)
or magnesium hydroxide (MDH)
Zinc borate decomposition has been studied by thermogravimetric
analyses TGA reported in figure 29 and its decomposition temperature
is about 436degC
Figure 29 TGA and DTG in nitrogen of zinc borate
Zinc borate works as an antitracking agent in both halogen-containing
and halogen-free polymers in different ways
In halogen-containing polymers
Chapter 2 Materials
24
bull Zinc borate possesses a synergistic effect with halogen sources
bull Zinc borate display synergistic effects with antimony oxide in fire
retardancy In the presence of ATH or MDH this synergy can be
augmented significantly
bull In some polymer systems zinc borate can completely replace
antimony oxide
bull In contrast to antimony oxide zinc borate is predominant in the
condensed phase and can work as a smoke suppressant
bull Zinc borate promotes char formation and prevents burning drips
The zinc oxide moiety can promote char formation with halogen
sources and B2O3 moiety can stabilize the char
bull Zinc borate can improve the thermal stability of polyamides
containing halogenantimony trioxide and improve the aged
elongation property of polyolefin
bull Improves corrosion resistance
In halogen-free polymers
bull Zinc borate are multifunctional fire retardants in halogen-free
polymers
bull When used in combination with metal hydroxides zinc borate can
work as a sintering aid to promote the formation of a strong
charceramic residue that can act as an insulator for underlying
polymer
bull Zinc borate can reduce the heat release rate smoke evolution
carbon monoxide generation and afterglow combustion
bull The use of a co-additive such as the siliconesilica melamine
polyphosphate talc or red phosphorous can increase the fire test
performance of zinc boratemetal hydroxide combination
bull Zinc borate alone can work as a flame retardant in certain
halogen-free systems
Chapter 2 Materials
25
Zinc borate used is produced by Joseph Storey amp Company LTD and its
name is Storflam ZB 2335 and its physical and chemical properties are
reported in table 22 [4]
Zinc Borate ZB
Appearance Power dust
Colour White
Molecular weight 43464
Bulk density (Kgm3) 400-700
Soluble in Acids and Bases
Solubility value (g100g
H2O20degC)
lt1
pH 7-8 (aqueous filtrate of 20
suspension)
Table 22Physical and chemical properties of zinc borate
222 Aluminium trihydrate
Aluminium trihydrate ATH (2Al(OH)3) is the most widely used flame
retardant It is an inert mineral filler a non-toxic white crystalline
powder and is included in the inorganic flame retardants It acts with
all three of mechanisms indicated in the figure 210 At around 300degC
(fig211) it is decomposed to aluminium oxide which forms a
protective non-flammable layer on the material surface and water
Chapter 2 Materials
26
Figure 210 Mechanism of Aluminium trihydrate ATH
Figure 211 TGA and DTG in nitrogen of aluminium trihydrate
Water forms a layer of non-flammable gas near the materialrsquos surface
inhibiting flames The reaction is endothermic it absorbs heat thus
cooling the material and slowing burning The water vapour produced
during ATH decomposition dilutes both the combustible gases and
oxygen in the vicinity of the flame making combustion more difficult
For smoke suppression the heat dissipation by the ATH is thought to
Chapter 2 Materials
27
aid in forming char rather than forming smoke by favouring
crosslinking reactions over soot formation The char provides a fuel-
oxygen barrier on the surface of the burning polymer
Aluminium trihydrate used in this work is produced by Dadco and
provided by Joseph Storey amp Company LTD [4] and its physical and
chemical properties are reported in table 23
Aluminium trihydrate ATH
LOI (110degC-1100degC) () 346
Specific gravity (gcm3) 24
Whiteness () gt 91
Bulk density (Kgm3) 500-700
Medium grain size diameter (μm) 40-75
Boiling point (degC) 2700 (Al2O3 decomposition
product)
Density at 20degC (gml) 242
Table 23Physical and chemical properties of aluminium trihydrate
223 Zinc Hydroxystannate
Zinc hydroxystannate ZHS (ZnSn(OH)6) is a fire retardant and a smoke
suppressant additive for polymeric materials [5] It was developed as a
smoke suppressant for PVC but later it was found that it also acts as a
flame retardant in certain plastics mainly by promoting char formation
and can usually partly substitute antimony trioxide Recent studies to
develop flame retardants formation have used inorganic tin compounds
such as zinc hydroxystannate because it is less toxic [2] The physical
and chemical properties of ZHS are reported in table 24 and it is
provided by Joseph Storey amp Company LTD [4] and its decomposition
temperature (225degC) is reported in figure 212
Chapter 2 Materials
28
Zinc Hydroxystannate
Physical state Power
Colour White
Bulk density (Kgm3) 400-500
Soluble in Strong Acids and Bases
Solubility in water ( in weight) 0003
pH 7
Table 24Physical and chemical properties of zinc hydroxystannate
Figure 212 TGA and DTG in nitrogen of zinc hydroxystannate
224 Zinc Stannate
Zinc stannate ZS (ZnSnO3) has excellent flame retardant and smoke
suppressant properties and its advantage as zinc hydroxystannate is
that it is less toxic than antimony compounds In fact ZS and ZHS are
used instead of antimony trioxide because they are less toxic [6] Zinc
stannate as zinc hydroxystannate is provided by Joseph Storey amp
Company LTD [4] and its properties are listed in table 25 and in figure
213
Chapter 2 Materials
29
Zinc Stannate
Appearance Power dust
Colour White
Bulk density (Kgm3) 400-500
Soluble in Strong Acids and Bases
Solubility value (g100g
H2O20degC) 0003
pH 7
Molecular weight 23207
Table 25Physical and chemical properties of zinc stannate
Figure 213 TGA in nitrogen of zinc hydroxystannate
Zinc hydroxystannate shows several degradation steps and different
decomposition temperatures hence its DTG is not reported
23 Nano materials Introduction on carbon nanotubes
The discovery of carbon nanotubes can be traced back to the origin of
fullerene chemistry (buckyball C60) in 1985 [7] Fullerenes have
provided an exciting new insight into carbon nanostructures built from
sp2 carbon units based on geometric architectures In 1991 Iijima [8]
Chapter 2 Materials
30
discovered carbon nanotubes (CNTs) that are elongated fullerenes where
the walls of the tubes are hexagonal carbon and often capped at each
end The nanotube is typically closed at each end by hemispherical caps
that are constituted by at least 12 pentagons According to the Euler
theorem [9] which relates the number of vertices edges and faces a
convex structure can be created by introducing a positive curvature
and therefore pentagons to close up the hexagonal lattice of the tube
(fig214)
Figure 214 Schematic of the nanotube formation
Due to the hexagonal symmetry of the carbon atoms in the graphitic
sheet different structural isomers are possible depending on how the
planar graphite sheet is folded The rolling up can be accomplished in
several different ways requiring only the matching of the dangling bonds
at each end However the nanotubes can present a different helicity
degree with respect to the tube axis Figure 215 shows the three
different possible nanotubes armchair zig zag and chiral
Figure 215 Schematic of the three different nanotubes structure
Chapter 2 Materials
31
The characteristic of helicity in nanotubes has a great relevance
affecting the physical properties that depend also on the tube diameter
[10] For example it has been shown that all the armchair tubes are
metallic whereas the zig zag and chiral tubes are either metallic or
semiconducting
The nanotubes can exist in two forms multi-walled and single-layer
(fig216) The multi-wall carbon nanotubes were the first to be
discovered They consist of concentric cylinders placed around a
common central hollow area with a constant separation between the
layers close to the graphite interlayer spacing (034 nm) Each
individual cylinder can be characterized by a different helicity and has
diameter ranging from 2 to 25 nm and length of several microns
Figure 216 Single walled and multi walled carbon nanotubes
The single walled nanotubes were synthesized in 1993 when it was
found that the addition of metals such as cobalt to the graphite
electrodes in the arc evaporation method resulted in tubes with single
layer walls [11] A single walled nanotube is close to an ideal fullerene
fiber and consists of a single layer cylinder extending from end to end
with a narrow distribution in diameter range (1-2 nm) When produced
in vapour phase the single wall nanotube can self-assemble into larger
bundles called ropes consisting of several tens of nanotubes arranged
in a one-dimensional triangular lattice It is important to observe that
the discovery of single wall tubes has been very significant allowing
Chapter 2 Materials
32
researchers to verify and test some of the theoretical predictions about
the nanotube properties
Due to the combination of size structure and topology the nanotubes
display remarkable features In particular the graphitic nature of the
nanotube lattice contributes to provide high conductivity high strength
and stiffness chemical specificity and inertness while the lattice
helicity and elasticity provide optimal electronic properties Further the
nanoscale size and the high aspect ratio are advantageous for many
applications that require large surface area to volume ratio However
due to the their very small size and often presence of defects
mechanical property characterization is a challenge Nevertheless it is
possible to imagine that their stiffness and strength are very high if one
uses graphite as reference The in-plane elastic modulus of graphite is
estimated to be 106 TPa (1061012 Pa) and the tensile stiffness as 08
TPa due to the very strong covalent C-C bonds in the plane [10]
The elastic properties evaluation of carbon nanotube has been
performed by
bull measuring their thermal vibration amplitudes
bull atomic force microscopy measurement during bending
The first technique provided the Youngrsquos modulus equal to 18 TPa
while a modulus close to 1 TPa has been determined by the second
method Further the maximum tensile strength has been determined
close to 30 GPa (30109Pa) [8] Many other observations have shown
that carbon nanotubes have other intriguing properties such as
bull high flexibility related to the ability of the carbon atoms to
rehybridize with the degree of rehybridization depending on the
strain
bull high capability to sustain strain in tension (40) without
brittleness plastic deformation or bond rupture
These features make the carbon nanotubes ideal candidates for
reinforcing fibers in polymer-based composites In particular due to
Chapter 2 Materials
33
their ability to sustain high deformations they have a significant
advantage over carbon fibers in composites for structural and strength
applications However the effective reinforcement action due to the
nanotubes hinges on the success of the preparation techniques and
stable dispersion of the nanotubes in the polymer matrix In most
cases since the nanotubes have many entanglements it is a challenge
and an unresolved issue to disperse them effectively with polymer
systems to make strong and stiff components
Carbon nanotubes have extraordinary properties that have attracted the
attention of several researchers from diverse fields Substantial effort
has been devoted to the experimental evaluation and theoretical
calculation of their physical electronic magnetic electrical and
mechanical properties
Because of their promising physical and mechanical properties the
most common commercial application of carbon nanotubes is based on
their use as filler elements for metals ceramic or polymers matrix In
particular carbon nanotubes may exhibit characteristics that can be
beneficial For example they can be used as
bull reinforcement of polymer based composite materials which
improve structural properties
bull polymer modifiers for high temperature uses
bull conductive filler in insulating polymer matrices to provide
electrostatic discharge and electromagnetic-radio frequency
interference protection
bull doping of conjugated luminescent polymers to produce active
materials for electronic applications
The use of carbon nanotubes as reinforcing systems of polymer matrix
would offer several advantages over the conventional reinforcements
including continuous and short fibers (glass carbon) In the case of
continuous fibers reinforcements the advanced composite material has
much higher mechanical properties in the direction parallel to the fibers
Chapter 2 Materials
34
or in the plane of the lamina than in the transverse direction
Furthermore since the conventional polymer processing equipment
cannot process the long continuous fibers their use is limited to simple
shapes and limited production On the other hand itrsquos established that
the fiber aspect ratio represents the critical factor affecting the resulting
structural properties of short fiber composites As the aspect ratio
increases the composite stiffness and strength increase However the
packing of short fibers in a polymer matrix is a percolation
phenomenon so the maximum packing decreases with increasing
aspect ratio (see figure 16) and may not be sufficient to manufacture a
very strong material [12]
Dispersion process of carbon nanotubes represents a very complex
phenomenon due to their natural tendency to bundle together due to
van der Walls interactions A non uniform dispersion can lead to many
defect sites and reach resin area limiting not only the efficiency of CNTs
as reinforcement filler for the polymer composite matrix [13-18] A good
dispersion and possibly the alignment of CNTs within a matrix is still a
challenge and it could play the main factor driving the diffusion of CNT
or MWCNT as nano-reinforcement on industrial scale [1718] in fact are
used several dispersion technique to separate the agglomerates into
individual nanotubes
Carbon nanotubes are another candidate as a FR additive because of
their highly elongated shape (high aspect ratio) The in situ formation of
a continuous network structured protective layer from the tubes is
critical for significant reduction in heat release rate because the layer
thus acts as a thermal shield from energy feedback from the flame [19]
231 Multi walled carbon nanotubes Nanocyl 7000
The multi walled carbon nanotubes used in this word are provided by
Nanocyl SA (Belgium) and are denominated Nanocyl 7000 This multi
walled carbon nanotubes are produced via the catalytic carbon vapour
deposition (ccvd) process Nanotubes exit the reactor with a purity of
Chapter 2 Materials
35
90 carbon to produce the 7000 grade [20] Its properties are reported
in table 26
Multi-walled carbon nanotubes (MWNTs)
Average diameter 10 nm
Length 01-10 μm
Carbon Purity 90
Table 26Properties of MWNT
Chapter 2 Materials
36
References [1] wwwhexcelcomHexFlowRTM6pdf
[2] Petsom A Roengsumran S Ariyaphattanakul A Sangvanich P
Polym Degrad Stab 2003(80)17-22
[3] Shen KK Kochesfahani S Jouffret F PolymAdvTechnol 2008
(19)469-474
[4] Data sheet provided by Joseph Storey amp Company LTD
[5] Hornsby PR Cusack PA Cross M Toth A Zelei B Marosi G
Journal of materials science 2003 (38)2893-2899
[6] Cusack PA Heer MS Monk AW Polymer Degradation and Stability
1997 (58)229-237
[7] Kroto HW Heath JR OrsquoBrien SC Curl RF Smalley RE Nature
1985 318 162
[8] Iijima S Nature 1991 354 56
[9] Ebbesen WT Physics Today 1996 26-32
[10] Ajayan PM Chem Rev 1999 (99)1787-1799
[11] Ebbesen WTCRC 1997
[12] Calvert P Nature 1999 (399)210-211
[13] Qian D Dickey EC Andrews R Rantell T Appl Phys Lett 2000
76 (20)2868-2870
[14] Park C et al Chemical Physical Letters 2002 (364)303-308
[15] Ham HT Choi YS Chung JI Journal of Col and Inter Science
2005 286 (1)216-223
[16] Salvetat JP Briggs AD Bonard JM Bacsa RR Kulik AJ Stockli
T Burnham NA Forroacute L Phys Rev Lett 1999 82 (5)944-947
[17] Jin L Bower C Zhou O Appl Phys Lett 1998 73 (9)1197-1199
[18] Choi ES Brooks JS Eaton DL Al-Haik MS Hussaini MY
Garmestani H Li D Dahmen KJ Appl Phys 2003 (94)5451-5473
[19] Kashiwagi T Du F Winey KI Groth KM Shields JR Bellayer
SP Kim H Douglas JF Polymer 2005 (46)471-481
[20] Data sheet provided by Nanocyl SA
CHAPTER 3 EXPERIMENTAL TECHNIQUES
31 Methods 311 Micro particles Mechanical stirring
The flame retardant composites were prepared by mixing the epoxy
resin RTM6 with zinc borate aluminium trihydrate zinc stannate and
zinc hydroxystannate at different percentage (5 wt 10 wt 20 wt
30 wt 40 wt) The mixing was made by using a Heidolph RZR
mechanical stirring equipment (fig 31) The additives were included
into the matrix at 400 rpm to avoid disperse the additive on the walls of
beaker [1]
Figure 31 Heidolph RZR mechanical stirring
Afterwards the mixing was continued for 10 minutes at 1050 rpm and
10 minutes at 2000 rpm and then the mixture were degassed for 30
minutes at 90degC in a vacuum oven to eliminate entrapped air and
humidity Finally the liquid system was poured in mould and cured at
160degC and 180degC respectively for 90 mins and 120 mins according to
the curing schedule sheet of the neat epoxy resin
Chapter 3 Experimental Techniques
38
The quality of dispersion of all additives into the epoxy resin after the
mixing process was observed by Scanning Electron Microscope (1450VP
LEO)
For example the SEM micrograph of zinc borate 20 wt is reported
where the dust of zinc borate (fig 32) is well dispersed into the epoxy
matrix and it maintains its original grain size Analogous behaviour is
noticed for the aluminium trihydrate zinc stannate and zinc
hydroxystannate (fig 33)
Figure 32 Scanning electron micrograph of zinc borate dust
Figure 33 Scanning electron micrograph of the composite of RTM6 and ZB 20wt
312 Nano particles Sonication
The nanocomposites were prepared by using sonication process (fig
34) for a constant time (1 hour) at temperature of 120degC with the
Chapter 3 Experimental Techniques
39
MWNTs content of 01 fraction by weight We selected this process
and this percentage of carbon nanotubes by previous studies and
experimental analysis that we conducted [2] All the obtained samples
were then degassed in vacuum oven at 90degC for 30 min and then cured
considering an identical temperature cycle (1 h at 160degC followed by 2 h
at 180degC) according to the specified curing schedule
Figure 34 Misonix Sonicator S3000
The SEM micrograph of fracture surface of multi walled carbon
nanotubes into the epoxy resin was obtained by fragile failure of
nitrogen cooled samples and this surface is reported in figure 35 at
different level of magnitude
Figure 35 SEM images of fracture surface of specimen taken at different magnitudes
(1 μm-300 nm)
Chapter 3 Experimental Techniques
40
The nanotubes reported in figure 35 are present and well separated
each other showing a good level of adhesion with the matrix in fact it
appears a satisfactory uniformity of single or agglomerated of nanotube
313 Vacuum infusion process
The vacuum infusion process (VIP) is a technique that uses vacuum
pressure to drive resin into a laminate Materials are laid dry into the
mould and the vacuum is applied before resin is introduced One a
complete vacuum is achieved resin is literally sucked into the laminate
via carefully placed tubing This process is aided by an assortment of
supplies and materials Vacuum infusion provides a number of
improvements over traditionally vacuum bagged parts These benefits
include
bull Better fiber-to-resin ratio
bull Less wasted resin
bull Very consistent resin usage
bull Unlimited set-up time
bull Cleaner
The samples were obtained by a preform of 8 plies of overlaid
unidirectional carbon fibres at zero degrees We chose 20x20cm
samples
Operations to prepare the samples are
1 Cleaning mould with acetone
2 Application of realising agent to make the mould hydrophobic
The realising agent used in this work is LOCTITEreg FREWAX
FREKOTEreg and adheres to the surface of the mould creating a
barrier between materials and mould
3 Application of sealing tape GS AT200Y This tape is softened by
temperature so to enable the perfect adherence of the bag to the
plate while maintaining the vacuum (figs 36a)-b))
Chapter 3 Experimental Techniques
41
Figures 36 Application of sealing tape a) and position of carbon plies b)
4 Application of ldquopeel plyrdquo under and over the carbon fibres plies to
avoid damage to the composite surface in the successive phases
(fig 37) The peel ply used in this work is RELEASE EASE
234TFP and it is provided by Airtech It is also placed on the
aspiration pipe because it allows to keep the vacuum
Figures 37 Application of ldquopeel plyrdquo
5 Application of ldquobreather and bleederrdquo provided by Airtech It is the
AIRWEAVEreg Super and it is useful to ensure the vacuum
distribution When the panels of epoxy resin are micro and nano
additived the breatherbleeder is placed only beside the carbon
Chapter 3 Experimental Techniques
42
fibres plies because it doesnrsquot absorb the additives but it
guarantees the vacuum distribution (fig 38)
Figures 38 Application of ldquobreatherbleederrdquo
6 Application of ldquonetworkrdquo (fig 39) to facilitate the advancement of
the resin flow in the mould
Figures 39 Application of ldquonetworkrdquo
7 Application of a vacuum bag (figs 310a)-b)) that is sealed by
sealing tape
Chapter 3 Experimental Techniques
43
Figures 310 Application of vacuum bag a) and creation of vacuum b)
At the end the vacuum is applied and a compaction of the different
layers is obtained (fig 310b)) and the breather allows the vacuum to
spread throughout the mould
32 Characterization 321 Cone Calorimeter
The cone calorimeter has become one of the most important and widely
used instruments for the research and development of fire retarded
polymeric materials The cone calorimeter is a performance-based
bench scale fire testing apparatus [3-7]
The cone calorimeter provides comprehensive insight into not only fire
risks such as heat release rate total heat release and time to ignition
but also fire hazards such as smoke release and CO production Cone
calorimeter investigations can be used as a universal approach to
ranking and comparing the fire behaviour of materials
However each experimental setup defines a specific fire scenario As is
typical for all fire tests samplesrsquo performance in the cone calorimeter
depends on the specific characteristics of the test including ignition
source ventilation irradiance (external heat flux) temperature and the
geometry of the specimen
Chapter 3 Experimental Techniques
44
The cone calorimeter test characterizes the performance resulting from
an interaction of material properties specimen and the defined fire
scenario
Lower external heat fluxes such as below 20 kWm2 target ignition and
flammability whereas higher external heat flux such as 50 kWm2
target flame spread and combustion properties The relevant and active
mechanisms can change significantly Hence the external heat flux
influences the conclusions implied by the cone calorimeter studies The
frequently used irradiances of 35 kWm2 or even 50 kWm2 deliver
reproducible results for forced flaming conditions with respect to flame
spread and combustion properties (fig 311)
Figure 311 Schematic diagram of the cone calorimeter
The main capability of the instrument is that the heat release response
of a burning material can be measured continuously to a high degree of
accuracy and values for peak and average heat release rate can be
determined The technique can also be used to measure time to ignition
time of sustained flaming effective heat of combustion smoke density
soot yield mass loss rate and yield of CO CO2 and other combustion
Chapter 3 Experimental Techniques
45
gases The only fire reaction property that cannot be directly determined
is the flame spread rate
Specimens tested within the cone calorimeter are flat plates that are
100mm long 100mm wide and up to 50mm thick The specimen is
placed inside a sample holder lined with a low-density refractory
material to minimise heat losses from the unexposed face It is also
necessary to insulate the specimen sides to minimise edge burning
which can give an artificially high heat release rate The sides of
composite specimens should also be sealed and insulated to avoid the
escape of volatile gases from the edges which can also affect the fire
reaction properties During fire testing the mass loss of the specimen is
recorded continuously using a load cell located beneath the sample
holder
The top surface of the specimen is positioned 25mm from the cone
heater (fig312)
Figure 312 Positioning of the sample
A spark igniter may be placed mid-way between the sample and heater
and is used to ignite combustible gases released from the thermally
decomposing material when the concentration reaches the critical level
needed to sustain flaming Most fire tests on composites are performed
Chapter 3 Experimental Techniques
46
using the igniters although it is possible not to use the igniters to study
the effect of auto-ignition on the reaction properties
During fire testing (fig313) a constant flow rate of air at 24 litres per
second is maintained in the heating chamber
This air flow rate is needed to force all the gaseous combustion
products released by the burning specimen up through the orifice of the
cone heater and into the gas exhaust system above the heating
chamber As the entrained air and combustion products enter the
exhaust system they are thoroughly mixed to avoid stratification of the
gases that can cause inaccurate heat release smoke or toxic gas
measurements
Figure 313 Burning of sample
In this work the combustion tests [8] according to ASTM E 1354-04
are carried out with irradiance of 50 kWm2 for samples of a thickness
between 6-8mm and size 100times100mm using the cone calorimeter
produced by Fire Testing Technology Ldt (fig 314)
Chapter 3 Experimental Techniques
47
Figure 314 Cone calorimeter provided by Fire Testing Technology Ldt
The information provided by cone calorimeter are
bull Time to ignition (TTI) which corresponds to the period that a
combustible material can withstand when exposed to a constant
radiant heat flux before igniting and undergoing sustained
flaming combustion
bull Mass lost different between the initial and final mass of the
sample
bull Heat Release Rate peak (pHRR) average (HRR avarage) and Time
To Peak (TTP) are a quantitative measure of the amount of
thermal energy released by a material per unit area when exposed
to a fire radiating at constant heat flux (or temperature)
bull Mean COCO2 Yield the average return of CO and CO2 related to
the mass of the sample
bull Total Heat Evolved (THR)
bull Total Smoke Released (TSR)
322 Scanning Electron Microscope
The Scanning Electron Microscope (SEM) is a microscope that uses
electrons rather than light to form an image (fig 315) The SEM has a
large depth of field which allows a large amount of the sample to be in
focus at one time The SEM also produces images of high resolution
Chapter 3 Experimental Techniques
48
which means that closely spaced features can be examined at a high
magnification The combination of higher magnification larger depth of
focus greater resolution and ease of sample observation makes the
SEM one of the most heavily used instruments in research areas today
The SEM is designed for direct studying of the surfaces of solid objects
By scanning with an electron beam that has been generated and
focused by the operation of the microscope an image is formed in much
the same way as a TV The SEM allows a greater depth of focus than the
optical microscope For this reason the SEM can produce an image that
is a good representation of the three-dimensional sample
The SEM uses electrons instead of light to form an image A beam of
electrons is produced at the top of the microscope by heating of a
metallic filament The electron beam follows a vertical path through the
column of the microscope It makes its way through electromagnetic
lenses which focus and direct the beam down towards the sample Once
it hits the sample other electrons (backscattered or secondary) are
ejected from the sample Detectors collect the secondary or
backscattered electrons and convert them to a signal that is sent to a
viewing screen similar to the one in an ordinary television producing an
image
Figure 315 Scanning Electron Microscope
Chapter 3 Experimental Techniques
49
When a SEM is used the column and sample must always be at
vacuum A vacuum environment means that most of the air molecules
have been removed from the inside of the microscope
Since the SEM uses electrons to produce an image most conventional
SEMs require that the samples be electrically conductive The sputter
coater uses argon gas and a small electric field The sample is placed in
a small chamber which is at vacuum Argon gas is then introduced and
an electric field is used to cause an electron to be removed from the
argon atoms to make the atoms ions with a positive charge The Ar ions
are then attracted to a negatively charged piece of gold foil The Ar ions
act like sand in a sandblaster knocking gold atoms from the surface of
the foil These gold atoms now settle onto the surface of the sample
producing a gold coating
323 Thermo mechanical analysis
Thermo mechanical analysis (TMA) is a well-known technique [9] that
measures linear or volumetric changes as a function of time
temperature and force TMA is the measurement of materials behaviour
expansion and or contraction as a function of an applied load or
temperature A scan of dimensional changes related to time or load
provides invaluable information about the samples mechanical
properties Most analyses are presented in the form of the coefficient of
thermal expansion
dL(dTL0)=CTE (coefficient of thermal expansion)
where dL is the change in length (microm) dT is the change in temperature
(degC) and L0 is the initial length (m) Thermo mechanical analysis were
conducted using a TMA-60WS (fig316) provided by SHIMADZU
We measured the CTE of epoxy resin with additives and panels obtained
by using VIP with a force of 003N from 25degC to 250degC at 3degCmin in
Chapter 3 Experimental Techniques
50
double scan and expansion mode The sample measure 3x3x15mm in
accordance to ASTM E831-06
Figure 316 TMA-60WS
324 Thermal gravimetric analysis
Thermogravimetric analysis (TGA) (fig317) is an analytical technique
used to determine the thermal stability of a material and its fraction of
volatile components by monitoring the weight change that occurs when
a specimen is heated The measurement is normally carried out in air or
in an inert atmosphere and the weight loss is recorded as a function of
increasing temperature
Analysis of the TGA curves and DTG signals reports two temperature
bull The onset temperature (Tonset) calculated from the TGA curves by
extrapolating from the curve at the peak of degradation back to
the initial weight of the polymer
bull The temperature maximum (Tmax) calculated from the DTG curves
by extrapolating from the curve at the peak of degradation
forward to the final weight of the polymer
Chapter 3 Experimental Techniques
51
Figure 317 TGA 2920 TA Instruments
Differential thermal analysis was carried out using a TGA 2950 by TA
Instruments [10] All measurements were conducted under air or inert
atmosphere with a sample weight of about 7-8mg for each test the
heating rate was 5 75 10 and 20degCmin and the test temperature
ranged from 30degC to 800degC
Chapter 3 Experimental Techniques
52
References [1] wwwheidolphit
[2] Formicola C Martone A Zarrelli M Giordano M Dispersion of
carbon nanotubes in a monocomponent epoxy system 2008 proceeding
of AIDC workshop
[3] Schartel B Bartholmai M Knoll Some comments on the use of
cone calorimeter data Polym Degrad Stab 2005 (88)540ndash547
[4] Schartel B Hull TR Development of fire-retarded materials-
Interpretation of cone calorimeter data Fire and materials 2007
(31)327ndash354
[5] Fire Testing Technology Userrsquos Guide for the Cone Calorimeter
February 2000
[6] Grant GB Quick operation procedure for the cone calorimeter Unit
of fire safety engineering Edinburgh University 2nd edition January
1993
[7] Babrauskas V and Grayson SJ Heat Release in Fires Elsevier
Applied Science 1992
[8] Committee E0521 on Smoke Combustion Products ASTM 1354-03
Standard test methods for heat and visible smoke release for materials
and products using an oxygen consumption calorimeter ASTM 10
February 2003
[9] wwwshimadzuit
[10] wwwtainstrumentscom
CHAPTER 4 FLAME RETARDANT OF EPOXY RESIN WITH
INORGANIC COMPOUNDS
41 The state of the art on flame retardant of inorganic
compounds Flame retardants are chemical agents which are added to combustible
materials to make them more resistant to ignition and they are intended
to minimise the risk of a fire starting in case of contact with a small
heat source
Inorganic flame retardant as zinc borate aluminium trihydrate zinc
stannate and zinc hydroxystannate are used in this study because they
have shown very low toxicity they are compatible with a variety of flame
retardants while acting as smoke suppressants for various polymer
systems Synergistic effects are envisaged when these smoke
suppressants are combined with conventional flame retardants andor
nanoclays Recent studies to develop flame retardants formation have
used inorganic compounds because they have less toxicity Bourbigot et
al [1] demonstrated that zinc borates are useful synergistic agents in
Ethylene vinyl acetate EVA and aluminium trihydrate ATH and
magnesium hydroxide Mg(OH)2 formulations and that they act as smoke
suppressant Moreover they demonstrated that zinc borate develops a
vitreous protective residual layer which reduces the combustion rate
Carpentier et al [2] studied the synergistic effect of zinc borate on EVA8
filled with magnesium hydroxide (MH) by LOI cone calorimeter and
TGA Solid-state NMR was employed to study the carbon in the residues
collected after thermal treatment It is suggested that zinc borate slows
the degradation of the polymer and creates a vitreous protective
Chapter 4 Flame retardant of epoxy resin with inorganic compounds
54
residual layer which could act as a physical barrier and a glassy cage
for polyethylene chains
Wu et al [3] studied the synergistic flame retarding effect of ultrafine
zinc borate on LDPEIFR based on LOI UL94 test and cone calorimeter
and established that the flame retardancy is improved when
incorporating zinc borate to LDPEIFR system in fact HRR THR and
mass loss is reduced significantly
Petsom et al [4] described a study on zinc hydroxystannate and zinc
stannate in combination with 12 bis-tribromophenoxy ethane (BTBPE)
to increase flame retardancy and reduce smoke emission in an
acrylonitrile-butadiene-styrene (ABS) copolymer They concluded that
the combination of tin compounds and BTBPE was found more effective
as flame retardant than the individual components when used alone
Cusak et al [5] found that zinc hydroxystannate is a good synergist
alternative to antimony trioxide particularly with regard to reducing
heat release rates and smoke generation They demonstrated that ZHS
is the best alternative synergist to Sb2O3 in halogen-containing
polyester resins
Ning et al [6] studied the effects of zinc borate aluminium trihydrate
and their mixture on the flame retardant and smoke suppressant
properties of polyvinyl chloride PVC as well as their mechanism for
flame retardancy and smoke suppression They concluded that ZB and
ZB-ATH reduced the activation energy of PVC and their mixture had a
good synergistic effect on the flame retardance and smoke suppression
of PVC
Itrsquos clear that different authors [1-11] analyzed the fire and smoke
behaviour of zinc borate zinc stannate aluminium trihydrate zinc
hydroxystannate and their synergist effect in thermoplastic matrix or in
thermosetting bi-component matrix
Chapter 4 Flame retardant of epoxy resin with inorganic compounds
55
42 Cone calorimeter test Cone calorimeter represents a small-scale testing configuration which
provides important correlating parameters with real fire scenario data
obtained from cone calorimeter can provide plentiful information on fire
scenario material behaviour [12]
The values provided by cone calorimeter are mainly Time To Ignition
(TTI) which corresponds to the period that a combustible material can
withstand when exposure to a constant radiant heat flux before igniting
and undergoing sustained flaming combustion Heat Release Rate peak
(pHRR) average (HRRavarage) and Time To Peak (TTP) are a
quantitative measure of the amount of thermal energy released by a
material per unit area when exposed to a fire radiating at constant heat
flux (or temperature) Total Heat Evolved (THR) Total Smoke Released
(TSR)
Cone calorimeter tests were performed using a Fire Testing Technology
Ldt cone calorimeter according to the ASTM E1354-04 procedure
Samples with nominal dimensions of 100x100x7 mm were tested
horizontally under an incident flux of 50 kWm2 This level was chosen
as it corresponds to the evolved heat during a fire
421 Flame retardant of epoxy resin with inorganic compounds
The composite flame retardant were prepared by mixing the epoxy resin
RTM6 with zinc borate aluminium trihydrate zinc stannate and zinc
hydroxystannate at different percentage (5 wt 10 wt 20 wt 30
wt 40 wt) using a Heidolph RZR mechanical stirring equipment
(Chap 3)
Cone calorimeter data reported in tables 41 and 42 show that the
presence of zinc borate at 5 and 10 wt does not change substantially
the flame behaviour of the matrix as drawn by analysing the time to
ignition and heat release rate peak values Instead the presence of zinc
borate at 20 30 40 wt induces the flame retardant effect as
Chapter 4 Flame retardant of epoxy resin with inorganic compounds
56
supported by the recorded values of pHRR and HRR average The cone
calorimeter data reported in table 41 are averaged over two replicate
experiments
Samples
TTI
(s)
pHRR
(kWm2)
HRR
average
(kWm2)
TTP
(s)
THR
(MJm2)
TSR
(m2m2)
RTM6
neat 43 702 382 290 189 9260
RTM6+ZB
5wt 48 523 265 297 176 8282
RTM6+ZB
10wt 44 682 354 325 1842 8442
RTM6+ZB
20wt 49 428 251 455 188 9275
RTM6+ZB
30wt 47 396 193 65 186 10296
RTM6+ZB
40wt 63 315 148 82 161 7474
Table 41 Main cone calorimeter parameters evaluated for RTM6 epoxy with ZB at
different percentage
Samples ΔTTI
(s)
ΔpHRR
(kWm2)
FIP
(kWm2s)
FIGRA
(kWm2s) RTM6
neat _ _ 1632 242
RTM6+ZB
5wt 5 179 1079 175
RTM6+ZB
10wt 1 20 155 209
RTM6+ZB
20wt 6 274 861 094
RTM6+ZB
30wt 4 306 842 609
RTM6+ZB
40wt 20 387 5 384
Table 42 Parameters calculated by cone calorimeter data for RTM6 epoxy with ZB at
different percentage
Chapter 4 Flame retardant of epoxy resin with inorganic compounds
57
Where FPI and FIGRA are respectively pHRRTTI (kWm2s) and
pHRRTTP (kWm2s)
Decreasing values for the pHRR and HRR average may be correlated
with the formation of a char layer over the surface of tested sample
during the combustion process
A visual inspection of the final residual sample reports the presence of
the char layer (fig 41)
In figure 41 the HRR peak of RTM6ZB 10 wt system is higher than
corresponding peak for the ZB 5 wt system this curversquos behaviour
could be attributed to a local instability of the heat flux during the test
which lead to a wider cracked area and therefore a localised
combustion growth
Figure 41 HRR curves of RTM6ZB at different percentage
Whereas the aluminium trihydrate shows a negative effect as showed
by preliminary thermo-gravimetric analysis probably due an
acceleration of decomposition of the epoxy resin the presence of ATH
from 20 to 40 wt reduced the HRR peak and the HRR average (fig
42)
Chapter 4 Flame retardant of epoxy resin with inorganic compounds
58
In figure 42 the images of the residues of 30 and 40 wt RTM6-ATH
system with the whitish surface characteristic of the aluminium
trihydrate are reported
Figure 42 HRR curves of RTM6ATH at different percentage
The cone calorimeter data for ATH are reported in table 43 and FPI and
FIGRA in table 44 and are averaged over two replicate experiments
Chapter 4 Flame retardant of epoxy resin with inorganic compounds
59
Samples
TTI
(s)
pHRR
(kWm2)
HRR
average
(kWm2)
TTP
(s)
THR
(MJm2)
TSR
(m2m2)
RTM6 neat 43 702 382 290 189 9260
RTM6+ATH
5 33 815 413 220 126 5099
RTM6+ATH
10 51 728 383 210 126 5246
RTM6+ATH
20 52 510 368 340 199 9109
RTM6+ATH
30 64 468 324 232 174 7648
RTM6+ATH
40 93 453 193 110 172 8238
Table 43 Main cone calorimeter parameters evaluated for RTM6 epoxy with ATH at
different percentage
Samples ΔTTI
(s)
ΔpHRR
(kWm2)
FIP
(kWm2s)
FIGRA
(kWm2s) RTM6 neat _ _ 1632 242
RTM6+ATH
5 -10 -113 247 370
RTM6+ATH
10 8 -26 1427 346
RTM6+ATH
20 9 192 98 15
RTM6+ATH
30 21 234 731 201
RTM6+ATH
40 50 249 487 411
Table 44 Parameters calculated by cone calorimeter data for RTM6 epoxy with ZB at
different percentage
Where FPI and FIGRA are respectively pHRRTTI (kWm2s) and
pHRRTTP (kWm2s)
Chapter 4 Flame retardant of epoxy resin with inorganic compounds
60
Zinc hydroxystannate and zinc stannate such as zinc borate and
aluminium trihydrate reduced HRR peak and HRR average with the
presence of ZS and ZHS of 30 and 40 wt ZS and ZHS werenrsquot
prepared at 5 wt percentage because previously test on zinc borate
and aluminium trihydrate have failed the cone calorimeter tests
Cone calorimeter data are reported in table 45 for ZHS and in table 47
for ZS
In figure 43 HRR curves of ZHS at different percentage are reported
and the residual image shows a densified structure (char) that forms a
barrier to inhibit combustible gases
Figure 43 HRR curves of RTM6ZHS at different percentage
Chapter 4 Flame retardant of epoxy resin with inorganic compounds
61
Samples
TTI
(s)
pHRR
(kWm2)
HRR
average
(kWm2)
TTP
(s)
THR
(MJm2)
TSR
(m2m2)
RTM6 neat 43 702 382 290 189 9260
RTM6+ZHS
10 44 469 203 255 202 9070
RTM6+ZHS
20 43 465 286 417 194 7092
RTM6+ZHS
30 52 379 192 70 153 6726
RTM6+ZHS
40 51 329 214 75 153 72
Table 45 Main cone calorimeter parameters evaluated for RTM6 epoxy with ZHS at
different percentage
Samples ΔTTI
(s)
ΔpHRR
(kWm2)
FIP
(kWm2s)
FIGRA
(kWm2s)
RTM6 neat _ _ 1632 242
RTM6+ZHS
10 1 233 1065 184
RTM6+ZHS
20 0 237 1082 111
RTM6+ZHS
30 9 323 728 541
RTM6+ZHS
40 8 373 645 438
Table 46 Parameters calculated by cone calorimeter data for RTM6 epoxy with ZHS
at different percentage
Instead in the residual image of ZS (fig 44) a crack on the surface is
observed probably due to a local instability of the heat flux during the
test which lead to a wider cracked area and therefore a localised
combustion growth such as zinc borate
Chapter 4 Flame retardant of epoxy resin with inorganic compounds
62
Figure 44 HRR curves of RTM6ZS at different percentage
Samples
TTI
(s)
pHRR
(kWm2)
HRR
average
(kWm2)
TTP
(s)
THR
(MJm2)
TSR
(m2m2)
RTM6 neat 43 702 382 290 189 9260
RTM6+ZS
10 45 583 313 260 176 7505
RTM6+ZS
20 46 803 336 475 200 6747
RTM6+ZS
30 43 551 274 262 152 6509
RTM6+ZS
40 45 470 293 282 163 7096
Table 47 Main cone calorimeter parameters evaluated for RTM6 epoxy with ZS at
different percentage
Chapter 4 Flame retardant of epoxy resin with inorganic compounds
63
Samples ΔTTI
(s)
ΔpHRR
(kWm2)
FIP
(kWm2s)
FIGRA
(kWm2s)
RTM6 neat _ _ 1632 242
RTM6+ZS
10 2 119 1295 224
RTM6+ZS
20 3 -101 1745 169
RTM6+ZS
30 0 151 1281 210
RTM6+ZS
40 2 232 1044 166
Table 48 Parameters calculated by cone calorimeter data for RTM6 epoxy with ZS at
different percentage
In conclusion the effect of all additives on the HRR peak value of epoxy
resin RTM6 is considerable for percentages of 30 and 40 wt In
particular the best result has been achieved with zinc borate 40 wt
and the heat release rate peak enhancement was 55
422 Synergistic effect of zinc borate with aluminium trihydrate
The synergy between the zinc borate and aluminium trihydrate was
investigated on four different percentages (10 20 30 and 40 wt ) of
additives into neat system considering the total amount split between
zinc borate and aluminium trihydrate according to the ratio 11
In order to study the synergistic effects of zinc borate with aluminium
trihydrate samples of composite of RTM6 and ZBATH dispersed at
total percentage of 20 wt were mapped by SEM The presence of ZB
and ATH within the same area of the sample lead to the reasonable
conclusion that an interaction between the two additives is taking place
(fig 45)
Chapter 4 Flame retardant of epoxy resin with inorganic compounds
64
Figure 45 Mapping of ZBATH sample dispersed into the epoxy resin
Preliminary thermogravimetric analysis shows that the synergic effect
due to the presence of both ZB and ATH is highlighted by the value of
onset temperature which decreases to about 355degC for the higher
concentrations Theoretical (calculation) and experimental TG-DTG
curves have been superimposed in figures 46 and 47 for the 30 wt
similar results were also obtained for the 40 wt mixture It results
that the addition of ZB and ATH synergistically drives the degradation
behaviour of neat matrix system as showed by the remarkable shifting
of the experimental curve toward higher onset temperature compared
with the calculated one
Chapter 4 Flame retardant of epoxy resin with inorganic compounds
65
0
20
40
60
80
100
120
0 100 200 300 400 500 600 700 800
RTM6+ATH+ZB 30 ExperimentRTM6RTM6+ATH+ZB 30 Calculation
Wei
ght (
)
Temperature (degC)
Figure 46 Experimental and calculated TGA curves for RTM6ATHZB 30 wt system
-02
0
02
04
06
08
1
12
0 100 200 300 400 500 600 700 800
RTM6RTM6+ATH+ZB 30 ExperimentRTM6+ATH+ZB 30 Calculation
Der
iv W
eigh
t (
degC
)
Temperature (degC)
Figure 47 Experimental and calculated DTG curves for RTM6ATHZB 30 wt system
Cone calorimeter data of synergic effect of zinc borate is reported in
tables 49 and 410
Chapter 4 Flame retardant of epoxy resin with inorganic compounds
66
Samples
TTI
(s)
pHRR
(kWm2)
HRR
average
(kWm2)
TTP
(s)
THR
(MJm2)
TSR
(m2m2)
RTM6 neat 43 702 382 290 189 9260
RTM6+ZB+ATH
10 52 679 285 200 122 5702
RTM6+ZB+ATH
20 52 468 337 140 195 10086
RTM6+ZB+ATH
30 55 431 249 95 174 8966
RTM6+ZB+ATH
40 87 437 74 100 173 7184
Table 49 Main cone calorimeter parameters evaluated for RTM6ZBATH system at
different percentage
Samples ΔTTI
(s)
ΔpHRR
(kWm2)
FIP
(kWm2s)
FIGRA
(kWm2s)
RTM6 neat _ _ 1632 242
RTM6+ZB+ATH
10 9 23 1305 34
RTM6+ZB+ATH
20 9 234 917 334
RTM6+ZB+ATH
30 12 271 783 453
RTM6+ZB+ATH
40 44 265 502 437
Table 410 Parameters calculated by cone calorimeter data for RTM6ZBATH
system at different percentage
The synergy of zinc borate is effective above content of 20 wt in fact
the heat release rate average undergoes a significant decrease by 382
kWm2 for epoxy resin to 249 kWm2 for system ZBATH 30 wt and
74 kWm2 for ZBATH 40 wt (fig 48) Comparing the ΔTTI and the
Chapter 4 Flame retardant of epoxy resin with inorganic compounds
67
HRR average values for RTM6ZB 20 wt RTM6ATH 20 wt and
RTM6ZBATH system at 40 wt the effect synergic of zinc borate and
aluminium trihydrate improves significantly the flame retardancy
respectively from 6 to 44 sec for TTI and from 251 kWm2 to 74 kWm2
for HRR compared
Figure 48 HRR curves of RTM6ZBATH system at different percentage
423 Scanning electron micrograph of residual
The scanning electron micrographs of dust cryogenically fractured
composite samples and their residuals were taken by a 1450VP LEO
The analyses made with the electronic scanning microscope were made
to observe the morphology of the material both before and after the
combustion process occurred in the cone calorimeter
We used two different methodologies one for observing the morphology
of the material (ion secondary SE1) and the other for the phase
difference (ions scatter QBSD) and the EDS analysis was also carried
out to view the compounds contained in the sample examined
Chapter 4 Flame retardant of epoxy resin with inorganic compounds
68
Analysis of SEM micrographs on residual of system of epoxy resin zinc
borate and aluminium trihydrate indicates that char topography varies
from a compact like-amalgam structure for the RTM6+ZB (fig49-411)
to a granular porous-like structure characterized by very small particles
of degraded resin and additive for the ATH mixture (fig412-414)
Reported SEM image are taken for the 20 wt content system as this
percentage represents the first useful composition to observe a delayed
effect of flame retardancy
Figure 49 and 410 Scanning electron micrograph of residual of RTM6ZB system
Figure 411 Scanning electron micrograph (SE1 and QBSD) and EDS of residual of
RTM6ZB system
Chapter 4 Flame retardant of epoxy resin with inorganic compounds
69
Figure 412 and 413 Scanning electron micrograph of residual of RTM6ZB system
Figure 414 Scanning electron micrograph (SE1 and QBSD) and EDS of residual of
RTM6ZB system
In figure 415 the scanning electron micrograph of residual samples of
RTM6ZBATH system is reported and the formation of char layer on
the surface due to zinc borate that reduces the HRR peak and average
of the burning surface is observe
Scanning electron micrographs indicate that the synergistic flame
retardant effects of these additives result from the excellent quality of
char that can better endure the oxidation of high temperatures slowing
at same time the degradation of epoxy resin
Chapter 4 Flame retardant of epoxy resin with inorganic compounds
70
Figure 415 Scanning electron micrograph and EDS of residual of RTM6ZBATH
system
424 Flame retardant of panels of RTM6 and inorganic compounds
The composites were prepared by mixing the epoxy resin RTM6 with all
additives at percentage of 30 wt and then the mixture was degassed
for 30 minutes at 90degC in a vacuum oven to eliminate entrapped air and
humidity Afterwards the mixture was injected in the preform of
20x20cm by vacuum infusion process
Flame retardants of panels of RTM6 and inorganic compounds were
investigated by cone calorimeter under an incident flux of 35 kWm2 in
according to the ASTM E1354-04 procedure for samples with thickness
less than 3mm Samples have dimensions of 100x100mm with
thickness of about 3mm because they were manufactured with 8 plies
of carbon fibres overlaid unidirectional at zero degree with thickness of
03mm each one
Cone calorimeter data show how the best results for the flame retardant
properties is at percentage of 40 wt but rheology test prepared at 5
degCmin demonstrates high viscosity for this percentage and hence
there are troubles during infusion For this reason the panels were
manufactured with percentage additives of 30 wt (fig 416)
Chapter 4 Flame retardant of epoxy resin with inorganic compounds
71
Figures 416 Rheology test viscosity vs time of RTM6 neat (green) RTM6ZB 30 wt
(blue) and RTM6ZB 40 wt (red)
In figure 417 are reported HRR curves of panels of RTM6 with carbon
fibres and all additives at percentage of 30 wt
0 100 200 300 4000
200
400
HR
R [k
Wm
2 ]
Time [s]
RTM6+CF RTM6+CF+ZB 30wt RTM6+CF+ATH 30wt RTM6+CF+ZHS 30wt RTM6+CF+ZS 30wt
Figure 417 HRR curves of RTM6CFAdditives system at percentage of 30 wt
Chapter 4 Flame retardant of epoxy resin with inorganic compounds
72
In the figure it is shown that zinc borate retarded the time to ignition
and reduced heat release rate respect to epoxy resin with carbon fibres
as is reported in table 411
Samples
TTI
(s)
pHRR
(kWm2)
HRR
average
(kWm2)
TTP
(s)
THR
(MJm2)
TSR
(m2m2)
RTM6+CF 91 301 119 124 20 1009
RTM6+CF+ZB
30 106 284 132 134 12 612
RTM6+CF+ATH
30 90 303 121 122 21 969
RTM6+CF+ZHS
30 81 344 139 110 18 876
RTM6+CF+ZS
30 73 278 114 114 16 766
Table 411 Main cone calorimeter parameters evaluated for RTM6Carbon
FibersAdditives system at percentage of 30 wt
Samples ΔTTI
(s)
ΔpHRR
(kWm2)
FIP
(kWm2s)
FIGRA
(kWm2s)
RTM6 neat _ _ 33 24
RTM6+CF+ZB
30 15 17 27 21
RTM6+CF+ATH
30 -1 -2 34 25
RTM6+CF+ZHS
30 -10 -43 42 32
RTM6+CF+ZS
40 -18 23 38 24
Table 412 Parameters calculated by cone calorimeter data for RTM6Carbon
FibersAdditives system at percentage of 30 wt
Chapter 4 Flame retardant of epoxy resin with inorganic compounds
73
In the table itrsquos shown clearly that the panels with zinc borate
augmented the flame retardant properties of RTM6 and carbon fibers in
fact increased the TTI reduced significantly the TSR and reduced FIP
and FIGRA (table 412)
The synergistic effect of zinc borate with aluminium trihydrate on
panels of RTM6 and carbon fibers is shown in figure 418
0 100 200 300 4000
200
400
HR
R [k
Wm
2 ]
Time [s]
RTM6+CF RTM6+CF+ZB 30wt RTM6+CF+ATH 30wt RTM6+CF+ZB+ATH 30wt
Figure 418 HRR curves of RTM6CFZBATH system
In this case itrsquos shown that the synergistic effect of zinc borate didnrsquot
produce any improvement on the flame retardant properties of RTM6
and Carbon Fibers as is reported in tables 413 and 414
Zinc borate from chemical in the combustion phase is able to slow
down the effect of carbon fibres because the zinc borate creates a layer
of char on the surface of sample more compact than was in the
presence of ZB with ATH
Chapter 4 Flame retardant of epoxy resin with inorganic compounds
74
Samples
TTI
(s)
pHRR
(kWm2)
HRR
average
(kWm2)
TTP
(s)
THR
(MJm2)
TSR
(m2m2)
RTM6+CF 91 301 119 124 20 1009
RTM6+CF+ZB 30 106 284 132 134 12 612
RTM6+CF+ATH
30 90 303 121 122 21 969
RTM6+CF+ZB+ATH
30 79 311 126 104 17 788
Table 413 Main cone calorimeter parameters evaluated for RTM6Carbon
FibersZBATH system at percentage of 30 wt
Samples ΔTTI
(s)
ΔpHRR
(kWm2)
FIP
(kWm2s)
FIGRA
(kWm2s) RTM6 neat _ _ 33 24
RTM6+CF+ZB 30 15 17 27 21
RTM6+CF+ATH
30 -1 -2 34 25
RTM6+CF+ZB+ATH
30 -12 -10 38 29
Table 414 Parameters calculated by cone calorimeter data for RTM6Carbon
FibersZBATH system at percentage of 30 wt
Chapter 4 Flame retardant of epoxy resin with inorganic compounds
75
43 Thermal mechanical analysis of RTM6 and inorganic
compounds The coefficient of thermal expansion is calculated by thermal
mechanical analysis as reported in Chapter 3
Each result reported in this chapter is averaged over three replicate
experiments The thermal mechanical analysis was conducted on the
samples additived at 30wt because this percentage is resulted good by
cone calorimeter test and principally to have a comparison with the
panels that are produced at this percentage
In figure 419 is reported the CTE of RTM6 neat and it is shown clearly
that there are two values of CTE in the first heating ramp and many
CTErsquos value in the second heating ramp
000 10000 20000Time [min]
145000
146000
147000
148000x10
1um
TMA
-002
-001
000
001
002
NLOAD
10000
20000
CTemp
19613C
5600C
16757C
6207x10-6
K
21589C
24557C
13770x10-6
K
7768C
16433C
6748x10-6
K
21168C
24930C
16647x10-6
K
RTM6 NEAT
Figure 419 CTE of epoxy resin RTM6 neat
Instead in the samples of RTM6 and additives the value of CTE in the
second heating ramp is only one and it is observed that the value of
CTE of RTM6additives system is more less than the CTE of RTM6 neat
Chapter 4 Flame retardant of epoxy resin with inorganic compounds
76
hence the influence of additives on the thermal mechanical properties of
matrix is clear
000 5000 10000 15000Time [min]
117000
117500
118000
x101
umTMA
-002
-001
000
001
002
NLOAD
5000
10000
15000
20000
CTemp
8451 C
18561 C
6615 x10-6
5238 C
15885 C
5781 x10-6
K
17844 C
18051 C
19565 C
12254 x10-6
K
RTM6+ZB 30 wt
Figure 420 CTE of epoxy resin RTM6+ZB 30wt
000 5000 10000 15000Time [min]
155000
155500
156000
156500x10
1um
TMA
-002
-001
000
001
002
NLOAD
5000
10000
15000
20000
CTemp
17557C
5017C
13426C
6051x10-6
K
18608C
19618C
9987x10-6
K
7391C
19130C
6231x10-6
K
RTM6+ATH 30wt
Figure 421 CTE of epoxy resin RTM6+ATH 30wt
Chapter 4 Flame retardant of epoxy resin with inorganic compounds
77
To observe the synergistic effect of zinc borate is calculated the CTE of
RTM6ZBATH 30wt system and the results are reported in table
415
000 5000 10000 15000Time [min]
121000
121500
122000
x101
umTMA
-002
-001
000
001
002
NLOAD
5000
10000
15000
20000
CTemp
4876C
12672C
6051x10-6
K7127C
19539C
6471x10-6K
15421C
17853C
12050x10-6K
RTM6+ZB+ATH 30wt
Figure 422 CTE of epoxy resin RTM6+ATH+ZB 30wt
Coefficient of Thermal Expansion (10-6K)
Samples I Heating ramp II Heating ramp
RTM6 neat 606 1329 678 1657
RTM6+ZB 30wt 595 1767 656 -
RTM6+ATH 30wt 605 1149 612 -
RTM6+ATH+ZB 30wt 612 1157 671 -
Table 415 CTE of synergistic effect of zinc borate
Instead in the graph of TMA of ZS and ZHS there are two values in the
second heating ramp and rather than as a ZB and ATH This confirms
as previously seen from the cone that the protective structure that is
created is different because chemically boron and aluminium will
Chapter 4 Flame retardant of epoxy resin with inorganic compounds
78
oxidize more easily creating alumina and boron oxide (ceramic) hence
tighten the structure
000 10000 20000Time [min]
150000
151000
x101
umTMA
-002
-001
000
001
002
NLOAD
10000
20000
CTemp
7767C
17204C
5787x10-6K
21699C
24925C
12096x10-6
K
19957C
4559C
13757C
6488x10-6
K
18170C
24788C
6759x10-6
K
RTM6+ZS 30wt
Figure 423 CTE of epoxy resin RTM6+ZS 30wt
000 10000 20000Time [min]
165000
166000
167000
168000
x101
umTMA
-002
-001
000
001
002
NLOAD
10000
20000
CTemp
6060C
15393C
6330x10-6
K
20830C
23721C
29456x10-6
K
20725C
7879C
15387C
6242x10-6
K
22040C
24930C
12702x10-6
K
RTM6+ZHS 30wt
Figure 424 CTE of epoxy resin RTM6+ZHS 30wt
In conclusion the values of coefficient of thermal expansion for both
heating ramp are reported in table 416
Chapter 4 Flame retardant of epoxy resin with inorganic compounds
79
Coefficient of Thermal Expansion (10-6K)
Samples I Heating ramp II Heating ramp
RTM6 neat 606 1329 678 1657
RTM6+ZB 30wt 595 2038 656 -
RTM6+ATH 30wt 605 1149 612 -
RTM6+ATH+ZB 30wt 612 1157 671 -
RTM6+ZS 30wt 636 7040 574 1276
RTM6+ZHS 30wt 621 2898 617 1268
Table 416 CTE of all samples of RTM6 and additives
In table 416 the values of CTE for all additives are reported and it is
clearly observed that the influence of additives on the matrix is able to
lower the CTE of epoxy resin neat
Furthermore it is shown the thermal mechanical analysis of panels of
epoxy resin with additives produced by VIP with carbon fibres The
samples were cut to 90 degrees in the transverse direction fibres to
observe the effect of carbon fibres and additives on the properties of
thermal mechanical of matrix
In the figures below the values of CTE of epoxy resin RTM6 with carbon
fibres and all additives are illustrated and it is shown that the values of
CTE are always lower than the CTE of single resin with fibres This
results are reported in the table 417
Chapter 4 Flame retardant of epoxy resin with inorganic compounds
80
000 10000 20000Time [min]
177500
178000
178500
x101
umTMA
-002
-001
000
001
002
NLOAD
10000
20000
CTemp
5090C
16755C
3325x10-6
K
22481C22314C
25029C
3085x10-6
K
17544C
7034C
15384C
3377x10-6
K
19683C
24476C
4543x10-6K
RTM6+CF
Figure 425 CTE of epoxy resin RTM6+CF
000 10000 20000Time [min]
138500
139000
139500
x101
umTMA
-002
-001
000
001
002
NLOAD
10000
20000
CTemp
5309C
15389C
2840x10-6K
21889C
24945C
2723x10-6
K
21278C
7875C
14546C
3036x10-6
K
18119C
19872C
24356C
3873x10-6
K
RTM6+CF+ZB 30 wt
Figure 426 CTE of epoxy resin RTM6+CF+ZB 30wt
Chapter 4 Flame retardant of epoxy resin with inorganic compounds
81
000 10000 20000Time [min]
162000
162500
163000
x101
umTMA
-002
-001
000
001
002
NLOAD
10000
20000
CTemp
22411C
5525C
16456C
3264x10-6
K
23409C24942C
2832x10-6K
17556C
7234C
14428C
3385x10-6K
20098C
24285C
3699x10-6
K
RTM6+CF+ATH 30 wt
Figure 427 CTE of epoxy resin RTM6+CF+ATH 30wt
000 10000 20000Time [min]
165500
166000
166500
x101
umTMA
-002
-001
000
001
002
NLOAD
10000
20000
CTemp
22639C
4575C
15467C
3111x10-6K
22316C
25085C
4058x10-6K
7993C
14547C
3240x10-6
K
17252C19766C
24360C
4942x10-6K
RTM6+CF+ATH+ZB 30 wt
Figure 428 CTE of epoxy resin RTM6+CF+ATH+ZB 30wt
Chapter 4 Flame retardant of epoxy resin with inorganic compounds
82
000 10000 20000Time [min]
155500
156000
x101
umTMA
-002
-001
000
001
002
NLOAD
10000
20000
CTemp
22262C
5082C
16873C
2888x10-6
K
22845C
25089C
3534x10-6
K
15935C
7235C
14962C
3211x10-6
K
18924C
23941C
4176x10-6
K
RTM6+ZS 30wt
Figure 429 CTE of epoxy resin RTM6+CF+ZS 30wt
000 10000 20000Time [min]
174000
174500
x101
umTMA
-002
-001
000
001
002
NLOAD
10000
20000
CTemp
24089C
5721C
18578C
2851x10-6
K
23944C25021C
2451x10-6K
16347C
6501C
14321C
3085x10-6
K
19681C
24287C
3625x10-6K
RTM6+ZHS 30wt
Figure 430 CTE of epoxy resin RTM6+CF+ZHS 30wt
Chapter 4 Flame retardant of epoxy resin with inorganic compounds
83
Coefficient of Thermal Expansion (10-6K)
Samples I Heating ramp II Heating ramp
RTM6+CF 332 319 346 452
RTM6+CF+ZB 30wt 265 317 311 386
RTM6+CF+ATH 30wt 326 306 339 389
RTM6+CF+ATH+ZB 30wt 292 299 306 398
RTM6+CF+ZS 30wt 296 318 318 378
RTM6+CF+ZHS 30wt 276 364 318 406
Table 417 CTE of all samples of RTM6+CF and all additives
In the table the thermal mechanical data of panels are reported and it is
shown that the carbon fibers and the additives reduced the CTE hence
increase the thermal mechanical properties of epoxy resin RTM6
Chapter 4 Flame retardant of epoxy resin with inorganic compounds
84
References [1] Bourbigot S Le Bras M Leeuwendal R Shen KK Schubert D
Polym Degrad Stab 1999 (64)419-425
[2] Carpentier F Bourbigot S Le Bras M Delobel R Foulon M Polym
Degrad Stab 2000 69 1 83-92
[3] Wu Z Shu W Hu Y Journal of Applied Polymer Science 2007
1033667-3674
[4] Petsom A Roengsumran S Ariyaphattanakul A Sangvanich P
Polym Degrad Stab 2003(80)17-22
[5] Cusack PA Heer MS Monk AW Polymer Degradation and Stability
1997 (58)229-237
[6] Ning Y Guo S J of App Pol Sc 2000 77 3119-3127
[7] Wu S Cong P Yu J Luo X Mo L Fuel 2006 85 1298-1304
[8] Bourbigot S Le Bras M Duquesne S Rochery M Macromol Mater
Eng 2004 289 499-511
[9] Le Bras M Bourbigot S Duquesne S Jama C Wilkie CA Royal
Society of Chemistry Press Cambridge 2005
[10] Genovese A Shanks RA Polym Degrad Stab 2007 92 2-13
[11] Samyn F Bourbigot S Duquesne S Delobel R Thermochimica
2007 456 134-144
[12] Schartel B Hull TR Fire and Materials 2007 31 327-354
CHAPTER 5 FLAME RETARDANT OF EPOXY RESIN WITH
CARBON NANOTUBES
51 The state of the art on flame retardant of carbon
nanotubes Fire retardancy is one of the fields where the nanomaterials could be
used successfully Nanoparticles embedded in various polymer matrices
are reported to reduce considerably the heat released from these
materials [1] The investigation of size shape interfaces and
concentration of nanoscale silica nano-flakes nanotubes and other
nanoparticles on the flame retardant performance increased the role of
fire protected polymers within the science of materials There is a high
level of interest in using filler particles having at least one nano-
dimensional scale for making polymeric nanocomposite materials with
exceptional properties One of the promising applications involves the
improvement in flammability properties of polymers with nanofillers
because one weak aspect of polymers is that they are combustible
under certain conditions These filled systems are attractive as possible
alternatives to conventional flame retardants and furthermore they
could simultaneously improve both physical and flammability
properties of polymers [2]
Carbon nanotubes are candidates as flame retardant additives because
of their highly elongated shape (high aspect ratio)
In literature [2-6] different authors analyzed the fire behaviours of
carbon nanotubes in several matrices
Kashiwagi et al [2-4] found that nanocomposites based on carbon
nanotubes are likewise capable of forming a continuous structured
network as a protective layer without the formation of cracks that
compromise the flame-retardant effectiveness This resulted in a
Chapter 5 Flame retardant of epoxy resin with carbon nanotubes
86
significant reduction in the heat release rate (a flammability measure
related to the fire intensity) with a carbon nanotube mass concentration
as low as 05 This protective layer consisted mainly of carbon
nanotubes and it seemed to act as a heat shield for the virgin polymer
below the layer Poorly dispersed carbon nanotubes resulted in the
formation of a discontinuous layer consisting of fragmented islands
rather than the continuous protective network layer Very low
concentrations of the tubes yielded the same fragmented island
structures as found in the clay nanocomposite measurements The
flame retardant performance of the nanocomposites containing the
island structure was much poorer than that of the nanocomposites
forming a continuous protective network layer Thus the formation of
the network structured protective layer during burning without any
openings or cracks seems to be crucial for the large reduction in heat
release rate Furthermore Kashiwagi et al [5] suggested that this
network is formed in the original sample under appropriate fabrication
conditions and that this structure provides the main source of the
protective layer that is formed during the burning process This
hypothesis was systematically tested with various sizes and
concentrations of carbon-based nanoparticles in a PMMA matrix
Cipiriano et al [6] studied the effects of the aspect ratio of multi-walled
carbon nanotubes (MWNTs) on the rheology and flammability of
polystyreneMWNT nanocomposites using two MWNTs having average
aspect ratios (length to outer diameter) of 49 and 150 In flammability
experiments they demonstrated that the larger aspect ratio particles
lead to a greater reduction in mass loss rate hence they are more
effective in reducing flammability
Chapter 5 Flame retardant of epoxy resin with carbon nanotubes
87
52 Cone calorimeter test Cone calorimeter tests were performed using a Fire Testing Technology
Ldt cone calorimeter according to the ASTM E1354-04 procedure
Samples with nominal dimensions of 100x100x3 mm were tested
horizontally under an incident flux of 35 kWm2 This level was chosen
as it corresponds to the evolved heat during a fire for samples with
thickness less than 3mm
521 Flame retardant of RTM6 and MWNT Nanocyl 7000
The nanocomposites of epoxy resin and multi walled carbon nanotubes
were prepared by sonication process as is reported in the Chapter 3
0 100 200 300 4000
600
1200
1800
2400
3000
HR
R [k
Wm
2 ]
Time [s]
RTM6 RTM6+MWNT 01wt
Figure 51 HRR curves of RTM6MWNT at percentage of 01wt
Samples
TTI
(s)
pHRR
(kWm2)
HRR
average
(kWm2)
TTP
(s)
THR
(MJm2)
TSR
(m2m2)
RTM6 neat 35 1479 614 156 117 4688
RTM6+MWNT
01wt 72 1651 643 136 108 3863
Table 51 Parameters calculated by cone calorimeter data for RTM6MWNT 01wt
Chapter 5 Flame retardant of epoxy resin with carbon nanotubes
88
In figure 51 it is shown that the carbon nanotubes donrsquot influence the
properties of flame retardants of matrices because the percentage used
in this work is low A small effect is shown only for the value of TTI as
reported in table 51
523 Flame retardant of panels of RTM6 and carbon nanotubes
The nanocomposites were prepared by sonication process (Chap3) the
epoxy resin RTM6 with multi walled carbon nanotubes at percentage of
01 wt and then the mixture was degassed for 30 minutes at 90degC in a
vacuum oven to eliminate entrapped air and humidity Afterwards the
mixture was injected in the preform of 20x20cm by vacuum infusion
process Samples were manufactured with 8 plies of overlaid
unidirectional carbon fibres at zero degrees with thickness of 03mm
each one
0 100 200 300 4000
200
400
600
800
HR
R [k
Wm
2 ]
Time [s]
RTM6+CF RTM6+CF+MWNT 01wt
Figure 52 HRR curves of RTM6CFMWNT 01wt
Chapter 5 Flame retardant of epoxy resin with carbon nanotubes
89
Samples
TTI
(s)
pHRR
(kWm2)
HRR
average
(kWm2)
TTP
(s)
THR
(MJm2)
TSR
(m2m2)
RTM6+CF 91 301 118 124 20 1009
RTM6+CF+MWNT
01wt 88 306 129 124 21 1077
Table 52 Parameters calculated by cone calorimeter data for RTM6CFMWNT
system at percentage of 01wt
As seen above the percentage of nanotubes is not effective and the
presence of unidirectional fibres does not induce changes sensitive to
the distribution of flame
53 Thermal mechanical analysis of RTM6 and carbon
nanotubes The thermal mechanical analysis was conducted on both samples of
RTM6 and additives on panels with carbon fibres
000 10000 20000Time [min]
145000
146000
147000
148000x10
1um
TMA
-002
-001
000
001
002
NLOAD
10000
20000
CTemp
19613C
5600C
16757C
6207x10-6
K
21589C
24557C
13770x10-6
K
7768C
16433C
6748x10-6K
21168C
24930C
16647x10-6
RTM6 NEAT
Figure 53 CTE of epoxy resin RTM6 neat
Chapter 5 Flame retardant of epoxy resin with carbon nanotubes
90
000 10000 20000Time [min]
140000
141000
142000
x101
umTMA
-002
-001
000
001
002
NLOAD
10000
20000
CTemp
20956C
4487C
16322C
6518x10-6K
21697C
25089C
13872x10-6
K
7339C
16669C
6897x10-6
K
20631C
21697C
24929C
17239x10-6K
RTM6+MWNT 01wt
Figure 54 CTE of epoxy resin RTM6+MWNT 01wt
Coefficient of Thermal Expansion (10-6K)
Samples I Heating ramp II Heating ramp
RTM6 neat 606 1329 678 1657
RTM6+MWNT 01wt 622 1374 688 1702
Table 53 CTE of RTM6 and MWNT 01wt
In the figures 53 and 54 and in the table 53 the CTE for panels of
epoxy resin additived with carbon nanotubes are shown where the
percentage of multi walled carbon nanotubes is too low to make an
improvement on the value of CTE of RTM6 and carbon fibres
Chapter 5 Flame retardant of epoxy resin with carbon nanotubes
91
000 10000 20000Time [min]
177500
178000
178500
x101
umTMA
-002
-001
000
001
002
NLOAD
10000
20000
CTemp
5090C
16755C
3325x10-6
K
22481C22314C
25029C
3085x10-6
K
17544C
7034C
15384C
3377x10-6
K
19683C
24476C
4543x10-6K
RTM6+CF
Figure 55 CTE of epoxy resin RTM6+CF
000 10000 20000Time [min]
153500
154000
154500
x101
umTMA
-002
-001
000
001
002
NLOAD
10000
20000
CTemp
6828C
19462C
3758x10-6
K
22996C25074C
5327x10-6K
8314C
14215C
3810x10-6
K
19996C
24591C
5725x10-6K
RTM6+CF+MWNT 01wt
Figure 56 CTE of epoxy resin RTM6+CF+MWNT 01wt
Chapter 5 Flame retardant of epoxy resin with carbon nanotubes
92
Coefficient of Thermal Expansion (10-6K)
Samples I Heating ramp II Heating ramp
RTM6+CF 332 319 346 452
RTM6+CF+MWNT
01wt 367 577 383 553
Table 54 CTE of RTM6+CF+MWNT 01wt system
Similar values are obtained for the sample with carbon fibres and
carbon nanotubes in fact in table 54 it is shown clearly that both
nanotubes and fibers donrsquot influence CTE of RTM6CF system
Chapter 5 Flame retardant of epoxy resin with carbon nanotubes
93
References [1] Marosfoi B Matko Sz Marosi PAnnaGy Current Applied Physics
2006 (6)259-261
[2] Kashiwagi T Du F Winey KI Groth KM Shields JR Bellayer SP
Kim H Douglas JF Polymer 2005 (46)471-481
[3] Kashiwagi T Grulke E Hilding J Groth K Harris R Butler K
Shields J Kharchenko S Douglas J Polymer 2004 (45) 4227-4239
[4] Kashiwagi et al Macromol Rapid Commun 2002 (23) 761-765
[5] Kashiwagi T Du F Douglas JF Winey KI Harris RHJr Shields
JR Nature materials 2005 (4) 5-10
[6] Cipiriano BH Kashiwagi T Raghavan SR Yang Y Grulke EA
Yamamoto K Shields JR Douglas JF Polymer 2007 486086-6096
[7] Qian D Dickey EC Andrews R Rantell T Appl Phys Lett 200076
(20)2868-2870
[8] Park C et al Chemical Physical Letters 2002364303-308
[9] Ham HT Choi YS Chung JI Journal of Colloid and Interface
Science 2005286 (1)216-223
[10] Salvetat JP Briggs AD Bonard JM Bacsa RR Kulik AJ Stockli T
Burnham NA Forroacute L Phys Rev Lett 199982 (5)944-947
[11] Choi ES Brooks JS Eaton DL Haik MS Hussaini MY Garmestani
H Li D Dahmen KJ Appl Phys 2003946034-
[12] Sandler J Shaffer MSP Prasse T Bauhofer W Schulte K Windle
AH Polymer 199940(21)5967-5971
[13] Xiao-Lin X Yiu-Wing M Xing-Ping Z Materials Science and
Engineering R 20054989-112
[14] Jin L Bower C Zhou O Appl Phys Lett 199873 (9)1197-1199
[15] Choi ES Brooks JS Eaton DL Al-Haik MS Hussaini MY
Garmestani H Li D Dahmen KJ Appl Phys 2003945451-5473
CHAPTER 6 KINETIC DEGRADATIONS KISSINGER AND OZAWA
METHODS
61 The state of the art on Kissinger and Ozawa methods
for epoxy resin To study the accelerated ageing of polymers and to obtain the kinetic
parameters of decomposition such as the apparent activation energy we
must to extrapolate according to the environment where the materials
are used It is important to consider the degradation mechanisms both
in the environments where they are used both when they are under
accelerated ageing conditions
Thermogravimetric analysis is often used to determine decomposition
reactions and to evaluate the thermal stability The mass loss is
controlled by time in isothermal conditions or by temperature during
the heating rate Changes in mass can be associated with solvent or
water desorptionabsorption oxidation or reduction and decomposition
Dynamic TG tests tend to be shorter and the mechanism of degradation
may be studied over a large temperature range with typical heating rate
Regnier et al [1] in a previously work on polyimide polymer system
compared several methods to calculate thermal kinetic parameters
They showed that Van Krevelen Horowitz-Metzger Coats Redfern and
Mac-Callum-Tanner methods gave a similar apparent activation energy
All kinetic parameters calculated by using these methods showed
equally good agreement with the experimental data Afterwards Regnier
et al [2] investigated the thermal degradation of epoxycarbon
composites in dynamic conditions The activation energy have been
evaluated employing Kissingerrsquos method assuming first order reaction or
the Osawarsquos method which gives an estimated activation energy for the
overall degradation
Chapter 6 Kinetic degradation Kissinger and Ozawa methods
95
Kiefer et al [3] mentioned that the sample preparation had an effect on
the kinetic results It does seem that the kinetic parameters are divided
into two groups however depending whether or not the sample
contained fibres He observed that the resin is affecting the fibre
Wang et al [4] studied the degradation behaviours of epoxy resins
containing various flame retardant components by Kissinger Flynn-
Wall-Ozawa and Horowitz-Metzger methods They demonstrated that
the activation energy at lower degree of the degradation decreased by
incorporation of flame retardant components while increased at higher
degree of the degradation
Chiang et al [5] prepared epoxy nanocomposites containing silicon and
phosphorus and compared with pure epoxy by Kissingerrsquos method They
found that the activation energies of thermo-oxidative degradation for
epoxy nanocomposites are less than those of thermo-oxidative
degradation for pure epoxy in first stage of thermo-oxidative
degradation However the activation energies of thermo-oxidative
degradation for epoxy nanocomposites are more than those of thermo-
oxidative degradation for pure epoxy in second stage of thermo-oxidative
degradation
In the dynamic and isothermal TGA measurements the mass loss is
detected in function of temperature and kinetic of degradation is based
on nth order reaction mechanism and in the many cases the rate of
degradation is a linear function of temperature by a constant
dependent of temperature by Arrhenius equation
)(αα Kfdtd
= (1)
with
⎟⎠⎞
⎜⎝⎛ minus=
RTEAfk exp)(α
(2)
Chapter 6 Kinetic degradation Kissinger and Ozawa methods
96
The combination of (1) e (2) gives
⎟⎠⎞
⎜⎝⎛ minus=
RTEAf
dtd exp)(αα
(3)
If heating rate β=dTdt is constant the variation in degree of conversion
can be analysed as a function of temperature and this temperature
being dependent on the time of heating
⎟⎠⎞
⎜⎝⎛ minus=
RTEfA
dTd exp)(α
βα
(4)
The integrated form of this equation generally is expressed as
int int ⎟⎠⎞
⎜⎝⎛minus==
α
βααα
0 0
exp)(
)( dTRTEA
fdg
T
(5)
where g(α) is the integrated form of the conversion dependence function
Different kinetics methods (differential and integral) were applied in this
study
Kissinger method [6] makes it possible to determine the values of
activation energy without a precise knowledge of the reaction
mechanism and analyzes the changes in the thermo-gravimetric data
through the change of scan rate of heating β depending on the
temperature of the maximum peak in DTG curve That way you get
that
( )[ ]max
1max2
max
1lnlnlnRT
EnE
ART
n minus⎭⎬⎫
⎩⎨⎧ minus+=⎟⎟
⎠
⎞⎜⎜⎝
⎛ minusαβ
(6)
where Tmax is the temperature corresponding to the inflection point of
thermo degradation curves which corresponds to the maximum reaction
rate αmax is the conversion at Tmax and n is the reaction order
Chapter 6 Kinetic degradation Kissinger and Ozawa methods
97
Assuming that ( ) ( ) 1 1maxmax constnf n congminus=prime minusαα the activation energy E can
be determined from a plot of ln(βT2max) against 1Tmax
With Flynn-Wall-Ozawa method [7-9] it is possible to get values of
activation energy applying Doylersquos approximation to the integration of
Eq(5) You get that
RTE
RgAE 456703152
)(loglog minusminus⎥
⎦
⎤⎢⎣
⎡=
αβ
(7)
Using Eq7 it is possible to plot logβ against 1T and to consider the
slope of straight line which result with a various value of conversion
The graph that result report E in function of conversion degree
62 Kinetic degradations of RTM6 and inorganic
compounds For obtaining the kinetic information such as the activation energy the
TGA study has been conducted with the variation of the heating rates
The dynamic experiments were carried out at different heating rates 5
75 10 and 20 degCmin from ambient to 800degC with TA 2950
thermobalance in nitrogen and air atmosphere For each experiment
were used approximately 10 mg of materials and the kinetics
parameters of interest as activation energy relating to initial
degradation of mixtures were obtained by Kissinger and Flynn-Ozawa-
Wall methods
In figure 61 thermogravimetric analysis of the epoxy resin RTM6 in the
nitrogen atmosphere are reported The epoxy resin shows only one step
of degradation and the onset temperature is around 350degC while the
maximum temperature on the DTG curves shows a little difference in
the heating rate
Chapter 6 Kinetic degradation Kissinger and Ozawa methods
98
Figure 61 TGA thermograms of RTM6 neat in nitrogen atmosphere
Figure 62 DTG thermograms of RTM6 neat in nitrogen atmosphere
In table 61 the onset temperature and maximum temperature for
epoxy system neat are reported along with the corresponding heating
ramp
Chapter 6 Kinetic degradation Kissinger and Ozawa methods
99
Heating rate (degCmin) Tonset (degC) Tmax (degC) 5degCmin 305 372
75degCmin 320 381
10degCmin 330 388
20degCmin 348 403
Table 61 Tonset and Tmax of epoxy resin RTM6 in nitrogen atmosphere
In air atmosphere two different degradation steps spanning the whole
investigated temperature range are noticeable the first step occurring
at 350degC and a second much broader step within around 500-550degC
(fig 63 and 64) The second step was attributed to a decomposition of
the non-volatile residues formed in the first step
Figure 63 TGA thermograms of RTM6 neat in air atmosphere
Chapter 6 Kinetic degradation Kissinger and Ozawa methods
100
Figure 64 DTG thermograms of RTM6 neat in air atmosphere
In table 62 are reported Tonset and Tmax of epoxy resin in air atmosphere
for each step
I STEP
Heating rate (degCmin) Tonset (degC) Tmax (degC) 5degCmin 354 378
75degCmin 351 383
10degCmin 354 406
20degCmin 357 398
II STEP
Heating rate (degCmin) Tonset (degC) Tmax (degC) 5degCmin 475 517
75degCmin 524 556
10degCmin 523 568
20degCmin 544 597
Table 62 Tonset and Tmax of epoxy resin RTM6 in air atmosphere
Chapter 6 Kinetic degradation Kissinger and Ozawa methods
101
The Kissinger method was employed to obtain the apparent activation
energy (Ea) in air or nitrogen from several scan with different heating
rate (q) Figures 65 and 66 represent the Kissinger plots of the epoxy
resin degraded in nitrogen and air atmosphere
150 152 154 156 158 160 162 1641000 KT
0
02
04
06
08
10
log (Heating rate(Kmin))
Activation Energy(kJmol) 16452 +- 351log (As^-1) 1070
Figure 65 Kissinger graphs for RTM6 data in nitrogen atmosphere
-1 2
-1 1 5
-1 1
-1 0 5
-1 0
-9 5
-9
-8 5
0 0 0 1 1 0 0 0 1 2 0 0 0 1 3 0 0 0 1 4 0 0 0 1 5 0 0 0 1 6
I S tepII s tep
y = 68 38 3 - 5 2 03 6 x R = 0 9 9 9 4 3
y = 0 4 01 9 5 - 9 69 1 x R = 0 9 9 7 4 3
ln ( β
T max
2 )
1 Tm a x
degK -1
Figure 66 Kissinger graphs for RTM6 data in air atmosphere
Chapter 6 Kinetic degradation Kissinger and Ozawa methods
102
KISSINGER in nitrogen atmosphere
Ea (kJmol) 16452
KISSINGER in air atmosphere
I STEP II STEP
Ea (kJmol)
RTM6 NEAT
816 1157
Table 63 Kissinger data for epoxy resin RTM6 in nitrogen and air atmosphere
The kinetic parameters calculated in nitrogen flow present activation
energy values higher than Ea obtained in air flow In fact activation
energy value in nitrogen flow is 16452 kJmol instead in air flow is
816 kJmol for first step and 1157 KJmol for second step
The Flynn-Ozawa-Wall method was also carried out for calculating the
activation energy only in nitrogen atmosphere In figures 67 and 68 it
is reported respectively the Ozawa analysis and activation energy
calculated with Ozawa methods for epoxy resin RTM6 It is possible to
notice that in the nitrogen atmosphere the Ea increase from conversion
zero to 20 after Ea is a constant from =02 to =07 and than
increase until to =085
Chapter 6 Kinetic degradation Kissinger and Ozawa methods
103
10 12 14 16 18 201000 KT
06
08
10
12
14log Heating rate(Kmin)
002 098
Figure 67 Ozawa analysis for RTM6 in nitrogen atmosphere
0 02 04 06 08 10 FractMass Loss
40
80
120
160
200
E(kJmol)
Figure 68 Energy of activation calculated with Ozawa method for RTM6 in nitrogen
atmosphere
The thermogravimetric derivate signal for RTM6ZB 30 wt system is
showed in figure 69 for nitrogen atmosphere and in figure 610 for air
atmosphere
Chapter 6 Kinetic degradation Kissinger and Ozawa methods
104
Figure 69 DTG thermograms of RTM6+ZB 30wt in nitrogen atmosphere
Figure 610 DTG thermograms of RTM6+ZB 30wt in air atmosphere
Chapter 6 Kinetic degradation Kissinger and Ozawa methods
105
145 147 149 151 1531000 KT
06
08
10
12
14log (Heating rate(Kmin))
Activation Energy(kJmol) 15425 +- 2201log (As^-1) 971
Figure 611 Kissinger graphs for RTM6+ZB 30wt data in nitrogen atmosphere
-12
-115
-11
-105
-10
0001 00012 00014 00016 00018 0002
I stepII step
y = 15735 - 17745x R= 099679
y = 15931 - 21603x R= 099919
ln(β
Tm
ax2 )
1Tmax
Figure 612 Kissinger graphs for RTM6+ZB 30wt data in air atmosphere
The Kissinger analysis in nitrogen atmosphere has demonstrated that
the activation energy Ea is less than the value of epoxy resin hence it
doesnrsquot achieve the energy for the degradation of RTM6 neat Instead in
the Kissinger analysis in air atmosphere it is shown that the value of
Chapter 6 Kinetic degradation Kissinger and Ozawa methods
106
Ea in the second step is higher than the value of RTM6 in fact at the
temperature lower 500degC a char on the surface that protects the matrix
is produce
KISSINGER in nitrogen atmosphere
Ea (kJmol) 15425
KISSINGER in air atmosphere
I STEP II STEP
Ea (kJmol)
RTM6+ZB 30wt
14754 17962
Table 64 Kissinger data for RTM6+ZB 30wt in nitrogen and air atmosphere
10 12 14 16 18 201000 KT
06
08
10
12
14log Heating rate(Kmin)
002 098
Figure 613 Ozawa analysis for RTM6+ZB 30wt in nitrogen atmosphere
Chapter 6 Kinetic degradation Kissinger and Ozawa methods
107
0 02 04 06 08 FractMass Loss
40
60
80
100
120
140
160
E(kJmol)
Figure 614 Energy of activation calculated with Ozawa method for RTM6+ZB 30wt
in nitrogen atmosphere
In the nitrogen atmosphere the Ozawa analysis confirms the positive
effect of zinc borate on the epoxy resin RTM6 because with low
conversion values the activation energy Ea is less than 50kJmol while
for conversion degrees between 01 and 08 a multi-step degradation
process is shown The presence of this step means that several layers of
char on the surface of the RTM6 have been created
Chapter 6 Kinetic degradation Kissinger and Ozawa methods
108
Figure 615 DTG of RTM6+ATH 30 wt in nitrogen atmosphere
Figure 616 DTG of RTM6+ATH 30 wt in air atmosphere
Chapter 6 Kinetic degradation Kissinger and Ozawa methods
109
147 149 151 1531000 KT
06
08
10
12
14log (Heating rate(Kmin))
Activation Energy(kJmol) 18731 +- 971log (As^-1) 1247
Figure 617 Kissinger graphs for RTM6+ATH 30 wt data in nitrogen atmosphere
-5
-49
-48
-47
-46
-45
-44
-43
-42
00012 00014 00016 00018 0002 00022
I stepII step
y = -071912 - 22661x R= 099682
y = 80558 - 84061x R= 097719
log
(βT
max
2 )
1Tmax
Figure 618 Kissinger graphs for RTM6+ATH 30 wt data in nitrogen atmosphere
Chapter 6 Kinetic degradation Kissinger and Ozawa methods
110
-12
-115
-11
-105
-10
-95
0001 00012 00014 00016 00018 0002
I stepII stepIII step
y = 11477 - 12954x R= 099948
y = 23102 - 22194x R= 099906
y = 66365 - 14480x R= 099861
ln(β
Tm
ax2 )
1Tmax
Figure 619 Kissinger graphs for RTM6+ATH 30 wt data in air atmosphere
KISSINGER in nitrogen atmosphere
I STEP II STEP
Ea (kJmol)
18841 6989
KISSINGER in air atmosphere
I STEP II STEP III STEP
Ea (kJmol)
RTM6+ATH 30wt
1077 1845 1204
Table 65 Kissinger data for RTM6+ATH 30wt in nitrogen and air atmosphere
In this case there are three degradation steps in the Kissinger analysis
in air atmosphere of aluminium trihydrate By varying the temperature
the following process occurred sequentially
bull dehydration of hydroxyl groups
bull formation of aluminized layer protection
bull pyrolysis of char
Chapter 6 Kinetic degradation Kissinger and Ozawa methods
111
For every step it is possible to associate the activation energy which is
greater than Ea of RTM6 hence it represents a slower degradation
08 10 12 14 16 18 201000 KT
06
08
10
12
14log Heating rate(Kmin)
002 095
Figure 620 Ozawa analysis for RTM6+ATH 30wt in nitrogen atmosphere
0 02 04 06 FractMass Loss
20
40
60
80
100
120
140
160
180
E(kJmol)
Figure 621 Energy of activation calculated with Ozawa methods for RTM6+ATH
30wt in nitrogen atmosphere
Chapter 6 Kinetic degradation Kissinger and Ozawa methods
112
In the Ozawa analysis it is demonstrated that the Ea starts to lower
values than both RTM6 and ZB in fact Ea starts to 25 kJmol and two
different steps are observed In the first step Ea is 70 kJmol for =01
while in the second step Ea is 160 kJmol with conversation degree
between 02 and 07
The TGA thermograms of the epoxy resin containing zinc borate and
aluminium trihydrate is reported in figures 622 and 623 to study the
kinetic parameters for synergistic effects of zinc borate
Figure 622 DTG of RTM6+ATH+ZB 30 wt in air atmosphere
Chapter 6 Kinetic degradation Kissinger and Ozawa methods
113
Figure 623 DTG of RTM6+ATH+ZB 30 wt in air atmosphere
146 148 150 152 154 1561000 KT
06
08
10
12
14log (Heating rate(Kmin))
Activation Energy(kJmol) 12276 +- 1399log (As^-1) 717
Figure 624 Kissinger graphs for RTM6+ATH+ZB 30 wt system data in nitrogen
atmosphere
Chapter 6 Kinetic degradation Kissinger and Ozawa methods
114
-125
-12
-115
-11
-105
-10
-95
-9
0001 00012 00014 00016 00018 0002 00022
I stepII stepIII step
y = 27768 - 24989x R= 099954
y = 26545 - 24952x R= 099876
y = 11444 - 18156x R= 099963
ln(β
Tm
ax2 )
1Tmax
Figure 625 Kissinger graphs for RTM6+ATH+ZB 30wt system data in air
atmosphere
KISSINGER in nitrogen atmosphere
Ea (kJmol) 12276
KISSINGER in air atmosphere
I STEP II STEP III STEP
Ea (kJmol)
RTM6+ATH+ZB 30wt
2077 2075 1509
Table 66 Kissinger data for RTM6+ATH+ZB 30wt in nitrogen and air atmosphere
Chapter 6 Kinetic degradation Kissinger and Ozawa methods
115
10 12 14 16 18 201000 KT
06
08
10
12
14log Heating rate(Kmin)
002 098
Figure 626 Ozawa analysis for RTM6+ATH+ZB 30wt system in nitrogen
atmosphere
01 03 05 07 Fractional Reaction
100
200
300
400
500
600
700E(kJmol)
Figure 627 Energy of activation calculated with Ozawa methods for RTM6+ATH+ZB
30wt system in nitrogen atmosphere
Chapter 6 Kinetic degradation Kissinger and Ozawa methods
116
The presence of both additives is clear in the Kissinger analysis and the
synergistic effect is shown in the Ozawa analysis because at low levels
of alpha Ea is higher In fact Ea increases for values of alpha around 01
and remains constant value of 200 kJmol throughout the range of
conversion Consequently it is necessary a higher energy than in
respect to the same additives taken individually and RTM6 neat to
complete the degradation process
Figure 628 DTG of RTM6+ZS 30 wt in nitrogen atmosphere
Chapter 6 Kinetic degradation Kissinger and Ozawa methods
117
Figure 629 DTG of RTM6+ZS 30 wt in air atmosphere
152 154 156 158 1601000 KT
06
08
10
12
14log (Heating rate(Kmin))
Activation Energy(kJmol) 15759 +- 420log (As^-1) 1044
Figure 630 Kissinger graphs for RTM6+ZS 30 wt data in nitrogen atmosphere
Chapter 6 Kinetic degradation Kissinger and Ozawa methods
118
-12
-115
-11
-105
-10
-95
0001 00012 00014 00016 00018 0002
I stepII stepIII step
y = 31646 - 26873x R= 099793
y = 11934 - 15035x R= 099848
y = 79213 - 15008x R= 099838
ln(β
Tm
ax2 )
1Tmax
Figure 631 Kissinger graphs for RTM6+ZS 30 wt data in air atmosphere
KISSINGER in nitrogen atmosphere
Ea (kJmol) 1576
KISSINGER in air atmosphere
I STEP II STEP III STEP
Ea (kJmol)
RTM6+ZS 30wt
2234 125 1248
Table 66 Kissinger data for RTM6+ZS 30wt in nitrogen and air atmosphere
Zinc stannate is similar to ATH for Kissinger analysis because also in
this case there are three degradation steps The discussion on the
structure of char isnrsquot like ATH because there isnrsquot the aluminium and
because the second and third degradation step need a lower energy to
be completed hence it is explained that the protection action is partly
missing
Chapter 6 Kinetic degradation Kissinger and Ozawa methods
119
10 12 14 16 18 20 22 24 261000 KT
06
08
10
12
14
log Heating rate(Kmin)
002 098
Figure 632 Ozawa analysis for RTM6+ZS 30wt in nitrogen atmosphere
0 02 04 06 08 FractMass Loss
0
40
80
120
160
200
E(kJmol)
Figure 633 Energy of activation calculated with Ozawa methods for RTM6+ZS in
nitrogen atmosphere
Chapter 6 Kinetic degradation Kissinger and Ozawa methods
120
In the Ozawa analysis in nitrogen atmosphere the activation energy has
a maximum peak of 200 kJmol around to =06 and neither a constant
evolution nor several degradation steps are shown
Figure 634 DTG of RTM6+ZHS 30 wt in nitrogen atmosphere
Figure 635 DTG of RTM6+ZHS 30 wt in air atmosphere
Chapter 6 Kinetic degradation Kissinger and Ozawa methods
121
151 153 155 157 1591000 KT
06
08
10
12
14log (Heating rate(Kmin))
Activation Energy(kJmol) 14931 +- 1257log (As^-1) 975
Figure 636 Kissinger graphs for RTM6+ZHS 30 wt data in nitrogen atmosphere
-49
-48
-47
-46
-45
-44
-43
-42
-41
00012 00014 00016 00018 0002 00022
I stepII step
y = 1713 - 10920x R= 09957
y = 11529 - 10291x R= 099916
log
(βT
max
2 )
1Tmax
Figure 637 Kissinger graphs for RTM6+ZHS 30 wt data in nitrogen atmosphere
Chapter 6 Kinetic degradation Kissinger and Ozawa methods
122
-125
-12
-115
-11
-105
-10
-95
0001 00012 00014 00016 00018 0002 00022
I stepII stepIII stepIV step
y = 30807 - 22469x R= 099707
y = 30543 - 26147x R= 099778
y = 755 - 56705x R= 099954
y = 83073 - 15323x R= 099946
ln(β
Tm
ax2 )
1Tmax
Figure 638 Kissinger graphs for RTM6+ZHS 30 wt data in air atmosphere
KISSINGER in nitrogen atmosphere
I STEP II STEP
Ea (kJmol)
908 85564
KISSINGER in air atmosphere
I STEP II STEP III STEP IV STEP
Ea (kJmol)
RTM6+ZHS 30wt
1868 2174 4715 1274
Table 67 Kissinger data for RTM6+ZHS 30wt in nitrogen and air atmosphere
Zinc hydroxystannate shows four degradation steps therefore the
degradation mechanism is particularly complex and to create the
protective layer a high energy contribution (471 kJmol) is necessary
Chapter 6 Kinetic degradation Kissinger and Ozawa methods
123
14 16 18 20 221000 KT
06
08
10
12
14log Heating rate(Kmin)
002 080
Figure 639 Ozawa analysis for RTM6+ZHS 30wt in nitrogen atmosphere
0 02 04 06 FractMass Loss
60
100
140
180
220
260
E(kJmol)
Figure 640 Energy of activation calculated with Ozawa methods for RTM6+ZHS in
nitrogen atmosphere
In the Ozawa analysis there are several steps and Ea is constant at the
value of 180 kJmol between alpha 01 to 05 and Ea increases until
Chapter 6 Kinetic degradation Kissinger and Ozawa methods
124
270 kJmol where is obtained to complete the degradation process of
degradation
63 Kinetic degradations of RTM6 and carbon nanotubes The thermal properties of CNTspolymer composites also attracted
many attentions from polymer scientists because CNTs have very high
thermal stability [10-14] Yang et al [11] reported the effect of single-
walled carbon nanotubes (SWNTs) on the thermal stability of
acrylonitrileebutadienee styrene (ABS)SWNTs composites They found
that the addition of SWNTs destabilized ABS and caused the composites
to degrade at lower temperatures Probst et al [12] revealed that
MWNTs promote the degradation of polyvinyl alcohol In contrast
Kashiwagi et al [13] observed an increased thermal stability of
MWNTspolypropylene (PP) composites The same effect of MWNTs on
PP was found by Yang et al [14] From the above publications both
promoting and hindering effects of CNTs on the thermal stability of
polymer are found The structure of the polymer matrix and the
interaction between CNTs and the matrix may be the key factors for the
thermal degradation behaviour of CNTs filled polymer composites
DTG curves of RTM6 with 01wt MWNTs under nitrogen and air
environments are showed in figures 639 and 640 respectively One
step decomposition is found under nitrogen atmosphere while two step
decomposition (second step from 450degC to 700degC) are found under air
atmosphere
Heating rate (degCmin) Tonset (degC) Tmax (degC) 5degCmin 317 376
75degCmin 334 387
10degCmin 334 391
20degCmin 348 404
Table 68 Tonset and Tmax of RTM6+MWNT 01wt in nitrogen atmosphere
Chapter 6 Kinetic degradation Kissinger and Ozawa methods
125
Figure 641 DTG of RTM6+MWNT 01wt in nitrogen atmosphere
Figure 642 DTG of RTM6+MWNT 01wt in air atmosphere
Chapter 6 Kinetic degradation Kissinger and Ozawa methods
126
147 149 151 153 1551000 KT
06
08
10
12
14log (Heating rate(Kmin))
Activation Energy(kJmol) 18936 +- 1296log (As^-1) 1269
Figure 643 Kissinger graphs for RTM6+MWNT 01wt data in nitrogen atmosphere
The Ea of neat RTM6 is found to be 164 KJmol while MWNTsRTM6
composites is found to be 189 KJmol suggesting that the MWNTs
increase the thermal stability of RTM6 under nitrogen atmosphere
-12
-115
-11
-105
-10
0001 00012 00014 00016 00018 0002
I stepII stepIII step
y = 11748 - 14660x R= 099802
y = 32132 - 97535x R= 099862
y = 38629 - 12408x R= 099656
ln(β
Tm
ax2 )
1Tmax
Figure 644 Kissinger graphs for RTM6+MWNT 01wt data in air atmosphere
Chapter 6 Kinetic degradation Kissinger and Ozawa methods
127
There are three steps although the small amount of carbon nanotubes
demonstrates that the degradation process has been altered The first
step is given by the of epoxy resin with carbon nanotubes The second
step is divided in two steps where in the first is lower than of the resin
and the second step is the pyrolysis of the char that happens with an
additional energy contribution
12 14 16 18 201000 KT
06
08
10
12
14log Heating rate(Kmin)
002 095
Figure 645 Ozawa analysis for RTM6+MWNT 01 wt in nitrogen atmosphere
In the Ozawa data a higher thermal stability than RTM6 is shown
because Ea starts by higher values but it is stable at about 200 kJmol
for alpha between 01 and 09
Chapter 6 Kinetic degradation Kissinger and Ozawa methods
128
0 02 04 06 08 FractMass Loss
60
80
100
120
140
160
180
200
E(kJmol)
Figure 646 Energy of activation calculated with Ozawa methods for RTM6+MWNT
01 wt in nitrogen atmosphere
64 Analysis of residue In the figure 647 a graph comparing dynamic measurements carried
out with scan rate of 10degCmin in air flow on all the samples tested in
this study is reported It is possible to notice that addition of zinc
compounds in the epoxy matrix does not induce big differences in the
first two stages of degradation except for the initial temperature of
degradation that increase for samples containing ZS and ZB For the
samples containing ZHS and ATH there is a difference in the first step
of degradation which occurs at around 220degC and these temperature is
characteristic of dehydration of crystallisation water For the samples
with ZS and ZB the loss of crystallisation water occur at higher
temperatures and this process is concomitant with the first step of
epoxy matrix degradation which happens in airflow at a temperature of
about 350degC and concern the dehydration of hydroxyl functions
The char oxidation stage occurs for the RTM6 neat in the temperature
range (513-627degC) instead for the samples containing flame retardant
Chapter 6 Kinetic degradation Kissinger and Ozawa methods
129
zinc compounds this range of temperature decrease It is possible to
notice larges differences for the residue of dynamic experiments carried
on samples flame retardants in oxidant atmosphere (tab 69) The flame
retardant zinc based promote char formation more efficiently at
temperatures lower than the epoxy RTM6 Zinc borate in the epoxy
matrix RTM6 induce formation of stable char at 554degC and residue is
about 32 of initial weight with weight loss in the third stage of 24
RTM6 with ZS form the char stable at the same temperature of sample
containing ZB but the residue in this case is lower than ZB (27)
Similarly RTM6 with ZHS show a residue equal at 14 lower than the
initial addition of flame retardant in the resin matrix (20) and the char
formation occurs at temperatures of 551degC
Figure 647 Comparison of additives at 10degCmin in dynamic mode and in air
atmosphere
Chapter 6 Kinetic degradation Kissinger and Ozawa methods
130
Temperature (degC)
Sample at 10
weight
loss
charring
stage
initial char
formation
weight
loss
III stage
of
char
at
800degC
RTM6 357 530-604 636 38 1
RTM6+ZS 359 492-527 555 35 24
RTM6+ZHS 356 498-530 559 40 17
RTM6+ZB 376 485-558 554 24 32
RTM6+ATH 374 509-582 628 36 9
Table 69 Analysis of last step of degradation in air flow
According to the Flynn-Ozawa-Wall analysis data it is possible to notice
that in air flow for RTM6 during the first stage of degradation occur
chain scission by thermolysis and there is the formation of thermally
more stable molecular compounds To destroy this compound it is
needed another stage of degradation that occurs with activation energy
and temperatures higher than first stage In the presence of flame
retardant compounds the second and third stage of degradation
concerns the segments of chain liberated that migrates in the surface of
samples A parts of these segments are volatiles but most of these
segments react with zinc compounds and form a layer of char stable
that delay the oxidation of matrix The sample containing ZB shows
higher efficiency of this process in the formation of char in the epoxy
matrix
Chapter 6 Kinetic degradation Kissinger and Ozawa methods
131
References [1] Regnier N Guibe C Polymer Degradation and Stability 1997
55165
[2] Regnier N Fontaine S Journal of Thermal Analysis and Calorimetry
2001 64789
[3] Kiefer R Yue J Hinkley J Journal of Advanced Materials 1995
2655
[4] Wang Q Shi W Polymer Degradation and Stability 2006 911747-
1754
[5] Chiang CL Ma CCM Wang FY Kuan HC European Polymer
Journal 2003 39825-830
[6] Kissinger HE Anal Chem 1957 291702-1706
[7] Flynn JH Wall LA J Res Nat Bur Stand A Phys Chem 1996
70A487
[8] Ozawa T Bull Chem Soc Jpn 1965 381881
[9] Doyle CD Nature 1965 207240
[10] Beyer G Fire Mater 200226(6)291-3
[11] Yang SY Castilleja JR Barrera EV Lozano K Polym Degrad Stab
200483383-8
[12] Probst O Moore EM Reasaco DE Grady BP Polymer 200454437-
43
[13] Kashiwagi T Grulke E Hilding J Harris R Awad W Douglas J
Macromol Rapid Commun 200223(13)761-5
[14] Yang J Lin YH Wang JF Lai MF Li J Liu JJ et al J Appl Polym
Sci 200598 1087-91
CHAPTER 7 CONCLUSIONS AND FUTURE PERSPECTIVES
71 Conclusions In this work the flame retardant and thermal mechanical properties of
an monocomponent epoxy resin additived with micro and nano fillers
are studied The experimental study is based on cone calorimeter
analysis and thermo-mechanical analysis and on the study of kinetic
parameters by Kissinger and Ozawa methods
Through the cone calorimeter test it has been demonstrated that the
zinc borate resulted as the best additive as it concerns the 30 and
40 percentages Furthermore the flame retardant effect of zinc borate
on the Epoxy resin neat is highlighted when it is synergistically used
with ATH instead as ZS and ZHS are concerned ZHS performs better
at the above mentioned percentages This comes up also by Kissinger
analysis (performed both in nitrogen atmosphere and in air atmosphere)
as ZHS shows two steps in nitrogen atmosphere (so as ATH does) and
epoxy resin neat shows one step In air atmosphere ZHS shows four
steps and epoxy resin neat shows two steps As the Ozawa model is
concerned the union of ZB and ATH improves the activation energy
From the residue analysis we can notice that ZB is the best additive
both regarding the char-formation temperature both regarding the
morphology
Thermo-mechanical analysis shows that all the additives provide an
improvement of the composites thermal expansion coefficient such as it
decreases upon the addition of additives respect to the neat resin
About nanotubes the used percentage is too low to observe any
meaningful effects in all of the analyses undertaken in this study
To conclude zinc borate is in the light of all performed analyses the
best additive the percentages where the effect of the additive can be
sensibly observed are 30 and 40
Chapter 7 Conclusions and future perspectives
133
72 Future Perspectives From our conclusions it is possible to suggest further studies on ZHS
and on its synergistic effect and an investigation on a possible synergy
between the used additives and the nanotubes As for nanotubes they
should be chosen with a higher statistical percolation threshold so to
use a higher additivation percentage
Moreover an interesting topic for future work is the comprehension of
the degradative mechanisms related to additives in terms of their
chemical properties and their interaction with the resin This study can
be carried out by means of FTIR and XRD analysis The study of the
actual mechanisms of degradation during the different heating steps
could lead to a better knowledge of kinetic parameters of the composite
systems
About fibres reinforced resin composites the study of the effects of
different lay-up methods on the thermal properties of the additivated
composites could lead to the improvement of their flame retardant
properties
- 1pdf
- 2cpdf
- 3bpdf
- 4pdf
- 5pdf
- 6pdf
- 7pdf
- 8bpdf
- 9pdf
- 10bpdf
- 11pdf
-
Chapter 1 Introduction
7
The heat release rate (HRR) is a quantitative measure of the amount
of thermal energy released by a material per unit area when exposed to
a fire radiating a constant heat flux (or temperature) and his unit is
kWm2 The heat release rate value of a composite material is
determined by the thermal energy liberated in several thermo-chemical
decomposition processes with the most important being exothermic
combustion at the compositeflame boundary of flammable gas
products released by the decomposing polymer matrix and (if present)
organic fibres Two parameters describe the heat release rate average
HRR and peak HRR The average heat release rate is the averaged
value over a certain period of time (usually three or five minutes) The
peak heat release rate is the maximum amount of heat liberated by a
material during the combustion process and it often occurs over a very
short period of time (less than a few seconds) The peak heat release
rate is considered a critical property controlling the maximum
temperature and flame spread rate
Time to ignition (TTI) is the period that a combustible material can
withstand exposure to a constant radiant heat flux before igniting and
undergoing sustained flaming combustion
Flame spread rate describes the speed at which the flame front will
travel over the surface of a combustible material The flame spread rate
is an experimentally measured value and various experimental
techniques with important differences in test configuration are used
Some tests are used to measure the rate of flame spread in a downward
direction while other techniques measure it in a vertical or inclined
direction Consequently the value for flame spread rate is test-
dependent Oxygen index is defined as the minimum oxygen content in
the fire environment required to sustain flaming combustion of a
material Materials with high oxygen index values should be used in
high fire risk applications particularly for internal structures and
components because they offer the potential to self-extinguish when
the fire becomes deprived of oxygen
Chapter 1 Introduction
8
Two other important fire reaction properties are smoke density and gas
toxicity because they have a major impact on the ability of humans to
survive a fire Smoke density is defined and measured in several ways
but basically it is the concentration of smoke particles (eg soot water
vapour) within the plume of a fire Gas toxicity is a generic term that
describes the concentration and lethality of gas products within the
smoke plume
While many fire reaction properties are important in the development of
fire up to the point of flashover the fire resistant properties are critical
when the fire has fully developed
Fire resistance defines the ability of a material or structure to impede
the spread of fire and retain mechanical integrity In other words fire
resistance describes the ability of a construction to prevent a fire from
spreading from one room to neighbouring rooms Fire resistance also
describes the ability of a construction to retain structural integrity (ie
shape load-bearing properties) in a fire The main fire resistant
properties are heat insulation burn-through resistance and structural
integrity Heat insulation is simply the resistive property that describes
the rate of heat conduction through a material when exposed to fire
Obviously materials that are good heat insulators are best suited for
slowing the spread of fire from room-to-room and this is one of the
attributes of composites compared to metals Burn-through resistance
is the time taken for a flame to penetrate a material and emerge from
the opposing side Composites generally have better burn-through
resistance than metals that melt at temperatures below the flame
temperature such as aluminium alloys Mechanical integrity is
another important fire resistant property and this defines the ability of
a material or structure to retain mechanical properties such as
stiffness creep resistance and strength when exposed to fire and after
the fire has been extinguished The behaviour of composites materials
in fire is based by chemical and thermal decomposition of the matrix
used In figure 15 is showed the decomposition process of polymer
Chapter 1 Introduction
9
composites exposed to a heat flux radiated from a fire When the
material is exposed to a fire the matrix decomposes to volatile gases
solid carbonaceous char and smoke The volatiles consist of a variety of
vapours and gases both flammable as carbon monoxide methane low
molecular organics and non flammable as carbon dioxide and water
The flammable volatiles extend from composites material into the flame
zone where they react with oxygen and lead to the formation of the final
combustion products accompanied by the liberation of heat
Figure 15 The decomposition mechanisms of composites materials
Several analytical technique can be used to characterise the
decomposition reactions and the chemical nature of the reaction
volatiles of polymers The three important technique are TGA in which
the weight loss is measured with increasing temperature or time
differential scanning calorimetry (DSC) in which heat absorption or
evolution due to chemical changes of the polymer are measured and
gas chromatographymass spectrometry (GCMS) in which the
chemical composition of the volatile gases are determined Other
methods may also be used including thermal volatilisation analysis
(TVA) and differential thermal analysis (DTA) It is often necessary to
use a combination of methods to obtain a complete understanding of
the decomposition reaction rate reaction mechanisms volatile gases
and char yield
Chapter 1 Introduction
10
12 Fire test for composites materials
A large quantity of information is available on the fire reaction
properties of polymer composites and the level of fire hazard associated
with their use is known for a large number of materials We also have a
good understanding of the chemical thermal and physical mechanisms
that control reaction properties such as time-to-ignition heat release
rate flame spread rate smoke production and toxicity
In short we have quite a good quantitative understanding of the fire
reaction behavior of composites Unfortunately less is known about the
fire resisting properties such as burn-through resistance dimensional
stability and structural integrity especially when the structure is under
load Moreover it is not usually possible to estimate the fire resistive
behavior based solely on the known fire reaction properties A
composite that has good fire reaction properties such as low heat
release rate and smoke yield may not necessarily have good fire
resistive properties Composites with a polymer matrix having high
thermal stability decomposition temperature and char yield may not
necessarily have better fire resistive properties than more flammable
materials
The first fire test was developed in the early twentieth century and over
the last one hundred years a large number of tests have been used to
characterise the fire properties of combustible materials The number of
tests available to characterise fire reaction is now immense For
example the American Society for Testing and Materials (ASTM) have
over 80 fire test standards in the 1999 edition of their handbooks on
testing standards The standards are applicable to a wide range of
materials including building products woods plastics and other
combustible materials None of the ASTM fire standards are specific to
polymer composites but are instead generic to a wide range of
materials The ASTM is one of many international standardisation
organisations that publish fire test methods Not all of the tests of
Chapter 1 Introduction
11
course are relevant for testing composites many tests are only suitable
for evaluating building materials woods or some other type of
combustible material Only a relatively small number of tests are
suitable for determining the fire properties of composite materials or
structures
Experimental techniques used to measure the fire properties of
composites range in size from bench-top apparatus for testing small
specimens weighing only a few grams up to full-scale tests for large
structures
Regardless of scale it is important that fire reaction tests are performed
in conditions that closely replicate the type of fire to which the
composite will be exposed These fires range in heat flux from low
intensity fires were the radiant heat flux is under 20 kWm2 to intense
fires were the heat flux can exceed 150 kWm2
The range of test methods for determining the fire reaction and fire
resistive properties of composites is clearly very diverse although some
attempts are now being made to rationalize this situation The tests
vary in scale and complexity and considerable care must be exercised
when selecting the most appropriate procedure Most fire reaction
testing is performed using bench-scale apparatus because of the lower
cost and greater simplicity Test methods such as the cone calorimeter
OSU calorimeter and radiant flame spread technique have an excellent
track record and are widely used for determining the fire behaviour of
composites However the problem of scaling-up from small-scale test
results to fire performance of large structures in real fires is a major
difficulty
Problems common to bench-scale tests are that the ignition heating
and atmospheric (oxygen content) conditions are not representative of
an actual fire The growth and spread of fire cannot be accurately
replicated using these tests and it is usually not possible to achieve
flashover Further the specimens are rarely tested in the end-use
condition
Chapter 1 Introduction
12
Large-scale fire tests such as the room calorimeter avoid many of the
problems associated with small size and allow the composite article to
be tested in the end-use condition However large fire tests are
generally slow and expensive to perform and may only produce data
relevant to one particular situation [4]
It is also important to recognise that no single test method is adequate
to evaluate all the fire properties of a composite Table 11 lists the
properties that can be determined using the test methods Of these it is
those methods capable of determining the heat release rate that are
most important when characterising the fire reaction of composites
While a few methods have the capability to determine the heat release
rate together with several other properties it is necessary to use two or
more methods to obtain a complete understanding of the fire behaviour
of a composite material
Table 11 The decomposition Fire reaction properties measured using test methods
Chapter 1 Introduction
13
References [1] HIngason Two dimensional rack storage fires Proceedings of the
Fourth International Symposium on Fire Safety Science 19941209-
1220
[2] KS Mudan and PA Croce Fire hazard calculations for large open
hydrocarbon fires in SFPE Handbook of Fire Protection Engineering
ed PJ DiNenno et al 1995 2-13
[3] H Inganson and J de Ris Flame heat transfer in storage
geometries Journal of Fire Safety 1997
[4] Mouritz AP Gibson AG Fire Properties of Polymer Composite
Materials Springer
CHAPTER 2 MATERIALS
21 Thermosetting resin RTM6 Epoxy resins are used worldwide on a large scale for adhesive
lamination coating casting applications and contain a very large
number of chemical types All such resins rely on the reactivity of the
three member epoxy group at both ends of the molecule Other more
complex types of epoxy resins are employed when a higher level of
functionality is needed ie when a grater number of cross-linking points
per epoxy group (fig21) is required as for instance in some of the
higher performance resins used in aerospace Traditionally epoxy
resins are cured by reacting them with amines or anhydrides these
materials being known as ldquohardenersrdquo There are also catalysts that will
polymerise the resin via the end groups and hydroxyls without the need
for a hardener
Figure 21 Epoxy group
Many epoxy resins and hardeners are viscous or even solid at room
temperature and may require preheating or dilution to lower their
viscosity prior to processing into composites Further heating
sometimes to temperatures up to 150-180degC is often needed to promote
resin gelation and curing Nevertheless epoxies are used in all the
traditional composite processes including wet laminating resin
transfer moulding and filament winding Decomposition of most epoxies
occurs via random chain scission reactions over the temperature range
of about 380 to 450degC
Chapter 2 Materials
15
HexFlowreg RTM6 provided by Hexcel is a premixed monocomponent
epoxy resin system specially developed to fulfil the requirements of the
aerospace and space industry in advanced resin transfer moulding
processes (RTM) The expected service temperatures of final products
range from -60degC to 180degC At room temperature RTM6 is a transluced
paste and its viscosity drops very quickly upon heating The uncured
resin has a density of 1117 gcm3 and the fully cured resin 1141
gcm3 When fully cured it exhibits high glass transition temperatures
excellent hot wet properties and low moisture absorption According to
the manufacturer the shelf life of this resin at 23degC is at least 15 days
whereas at -18degC it is approximately 9 months [1]
The main advantage of this epoxy resin called RTM6 is that it is a
monocomponent system and is already degassed and its properties are
reported in table 21
Epoxy resin RTM6
Tg0 -11degC
Tginfin 190degC
Density uncured resin (gcm3) 111 at 25degC
Density cured resin (gcm3) 114 at 25degC
Table 21Properties of monocomponent epoxy resin
In figures 22 and 23 are reported the molecule from which RTM6
derives carbon glycidyl diamino-diphenyl-methane (TGDMM) and the
molecule-diamino-diphenyl sulfone (DDS) as agent crosslinker
Chapter 2 Materials
16
Figure 22 Formula of structure of TGDDM
Figure 23 Formula of structure of DDS
211 Characterization of RTM6
To define the parameters of resin process a preliminary screening by a
kinetic analysis by differential scanning calorimeter (DSC) is necessary
to understand the mechanisms with which the molecules inside the
composites are organized depending on the temperature variations In
figure 24 and 25 the kinetic analysis dynamical and isothermal of
epoxy resin RTM6 neat are reported
Chapter 2 Materials
17
-05
0
05
1
15
2
25
-100 0 100 200 300 400
10degCmin75degCmin5degCmin25degCmin1degCmin
Hea
t flo
w W
g
TemperaturedegC
Figure 24 Dynamic analysis of RTM6 neat
-01
0
01
02
03
04
05
06
07
0 50 100 150 200 250 300 350 400
120degC140degC160degC180degC190degC200degC
Hea
t flo
w W
g
Time min
Figure 25 Dynamic analysis of RTM6 neat
The dynamical analysis (fig24) show that the reticulation peak has a
maximum at the temperature 241degC and a energy amounted to 470Jg
From the data of the isotherm analysis (fig25) it is clear that curing for
90 minutes at 160degC results in a cross-linking of molecules equal to
Chapter 2 Materials
18
83 In addition to obtain a complete cross-linking there should be a
next step of treatment at a temperature greater than 160degC but that
does not exceed the value of glass transition temperature of 196degC
The choice of temperature for the second step of treatment was 180degC
because the isothermal measure carried out this value of temperature is
slow enough to allow the molecules to rearrange within the matrix
partially cured before completing the reaction
22 Micro materials Introduction on flame retardants Flame retardation is a process by which the normal degradation or
combustion of polymers is altered by addition of certain chemicals
Some plastics are inherently fire retardant or smoke retardant and their
fire performance is acceptable for certain applications However [2] for
many plastic materials it is necessary to improve their fire performance
by incorporating flame retardants
Flame retardants are chemical agents which are added to combustible
materials to make them more resistant to ignition and they are intended
to minimise the risk of a fire starting in case the contact with a small
heat source Hence the term ldquoflame retardantsrdquo describe a function and
not a chemical class and their aim is to break the cycle of self-
combustion of polymeric materials reducing the speed of chemical and
physical process that develop Often they are applied in combinations
and this variety of products is necessary because the materials are very
different in nature and composition
Flame retardants interfere with combustion processes during a
particular stage of this process during heating decomposition ignition
or flame spread and the amount of flame retardant one has to add to
achieve the desired level of fire safety can range from less than one
percent for highly effective flame retardants up to more than 50 percent
for inorganic fillers but typical ranges are 5 to 20 percent by weight
Chapter 2 Materials
19
Flame retardants acting by chemical and physical actions which are
divided into
bull Chemical action
1 Reaction in the gas phase The radical gas phase
combustion process is interrupted by flame retardant
resulting in cooling of the system reducing and eventually
suppressing the supply of flammable gases
2 Reaction in the solid phase (fig26) The flame retardant
builds up a char layer and shields the materials against
oxygen and provides a barrier against the heat source
(flame)
Figure 26 Reaction in the solid phase
bull Physical action (fig27)
1 Cooling Energy absorbing (endothermic) processes
triggered by additives and the chemical release of water cool
the substrate of material to a temperature below that
required for sustaining the combustion process
2 Formation of a protective layer (coating) The material is
protected with a solid or gaseous protective layer and
protected from heat and oxygen necessary for the
combustion process
3 Dilution Inert substances and additives evolving non-
combustible gases dilute the fuel in the solid and gaseous
phases
Chapter 2 Materials
20
Figure 27 Physical action of flame retardant
Flame retardants can be placed into the polymer material or by reacting
chemically with the polymer (reactive mode) or by mixing (additive
mode) or in both modes The choice of a flame retardant must be based
on the knowledge its toxicity action and its impact on environment The
main categories of flame retardants are based on compounds containing
(fig 28)
1 Halogens (Bromine and Chlorine)
2 Phosphorus
3 Nitrogen
4 Inorganic compounds Minerals (based on aluminium and
magnesium)
5 Borates and Stannates
6 Intumescent systems
Figure 28 Classes of flame retardant
Chapter 2 Materials
21
Flame retardants work in a number of different ways in fact some flame
retardant are effective on their own but other are used mainly as
ldquosynergistsrdquo acting to increase the effect of other types of flame
retardants Almost all flame retardants generate a stable carbonaceous
barrier called ldquocharrdquo which protects and at the same time cools the
surface of the material
Halogenated flame retardants when exposed to high temperatures
release bromine (Br) or chlorine (Cl) as free radicals (Br- or Cl- ) which
react with hydrocarbon molecules (flammable gases) to give HBr or HCl
These then react with the high-energy H+ and OH- radicals to give water
and the much lower energy Br- or Cl- radicals which are then available
to begin a new cycle of H+ and OH- radical removal They act by
effectively removing the H+ and OH- radicals in the gas flame phase thus
reducing heat generation and so the production of further gaseous
flammable materials
Phosphorus-containing flame retardants when heated reacts to give
a polymeric form of phosphoric acid This acid crates a glass layer (char)
on the surface of the material and inhibits the pyrolysis process which
is necessary to feed flames Char plays an important role in fact it acts
as a two-way barrier that both prevents the passage of the combustible
gases and shields the polymer from the heat of the flame
A wide range of different phosphorus based flame retardants is
available including elemental red phosphorus which is oxidised to
phosphoric acid with heat ammonium polyphosphate melamine
polyphosphate phosphonates phosphinates and phosphate esters
Nitrogen-containing flame retardant (pure melamine and derivates)
are believed to act by several mechanisms In fact in the condensed
phase melamine is transformed into cross-linked structures which
promotes char formation releasing ammonia In conjunction with
phosphorus the nitrogen appears to enhance the attachment of the
phosphorus to the polymer A mechanism in the gas phase may be the
Chapter 2 Materials
22
release of molecular nitrogen which dilutes the volatile polymer
decomposition products
Antimony trioxide does not have flame retarding properties of its own
but is an effective synergist for halogenated flame retardants It acts as
a catalyst facilitating the breakdown of halogenated flame retardants
into active molecules It also reacts with the halogens to produce
volatile antimony halogen compounds which are themselves directly
effective in removing the high energy H+ and OH- radicals which feed
the flame phase of the fire thus reinforcing the flame suppressing effect
of the halogenated flame retardants When added to PVC antimony
trioxide acts to suppress flames by activating the chlorine present in the
plastic itself
Inorganic compounds are used as flame retardants interfering through
various physical processes with the burning process release of water or
non-flammable gases which dilute the gases feeding flames absorption
of heat energy thus cooling the fire production of a non-flammable and
resistant layer on the surface of material (char) These mechanisms of
inorganic compounds are however of a relatively low efficiency and the
products have to often be used in large concentrations or more usually
in combination with other types of flame retardants
Boron containing compounds act through the stepwise release of
water and the formation of a glassy coating protecting the surface Zinc
borate in halogen-free systems is normally used in conjunction with
aluminium trihydrate magnesium hydroxide or red phosphorus Zinc
stannate and zinc hydroxystannate are used to reduce smoke emission
from PVC to promote charring or as synergists to increase the
effectiveness of halogenated or nitrogen flame retardants
Finally intumescent coatings are fire protection systems which are
used to protect materials such as wood or plastic from fire but also to
protect steel and other materials from the high temperatures of fire The
coatings are made of a combination of products applied to the surface
Chapter 2 Materials
23
like a paint which are designed to expand to form an insulating and
fire-resistant covering when subject to heat
221 Zinc Borate
Zinc borate ZB (2ZnO 3B2O3 35H2O) is a multifunctional flame
retardant which can function as a flame retardant in synergy with
halogen smoke suppressant because promote char formation and
afterglow suppressant It is a synergist of chlorine and bromine-
containing flame retardants or polymers Its efficacy depends on the
type of halogen source (aliphatic versus aromatic) and the base polymer
used The zinc borate can generally display synergistic effects with
antimony oxide in fire retardancy This synergy [3] can be more
remarkable when used in conjunction with aluminium trihydrate (ATH)
or magnesium hydroxide (MDH)
Zinc borate decomposition has been studied by thermogravimetric
analyses TGA reported in figure 29 and its decomposition temperature
is about 436degC
Figure 29 TGA and DTG in nitrogen of zinc borate
Zinc borate works as an antitracking agent in both halogen-containing
and halogen-free polymers in different ways
In halogen-containing polymers
Chapter 2 Materials
24
bull Zinc borate possesses a synergistic effect with halogen sources
bull Zinc borate display synergistic effects with antimony oxide in fire
retardancy In the presence of ATH or MDH this synergy can be
augmented significantly
bull In some polymer systems zinc borate can completely replace
antimony oxide
bull In contrast to antimony oxide zinc borate is predominant in the
condensed phase and can work as a smoke suppressant
bull Zinc borate promotes char formation and prevents burning drips
The zinc oxide moiety can promote char formation with halogen
sources and B2O3 moiety can stabilize the char
bull Zinc borate can improve the thermal stability of polyamides
containing halogenantimony trioxide and improve the aged
elongation property of polyolefin
bull Improves corrosion resistance
In halogen-free polymers
bull Zinc borate are multifunctional fire retardants in halogen-free
polymers
bull When used in combination with metal hydroxides zinc borate can
work as a sintering aid to promote the formation of a strong
charceramic residue that can act as an insulator for underlying
polymer
bull Zinc borate can reduce the heat release rate smoke evolution
carbon monoxide generation and afterglow combustion
bull The use of a co-additive such as the siliconesilica melamine
polyphosphate talc or red phosphorous can increase the fire test
performance of zinc boratemetal hydroxide combination
bull Zinc borate alone can work as a flame retardant in certain
halogen-free systems
Chapter 2 Materials
25
Zinc borate used is produced by Joseph Storey amp Company LTD and its
name is Storflam ZB 2335 and its physical and chemical properties are
reported in table 22 [4]
Zinc Borate ZB
Appearance Power dust
Colour White
Molecular weight 43464
Bulk density (Kgm3) 400-700
Soluble in Acids and Bases
Solubility value (g100g
H2O20degC)
lt1
pH 7-8 (aqueous filtrate of 20
suspension)
Table 22Physical and chemical properties of zinc borate
222 Aluminium trihydrate
Aluminium trihydrate ATH (2Al(OH)3) is the most widely used flame
retardant It is an inert mineral filler a non-toxic white crystalline
powder and is included in the inorganic flame retardants It acts with
all three of mechanisms indicated in the figure 210 At around 300degC
(fig211) it is decomposed to aluminium oxide which forms a
protective non-flammable layer on the material surface and water
Chapter 2 Materials
26
Figure 210 Mechanism of Aluminium trihydrate ATH
Figure 211 TGA and DTG in nitrogen of aluminium trihydrate
Water forms a layer of non-flammable gas near the materialrsquos surface
inhibiting flames The reaction is endothermic it absorbs heat thus
cooling the material and slowing burning The water vapour produced
during ATH decomposition dilutes both the combustible gases and
oxygen in the vicinity of the flame making combustion more difficult
For smoke suppression the heat dissipation by the ATH is thought to
Chapter 2 Materials
27
aid in forming char rather than forming smoke by favouring
crosslinking reactions over soot formation The char provides a fuel-
oxygen barrier on the surface of the burning polymer
Aluminium trihydrate used in this work is produced by Dadco and
provided by Joseph Storey amp Company LTD [4] and its physical and
chemical properties are reported in table 23
Aluminium trihydrate ATH
LOI (110degC-1100degC) () 346
Specific gravity (gcm3) 24
Whiteness () gt 91
Bulk density (Kgm3) 500-700
Medium grain size diameter (μm) 40-75
Boiling point (degC) 2700 (Al2O3 decomposition
product)
Density at 20degC (gml) 242
Table 23Physical and chemical properties of aluminium trihydrate
223 Zinc Hydroxystannate
Zinc hydroxystannate ZHS (ZnSn(OH)6) is a fire retardant and a smoke
suppressant additive for polymeric materials [5] It was developed as a
smoke suppressant for PVC but later it was found that it also acts as a
flame retardant in certain plastics mainly by promoting char formation
and can usually partly substitute antimony trioxide Recent studies to
develop flame retardants formation have used inorganic tin compounds
such as zinc hydroxystannate because it is less toxic [2] The physical
and chemical properties of ZHS are reported in table 24 and it is
provided by Joseph Storey amp Company LTD [4] and its decomposition
temperature (225degC) is reported in figure 212
Chapter 2 Materials
28
Zinc Hydroxystannate
Physical state Power
Colour White
Bulk density (Kgm3) 400-500
Soluble in Strong Acids and Bases
Solubility in water ( in weight) 0003
pH 7
Table 24Physical and chemical properties of zinc hydroxystannate
Figure 212 TGA and DTG in nitrogen of zinc hydroxystannate
224 Zinc Stannate
Zinc stannate ZS (ZnSnO3) has excellent flame retardant and smoke
suppressant properties and its advantage as zinc hydroxystannate is
that it is less toxic than antimony compounds In fact ZS and ZHS are
used instead of antimony trioxide because they are less toxic [6] Zinc
stannate as zinc hydroxystannate is provided by Joseph Storey amp
Company LTD [4] and its properties are listed in table 25 and in figure
213
Chapter 2 Materials
29
Zinc Stannate
Appearance Power dust
Colour White
Bulk density (Kgm3) 400-500
Soluble in Strong Acids and Bases
Solubility value (g100g
H2O20degC) 0003
pH 7
Molecular weight 23207
Table 25Physical and chemical properties of zinc stannate
Figure 213 TGA in nitrogen of zinc hydroxystannate
Zinc hydroxystannate shows several degradation steps and different
decomposition temperatures hence its DTG is not reported
23 Nano materials Introduction on carbon nanotubes
The discovery of carbon nanotubes can be traced back to the origin of
fullerene chemistry (buckyball C60) in 1985 [7] Fullerenes have
provided an exciting new insight into carbon nanostructures built from
sp2 carbon units based on geometric architectures In 1991 Iijima [8]
Chapter 2 Materials
30
discovered carbon nanotubes (CNTs) that are elongated fullerenes where
the walls of the tubes are hexagonal carbon and often capped at each
end The nanotube is typically closed at each end by hemispherical caps
that are constituted by at least 12 pentagons According to the Euler
theorem [9] which relates the number of vertices edges and faces a
convex structure can be created by introducing a positive curvature
and therefore pentagons to close up the hexagonal lattice of the tube
(fig214)
Figure 214 Schematic of the nanotube formation
Due to the hexagonal symmetry of the carbon atoms in the graphitic
sheet different structural isomers are possible depending on how the
planar graphite sheet is folded The rolling up can be accomplished in
several different ways requiring only the matching of the dangling bonds
at each end However the nanotubes can present a different helicity
degree with respect to the tube axis Figure 215 shows the three
different possible nanotubes armchair zig zag and chiral
Figure 215 Schematic of the three different nanotubes structure
Chapter 2 Materials
31
The characteristic of helicity in nanotubes has a great relevance
affecting the physical properties that depend also on the tube diameter
[10] For example it has been shown that all the armchair tubes are
metallic whereas the zig zag and chiral tubes are either metallic or
semiconducting
The nanotubes can exist in two forms multi-walled and single-layer
(fig216) The multi-wall carbon nanotubes were the first to be
discovered They consist of concentric cylinders placed around a
common central hollow area with a constant separation between the
layers close to the graphite interlayer spacing (034 nm) Each
individual cylinder can be characterized by a different helicity and has
diameter ranging from 2 to 25 nm and length of several microns
Figure 216 Single walled and multi walled carbon nanotubes
The single walled nanotubes were synthesized in 1993 when it was
found that the addition of metals such as cobalt to the graphite
electrodes in the arc evaporation method resulted in tubes with single
layer walls [11] A single walled nanotube is close to an ideal fullerene
fiber and consists of a single layer cylinder extending from end to end
with a narrow distribution in diameter range (1-2 nm) When produced
in vapour phase the single wall nanotube can self-assemble into larger
bundles called ropes consisting of several tens of nanotubes arranged
in a one-dimensional triangular lattice It is important to observe that
the discovery of single wall tubes has been very significant allowing
Chapter 2 Materials
32
researchers to verify and test some of the theoretical predictions about
the nanotube properties
Due to the combination of size structure and topology the nanotubes
display remarkable features In particular the graphitic nature of the
nanotube lattice contributes to provide high conductivity high strength
and stiffness chemical specificity and inertness while the lattice
helicity and elasticity provide optimal electronic properties Further the
nanoscale size and the high aspect ratio are advantageous for many
applications that require large surface area to volume ratio However
due to the their very small size and often presence of defects
mechanical property characterization is a challenge Nevertheless it is
possible to imagine that their stiffness and strength are very high if one
uses graphite as reference The in-plane elastic modulus of graphite is
estimated to be 106 TPa (1061012 Pa) and the tensile stiffness as 08
TPa due to the very strong covalent C-C bonds in the plane [10]
The elastic properties evaluation of carbon nanotube has been
performed by
bull measuring their thermal vibration amplitudes
bull atomic force microscopy measurement during bending
The first technique provided the Youngrsquos modulus equal to 18 TPa
while a modulus close to 1 TPa has been determined by the second
method Further the maximum tensile strength has been determined
close to 30 GPa (30109Pa) [8] Many other observations have shown
that carbon nanotubes have other intriguing properties such as
bull high flexibility related to the ability of the carbon atoms to
rehybridize with the degree of rehybridization depending on the
strain
bull high capability to sustain strain in tension (40) without
brittleness plastic deformation or bond rupture
These features make the carbon nanotubes ideal candidates for
reinforcing fibers in polymer-based composites In particular due to
Chapter 2 Materials
33
their ability to sustain high deformations they have a significant
advantage over carbon fibers in composites for structural and strength
applications However the effective reinforcement action due to the
nanotubes hinges on the success of the preparation techniques and
stable dispersion of the nanotubes in the polymer matrix In most
cases since the nanotubes have many entanglements it is a challenge
and an unresolved issue to disperse them effectively with polymer
systems to make strong and stiff components
Carbon nanotubes have extraordinary properties that have attracted the
attention of several researchers from diverse fields Substantial effort
has been devoted to the experimental evaluation and theoretical
calculation of their physical electronic magnetic electrical and
mechanical properties
Because of their promising physical and mechanical properties the
most common commercial application of carbon nanotubes is based on
their use as filler elements for metals ceramic or polymers matrix In
particular carbon nanotubes may exhibit characteristics that can be
beneficial For example they can be used as
bull reinforcement of polymer based composite materials which
improve structural properties
bull polymer modifiers for high temperature uses
bull conductive filler in insulating polymer matrices to provide
electrostatic discharge and electromagnetic-radio frequency
interference protection
bull doping of conjugated luminescent polymers to produce active
materials for electronic applications
The use of carbon nanotubes as reinforcing systems of polymer matrix
would offer several advantages over the conventional reinforcements
including continuous and short fibers (glass carbon) In the case of
continuous fibers reinforcements the advanced composite material has
much higher mechanical properties in the direction parallel to the fibers
Chapter 2 Materials
34
or in the plane of the lamina than in the transverse direction
Furthermore since the conventional polymer processing equipment
cannot process the long continuous fibers their use is limited to simple
shapes and limited production On the other hand itrsquos established that
the fiber aspect ratio represents the critical factor affecting the resulting
structural properties of short fiber composites As the aspect ratio
increases the composite stiffness and strength increase However the
packing of short fibers in a polymer matrix is a percolation
phenomenon so the maximum packing decreases with increasing
aspect ratio (see figure 16) and may not be sufficient to manufacture a
very strong material [12]
Dispersion process of carbon nanotubes represents a very complex
phenomenon due to their natural tendency to bundle together due to
van der Walls interactions A non uniform dispersion can lead to many
defect sites and reach resin area limiting not only the efficiency of CNTs
as reinforcement filler for the polymer composite matrix [13-18] A good
dispersion and possibly the alignment of CNTs within a matrix is still a
challenge and it could play the main factor driving the diffusion of CNT
or MWCNT as nano-reinforcement on industrial scale [1718] in fact are
used several dispersion technique to separate the agglomerates into
individual nanotubes
Carbon nanotubes are another candidate as a FR additive because of
their highly elongated shape (high aspect ratio) The in situ formation of
a continuous network structured protective layer from the tubes is
critical for significant reduction in heat release rate because the layer
thus acts as a thermal shield from energy feedback from the flame [19]
231 Multi walled carbon nanotubes Nanocyl 7000
The multi walled carbon nanotubes used in this word are provided by
Nanocyl SA (Belgium) and are denominated Nanocyl 7000 This multi
walled carbon nanotubes are produced via the catalytic carbon vapour
deposition (ccvd) process Nanotubes exit the reactor with a purity of
Chapter 2 Materials
35
90 carbon to produce the 7000 grade [20] Its properties are reported
in table 26
Multi-walled carbon nanotubes (MWNTs)
Average diameter 10 nm
Length 01-10 μm
Carbon Purity 90
Table 26Properties of MWNT
Chapter 2 Materials
36
References [1] wwwhexcelcomHexFlowRTM6pdf
[2] Petsom A Roengsumran S Ariyaphattanakul A Sangvanich P
Polym Degrad Stab 2003(80)17-22
[3] Shen KK Kochesfahani S Jouffret F PolymAdvTechnol 2008
(19)469-474
[4] Data sheet provided by Joseph Storey amp Company LTD
[5] Hornsby PR Cusack PA Cross M Toth A Zelei B Marosi G
Journal of materials science 2003 (38)2893-2899
[6] Cusack PA Heer MS Monk AW Polymer Degradation and Stability
1997 (58)229-237
[7] Kroto HW Heath JR OrsquoBrien SC Curl RF Smalley RE Nature
1985 318 162
[8] Iijima S Nature 1991 354 56
[9] Ebbesen WT Physics Today 1996 26-32
[10] Ajayan PM Chem Rev 1999 (99)1787-1799
[11] Ebbesen WTCRC 1997
[12] Calvert P Nature 1999 (399)210-211
[13] Qian D Dickey EC Andrews R Rantell T Appl Phys Lett 2000
76 (20)2868-2870
[14] Park C et al Chemical Physical Letters 2002 (364)303-308
[15] Ham HT Choi YS Chung JI Journal of Col and Inter Science
2005 286 (1)216-223
[16] Salvetat JP Briggs AD Bonard JM Bacsa RR Kulik AJ Stockli
T Burnham NA Forroacute L Phys Rev Lett 1999 82 (5)944-947
[17] Jin L Bower C Zhou O Appl Phys Lett 1998 73 (9)1197-1199
[18] Choi ES Brooks JS Eaton DL Al-Haik MS Hussaini MY
Garmestani H Li D Dahmen KJ Appl Phys 2003 (94)5451-5473
[19] Kashiwagi T Du F Winey KI Groth KM Shields JR Bellayer
SP Kim H Douglas JF Polymer 2005 (46)471-481
[20] Data sheet provided by Nanocyl SA
CHAPTER 3 EXPERIMENTAL TECHNIQUES
31 Methods 311 Micro particles Mechanical stirring
The flame retardant composites were prepared by mixing the epoxy
resin RTM6 with zinc borate aluminium trihydrate zinc stannate and
zinc hydroxystannate at different percentage (5 wt 10 wt 20 wt
30 wt 40 wt) The mixing was made by using a Heidolph RZR
mechanical stirring equipment (fig 31) The additives were included
into the matrix at 400 rpm to avoid disperse the additive on the walls of
beaker [1]
Figure 31 Heidolph RZR mechanical stirring
Afterwards the mixing was continued for 10 minutes at 1050 rpm and
10 minutes at 2000 rpm and then the mixture were degassed for 30
minutes at 90degC in a vacuum oven to eliminate entrapped air and
humidity Finally the liquid system was poured in mould and cured at
160degC and 180degC respectively for 90 mins and 120 mins according to
the curing schedule sheet of the neat epoxy resin
Chapter 3 Experimental Techniques
38
The quality of dispersion of all additives into the epoxy resin after the
mixing process was observed by Scanning Electron Microscope (1450VP
LEO)
For example the SEM micrograph of zinc borate 20 wt is reported
where the dust of zinc borate (fig 32) is well dispersed into the epoxy
matrix and it maintains its original grain size Analogous behaviour is
noticed for the aluminium trihydrate zinc stannate and zinc
hydroxystannate (fig 33)
Figure 32 Scanning electron micrograph of zinc borate dust
Figure 33 Scanning electron micrograph of the composite of RTM6 and ZB 20wt
312 Nano particles Sonication
The nanocomposites were prepared by using sonication process (fig
34) for a constant time (1 hour) at temperature of 120degC with the
Chapter 3 Experimental Techniques
39
MWNTs content of 01 fraction by weight We selected this process
and this percentage of carbon nanotubes by previous studies and
experimental analysis that we conducted [2] All the obtained samples
were then degassed in vacuum oven at 90degC for 30 min and then cured
considering an identical temperature cycle (1 h at 160degC followed by 2 h
at 180degC) according to the specified curing schedule
Figure 34 Misonix Sonicator S3000
The SEM micrograph of fracture surface of multi walled carbon
nanotubes into the epoxy resin was obtained by fragile failure of
nitrogen cooled samples and this surface is reported in figure 35 at
different level of magnitude
Figure 35 SEM images of fracture surface of specimen taken at different magnitudes
(1 μm-300 nm)
Chapter 3 Experimental Techniques
40
The nanotubes reported in figure 35 are present and well separated
each other showing a good level of adhesion with the matrix in fact it
appears a satisfactory uniformity of single or agglomerated of nanotube
313 Vacuum infusion process
The vacuum infusion process (VIP) is a technique that uses vacuum
pressure to drive resin into a laminate Materials are laid dry into the
mould and the vacuum is applied before resin is introduced One a
complete vacuum is achieved resin is literally sucked into the laminate
via carefully placed tubing This process is aided by an assortment of
supplies and materials Vacuum infusion provides a number of
improvements over traditionally vacuum bagged parts These benefits
include
bull Better fiber-to-resin ratio
bull Less wasted resin
bull Very consistent resin usage
bull Unlimited set-up time
bull Cleaner
The samples were obtained by a preform of 8 plies of overlaid
unidirectional carbon fibres at zero degrees We chose 20x20cm
samples
Operations to prepare the samples are
1 Cleaning mould with acetone
2 Application of realising agent to make the mould hydrophobic
The realising agent used in this work is LOCTITEreg FREWAX
FREKOTEreg and adheres to the surface of the mould creating a
barrier between materials and mould
3 Application of sealing tape GS AT200Y This tape is softened by
temperature so to enable the perfect adherence of the bag to the
plate while maintaining the vacuum (figs 36a)-b))
Chapter 3 Experimental Techniques
41
Figures 36 Application of sealing tape a) and position of carbon plies b)
4 Application of ldquopeel plyrdquo under and over the carbon fibres plies to
avoid damage to the composite surface in the successive phases
(fig 37) The peel ply used in this work is RELEASE EASE
234TFP and it is provided by Airtech It is also placed on the
aspiration pipe because it allows to keep the vacuum
Figures 37 Application of ldquopeel plyrdquo
5 Application of ldquobreather and bleederrdquo provided by Airtech It is the
AIRWEAVEreg Super and it is useful to ensure the vacuum
distribution When the panels of epoxy resin are micro and nano
additived the breatherbleeder is placed only beside the carbon
Chapter 3 Experimental Techniques
42
fibres plies because it doesnrsquot absorb the additives but it
guarantees the vacuum distribution (fig 38)
Figures 38 Application of ldquobreatherbleederrdquo
6 Application of ldquonetworkrdquo (fig 39) to facilitate the advancement of
the resin flow in the mould
Figures 39 Application of ldquonetworkrdquo
7 Application of a vacuum bag (figs 310a)-b)) that is sealed by
sealing tape
Chapter 3 Experimental Techniques
43
Figures 310 Application of vacuum bag a) and creation of vacuum b)
At the end the vacuum is applied and a compaction of the different
layers is obtained (fig 310b)) and the breather allows the vacuum to
spread throughout the mould
32 Characterization 321 Cone Calorimeter
The cone calorimeter has become one of the most important and widely
used instruments for the research and development of fire retarded
polymeric materials The cone calorimeter is a performance-based
bench scale fire testing apparatus [3-7]
The cone calorimeter provides comprehensive insight into not only fire
risks such as heat release rate total heat release and time to ignition
but also fire hazards such as smoke release and CO production Cone
calorimeter investigations can be used as a universal approach to
ranking and comparing the fire behaviour of materials
However each experimental setup defines a specific fire scenario As is
typical for all fire tests samplesrsquo performance in the cone calorimeter
depends on the specific characteristics of the test including ignition
source ventilation irradiance (external heat flux) temperature and the
geometry of the specimen
Chapter 3 Experimental Techniques
44
The cone calorimeter test characterizes the performance resulting from
an interaction of material properties specimen and the defined fire
scenario
Lower external heat fluxes such as below 20 kWm2 target ignition and
flammability whereas higher external heat flux such as 50 kWm2
target flame spread and combustion properties The relevant and active
mechanisms can change significantly Hence the external heat flux
influences the conclusions implied by the cone calorimeter studies The
frequently used irradiances of 35 kWm2 or even 50 kWm2 deliver
reproducible results for forced flaming conditions with respect to flame
spread and combustion properties (fig 311)
Figure 311 Schematic diagram of the cone calorimeter
The main capability of the instrument is that the heat release response
of a burning material can be measured continuously to a high degree of
accuracy and values for peak and average heat release rate can be
determined The technique can also be used to measure time to ignition
time of sustained flaming effective heat of combustion smoke density
soot yield mass loss rate and yield of CO CO2 and other combustion
Chapter 3 Experimental Techniques
45
gases The only fire reaction property that cannot be directly determined
is the flame spread rate
Specimens tested within the cone calorimeter are flat plates that are
100mm long 100mm wide and up to 50mm thick The specimen is
placed inside a sample holder lined with a low-density refractory
material to minimise heat losses from the unexposed face It is also
necessary to insulate the specimen sides to minimise edge burning
which can give an artificially high heat release rate The sides of
composite specimens should also be sealed and insulated to avoid the
escape of volatile gases from the edges which can also affect the fire
reaction properties During fire testing the mass loss of the specimen is
recorded continuously using a load cell located beneath the sample
holder
The top surface of the specimen is positioned 25mm from the cone
heater (fig312)
Figure 312 Positioning of the sample
A spark igniter may be placed mid-way between the sample and heater
and is used to ignite combustible gases released from the thermally
decomposing material when the concentration reaches the critical level
needed to sustain flaming Most fire tests on composites are performed
Chapter 3 Experimental Techniques
46
using the igniters although it is possible not to use the igniters to study
the effect of auto-ignition on the reaction properties
During fire testing (fig313) a constant flow rate of air at 24 litres per
second is maintained in the heating chamber
This air flow rate is needed to force all the gaseous combustion
products released by the burning specimen up through the orifice of the
cone heater and into the gas exhaust system above the heating
chamber As the entrained air and combustion products enter the
exhaust system they are thoroughly mixed to avoid stratification of the
gases that can cause inaccurate heat release smoke or toxic gas
measurements
Figure 313 Burning of sample
In this work the combustion tests [8] according to ASTM E 1354-04
are carried out with irradiance of 50 kWm2 for samples of a thickness
between 6-8mm and size 100times100mm using the cone calorimeter
produced by Fire Testing Technology Ldt (fig 314)
Chapter 3 Experimental Techniques
47
Figure 314 Cone calorimeter provided by Fire Testing Technology Ldt
The information provided by cone calorimeter are
bull Time to ignition (TTI) which corresponds to the period that a
combustible material can withstand when exposed to a constant
radiant heat flux before igniting and undergoing sustained
flaming combustion
bull Mass lost different between the initial and final mass of the
sample
bull Heat Release Rate peak (pHRR) average (HRR avarage) and Time
To Peak (TTP) are a quantitative measure of the amount of
thermal energy released by a material per unit area when exposed
to a fire radiating at constant heat flux (or temperature)
bull Mean COCO2 Yield the average return of CO and CO2 related to
the mass of the sample
bull Total Heat Evolved (THR)
bull Total Smoke Released (TSR)
322 Scanning Electron Microscope
The Scanning Electron Microscope (SEM) is a microscope that uses
electrons rather than light to form an image (fig 315) The SEM has a
large depth of field which allows a large amount of the sample to be in
focus at one time The SEM also produces images of high resolution
Chapter 3 Experimental Techniques
48
which means that closely spaced features can be examined at a high
magnification The combination of higher magnification larger depth of
focus greater resolution and ease of sample observation makes the
SEM one of the most heavily used instruments in research areas today
The SEM is designed for direct studying of the surfaces of solid objects
By scanning with an electron beam that has been generated and
focused by the operation of the microscope an image is formed in much
the same way as a TV The SEM allows a greater depth of focus than the
optical microscope For this reason the SEM can produce an image that
is a good representation of the three-dimensional sample
The SEM uses electrons instead of light to form an image A beam of
electrons is produced at the top of the microscope by heating of a
metallic filament The electron beam follows a vertical path through the
column of the microscope It makes its way through electromagnetic
lenses which focus and direct the beam down towards the sample Once
it hits the sample other electrons (backscattered or secondary) are
ejected from the sample Detectors collect the secondary or
backscattered electrons and convert them to a signal that is sent to a
viewing screen similar to the one in an ordinary television producing an
image
Figure 315 Scanning Electron Microscope
Chapter 3 Experimental Techniques
49
When a SEM is used the column and sample must always be at
vacuum A vacuum environment means that most of the air molecules
have been removed from the inside of the microscope
Since the SEM uses electrons to produce an image most conventional
SEMs require that the samples be electrically conductive The sputter
coater uses argon gas and a small electric field The sample is placed in
a small chamber which is at vacuum Argon gas is then introduced and
an electric field is used to cause an electron to be removed from the
argon atoms to make the atoms ions with a positive charge The Ar ions
are then attracted to a negatively charged piece of gold foil The Ar ions
act like sand in a sandblaster knocking gold atoms from the surface of
the foil These gold atoms now settle onto the surface of the sample
producing a gold coating
323 Thermo mechanical analysis
Thermo mechanical analysis (TMA) is a well-known technique [9] that
measures linear or volumetric changes as a function of time
temperature and force TMA is the measurement of materials behaviour
expansion and or contraction as a function of an applied load or
temperature A scan of dimensional changes related to time or load
provides invaluable information about the samples mechanical
properties Most analyses are presented in the form of the coefficient of
thermal expansion
dL(dTL0)=CTE (coefficient of thermal expansion)
where dL is the change in length (microm) dT is the change in temperature
(degC) and L0 is the initial length (m) Thermo mechanical analysis were
conducted using a TMA-60WS (fig316) provided by SHIMADZU
We measured the CTE of epoxy resin with additives and panels obtained
by using VIP with a force of 003N from 25degC to 250degC at 3degCmin in
Chapter 3 Experimental Techniques
50
double scan and expansion mode The sample measure 3x3x15mm in
accordance to ASTM E831-06
Figure 316 TMA-60WS
324 Thermal gravimetric analysis
Thermogravimetric analysis (TGA) (fig317) is an analytical technique
used to determine the thermal stability of a material and its fraction of
volatile components by monitoring the weight change that occurs when
a specimen is heated The measurement is normally carried out in air or
in an inert atmosphere and the weight loss is recorded as a function of
increasing temperature
Analysis of the TGA curves and DTG signals reports two temperature
bull The onset temperature (Tonset) calculated from the TGA curves by
extrapolating from the curve at the peak of degradation back to
the initial weight of the polymer
bull The temperature maximum (Tmax) calculated from the DTG curves
by extrapolating from the curve at the peak of degradation
forward to the final weight of the polymer
Chapter 3 Experimental Techniques
51
Figure 317 TGA 2920 TA Instruments
Differential thermal analysis was carried out using a TGA 2950 by TA
Instruments [10] All measurements were conducted under air or inert
atmosphere with a sample weight of about 7-8mg for each test the
heating rate was 5 75 10 and 20degCmin and the test temperature
ranged from 30degC to 800degC
Chapter 3 Experimental Techniques
52
References [1] wwwheidolphit
[2] Formicola C Martone A Zarrelli M Giordano M Dispersion of
carbon nanotubes in a monocomponent epoxy system 2008 proceeding
of AIDC workshop
[3] Schartel B Bartholmai M Knoll Some comments on the use of
cone calorimeter data Polym Degrad Stab 2005 (88)540ndash547
[4] Schartel B Hull TR Development of fire-retarded materials-
Interpretation of cone calorimeter data Fire and materials 2007
(31)327ndash354
[5] Fire Testing Technology Userrsquos Guide for the Cone Calorimeter
February 2000
[6] Grant GB Quick operation procedure for the cone calorimeter Unit
of fire safety engineering Edinburgh University 2nd edition January
1993
[7] Babrauskas V and Grayson SJ Heat Release in Fires Elsevier
Applied Science 1992
[8] Committee E0521 on Smoke Combustion Products ASTM 1354-03
Standard test methods for heat and visible smoke release for materials
and products using an oxygen consumption calorimeter ASTM 10
February 2003
[9] wwwshimadzuit
[10] wwwtainstrumentscom
CHAPTER 4 FLAME RETARDANT OF EPOXY RESIN WITH
INORGANIC COMPOUNDS
41 The state of the art on flame retardant of inorganic
compounds Flame retardants are chemical agents which are added to combustible
materials to make them more resistant to ignition and they are intended
to minimise the risk of a fire starting in case of contact with a small
heat source
Inorganic flame retardant as zinc borate aluminium trihydrate zinc
stannate and zinc hydroxystannate are used in this study because they
have shown very low toxicity they are compatible with a variety of flame
retardants while acting as smoke suppressants for various polymer
systems Synergistic effects are envisaged when these smoke
suppressants are combined with conventional flame retardants andor
nanoclays Recent studies to develop flame retardants formation have
used inorganic compounds because they have less toxicity Bourbigot et
al [1] demonstrated that zinc borates are useful synergistic agents in
Ethylene vinyl acetate EVA and aluminium trihydrate ATH and
magnesium hydroxide Mg(OH)2 formulations and that they act as smoke
suppressant Moreover they demonstrated that zinc borate develops a
vitreous protective residual layer which reduces the combustion rate
Carpentier et al [2] studied the synergistic effect of zinc borate on EVA8
filled with magnesium hydroxide (MH) by LOI cone calorimeter and
TGA Solid-state NMR was employed to study the carbon in the residues
collected after thermal treatment It is suggested that zinc borate slows
the degradation of the polymer and creates a vitreous protective
Chapter 4 Flame retardant of epoxy resin with inorganic compounds
54
residual layer which could act as a physical barrier and a glassy cage
for polyethylene chains
Wu et al [3] studied the synergistic flame retarding effect of ultrafine
zinc borate on LDPEIFR based on LOI UL94 test and cone calorimeter
and established that the flame retardancy is improved when
incorporating zinc borate to LDPEIFR system in fact HRR THR and
mass loss is reduced significantly
Petsom et al [4] described a study on zinc hydroxystannate and zinc
stannate in combination with 12 bis-tribromophenoxy ethane (BTBPE)
to increase flame retardancy and reduce smoke emission in an
acrylonitrile-butadiene-styrene (ABS) copolymer They concluded that
the combination of tin compounds and BTBPE was found more effective
as flame retardant than the individual components when used alone
Cusak et al [5] found that zinc hydroxystannate is a good synergist
alternative to antimony trioxide particularly with regard to reducing
heat release rates and smoke generation They demonstrated that ZHS
is the best alternative synergist to Sb2O3 in halogen-containing
polyester resins
Ning et al [6] studied the effects of zinc borate aluminium trihydrate
and their mixture on the flame retardant and smoke suppressant
properties of polyvinyl chloride PVC as well as their mechanism for
flame retardancy and smoke suppression They concluded that ZB and
ZB-ATH reduced the activation energy of PVC and their mixture had a
good synergistic effect on the flame retardance and smoke suppression
of PVC
Itrsquos clear that different authors [1-11] analyzed the fire and smoke
behaviour of zinc borate zinc stannate aluminium trihydrate zinc
hydroxystannate and their synergist effect in thermoplastic matrix or in
thermosetting bi-component matrix
Chapter 4 Flame retardant of epoxy resin with inorganic compounds
55
42 Cone calorimeter test Cone calorimeter represents a small-scale testing configuration which
provides important correlating parameters with real fire scenario data
obtained from cone calorimeter can provide plentiful information on fire
scenario material behaviour [12]
The values provided by cone calorimeter are mainly Time To Ignition
(TTI) which corresponds to the period that a combustible material can
withstand when exposure to a constant radiant heat flux before igniting
and undergoing sustained flaming combustion Heat Release Rate peak
(pHRR) average (HRRavarage) and Time To Peak (TTP) are a
quantitative measure of the amount of thermal energy released by a
material per unit area when exposed to a fire radiating at constant heat
flux (or temperature) Total Heat Evolved (THR) Total Smoke Released
(TSR)
Cone calorimeter tests were performed using a Fire Testing Technology
Ldt cone calorimeter according to the ASTM E1354-04 procedure
Samples with nominal dimensions of 100x100x7 mm were tested
horizontally under an incident flux of 50 kWm2 This level was chosen
as it corresponds to the evolved heat during a fire
421 Flame retardant of epoxy resin with inorganic compounds
The composite flame retardant were prepared by mixing the epoxy resin
RTM6 with zinc borate aluminium trihydrate zinc stannate and zinc
hydroxystannate at different percentage (5 wt 10 wt 20 wt 30
wt 40 wt) using a Heidolph RZR mechanical stirring equipment
(Chap 3)
Cone calorimeter data reported in tables 41 and 42 show that the
presence of zinc borate at 5 and 10 wt does not change substantially
the flame behaviour of the matrix as drawn by analysing the time to
ignition and heat release rate peak values Instead the presence of zinc
borate at 20 30 40 wt induces the flame retardant effect as
Chapter 4 Flame retardant of epoxy resin with inorganic compounds
56
supported by the recorded values of pHRR and HRR average The cone
calorimeter data reported in table 41 are averaged over two replicate
experiments
Samples
TTI
(s)
pHRR
(kWm2)
HRR
average
(kWm2)
TTP
(s)
THR
(MJm2)
TSR
(m2m2)
RTM6
neat 43 702 382 290 189 9260
RTM6+ZB
5wt 48 523 265 297 176 8282
RTM6+ZB
10wt 44 682 354 325 1842 8442
RTM6+ZB
20wt 49 428 251 455 188 9275
RTM6+ZB
30wt 47 396 193 65 186 10296
RTM6+ZB
40wt 63 315 148 82 161 7474
Table 41 Main cone calorimeter parameters evaluated for RTM6 epoxy with ZB at
different percentage
Samples ΔTTI
(s)
ΔpHRR
(kWm2)
FIP
(kWm2s)
FIGRA
(kWm2s) RTM6
neat _ _ 1632 242
RTM6+ZB
5wt 5 179 1079 175
RTM6+ZB
10wt 1 20 155 209
RTM6+ZB
20wt 6 274 861 094
RTM6+ZB
30wt 4 306 842 609
RTM6+ZB
40wt 20 387 5 384
Table 42 Parameters calculated by cone calorimeter data for RTM6 epoxy with ZB at
different percentage
Chapter 4 Flame retardant of epoxy resin with inorganic compounds
57
Where FPI and FIGRA are respectively pHRRTTI (kWm2s) and
pHRRTTP (kWm2s)
Decreasing values for the pHRR and HRR average may be correlated
with the formation of a char layer over the surface of tested sample
during the combustion process
A visual inspection of the final residual sample reports the presence of
the char layer (fig 41)
In figure 41 the HRR peak of RTM6ZB 10 wt system is higher than
corresponding peak for the ZB 5 wt system this curversquos behaviour
could be attributed to a local instability of the heat flux during the test
which lead to a wider cracked area and therefore a localised
combustion growth
Figure 41 HRR curves of RTM6ZB at different percentage
Whereas the aluminium trihydrate shows a negative effect as showed
by preliminary thermo-gravimetric analysis probably due an
acceleration of decomposition of the epoxy resin the presence of ATH
from 20 to 40 wt reduced the HRR peak and the HRR average (fig
42)
Chapter 4 Flame retardant of epoxy resin with inorganic compounds
58
In figure 42 the images of the residues of 30 and 40 wt RTM6-ATH
system with the whitish surface characteristic of the aluminium
trihydrate are reported
Figure 42 HRR curves of RTM6ATH at different percentage
The cone calorimeter data for ATH are reported in table 43 and FPI and
FIGRA in table 44 and are averaged over two replicate experiments
Chapter 4 Flame retardant of epoxy resin with inorganic compounds
59
Samples
TTI
(s)
pHRR
(kWm2)
HRR
average
(kWm2)
TTP
(s)
THR
(MJm2)
TSR
(m2m2)
RTM6 neat 43 702 382 290 189 9260
RTM6+ATH
5 33 815 413 220 126 5099
RTM6+ATH
10 51 728 383 210 126 5246
RTM6+ATH
20 52 510 368 340 199 9109
RTM6+ATH
30 64 468 324 232 174 7648
RTM6+ATH
40 93 453 193 110 172 8238
Table 43 Main cone calorimeter parameters evaluated for RTM6 epoxy with ATH at
different percentage
Samples ΔTTI
(s)
ΔpHRR
(kWm2)
FIP
(kWm2s)
FIGRA
(kWm2s) RTM6 neat _ _ 1632 242
RTM6+ATH
5 -10 -113 247 370
RTM6+ATH
10 8 -26 1427 346
RTM6+ATH
20 9 192 98 15
RTM6+ATH
30 21 234 731 201
RTM6+ATH
40 50 249 487 411
Table 44 Parameters calculated by cone calorimeter data for RTM6 epoxy with ZB at
different percentage
Where FPI and FIGRA are respectively pHRRTTI (kWm2s) and
pHRRTTP (kWm2s)
Chapter 4 Flame retardant of epoxy resin with inorganic compounds
60
Zinc hydroxystannate and zinc stannate such as zinc borate and
aluminium trihydrate reduced HRR peak and HRR average with the
presence of ZS and ZHS of 30 and 40 wt ZS and ZHS werenrsquot
prepared at 5 wt percentage because previously test on zinc borate
and aluminium trihydrate have failed the cone calorimeter tests
Cone calorimeter data are reported in table 45 for ZHS and in table 47
for ZS
In figure 43 HRR curves of ZHS at different percentage are reported
and the residual image shows a densified structure (char) that forms a
barrier to inhibit combustible gases
Figure 43 HRR curves of RTM6ZHS at different percentage
Chapter 4 Flame retardant of epoxy resin with inorganic compounds
61
Samples
TTI
(s)
pHRR
(kWm2)
HRR
average
(kWm2)
TTP
(s)
THR
(MJm2)
TSR
(m2m2)
RTM6 neat 43 702 382 290 189 9260
RTM6+ZHS
10 44 469 203 255 202 9070
RTM6+ZHS
20 43 465 286 417 194 7092
RTM6+ZHS
30 52 379 192 70 153 6726
RTM6+ZHS
40 51 329 214 75 153 72
Table 45 Main cone calorimeter parameters evaluated for RTM6 epoxy with ZHS at
different percentage
Samples ΔTTI
(s)
ΔpHRR
(kWm2)
FIP
(kWm2s)
FIGRA
(kWm2s)
RTM6 neat _ _ 1632 242
RTM6+ZHS
10 1 233 1065 184
RTM6+ZHS
20 0 237 1082 111
RTM6+ZHS
30 9 323 728 541
RTM6+ZHS
40 8 373 645 438
Table 46 Parameters calculated by cone calorimeter data for RTM6 epoxy with ZHS
at different percentage
Instead in the residual image of ZS (fig 44) a crack on the surface is
observed probably due to a local instability of the heat flux during the
test which lead to a wider cracked area and therefore a localised
combustion growth such as zinc borate
Chapter 4 Flame retardant of epoxy resin with inorganic compounds
62
Figure 44 HRR curves of RTM6ZS at different percentage
Samples
TTI
(s)
pHRR
(kWm2)
HRR
average
(kWm2)
TTP
(s)
THR
(MJm2)
TSR
(m2m2)
RTM6 neat 43 702 382 290 189 9260
RTM6+ZS
10 45 583 313 260 176 7505
RTM6+ZS
20 46 803 336 475 200 6747
RTM6+ZS
30 43 551 274 262 152 6509
RTM6+ZS
40 45 470 293 282 163 7096
Table 47 Main cone calorimeter parameters evaluated for RTM6 epoxy with ZS at
different percentage
Chapter 4 Flame retardant of epoxy resin with inorganic compounds
63
Samples ΔTTI
(s)
ΔpHRR
(kWm2)
FIP
(kWm2s)
FIGRA
(kWm2s)
RTM6 neat _ _ 1632 242
RTM6+ZS
10 2 119 1295 224
RTM6+ZS
20 3 -101 1745 169
RTM6+ZS
30 0 151 1281 210
RTM6+ZS
40 2 232 1044 166
Table 48 Parameters calculated by cone calorimeter data for RTM6 epoxy with ZS at
different percentage
In conclusion the effect of all additives on the HRR peak value of epoxy
resin RTM6 is considerable for percentages of 30 and 40 wt In
particular the best result has been achieved with zinc borate 40 wt
and the heat release rate peak enhancement was 55
422 Synergistic effect of zinc borate with aluminium trihydrate
The synergy between the zinc borate and aluminium trihydrate was
investigated on four different percentages (10 20 30 and 40 wt ) of
additives into neat system considering the total amount split between
zinc borate and aluminium trihydrate according to the ratio 11
In order to study the synergistic effects of zinc borate with aluminium
trihydrate samples of composite of RTM6 and ZBATH dispersed at
total percentage of 20 wt were mapped by SEM The presence of ZB
and ATH within the same area of the sample lead to the reasonable
conclusion that an interaction between the two additives is taking place
(fig 45)
Chapter 4 Flame retardant of epoxy resin with inorganic compounds
64
Figure 45 Mapping of ZBATH sample dispersed into the epoxy resin
Preliminary thermogravimetric analysis shows that the synergic effect
due to the presence of both ZB and ATH is highlighted by the value of
onset temperature which decreases to about 355degC for the higher
concentrations Theoretical (calculation) and experimental TG-DTG
curves have been superimposed in figures 46 and 47 for the 30 wt
similar results were also obtained for the 40 wt mixture It results
that the addition of ZB and ATH synergistically drives the degradation
behaviour of neat matrix system as showed by the remarkable shifting
of the experimental curve toward higher onset temperature compared
with the calculated one
Chapter 4 Flame retardant of epoxy resin with inorganic compounds
65
0
20
40
60
80
100
120
0 100 200 300 400 500 600 700 800
RTM6+ATH+ZB 30 ExperimentRTM6RTM6+ATH+ZB 30 Calculation
Wei
ght (
)
Temperature (degC)
Figure 46 Experimental and calculated TGA curves for RTM6ATHZB 30 wt system
-02
0
02
04
06
08
1
12
0 100 200 300 400 500 600 700 800
RTM6RTM6+ATH+ZB 30 ExperimentRTM6+ATH+ZB 30 Calculation
Der
iv W
eigh
t (
degC
)
Temperature (degC)
Figure 47 Experimental and calculated DTG curves for RTM6ATHZB 30 wt system
Cone calorimeter data of synergic effect of zinc borate is reported in
tables 49 and 410
Chapter 4 Flame retardant of epoxy resin with inorganic compounds
66
Samples
TTI
(s)
pHRR
(kWm2)
HRR
average
(kWm2)
TTP
(s)
THR
(MJm2)
TSR
(m2m2)
RTM6 neat 43 702 382 290 189 9260
RTM6+ZB+ATH
10 52 679 285 200 122 5702
RTM6+ZB+ATH
20 52 468 337 140 195 10086
RTM6+ZB+ATH
30 55 431 249 95 174 8966
RTM6+ZB+ATH
40 87 437 74 100 173 7184
Table 49 Main cone calorimeter parameters evaluated for RTM6ZBATH system at
different percentage
Samples ΔTTI
(s)
ΔpHRR
(kWm2)
FIP
(kWm2s)
FIGRA
(kWm2s)
RTM6 neat _ _ 1632 242
RTM6+ZB+ATH
10 9 23 1305 34
RTM6+ZB+ATH
20 9 234 917 334
RTM6+ZB+ATH
30 12 271 783 453
RTM6+ZB+ATH
40 44 265 502 437
Table 410 Parameters calculated by cone calorimeter data for RTM6ZBATH
system at different percentage
The synergy of zinc borate is effective above content of 20 wt in fact
the heat release rate average undergoes a significant decrease by 382
kWm2 for epoxy resin to 249 kWm2 for system ZBATH 30 wt and
74 kWm2 for ZBATH 40 wt (fig 48) Comparing the ΔTTI and the
Chapter 4 Flame retardant of epoxy resin with inorganic compounds
67
HRR average values for RTM6ZB 20 wt RTM6ATH 20 wt and
RTM6ZBATH system at 40 wt the effect synergic of zinc borate and
aluminium trihydrate improves significantly the flame retardancy
respectively from 6 to 44 sec for TTI and from 251 kWm2 to 74 kWm2
for HRR compared
Figure 48 HRR curves of RTM6ZBATH system at different percentage
423 Scanning electron micrograph of residual
The scanning electron micrographs of dust cryogenically fractured
composite samples and their residuals were taken by a 1450VP LEO
The analyses made with the electronic scanning microscope were made
to observe the morphology of the material both before and after the
combustion process occurred in the cone calorimeter
We used two different methodologies one for observing the morphology
of the material (ion secondary SE1) and the other for the phase
difference (ions scatter QBSD) and the EDS analysis was also carried
out to view the compounds contained in the sample examined
Chapter 4 Flame retardant of epoxy resin with inorganic compounds
68
Analysis of SEM micrographs on residual of system of epoxy resin zinc
borate and aluminium trihydrate indicates that char topography varies
from a compact like-amalgam structure for the RTM6+ZB (fig49-411)
to a granular porous-like structure characterized by very small particles
of degraded resin and additive for the ATH mixture (fig412-414)
Reported SEM image are taken for the 20 wt content system as this
percentage represents the first useful composition to observe a delayed
effect of flame retardancy
Figure 49 and 410 Scanning electron micrograph of residual of RTM6ZB system
Figure 411 Scanning electron micrograph (SE1 and QBSD) and EDS of residual of
RTM6ZB system
Chapter 4 Flame retardant of epoxy resin with inorganic compounds
69
Figure 412 and 413 Scanning electron micrograph of residual of RTM6ZB system
Figure 414 Scanning electron micrograph (SE1 and QBSD) and EDS of residual of
RTM6ZB system
In figure 415 the scanning electron micrograph of residual samples of
RTM6ZBATH system is reported and the formation of char layer on
the surface due to zinc borate that reduces the HRR peak and average
of the burning surface is observe
Scanning electron micrographs indicate that the synergistic flame
retardant effects of these additives result from the excellent quality of
char that can better endure the oxidation of high temperatures slowing
at same time the degradation of epoxy resin
Chapter 4 Flame retardant of epoxy resin with inorganic compounds
70
Figure 415 Scanning electron micrograph and EDS of residual of RTM6ZBATH
system
424 Flame retardant of panels of RTM6 and inorganic compounds
The composites were prepared by mixing the epoxy resin RTM6 with all
additives at percentage of 30 wt and then the mixture was degassed
for 30 minutes at 90degC in a vacuum oven to eliminate entrapped air and
humidity Afterwards the mixture was injected in the preform of
20x20cm by vacuum infusion process
Flame retardants of panels of RTM6 and inorganic compounds were
investigated by cone calorimeter under an incident flux of 35 kWm2 in
according to the ASTM E1354-04 procedure for samples with thickness
less than 3mm Samples have dimensions of 100x100mm with
thickness of about 3mm because they were manufactured with 8 plies
of carbon fibres overlaid unidirectional at zero degree with thickness of
03mm each one
Cone calorimeter data show how the best results for the flame retardant
properties is at percentage of 40 wt but rheology test prepared at 5
degCmin demonstrates high viscosity for this percentage and hence
there are troubles during infusion For this reason the panels were
manufactured with percentage additives of 30 wt (fig 416)
Chapter 4 Flame retardant of epoxy resin with inorganic compounds
71
Figures 416 Rheology test viscosity vs time of RTM6 neat (green) RTM6ZB 30 wt
(blue) and RTM6ZB 40 wt (red)
In figure 417 are reported HRR curves of panels of RTM6 with carbon
fibres and all additives at percentage of 30 wt
0 100 200 300 4000
200
400
HR
R [k
Wm
2 ]
Time [s]
RTM6+CF RTM6+CF+ZB 30wt RTM6+CF+ATH 30wt RTM6+CF+ZHS 30wt RTM6+CF+ZS 30wt
Figure 417 HRR curves of RTM6CFAdditives system at percentage of 30 wt
Chapter 4 Flame retardant of epoxy resin with inorganic compounds
72
In the figure it is shown that zinc borate retarded the time to ignition
and reduced heat release rate respect to epoxy resin with carbon fibres
as is reported in table 411
Samples
TTI
(s)
pHRR
(kWm2)
HRR
average
(kWm2)
TTP
(s)
THR
(MJm2)
TSR
(m2m2)
RTM6+CF 91 301 119 124 20 1009
RTM6+CF+ZB
30 106 284 132 134 12 612
RTM6+CF+ATH
30 90 303 121 122 21 969
RTM6+CF+ZHS
30 81 344 139 110 18 876
RTM6+CF+ZS
30 73 278 114 114 16 766
Table 411 Main cone calorimeter parameters evaluated for RTM6Carbon
FibersAdditives system at percentage of 30 wt
Samples ΔTTI
(s)
ΔpHRR
(kWm2)
FIP
(kWm2s)
FIGRA
(kWm2s)
RTM6 neat _ _ 33 24
RTM6+CF+ZB
30 15 17 27 21
RTM6+CF+ATH
30 -1 -2 34 25
RTM6+CF+ZHS
30 -10 -43 42 32
RTM6+CF+ZS
40 -18 23 38 24
Table 412 Parameters calculated by cone calorimeter data for RTM6Carbon
FibersAdditives system at percentage of 30 wt
Chapter 4 Flame retardant of epoxy resin with inorganic compounds
73
In the table itrsquos shown clearly that the panels with zinc borate
augmented the flame retardant properties of RTM6 and carbon fibers in
fact increased the TTI reduced significantly the TSR and reduced FIP
and FIGRA (table 412)
The synergistic effect of zinc borate with aluminium trihydrate on
panels of RTM6 and carbon fibers is shown in figure 418
0 100 200 300 4000
200
400
HR
R [k
Wm
2 ]
Time [s]
RTM6+CF RTM6+CF+ZB 30wt RTM6+CF+ATH 30wt RTM6+CF+ZB+ATH 30wt
Figure 418 HRR curves of RTM6CFZBATH system
In this case itrsquos shown that the synergistic effect of zinc borate didnrsquot
produce any improvement on the flame retardant properties of RTM6
and Carbon Fibers as is reported in tables 413 and 414
Zinc borate from chemical in the combustion phase is able to slow
down the effect of carbon fibres because the zinc borate creates a layer
of char on the surface of sample more compact than was in the
presence of ZB with ATH
Chapter 4 Flame retardant of epoxy resin with inorganic compounds
74
Samples
TTI
(s)
pHRR
(kWm2)
HRR
average
(kWm2)
TTP
(s)
THR
(MJm2)
TSR
(m2m2)
RTM6+CF 91 301 119 124 20 1009
RTM6+CF+ZB 30 106 284 132 134 12 612
RTM6+CF+ATH
30 90 303 121 122 21 969
RTM6+CF+ZB+ATH
30 79 311 126 104 17 788
Table 413 Main cone calorimeter parameters evaluated for RTM6Carbon
FibersZBATH system at percentage of 30 wt
Samples ΔTTI
(s)
ΔpHRR
(kWm2)
FIP
(kWm2s)
FIGRA
(kWm2s) RTM6 neat _ _ 33 24
RTM6+CF+ZB 30 15 17 27 21
RTM6+CF+ATH
30 -1 -2 34 25
RTM6+CF+ZB+ATH
30 -12 -10 38 29
Table 414 Parameters calculated by cone calorimeter data for RTM6Carbon
FibersZBATH system at percentage of 30 wt
Chapter 4 Flame retardant of epoxy resin with inorganic compounds
75
43 Thermal mechanical analysis of RTM6 and inorganic
compounds The coefficient of thermal expansion is calculated by thermal
mechanical analysis as reported in Chapter 3
Each result reported in this chapter is averaged over three replicate
experiments The thermal mechanical analysis was conducted on the
samples additived at 30wt because this percentage is resulted good by
cone calorimeter test and principally to have a comparison with the
panels that are produced at this percentage
In figure 419 is reported the CTE of RTM6 neat and it is shown clearly
that there are two values of CTE in the first heating ramp and many
CTErsquos value in the second heating ramp
000 10000 20000Time [min]
145000
146000
147000
148000x10
1um
TMA
-002
-001
000
001
002
NLOAD
10000
20000
CTemp
19613C
5600C
16757C
6207x10-6
K
21589C
24557C
13770x10-6
K
7768C
16433C
6748x10-6
K
21168C
24930C
16647x10-6
K
RTM6 NEAT
Figure 419 CTE of epoxy resin RTM6 neat
Instead in the samples of RTM6 and additives the value of CTE in the
second heating ramp is only one and it is observed that the value of
CTE of RTM6additives system is more less than the CTE of RTM6 neat
Chapter 4 Flame retardant of epoxy resin with inorganic compounds
76
hence the influence of additives on the thermal mechanical properties of
matrix is clear
000 5000 10000 15000Time [min]
117000
117500
118000
x101
umTMA
-002
-001
000
001
002
NLOAD
5000
10000
15000
20000
CTemp
8451 C
18561 C
6615 x10-6
5238 C
15885 C
5781 x10-6
K
17844 C
18051 C
19565 C
12254 x10-6
K
RTM6+ZB 30 wt
Figure 420 CTE of epoxy resin RTM6+ZB 30wt
000 5000 10000 15000Time [min]
155000
155500
156000
156500x10
1um
TMA
-002
-001
000
001
002
NLOAD
5000
10000
15000
20000
CTemp
17557C
5017C
13426C
6051x10-6
K
18608C
19618C
9987x10-6
K
7391C
19130C
6231x10-6
K
RTM6+ATH 30wt
Figure 421 CTE of epoxy resin RTM6+ATH 30wt
Chapter 4 Flame retardant of epoxy resin with inorganic compounds
77
To observe the synergistic effect of zinc borate is calculated the CTE of
RTM6ZBATH 30wt system and the results are reported in table
415
000 5000 10000 15000Time [min]
121000
121500
122000
x101
umTMA
-002
-001
000
001
002
NLOAD
5000
10000
15000
20000
CTemp
4876C
12672C
6051x10-6
K7127C
19539C
6471x10-6K
15421C
17853C
12050x10-6K
RTM6+ZB+ATH 30wt
Figure 422 CTE of epoxy resin RTM6+ATH+ZB 30wt
Coefficient of Thermal Expansion (10-6K)
Samples I Heating ramp II Heating ramp
RTM6 neat 606 1329 678 1657
RTM6+ZB 30wt 595 1767 656 -
RTM6+ATH 30wt 605 1149 612 -
RTM6+ATH+ZB 30wt 612 1157 671 -
Table 415 CTE of synergistic effect of zinc borate
Instead in the graph of TMA of ZS and ZHS there are two values in the
second heating ramp and rather than as a ZB and ATH This confirms
as previously seen from the cone that the protective structure that is
created is different because chemically boron and aluminium will
Chapter 4 Flame retardant of epoxy resin with inorganic compounds
78
oxidize more easily creating alumina and boron oxide (ceramic) hence
tighten the structure
000 10000 20000Time [min]
150000
151000
x101
umTMA
-002
-001
000
001
002
NLOAD
10000
20000
CTemp
7767C
17204C
5787x10-6K
21699C
24925C
12096x10-6
K
19957C
4559C
13757C
6488x10-6
K
18170C
24788C
6759x10-6
K
RTM6+ZS 30wt
Figure 423 CTE of epoxy resin RTM6+ZS 30wt
000 10000 20000Time [min]
165000
166000
167000
168000
x101
umTMA
-002
-001
000
001
002
NLOAD
10000
20000
CTemp
6060C
15393C
6330x10-6
K
20830C
23721C
29456x10-6
K
20725C
7879C
15387C
6242x10-6
K
22040C
24930C
12702x10-6
K
RTM6+ZHS 30wt
Figure 424 CTE of epoxy resin RTM6+ZHS 30wt
In conclusion the values of coefficient of thermal expansion for both
heating ramp are reported in table 416
Chapter 4 Flame retardant of epoxy resin with inorganic compounds
79
Coefficient of Thermal Expansion (10-6K)
Samples I Heating ramp II Heating ramp
RTM6 neat 606 1329 678 1657
RTM6+ZB 30wt 595 2038 656 -
RTM6+ATH 30wt 605 1149 612 -
RTM6+ATH+ZB 30wt 612 1157 671 -
RTM6+ZS 30wt 636 7040 574 1276
RTM6+ZHS 30wt 621 2898 617 1268
Table 416 CTE of all samples of RTM6 and additives
In table 416 the values of CTE for all additives are reported and it is
clearly observed that the influence of additives on the matrix is able to
lower the CTE of epoxy resin neat
Furthermore it is shown the thermal mechanical analysis of panels of
epoxy resin with additives produced by VIP with carbon fibres The
samples were cut to 90 degrees in the transverse direction fibres to
observe the effect of carbon fibres and additives on the properties of
thermal mechanical of matrix
In the figures below the values of CTE of epoxy resin RTM6 with carbon
fibres and all additives are illustrated and it is shown that the values of
CTE are always lower than the CTE of single resin with fibres This
results are reported in the table 417
Chapter 4 Flame retardant of epoxy resin with inorganic compounds
80
000 10000 20000Time [min]
177500
178000
178500
x101
umTMA
-002
-001
000
001
002
NLOAD
10000
20000
CTemp
5090C
16755C
3325x10-6
K
22481C22314C
25029C
3085x10-6
K
17544C
7034C
15384C
3377x10-6
K
19683C
24476C
4543x10-6K
RTM6+CF
Figure 425 CTE of epoxy resin RTM6+CF
000 10000 20000Time [min]
138500
139000
139500
x101
umTMA
-002
-001
000
001
002
NLOAD
10000
20000
CTemp
5309C
15389C
2840x10-6K
21889C
24945C
2723x10-6
K
21278C
7875C
14546C
3036x10-6
K
18119C
19872C
24356C
3873x10-6
K
RTM6+CF+ZB 30 wt
Figure 426 CTE of epoxy resin RTM6+CF+ZB 30wt
Chapter 4 Flame retardant of epoxy resin with inorganic compounds
81
000 10000 20000Time [min]
162000
162500
163000
x101
umTMA
-002
-001
000
001
002
NLOAD
10000
20000
CTemp
22411C
5525C
16456C
3264x10-6
K
23409C24942C
2832x10-6K
17556C
7234C
14428C
3385x10-6K
20098C
24285C
3699x10-6
K
RTM6+CF+ATH 30 wt
Figure 427 CTE of epoxy resin RTM6+CF+ATH 30wt
000 10000 20000Time [min]
165500
166000
166500
x101
umTMA
-002
-001
000
001
002
NLOAD
10000
20000
CTemp
22639C
4575C
15467C
3111x10-6K
22316C
25085C
4058x10-6K
7993C
14547C
3240x10-6
K
17252C19766C
24360C
4942x10-6K
RTM6+CF+ATH+ZB 30 wt
Figure 428 CTE of epoxy resin RTM6+CF+ATH+ZB 30wt
Chapter 4 Flame retardant of epoxy resin with inorganic compounds
82
000 10000 20000Time [min]
155500
156000
x101
umTMA
-002
-001
000
001
002
NLOAD
10000
20000
CTemp
22262C
5082C
16873C
2888x10-6
K
22845C
25089C
3534x10-6
K
15935C
7235C
14962C
3211x10-6
K
18924C
23941C
4176x10-6
K
RTM6+ZS 30wt
Figure 429 CTE of epoxy resin RTM6+CF+ZS 30wt
000 10000 20000Time [min]
174000
174500
x101
umTMA
-002
-001
000
001
002
NLOAD
10000
20000
CTemp
24089C
5721C
18578C
2851x10-6
K
23944C25021C
2451x10-6K
16347C
6501C
14321C
3085x10-6
K
19681C
24287C
3625x10-6K
RTM6+ZHS 30wt
Figure 430 CTE of epoxy resin RTM6+CF+ZHS 30wt
Chapter 4 Flame retardant of epoxy resin with inorganic compounds
83
Coefficient of Thermal Expansion (10-6K)
Samples I Heating ramp II Heating ramp
RTM6+CF 332 319 346 452
RTM6+CF+ZB 30wt 265 317 311 386
RTM6+CF+ATH 30wt 326 306 339 389
RTM6+CF+ATH+ZB 30wt 292 299 306 398
RTM6+CF+ZS 30wt 296 318 318 378
RTM6+CF+ZHS 30wt 276 364 318 406
Table 417 CTE of all samples of RTM6+CF and all additives
In the table the thermal mechanical data of panels are reported and it is
shown that the carbon fibers and the additives reduced the CTE hence
increase the thermal mechanical properties of epoxy resin RTM6
Chapter 4 Flame retardant of epoxy resin with inorganic compounds
84
References [1] Bourbigot S Le Bras M Leeuwendal R Shen KK Schubert D
Polym Degrad Stab 1999 (64)419-425
[2] Carpentier F Bourbigot S Le Bras M Delobel R Foulon M Polym
Degrad Stab 2000 69 1 83-92
[3] Wu Z Shu W Hu Y Journal of Applied Polymer Science 2007
1033667-3674
[4] Petsom A Roengsumran S Ariyaphattanakul A Sangvanich P
Polym Degrad Stab 2003(80)17-22
[5] Cusack PA Heer MS Monk AW Polymer Degradation and Stability
1997 (58)229-237
[6] Ning Y Guo S J of App Pol Sc 2000 77 3119-3127
[7] Wu S Cong P Yu J Luo X Mo L Fuel 2006 85 1298-1304
[8] Bourbigot S Le Bras M Duquesne S Rochery M Macromol Mater
Eng 2004 289 499-511
[9] Le Bras M Bourbigot S Duquesne S Jama C Wilkie CA Royal
Society of Chemistry Press Cambridge 2005
[10] Genovese A Shanks RA Polym Degrad Stab 2007 92 2-13
[11] Samyn F Bourbigot S Duquesne S Delobel R Thermochimica
2007 456 134-144
[12] Schartel B Hull TR Fire and Materials 2007 31 327-354
CHAPTER 5 FLAME RETARDANT OF EPOXY RESIN WITH
CARBON NANOTUBES
51 The state of the art on flame retardant of carbon
nanotubes Fire retardancy is one of the fields where the nanomaterials could be
used successfully Nanoparticles embedded in various polymer matrices
are reported to reduce considerably the heat released from these
materials [1] The investigation of size shape interfaces and
concentration of nanoscale silica nano-flakes nanotubes and other
nanoparticles on the flame retardant performance increased the role of
fire protected polymers within the science of materials There is a high
level of interest in using filler particles having at least one nano-
dimensional scale for making polymeric nanocomposite materials with
exceptional properties One of the promising applications involves the
improvement in flammability properties of polymers with nanofillers
because one weak aspect of polymers is that they are combustible
under certain conditions These filled systems are attractive as possible
alternatives to conventional flame retardants and furthermore they
could simultaneously improve both physical and flammability
properties of polymers [2]
Carbon nanotubes are candidates as flame retardant additives because
of their highly elongated shape (high aspect ratio)
In literature [2-6] different authors analyzed the fire behaviours of
carbon nanotubes in several matrices
Kashiwagi et al [2-4] found that nanocomposites based on carbon
nanotubes are likewise capable of forming a continuous structured
network as a protective layer without the formation of cracks that
compromise the flame-retardant effectiveness This resulted in a
Chapter 5 Flame retardant of epoxy resin with carbon nanotubes
86
significant reduction in the heat release rate (a flammability measure
related to the fire intensity) with a carbon nanotube mass concentration
as low as 05 This protective layer consisted mainly of carbon
nanotubes and it seemed to act as a heat shield for the virgin polymer
below the layer Poorly dispersed carbon nanotubes resulted in the
formation of a discontinuous layer consisting of fragmented islands
rather than the continuous protective network layer Very low
concentrations of the tubes yielded the same fragmented island
structures as found in the clay nanocomposite measurements The
flame retardant performance of the nanocomposites containing the
island structure was much poorer than that of the nanocomposites
forming a continuous protective network layer Thus the formation of
the network structured protective layer during burning without any
openings or cracks seems to be crucial for the large reduction in heat
release rate Furthermore Kashiwagi et al [5] suggested that this
network is formed in the original sample under appropriate fabrication
conditions and that this structure provides the main source of the
protective layer that is formed during the burning process This
hypothesis was systematically tested with various sizes and
concentrations of carbon-based nanoparticles in a PMMA matrix
Cipiriano et al [6] studied the effects of the aspect ratio of multi-walled
carbon nanotubes (MWNTs) on the rheology and flammability of
polystyreneMWNT nanocomposites using two MWNTs having average
aspect ratios (length to outer diameter) of 49 and 150 In flammability
experiments they demonstrated that the larger aspect ratio particles
lead to a greater reduction in mass loss rate hence they are more
effective in reducing flammability
Chapter 5 Flame retardant of epoxy resin with carbon nanotubes
87
52 Cone calorimeter test Cone calorimeter tests were performed using a Fire Testing Technology
Ldt cone calorimeter according to the ASTM E1354-04 procedure
Samples with nominal dimensions of 100x100x3 mm were tested
horizontally under an incident flux of 35 kWm2 This level was chosen
as it corresponds to the evolved heat during a fire for samples with
thickness less than 3mm
521 Flame retardant of RTM6 and MWNT Nanocyl 7000
The nanocomposites of epoxy resin and multi walled carbon nanotubes
were prepared by sonication process as is reported in the Chapter 3
0 100 200 300 4000
600
1200
1800
2400
3000
HR
R [k
Wm
2 ]
Time [s]
RTM6 RTM6+MWNT 01wt
Figure 51 HRR curves of RTM6MWNT at percentage of 01wt
Samples
TTI
(s)
pHRR
(kWm2)
HRR
average
(kWm2)
TTP
(s)
THR
(MJm2)
TSR
(m2m2)
RTM6 neat 35 1479 614 156 117 4688
RTM6+MWNT
01wt 72 1651 643 136 108 3863
Table 51 Parameters calculated by cone calorimeter data for RTM6MWNT 01wt
Chapter 5 Flame retardant of epoxy resin with carbon nanotubes
88
In figure 51 it is shown that the carbon nanotubes donrsquot influence the
properties of flame retardants of matrices because the percentage used
in this work is low A small effect is shown only for the value of TTI as
reported in table 51
523 Flame retardant of panels of RTM6 and carbon nanotubes
The nanocomposites were prepared by sonication process (Chap3) the
epoxy resin RTM6 with multi walled carbon nanotubes at percentage of
01 wt and then the mixture was degassed for 30 minutes at 90degC in a
vacuum oven to eliminate entrapped air and humidity Afterwards the
mixture was injected in the preform of 20x20cm by vacuum infusion
process Samples were manufactured with 8 plies of overlaid
unidirectional carbon fibres at zero degrees with thickness of 03mm
each one
0 100 200 300 4000
200
400
600
800
HR
R [k
Wm
2 ]
Time [s]
RTM6+CF RTM6+CF+MWNT 01wt
Figure 52 HRR curves of RTM6CFMWNT 01wt
Chapter 5 Flame retardant of epoxy resin with carbon nanotubes
89
Samples
TTI
(s)
pHRR
(kWm2)
HRR
average
(kWm2)
TTP
(s)
THR
(MJm2)
TSR
(m2m2)
RTM6+CF 91 301 118 124 20 1009
RTM6+CF+MWNT
01wt 88 306 129 124 21 1077
Table 52 Parameters calculated by cone calorimeter data for RTM6CFMWNT
system at percentage of 01wt
As seen above the percentage of nanotubes is not effective and the
presence of unidirectional fibres does not induce changes sensitive to
the distribution of flame
53 Thermal mechanical analysis of RTM6 and carbon
nanotubes The thermal mechanical analysis was conducted on both samples of
RTM6 and additives on panels with carbon fibres
000 10000 20000Time [min]
145000
146000
147000
148000x10
1um
TMA
-002
-001
000
001
002
NLOAD
10000
20000
CTemp
19613C
5600C
16757C
6207x10-6
K
21589C
24557C
13770x10-6
K
7768C
16433C
6748x10-6K
21168C
24930C
16647x10-6
RTM6 NEAT
Figure 53 CTE of epoxy resin RTM6 neat
Chapter 5 Flame retardant of epoxy resin with carbon nanotubes
90
000 10000 20000Time [min]
140000
141000
142000
x101
umTMA
-002
-001
000
001
002
NLOAD
10000
20000
CTemp
20956C
4487C
16322C
6518x10-6K
21697C
25089C
13872x10-6
K
7339C
16669C
6897x10-6
K
20631C
21697C
24929C
17239x10-6K
RTM6+MWNT 01wt
Figure 54 CTE of epoxy resin RTM6+MWNT 01wt
Coefficient of Thermal Expansion (10-6K)
Samples I Heating ramp II Heating ramp
RTM6 neat 606 1329 678 1657
RTM6+MWNT 01wt 622 1374 688 1702
Table 53 CTE of RTM6 and MWNT 01wt
In the figures 53 and 54 and in the table 53 the CTE for panels of
epoxy resin additived with carbon nanotubes are shown where the
percentage of multi walled carbon nanotubes is too low to make an
improvement on the value of CTE of RTM6 and carbon fibres
Chapter 5 Flame retardant of epoxy resin with carbon nanotubes
91
000 10000 20000Time [min]
177500
178000
178500
x101
umTMA
-002
-001
000
001
002
NLOAD
10000
20000
CTemp
5090C
16755C
3325x10-6
K
22481C22314C
25029C
3085x10-6
K
17544C
7034C
15384C
3377x10-6
K
19683C
24476C
4543x10-6K
RTM6+CF
Figure 55 CTE of epoxy resin RTM6+CF
000 10000 20000Time [min]
153500
154000
154500
x101
umTMA
-002
-001
000
001
002
NLOAD
10000
20000
CTemp
6828C
19462C
3758x10-6
K
22996C25074C
5327x10-6K
8314C
14215C
3810x10-6
K
19996C
24591C
5725x10-6K
RTM6+CF+MWNT 01wt
Figure 56 CTE of epoxy resin RTM6+CF+MWNT 01wt
Chapter 5 Flame retardant of epoxy resin with carbon nanotubes
92
Coefficient of Thermal Expansion (10-6K)
Samples I Heating ramp II Heating ramp
RTM6+CF 332 319 346 452
RTM6+CF+MWNT
01wt 367 577 383 553
Table 54 CTE of RTM6+CF+MWNT 01wt system
Similar values are obtained for the sample with carbon fibres and
carbon nanotubes in fact in table 54 it is shown clearly that both
nanotubes and fibers donrsquot influence CTE of RTM6CF system
Chapter 5 Flame retardant of epoxy resin with carbon nanotubes
93
References [1] Marosfoi B Matko Sz Marosi PAnnaGy Current Applied Physics
2006 (6)259-261
[2] Kashiwagi T Du F Winey KI Groth KM Shields JR Bellayer SP
Kim H Douglas JF Polymer 2005 (46)471-481
[3] Kashiwagi T Grulke E Hilding J Groth K Harris R Butler K
Shields J Kharchenko S Douglas J Polymer 2004 (45) 4227-4239
[4] Kashiwagi et al Macromol Rapid Commun 2002 (23) 761-765
[5] Kashiwagi T Du F Douglas JF Winey KI Harris RHJr Shields
JR Nature materials 2005 (4) 5-10
[6] Cipiriano BH Kashiwagi T Raghavan SR Yang Y Grulke EA
Yamamoto K Shields JR Douglas JF Polymer 2007 486086-6096
[7] Qian D Dickey EC Andrews R Rantell T Appl Phys Lett 200076
(20)2868-2870
[8] Park C et al Chemical Physical Letters 2002364303-308
[9] Ham HT Choi YS Chung JI Journal of Colloid and Interface
Science 2005286 (1)216-223
[10] Salvetat JP Briggs AD Bonard JM Bacsa RR Kulik AJ Stockli T
Burnham NA Forroacute L Phys Rev Lett 199982 (5)944-947
[11] Choi ES Brooks JS Eaton DL Haik MS Hussaini MY Garmestani
H Li D Dahmen KJ Appl Phys 2003946034-
[12] Sandler J Shaffer MSP Prasse T Bauhofer W Schulte K Windle
AH Polymer 199940(21)5967-5971
[13] Xiao-Lin X Yiu-Wing M Xing-Ping Z Materials Science and
Engineering R 20054989-112
[14] Jin L Bower C Zhou O Appl Phys Lett 199873 (9)1197-1199
[15] Choi ES Brooks JS Eaton DL Al-Haik MS Hussaini MY
Garmestani H Li D Dahmen KJ Appl Phys 2003945451-5473
CHAPTER 6 KINETIC DEGRADATIONS KISSINGER AND OZAWA
METHODS
61 The state of the art on Kissinger and Ozawa methods
for epoxy resin To study the accelerated ageing of polymers and to obtain the kinetic
parameters of decomposition such as the apparent activation energy we
must to extrapolate according to the environment where the materials
are used It is important to consider the degradation mechanisms both
in the environments where they are used both when they are under
accelerated ageing conditions
Thermogravimetric analysis is often used to determine decomposition
reactions and to evaluate the thermal stability The mass loss is
controlled by time in isothermal conditions or by temperature during
the heating rate Changes in mass can be associated with solvent or
water desorptionabsorption oxidation or reduction and decomposition
Dynamic TG tests tend to be shorter and the mechanism of degradation
may be studied over a large temperature range with typical heating rate
Regnier et al [1] in a previously work on polyimide polymer system
compared several methods to calculate thermal kinetic parameters
They showed that Van Krevelen Horowitz-Metzger Coats Redfern and
Mac-Callum-Tanner methods gave a similar apparent activation energy
All kinetic parameters calculated by using these methods showed
equally good agreement with the experimental data Afterwards Regnier
et al [2] investigated the thermal degradation of epoxycarbon
composites in dynamic conditions The activation energy have been
evaluated employing Kissingerrsquos method assuming first order reaction or
the Osawarsquos method which gives an estimated activation energy for the
overall degradation
Chapter 6 Kinetic degradation Kissinger and Ozawa methods
95
Kiefer et al [3] mentioned that the sample preparation had an effect on
the kinetic results It does seem that the kinetic parameters are divided
into two groups however depending whether or not the sample
contained fibres He observed that the resin is affecting the fibre
Wang et al [4] studied the degradation behaviours of epoxy resins
containing various flame retardant components by Kissinger Flynn-
Wall-Ozawa and Horowitz-Metzger methods They demonstrated that
the activation energy at lower degree of the degradation decreased by
incorporation of flame retardant components while increased at higher
degree of the degradation
Chiang et al [5] prepared epoxy nanocomposites containing silicon and
phosphorus and compared with pure epoxy by Kissingerrsquos method They
found that the activation energies of thermo-oxidative degradation for
epoxy nanocomposites are less than those of thermo-oxidative
degradation for pure epoxy in first stage of thermo-oxidative
degradation However the activation energies of thermo-oxidative
degradation for epoxy nanocomposites are more than those of thermo-
oxidative degradation for pure epoxy in second stage of thermo-oxidative
degradation
In the dynamic and isothermal TGA measurements the mass loss is
detected in function of temperature and kinetic of degradation is based
on nth order reaction mechanism and in the many cases the rate of
degradation is a linear function of temperature by a constant
dependent of temperature by Arrhenius equation
)(αα Kfdtd
= (1)
with
⎟⎠⎞
⎜⎝⎛ minus=
RTEAfk exp)(α
(2)
Chapter 6 Kinetic degradation Kissinger and Ozawa methods
96
The combination of (1) e (2) gives
⎟⎠⎞
⎜⎝⎛ minus=
RTEAf
dtd exp)(αα
(3)
If heating rate β=dTdt is constant the variation in degree of conversion
can be analysed as a function of temperature and this temperature
being dependent on the time of heating
⎟⎠⎞
⎜⎝⎛ minus=
RTEfA
dTd exp)(α
βα
(4)
The integrated form of this equation generally is expressed as
int int ⎟⎠⎞
⎜⎝⎛minus==
α
βααα
0 0
exp)(
)( dTRTEA
fdg
T
(5)
where g(α) is the integrated form of the conversion dependence function
Different kinetics methods (differential and integral) were applied in this
study
Kissinger method [6] makes it possible to determine the values of
activation energy without a precise knowledge of the reaction
mechanism and analyzes the changes in the thermo-gravimetric data
through the change of scan rate of heating β depending on the
temperature of the maximum peak in DTG curve That way you get
that
( )[ ]max
1max2
max
1lnlnlnRT
EnE
ART
n minus⎭⎬⎫
⎩⎨⎧ minus+=⎟⎟
⎠
⎞⎜⎜⎝
⎛ minusαβ
(6)
where Tmax is the temperature corresponding to the inflection point of
thermo degradation curves which corresponds to the maximum reaction
rate αmax is the conversion at Tmax and n is the reaction order
Chapter 6 Kinetic degradation Kissinger and Ozawa methods
97
Assuming that ( ) ( ) 1 1maxmax constnf n congminus=prime minusαα the activation energy E can
be determined from a plot of ln(βT2max) against 1Tmax
With Flynn-Wall-Ozawa method [7-9] it is possible to get values of
activation energy applying Doylersquos approximation to the integration of
Eq(5) You get that
RTE
RgAE 456703152
)(loglog minusminus⎥
⎦
⎤⎢⎣
⎡=
αβ
(7)
Using Eq7 it is possible to plot logβ against 1T and to consider the
slope of straight line which result with a various value of conversion
The graph that result report E in function of conversion degree
62 Kinetic degradations of RTM6 and inorganic
compounds For obtaining the kinetic information such as the activation energy the
TGA study has been conducted with the variation of the heating rates
The dynamic experiments were carried out at different heating rates 5
75 10 and 20 degCmin from ambient to 800degC with TA 2950
thermobalance in nitrogen and air atmosphere For each experiment
were used approximately 10 mg of materials and the kinetics
parameters of interest as activation energy relating to initial
degradation of mixtures were obtained by Kissinger and Flynn-Ozawa-
Wall methods
In figure 61 thermogravimetric analysis of the epoxy resin RTM6 in the
nitrogen atmosphere are reported The epoxy resin shows only one step
of degradation and the onset temperature is around 350degC while the
maximum temperature on the DTG curves shows a little difference in
the heating rate
Chapter 6 Kinetic degradation Kissinger and Ozawa methods
98
Figure 61 TGA thermograms of RTM6 neat in nitrogen atmosphere
Figure 62 DTG thermograms of RTM6 neat in nitrogen atmosphere
In table 61 the onset temperature and maximum temperature for
epoxy system neat are reported along with the corresponding heating
ramp
Chapter 6 Kinetic degradation Kissinger and Ozawa methods
99
Heating rate (degCmin) Tonset (degC) Tmax (degC) 5degCmin 305 372
75degCmin 320 381
10degCmin 330 388
20degCmin 348 403
Table 61 Tonset and Tmax of epoxy resin RTM6 in nitrogen atmosphere
In air atmosphere two different degradation steps spanning the whole
investigated temperature range are noticeable the first step occurring
at 350degC and a second much broader step within around 500-550degC
(fig 63 and 64) The second step was attributed to a decomposition of
the non-volatile residues formed in the first step
Figure 63 TGA thermograms of RTM6 neat in air atmosphere
Chapter 6 Kinetic degradation Kissinger and Ozawa methods
100
Figure 64 DTG thermograms of RTM6 neat in air atmosphere
In table 62 are reported Tonset and Tmax of epoxy resin in air atmosphere
for each step
I STEP
Heating rate (degCmin) Tonset (degC) Tmax (degC) 5degCmin 354 378
75degCmin 351 383
10degCmin 354 406
20degCmin 357 398
II STEP
Heating rate (degCmin) Tonset (degC) Tmax (degC) 5degCmin 475 517
75degCmin 524 556
10degCmin 523 568
20degCmin 544 597
Table 62 Tonset and Tmax of epoxy resin RTM6 in air atmosphere
Chapter 6 Kinetic degradation Kissinger and Ozawa methods
101
The Kissinger method was employed to obtain the apparent activation
energy (Ea) in air or nitrogen from several scan with different heating
rate (q) Figures 65 and 66 represent the Kissinger plots of the epoxy
resin degraded in nitrogen and air atmosphere
150 152 154 156 158 160 162 1641000 KT
0
02
04
06
08
10
log (Heating rate(Kmin))
Activation Energy(kJmol) 16452 +- 351log (As^-1) 1070
Figure 65 Kissinger graphs for RTM6 data in nitrogen atmosphere
-1 2
-1 1 5
-1 1
-1 0 5
-1 0
-9 5
-9
-8 5
0 0 0 1 1 0 0 0 1 2 0 0 0 1 3 0 0 0 1 4 0 0 0 1 5 0 0 0 1 6
I S tepII s tep
y = 68 38 3 - 5 2 03 6 x R = 0 9 9 9 4 3
y = 0 4 01 9 5 - 9 69 1 x R = 0 9 9 7 4 3
ln ( β
T max
2 )
1 Tm a x
degK -1
Figure 66 Kissinger graphs for RTM6 data in air atmosphere
Chapter 6 Kinetic degradation Kissinger and Ozawa methods
102
KISSINGER in nitrogen atmosphere
Ea (kJmol) 16452
KISSINGER in air atmosphere
I STEP II STEP
Ea (kJmol)
RTM6 NEAT
816 1157
Table 63 Kissinger data for epoxy resin RTM6 in nitrogen and air atmosphere
The kinetic parameters calculated in nitrogen flow present activation
energy values higher than Ea obtained in air flow In fact activation
energy value in nitrogen flow is 16452 kJmol instead in air flow is
816 kJmol for first step and 1157 KJmol for second step
The Flynn-Ozawa-Wall method was also carried out for calculating the
activation energy only in nitrogen atmosphere In figures 67 and 68 it
is reported respectively the Ozawa analysis and activation energy
calculated with Ozawa methods for epoxy resin RTM6 It is possible to
notice that in the nitrogen atmosphere the Ea increase from conversion
zero to 20 after Ea is a constant from =02 to =07 and than
increase until to =085
Chapter 6 Kinetic degradation Kissinger and Ozawa methods
103
10 12 14 16 18 201000 KT
06
08
10
12
14log Heating rate(Kmin)
002 098
Figure 67 Ozawa analysis for RTM6 in nitrogen atmosphere
0 02 04 06 08 10 FractMass Loss
40
80
120
160
200
E(kJmol)
Figure 68 Energy of activation calculated with Ozawa method for RTM6 in nitrogen
atmosphere
The thermogravimetric derivate signal for RTM6ZB 30 wt system is
showed in figure 69 for nitrogen atmosphere and in figure 610 for air
atmosphere
Chapter 6 Kinetic degradation Kissinger and Ozawa methods
104
Figure 69 DTG thermograms of RTM6+ZB 30wt in nitrogen atmosphere
Figure 610 DTG thermograms of RTM6+ZB 30wt in air atmosphere
Chapter 6 Kinetic degradation Kissinger and Ozawa methods
105
145 147 149 151 1531000 KT
06
08
10
12
14log (Heating rate(Kmin))
Activation Energy(kJmol) 15425 +- 2201log (As^-1) 971
Figure 611 Kissinger graphs for RTM6+ZB 30wt data in nitrogen atmosphere
-12
-115
-11
-105
-10
0001 00012 00014 00016 00018 0002
I stepII step
y = 15735 - 17745x R= 099679
y = 15931 - 21603x R= 099919
ln(β
Tm
ax2 )
1Tmax
Figure 612 Kissinger graphs for RTM6+ZB 30wt data in air atmosphere
The Kissinger analysis in nitrogen atmosphere has demonstrated that
the activation energy Ea is less than the value of epoxy resin hence it
doesnrsquot achieve the energy for the degradation of RTM6 neat Instead in
the Kissinger analysis in air atmosphere it is shown that the value of
Chapter 6 Kinetic degradation Kissinger and Ozawa methods
106
Ea in the second step is higher than the value of RTM6 in fact at the
temperature lower 500degC a char on the surface that protects the matrix
is produce
KISSINGER in nitrogen atmosphere
Ea (kJmol) 15425
KISSINGER in air atmosphere
I STEP II STEP
Ea (kJmol)
RTM6+ZB 30wt
14754 17962
Table 64 Kissinger data for RTM6+ZB 30wt in nitrogen and air atmosphere
10 12 14 16 18 201000 KT
06
08
10
12
14log Heating rate(Kmin)
002 098
Figure 613 Ozawa analysis for RTM6+ZB 30wt in nitrogen atmosphere
Chapter 6 Kinetic degradation Kissinger and Ozawa methods
107
0 02 04 06 08 FractMass Loss
40
60
80
100
120
140
160
E(kJmol)
Figure 614 Energy of activation calculated with Ozawa method for RTM6+ZB 30wt
in nitrogen atmosphere
In the nitrogen atmosphere the Ozawa analysis confirms the positive
effect of zinc borate on the epoxy resin RTM6 because with low
conversion values the activation energy Ea is less than 50kJmol while
for conversion degrees between 01 and 08 a multi-step degradation
process is shown The presence of this step means that several layers of
char on the surface of the RTM6 have been created
Chapter 6 Kinetic degradation Kissinger and Ozawa methods
108
Figure 615 DTG of RTM6+ATH 30 wt in nitrogen atmosphere
Figure 616 DTG of RTM6+ATH 30 wt in air atmosphere
Chapter 6 Kinetic degradation Kissinger and Ozawa methods
109
147 149 151 1531000 KT
06
08
10
12
14log (Heating rate(Kmin))
Activation Energy(kJmol) 18731 +- 971log (As^-1) 1247
Figure 617 Kissinger graphs for RTM6+ATH 30 wt data in nitrogen atmosphere
-5
-49
-48
-47
-46
-45
-44
-43
-42
00012 00014 00016 00018 0002 00022
I stepII step
y = -071912 - 22661x R= 099682
y = 80558 - 84061x R= 097719
log
(βT
max
2 )
1Tmax
Figure 618 Kissinger graphs for RTM6+ATH 30 wt data in nitrogen atmosphere
Chapter 6 Kinetic degradation Kissinger and Ozawa methods
110
-12
-115
-11
-105
-10
-95
0001 00012 00014 00016 00018 0002
I stepII stepIII step
y = 11477 - 12954x R= 099948
y = 23102 - 22194x R= 099906
y = 66365 - 14480x R= 099861
ln(β
Tm
ax2 )
1Tmax
Figure 619 Kissinger graphs for RTM6+ATH 30 wt data in air atmosphere
KISSINGER in nitrogen atmosphere
I STEP II STEP
Ea (kJmol)
18841 6989
KISSINGER in air atmosphere
I STEP II STEP III STEP
Ea (kJmol)
RTM6+ATH 30wt
1077 1845 1204
Table 65 Kissinger data for RTM6+ATH 30wt in nitrogen and air atmosphere
In this case there are three degradation steps in the Kissinger analysis
in air atmosphere of aluminium trihydrate By varying the temperature
the following process occurred sequentially
bull dehydration of hydroxyl groups
bull formation of aluminized layer protection
bull pyrolysis of char
Chapter 6 Kinetic degradation Kissinger and Ozawa methods
111
For every step it is possible to associate the activation energy which is
greater than Ea of RTM6 hence it represents a slower degradation
08 10 12 14 16 18 201000 KT
06
08
10
12
14log Heating rate(Kmin)
002 095
Figure 620 Ozawa analysis for RTM6+ATH 30wt in nitrogen atmosphere
0 02 04 06 FractMass Loss
20
40
60
80
100
120
140
160
180
E(kJmol)
Figure 621 Energy of activation calculated with Ozawa methods for RTM6+ATH
30wt in nitrogen atmosphere
Chapter 6 Kinetic degradation Kissinger and Ozawa methods
112
In the Ozawa analysis it is demonstrated that the Ea starts to lower
values than both RTM6 and ZB in fact Ea starts to 25 kJmol and two
different steps are observed In the first step Ea is 70 kJmol for =01
while in the second step Ea is 160 kJmol with conversation degree
between 02 and 07
The TGA thermograms of the epoxy resin containing zinc borate and
aluminium trihydrate is reported in figures 622 and 623 to study the
kinetic parameters for synergistic effects of zinc borate
Figure 622 DTG of RTM6+ATH+ZB 30 wt in air atmosphere
Chapter 6 Kinetic degradation Kissinger and Ozawa methods
113
Figure 623 DTG of RTM6+ATH+ZB 30 wt in air atmosphere
146 148 150 152 154 1561000 KT
06
08
10
12
14log (Heating rate(Kmin))
Activation Energy(kJmol) 12276 +- 1399log (As^-1) 717
Figure 624 Kissinger graphs for RTM6+ATH+ZB 30 wt system data in nitrogen
atmosphere
Chapter 6 Kinetic degradation Kissinger and Ozawa methods
114
-125
-12
-115
-11
-105
-10
-95
-9
0001 00012 00014 00016 00018 0002 00022
I stepII stepIII step
y = 27768 - 24989x R= 099954
y = 26545 - 24952x R= 099876
y = 11444 - 18156x R= 099963
ln(β
Tm
ax2 )
1Tmax
Figure 625 Kissinger graphs for RTM6+ATH+ZB 30wt system data in air
atmosphere
KISSINGER in nitrogen atmosphere
Ea (kJmol) 12276
KISSINGER in air atmosphere
I STEP II STEP III STEP
Ea (kJmol)
RTM6+ATH+ZB 30wt
2077 2075 1509
Table 66 Kissinger data for RTM6+ATH+ZB 30wt in nitrogen and air atmosphere
Chapter 6 Kinetic degradation Kissinger and Ozawa methods
115
10 12 14 16 18 201000 KT
06
08
10
12
14log Heating rate(Kmin)
002 098
Figure 626 Ozawa analysis for RTM6+ATH+ZB 30wt system in nitrogen
atmosphere
01 03 05 07 Fractional Reaction
100
200
300
400
500
600
700E(kJmol)
Figure 627 Energy of activation calculated with Ozawa methods for RTM6+ATH+ZB
30wt system in nitrogen atmosphere
Chapter 6 Kinetic degradation Kissinger and Ozawa methods
116
The presence of both additives is clear in the Kissinger analysis and the
synergistic effect is shown in the Ozawa analysis because at low levels
of alpha Ea is higher In fact Ea increases for values of alpha around 01
and remains constant value of 200 kJmol throughout the range of
conversion Consequently it is necessary a higher energy than in
respect to the same additives taken individually and RTM6 neat to
complete the degradation process
Figure 628 DTG of RTM6+ZS 30 wt in nitrogen atmosphere
Chapter 6 Kinetic degradation Kissinger and Ozawa methods
117
Figure 629 DTG of RTM6+ZS 30 wt in air atmosphere
152 154 156 158 1601000 KT
06
08
10
12
14log (Heating rate(Kmin))
Activation Energy(kJmol) 15759 +- 420log (As^-1) 1044
Figure 630 Kissinger graphs for RTM6+ZS 30 wt data in nitrogen atmosphere
Chapter 6 Kinetic degradation Kissinger and Ozawa methods
118
-12
-115
-11
-105
-10
-95
0001 00012 00014 00016 00018 0002
I stepII stepIII step
y = 31646 - 26873x R= 099793
y = 11934 - 15035x R= 099848
y = 79213 - 15008x R= 099838
ln(β
Tm
ax2 )
1Tmax
Figure 631 Kissinger graphs for RTM6+ZS 30 wt data in air atmosphere
KISSINGER in nitrogen atmosphere
Ea (kJmol) 1576
KISSINGER in air atmosphere
I STEP II STEP III STEP
Ea (kJmol)
RTM6+ZS 30wt
2234 125 1248
Table 66 Kissinger data for RTM6+ZS 30wt in nitrogen and air atmosphere
Zinc stannate is similar to ATH for Kissinger analysis because also in
this case there are three degradation steps The discussion on the
structure of char isnrsquot like ATH because there isnrsquot the aluminium and
because the second and third degradation step need a lower energy to
be completed hence it is explained that the protection action is partly
missing
Chapter 6 Kinetic degradation Kissinger and Ozawa methods
119
10 12 14 16 18 20 22 24 261000 KT
06
08
10
12
14
log Heating rate(Kmin)
002 098
Figure 632 Ozawa analysis for RTM6+ZS 30wt in nitrogen atmosphere
0 02 04 06 08 FractMass Loss
0
40
80
120
160
200
E(kJmol)
Figure 633 Energy of activation calculated with Ozawa methods for RTM6+ZS in
nitrogen atmosphere
Chapter 6 Kinetic degradation Kissinger and Ozawa methods
120
In the Ozawa analysis in nitrogen atmosphere the activation energy has
a maximum peak of 200 kJmol around to =06 and neither a constant
evolution nor several degradation steps are shown
Figure 634 DTG of RTM6+ZHS 30 wt in nitrogen atmosphere
Figure 635 DTG of RTM6+ZHS 30 wt in air atmosphere
Chapter 6 Kinetic degradation Kissinger and Ozawa methods
121
151 153 155 157 1591000 KT
06
08
10
12
14log (Heating rate(Kmin))
Activation Energy(kJmol) 14931 +- 1257log (As^-1) 975
Figure 636 Kissinger graphs for RTM6+ZHS 30 wt data in nitrogen atmosphere
-49
-48
-47
-46
-45
-44
-43
-42
-41
00012 00014 00016 00018 0002 00022
I stepII step
y = 1713 - 10920x R= 09957
y = 11529 - 10291x R= 099916
log
(βT
max
2 )
1Tmax
Figure 637 Kissinger graphs for RTM6+ZHS 30 wt data in nitrogen atmosphere
Chapter 6 Kinetic degradation Kissinger and Ozawa methods
122
-125
-12
-115
-11
-105
-10
-95
0001 00012 00014 00016 00018 0002 00022
I stepII stepIII stepIV step
y = 30807 - 22469x R= 099707
y = 30543 - 26147x R= 099778
y = 755 - 56705x R= 099954
y = 83073 - 15323x R= 099946
ln(β
Tm
ax2 )
1Tmax
Figure 638 Kissinger graphs for RTM6+ZHS 30 wt data in air atmosphere
KISSINGER in nitrogen atmosphere
I STEP II STEP
Ea (kJmol)
908 85564
KISSINGER in air atmosphere
I STEP II STEP III STEP IV STEP
Ea (kJmol)
RTM6+ZHS 30wt
1868 2174 4715 1274
Table 67 Kissinger data for RTM6+ZHS 30wt in nitrogen and air atmosphere
Zinc hydroxystannate shows four degradation steps therefore the
degradation mechanism is particularly complex and to create the
protective layer a high energy contribution (471 kJmol) is necessary
Chapter 6 Kinetic degradation Kissinger and Ozawa methods
123
14 16 18 20 221000 KT
06
08
10
12
14log Heating rate(Kmin)
002 080
Figure 639 Ozawa analysis for RTM6+ZHS 30wt in nitrogen atmosphere
0 02 04 06 FractMass Loss
60
100
140
180
220
260
E(kJmol)
Figure 640 Energy of activation calculated with Ozawa methods for RTM6+ZHS in
nitrogen atmosphere
In the Ozawa analysis there are several steps and Ea is constant at the
value of 180 kJmol between alpha 01 to 05 and Ea increases until
Chapter 6 Kinetic degradation Kissinger and Ozawa methods
124
270 kJmol where is obtained to complete the degradation process of
degradation
63 Kinetic degradations of RTM6 and carbon nanotubes The thermal properties of CNTspolymer composites also attracted
many attentions from polymer scientists because CNTs have very high
thermal stability [10-14] Yang et al [11] reported the effect of single-
walled carbon nanotubes (SWNTs) on the thermal stability of
acrylonitrileebutadienee styrene (ABS)SWNTs composites They found
that the addition of SWNTs destabilized ABS and caused the composites
to degrade at lower temperatures Probst et al [12] revealed that
MWNTs promote the degradation of polyvinyl alcohol In contrast
Kashiwagi et al [13] observed an increased thermal stability of
MWNTspolypropylene (PP) composites The same effect of MWNTs on
PP was found by Yang et al [14] From the above publications both
promoting and hindering effects of CNTs on the thermal stability of
polymer are found The structure of the polymer matrix and the
interaction between CNTs and the matrix may be the key factors for the
thermal degradation behaviour of CNTs filled polymer composites
DTG curves of RTM6 with 01wt MWNTs under nitrogen and air
environments are showed in figures 639 and 640 respectively One
step decomposition is found under nitrogen atmosphere while two step
decomposition (second step from 450degC to 700degC) are found under air
atmosphere
Heating rate (degCmin) Tonset (degC) Tmax (degC) 5degCmin 317 376
75degCmin 334 387
10degCmin 334 391
20degCmin 348 404
Table 68 Tonset and Tmax of RTM6+MWNT 01wt in nitrogen atmosphere
Chapter 6 Kinetic degradation Kissinger and Ozawa methods
125
Figure 641 DTG of RTM6+MWNT 01wt in nitrogen atmosphere
Figure 642 DTG of RTM6+MWNT 01wt in air atmosphere
Chapter 6 Kinetic degradation Kissinger and Ozawa methods
126
147 149 151 153 1551000 KT
06
08
10
12
14log (Heating rate(Kmin))
Activation Energy(kJmol) 18936 +- 1296log (As^-1) 1269
Figure 643 Kissinger graphs for RTM6+MWNT 01wt data in nitrogen atmosphere
The Ea of neat RTM6 is found to be 164 KJmol while MWNTsRTM6
composites is found to be 189 KJmol suggesting that the MWNTs
increase the thermal stability of RTM6 under nitrogen atmosphere
-12
-115
-11
-105
-10
0001 00012 00014 00016 00018 0002
I stepII stepIII step
y = 11748 - 14660x R= 099802
y = 32132 - 97535x R= 099862
y = 38629 - 12408x R= 099656
ln(β
Tm
ax2 )
1Tmax
Figure 644 Kissinger graphs for RTM6+MWNT 01wt data in air atmosphere
Chapter 6 Kinetic degradation Kissinger and Ozawa methods
127
There are three steps although the small amount of carbon nanotubes
demonstrates that the degradation process has been altered The first
step is given by the of epoxy resin with carbon nanotubes The second
step is divided in two steps where in the first is lower than of the resin
and the second step is the pyrolysis of the char that happens with an
additional energy contribution
12 14 16 18 201000 KT
06
08
10
12
14log Heating rate(Kmin)
002 095
Figure 645 Ozawa analysis for RTM6+MWNT 01 wt in nitrogen atmosphere
In the Ozawa data a higher thermal stability than RTM6 is shown
because Ea starts by higher values but it is stable at about 200 kJmol
for alpha between 01 and 09
Chapter 6 Kinetic degradation Kissinger and Ozawa methods
128
0 02 04 06 08 FractMass Loss
60
80
100
120
140
160
180
200
E(kJmol)
Figure 646 Energy of activation calculated with Ozawa methods for RTM6+MWNT
01 wt in nitrogen atmosphere
64 Analysis of residue In the figure 647 a graph comparing dynamic measurements carried
out with scan rate of 10degCmin in air flow on all the samples tested in
this study is reported It is possible to notice that addition of zinc
compounds in the epoxy matrix does not induce big differences in the
first two stages of degradation except for the initial temperature of
degradation that increase for samples containing ZS and ZB For the
samples containing ZHS and ATH there is a difference in the first step
of degradation which occurs at around 220degC and these temperature is
characteristic of dehydration of crystallisation water For the samples
with ZS and ZB the loss of crystallisation water occur at higher
temperatures and this process is concomitant with the first step of
epoxy matrix degradation which happens in airflow at a temperature of
about 350degC and concern the dehydration of hydroxyl functions
The char oxidation stage occurs for the RTM6 neat in the temperature
range (513-627degC) instead for the samples containing flame retardant
Chapter 6 Kinetic degradation Kissinger and Ozawa methods
129
zinc compounds this range of temperature decrease It is possible to
notice larges differences for the residue of dynamic experiments carried
on samples flame retardants in oxidant atmosphere (tab 69) The flame
retardant zinc based promote char formation more efficiently at
temperatures lower than the epoxy RTM6 Zinc borate in the epoxy
matrix RTM6 induce formation of stable char at 554degC and residue is
about 32 of initial weight with weight loss in the third stage of 24
RTM6 with ZS form the char stable at the same temperature of sample
containing ZB but the residue in this case is lower than ZB (27)
Similarly RTM6 with ZHS show a residue equal at 14 lower than the
initial addition of flame retardant in the resin matrix (20) and the char
formation occurs at temperatures of 551degC
Figure 647 Comparison of additives at 10degCmin in dynamic mode and in air
atmosphere
Chapter 6 Kinetic degradation Kissinger and Ozawa methods
130
Temperature (degC)
Sample at 10
weight
loss
charring
stage
initial char
formation
weight
loss
III stage
of
char
at
800degC
RTM6 357 530-604 636 38 1
RTM6+ZS 359 492-527 555 35 24
RTM6+ZHS 356 498-530 559 40 17
RTM6+ZB 376 485-558 554 24 32
RTM6+ATH 374 509-582 628 36 9
Table 69 Analysis of last step of degradation in air flow
According to the Flynn-Ozawa-Wall analysis data it is possible to notice
that in air flow for RTM6 during the first stage of degradation occur
chain scission by thermolysis and there is the formation of thermally
more stable molecular compounds To destroy this compound it is
needed another stage of degradation that occurs with activation energy
and temperatures higher than first stage In the presence of flame
retardant compounds the second and third stage of degradation
concerns the segments of chain liberated that migrates in the surface of
samples A parts of these segments are volatiles but most of these
segments react with zinc compounds and form a layer of char stable
that delay the oxidation of matrix The sample containing ZB shows
higher efficiency of this process in the formation of char in the epoxy
matrix
Chapter 6 Kinetic degradation Kissinger and Ozawa methods
131
References [1] Regnier N Guibe C Polymer Degradation and Stability 1997
55165
[2] Regnier N Fontaine S Journal of Thermal Analysis and Calorimetry
2001 64789
[3] Kiefer R Yue J Hinkley J Journal of Advanced Materials 1995
2655
[4] Wang Q Shi W Polymer Degradation and Stability 2006 911747-
1754
[5] Chiang CL Ma CCM Wang FY Kuan HC European Polymer
Journal 2003 39825-830
[6] Kissinger HE Anal Chem 1957 291702-1706
[7] Flynn JH Wall LA J Res Nat Bur Stand A Phys Chem 1996
70A487
[8] Ozawa T Bull Chem Soc Jpn 1965 381881
[9] Doyle CD Nature 1965 207240
[10] Beyer G Fire Mater 200226(6)291-3
[11] Yang SY Castilleja JR Barrera EV Lozano K Polym Degrad Stab
200483383-8
[12] Probst O Moore EM Reasaco DE Grady BP Polymer 200454437-
43
[13] Kashiwagi T Grulke E Hilding J Harris R Awad W Douglas J
Macromol Rapid Commun 200223(13)761-5
[14] Yang J Lin YH Wang JF Lai MF Li J Liu JJ et al J Appl Polym
Sci 200598 1087-91
CHAPTER 7 CONCLUSIONS AND FUTURE PERSPECTIVES
71 Conclusions In this work the flame retardant and thermal mechanical properties of
an monocomponent epoxy resin additived with micro and nano fillers
are studied The experimental study is based on cone calorimeter
analysis and thermo-mechanical analysis and on the study of kinetic
parameters by Kissinger and Ozawa methods
Through the cone calorimeter test it has been demonstrated that the
zinc borate resulted as the best additive as it concerns the 30 and
40 percentages Furthermore the flame retardant effect of zinc borate
on the Epoxy resin neat is highlighted when it is synergistically used
with ATH instead as ZS and ZHS are concerned ZHS performs better
at the above mentioned percentages This comes up also by Kissinger
analysis (performed both in nitrogen atmosphere and in air atmosphere)
as ZHS shows two steps in nitrogen atmosphere (so as ATH does) and
epoxy resin neat shows one step In air atmosphere ZHS shows four
steps and epoxy resin neat shows two steps As the Ozawa model is
concerned the union of ZB and ATH improves the activation energy
From the residue analysis we can notice that ZB is the best additive
both regarding the char-formation temperature both regarding the
morphology
Thermo-mechanical analysis shows that all the additives provide an
improvement of the composites thermal expansion coefficient such as it
decreases upon the addition of additives respect to the neat resin
About nanotubes the used percentage is too low to observe any
meaningful effects in all of the analyses undertaken in this study
To conclude zinc borate is in the light of all performed analyses the
best additive the percentages where the effect of the additive can be
sensibly observed are 30 and 40
Chapter 7 Conclusions and future perspectives
133
72 Future Perspectives From our conclusions it is possible to suggest further studies on ZHS
and on its synergistic effect and an investigation on a possible synergy
between the used additives and the nanotubes As for nanotubes they
should be chosen with a higher statistical percolation threshold so to
use a higher additivation percentage
Moreover an interesting topic for future work is the comprehension of
the degradative mechanisms related to additives in terms of their
chemical properties and their interaction with the resin This study can
be carried out by means of FTIR and XRD analysis The study of the
actual mechanisms of degradation during the different heating steps
could lead to a better knowledge of kinetic parameters of the composite
systems
About fibres reinforced resin composites the study of the effects of
different lay-up methods on the thermal properties of the additivated
composites could lead to the improvement of their flame retardant
properties
- 1pdf
- 2cpdf
- 3bpdf
- 4pdf
- 5pdf
- 6pdf
- 7pdf
- 8bpdf
- 9pdf
- 10bpdf
- 11pdf
-