inside sales enablement: “let them drink coffee!”report, to achieve best-in-class performance,...
TRANSCRIPT
Inside Sales Enablement: “Let Them Drink Coffee!”
December 2009
Peter Ostrow
Inside Sales Enablement: “Let Them Drink Coffee!” Page 2
© 2009 Aberdeen Group. Telephone: 617 854 5200
Executive Summary Research Benchmark
Aberdeen’s Research Benchmarks provide an in-depth and comprehensive look into process, procedure, methodologies, and technologies with best practice identification and actionable recommendations
Top-performing sales organizations are meeting the challenges of increasing the quality and flow of leads presented to their “closers,” as well improving their overall revenue and sales effectiveness, by deploying well-supported and carefully structured inside sales teams to handle the top layers of the corporate sales funnel. With the ultimate goals of beating quota and improving their selling batting average, Best-in-Class companies are going far beyond the simple act of employing low-value staff to “dial for dollars” into aging, purchased contact lists, and instead showing demonstrable return on their extensive investments in advanced processes and enabling inside sales technologies.
Best-in-Class Performance In October and November, 2009, Aberdeen surveyed 488 end-user organizations to learn about their inside sales deployments. Aberdeen used the following four key performance criteria to distinguish the marketing and sales teams within Best-in-Class companies:
• An average 87% of sales representatives are currently achieving quota • 17% year-over-year increase in average corporate revenue • An average 7% year-over-year improvement in lead conversion rate • Average win/loss performance improvement of 6% year-over-year
Competitive Maturity Assessment Survey results show that the firms enjoying Best-in-Class performance share several common characteristics, including:
• 87% enjoy a collaboration between marketing and sales to agree on lead definitions
• 85% provide Inside Sales reps with access to prospect/customer business intelligence data
• 80% support email-integrated Customer Relationship Management “Inside sales represents a vital link between marketing and sales. While you’re doomed to failure if inside sales and lead generation aren’t designed to work together well, a strong inside sales function creates an effective common link and language tying the two groups together.”
~ Ralph Lentz, former COO and VP Sales, Human Concepts
Required Actions In addition to the specific recommendations in Chapter Three of this report, to achieve Best-in-Class performance, companies must:
• Pay attention to the organizational structures around inside sales, by ensuring that their mission is supported by processes, technologies, and direct links to the goals of the entire organization
• Amplify the conversation between inside sales professionals and their audience, with a rich flow of pre-call information that benefits the seller, and real-time, market-facing applications that add relevant, customized data and visually compelling, sensory-rich dimensions to the discussion, for both buying and selling professionals
• Mine their inside sales teams for best practices that can be optimized by other sellers such as field sales and channel partners – and for talent worth promoting into the “closer” ranks
www.aberdeen.com Fax: 617 723 7897
Inside Sales Enablement: “Let Them Drink Coffee!” Page 3
© 2009 Aberdeen Group. Telephone: 617 854 5200 www.aberdeen.com Fax: 617 723 7897
Table of Contents Executive Summary....................................................................................................... 2
Best-in-Class Performance..................................................................................... 2 Competitive Maturity Assessment....................................................................... 2 Required Actions...................................................................................................... 2
Chapter One: Benchmarking the Best-in-Class ..................................................... 4 The Business Context of Inside Sales.................................................................. 4 The Maturity Class Framework............................................................................ 6 Best-in-Class Business Landscape......................................................................... 7 The Best-in-Class PACE Model ............................................................................ 9 Best-in-Class Strategies........................................................................................... 9
Chapter Two: Benchmarking Requirements for Success ..................................13 Competitive Assessment......................................................................................13 Capabilities and Enablers ......................................................................................14 Best-in-Class Business Results from Deploying Capabilities and Enablers.....19
Chapter Three: Required Actions...........................................................................24 Laggard Steps to Success......................................................................................24 Industry Average Steps to Success ....................................................................24 Best-in-Class Steps to Success ............................................................................25
Appendix A: Research Methodology......................................................................27 Appendix B: Related Aberdeen Research .............................................................29
Figures Figure 1: Top Business Pressures Driving Inside Sales Deployments............... 4 Figure 2: Most Common Responsibilities of Inside Sales Teams ....................... 5 Figure 3: Goals of Inside Sales Teams by Best-in-Class ....................................... 8 Figure 4: Best-in-Class Inside Sales Compensation Trends................................. 8 Figure 5: Best-in-Class Strategic Actions in Response to Pressures...............10 Figure 6: Secondary Enablers Deployed More Frequently by the Best-in-Class......17 Figure 7: Year-over-Year Improvements in Company-oriented Sales Metrics by Best-in-Class ...........................................................................................................20 Figure 8: Year-over-Year Improvements in Individual-oriented Sales Metrics by Best-in-Class ...........................................................................................................21 Figure 9: Current Technologies Layered With Inside Sales..............................22
Tables Table 1: Top Performers Earn Best-in-Class Status.............................................. 7 Table 2: The Best-in-Class PACE Framework ....................................................... 9 Table 3: The Competitive Framework...................................................................13 Table 4: The PACE Framework Key ......................................................................28 Table 5: The Competitive Framework Key ..........................................................28 Table 6: The Relationship Between PACE and the Competitive Framework ...28

Inside Sales Enablement: “Let Them Drink Coffee!” Page 4
© 2009 Aberdeen Group. Telephone: 617 854 5200
Chapter One: Benchmarking the Best-in-Class
From early origins of cold-calling into purchased contact lists, to contemporary methodologies incorporating Web 2.0 enablers, companies seeking to steer highly qualified sales leads to their “closers” are faced today with a combination of competitive threats, information overload and hesitant buyer behavior requiring new strategies and tools to succeed. The never-ending economic pressure for sales organizations to increase productivity, while “doing more with less,” often results in organizational emphasis on segregating responsibilities between inside and outside sales teams.
Fast Facts
√ The average survey-responding company employs 46 inside and 106 outside sales reps; has an average deal size of $267k; and has annual revenue of $661M
√ Inside sales reps for surveyed organizations average 50 phone calls and 17 connects per day; interact with prospects an average of 3.87 times before passing leads to closers; and have a direct impact on 38% of overall corporate revenue
The Business Context of Inside Sales Few sales professionals would fail to instantly recognize the famous line from Glengarry Glen Ross, in which the regional sales manager played by Alec Baldwin in the movie version snarls, "Coffee is for closers!" In the cut-throat environment of commission-only sales reps vying for real estate deposits - and trying to keep their jobs - the protagonists of the story wheel, deal, cheat and lie their way toward getting their hands on "the good leads" that are held back by their manager and doled out only to the closers who end up succeeding more because of their back-stabbing internal tactics than due to displaying consistent best practices in skilled selling.
Figure 1: Top Business Pressures Driving Inside Sales Deployments
56%
27% 26% 26%
0%
10%
20%
30%
40%
50%
60%
Too manyprospects foroutside/field
sales team tocover
Increasedcustomer
demands forbetter service
or value
Improve salesforecastingaccuracy by
filtering qualityof leadsthrough
Insides Salesfunction
Organizationalexpansion
forcing us tocover new or
largergeographies
n = 488
Perc
enta
ge o
f Res
pond
ents
Source: Aberdeen Group, December 2009
www.aberdeen.com Fax: 617 723 7897
Inside Sales Enablement: “Let Them Drink Coffee!” Page 5
© 2009 Aberdeen Group. Telephone: 617 854 5200
Inside Sales Defined
For the purposes of this study, "inside sales" refers to any internal department tasked with early-stage sales activity, usually in the context of narrowing down larger quantities of “suspects” into well-vetted “leads” that are passed along to “closers,” field or channel sales representatives, or account managers responsible for closing the deal. Inside sales teams include those focused on both outbound activity and inbound response management; in contrast to customer-care teams, inside sales department members will generally carry team and/or individual sales quotas. In some cases inside sales is tasked with up- or cross-selling to existing customers; they are also frequently tasked with sourcing net-new business. Most inside sales deployments exist in the Business-to-Business (B2B) space, but certain Business-to-Consumer (B2C) environments may deploy such a functional department as well.
For this study, 488 companies were surveyed, of which 429 currently deploy an inside sales team.
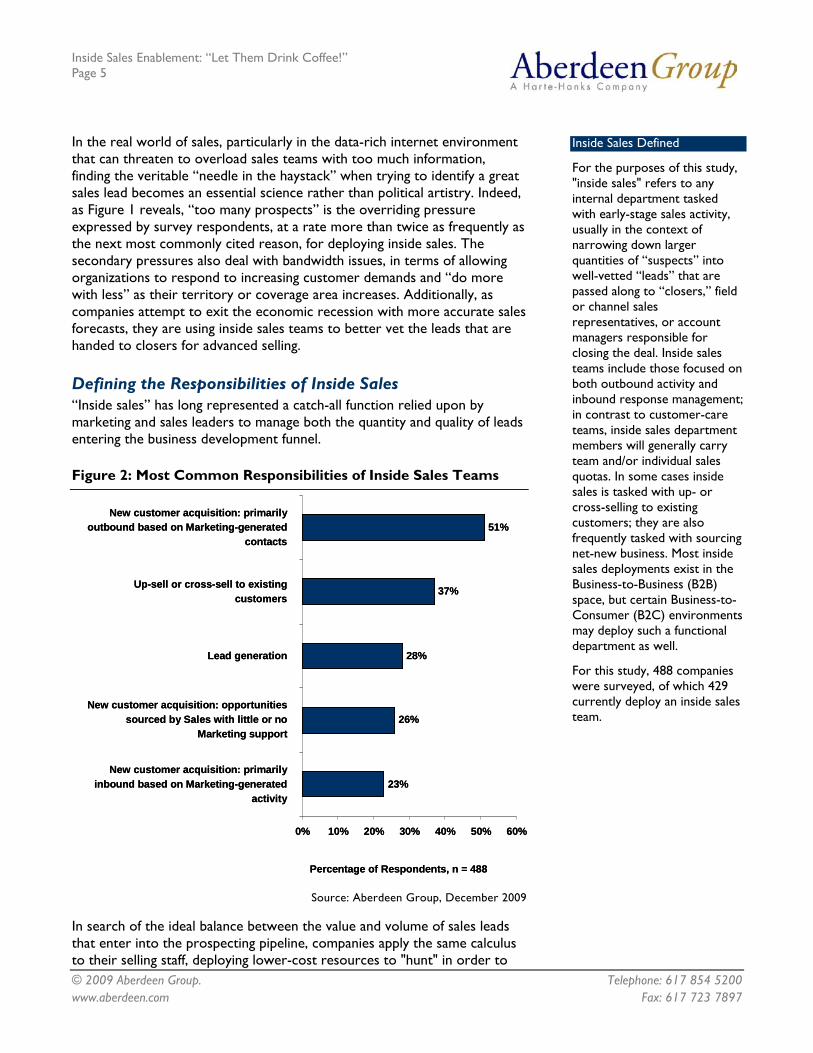
In the real world of sales, particularly in the data-rich internet environment that can threaten to overload sales teams with too much information, finding the veritable “needle in the haystack” when trying to identify a great sales lead becomes an essential science rather than political artistry. Indeed, as Figure 1 reveals, “too many prospects” is the overriding pressure expressed by survey respondents, at a rate more than twice as frequently as the next most commonly cited reason, for deploying inside sales. The secondary pressures also deal with bandwidth issues, in terms of allowing organizations to respond to increasing customer demands and “do more with less” as their territory or coverage area increases. Additionally, as companies attempt to exit the economic recession with more accurate sales forecasts, they are using inside sales teams to better vet the leads that are handed to closers for advanced selling.
Defining the Responsibilities of Inside Sales “Inside sales” has long represented a catch-all function relied upon by marketing and sales leaders to manage both the quantity and quality of leads entering the business development funnel.
Figure 2: Most Common Responsibilities of Inside Sales Teams
23%
26%
28%
37%
51%
0% 10% 20% 30% 40% 50% 60%
New customer acquisition: primarilyinbound based on Marketing-generated
activity
New customer acquisition: opportunitiessourced by Sales with little or no
Marketing support
Lead generation
Up-sell or cross-sell to existingcustomers
New customer acquisition: primarilyoutbound based on Marketing-generated
contacts
Percentage of Respondents, n = 488
Source: Aberdeen Group, December 2009
In search of the ideal balance between the value and volume of sales leads that enter into the prospecting pipeline, companies apply the same calculus to their selling staff, deploying lower-cost resources to "hunt" in order to
www.aberdeen.com Fax: 617 723 7897

Inside Sales Enablement: “Let Them Drink Coffee!” Page 6
© 2009 Aberdeen Group. Telephone: 617 854 5200 www.aberdeen.com Fax: 617 723 7897
ity,
ologies and
y is
s gy
ticket" sales leads so coveted by the Glengarry Glen Ross reps
t
the
filter the best revenue opportunities to more highly leveraged closers. Figure 2 supports this approach, showing that the most frequently citedduties of inside sales teams are primarily oriented around outbound activlocating new customers or new opportunities within existing accounts.
The requirement of a focus on these activities is often a significant investment in consulting, selection / placement, and learning and development services, as well as in a wide array of enabling technIT / telephony infrastructure, all geared toward pushing more revenue, more efficiently, through the enterprise. Whether the prime focus of angiven inside selling team is on net-new customer acquisition, or an emphason cross- and up-selling from current clientele, the need to achieve increased sales effectiveness through a properly deployed inside saleorganization becomes, for many, an essential focus of corporate strateand budget.
The "golden are introduced to us with no explanation of their source. In real-life B2B and B2C selling, of course, the acquisition of potential customer revenue often begins with incredibly complex and creative marketing initiatives thacrunch data, imply value, establish a personal connection with the prospect, and create a data trail that links buyer and seller. The sales process often begins with a multi-step methodology that continuously filters each individual record regarding their job role, industry niche, geography,company and, most importantly, the nature of their engagement with selling organization. At some point the interaction moves from marketing technology to human contact; this is the “moment of truth” at which insidesales organizations are typically deployed to make contact and hold the first of many crucial live conversations with the prospect/customer.
The Maturity Class Framework Aberdeen used four key performance criteria among responding
t-in-Class
eps achieving quota
organizations that deploy inside sales teams, to distinguish the Besfrom Industry Average and Laggard organizations:
• Current average percentage of individual sales r
• Year-over-year change in overall corporate revenue
• Year-over-year change in lead conversion rate
• Year-over-year change in win/loss performance

Inside Sales Enablement: “Let Them Drink Coffee!” Page 7
© 2009 Aberdeen Group. Telephone: 617 854 5200
Table 1: Top Performers Earn Best-in-Class Status
Definition of Maturity Class
Mean Class Performance (Year-over-Year)
Best-in-Class: Top 20%
of aggregate performance scorers
87% of inside sales reps currently achieve annual quota 17% average growth in overall corporate revenue; 80% have shown improvement 7% average increase in lead conversion rate (pass-through to closers); 47% have shown improvement 6% average improvement in win-loss ratio; 50% have shown improvement
Industry Average: Middle 50% of aggregate
performance scorers
52% of inside sales reps currently achieve annual quota No change in overall corporate revenue; 43% have shown improvement 1% average increase in lead conversion rate (pass-through to closers); 27% have shown improvement No change in win-loss ratio; 17% have shown improvement
Laggard: Bottom 30% of aggregate
performance scorers
25% of inside sales reps currently achieve annual quota 14% average decrease in overall corporate revenue; 10% have shown improvement 5% average decrease in lead conversion rate (pass-through to closers); 6% have shown improvement 7% average worsening of win-loss ratio; 5% have shown improvement
Source: Aberdeen Group, December 2009
Best-in-Class Business Landscape Before addressing the strategic actions taken by Best-in-Class enterprises around their inside sales deployments, it is important to gain an in-depth understanding of these unique teams, around how why they are deployed and rewarded.
“We use our sophisticated pipeline trending tool to look at all the opportunities in our funnel, the activities performed around them, and are able to understand not only what has changed, but why, based on activities registered through the system. This helps me better align our forecasts for management, which provide a more accurate view of our overall business.”
~ Christian Smith, VP Sales and Marketing, Daptiv
When survey respondents were asked about the relevant importance of assorted inside sales deployment goals, a common theme arises regarding the overall need for better sales effectiveness, especially in support of making the time spent by closers as efficient as possible (Figure 3). Where the Best-in-Class diverge from other companies, however, is around the relative importance of pre-closer qualification activity. In the ongoing discussions, and sometimes heated debates, between marketing and sales teams regarding lead quality – “Give me the Glengarry leads!” – this represents a wise focus on presenting closers with only the best opportunities, and thereby validating the expertise of lead generation professionals in the eyes of field sales. In fact, while the majority (73%) of
www.aberdeen.com Fax: 617 723 7897

Inside Sales Enablement: “Let Them Drink Coffee!” Page 8
© 2009 Aberdeen Group. Telephone: 617 854 5200
inside teams report to sales management, those reporting into marketing are better represented by the Best-in-Class, at 21% of respondents, compared with 15% of all other companies.
Figure 3: Goals of Inside Sales Teams by Best-in-Class
Best-in-Class Criteria Defined
The four Key Performance Indicators (KPIs) used by Aberdeen to segment the Best-in-Class, or top 20% of companies in the research by performance, are:
√ Current percentage of inside sales representatives who achieved their individual selling quota in the most recent fiscal year
√ Year-to-year growth in overall organizational revenue
√ Year-to-year growth in the average lead conversion or pass-through rate (leads accepted by closers or field sales from inside sales)
√ Year-to-year growth in win/loss rate (closer-accepted leads resulting in revenue)
57% 56%
72%
66%64%
59%
65%
54%
44%
40%
45%
50%
55%
60%
65%
70%
75%
Increase qualificationrates in order tominimize pass-
through ofunqualified leads
Increase conversionrates to improve
selling 'batting average'
Increase reach ratesin order to
maximize contactwith appropriate
suspects
n = 488
Perc
enta
ge o
f Res
pond
ents
Best-in-Class Industry Average Laggard
Source: Aberdeen Group, December 2009
This trend does not support adjusting the organizational chart so that marketing owns the inside sales function, but does speak to the value of isolating the lead vetting process in order to maximize the efficiency of the closer staff.
Figure 4: Best-in-Class Inside Sales Compensation Trends
57%
66%
74%
71%
67%
56%
40%
45%
50%
55%
60%
65%
70%
75%
Inside reps:fully loaded
comp > $50k
Outside reps:fully loadedcomp > $75k
n = 488
Perc
enta
ge o
f Res
pond
ents
Best-in-Class Industry Average Laggard
57%
66%
74%
71%
67%
56%
40%
45%
50%
55%
60%
65%
70%
75%
Inside reps:fully loaded
comp > $50k
Outside reps:fully loadedcomp > $75k
n = 488
Perc
enta
ge o
f Res
pond
ents
Best-in-Class Industry Average Laggard
Source: Aberdeen Group, December 2009
www.aberdeen.com Fax: 617 723 7897

Inside Sales Enablement: “Let Them Drink Coffee!” Page 9
© 2009 Aberdeen Group. Telephone: 617 854 5200 www.aberdeen.com Fax: 617 723 7897
When analyzing the relative compensation approaches of top performers versus other companies (Figure 4), it is also clear that inside sales teams are worthy of investment, in that nearly three-quarters of the Best-in-Class provide “fully loaded” (base salary, commissions, bonuses, benefits) totals in excess of $50,000 per year. This 24% premium over Laggards indicates that any traditional view of inside sales team members as low-skill, low-cost is unlikely to result in strong corporate performance. Indeed, as Figure 4 indicates, Laggards continue to trail other companies in compensating their outside reps or closers as well (see additional sidebar).
The Best-in-Class PACE Model Using inside sales teams to achieve corporate goals requires a combination of strategic actions, organizational capabilities, and enabling technologies and services that can be summarized as shown in Table 2.
Table 2: The Best-in-Class PACE Framework
Fast Facts
√ Among all companies, the average inside sales rep earns a “fully loaded” $69, 498 in base salary, commissions, bonuses, etc. Best-in-Class reps earn an average of 9% more than Laggards
√ Among all companies, the average outside sales rep earns a “fully loaded” $123,907 in base salary, commissions, bonuses, etc. Best-in-Class reps earn an average of 36% more than Laggards
Pressures Actions Capabilities Enablers Too many prospects for outside/field sales team to cover
Provide more consistency for prospect/customer interactions with our company Focus “closers” on closing, not prospecting Automate the capture and processing of data associated with prospects/customers
Documented process to direct incoming leads to relevant reps (call dispositioning) Formal sales training is provided for inside sales reps Collaboration between Marketing and Sales to agree on lead definitions Formalized and documented inside sales strategy Inside Sales reps have access to prospect/customer business intelligence data Inside sales reps can forecast based on actual data, vs. just a “gut feel” (data-driven forecasting) Performance objectives that need to be achieved are defined and agreed to by key stakeholders Business intelligence reporting or analytics for performance tracking
Email-integrated Customer Relationship Management (CRM) Real-time web visitor tracking Marketing automation Live chat Instant screen-sharing External, hosted contact center Co-browsing Preview dialing Click-to-call Intelligent call recording
Source: Aberdeen Group, December 2009
Best-in-Class Strategies The most popular responses from Best-in-Class organizations reporting on what strategic actions are taken to address business pressures, in the context of inside sales activity, are represented by Figure 5. These strategies follow a number of themes, but an underlying concern focuses on two key issues: sales efficiency and customer care. The following is an analysis of leading action items that these top-performing end-users are deploying, including relevant context from additional Aberdeen research findings.
Provide more consistency for prospect/customer interactions with our company: Best-in-Class companies are 13% more likely than others to identify this strategic action as a top-two choice, because they recognize that the comfort zone established between a potential buyer and an

Inside Sales Enablement: “Let Them Drink Coffee!” Page 10
© 2009 Aberdeen Group. Telephone: 617 854 5200
organization that speaks with “one voice” will have more efficient and progressively more valuable conversations, leading to more closed deals and a shorter sales cycle.
Figure 5: Best-in-Class Strategic Actions in Response to Pressures
13%
30%
32%
48%
52%
0% 10% 20% 30% 40% 50% 60%
Bring more of the salesorganization “in-house” instead
of relying primarily on field salesto hit our quota
Reduce responsetimes to increase
contact and qualification rates
Automate captureand processing
of prospect/customer data
Focus “closers”on closing,
not prospecting
Provide more consistencyfor prospect/customer
interactions
Percentage of Respondents, n = 488
“The beauty of the CRM application used by my team is that you don’t need 11 clicks to register a call logged and arrange a task to follow-up in the future.”
~ Chris Brown, President, ChaCha Mobile Search
Source: Aberdeen Group, December 2009
Much as Aberdeen research for Customer Experience Management: Engaging Loyal Customers to Evangelize Your Brand (July, 2009) showed that 65% of Best-in-Class organizations have empowered an executive level champion around maximizing the customer experience, the top performers within the inside sales enablement survey audience are more able than others (28% versus 9%) to have shortened their sales cycle on a year-over-year basis. In the era of multi-channel marketing campaigns, in which prospects are likely to click, see, and hear a stream of messages from the selling organization, maintaining consistency among the delivery mechanisms – and ultimately more satisfied return customers – such as inside sales, is crucial to growing revenue and allowing more reps to achieve their quota.
Focus “closers” on closing, not prospecting: it may seem an obvious action, but by a margin of 42% (48% of the Best-in-Class versus 28% for all other companies), the top performers recognize that the variety of selling skills and personas within their team should be segregated into inside and outside specialties. In the benchmark report on Sales Training: Translating Tribal Selling Knowledge into Bottom-Line Productivity (September, 2009), 47% of the best performers defined separate competencies for individual sales roles, such as inside, outside, field, channel, global accounts, etc., compared
www.aberdeen.com Fax: 617 723 7897
Inside Sales Enablement: “Let Them Drink Coffee!” Page 11
© 2009 Aberdeen Group. Telephone: 617 854 5200
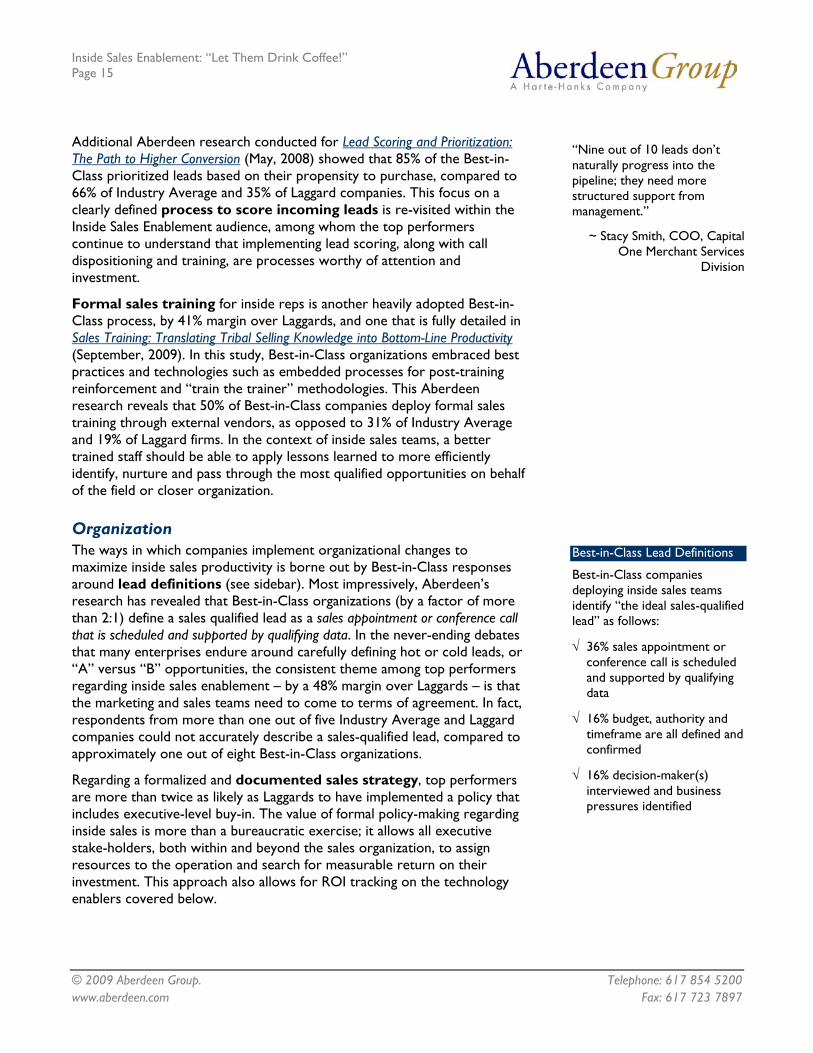
to only 36% of Laggards. The Best-in-Class understand that inside sales teams are better tasked with the higher-volume activities required to explore, vet, nurture and filter a larger number of “suspects” before turning them over for closing to the field sales team, whose responsibilities are typically more focused on bringing a smaller quantity of sales-qualified leads to the final signature stage. In fact, the Best-in-Class far out-dial and out-connect other companies by using the capabilities and technology enablers described below. Their inside sales reps typically make 55 telephone dials per day compared to 44 and 36 for Industry Average and Laggard companies; top performers have improved the number of phone connections per day, on a year-over-year basis, by 3%, compared with 1% for the Industry Average and a drop of 3% for Laggards.
“Our internal team uses the portal technology to keep track of when the prospect looked at something, which is vital to the sales process so we understand how to time future outreach. These metrics and analytics are tremendously helpful in achieving efficiencies.”
~ Garth Case, VP Information Technology, National
Basketball Association
Automate the capture and processing of customer data: end-users of inside sales enablement are 16% more likely than other companies to take an action around discovering and housing a centralized repository of customer-centric data such as company/contact information as well as transactional history. This activity will traditionally take place within the company’s CRM or Sales Force Automation (SFA) system. Additionally, though, Aberdeen research for Sales Intelligence: The Secret to Sales Nirvana (January, 2009) showed that 59% of the Best-in-Class have a process in place for unifying externally-sourced customer information gathered through multiple and disparate customer touch points, compared to 33% of other companies. The delta between these groups is even more significant within the Inside Sales Enablement audience: 54% of top performers incorporate sales intelligence into their inside sale technology platform, as opposed to 29% of Industry Average and 16% of Laggards. Enabling the inside team with consolidated, accessible and up-to-date customer data is clearly a wise technology investment.
Reduce response times to increase contact and qualification rates: speed is essential to running efficient sales operations, particularly in highly competitive selling environments. Within the Inside Sales Enablement data set, the Best-in-Class were able to improve their average lead response time (closers or field sales staff taking action on an inside sales-provided lead) on a year-over-year basis by 5%, while Industry Average companies improved by 1% and Laggards decreased performance by 3%. Moreover, 41% of the best performers showed a year-over-year increase, versus 23% for Industry Average and 10% for Laggards within the research. With an eye toward “working smarter, not harder” – perhaps “doing more with less” in a constricted economy – top performing sales organizations recognize the value of fast action by closers, in turning inside sales activities into pipeline content. Those which allow sales-qualified leads to linger within antiquated lead management systems, or get stuck in organizational limbo, run the risk of losing more deals and decreasing their overall sales effectiveness.
In the next chapter, we will see what the top performers are doing to achieve these gains.
www.aberdeen.com Fax: 617 723 7897
Inside Sales Enablement: “Let Them Drink Coffee!” Page 12
© 2009 Aberdeen Group. Telephone: 617 854 5200 www.aberdeen.com Fax: 617 723 7897
Case Study: Capital One Merchant Service Division
Consider the case of Capital One, whose Merchant Service Division (MSD) provides the “acquirer,” or intermediary services, that reside in between the banks who issue credit cards, and the card associations (Visa, MasterCard) that collectively process millions of transactions per day on behalf of retail merchants of all sizes. According to Stacy Smith, COO of the MSD, the combined sales team of 45 was inundated with inbound referrals from within the Capital One branch network. “As we continued to grow and diversify, we needed a system that could better track the increasing number of referrals, and a more robust process for calculating pass-through rates and close ratios."
Smith decided that Capital One would benefit from a better system that could capture leads, automate their distribution and merchant communications, and create a queuing system providing both reps and management with real-time insight into the status of every referral. He explains that, “Nine out of 10 leads don’t naturally progress into the pipeline; they need more structured support from management,” and that deploying a SaaS-based lead management system has created enormous value for MSD by adding new processes and visibility, as the company moves opportunities from the inside to outside sales teams.
One of the most valuable aspects of Capital One’s investment is the automated email and audit trail actions that are triggered as incoming leads are captured and assigned by the system. “Think of the key milestones in the sales process,” says Smith. “From the first moment of inbound referral, to a merchant’s initial contact with a human representative of our company, the automated emails compensate for our huge spikes in volume, and provide immediate feedback to the customer that we have them in our sights and are considering their need.” From an internal perspective, the same visibility allows MSD to track every customer “touch,” automate notifications to the referring bank branch, and give both managers and reps a real-time, and accurate view, of their activity, pipeline and performance.
As a result, Smith explains that, “We now have complete visibility into our sales chain,” as referrals are actioned by inside sales and moved to the closer team. “We understand our pipeline, can constantly adjust our nurturing criteria and lead rejection definitions, and better coordinate our overall program.” Perhaps most significantly, Capital One realized a significant improvement in the percentage of the new leads closing per month since their lead management implementation.

Inside Sales Enablement: “Let Them Drink Coffee!” Page 13
© 2009 Aberdeen Group. Telephone: 617 854 5200
Chapter Two: Benchmarking Requirements for Success
The selection of inside sales solutions and their integration within the daily lifecycle of selling play a crucial role in the ability to turn these strategies into profit. Below is an analysis of how top performers distinguish themselves from other companies through the implementation of capabilities and enablers that support excellence in inside sales results.
Competitive Assessment Aberdeen Group analyzed the aggregated metrics of surveyed companies to determine whether their performance ranked as Best-in-Class, Industry Average, or Laggard. In addition to having common performance levels, each class also shared characteristics in five key categories: (1) process (the approaches they take to execute daily operations); (2) organization (corporate focus and collaboration among stakeholders); (3) knowledge management (contextualizing data and exposing it to key stakeholders); (4) technology (the selection of the appropriate tools and the effective deployment of those tools); and (5) performance management (the ability of the organization to measure its results to improve its business). These characteristics (identified in Table 3) serve as a guideline for best practices, and correlate directly with Best-in-Class performance across the key metrics.
Table 3: The Competitive Framework
Best-in-Class Industry Average Laggards Documented process to direct incoming leads to relevant reps (call dispositioning)
80% 69% 57%
Formal sales training is provided for inside sales reps
73% 61% 43%
Management-defined process to score incoming leads
Process
67% 59% 38%
Collaboration between Marketing and Sales to agree on lead definitions
87% 61% 48%
Formalized and documented inside sales strategy Organization
78% 68% 35%
Inside Sales reps have access to prospect/customer business intelligence data
85% 77% 60%
Inside sales reps can forecast based on actual data, vs. just a “gut feel” (data-driven forecasting)
72% 47% 22%
Detailed conversation guides or scripts available to all inside sales reps
Knowledge
70% 56% 30%
Fast Facts
√ 28% of Best-in-Class companies shortened their sales cycle on a year-over-year basis, compared to 15% for Industry Average and 1% for Laggards.
√ Top performers increased their average deal size on a year-over-year basis by an average of 6%, with 45% of these Best-in-Class companies showing annual improvement - while 12% of Laggards improved, and the overall change for bottom performers was a decrease of 7%
www.aberdeen.com Fax: 617 723 7897
Inside Sales Enablement: “Let Them Drink Coffee!” Page 14
© 2009 Aberdeen Group. Telephone: 617 854 5200 www.aberdeen.com Fax: 617 723 7897
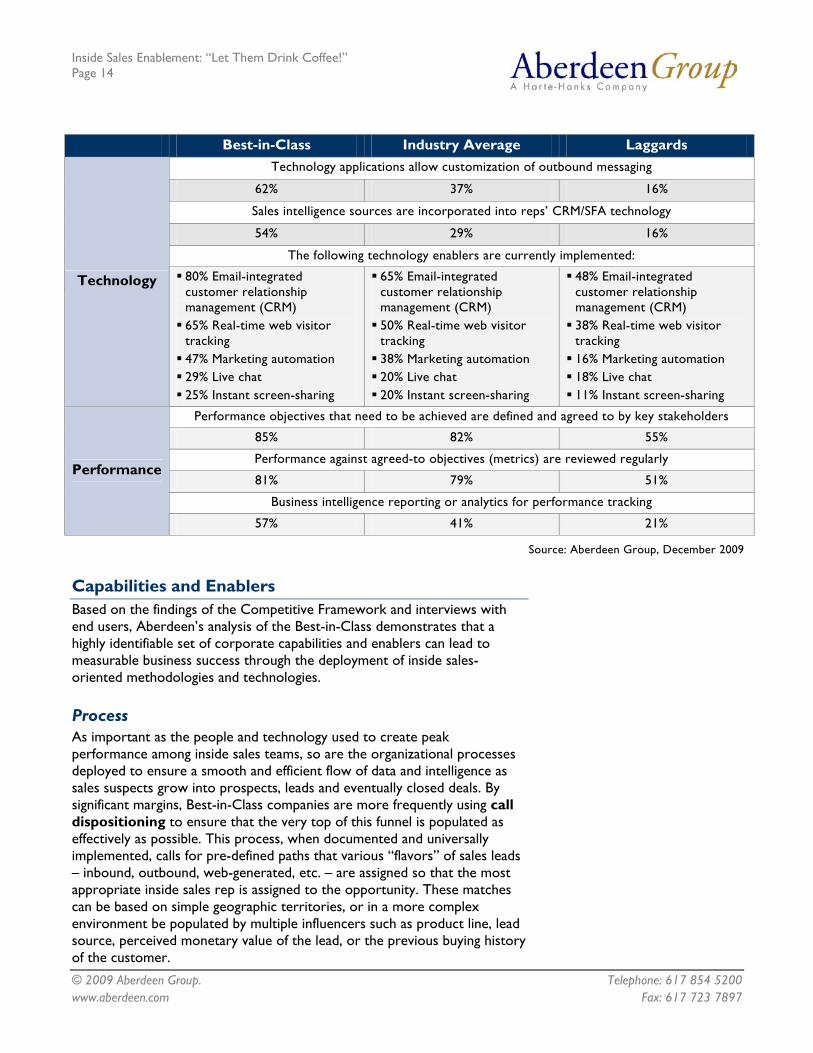
Best-in-Class Industry Average Laggards Technology applications allow customization of outbound messaging
62% 37% 16%
Sales intelligence sources are incorporated into reps’ CRM/SFA technology
54% 29% 16%
The following technology enablers are currently implemented:
Technology 80% Email-integrated customer relationship management (CRM) 65% Real-time web visitor tracking 47% Marketing automation 29% Live chat 25% Instant screen-sharing
65% Email-integrated customer relationship management (CRM) 50% Real-time web visitor tracking 38% Marketing automation 20% Live chat 20% Instant screen-sharing
48% Email-integrated customer relationship management (CRM) 38% Real-time web visitor tracking 16% Marketing automation 18% Live chat 11% Instant screen-sharing
Performance objectives that need to be achieved are defined and agreed to by key stakeholders
85% 82% 55%
Performance against agreed-to objectives (metrics) are reviewed regularly
81% 79% 51%
Business intelligence reporting or analytics for performance tracking
Performance
57% 41% 21%
Source: Aberdeen Group, December 2009
Capabilities and Enablers Based on the findings of the Competitive Framework and interviews with end users, Aberdeen’s analysis of the Best-in-Class demonstrates that a highly identifiable set of corporate capabilities and enablers can lead to measurable business success through the deployment of inside sales-oriented methodologies and technologies.
Process As important as the people and technology used to create peak performance among inside sales teams, so are the organizational processes deployed to ensure a smooth and efficient flow of data and intelligence as sales suspects grow into prospects, leads and eventually closed deals. By significant margins, Best-in-Class companies are more frequently using call dispositioning to ensure that the very top of this funnel is populated as effectively as possible. This process, when documented and universally implemented, calls for pre-defined paths that various “flavors” of sales leads – inbound, outbound, web-generated, etc. – are assigned so that the most appropriate inside sales rep is assigned to the opportunity. These matches can be based on simple geographic territories, or in a more complex environment be populated by multiple influencers such as product line, lead source, perceived monetary value of the lead, or the previous buying history of the customer.
Inside Sales Enablement: “Let Them Drink Coffee!” Page 15
© 2009 Aberdeen Group. Telephone: 617 854 5200
“Nine out of 10 leads don’t naturally progress into the pipeline; they need more structured support from management.”
~ Stacy Smith, COO, Capital One Merchant Services
Division
Additional Aberdeen research conducted for Lead Scoring and Prioritization: The Path to Higher Conversion (May, 2008) showed that 85% of the Best-in-Class prioritized leads based on their propensity to purchase, compared to 66% of Industry Average and 35% of Laggard companies. This focus on a clearly defined process to score incoming leads is re-visited within the Inside Sales Enablement audience, among whom the top performers continue to understand that implementing lead scoring, along with call dispositioning and training, are processes worthy of attention and investment.
Formal sales training for inside reps is another heavily adopted Best-in-Class process, by 41% margin over Laggards, and one that is fully detailed in Sales Training: Translating Tribal Selling Knowledge into Bottom-Line Productivity (September, 2009). In this study, Best-in-Class organizations embraced best practices and technologies such as embedded processes for post-training reinforcement and “train the trainer” methodologies. This Aberdeen research reveals that 50% of Best-in-Class companies deploy formal sales training through external vendors, as opposed to 31% of Industry Average and 19% of Laggard firms. In the context of inside sales teams, a better trained staff should be able to apply lessons learned to more efficiently identify, nurture and pass through the most qualified opportunities on behalf of the field or closer organization.
Organization Best-in-Class Lead Definitions
Best-in-Class companies deploying inside sales teams identify “the ideal sales-qualified lead” as follows:
√ 36% sales appointment or conference call is scheduled and supported by qualifying data
√ 16% budget, authority and timeframe are all defined and confirmed
√ 16% decision-maker(s) interviewed and business pressures identified
The ways in which companies implement organizational changes to maximize inside sales productivity is borne out by Best-in-Class responses around lead definitions (see sidebar). Most impressively, Aberdeen’s research has revealed that Best-in-Class organizations (by a factor of more than 2:1) define a sales qualified lead as a sales appointment or conference call that is scheduled and supported by qualifying data. In the never-ending debates that many enterprises endure around carefully defining hot or cold leads, or “A” versus “B” opportunities, the consistent theme among top performers regarding inside sales enablement – by a 48% margin over Laggards – is that the marketing and sales teams need to come to terms of agreement. In fact, respondents from more than one out of five Industry Average and Laggard companies could not accurately describe a sales-qualified lead, compared to approximately one out of eight Best-in-Class organizations.
Regarding a formalized and documented sales strategy, top performers are more than twice as likely as Laggards to have implemented a policy that includes executive-level buy-in. The value of formal policy-making regarding inside sales is more than a bureaucratic exercise; it allows all executive stake-holders, both within and beyond the sales organization, to assign resources to the operation and search for measurable return on their investment. This approach also allows for ROI tracking on the technology enablers covered below.
www.aberdeen.com Fax: 617 723 7897
Inside Sales Enablement: “Let Them Drink Coffee!” Page 16
© 2009 Aberdeen Group. Telephone: 617 854 5200
Knowledge Management Knowledge management best practices allow Best-in-Class sales teams to capture, store, improve and disseminate the right information to the right insides sales staffers, at the right time, for the right purposes. Access to business intelligence by inside reps, regarding their customers and prospects, allows them to dig deeper into their communities’ needs beyond one-dimensional contact records; this latter scenario only serves to encourage a “dial for dollars” methodology rather than more customer-centric or solution-oriented selling approach. With more rich intelligence about the financial news, corporate developments, detailed backgrounds on company executives, and even social media content at their fingertips, inside reps working at Best-in-Class companies are empowered by access to the most relevant information.
“Anytime you’re communicating with someone via the internet and can see the same thing (screen), it helps with better communication. Now, our agents can communicate with both high- and low- computer savvy users, completely over the web, whereas that customer may previously have been less likely to purchase over the internet.”
~ Daniel Andrus, Chat Administrator, Dish Network, supports
approximately 50 inside sales and over 200 additional staff
with live chat and screen sharing tools
Data-driven forecasting enables the ability for inside reps to accurately forecast their estimated amount of closed business within a specified timeframe, and is frequently supported by the Best-in-Class, 76% of whom employ formal sales analytics technologies to help identify and refine an accurate view of the sales pipeline in real-time. Only 40% of Laggards do so, while a surprising 78% of these bottom performers allow inside sellers to use their “gut feel” in predicting how much business they will generate. In a post-recession economy, where just-in-time delivery of goods and services can be considered essential to enterprise success, this lack of data-driven forecasting support is likely to spell trouble for sales teams hoping to hit their quota. It can also cause additional damage to the organization’s overall budgetary planning and realization, if inaccuracies in sales forecasting negatively impact accurate supply chain management and financial reporting.
A final knowledge management capability embraced by the Best-in-Class, detailed conversation guides for all inside sales representatives, is remarkably adopted by fewer than one-third of Laggard organizations. While locking sales reps into rigid scripts may not always represent a best practice, given the fact that inside sales teams are generally tasked with high-volume activities, it only makes sense to provide efficiency by standardizing at least some of what they say and do when communicating to the customer/prospect audience. It should be noted that Best-in-Class companies are 30% more likely than others to consider conducting “market validation to test product messaging or pricing” a vital strategic action. And this activity can be directly applied to adapting scripts and conversation guides for inside reps, as markets and results vary over time.
Enabling Technologies No technology enabler is more frequently cited by the Best-in-Class as email-integrated CRM tools. Significant Aberdeen research into the value of properly-deployed CRM, most recently The 2009 Sales Automation Report – Best-in-Class Strategies for Increasing Returns on SFA Investments (August, 2009) has shown that top performers are 30% more likely than Laggards to incorporate intense CRM usage into their daily selling lives. By blending email with this most common of sales-oriented applications, inside sales reps are able to launch messaging directly from their CRM interface, and
www.aberdeen.com Fax: 617 723 7897
Inside Sales Enablement: “Let Them Drink Coffee!” Page 17
© 2009 Aberdeen Group. Telephone: 617 854 5200
relevant stakeholders can quickly track the conversational history of each prospect and customer within the selling technology portal. Inside sales reps within Best-in-Class organizations are provided with this level of efficient technology integration 48% more frequently than their counterparts inside Laggard performers.
“When you have complex sale like ours, calling is essential to make a human connection and deliver an effective first message, but telephone selling is like a lost art.”
~ Tom Turner, SVP of Marketing and Channel Sales,
Q1 Labs
For many inside sales teams, the insight provided by real-time web visitor tracking allows them to know “who is visiting my web site right now,” empowering 65% of the Best-in-Class with incredibly rich and valuable knowledge that allows them to proactively call or contact the prospect or customer at the precise moment when their product research, or perceived buying behavior, is at its peak. Forty-two percent (42%) fewer inside sellers at the lowest-performing organizations are supported with this technology, meaning they have to simply guess when their audience is actively “pulling” data from the seller’s web site.
In many cases, real-time web visitor tracking is married to the use of live chat technology, a common consumer-oriented tool finding more traction in the B2B marketplace and deployed by almost a third of Best-in-Class companies’ inside sales reps. Compared to fewer than one in five Laggards, these progressive selling teams are investing in the key conversation that takes place between buyer and seller, on a more active and personal level, and earlier in the sales process than if a follow-up by email or web form was the only option of communication. As a result, the better-performing companies become more engaged with their customers and prospects, and earlier in the sales cycle.
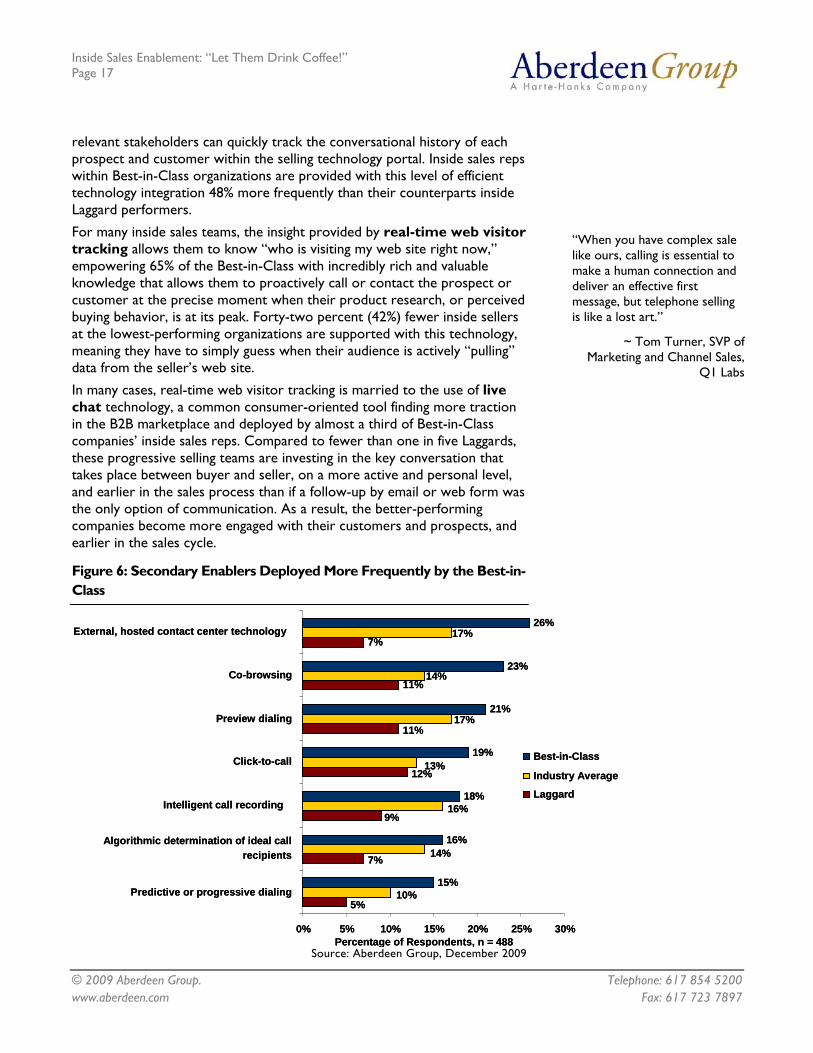
Figure 6: Secondary Enablers Deployed More Frequently by the Best-in-Class
11%
7%
14%
17%
15%
16%
18%
19%
21%
23%
26%
11%
12%
9%
7%
5%
17%
13%
16%
14%
10%
0% 5% 10% 15% 20% 25% 30%
Predictive or progressive dialing
Algorithmic determination of ideal callrecipients
Intelligent call recording
Click-to-call
Preview dialing
Co-browsing
External, hosted contact center technology
Best-in-Class
Industry Average
Laggard
11%
7%
14%
17%
15%
16%
18%
19%
21%
23%
26%
11%
12%
9%
7%
5%
17%
13%
16%
14%
10%
0% 5% 10% 15% 20% 25% 30%
Predictive or progressive dialing
Algorithmic determination of ideal callrecipients
Intelligent call recording
Click-to-call
Preview dialing
Co-browsing
External, hosted contact center technology
Best-in-Class
Industry Average
Laggard
Percentage of Respondents, n = 488Percentage of Respondents, n = 488
Source: Aberdeen Group, December 2009
www.aberdeen.com Fax: 617 723 7897
Inside Sales Enablement: “Let Them Drink Coffee!” Page 18
© 2009 Aberdeen Group. Telephone: 617 854 5200
“Live chat is very powerful. It gives us insight into the individual on the other side of the conversation, what they’re thinking about, and additionally provides both proactive and reactive options for a savvy user.”
~ Geoff Miller, Global Marketing Contact Center
Operations Manager, Cisco, supports 225 contact center
agents
In addition to these most popular Best-in-Class enabling technologies, a number of additional tools are deployed in smaller overall percentages, but as Figure 6 reveals, in far more Best-in-Class inside sales environments than in Industry Average or Laggard. These technologies include a number of enablers that can support the telephone-based activities of such personnel, such as preview/predictive dialing, click-to-call and conversation recording, as well as web-oriented support (such as co-browsing and externally hosted contact center options).
Performance Management Just as a formalized and documented inside sales strategy is an attribute of Best-in-Class selling teams, so too are mutually-defined and accepted performance objectives that allow for detailed and objective ROI measurements regarding all aspects of inside sales enablement. Indeed, while only 2% of top performers do not currently measure overall sales productivity – and all members of this small sub-set indicate plans to do so in the near future – a surprising 21% of Laggards have no insight into their own sales effectiveness. As the saying goes, “you have to measure it to manage it,” and the Best-in-Class clearly see the value in accomplishing both in support of their inside sellers. In addition, regular review of these metrics shows up as a choice taken by 37% more top performers than Laggards.
Finally, the idea of external business intelligence explained above as a knowledge-oriented capability, is complemented by an internal version – analytics for performance tracking – that is adopted by the Best-in-Class at nearly three times the frequency of bottom performers. Understanding how the sales team and its member individuals are performing against quota, particularly in real-time, is a crucial component of managing efficient inside teams. Indeed 29% of Laggards “don’t know” or “don’t measure” what percentage of their inside reps are currently achieving quota, compared to 16% of Industry Average companies and, predictably, 0% of the Best-in-Class.
Case Study: Cisco
Consider the case of Cisco, the largest network manufacturer in the world, and the 225 agents supported by Geoff Miller, Global Marketing Contact Center Operations Manager. This team has a wide variety of responsibilities, but the common theme, explains Miller, is that “they are the first line of defense in turning marketing-generated suspects into prospects,” regardless of what kind of original marketing activity motivated the initial outreach to Cisco. “Every record generates an activity for our team,” Miller says, “so we can quickly determine lead-worthiness in terms of budget and project opportunities, or whether to move the contact into a database queue for marketing or opt-in status.”
continued
www.aberdeen.com Fax: 617 723 7897
Inside Sales Enablement: “Let Them Drink Coffee!” Page 19
© 2009 Aberdeen Group. Telephone: 617 854 5200
Case Study: Cisco
The complexity of Cisco’s operations, however – frequent territorial and product changes for sites in 33 countries, augmented by multiple corporate acquisitions – created internal efficiency pressures that led to the creation of shared services such as Miller’s team. One of the crucial technologies deployed throughout the organization was live chat. “There are many reasons a prospect will initially communicate via email rather than pick up the phone for a more personal discussion,” explains Miller, “whether out of shyness, or just wanting to scratch the surface but with no initial buying intent.” With live chat, however, Cisco’s reps “can have instant insight into the prospect’s browsing history, depending on the activated chat features, into the individual themselves, and creates opportunities for both proactive and reactive conversational options,” such as suggesting contact with a subject matter expert.
Miller extols “the value of blending communications channels based on the instincts of the agent and their knowledge of the prospect’s browsing behavior…that was an ‘a-ha’ moment for me; I though you relied only on phone, email or chat, but blending them is far more effective.” The results for Cisco have been dramatic, with new feature roll-outs supported by the live chat function, and lead conversion ratios of 10% to 15% when using chat as the primary method of communication with prospects.
Best-in-Class Business Results from Deploying Capabilities and Enablers
“Our clients have transparent access to far more information about their pre-sales activity than ever before.”
~ Jenny Vance, President, LeadJen
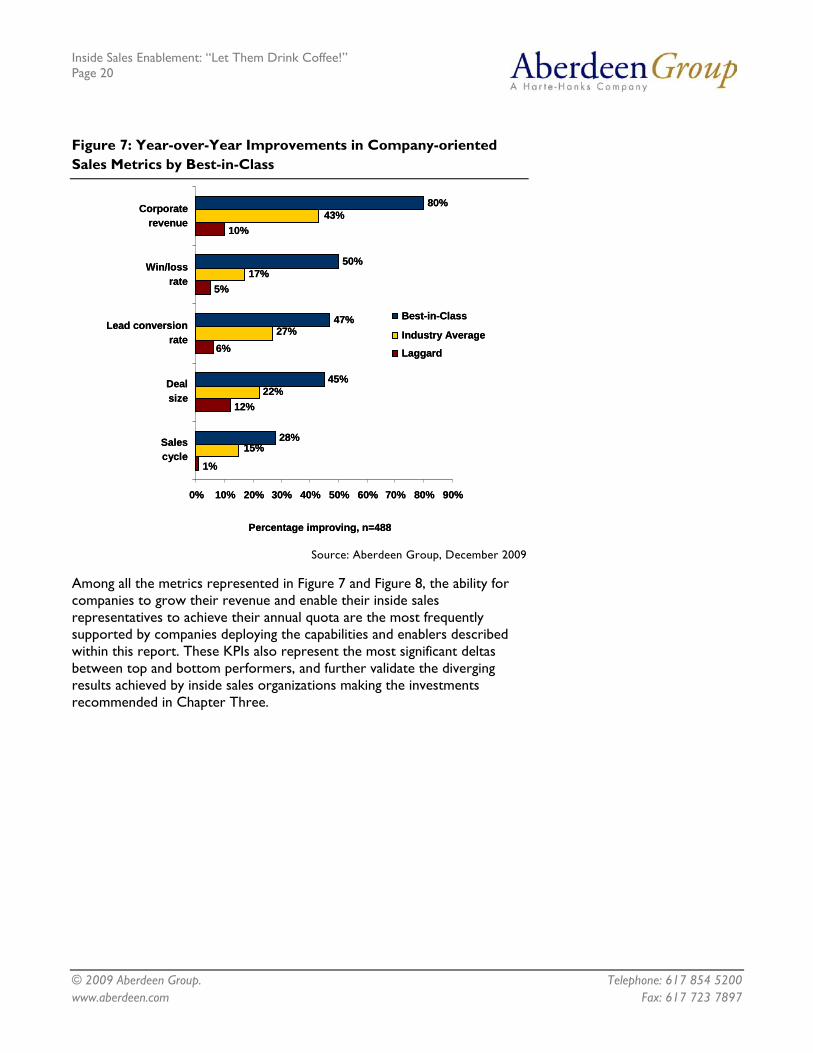
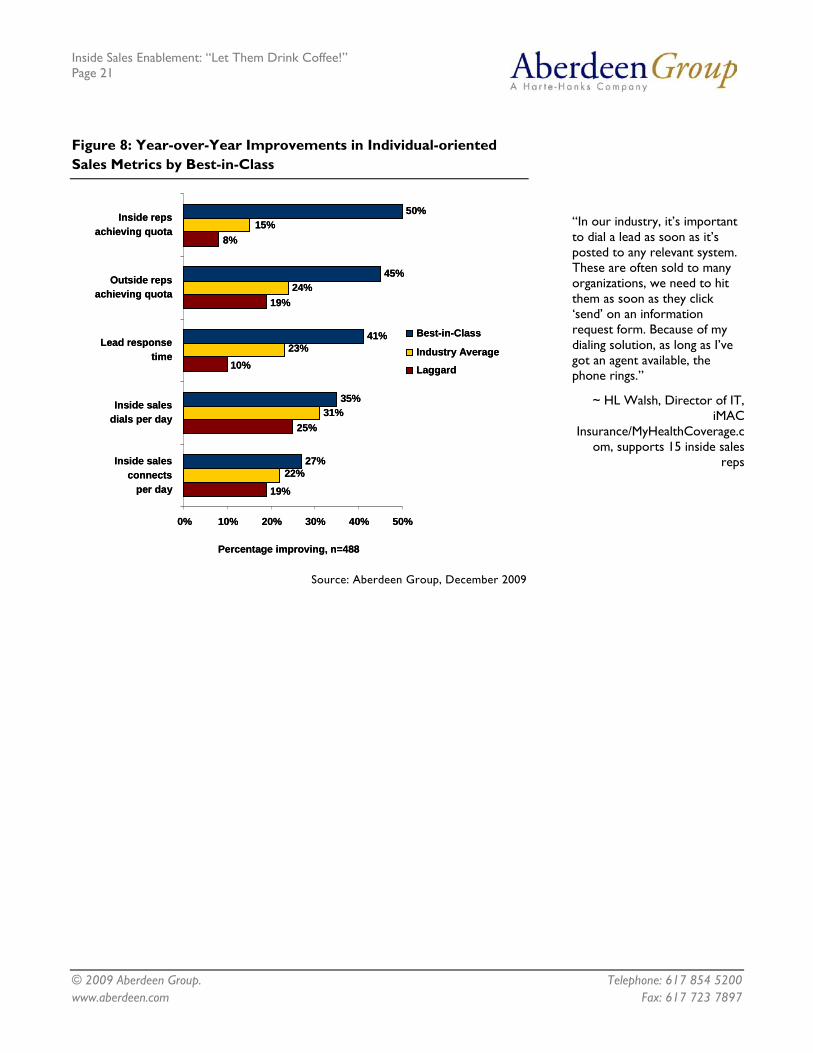
While the metrics used by Aberdeen to isolate the Best-in-Class within this research are spelled out in Table 1 in Chapter One of this research report, a more dramatic illustration of how sales organizations vary is illustrated by Figure 7 and Figure 8. These reveal how year-to-year changes in KPIs vary among the three maturity class cohorts, in terms of both overall team performance and individual levels of achievement. These figures detail the percentage of respondents, within each maturity class, which realized any type of improvement on a year-over-year basis.
www.aberdeen.com Fax: 617 723 7897
Inside Sales Enablement: “Let Them Drink Coffee!” Page 20
© 2009 Aberdeen Group. Telephone: 617 854 5200
Figure 7: Year-over-Year Improvements in Company-oriented Sales Metrics by Best-in-Class
28%
45%
47%
50%
80%
10%
5%
6%
12%
1%
43%
17%
27%
22%
15%
0% 10% 20% 30% 40% 50% 60% 70% 80% 90%
Salescycle
Dealsize
Lead conversionrate
Win/lossrate
Corporaterevenue
Percentage improving, n=488
Best-in-Class
Industry Average
Laggard
28%
45%
47%
50%
80%
10%
5%
6%
12%
1%
43%
17%
27%
22%
15%
0% 10% 20% 30% 40% 50% 60% 70% 80% 90%
Salescycle
Dealsize
Lead conversionrate
Win/lossrate
Corporaterevenue
Percentage improving, n=488
Best-in-Class
Industry Average
Laggard
Source: Aberdeen Group, December 2009
Among all the metrics represented in Figure 7 and Figure 8, the ability for companies to grow their revenue and enable their inside sales representatives to achieve their annual quota are the most frequently supported by companies deploying the capabilities and enablers described within this report. These KPIs also represent the most significant deltas between top and bottom performers, and further validate the diverging results achieved by inside sales organizations making the investments recommended in Chapter Three.
www.aberdeen.com Fax: 617 723 7897
Inside Sales Enablement: “Let Them Drink Coffee!” Page 21
© 2009 Aberdeen Group. Telephone: 617 854 5200
Figure 8: Year-over-Year Improvements in Individual-oriented Sales Metrics by Best-in-Class
27%
35%
41%
45%
50%
8%
19%
10%
25%
19%
15%
24%
23%
31%
22%
0% 10% 20% 30% 40% 50%
Inside salesconnects
per day
Inside salesdials per day
Lead responsetime
Outside repsachieving quota
Inside repsachieving quota
Percentage improving, n=488
Best-in-Class
Industry Average
Laggard
27%
35%
41%
45%
50%
8%
19%
10%
25%
19%
15%
24%
23%
31%
22%
0% 10% 20% 30% 40% 50%
Inside salesconnects
per day
Inside salesdials per day
Lead responsetime
Outside repsachieving quota
Inside repsachieving quota
Percentage improving, n=488
Best-in-Class
Industry Average
Laggard
“In our industry, it’s important to dial a lead as soon as it’s posted to any relevant system. These are often sold to many organizations, we need to hit them as soon as they click ‘send’ on an information request form. Because of my dialing solution, as long as I’ve got an agent available, the phone rings.”
~ HL Walsh, Director of IT, iMAC
Insurance/MyHealthCoverage.com, supports 15 inside sales
reps
Source: Aberdeen Group, December 2009
www.aberdeen.com Fax: 617 723 7897
Inside Sales Enablement: “Let Them Drink Coffee!” Page 22
© 2009 Aberdeen Group. Telephone: 617 854 5200
Aberdeen Insights — Technology
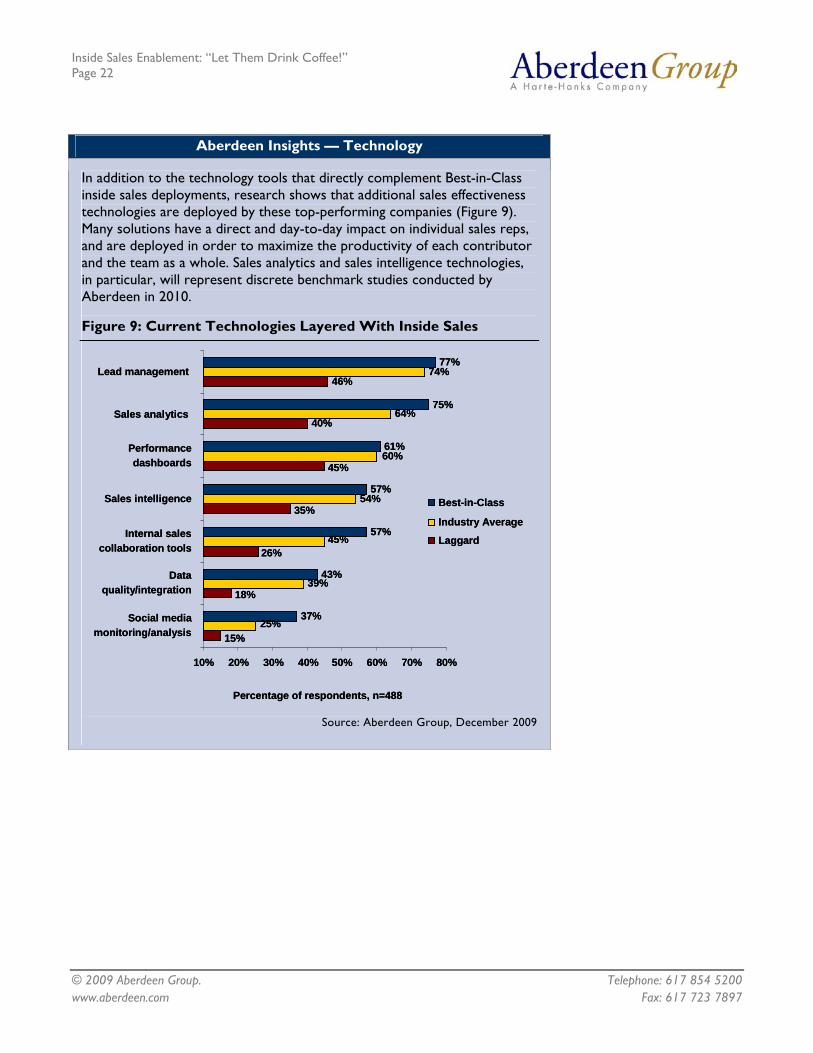
In addition to the technology tools that directly complement Best-in-Class inside sales deployments, research shows that additional sales effectiveness technologies are deployed by these top-performing companies (Figure 9). Many solutions have a direct and day-to-day impact on individual sales reps, and are deployed in order to maximize the productivity of each contributor and the team as a whole. Sales analytics and sales intelligence technologies, in particular, will represent discrete benchmark studies conducted by Aberdeen in 2010.
Figure 9: Current Technologies Layered With Inside Sales
40%
46%
64%
74%
37%
43%
57%
57%
61%
75%
77%
45%
35%
26%
18%
15%
60%
54%
45%
39%
25%
10% 20% 30% 40% 50% 60% 70% 80%
Social mediamonitoring/analysis
Dataquality/integration
Internal salescollaboration tools
Sales intelligence
Performancedashboards
Sales analytics
Lead management
Percentage of respondents, n=488
Best-in-Class
www.aberdeen.com Fax: 617 723 7897
Industry Average
Laggard
40%
46%
64%
74%
37%
43%
57%
57%
61%
75%
77%
45%
35%
26%
18%
15%
60%
54%
45%
39%
25%
10% 20% 30% 40% 50% 60% 70% 80%
Social mediamonitoring/analysis
Dataquality/integration
Internal salescollaboration tools
Sales intelligence
Performancedashboards
Sales analytics
Lead management
Percentage of respondents, n=488
Best-in-Class
Industry Average
Laggard
Source: Aberdeen Group, December 2009
Inside Sales Enablement: “Let Them Drink Coffee!” Page 23
© 2009 Aberdeen Group. Telephone: 617 854 5200 www.aberdeen.com Fax: 617 723 7897
Case Study – ChaCha
Consider the case of ChaCha, a start-up mobile search provider in need of a customer relationship management tool that would meet their particular needs. According to Chris Brown, President, “At this point, SaaS models for CRM are mostly repeat versions of the same technology,” but ChaCha needed a particularly nimble and flexible tool that would allow his sales team – which was experiencing turnover and included many remote staff – to accomplish the veritable “more with less.”
By “less,” Brown explains, “The beauty of the tool we chose is that you don’t need 11 clicks to simply register a sales call made and schedule a future follow-up task.” With CRM adoption a perennial challenge for sales leaders throughout industry, ChaCha found this simplicity refreshing, though the actual reason for a faster clickstream actually lay in the tool’s complex guided selling methodology, and its ability to segment prospects and customers into manageable groups of activity-specific tasks for the sales team. “We can also modify and customize the application,” continues Brown, “as well as pull detailed reports on the activities of each individual that helps us create prescriptive guidance for any type of selling situation, in real-time, as well as evaluate the effectiveness of individual marketing campaigns based on the success rate of reps’ activities.”
ChaCha is also able to better measure, and manage, its selling team as a result of deploying their new tool. “It has all the basics for lead generation and CRM that a start-up treasures,” Brown says, “and yet provides complex insight into appointment rates and close ratios, which allows us to quickly course-correct our reps’ behavior in real-time.”
Inside Sales Enablement: “Let Them Drink Coffee!” Page 24
© 2009 Aberdeen Group. Telephone: 617 854 5200
Chapter Three: Required Actions
Fast Facts
√ Best-in-Class sales organizations increased revenue-per-sales-rep by an average of 8% on a year-over-year basis, with 50% of these companies showing improvement. 8% of Laggards improved, with an average yearly decrease of 11%.
√ Among the Best-in-Class, 62% of outside sales reps, or “closers,” currently achieve their annual quota, compared to 52% for Industry Average and 41% for Laggard companies.
Whether a company is trying to move its performance in inside sales from Laggard to Industry Average, or Industry Average to Best-in-Class, the following actions will help spur the necessary performance improvements:
Laggard Steps to Success • Get organized on an institutional level by building a better
commitment to collaboration between the marketing and sales teams. The Best-in-Class are 45% more likely than Laggards to identify an answer to the crucial question, “what is a sales lead,” agreed to by both organizations, which in turn will yield a more streamlined organizational ability to formally define a strategy for the inside sales team – something achieved 55% more frequently by the Best-in-Class. With lead definitions and documented inside sales mission in hand, Laggards will be better enabled to efficiently score, process and flip the best leads from the inside team to the field sales or channel organization.
• Don’t rely on a “one size fits all” messaging strategy for the inside sales team. A surprisingly small audience of under-performing organizations, roughly one-fourth the percentage of the Best-in-Class, deploy technology solutions that allow their front-line sellers to customize outbound messaging, and fewer than one-third provide detailed conversation guides to their full inside team. Whether via phone, live chat, email or automated marketing campaigns, Laggards need to dramatically increase their teams’ ability to determine what each prospect, suspect or customer should see or hear, in order to deliver the most compelling and individualized content. Technology solutions such as email-integrated CRM go a long way toward enabling this approach.
Industry Average Steps to Success • Get your house in order regarding the sales lead process.
While Industry Average companies are out-pacing Laggards when it comes to revenue and quota performance, they still average 14% lower adoption rates, versus the Best-in-Class, of crucial organizational processes that directly impact inside sales efficiencies. Call dispositioning, or a formalized, pre-determined path to route various “flavors” of incoming leads to relevant sales reps, is a key growth area for Industry Average performers. Lead scoring methodologies represent a parallel process that these companies should more frequently deploy, in order to prioritize which prospect or customer conversations are more likely than others to be worth a high prioritization on the inside sales rep’s task list. Sales training, finally, represents an additional process-oriented area for the Industry Average to improve.
www.aberdeen.com Fax: 617 723 7897
Inside Sales Enablement: “Let Them Drink Coffee!” Page 25
© 2009 Aberdeen Group. Telephone: 617 854 5200
“Co-browsing is a very powerful tool for our organization. Within 10 seconds, in either a sales or trouble-shooting environment, it helps a prospect or client realize the full effect of what we’re trying to show them. We even use it to immediately dispute competitors’ claims in real-time.”
~ Frank Basanta, Director of Technology, Systems Solutions
• Manage Inside Sales with a 30,000-foot view of the sales organization’s overall health, by adopting performance tracking of the inside team through the deployment of business intelligence reporting and analytics. Best-in-Class sales teams reveal a 28% lead over the Industry Average in using powerful applications that can provide real-time insight into which teams or individuals are the most effective, or in need of life support, and often the reasons why. Add to this technology the advantages of data-driven forecasting, used by a third more top performers than Industry Average companies, and the ability for individual reps to better forecast their results can yield a clearer view of the overall company’s prospects and financial health.
Best-in-Class Steps to Success • Enrich the conversations that take place between your inside
sales reps and their prospects, by increasing the adoption of live chat, screen-sharing and co-browsing applications. While out-pacing other companies, the Best-in-Class should additionally benefit from ramping up the modest current levels of personalization that conversations will add by using these tools. By adding to the sensory connection between buyers and sellers, more sales-qualified leads are likely to be sourced, and more efficiently.
• Dial smarter, not harder by taking better advantage of click-to-call and preview/predictive/progressive dialing tools, as well as intelligent call recording, to help improve both the quality and quantity of conversations on a continuous basis. As the front line of selling prowess, the inside sales team needs to deploy its valuable human capital as efficiently as possible.
Aberdeen Insights — Summary (The Power of Inside Sales)
Organizations interested in empowering revenue success among their closers are wisely committing significant resources to the top of the sales funnel, both through advanced marketing techniques and in support of an inside sales organization tasked with providing an effective filter that turns suspects - into prospects - into opportunities.
continued
www.aberdeen.com Fax: 617 723 7897
Inside Sales Enablement: “Let Them Drink Coffee!” Page 26
© 2009 Aberdeen Group. Telephone: 617 854 5200 www.aberdeen.com Fax: 617 723 7897
Aberdeen Insights — Summary (The Power of Inside Sales)
Yet even if inside selling is deployed among lower-cost resources as compared to expensive closers, the cost of creating human contact between buying and selling parties is enormous compared to any automated process. It is easy to understand why a book purchase on Amazon.com needs to be handled by software, and why a multi-million-dollar technology deal must be managed by an experienced business development professional or selling team with a more personal and inherently manual process. But in between these extremes, organizations need to establish the ideal time to introduce human contact and, importantly, how to empower their inside team with processes, technologies and best practices that ensure they spend their time wisely.
Ultimately, companies seeking to succeed in the post-millennial economy will need to empower their first-contact sales staff with the tools necessary to sustain revenue and profitability through both recessionary and boom cycles, as they seek to source and win more deals from competitors and efficiently add to the revenue stream of current customers. Additional benefits of establishing measurable, manageable inside sales methodologies also include better collaboration between marketing and sales teams, more accurate corporate revenue forecasting, and better career path development from inside to field selling.

Inside Sales Enablement: “Let Them Drink Coffee!” Page 27
© 2009 Aberdeen Group. Telephone: 617 854 5200
Appendix A: Research Methodology
Between October and November 2009, Aberdeen examined the use, the experiences, and the intentions of 488 enterprises deploying Inside Sales teams in a diverse set of selling environments.
Study Focus
Responding executives, primarily in sales management roles, completed an online survey that included questions designed to determine the following:
√ The degree to which inside sales is deployed in their organization and the impact it has on achieving their business goals
√ The structure, effectiveness and satisfaction with existing inside sales implementations
√ Current and planned use of inside sales to achieve desired changes in revenue, quota and deal size
√ The benefits, if any, that have been derived from inside sales initiatives
The study aimed to identify emerging best practices for inside sales usage, and to provide a framework by which readers could assess their own management capabilities.
Aberdeen supplemented this online survey effort with interviews with select survey respondents, gathering additional information on B2B teleservices strategies, experiences, and results.
Responding enterprises included the following:
• Job title: The research sample included respondents with the following job titles: CEO / President (20%), EVP / SVP / VP (14%), Director (23%), Manager (26%), Consultant (4%) and other (13%).
• Department / function: The research sample included respondents from the following departments or functions: sales and business development (51%), marketing (20%), corporate management (10%), operations (6%) and other (13%).
• Industry: The research sample included respondents exclusively from software (35%), IT consulting and services (14%), computer equipment/hardware/peripherals (7%), wholesale distribution (5%) and other (32%).
• Geography: The majority of respondents (78%) were from the Americas. Remaining respondents were from the EMEA region (13%) and Asia-Pacific (9%).
• Company size: 17% of respondents were from large enterprises (annual revenues above US $1 billion); 31% were from midsize enterprises (annual revenues between $50 million and $1 billion); and 52% of respondents were from small businesses (annual revenues of $50 million or less).
• Headcount: 26% of respondents were from large enterprises (headcount greater than 1,000 employees); 29% were from midsize enterprises (headcount between 100 and 999 employees); and 45% of respondents were from small businesses (headcount between 1 and 99 employees).
www.aberdeen.com Fax: 617 723 7897
Inside Sales Enablement: “Let Them Drink Coffee!” Page 28
© 2009 Aberdeen Group. Telephone: 617 854 5200
Table 4: The PACE Framework Key
Overview Aberdeen applies a methodology to benchmark research that evaluates the business pressures, actions, capabilities, and enablers (PACE) that indicate corporate behavior in specific business processes. These terms are defined as follows: Pressures — external forces that impact an organization’s market position, competitiveness, or business operations (e.g., economic, political and regulatory, technology, changing customer preferences, competitive) Actions — the strategic approaches that an organization takes in response to industry pressures (e.g., align the corporate business model to leverage industry opportunities, such as product / service strategy, target markets, financial strategy, go-to-market, and sales strategy) Capabilities — the business process competencies required to execute corporate strategy (e.g., skilled people, brand, market positioning, viable products / services, ecosystem partners, financing) Enablers — the key functionality of technology and service solutions required to support the organization’s enabling business practices (e.g., development platform, applications, network connectivity, user interface, training and support, partner interfaces, data cleansing, and management)
Source: Aberdeen Group, December 2009
Table 5: The Competitive Framework Key
Overview The Aberdeen Competitive Framework defines enterprises as falling into one of the following three levels of practices and performance: Best-in-Class (20%) — Practices that are the best currently being employed and are significantly superior to the Industry Average, and result in the top industry performance. Industry Average (50%) — Practices that represent the average or norm, and result in average industry performance. Laggards (30%) — Practices that are significantly behind the average of the industry, and result in below average performance.
In the following categories: Process — What is the scope of process standardization? What is the efficiency and effectiveness of this process? Organization — How is your company currently organized to manage and optimize this particular process? Knowledge — What visibility do you have into key data and intelligence required to manage this process? Enabling Services and Technologies — What level of automation and business process outsourcing (BPO) have you used to support this process? How is this automation integrated and aligned? Performance — What do you measure? How frequently? What’s your actual performance?
Source: Aberdeen Group, December 2009
Table 6: The Relationship Between PACE and the Competitive Framework
PACE and the Competitive Framework – How They Interact Aberdeen research indicates that companies that identify the most influential pressures and take the most transformational and effective actions are most likely to achieve superior performance. The level of competitive performance that a company achieves is strongly determined by the PACE choices that they make and how well they execute those decisions.
Source: Aberdeen Group, December 2009
www.aberdeen.com Fax: 617 723 7897
Inside Sales Enablement: “Let Them Drink Coffee!” Page 29
© 2009 Aberdeen Group. Telephone: 617 854 5200 www.aberdeen.com Fax: 617 723 7897
Appendix B: Related Aberdeen Research
Related Aberdeen research that forms a companion or reference to this report includes:
• Sales Training: Translating Tribal Selling Knowledge Into Bottom-Line Productivity, September 2009
• Sales Training: Embedding Best Practices into Tribal Selling Knowledge; July 2009
• Sales Training: Tracking Best-in-Class Deployments; July 2009 • Sales Training: Instructor-Led Options for Best-in-Class Performance;
September 2009 • Sales Intelligence: The Secret to Sales Nirvana; January, 2009 • Sales Effectiveness: Pathways to Productivity; September, 2008 • Sales Analytics: Hitting the Forecast Bulls-Eye; July, 2008 • Sales Effectiveness: Leveraging Content to Close Deals, November, 2007 • Sales Effectiveness: Getting Sales Back to Selling; June, 2007 • Sales 2.0: Social Media for Knowledge Management and Sales
Collaboration; September, 2008 • Users of Sales and Marketing Solutions Display a Significant Lack of KPI
Awareness; August, 2008 Information on these and any other Aberdeen publications can be found at www.aberdeen.com.
Author: Peter Ostrow, Research Director, Sales Effectiveness ([email protected])
Since 1988, Aberdeen's research has been helping corporations worldwide become Best-in-Class. Having benchmarked the performance of more than 644,000 companies, Aberdeen is uniquely positioned to provide organizations with the facts that matter — the facts that enable companies to get ahead and drive results. That's why our research is relied on by more than 2.2 million readers in over 40 countries, 90% of the Fortune 1,000, and 93% of the Technology 500.
As a Harte-Hanks Company, Aberdeen plays a key role of putting content in context for the global direct and targeted marketing company. Aberdeen's analytical and independent view of the "customer optimization" process of Harte-Hanks (Information – Opportunity – Insight – Engagement – Interaction) extends the client value and accentuates the strategic role Harte-Hanks brings to the market. For additional information, visit Aberdeen http://www.aberdeen.com or call (617) 723-7890, or to learn more about Harte-Hanks, call (800) 456-9748 or go to http://www.harte-hanks.com.
This document is the result of primary research performed by Aberdeen Group. Aberdeen Group's methodologies provide for objective fact-based research and represent the best analysis available at the time of publication. Unless otherwise noted, the entire contents of this publication are copyrighted by Aberdeen Group, Inc. and may not be reproduced, distributed, archived, or transmitted in any form or by any means without prior written consent by Aberdeen Group, Inc. (071309b)