inside - brazil oil and gas oil and...bj vessel blue angel in guanabara bay ... that will be solved...
TRANSCRIPT

EPRASHEEDsignature series2007 – Issue 5
InsideWell Planned
Part 2Jose Formigli
Part 2
Seismic
Norway Oil & Gas, tt_nrg, Saudi Arabia Oil & Gas

EPRASHEEDsignature series
www.eprasheed.com
www.ttnrg.comwww.braziloilandgas.com
www.norwayoilandgas.com www.saudiarabiaoilandgas.com
BJ Vessel Blue Angel in Guanabara Bay

BJ Vessel Blue Angel in Guanabara Bay
EPRasheed offers specialized services for the Oil and Gas Industry:• Marketing,MediaManagement,
SupplementsandAdvertising
• TechnicalGhostWritingofcompany,SPEandindustryarticles
• TechnicalTranslationofcompanybrochures,productinformation,technicaldata,instructionmanualsand field applications
• InEnglish,Portuguese,Arabic,RussianandSpanish
Trinidad48-50 Sackville St, Port of SpainTlf: + 1 868 730 6443
London11 Murray St, Camden, NW1 3RETlf + 44 20 71 93 16 02
BrazilAv. Prado Junior, 48 Sala 210 Copacabana Rio de Janeiro - Tlf: + 55 21 22 75 44 92
Supplements
Technical Translations
EngineeringMarketing Communications
Increase SalesBrochures
Technical ArticlesSave Time
Communicate with Oil and Gas Companies
See us at: OTC, SPE/LACPEC, OE and SPE/ATCEEPRASHEEDsignature series

EP FEATuRE 2Petrobras EP Executive Manager Jose Formigli interview
WELL PLANNED 2The second of three articles based on excerpts from the book Hydrocarbon HighwayBy Wajid Rasheed
CENPES ENVISIONS NEW SEISMIC TECHNOLOGIESBy Wajid Rasheed
SEISMIC THROWS uP AN ARRAY OF APPLICATIONSBy EPRasheed Staff
DEEPWATER FIELDSBy R.F.T.Lomba, A.L.Martins, A.F.L.Aragao, A.Calderon, Petrobras Petroleo Brasileiro S.A.
EP IN RuB AL KHALIReproduced from Saudi Arabia Oil & Gas - a sister magazine
TRANSPETRO PIPELINE INTEGRITY PROGRAMBy Paulo de Tarso Arruda Correia, Petrobras Transporte S.A. - Transpetro
SPONSOR BJ SERVICESEnvironmentally Sensitive Well Cementing Technology
EPRASHEEDsignature series
2007 – Issue 5
EditorsWajid [email protected] Bradbury (Intl)JC Cunha (Technology)Majid RasheedMauro Martins
Trinidad
n Shrimati [email protected]: 1 868 730 6443
Houston n William Bart [email protected]: (1) 713 304 6119
ArtistsDesign concept: Wajid RasheedAlexandra BrunaNeuza MarcondesFernanda Brunoro
Braziln Ana Felix [email protected]: (55) 21 9714 8690n Monica Placido [email protected]: (55) 21 9213 0629n Roberto S. [email protected]: (55) 22 8818 8507
United Kingdom
n Head OfficeTel: (44) 207 193 1602
n David [email protected]: (44) 776 955 4051
ADVERTISERS: C&C TECHNOLOGIES - page 7, TESCO - page 15, VETCO - page 19, CGGVERITAS - page 21, GEORADAR - page 23, RXT - page 27, IBP - page 47, SMITH BITS - page 48
Brazil oil & gasContents


Petrobras EP Executive ManagerJose Formigli interview
EP Feature
By Petrobras Press Office and EPRasheed Staff
PART 2
The second of a two-part interview.
� Brazil Oil and Gas Issue 5

EP Feature

Photo: Steferson Faria
Q: Brazil Oil & Gas – How does Petrobras approach the application of technology?
A: Jose Formigli – The Petrobras technological strategy consists of three main dimensions:
- Technology demands identification;
- Technology development and availability;
- Technology application and implementation
Petrobras has a system for identifying its technology demands. Each professional within the Company may access this system with the technological demands he/she is facing. Once a year, a group of technical managers - Technological Operational Committee - get together per technical area in order to select and prioritize the demands that will be solved with internal or external (partnership or external technological providers) resources.
Petrobras’ technology development also has a process for following up the progress of the technological projects being developed internally, in partnership, or externally in order to guarantee they are being developed according to the original planning.
Finally, once Petrobras has developed or made available certain technology, there is a process for homologation and implementation of this technology, which passes through the execution of pilot projects or prototype developments.
All of these dimensions are supported by a Technological Management Process that is composed by a Strategic Technological Committee – CTE - that gathers top level company managers in order to define the short, medium and long term technological and operational guidelines. This committee is responsible for defining strategic planning for the Company’s technological area through the technological factors; a logical group of technologies that contribute to actual and future company business. Another process that composes the Petrobras Technological Management Process is the Operational Technological Process - CTO. This process is responsible for generating and managing the technological project portfolio. The committee in charge of this process, the Operational Technological Committee, is formed by a group of technical managers per technical area.
Q: Brazil Oil & Gas – What is Petrobras’ strategy for mature fields?
� Brazil Oil and Gas Issue 5

A: Jose Formigli – Mature fields count for 60% of our domestic oil production and 40% of our domestic proven reserves. More than 200 fields from our national portfolio can be considered as mature or brown fields. Petrobras considers a mature field or brown fields as the ones that have already passed their peak production. Even the Campos Basin Unit with our giant Marlim field is in a mature stage of production development. As a result we are focusing our mature areas and in August 2004 we launched a Corporative Program called RECAGE, with the main objective of revitalizing our mature fields.
The RECAGE Program is structured in 3 themes: Projects and Processes Management, Production Increase, and Cost Optimization. The idea is to help Business Units identify new opportunities to increase production, improve the process of management, assure that we are applying the best practices, and optimize costs in order to extend the productive life of our mature fields. To extend the productive life means that we are increasing the ultimate recovery factor in an economic way.
Q: Brazil Oil & Gas – What are the new technology developments for flow assurance and processing engineering?
A: Jose Formigli – Regarding Flow Assurance, one of the major challenges faced today relates to the optimized design of flowlines in deepwater production. There is a great need for better predictive techniques (laboratorial and/or numerical) of the risks of line blockage due to hydrates, waxes, asphalthenes and scaling. With such tools, subsea production systems (layouts, lines, insulation and heating devices) and chemical inhibition facilities will have an optimized design, that can lead to a considerable CAPEX reduction.
Another major challenge is preventing hydrate formation when producing small and medium size deepwater accumulations of non-associated gas. In such cases, very often the installation of a FPU exclusively for gas processing and treatment is not economically feasible. So, there comes the need for long tie-backs for gas export to a distant FPU or even straight to shore. Solutions such as the use of insulation systems (pipe-in-pipe, for instance) associated with thermodynamic inhibition are being pursued.
In terms of heavy oil production from deepwater fields, the tendency is to promote the use of pumping/boosting systems. Potential solutions such as ESPs (both downhole
In terms of heavy oil production from deepwater fields, the tendency is to promote the use of pumping/boosting systems. Potential solutions
such as ESPs (both downhole or at the seabed), volumetric (Twin Screw) pumps, as well as those using hydraulic power (Jet Pumps and Hydraulic
Submersible Pumps) are being considered. Hydraulic power has the advantage of making water the continuous phase, thus reducing flow
viscosity, but this may lead to problems with hydrate formation.
�Brazil Oil and Gas Issue 5

or at the seabed), volumetric (Twin Screw) pumps, as well as those using hydraulic power (Jet Pumps and Hydraulic Submersible Pumps) are being considered. Hydraulic power has the advantage of making water the continuous phase, thus reducing flow viscosity, but this may lead to problems with hydrate formation.
that require a smaller footprint area and weight on the FPU. The tendency is to look for optimized electrostatic treatment of water-in-oil emulsions in the first stage separators (such as the use of VIEC or LOWAC technologies).
When producing offshore gas fields distant from the FPU, another important technological challenge is the dehydration of gas streams near the well (such as the TWISTER method), so as to avoid hydrate formation in the flowline.
Q: Brazil Oil & Gas – What sub-sea engineering solutions has Petrobras identified?
A: Jose Formigli – Petrobras has been working in subsea technology development for ultra deepwater, heavy oil and mature fields. Among these initiatives, we can mention:
- Subsea raw water injection system for the Albacora field, that will allow a considerable amount of water to
SPONSORED BY BJ
As for Process Engineering, a great challenge is the development of a subsea separation system for produced water reinjection, minimizing the need for treatment facilities on the FPU. Such systems will probably need to make use of a serial arrangement of hydro cyclones for water treatment without flotation.
Another effort is to develop process and treatment equipment for heavy and ultra heavy crude oil fields
Environmentally Sensitive Well Cementing TechnologyBJ Services is the first company to bring to Latin America a complete suite of environmentally safe cement additives - including additive packages for gas-tight slurries - which equally comply with PLONOR regulations in the North Sea.
With 50 years’ experience in Latin America, BJ Services has supported operators with innovative technologies and services related to production enhancement, well construction and well completion. In Brazil, BJ Services was the first company to introduce an environmentally friendly fracturing fluid in 2003, and, since then, BJ’s stimulation vessels offshore Brazil have done several successful frac jobs using this fluid.
+55 21 2136-9230Phone
Rio de Janeiro
10 Brazil Oil and Gas Issue 5

application. The main advantage of this development is the ability to retrieve the ESP without performing a true workover, since the ESP is placed outside the production well, dowstream of the subsea tree. This technology will be applied in the Jubarte and Golfinho fields, as the first unit is already installed and ready to be connected to the P-34 platform.
- Production risers for ultra deepwater applications, capable of overcoming the technical challenge of fatigue life caused by the motions induced by waves and wind on the floating production unit and the sea current acting on the riser structure. These special pipelines must be compatible with the produced fluids (sometimes sour service) and preferably be capable of being installed by a variety of pipelay vessels, since those are critical resources on the production development program. Petrobras is developing ultra deepwater flexible flowlines, cladded steel catenary risers and tower configuration risers. Another important aspect related to production risers is integrity management. So, development of monitoring and inspection techniques is also being carried out.
be injected in the reservoir, without installing complex topside sea water treatment and pumping systems on the existing production platforms. The system will comprise a subsea filter and pumping unit and will be connected to the existing platform via an electric power and control umbilical.
- Subsea water separation and pumping system. The objective of this system is to separate the produced water at the subsea station, pump the produced water into an injection well and leave the oil & gas stream flow to the existing production platform. This system is attractive to mature heavy oil fields, that present increasing water cut such as the Marlim field. The use of a subsea water separation system will help de-bottleneck the processing facilities of the existing platforms. The main challenge is to develop an uncomplicated system, which is to be installed subsea and is capable of effectively separating the heavy oil with severe tendency of stable emulsion formation.
- Subsea pumping modules, placed at mudline, extending the scenarios for ESP (electrical submersible pump)
"When producing offshore gas fields distant from the FPU, another important technological challenge is the dehydration of gas streams near the well (such as the TWISTER method), so as to avoid hydrate
formation in the flowline."
11Brazil Oil and Gas Issue 5

Courtesy of BP
Well Planned12 Brazil Oil and Gas Issue 5

Well PlannedBy Wajid Rasheed
TargetsTargets usually refer to geological targets, which are the depths of formations that likely contain oil and gas. Depths are expressed as vertical and measured depths. True Vertical Depth for our purposes refers to a particular depth taken as a ninety degree straight line down to the depth of interest. The measured depth is the actual distance drilled. Other formations or markers along with their age and lithology ie sand/shale will be noted. The TVD is measured from the top of the target to the bottom height of the reservoir. When you read that a reservoir had 78 feet of ‘pay’ or oilbearing sands that refers to the vertical height of an oil and gas reservoir. ‘First oil’ refers to the time at which production of a certain reservoir occurs.
In the darkReservoir information on exploratory drilling will be limited or even unavailable. However, there may be some basic info on formation markers, porosity permeability,
temperatures, expected hydrocarbon gas or oil. Reservoir pressure, formation markers, the TVD, the tops of formations, and a range of pressures will all need to be predicted. Only upon drilling will true values be confirmed. Most of the large integrated service companies offer down-hole formation pressure while drilling tools.
Regulatory ComplianceAll regulations including health and safety considerations and environmental protection will be cited and acted upon.
Potential hazardsHazards are identified as geological/formation related and environmental/operational. Exemplifying the former are shallow gas, shallow water flows, charged zones, depleted zones, overpressure, abnormal temperatures, presence of H2S, CO2, and pressure faults. These will be covered in part by the Well Control Plan which will have considered all components of the wellhead and well control equipment.
PART 2
The second of three articles based on excerpts from the book Hydrocarbon Highway
13Brazil Oil and Gas Issue 5

This includes:
• All wellhead components
• BOP stack & valves
• Accumulator
• Choke and kill lines
• Choke manifold
• Gas buster (or poor boy de-gasser)
• Drill string safety valves
• Standpipe manifold
• High pressure mud lines and system (including cementing system)
• Drill strings
• Drill stem testing surface and subsurface equipment
• Subsea well control equipment, if drilling from a floating vessel
Operational hazards range from well-bore positioning (such as avoiding collision with existing wells or pipelines), avoiding shipping channels, avoiding cetaceans or other protected marine life. Operational risks include maintaining casing integrity, avoiding casing wear (casing is metal tubing used to protect well-bores), maintaining well-bore stability and managing any pressure ramp near TD.
Formation Evalution Plan.This plan will include provision for LWD or the Logging program. This will outline requirements for cuttings samples, mud logging and formation logging. This allows the oil company to characterize formations and understand actual drilling conditions which will vary from seismic. PWD tools exist also and can replace wireline or pipe-conveyed logging services and are made up as part of the BHA. This allows operators to measure formation pressure as they are encountered which improves well control, safety and drilling efficiency.
Potential hazards such as shallow gas flows or severe pressure changes can be noted earlier and preventative action taken which lowers risk and operational cost. Usually, these systems make use of binary coding using mud pulse telemetry where surface operator and subsurface tool communicate by means of pressure pulses that are sent through the column of drilling mud during drill-pipe connections.
Mud-logging SystemDuring drilling operations a multitude of measurements are taken and monitored. Temperature, pressure, depth, torque and loading are just a few. Several systems exist on rigs to fulfil this function with mud-logging being a primary one.
Operational hazards range from well-bore positioning (such as avoiding collision with existing wells or pipelines), avoiding shipping channels, avoiding cetaceans or other protected marine life. Operational risks include maintaining casing integrity, avoiding casing wear (casing is metal tubing used to protect well-bores), maintaining well-bore
stability and managing any pressure ramp near TD.
14 Brazil Oil and Gas Issue 5


The use of mud-logging systems was first introduced in the industry in the 1960s. Since then, advances in instrumentation and in the number of measured parameters have resulted in much more sophisticated mud-logging systems.
The advent of deepwater drilling also contributed to the progress of mud-logging techniques. Deep and ultra-deep water environments require very accurately controlled drilling operations. Any failure or negligence may cause human injury and economic losses. To control processes accurately, enhanced mud-logging was required.
Mud-logging systems encompass two different sorts of data. Firstly they collect and analyze formation samples (shale-shaker samples). Secondly, they measure and monitor mechanical parameters related to the drilling operation. Both provide invaluable data as to whether formations encountered bear oil and gas or how drilling is going.
Examining Cuttings Drilling chips or returns also known as ‘cuttings’ provide the operator with information as to whether hydrocarbons have been found, by carefully examining cuttings brought up by the circulating bit. The mud logger or geologist samples cuttings from the flow equipment by using a microscope or ultraviolet light to determine the presence of oil in the cuttings. Where
gas reserves are concerned, he may use a gas-detection instrument.
During drilling, an operator will observe mud-logging parameters for any abnormalities. If an observed parameter presents unusual behavior, the operator immediately communicates this to the driller who will carry out certain procedures to solve the problem. Actually, the system allows the programming of alarms that will sound in the mud-logging cabin, alerting the mud-logger that the value of the observed parameter is outside of the programmed range.
The number of observed parameters may vary according to a particular characteristic of the drilling operation. The most common measured parameters are: Well Depth (Depth), True Vertical Depth (TVD), Bit Depth, Rate of Penetration (ROP), Hook Height, Weight on Hook (WOH), Weight on Bit (WOB), Vertical Rig Displacement (Heave), Torque, Drill-string rotation per minute (RPM), Mud Pit Volume, Pump Pressure, Choke Line Pressure, Pump Strokes per minute (SPM), Mud Flow, Total Gas, Gas Concentration Distribution, H2S concentration, Mud Weight in/out, Drilling Fluid Resistivity, Drilling Fluid Temperature, Flow Line, LAG Time, and Stand Length.
It is noticed that only some of the listed parameters are really measured using sensor devices. Some of them are
Mud-logging systems encompass two different sorts of data. Firstly they collect and analyze formation samples (shale-shaker
samples). Secondly, they measure and monitor mechanical parameters related to the drilling operation. Both provide
invaluable data as to whether formations encountered bear oil and gas or how drilling is going.
1� Brazil Oil and Gas Issue 5

estimated from measured parameters. The WOB, for instance, is an estimated parameter. It is calculated using the WOH (a measured parameter) and the weight of drill-string elements.
Well LoggingUsing a portable laboratory, truck-mounted for land rigs, well loggers lower devices called logging tools into the well on wire-line. The tools are lowered all the way to the bottom and then reeled slowly back up. As the tools come back up the hole, they are able to measure the properties of the formations they pass.
Electric logs measure and record natural and induced electricity in formations. Some logs ping formations with sound and measure and record sound reactions. Radioactivity logs measure and record the effects of natural and induced radiation in the formations. These are only a few of the many types of logs available. Since all the logging tools make a record, which resembles a graph or an electrocardiogram (ECG), the records, or logs can be studied and interpreted by an experienced geologist or engineer to indicate not only the existence of oil or gas, but also how much may be there. Computers have made the interpretation of logs much easier and logging tools using real-time transmission systems are now capable of imaging the wellbore as it is drilled.
Although logging and measurement while drilling (LWD/MWD) tools have been available for many years, it is only recently that advances in data transmission and interpretation have progressed to generate accurate images of the wellbore. These images are based on real time data and offer insight into what is really happening downhole.
Typically, a high quality image is drawn from detailed, three-dimensional resistivity data. This data is supplied by a resistivity tool similar to a logging formation micro-imager, which is run on wireline. The resistivity tool is capable of identifying wellbore features and characterizing faults, cementation changes and threaded or spiraling caused by bit whirl. Software transforms the resistivity data into images of 3-D wellbores that are viewable at all angles with simple mouse movements. The resistivity measurements are transformed into 56 azimuthal sectors around the circumference of the wellbore to provide extremely detailed images.
The combination of resistivity and density services based on real-time logging images and geo-steering techniques is likely to enable operators to reduce risk and overcome geological uncertainties commonly associated with complex wells.
17Brazil Oil and Gas Issue 5

Ultra high telemetry rates (12 bits per second) have been successfully used to optimize horizontal well placement as well as warn of wellbore stability issues before they become serious enough to jeopardize operations or impact drilling costs.
Wellbore stability problems are detected with ultrasonic calipers from density logging while drilling (LWD) tools. Hole enlargement or washouts can be identified while drilling or during subsequent trips. This is beneficial as it helps monitor wellbore stability and allows adjustments to be made to mud weights or effective circulating density as required. Wellbore stability problems are confirmed using vision technology incorporating Azimuthal Density/Neutron viewer software, which provides density image and caliper data while drilling. The software also generates 3-D images and caliper logs. Together, these offer easier methods of understanding well bore conditions during drilling operations. Additionally, the 3-D density images and ultrasonic caliper allow wellbore instability mechanisms to be better characterized, and when necessary, resolved. This is particularly important in completions where gravel packs or expandable screens are required. The ultrasonic and density caliper information
gathered during drilling can indicate whether hole quality is good enough to permit specialized completions to proceed. An up log obtained on a subsequent wiper trip allows visualization of the hole enlargement and stress failures after drilling.
Specialized software uses a recorded mode to gather real-time dip information, provided by the LWD resistivity imaging tools. This information is harnessed to view geological structures and reduce the uncertainties in pre-existent geological models. Analysis of surface seismic can also help indicate the possibility of erosion surfaces, which can jeopardize well navigation. Specialized data transmission from the rig site allows continuous observation of the wellbore to anticipate changes in the bedding plane and structure behavior of the reservoir.
The software also allows structural dip picking from images, which can be used in combination with the real-time data for structural interpretation. Bed dips and layer thickness are also characterized permitting the evaluation of structural cross-sections. The reduction in risk and geological uncertainty will make the advent of wellbore imaging hard to resist for production companies.
Ultra high telemetry rates (12 bits per second) have been successfully used to optimize horizontal well
placement as well as warn of wellbore stability issues before they become serious enough to jeopardize
operations or impact drilling costs.
1� Brazil Oil and Gas Issue 5


CENPES envisions new seismic technologiesQ: Brazil Oil & Gas – What are the major upcoming seismic technology projects?
A: Eduardo Faria – Petrobras’ R & D programs are based on overcoming a group of operational and geophysical challenges that Petrobras assets present. To this end there is a broad range of projects which includes imaging sub-salt migration phenomena and the modeling of seismic data. The prize is to access reservoirs but there are many obstacles. For example, one of these obstacles is radial salt closure which prevents current seismic technology from producing good quality images.
Q: Brazil Oil & Gas – What Sub-salt seismic applications exist in Brazil?
A: Eduardo Faria – Today, Petrobras is exploring several frontier areas in the Santos and Campos Basins. These frontiers encompass deep subsalt reservoirs – this is a
By Wajid Rasheed
frontier that has very little characterization to date, yet holds a very high potential for hydrocarbon plays. In terms of perspectives for Brazil we are looking for migration at 1000-2000m TVD depth. At depths beyond 2000m, the salt breaks up which causes further problems.
Q: Brazil Oil & Gas – What are the Petrophysical challenges associated with heavy oil?
A: Eduardo Faria – This is one of the biggest challenges that we face. Petrobras has an agreement with a university in Houston and in Colorado which covers a multi-client research and development project. This covers the issues of seismic attenuation and enhancing the extraction of field data.
Q: Brazil Oil & Gas – How does Seismic imaging help drill more ‘wet’-holes?
20 Brazil Oil and Gas Issue 5

CENPES envisions new seismic technologies
A: Eduardo Faria – Seismic multi-component 3 and 4D technologies along with better seismic imaging helps drill more ‘wet’-holes because it provides greater precision of the location and migration of hydrocarbons. Multi component involves larger volumes of data but it also enables the direct detection of hydrocarbons as well as reservoir geometries.
Q: Brazil Oil & Gas – What is the role of vertical seismic profiling (VSP) in exploratory and development drilling apps?
A: Eduardo Faria – VSP aids exploratory and development drilling by reducing risk and uncertainty. In this way, seismic has evolved from being an exploratory risk mitigating tool to a reservoir management tool with applications in mature fields.
In the future the plan is to implement permanent seabed cables which take a lifecycle approach and includes taking repeat shots, overlaps and using permanent cables that use fibre-optics. This is because shear waves do not travel through water and therefore require seabed and solid media. VSP Multi Component are typically double the cost of regular P wave or marine.
Q: Brazil Oil & Gas – How has multi-component 3D, 4C, 4D, time lapse seismic developed?
A: Eduardo Faria – For example, last year Petrobras commissioned the industry’s first 3D 4C in ultra-deep waters in the Roncador field where water depths are approximately 2000m. In this survey, cables stretching 4 miles were placed on the seabed and data was acquired under the PRAVAP mature fields (see Issue 1 Farid) where P waves were not applicable.
Q: Brazil Oil & Gas – What applications are there for Electro magnetic surveys?
A: Eduardo Faria – Magnetic seabed logging using controlled source electronic mechanism (CSEM) is interesting. There is an agreement to interprete and visualize this data as seabed logging allows physical qualities to be mapped with high resolution.
An artificial electro-magnetic source is used on the seabed in conjunction with recording instruments that register resultant magnetic fields. A low frequency signal is emitted by the source which penetrates formations to a given depth. The CSEM system is useful because it can help differentiate between hydrocarbons and water. This is because the CSEM propagates more effectively and is subject to less attenuation in higher resistivity layers, which are precisely the formations of interest; hydrocarbon bearing.
SPONSORED BY CGG
21Brazil Oil and Gas Issue 5

"With 4D time based seismic it is also possible to view migration as two time lagged surveys, say a year apart, which will show how
hydrocarbons have moved."
Seabed logging allows the physical qualities to be mapped in those areas with high resistivity allowing the accurate delineation of reservoirs. Although this is an auxiliary technique it offers great value in deep and ultra deep water applications.
The key is its combined use with wider seismic, which enables better characterization and hence a better return on investment for exploratory and delineation projects.
Deeper prospects combined with the subsalt challenges are likely to increase demand for long offset data. The longer the offset between the source and the receiver, the deeper the survey.
Here we have to pay careful attention to environmental controls to minimize any impact and work within distance limits.
Q: Brazil Oil & Gas – What other new technologies are being developed?
A: Eduardo Faria – Petrobras is developing passive seismic where there is no man-made source. The source consists of harnessing naturally occurring sounds, of which there are two types – the first are micro-seismic events and the other is injecting CO2 gas, which is registered at surface. The origin of the source is not well established but is thought to be tidal based.
Q: Brazil Oil & Gas – What is the role of seismic visualization?
A: Eduardo Faria – Petrobras has visualization rooms in all its operational sites and in other locations where engineers can ‘see’ reservoirs. The development of visualization tools has been conducted in conjunction with the Catholic University (PUC). This has allowed us to image ‘harder to see’ reservoirs such as thin layers, which can be missed by conventional seismic. With 4D time based seismic it is also possible to view migration as two time lagged surveys, say a year apart, which will show how hydrocarbons have moved.
22 Brazil Oil and Gas Issue 5


Courtesy of Petrobras
24 Brazil Oil and Gas Issue 5

Seismic throws up an array of applications
25Brazil Oil and Gas Issue 5
Greater well placement accuracy, better reservoir characterization and enhanced production curves are just some of the offerings of seismic.
Traditionally, seismic has always been synonymous with greenfield or exploratory development. However, it has successfully branched out to brownfield or mature applications. It has now become a tool that accompanies the life-cycle of the asset providing value in prospect selection, reducing drilling risk and maximizing production at all stages of recovery.
Driven by various operational and geophysical obstacles worldwide, seismic technology has thrown up an array of applications that include the imaging of deepwater sub-salt migration and plays, the drilling of more ‘wet’ holes, Vertical Seismic Profiling, Electro-magnetic seismic, 4D time-lapse seismic and Passive seismic.
Sub-salt seismic Increasingly oil companies are moving out to deep and ultra deepwater frontier locations and greater emphasis
is placed on characterizing deep subsalt reservoirs. The prize is to access reservoirs and maximize production but there are many obstacles. One of which is, for example, massive salt sections in deepwater acreage that complicates seismic acquisition and imaging. These are frontier areas characterized by expensive wildcats that hold very high hydrocarbon bearing potential. In terms of plays this can be seen with a series of sub-salt finds in the US GoM, for Brazil and Angola. However, massive salt sections can block or attenuate seismic, making the extraction of field data more difficult.
Approximately 15 years ago, the industry started to overcome the depth penetration issues and subsalt attenuation limitations. In those days, 2 Dimensional seismic technology (2D) could often only locate ‘shallow plays’. In contrast, today’s multi-component 3 and 4D seismic can help resolve the problems of poor acquisition and attenuation due to massive salt sections and locate deeper reservoirs below mature fields or salt sections which were previously uncharacterized. Exemplifying
By EPRasheed Staff
Recognized as a key oilfield technology, Seismic has made a tremendous contribution to EP by adding reserves and improving production.
This article looks at the major seismic technologies that service and oil companies are betting on in the race to find and produce reserves.
26 Brazil Oil and Gas Issue 5


Time lapse or 4D seismic accompanies the lifecycle of an oil and gas asset providing valuable seismic information on the asset as it matures. This can generate tremendous value in
shaping decisions as to the peaking of production rates, decline curves and secondary recovery techniques.
this are the new deep gas plays being explored in the Gulf of Mexico (both Mexican and US waters) and Offshore Eastern Brazil. Deeper reservoirs or those located below salt would have been overlooked as previously seismic was not capable of penetrating beneath shallow reservoirs or below formations containing thick layers of salt. Hand in hand with seismic advances have been drilling technology firsts such as overcoming directional control and drilling torque problems of drilling 10km depths.
Such deeper prospects combined with subsalt are increasing demand for long offset data. The basic principle is that the longer the offset between the source and the receiver, the deeper the survey. Here all parties involved must pay careful attention to environmental controls to minimize any impact and work within distance limits. For deeper or sub-salt seismic, two seismic vessels are run together with both shooting simultaneously and using long streamers. Global Positioning Systems are used to keep the two vessels at a known distance and this maintains the required distance between the source and streamer to accurately measure seismic reflections from deep and sub-salt formations.
Seismic imaging helps drill more ‘wet’-holesSeismic multi-component 3 and 4D technologies along with better seismic imaging helps drill more ‘wet’-holes because it provides greater precision of the location and
migration of hydrocarbons. It is has been shown that with the availability of timely information, accurate reservoir models can be constructed, and smart, controllable wells can be planned. Multi component acquisition involves larger volumes of data but it also enables the direct detection of hydrocarbons as well as reservoir geometries.
Reservoir monitoring begins with a baseline survey, preferably acquired before any production of hydrocarbons has begun. A monitor survey is later acquired after production has begun, and a physical change in the reservoir state has occurred. Successive monitor surveys are then acquired throughout the lifetime of reservoir production.
4D seismicTime lapse or 4D seismic accompanies the lifecycle of an oil and gas asset providing valuable seismic information on the asset as it matures. This can generate tremendous value in shaping decisions as to the peaking of production rates, decline curves and secondary recovery techniques. Usually, a cost-benefit analysis is conducted which measures costs and attributes the value gained. This exercise can be difficult as the value gained may often be indirect. 4D seismic is mainly used to better manage reservoir production across the lifecycle of a field. Due to the increasing number of brown fields worldwide applications of 4D seismic have increased substantially.
28 Brazil Oil and Gas Issue 5

Oil companies are developing passive seismic where there is no man-made source. The source consists of harnessing naturally occurring sounds, of which there are two types – the first are
micro-seismic events and the other is injecting CO2 gas, which is registered at surface. The origin of the source is not well
established but is thought to be tidal based.
However, as 4D seismic is a recent technology there are relatively few processes available to evaluate it. This has allowed us to image ‘harder to see’ reservoirs such as thin layers, which can be missed by conventional seismic. With 4D time based seismic it is also possible to view migration as two time - lagged surveys, say a year apart, to show how hydrocarbons have moved.
Vertical Seismic Profiling (VSP)VSP aids exploratory and development drilling by reducing risk and uncertainty. In this way, seismic has evolved from being an exploratory risk-mitigating tool to a reservoir management tool with applications in mature fields. Offshore, the trend is for the installation of permanent seabed cables. These provide a lifecycle perspective by taking repeat shots, overlaps and using permanent cables that use fibre-optics. This is because shear waves do not travel through water and therefore require seabed and solid media. However the cost of VSP Multi Component data can be typically double the cost of regular P wave or marine.
Electro magnetic surveys Magnetic seabed logging using controlled source electronic mechanism (CSEM) is another emerging area of interest. Here the focus is on interpreting and visualizing data as seabed logging allows physical qualities to be mapped with high resolution. An artificial electro-magnetic source is used on the seabed in conjunction with recording instruments that register resultant magnetic fields. A low frequency signal is
emitted by the source, which penetrates formations to a given depth. The CSEM system is useful because it can help differentiate between hydrocarbons and water. This is because the CSEM propagates more effectively and is subject to less attenuation in higher resistivity layers, which are precisely the formations of interest; hydrocarbon bearing. Seabed logging allows the physical qualities to be mapped in those areas with high resistivity allowing the accurate delineation of reservoirs. Although this is an auxiliary technique it offers great value in deep and ultra deep water applications. The key is its combined use with wider seismic which enables better characterization and hence a better return on investment for exploratory and delineation projects.
Passive SeismicOil companies are developing passive seismic where there is no man-made source. The source consists of harnessing naturally occurring sounds, of which there are two types – the first are micro-seismic events and the other is injecting CO2 gas, which is registered at surface. The origin of the source is not well established but is thought to be tidal based.
In all these applications and others, seismic plays a special role in reducing oil and gas EP risk. There are not many technologies that have such a broad range of oilfield uses – seismic is one of them.
Acknowledgements: Calvert, 2005; Faria 2006; Long PGS, 2006 and Rasheed, 2006.
29Brazil Oil and Gas Issue 5

Fluid challenges for long horizontal section offshore wells in
deepwater fields
By R.F.T.Lomba, A.L.Martins, A.F.L.Aragao, A.Calderon, Petrobras Petroleo Brasileiro S.A.
Fluid issues include the efforts required to minimize interaction between the drilling or completion fluid with the reservoir fluid. Invasion diagnosis and prevention and emulsion prevention are the main challenges to be overcome.
Q: Brazil Oil & Gas – What are the difficulties faced with oil exploitation in deepwater well design?
A: R.F.T. Lomba (Petrobras) - Oil exploitation in a deepwater environment presents several particularities concerning well design. Due to the low sediment coverage, rock formations frequently present low competency and, consequently, a narrow window between pore pressure and frac pressure. Due to this fact, the design of long horizontal section wells, where annular friction losses play a major role on down hole pressure, may be a complex task.
We focus on ways to evaluate and minimize fluid invasion and consequent formation damage to the reservoir.
Q: Brazil Oil & Gas – What are the effects of fluid invasion and how can it be minimized?
A: A.L Martins (Petrobras) - Minimizing fluid invasion is a major issue while drilling reservoir rocks. Large
invasion may create several problems in sampling reservoir fluids in exploratory wells. Unreliable sampling may lead to wrong reservoir evaluation and, in critical cases, to wrong decisions concerning reservoir exploitability.
Besides, drilling fluid invasion may also provoke irreversible reservoir damage, reducing its initial and/or its long term productivity. Such problems can be critical in heavy oil reservoirs, where oil and filtrate interaction can generate stable emulsions. Invasion in light oil reservoirs is less critical due to its good mobility properties (Ladva et al.1). Another critical scenario is the low permeability gas reservoirs where imbibition’s effects may result in deep invasion.
The role of rheology on drilling fluid invasion in the oil reservoir is still not clearly stated. The main points which arise are:
- To what nature of efforts is the fluid submitted when flowing through the porous media? Which shear rates characterize the well-reservoir boundary?
30 Brazil Oil and Gas Issue 5

Fluid challenges for long horizontal section offshore wells in
deepwater fields
Fig. 1 – 3 lb/bbl XC solution Fig. 2 – 16 lb/bbl PHPA solution
- Which rheological properties govern the invasion phenomenon?
Designing drill in fluids which can guarantee minimum invasion into the reservoir rock is a must for open hole completion wells. The industry has proposed several ideas to deal with the problem, most of them based on adding bridging agents to the fluid formulation. Such agents would block pores near the well bore and, consequently, prevent additional fluid from invading the rock.
A different concept is proposed for controlling invasion: designing a polymer based fluid which would generate extremely high friction losses when flowing through a porous media without generating extra losses while flowing in the well. In this case the fluid would present proper flow and solids transport properties in the well and would not invade the rock formation.
Previous studies (Martins et al. 2,3,4) showed that the viscoelastic behavior of fluids can be a major restriction to fluid invasion. The invasion analysis is based on a 2 phase (viscoelastic fluid + Newtonian oil) radial flow through porous media and supported by a commercial Computational Fluid Dynamics (CFD) package.
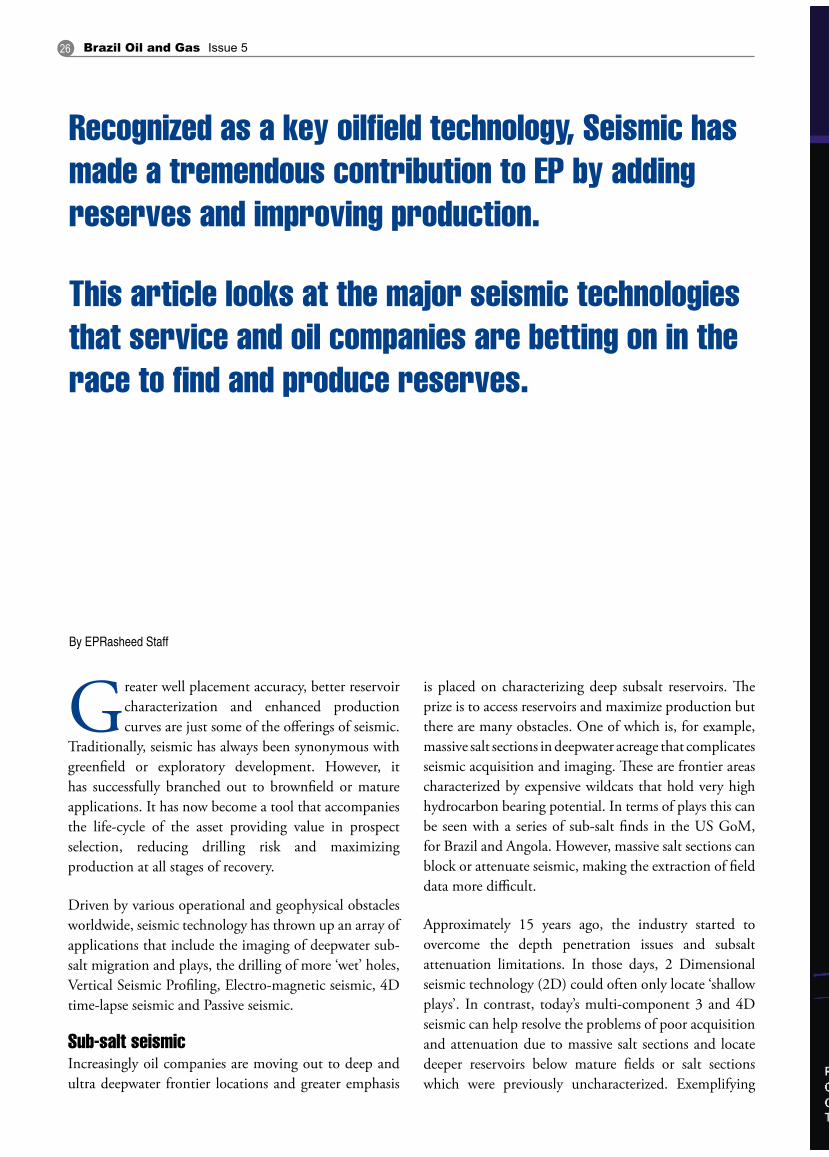
Experimental results show that Darcy’s law was capable of reproducing the flow of low polymer concentration solutions through porous media. For higher concentrations, however, deviations from Darcy’s law become larger, especially at the high differential pressure tests, as shown in Figs. 1 and 2. This fact leads to the conclusion that viscoelastic effects play a relevant role in such conditions. CFD analysis highlights the expressive invasion prevention when the viscoelastic resistive force terms are considered. The proposed methodology allows the definition of optimum rheological parameters (including viscoelastic) which can minimize invasion into a specific reservoir as described by Figs. 3 and 4.
31Brazil Oil and Gas Issue 5
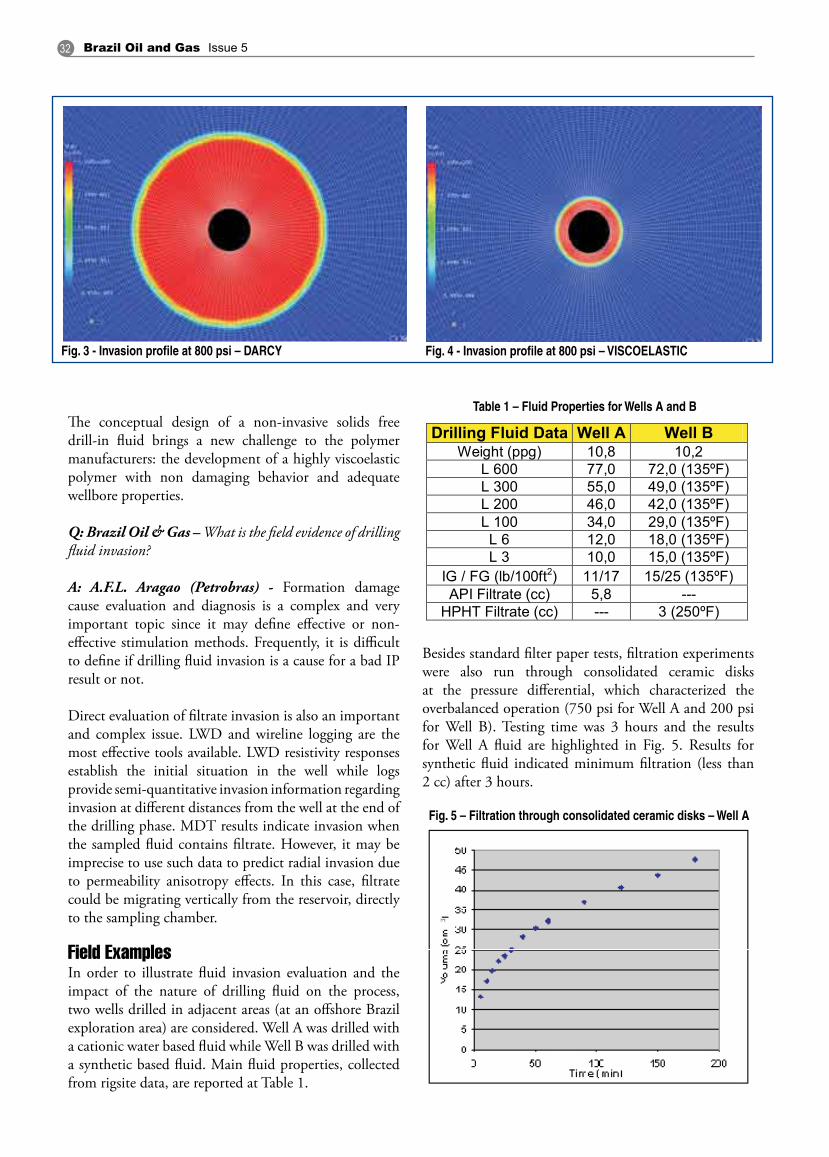
Fig. 3 - Invasion profile at 800 psi – DARCY Fig. 4 - Invasion profile at 800 psi – VISCOELASTIC
Drilling Fluid Data Well A Well BWeight (ppg) 10,8 10,2
L 600 77,0 72,0 (135ºF)L 300 55,0 49,0 (135ºF)L 200 46,0 42,0 (135ºF)L 100 34,0 29,0 (135ºF)L 6 12,0 18,0 (135ºF)L 3 10,0 15,0 (135ºF)
IG / FG (lb/100ft2) 11/17 15/25 (135ºF)API Filtrate (cc) 5,8 ---
HPHT Filtrate (cc) --- 3 (250ºF)
Table 1 – Fluid Properties for Wells A and B
Fig. 5 – Filtration through consolidated ceramic disks – Well A
The conceptual design of a non-invasive solids free drill-in fluid brings a new challenge to the polymer manufacturers: the development of a highly viscoelastic polymer with non damaging behavior and adequate wellbore properties.
Q: Brazil Oil & Gas – What is the field evidence of drilling fluid invasion?
A: A.F.L. Aragao (Petrobras) - Formation damage cause evaluation and diagnosis is a complex and very important topic since it may define effective or non-effective stimulation methods. Frequently, it is difficult to define if drilling fluid invasion is a cause for a bad IP result or not.
Direct evaluation of filtrate invasion is also an important and complex issue. LWD and wireline logging are the most effective tools available. LWD resistivity responses establish the initial situation in the well while logs provide semi-quantitative invasion information regarding invasion at different distances from the well at the end of the drilling phase. MDT results indicate invasion when the sampled fluid contains filtrate. However, it may be imprecise to use such data to predict radial invasion due to permeability anisotropy effects. In this case, filtrate could be migrating vertically from the reservoir, directly to the sampling chamber.
Field ExamplesIn order to illustrate fluid invasion evaluation and the impact of the nature of drilling fluid on the process, two wells drilled in adjacent areas (at an offshore Brazil exploration area) are considered. Well A was drilled with a cationic water based fluid while Well B was drilled with a synthetic based fluid. Main fluid properties, collected from rigsite data, are reported at Table 1.
Besides standard filter paper tests, filtration experiments were also run through consolidated ceramic disks at the pressure differential, which characterized the overbalanced operation (750 psi for Well A and 200 psi for Well B). Testing time was 3 hours and the results for Well A fluid are highlighted in Fig. 5. Results for synthetic fluid indicated minimum filtration (less than 2 cc) after 3 hours.
32 Brazil Oil and Gas Issue 5

Fig. 6 – Logs Well A - Water based fluid Fig. 7 – Logs Well B - Oil based fluid
Fig. 6 shows, for Well A, the porosity (continuous black line), density (continuous red line) at the right side and the group of 5 resistivity logs at the left side. The dotted yellow color represents the reservoir sections in the log. The dark blue resistivity log (extreme right of the figure), representing the well bore vicinity, denotes the baseline for the water base drilling fluid filtrate. This line shows lower resistivity than the other curves, which represent the lower salinity formation water at the shale intervals. In the reservoir the other four resistivity logs tend to approach the base line indicating that the high salinity filtrate has deeply invaded the reservoir. Fig. 7 shows the caliper (dashed red line on the left side of the figure), gamma-ray (green continuous line adjacent to the caliper log) and resistivity logs (group of five curves at the right side of the figure) for Well B at the interface of a shale formation with the reservoir. This interface can be detected by the gamma ray log which shows large attenuation when the interface is reached. The resistivity log curves (each one representing a different distance from the well) are very similar at the shale section while the red continuous curve (extreme right of the figure), which represents the wellbore vicinity, gets apart from the group of 4 other curves. The interpretation is that there is a controlled invasion of the organic based fluid filtrate near the well walls, while the other curves reflect the response for the reservoir fluid (possibly formation water).
Although there is not enough information available to make quantitative analysis, results indicate clearly that the good filtration control characteristics of the fluid used in Well B played an important role in the minimization of invasion in relation to Well A. Of course, the chemical nature of the drilling fluid and the overbalance pressure also play important roles. Despite that, there are several good results (minimum invasion) obtained in wells drilled in nearby areas with properly designed water based fluids.
Compatibility testsQ: Brazil Oil & Gas – What have compatibility tests shown?
A: A. Calderon (Petrobras) - Fluid compatibility is a major issue when drilling through the productive rock. The problem gets more critical when heavy oil reservoirs are involved. The potential for emulsion development between the drilling fluid filtrate and/or the completion fluid and the formation oil may be the cause of severe formation damage and loss of permeability. The present work exhibits some results from a study performed during the drilling of a long horizontal heavy oil well offshore Brazil to evaluate fluid interactions concerning the stability of the emulsion formed.
Experiments carried out to evaluate the potential for emulsion development between a water based drilling fluid or its filtrate and a heavy oil sample from offshore
33Brazil Oil and Gas Issue 5

Brazil resulted in immediate emulsion breakage when an emulsion preventor was added to the system. When no additive was used, the delayed time for breakage was 10 minutes. The tests were carried out at room temperature and at 160°F with an oil to fluid ratio equal to 3:1, under moderate stirring (magnetic stirrer).
Experiments were also performed with the heavy oil and a 9.3 ppg completion fluid. The objective was to determine the best solvent conditions for the given oil. The control parameters were the developed mixture viscosity and breakage percentual after a pre-defined time interval for different test conditions. The results are shown in Tables 2 to 6.
Viscosity, cP % aqueous phase Time interval, h2.776 @ 25oC 8 12.776 @ 25oC 17 52.776 @ 25oC 18 62.776 @ 25oC 18 72.776 @ 25oC 21 24
18.340 @ 4oC - -16.680 @ 10oC - -
Table 2: Manual stirring -10 minutes - no additives - room temperature
% Aqueous phase Time interval, h0 10 3
<1 4<1 5
10.9 21
Table 3: Hamilton Beach low velocity - 1 minute - no additives - room temperature
% Aqueous phase Time interval, h17.3 119.5 221 421 522 21
Table 4: Hamilton Beach low velocity - 1 minute - no additives – T = 69oC
Solvent Mix Viscosity, cP % Aqueousphase
Timeinterval, min
100ml oil+ 45ml D+45ml X+10ml B 16,56 9 30100ml oil+ 45ml D+45ml Product A +10ml B 96,98 21 30
100ml oil+ 50ml D+50ml kerosene 98,21 20 30100ml oil+ 90ml D+10ml B+0,3ml preventer 149,4 9.4 30
100ml oil+ 90ml D+10ml B - 8 30100ml oil+ 90ml kerosene+10ml B - 6 30
Table 5: Oil+Solvent - Hamilton Beach low velocity - 1 minute - no additives – T = 69oC
D: diesel; B: benzene; X: xilene
Viscosity, cP % Breakage Time interval, min
754 91.5 30
754 96 60
754 100 90
Table 6 –150 ml Oil + 50ml 9.3 ppg completion fluid + 0.3% emulsion preventer Hamilton Beach low velocity - 1 minute – T=69oC
34 Brazil Oil and Gas Issue 5

“Drilling and completion of long horizontal wells are critical operations, especially in deepwater environments. The strategies proposed in this work consist of effective alternatives to achieve success in critical operations. Each operation depends upon a great deal of specific data for each area and well configuration
and should require a singular solution even when compared with a quasi-similar well. Generalized well design strategies are not
recommended for such complex operations.”
The results show spontaneous segregation even at ambient conditions. The addition of an emulsion preventer speeds up the process. The 1000 m horizontal well produced at high productive indexes.
Q: Brazil Oil & Gas – What are your conclusions?
A. R.F.T. Lomba (Petrobras) - Drilling and completion of long horizontal wells are critical operations, especially in deepwater environments. The strategies proposed in this work consist of effective alternatives to achieve success in critical operations. Each operation depends upon a great deal of specific data for each area and well configuration and should require a singular solution even when compared with a quasi-similar well. Generalized well design strategies are not recommended for such complex operations.
REFERENCES[1]Ladva, H.K.J., Tardy, P., Howard, P.R. and Dussan V., E.B.: “Multiphase Flow and Drilling-Fluid Filtrate
Effects on the Onset of Production”, paper presented at the 2000 SPE International Symposium on Formation Damage Control, Laffayete, Louisiana, 23-24 February.
[2]Martins A.L. 2003, “On the Rheological Mechanisms Governing Drill-in Fluid Invasion into Reservoir Rocks”, SPE – International Student Paper Contest at the SPE Annual Technical Conference and Exhibition being held in Denver, Colorado, 6-8 October.
[3]Martins A.L. et al, "Predicting and Monitoring Fluid Invasion in Exploratory Drilling", SPE – 86497, at the SPE International Symposium and Exhibition on Formation Damage Control held in Lafayette, Louisiana, U.S.A., 18–20 February 2004.
[4]Martins, A. L., et al 2004, “Quantificação de Forças Resistivas no Escoamento de Soluções Poliméricas em Meios Porosos, e seu Impacto na Engenharia de Poços de Petróleo”, II Brazilian Conference on Rheology, pp- 31-32, Rio de Janeiro 7-9 July.
35Brazil Oil and Gas Issue 5

EP in Rub Al Khali36 Brazil Oil and Gas Issue 5

The RubThis is an archetypal sand desert that seems haunted by its own vastness, its own austere beauty. It is one of the largest continuous sand deserts, encompassing 582,750 square kilometers (225,000 square miles) of the Arabian Peninsula. SRAK, an incorporated joint venture company operating on behalf of its three shareholders (Shell with 40 percent and Total and Saudi Aramco each holding 30 percent), inaugurated its first well in July 2006. The drilling rig is a fragile looking metal latticework frame 65 meters (213 feet) tall, which seems tiny and insubstantial amid the hugeness of the desert.
According to the terms of the Upstream Project Agreement with the Saudi Arabian government, signed during ceremonies in Riyadh on November 15th 2003, the newly formed company had only five years to explore the geology of an area equivalent in size to the United Kingdom. One thing was clear. To do so in any comprehensive manner would be an impossible feat. In addition, the contract stipulated that seven wells were to be drilled during that time.
In a perfect world, drilling engineers know ahead of time how deep they need to drill and what types of rocks they will encounter at various depths. The problem for SRAK drilling engineers was the lack of geological data on their contract area in the southern Rub‘ al-Khali Basin.
With the recent move of Halliburton’s corporate HQ to Dubai, Brazil Oil & Gas takes a look at a frontier in what many see as the world’s largest oil producer and reserves holder - Saudi Arabia.
SRAK drilling manager Koen Bracquene is a man long accustomed to the realities of the imperfect world of exploration and drilling. “Based on very preliminary geological data, you make your conceptual design calculations for different situations, and worst case scenarios in particular,” he said. “From there, you start looking for a drilling unit and your long delivery equipment — the pipes, the valves and the flanges to put on the wellhead. Because of the specific requirements and the prevailing market conditions, that process typically takes about a year.”
A year, plus a minimum of two years before SRAK generated data would reveal the most promising site for a well. Before SRAK could even hope to get its first well started, three of the five years were already gone. Under that timeline the math wasn’t adding up.
Bracquene and his team got to work making the most accurate drilling plan they could, along with contingencies to cover as many geological uncertainties as possible. The last thing they wanted was to start drilling a well only to find that they didn’t have bits of the correct hardness or pipe of the correct specifications to complete the well to the required depth. That could delay progress for a year they could ill afford to lose.
EP in Rub Al Khali
Reproduced from Saudi Arabia Oil & Gas - a sister magazine
37Brazil Oil and Gas Issue 5

“It is very rare in the world these days that you get an opportunity to explore a basin pretty well from scratch and to turn a blank piece of paper into a portfolio of prospects”. (Allman-Ward)
Depending on your perspective, this could either be an absolutely appalling prospect or a dream come true. For SRAK CEO Patrick Allman-Ward, it was both.
“It is very rare in the world these days that you get an opportunity to explore a basin pretty well from scratch and to turn a blank piece of paper into a portfolio of prospects,” he said. “Most geologists spend their lives re-mapping prospects that other people have already mapped. In this project we are putting new prospects on the map that have never been seen before. That, of course, is very exciting.”
He also knew that time and technology had fortuitously conjoined at this moment to give this venture its best chance for success. There had been tentative attempts to unlock the secrets of the Rub‘ al-Khali before, of course. With a few exceptions in the north, most had been defeated by the combination of extreme conditions and distances.
To do it right, Allman-Ward knew he would have to take advantage of every new technological advancement. He would have to assemble teams of people who knew how to turn challenges into opportunities. To prevent mutiny en masse, he would need to make the desert camps as comfortable as possible. Environmental impact
Every day became a race for information. Over the years, 20 test wells had been drilled within the SRAK contract area. Imagine 20 straws sunk randomly into the ground across the whole of Scotland, and you begin to understand not only the scale but also the limitations of any information the geologists might obtain. Furthermore, only five of the wells were drilled to a depth at which gas might reside. Analysis of core and cutting samples from those wells would provide the first few pieces of the puzzle, albeit not the prized edge pieces. A little more information was gleaned from a Saudi Aramco airborne magnetic survey done in the early 2000s that overlapped into the northern edge of SRAK acreage. The Saudi Geological Survey also had some magnetic data that SRAK acquired. After integrating all of the well and seismic data at their disposal, a hazy picture began to form and obvious questions arose. How do you acquire enough geological data to exactly pinpoint the seven best well sites in a 210,000-square-kilometer area? How do you engineer and drill seven wells in five years when you don’t have the information you need and when materials for each one could take a year to manufacture and get on site? How do you accomplish all of this in one of the most remote deserts on the planet and one of the last places on earth to be explored, where the climate is severe and there are no roads?
38 Brazil Oil and Gas Issue 5

studies would need to be undertaken. Health, safety and environment (HSE) standards would have to be implemented and strictly adhered to. And exploration efforts would have to be coordinated with government agencies interested in the preservation of any archaeological sites that might be discovered. Allman-Ward and SRAK had one chance to bend to their will the collective forces that would result in success. There would be no cutting corners. They would do it right.
SRAK CEO Patrick Allman-Ward reveals why he thinks this area has such large hydrocarbon reservoirs compared to other places around the world.
“It always puzzled me a little bit as to why Saudi Arabia was so uniquely blessed with such an abundance of hydrocarbons. I think for most geologists and seismic interpreters who are familiar with mature areas of exploration, if you find a new prospect it will typically be a prospect of a few square kilometers. One of the exciting things about the acreage we are exploring is that we are mapping for the first time some very large structures indeed, with an aerial extent of hundreds of square
kilometers in some cases. I think one of the keys to the large prospects found here is that the Arabian platform, which is the name for the plate on which Saudi Arabia sits, has actually been very stable over geological time.
“Part of the regional geological work we have done has established that the Arabian plate came together from a series of smaller plates between the Pre-Cambrian and Cambrian period. So we’re talking 600–800 million years ago when the Saudi Arabian plate was welded together in its present form. Since then the plate has gone up and down relative to sea level, and has experienced a series of flooding and erosion events. When sea flooded over the top of the plate, it created accommodation space for sediments to be deposited either in the form of clastic sediments or carbonate sediments. These provided the source rocks, the reservoirs and the seals. And when the sea retreated, the sediments were exposed and eroded. But in fact, the overall internal structural deformation in the Arabian plate has been relatively minor. It has remained largely undisturbed. Yet all around the edges of the Arabian plate, a whole series of plate tectonic mountain-building events has occurred.
39Brazil Oil and Gas Issue 5

through time and at what point hydrocarbons may have been expelled out of those source rocks and to where they might have migrated.
Knowing that they had one chance to coax a grudging desert into revealing its mysteries, a serious multi-pronged exploration program ensued. SRAK used unconventional technologies such as low-frequency (acoustic) seismic surveying and magneto tellurics, as well as conventionally acquired seismic data from vibroseis trucks and satellite imagery. And in its effort to locate the contract area’s
The consequence was some subtle re-activation of structures within the Arabian plate as a result of these far-field stresses.
“Subtle changes mean the structures are very large because they haven’t been fragmented and broken up into tiny pieces. The Saudi Arabian plate seems to be full of these very large structures, because it has not been subjected to intense tectonic events. It has been subjected to relatively mild far-field events that have subtly remobilized faults and fractures and created the structures that we currently see. And then, of course, you have two world-class source rocks; some people say more than two, which also help to fill these very nice structures with hydrocarbons.”
Data explorationMeanwhile, SRAK geologists were trying to decide how to quickly acquire the most useful seismic data in their massive contract area.
“Our strategy was to try and find a means by which we could implement a focused exploration program, centered during the first two-and-a-half years on finding the hot spots in the contract area,” said Allman-Ward. “Ultimately, that meant applying every geological trick that we had in order to zoom in and focus on the pieces of acreage that we needed to expend time and effort in.”
To accomplish this they used a methodology called play-based exploration. In play-based exploration, you step back and look at the terrain in a holistic way instead of just trying to map prospects or structures. You take into account the natural history of the terrain and how it evolved through time in terms of its structural evolution and the deposition of sediments and source rocks. Then you evaluate how those source rocks have matured
We have a large number of structures we are mapping and discovering in this area... But then the question becomes: Which are the good ones
and which are the bad ones? You have to prioritize the prospects for drilling, and that’s the process of de-risking.
40 Brazil Oil and Gas Issue 5

elusive hydrocarbon deposits, SRAK would eventually conduct what would become the largest high-resolution airborne gravity survey in the world.
An educated guessAfter more than two years of exploring, surveying and mapping their contract area, SRAK narrowed in on where to drill their first well. Frustratingly, even with all the data at their disposal, the site selection was little more than an educated best guess. Why?
“In some areas of the world (the Gulf of Mexico, Nigeria, the Far East, etc.), you get a strong indication of whether you have hydrocarbons from the seismic data,” Allman-Ward stressed. “We don’t have that luxury. In all of our areas, the rocks are old as opposed to being very young. Old rocks don’t respond in the same way to the presence of hydrocarbons and therefore don’t show up on the seismic data directly.”
When dealing with an entity such as the Rub‘ al-Khali, the people of SRAK will tell you that they don’t expect things to be easy. Instead, they shore up their positive attitudes and make contingency plans. In this case, the first well would be considered a true blind test. From there they would do something geologists call de-risking.
“We have a large number of structures we are mapping and discovering in this area,” Allman-Ward explained. “But then the question becomes: Which are the good ones and which are the bad ones? You have to prioritize the prospects for drilling, and that’s the process of de-risking.”
For a while, though, it looked like SRAK wasn’t going to meet its tight timeframe. All the equipment that
Bracquene had ordered over a year ago was now being delivered at the SRAK storage yard in al-Khobar. There was just one small problem: As the five-year clock continued to count down, Saudi Aramco had recently embarked on a major expansion of its exploration program, and the suitable drilling rigs, well construction and evaluation services throughout the Kingdom were being used.
Not ones to be discouraged easily, representatives from SRAK had launched an area-wide search and had found a suitable rig in Dubai. All they had to do now was have it trucked nearly 2,000 kilometers through the desert to the well site. Also, for the over-desert trek they would need specially rated trucks. That was fine. They were even willing to build basic roads where none existed.
SRAK officials said that results from Isharat-1 have been very encouraging and have shown that the venture’s geological model for the region is gratifyingly accurate. SRAK hopes to spud another exploration well — Al-Mirtan — in early March 2007. But, gas or no gas, SRAK is gathering critical information with which to recalibrate their ever-changing model of the Southern Rub‘ al-Khali Basin. They had already moved the location of their second well when new information was analyzed. That decision resulted in an additional 200 kilometers of road that needed to be built and completed in three months. Work at that well site is now under way and plans are being updated for the third well and beyond.
But those plans could get reshuffled at a moment’s notice, depending on what additional data comes to light. The men of SRAK understand the sarab, the mirage, because they live in a realm where images are constantly shimmering in the heat of scrutiny and wavering in and out of focus. But that’s part of the challenge. And they wouldn’t be in this business if they didn’t welcome a challenge.
But those plans could get reshuffled at a moment’s notice, depending on what additional data comes to light. The men of
SRAK understand the sarab, the mirage, because they live in a realm where images are constantly shimmering in the heat of scrutiny and
wavering in and out of focus. But that’s part of the challenge.
41Brazil Oil and Gas Issue 5

Transpetro Pipeline Integrity Program
By Paulo de Tarso Arruda Correia, Petrobras Transporte S.A. - Transpetro
Introduction The project is part of the PEGASO Program – (Operational Safety and Excellence in Environmental Management). It started in 2001, with a large and intense pipeline physical integrity recovery program, followed by the adjustment of the company’s pipeline grid (more than 9,650 km of natural gas, oil and oil product pipelines) and led to the new Petrobras Integrity Standard or PID (Padrão de Integridade de Dutos).
The Program was started after three pipeline accidents in the country; the first one in Guanabara Bay with a fuel oil line (PEII 16”, 13.7 km) in January/2000, resulting in a leakage of 1300 m3; the second in a crude pipeline in July/2000 (OSPAR 30”, 118.5 km) with 4000 m3 lost and the third one in a diesel pipeline (OLAPA 12”, 94.0 km) with 150 m3 lost in 2001. A fourth accident with a fuel oil pipeline (OBATI 14”, 50 km) happened in May/2001 due to external corrosion resulting in a leakage of 200 m3 of atmospheric residue, and a fifth in July/2001 (OBATI Clean products 14” pipeline) due to Third Party Action also resulting in a leakage of 200 m3 of LPG.
Transpetro has invested more than US$600 million to date, aiming to adjust its pipeline network to the new level of integrity demanded by PID.
This new standard began establishing routines for inspection, control and mitigation for what were called four main failure modes: Internal Corrosion; External Corrosion, Third Party Action; Pipe and Soil interaction.
The PID document comprised eight chapters covering: Risk Analysis; Internal Corrosion; External Corrosion; Third Party Actions; Soil and Pipe Interaction (Geotechnical Problems); Pigging; Defect and Repair Analyses and Pressure Testing.
All these PID chapters were applied to each pipeline in the company’s network in a way that the control of the program was carried out per pipeline.
Program StructureThe program as a whole, delivered a reduction in the leakage volume from 6,000 m3 in 2000, to less than 39 m3 in 2003 and the leakage has been kept at a very low level since then.
42 Brazil Oil and Gas Issue 5

Transpetro Pipeline Integrity Program
Three phases and five processes were identified. These were the ‘Emergency Phase’ to rapidly recover the physical integrity of a set of prioritised pipelines. This included the assessment and recovery of integrity as well as adjusting the whole pipeline network to the Petrobras Pipeline Standard. Additionally, it included the introduction of the Pipeline Standard as a permanent practice of the company.
The Emergency PhaseThis was applied to a priority list of 96 pipelines (6,084.9 km) selected for strategic and risk reasons. These were selected from among the 183 pipelines (9,650 Km) that would be considered in the whole program.
In this emergency phase, more than 245 km of new and different pipelines, representative of the installed base considering items such as nominal diameters, material and wall thicknesses, were purchased and used to assist in the repairs that came after an in-line inspection program, using MFL or ultrasonic pigs.
A total of 5,480.1 km of pipeline was inspected through intelligent pigs (geometric, high resolution MFL and
ultrasonic) resulting in the repair of 5,200 defects. This resulted in 5,094.3 km of rehabilitated pipeline. During this phase more than 87 new employees were hired to work in the integrity area and almost US$400.00 million were invested.
This phase started in early 2001 and ended in 2003 (the target was 07/2002 but the repairs continued until mid 2003).
The Adjustment to Petrobras Pipeline Standard In this phase all Pipeline standardization actions were applied to each pipeline through a variety of different projects and according to a WBS (Work Breakdown Structure).
The management of the program considered a structure composed of five Committees, one in headquarters and one in each of Transpetro’s regions.
Typically, the Regional Committees brought together representatives of the following areas:
43Brazil Oil and Gas Issue 5

Health, Safety and the Environment; Commercial; Marine Terminals; Oil Pipelines; Gas Pipelines and Engineering.
The Regional Committee promoted periodic coordination meetings where the different agents had the opportunity to exchange ideas, update each other regarding the progress in their activities, discuss problems, etc. The headquarters’ committee performs the whole program coordination, issuing a monthly report and keeping a specific site on the company home page.
Transpetro has created a standard and negotiated with the ILI services provider companies, for the format of pig inspection reports (magnetic and hard copy). This makes the interpretation easier as well as the data processing, using a toll that estimates the wall resistance, the defects that must be repaired as well as defining the next inspection (described below) called Planpig.
Planpig is a novel methodology developed by Transpetro for pipeline management in-line inspection programs.
This software was developed to determine the best (risk and cost based) time interval between in-line inspections and the preventive repairs to be carried out following
a pipeline inspection. The innovative feature of this methodology is that it takes into account the expected failure cost, the cost of inspection and the cost of repair to determine the optimal failure risk at the moment of inspection as well as the ILI tool accuracies and internal and external corrosion rates.
By applying this methodology a reduction of 46% in the expenditure on in-line pipeline inspection was obtained.
After a careful experimental research program, Petrobras developed a self-integrity criterion for the assessment of pipelines with corrosion defects. The RPA methodology may be used alternatively for ASME B31-G, generating a reduction of 49% in the preventive repairs carried out after in-line inspections.
Petrobras also has a laboratory devoted to the development and tests of smart-pig tools in its Research Center, CENPES. This laboratory has developed tools of different types such as Geometric, MFL, pressure and temperature profiler with an accelerometer and new technology for internal corrosion and geometry deploying the polygraph principles. The following areas have been researched:
Internal Corrosion (IC)In order to control and mitigate the IC, the project in this area comprised the following main items:
Petrobras also has a laboratory devoted to the development and tests of smart-pig tools in its Research Center, CENPES. This laboratory has developed tools of different types such as Geometric, MFL, pressure
and temperature profiler with an accelerometer and new technology for internal corrosion and geometry deploying
the polygraph principles.
44 Brazil Oil and Gas Issue 5

Implantation of infra-structure including:
• Petrobras project and installation of corrosion coupon and Electrical Resistance Corrosion Probes (ERCP) in the 6o/c position (bottom line of the pipes).
• Development of new corrosion inhibitor additives, injection stations and updating the existing units with automation.
Implementation of a set of routine services considering:
Periodical cleaning of the pipelines with scraper pigs: IC management service routine to collect samples from the debris dragged by the scraper pigs and NACE test of samples from product batches pumped through the pipelines.
External Corrosion (EC) In EC the project encompassed the following items: External coating survey using PCM, ACVG, DCVG and CIPS for mapping and sizing the discontinuities in the external coating as well as being a way to provide the mapping of the pipelines at the ROW (Right Of Way) without the mapping tool.
The CPS Supervisory System A great advance in the program was the application of the supervisory system for the CPS.
This system called STR (Sistema de Telesupervisão Remota) is based on a set of sensors installed in the rectifiers or the interference current drainage equipment like voltmeters (AC and DC), current meters (DC output current), soil to pipe voltmeter with a permanent semi-cell and a switch in the entrance door to detect invaders in the rectifier shelter.
The External Coating InspectionThe surveys using the methods already described, have proved to be very efficient in pinpointing the external coating failures and a lot of repairs have been carried out in points where the coating was severely degraded or did not exist any more. Up to May 2006, a total of 7,626km of the pipeline network, or 79% of the total network had been inspected and a total of 3,499km were rehabilitated.
Geotechnical or Soil/Pipeline Interaction The PID created the requirement to develop a geographic plan produced from aerial photography that allows the identification as well as the classification and sizing on a three level scale (severe, medium and moderate), of all geological problems along the pipeline. This plan is called a thematic map, and takes into account the results of special and periodic surveys.
Among the most common problems are: River crossing erosion causing the pipeline exposition leading segments
Among the most common problems are: River crossing erosion causing the pipeline exposition leading segments to be without
support; Soil movement in mountain slopes (hillsides); Soil erosion with the exposition of the pipeline by heavy rain; The
collapse of the soil by underground water movement; The actions of strong waves or strong tides in the sea to beach transition.
45Brazil Oil and Gas Issue 5

to be without support; Soil movement in mountain slopes (hillsides); Soil erosion with the exposition of the pipeline by heavy rain; The collapse of the soil by underground water movement; The actions of strong waves or strong tides in the sea to beach transition.
Risk Analyses The Risk Analyses chapter in the Petrobras Pipeline Standard is one of the most important in the whole document.
It is the qualitative analyses that consider the consequence potential and the failure probability of the four failure modes considered in the PID.
The pipelines are divided into segments according to the geographical and environmental factors. The consequence potential takes into account: the environmental classification; class location; operational conditions like product, flow rate and pressure (only for natural gas pipelines).
All 183 pipelines in the network had their risk evaluated by this process.
Pressure Test In the PID standard the pressure test is either mandatory or recommended, based on the following cases:
Mandatory Cases: New pipelines; After pipeline repair; Pipelines that need to operate under pressure higher than that allowed by the last valid hydro-test; Pipelines in sensitive areas.
Recommended Cases: Pipelines that remain out of use for more than 5 years, and that need to operate again;
Pipelines that have been operating at one pressure level that need to operate at a pressure 25% higher, although lower or equal to the one allowed by the last test. Pipelines that have been operating for more than 25 years without a new valid pressure test; Pipelines out of operation, even in periods lower than 5 years that have not had an appropriate hibernating process. These criteria were applied to the pipeline network, and as a result, 101 pipelines were tested.
R&D in Pipeline, Pipeline Technological Center, Cooperative Projects Petrobras has in its Research and Development Center (CENPES) a laboratory devoted to the development and testing of smart pigs tools. This laboratory has developed Geometric tools, MFL and pressure/temperature profiler.
Recently, Transpetro took part together with other companies in the foundation of an independent and private Pipeline Technological Center (CTDUT – Centro Tecnológico de Dutos).
Two pipeline loops are being constructed, the larger one with 12”, 2.4 km for liquids and the smaller one for gas with 14”, 130m.
Conclusion Transpetro is fully committed to the improvement of the integrity of its pipeline network. It does this through a sound pipeline integrity program, which aims to achieve higher safety levels and more economical operations. The total investment of more than US$600 million covering a broad range of projects as described herein, confirms this commitment.
Transpetro is fully committed to the improvement of the integrity of its pipeline network. It does this through a sound pipeline integrity program, which
aims to achieve higher safety levels and more economical operations.
46 Brazil Oil and Gas Issue 5

