inquiry adventure: biology! day 1 - carnegie … · inquiry adventure: biology! day 1 ... activity...
TRANSCRIPT
INQUIRY ADVENTURE: BIOLOGY! DAY 1
Subject Overview
Cells and Organisms
Grade Level
7-10
Lung capacity is one of several factors that influence the rate at which oxygen and carbon dioxide
are exchanged in the lungs through diffusion in the alveoli. This lesson illustrates diffusion with two
demonstrations, tests students’ lung capacities, and challenges them to explore factors that affect
lung capacity and the rate of oxygen delivery to the body’s cells.
Teacher Guide
Objectives Students will learn that oxygen is exchanged for carbon dioxide in the lungs through a process
called diffusion and that the rate at which this takes place is dependent in part on lung
capacity. Students will then measure their own lung capacity.
Anticipatory Set Diffusion is the flow of material from an area of high concentration to one of low
concentration. Oxygen that is breathed into the lungs is exchanged for carbon dioxide in the
blood due to relative concentrations. This can be demonstrated in two ways:
1. Fill a large flask or beaker (> 1 l) with water. Place 1 drop of food coloring in the
water at the beginning of class and ask students to hypothesize what the water will
look like at the end of class. Through entropy and diffusion, the water will be
uniform in color by the end of class.
2. Set up two small beakers, one ¾ full of water, the other empty about 3” apart. Take
a paper towel and roll it up tightly, placing one end in the water and the other in the
empty beaker. Watch over time as capillary action drives the water through the
paper towel and fills the empty beaker until the two levels are equal. Guide students
to recognize that water will transfer until the water levels are equal because at that
time, pressure is equalized between the two beakers.
Prior to starting the demonstration, have each student write a hypothesis about what he or
she believes will happen. Encourage several of them to share with the class and write them on
the board. Then begin the demonstrations to test their hypotheses.
Information How does oxygen get from your lungs into your bloodstream? When you inhale, your lungs fill
with air that is 21% oxygen. Since this is a higher concentration that in your deoxygenated
blood, it diffuses into your bloodstream. At the same time, carbon dioxide moves from your
blood back into the air in your lungs and is then exhaled. This exchange is facilitated by the
thin walls of the alveoli in your lungs which are 1 micron thick. The amount of oxygen that is
Materials Required
Additional Resources
-
PA Standards
-3.1.7.A6
-3.1.7.A7
-3.1.7.A9
-3.1.8.A8
3.1.10.A5
2
Teacher Guide
transferred is also dependent on the amount of air you can get into your lungs per breath and
the total surface area of your alveoli. Discuss some factors that could affect either of these (for
instance, genetics, asthma, smoking, pollution).
Activity Measuring lung capacity lab.
Summary Through measuring their lung capacity, students will consider how lung volume affects a
body’s ability to function both at rest and while in motion. Through the diffusion
demonstrations, they will view how different concentrations of a substance cause it move
from one area to another. Finally, they will consider how factors such as smoking or pollution
can affect the health and capacity of one’s lungs and take proactive measures to address the
issue of air pollution.
Verification/ HW Identify at least one illness or injury that can result in insufficient oxygen to different parts of
the body. What are some of the effects of such an illness on the person? In what way does
the affliction reduce the effectiveness of the exchange of oxygen in the lungs (reduced lung
capacity, reduced diffusion, something else altogether)?
What treatments are available for the illness you describe? What careers or technologies
focus on solutions to such illnesses?
Career Awareness Environmental and chemical engineers are challenged to reduce the pollution that is emitted
from power generation and manufacturing industries in the U.S. and around the world. They
must devise new technologies that clean the air and remove pollutants before releasing it into
the atmosphere. However, their challenge is made more difficult by the need to minimize the
additional costs of implementing additional steps or slowing down their processes. Therefore,
these engineers must be creative problem solvers and create new, inexpensive, and
highlyefficient machines to accomplish this. Can you think of other constraints that engineers
might face in their quest to reduce air pollution?
Humanities Tie-In Through organized letter writing campaigns, the power of one person is amplified by many
participants. Have students go to the Global Response web site
(http://www.culturalsurvival.org/current-projects/global-response) and, using the search tool,
research a letter writing campaign related to air pollution. After identifying a relevant
campaign, students should craft a letter to send to the appropriate officials listed on the
campaign site. They should be sure to follow the “Letter Writing Tips” on the Global Response
site as they write their letters. Encourage students to advocate regularly for campaigns they
believe in.

3
MEASURING LUNG CAPACITY
Name Background
Class Period
In order to live, we need to continually provide our bodies with oxygen and expel carbon dioxide,
the by-product of cellular respiration. Oxygen, which we get from the air, allows us to convert the
food that we eat into energy that operates all of our bodily processes.
The intake, filtering, warming and humidification of air is done by the respiratory system, whose
primary components are the lungs. Air passes through the trachea on its way in and out of the lungs,
but not all air is expelled from the body on each breath. This remaining air is called residual volume.
Each time we inhale, we add additional air. When we exhale, we remove the exact same amount of
air as we inhaled.
The amount of air in your lungs can be measured using several different metrics:
1. Residual lung capacity: the amount of air remaining in your lungs after a deep exhalation.
2. Tidal lung capacity: the amount of air in your lungs during a normal breath. Provides
enough oxygen for someone at rest.
3. Vital lung capacity: the amount of air that can be forcibly exhaled after inhaling as much
as possible.
4. Total lung capacity: the amount of air in the lungs after a deep inhalation (vital + residual
capacities)
Lung capacity, although affected by age, sex, build, etc., can be increased and improved through
regular cardiovascular exercise. In general, however, humans require about 1/3 of their lung
capacity, measure in liters (l) or cubic centimeters (cc), for everyday activities.
Procedure
Tidal Capacity 1. Stretch out a round balloon.
2. Take a normal inhalation and then exhale normally into the balloon.
3. Seal the balloon by pinching it with your fingers. Measure its diameter by resting the
balloon on its side on a table. Have your partner hold the ruler vertically adjacent to
the balloon and read the measurement. Record the data in the table on the next
page.
4. Repeat for a total of five trials.
Vital Capacity 1. Repeat the same procedure as for tidal capacity, except this time inhale and then
exhale as much air as you can. Exhale until you every bit you can get out is out.
Materials Required
- Balloons
- Metric ruler
- Data sheets
Additional Resources
-
Additional Notes

4
Procedure
Analysis Using the graph below, determine your tidal and vital lung capacities.
Data Tidal Capacity Vital Capacity
Balloon diameter (cm)
Volume of air (cc)
Balloon diameter (cm)
Volume of air (cc)
Trial
1
2
3
4
5
Average
5
Conclusions 1. How does your lung capacity compare to your partner’s? Explain why you think they are
different.
2. How do you think smoking would affect your lung capacity? Why?
3. How do you think the lung capacity of an Olympic runner compares to the lung capacity of
a couch potato? Explain your reasoning.
4. What other factors besides lung capacity do you think might influence how much oxygen
can be delivered to your bodily systems?
5. How many cc’s are in one liter?
Adapted from “Lab – Lung Capacity.pdf” from the website of Health and Science Pipeline Initiative @ www.haspi.org
6
INQUIRY ADVENTURE:
BIOLOGY! DAY 2
Subject Overview
Genetics
Grade Level
7-10
DNA is the foundation of all life on Earth. It controls the inheritance of traits and is the raw material
of natural selection. This lesson explores genetics through the isolation of DNA from cells and
exploring Mendelian inheritance patterns in cats.
Teacher Guide
Objectives Introduce students to the role DNA plays in expressing genes and the advantages of sexual
reproduction over asexual reproduction. Demonstrate the process of isolating DNA from cells.
Explore Mendelian inheritance using visible traits of domestic cats.
Anticipatory Set Question: Why might a scientist want to know and understand the sequence of a DNA
molecule?
Teacher will facilitate a 5-10 minute discussion about how and why DNA mapping is useful and
important.
Information From accompanying DNA Extraction Activity:
What is DNA?
What do we do with DNA?
Activity DNA Extraction Activity – attached.
Summary DNA is the genetic material exchanged in sexual reproduction. Offspring receive half their
DNA from one parent and half from the other; the DNA in the offspring can contain any
permutation of genes from both parents, leading to diversity. This diversity is the fodder for
natural selection.
Materials Required
Blender
Measuring cups
Strainer
Bowls
Reaction tubes with rack
Spoons
Towels
Split peas
Water
Salt
Detergent (shampoo or dish
detergent)
Meat tenderizer
Ice cold 95% rubbing alcohol
Wooden skewers/toothpicks
PA Standards
-3.1.10.A7
-3.1.7.B1
-3.1.7.B6
3.1.10.B1
3.1.10.B3
3.1.10.B4

7
Teacher Guide
Isolating DNA from cells is a critical step in the study of an individual’s DNA. The techniques in
this lesson, while primitive, closely mirror those done in labs to prepare DNA for gel
electrophoresis.
While some traits are dictated by a single gene (Mendelian inheritance), most are controlled
by several genes being activated and deactivated at precise intervals. Mendelian traits are
rare in humans, and many lead to conditions like methemoglobinemia, albinism, and sickle cell
anemia. The expression of genes that control features of cats’ coats, however, mostly follow
Mendelian inheritance.
Verification/HW Mendelian inheritance in cats. Show the Cat Coat Genetics PowerPoint slideshow in class to
prepare students to identify dominant and recessive traits in cats. Students will identify
phenotypes and genotypes (to the extent possible) in cats they know or from pictures in
books, magazines, or the Internet. Students may use these data in a Punnett square to
determine the chances of particular phenotypes occurring in offspring, or they may determine
the frequency of phenotypes in their “population” of cats. Are traits linked to dominant genes
always the most common in a population?
If students complete a Punnett Square using the data collected for this assignment, they will
have some degree of uncertainty because dominant phenotypes may be heterozygous or
homozygous.
Career Awareness Genetic engineers can work in human health care, agriculture, waste management, or animal
science. For example, people working in the field of genetic engineering have engineered
insulin for diabetics, proteins and antibodies to fight cancer, vaccines for hepatitis B, and
antibodies to stop organ rejections in transplant patients. Some medical professionals are
working to develop gene therapy, an experimental technique to treat diseases using genes.
For example, rather than using drugs to treat an illness, doctors may one day replace a
malfunctioning gene in the patient with one the works properly, deactivating a mutated gene
that is causing an illness, or even insert a new gene into the patient’s body to fight the disease
directly.
Humanities Tie-In Choose and research a common genetic mutation that appears in the human population.
Write a descriptive summary of what it is called, what the specific mutation is, how it
manifests itself, and if there is any treatment for it. Be prepared to present your findings to
the class.
8
DNA EXTRACTION ACTIVITY
Subject Background
Genetics
Grade Level
7-10
What is DNA?
DNA (deoxyribonucleic acid) is a molecule that is critical for most life on Earth and found in most
cells. Each DNA molecule is made of two strands; each strand is made of smaller molecules called
nucleotides. Nucleotides are made of a sugar-phosphate “backbone” and one of four nucleic bases.
Adenine (A), thymine (T), cytosine (C), and guanine (G) are the four nucleic bases present in DNA.
The bases in each strand of DNA are complementary; A only pairs with T and C only pairs with G.
This property allows DNA to duplicate itself by separating into two separate strands. Each single
strand gets paired with its complementary bases, resulting in 2 perfect copies of the original DNA
molecule. This replication process happens every time a cell divides.
DNA is like a recipe book for making an organism, whether it’s a bacterium, monarch butterfly, slime
mold, or a human. It contains the instructions for making every protein in your body and when to
make them. Sometimes a mistake is made when DNA is copied – a mutation. Most mutations have
no effect, but a small percentage of them result in traits that help the organism survive. Some
mutations can have negative impacts on the organism, resulting in genetic diseases (like hemophilia)
or death. Organisms with beneficial traits are more likely to survive and reproduce, so their traits
are spread through the population.
While some traits visible in an organism are inherited from the previous generation, others are
shaped by the environment. Consider a person who gets a tattoo – the tattoo is an acquired trait
that is not passed onto children. Similarly, learning Mandarin does not mean that your children will
be born knowing Mandarin.
Many traits in humans that were once thought to follow simple Mendelian inheritance patterns
have been shown to be more complicated. Some of the traits in question are controlled by more
than one gene while others depend as much on environment as genes.
What do we do with DNA?
The science of genetics is all about DNA and how traits are passed from one generation to the next.
Knowing about genetics helps us to develop medicines to fight quickly evolving microbes like the flu
virus. It’s also important in agriculture. All the crops and animals we raise today are the result of
selective breeding; those with traits we desire (like higher milk production or faster growth) were
bred to create new breeds of animals and strains of plants. We can also use DNA to help solve
crimes, but it doesn’t work the same way we see on TV.
Materials Required
Blender
Measuring cups
Strainer
Bowls
Reaction tubes with rack
Spoons
Towels
Split peas
Water
Salt
Detergent (shampoo or dish
detergent)
Meat tenderizer
Ice cold 95% rubbing alcohol
Wooden skewers/toothpicks
Additional Resources
-
Additional Notes
9
Right now exciting work is being done on changing the DNA of organisms to give them traits we
want – genetic engineering. It’s like selective breeding, but faster. The first genetically engineered
organism was E. coli bacteria that had genes for producing human insulin inserted into its DNA.
Those bacteria are used to produce artificial human insulin, which is used to treat diabetes. Some
agricultural crops have been genetically engineered to produce chemicals that are toxic to insects –
the plants make their own pesticide. Some people are worried that this kind of genetic engineering
might have negative impacts on the environment, while others are concerned how the law treats
genetically modified organisms. While the practice of genetic engineering is well understood and
being used today, the ethics of this tool are still being developed.
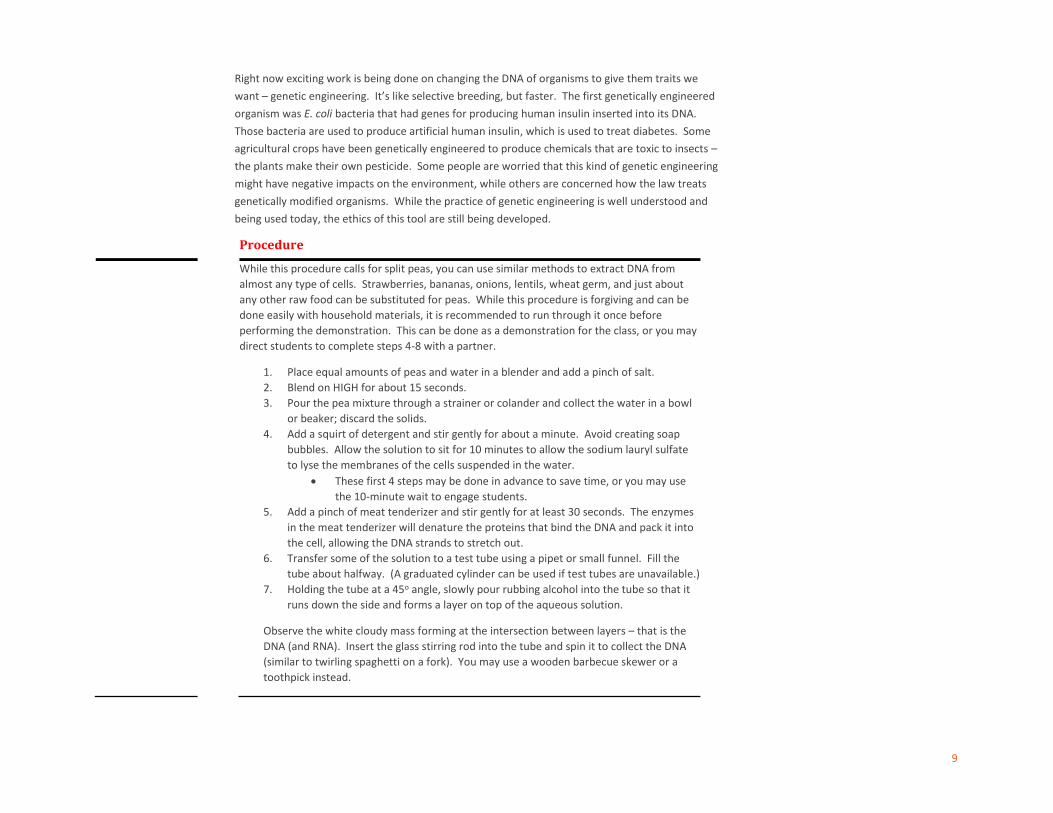
Procedure
While this procedure calls for split peas, you can use similar methods to extract DNA from
almost any type of cells. Strawberries, bananas, onions, lentils, wheat germ, and just about
any other raw food can be substituted for peas. While this procedure is forgiving and can be
done easily with household materials, it is recommended to run through it once before
performing the demonstration. This can be done as a demonstration for the class, or you may
direct students to complete steps 4-8 with a partner.
1. Place equal amounts of peas and water in a blender and add a pinch of salt.
2. Blend on HIGH for about 15 seconds.
3. Pour the pea mixture through a strainer or colander and collect the water in a bowl
or beaker; discard the solids.
4. Add a squirt of detergent and stir gently for about a minute. Avoid creating soap
bubbles. Allow the solution to sit for 10 minutes to allow the sodium lauryl sulfate
to lyse the membranes of the cells suspended in the water.
These first 4 steps may be done in advance to save time, or you may use
the 10-minute wait to engage students.
5. Add a pinch of meat tenderizer and stir gently for at least 30 seconds. The enzymes
in the meat tenderizer will denature the proteins that bind the DNA and pack it into
the cell, allowing the DNA strands to stretch out.
6. Transfer some of the solution to a test tube using a pipet or small funnel. Fill the
tube about halfway. (A graduated cylinder can be used if test tubes are unavailable.)
7. Holding the tube at a 45o angle, slowly pour rubbing alcohol into the tube so that it
runs down the side and forms a layer on top of the aqueous solution.
Observe the white cloudy mass forming at the intersection between layers – that is the
DNA (and RNA). Insert the glass stirring rod into the tube and spin it to collect the DNA
(similar to twirling spaghetti on a fork). You may use a wooden barbecue skewer or a
toothpick instead.
10
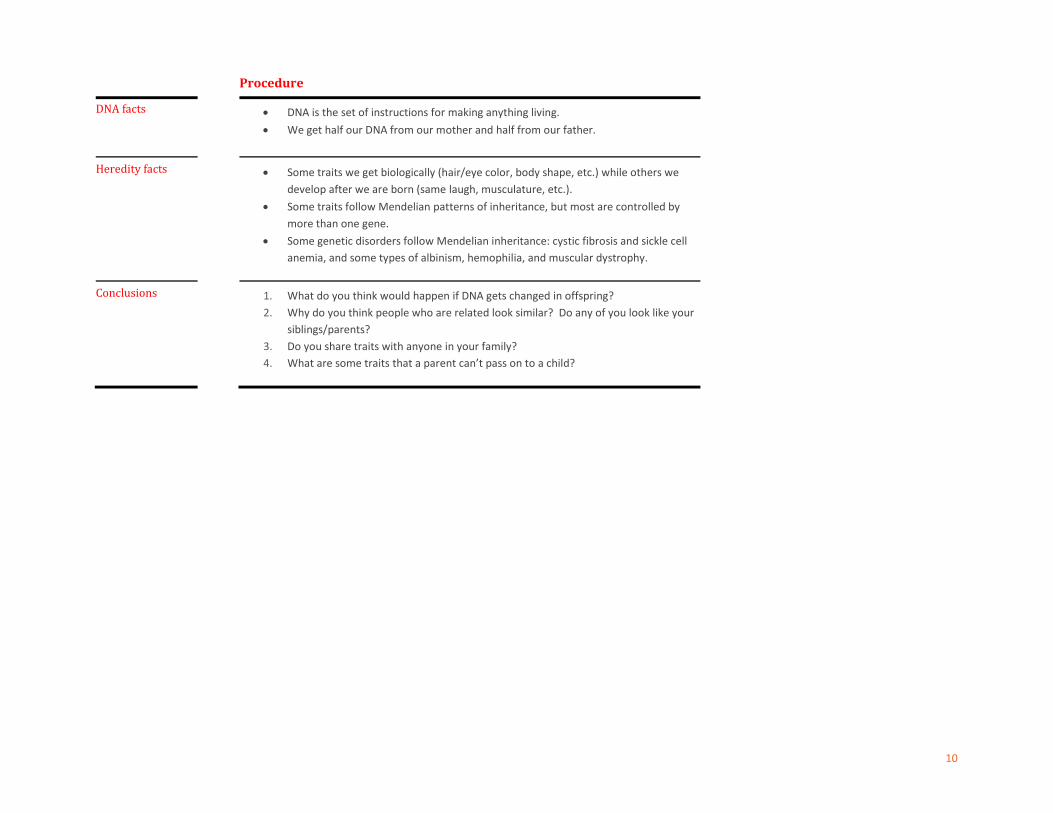
Procedure
DNA facts DNA is the set of instructions for making anything living.
We get half our DNA from our mother and half from our father.
Heredity facts Some traits we get biologically (hair/eye color, body shape, etc.) while others we
develop after we are born (same laugh, musculature, etc.).
Some traits follow Mendelian patterns of inheritance, but most are controlled by
more than one gene.
Some genetic disorders follow Mendelian inheritance: cystic fibrosis and sickle cell
anemia, and some types of albinism, hemophilia, and muscular dystrophy.
Conclusions 1. What do you think would happen if DNA gets changed in offspring?
2. Why do you think people who are related look similar? Do any of you look like your
siblings/parents?
3. Do you share traits with anyone in your family?
4. What are some traits that a parent can’t pass on to a child?

11
INQUIRY ADVENTURE:
BIOLOGY! DAY 3
Subject Overview
Evolution
Grade Level
7-10
Evolution is the change in inherited characteristics of a species over a series of generations. The
ability of a population of organisms to thrive and survive is dependent in large part on natural
selection, a theory put forth by Charles Darwin. This theory postulates that the offspring that are
most likely to survive possess traits that are the best fitted for their environment. Consequently,
the population of organisms that possess these traits will increase over successive generations.
Teacher Guide
Objectives This activity will help students to recognize that simple adaptations by a species to its
environment can have a dramatic impact not only on its ability to survive, but on its
population. The more adapted something is to avoid predation, the more its population will
grow over time. Conversely, organisms that are more susceptible to predators will experience
a drop in population and potential extinction.
Anticipatory Set Question: How does adaptation affect the likelihood of a species to survive and thrive? Ask
students to share their beliefs on this question and then share the story of the white-bodied
and black-bodied peppered moths. Prior to early 19th century, the white-bodied moth thrived
because of its ability to blend in with the lichens that existed on tress. However, during the
industrial revolution, camouflaging lichens died off, and trees were blackened from factory
emissions. As a result, the white-bodied moths were highly visible on trees; there was great
contrast in color between the trees and their bodies. This resulted in a dramatic decrease in
their population. Concurrently, the black-bodied peppered moth population soared, thanks to
its new ability to hide its black body against the blackened tree bark.
Information Evolution by natural selection depends on three facts about a population of a particular
organism:
1. Parents produce more offspring than can survive.
2. Individual offspring possess varying traits that, in turn, lead to different rates of
survival.
Materials Required
Lentils
Red kidney beans
Navy beans (or something similar in
color to lentils)
Bins or trays
Additional Resources
-
PA Standards.
-3.1.7.C1
-3.1.7.C2
-3.1.7.C3
-3.1.7.C4
-3.1.8.A9
-3.1.8.C1
-3.1.8.C3
-3.1.8.C4
12
Teacher Guide
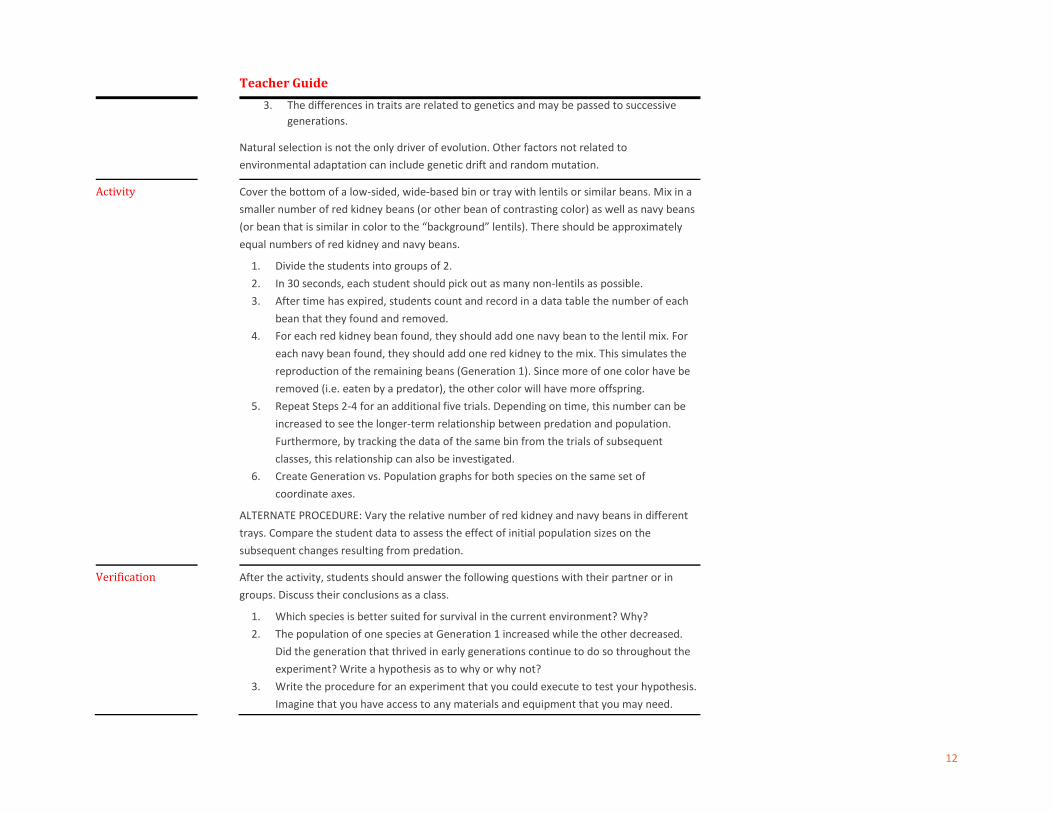
3. The differences in traits are related to genetics and may be passed to successive
generations.
Natural selection is not the only driver of evolution. Other factors not related to
environmental adaptation can include genetic drift and random mutation.
Activity Cover the bottom of a low-sided, wide-based bin or tray with lentils or similar beans. Mix in a
smaller number of red kidney beans (or other bean of contrasting color) as well as navy beans
(or bean that is similar in color to the “background” lentils). There should be approximately
equal numbers of red kidney and navy beans.
1. Divide the students into groups of 2.
2. In 30 seconds, each student should pick out as many non-lentils as possible.
3. After time has expired, students count and record in a data table the number of each
bean that they found and removed.
4. For each red kidney bean found, they should add one navy bean to the lentil mix. For
each navy bean found, they should add one red kidney to the mix. This simulates the
reproduction of the remaining beans (Generation 1). Since more of one color have be
removed (i.e. eaten by a predator), the other color will have more offspring.
5. Repeat Steps 2-4 for an additional five trials. Depending on time, this number can be
increased to see the longer-term relationship between predation and population.
Furthermore, by tracking the data of the same bin from the trials of subsequent
classes, this relationship can also be investigated.
6. Create Generation vs. Population graphs for both species on the same set of
coordinate axes.
ALTERNATE PROCEDURE: Vary the relative number of red kidney and navy beans in different
trays. Compare the student data to assess the effect of initial population sizes on the
subsequent changes resulting from predation.
Verification After the activity, students should answer the following questions with their partner or in
groups. Discuss their conclusions as a class.
1. Which species is better suited for survival in the current environment? Why?
2. The population of one species at Generation 1 increased while the other decreased.
Did the generation that thrived in early generations continue to do so throughout the
experiment? Write a hypothesis as to why or why not?
3. Write the procedure for an experiment that you could execute to test your hypothesis.
Imagine that you have access to any materials and equipment that you may need.
13
Teacher Guide
4. Now imagine that the lentil environment was contaminated by pollutants that colored
it light orange. How do you think this would change your results, if at all? Explain your
answer.
Summary Over time, evolution enables organisms to become adapted to survival in their specific
environment. Changes to the environment that outpace the speed of evolution can result in
rapid and dramatic changes in the populations of various species. Human activity has
increased the potential for this type of situation and the threat of extinction for many species
that cannot adapt fast enough to the changes in their surroundings. Can you think of types of
organisms that are particularly susceptible to rapid changes in their habitat? (Plants cannot
move to new surroundings when their environment changes and are, therefore, more likely to
face dramatic drops in population due to changing environmental or climatic factors including
warming surface temperatures of the Earth).
Homework Find two genetically related people of the same generation (e.g. you and a sibling, one of your
parents and an aunt or uncle, etc.). Identify five obvious characteristics about them (height,
hair color, etc.). Identify each of the five characteristics and which parent in which you believe
it originated (e.g. both my mom and my sister have red hair). Which characteristics do the
siblings have in common? Which characteristics are different? Imagine that we were not living
in modern American society, but the Earth as it was 5000 years ago. Identify which person,
based only on the five characteristics you identified, would be more adapted for survival and,
in one paragraph, explain why.
Career Awareness Genetic engineers work in all sorts of industries to artificially “evolve” organisms to serve our
needs. For example, in agriculture, these engineers change the DNA of plants to make them
more resistant to insects or diseases, or alter their genes to make them grow larger and yield
more edible food. They even tweak the genetics of plants in hopes of making them healthier
for human consumption. Finally, in other, less well-known careers for genetic engineers, they
have developed bacteria that survives by breaking down solid contaminants in waste water.
They even work in crime labs, isolating and studying DNA to solve crimes (think CSI!).
Humanities Tie-In Global climate change is causing major changes in many local and regional environments.
Choose a species that you believe may be particularly susceptible to these rapid changes in
temperature, rainfall, and other weather-related conditions. Write a letter from a member of
that species to the President explaining in what ways your environment has changed, how
that has affected your ability to thrive and survive, and one thing that could be done that
would minimize the risk of extinction to your species.
14
INQUIRY ADVENTURE:
BIOLOGY! DAY 4
Subject Overview
Science Center Visit
Grade Level
7-10
During your visit to Carnegie Science Center, students will participate in many activities related to
the Adventure. In the Chaperones’ Guide, there are a series of guiding questions that are designed
to aid students in synthesizing the information that will see today and recognize the
interrelationships between different scientific concepts. Below are brief descriptions of the specific
activities that are a part of the Adventure. Remember that teachers are encouraged to tailor the
specific content and activities to the knowledge and skill levels of their classes.
Teacher Guide
Objectives Students will apply the knowledge that they have learned in class this week as they complete
activities during their visit to the Carnegie Science Center. They will also extend their
understanding from the classroom to the practices where this knowledge is applied in the
“real world.”
Highmark
SportsWorks
The SportsWorks® Data Card provides kids with the opportunity to get a little exercise and
see how it affects their heart rate. Like scientists, they will record the data and, in subsequent
classes, look for trends and relationships. Although students will be able to participate in any
available SportsWorks® activities, those that are slotted for data collection on the card
include:
Fit Stops 1, 2 & 6: Steam Engine, Running in Place, & Jumping Jacks, respectively.
Rock-to-Pus
Omnimax:
Mysteries of the
Unseen World
A whole new world is open to us, thanks to cutting-edge science and technology making the
invisible visible, affecting our lives in ways we can’t even imagine. Think what you see around
you is all there is? Think again! Mysteries of the Unseen World will transport your class to
places on the planet they've never been before, to see things that are beyond their normal
vision yet are literally right in front of their eyes.
Materials Required
Writing Implement
SportsWorks® data card
Additional Resources
-
PA Standards

15
Teacher Guide
BodyStage:
Scanning, Scopes,
and Surgery!
Middle and high school students will explore the options doctors have in examining the body
and how they can use the latest technology to help them diagnose a patient's condition.
Students will learn how and why medical professionals choose between non-invasive scans,
minimally invasive scopes, and the serious consideration of surgery. During the show
students will see examples of scanners and scopes in action, before taking a look at the skills
of surgery through a dissection.
Activities &
Exhibit Gallery
At the tabletop activities, students can see first-hand what DNA looks like and how things
that are invisible to the naked eye appear under the microscope. The whole museum is theirs
to explore, of course; but in roboworld on the second floor, they can come to see how much
of the technology we have today was created based on designs in nature.
Summary While at the Science Center, students will participate in activities that allow them to make
connections between the study of evolution, genetics, cells, and organisms to everyday life and
recognize and identify potential careers in these and other areas related to STEM.
16
INQUIRY ADVENTURE:
BIOLOGY! DAY 5
Subject Overview
Post-Visit Data Analysis
Grade Level
7-10
This activity is designed for students to see a graphical representation of the data collected in
SportsWorks®. Graphs will be created using a spreadsheet application like Microsoft Excel or Google
Sheets. Students will also learn to use formulas in spreadsheet applications.
Teacher Guide
Objectives The purpose of this lesson is to help students recognize that trends in data are often more
easily recognized when analyzed graphically. Students will create two graphs ─ one line graph
and one bar graph ─ and determine which is more appropriate in different situations. Students
will also be able to differentiate between an independent and dependent variable.
Anticipatory Set Scenario: Students are asked to measure the temperature at noon at their house for one year.
Show students an image of a line graph with no data labels (like a long-term stock market
graph) and a bar graph. Discuss which graphing type is more appropriate, which variable (date
or temperature) depends on the other, and have them come up with ideas for creating graphs
when there are large amounts of data. Also discuss advantages and disadvantages of each
graph type.
Information Explain the difference between an independent and dependent variable (Asking, for example,
the question: “Does temperature depend on the date or does the date depend on the
temperature?”).
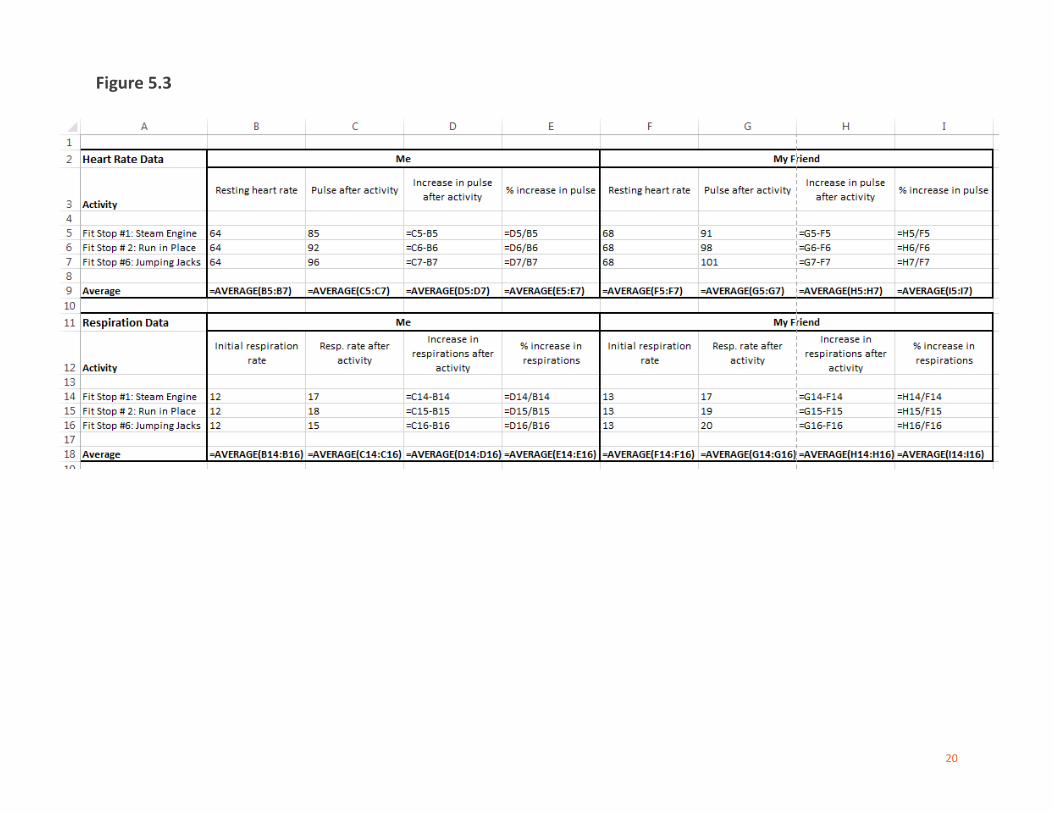
In a spreadsheet, formulas that will automatically complete a mathematical calculation begin
with an equal sign and can be expressed either as a mathematical formula (e.g. =B4/F4) or using
a function term (e.g. =AVERAGE(B4:F4)).
Bar graphs are best used when comparing categories of variables whereas line or scatter graphs
are better for identifying trends series of data.
Materials Required
Computer with spreadsheet software
Sports Works data card
Additional Resources
-
PA Standards
-3.1.10.A9
-3.1.10.B6
17
Teacher Guide
Activity Using a spreadsheet program, have students create a data table similar to Figure 5.1 and using
the data that they collected in SportsWorks®. The students should use formulas for determining
their Increase In Heart Rate, % Increase In Heart Rate and Average Heart Rate. A copy of the
data table (Fig. 5.3) is included with the formulas shown. Then they can create both a line and
bar graphs (Scatter “Line with Markers” and Column “Clustered”, respectively, in Excel). Figure
5.1 shows the data that are highlighted to create the graph. Next, have the students create the
following graphs with a particular emphasis on choosing the proper graph type:
1. A comparison of the % increase in your heart rate per activity
2. Your elevated heart rate and your friend’s elevated heart rate for all three activities
3. A graph of resting and average elevated heart rate for both you and your friend
Verification After the students have finished their graphs, have them address the following prompts
individually, with their partners, or as a class discussion:
Write an alternative formula (in the form of a mathematical expression) that could be used as a
substitute for AVERAGE.
Find a function term in the spreadsheet that would allow you to add up a series of numbers.
Hint: What is the result of addition called?
Which graph type would be better to compare the amount of sleep you get each night? Why?
Which type of graph would be better to compare the number of red cars in the parking lot to
the number of black cars? Why?
What are the physical demands of the body on a cellular level that result in an increase in heart
rate and respirations?
What types of evolutionary differences between organisms could make them more or less
adapted for physical exertion? Cite specific examples.
Summary The use of spreadsheets allows for rapid data analysis and helps to identify trends in
information. Furthermore, they allow the user to create and analyze the information not only
numerically, but graphically as well. Most importantly, they decrease the amount of time
required to evaluate sets of data and graphs, thereby increasing productivity.
Homework Record your resting heart rate. Then run or walk briskly for at least 5 minutes, being sure to
elevate your heart rate. Upon finishing the exercise, immediately measure your heart rate for
15 seconds, calculate your heart rate, and record the value. Then re-measure and re-record
your heart rate every minute for the next 10 minutes, being sure to record the values. Once you
have recorded your data, create a data table using MS Excel or Google Sheets (free). Finally,

18
Teacher Guide
create a graph of heart rate vs. time where Time 0 is your pulse at the instant you finish your
exercise.
Career Awareness Spreadsheets are used in many career fields and not simply limited to STEM fields. In addition
to data analysis like this lesson, spreadsheets are used by accountants, financial analysts,
business owners, or anyone whose job requires evaluating numbers and sets of data. They can
help show if a business is growing over time or headed for disaster. They can also help scientists
determine the success or failure of a hypothesis or discover new trends and relationships in
nature.
Figure 5.1

19
Figure 5.2
20
Figure 5.3