inorganics in fuel: a century of scientific … archive/files/merge/vol-45... · inorganics in...
TRANSCRIPT

INORGANICS IN FUEL: A CENTURY OF SCIENTIFIC AND ENGINEERING PROGRESS
Constance L. Senior Physical Sciences, Inc.
20 New England Business Center Andover, MA 01886 USA
INTRODUCTION
Combustion of fossil fuels has been the backbone of the power generation, manufacturing and transportation industries in the twentieth century. Although the mix of fuels has changed, at the close of the century we find that combustion systems have not changed overmuch. Operational caused by inorganic elements in fossil fuels (corrosion, slagging, and fouling) continue to present problems in combustion systems, although substantial progress has been made in understanding and addressing such problems. In the latter half of tpe century, the impact of inorganic elements in fossil fuels on the environment was recognized as a potential problem. Considerable effort has therefore been directed at understanding the behavior of certain trace metals such as mercury. arsenic, nickel, chromium, and selenium during the combustion process. This paper briefly reviews the behavior of inorganic elements in practical combustion systems as well as the progress made in applying this knowledge to improvements in operational and environmental performance.
Most inorganic elements in the periodic table can be found in fossil fuels, although only a small number occur in significant concentrations to cause operational or environmental problems. Coal has by far the highest content of ash, although the chemical composition of lower ash fuels can makedoil and biomass problematic in some instances. Table 1, drawn largely from Bryers,' summarizes the contributions of the elements in ash from various fuels to slagging, fouling, corrosion, and environmental problems. Slagging is defined as deposition of fly ash in the radiant section of the furnace, on both heat transfer surfaces and refractory surfaces. Fouling occurs in the convective heat transfer section and includes deposition of ash and volatiles as well as sulfidation reactions of ash. Fouling results in loss of heat transfer efficiency and blockage of the gas flow path. Corrosion occurs primarily on the water-wall tubes in the radiant section of the boiler and results in thinning of tubes with eventual leaks.
Table 1. Impact of Inorganic Elements in Fuel on Operational and Environmental Problems.
Bituminous Subbituminous Lignite Oil and Coke Biomass
4-7% . 520% - 0.1 -0.5%
Fe S
Ca S F, S F. S S S
Ni V As Cr Hg
F C, F
E E E E E
E E E E
!
devices and the poisoning of selective catalytic reduction catalysts by arsenic. In coal-fired power plants, the sodium and sulfur contents of the fuel both affect the resistivity of the fly ash. If an electrostatic precipitator (ESP) is used to collect the ash, resistivity is the key ash parameter which influences the collection efficiency.
CmRACTERIZATION OF INORGANIC ELEMENTS IN FUEL
Since the 1960’s. low rank coals have become more widely used for steam generation because of their low ash and sulfur contents. Low rank fuels have a major proportion of inorganic elements organically bound to the coal matrix instead of in discrete minerals. Selective leaching (or chemical fractionation) methods have been used to identify and characterize the organically bound elements, primarily Ca, Na, and Mg in subbituminous and lignite coals! Recently, selective leaching and advanced analytical methods such as X-Ray absorption fine structure spectroscopy have been applied to the problem of determining the forms of occurrence of trace elements in coa1.7.~
Oil and coke, as well as biomass, have much lower ash contents than coal and little, if any minerals (although the inorganic elements in these fuels can still cause problems in practical combustion systems). Generally the ash content and ash composition of these fuels is all that is measured, although the mineralogy and leaching behavior of elements of some biomass fuels have been reported.’
Coal was the first fossil fuel to be used for generation of steam applied to transportation and manufacturing, and later to large-scale power generation. Heavy oils and coke, produced from refining of petroleum have been utilized for power generation and manufacturing in the latter half of the century. Wood and agricultural wastes (biomass) have been used at a low level throughout the century, and this may increase with concerns about the use of non-renewable resources. Most of the fossil fuels used for large scale industrial use have a substantial fraction of inorganic elements, the exceptions being natural gas and transportation fuels such as gasoline and diesel oil.
Early methods for characterizing inorganic elements in coal were indirect. for example, ash content or fusibility of the ash. It acknowledged early on that the composition of coal ash strongly influenced the tendency to form deposits in the combustion system. Beginning in the 1930’s. the contribution of specific minerals to slagging and fouling problems was recognized using methods of density separation to isolate mineral-rich fractions of coal? With the advent of cyclone boilers for pulverized coal, viscosity measmments were made on coal ash? Mineralogical characterization of coal continued, resulting in a fairly comprehensive understanding of the occurrence and formation of the major minerals in coal by techniques such as physical separation, selective leaching, and x-ray diffraction analysis. Table 2 summarizes the important minerals in coal.’ More recently, automated techniques such as computer controlled scanning electron microscopy (CCSJ~V~)~ and scanning electron microscopy point count (SEMPC).’ have been developed to provide a more accurate picture of the minerals in coal.
Table 2. Minerals occurring in coal
Quartz Shale group
Species: illite, montmorillonite, muscovite, bravaisite General formula: (IC, Na, H30, Ca)2 (AI, Mg, Fe, Ti)4 (AlSi080~(OH,F)~)4)
Species: kaolinte, livesite, metahalloysite Formula: AIz(Si205)(0H)4
Species: pyrites, marcasite Formula: FeS2
Carbonate group Species: calcite, dolomite, ankerite Formula: (Ca,Mg,Fe,Mn) C03
Species: sylvite, hallite Formula: KCI, NaCl
Kaolin group
Sulphide group
Chloride Group
533

IMPACT OF INORGANIC ELEMENTS ON SYSTEM OPERATION
At the start of the twentieth century, coal burned in stoker-fired units was the most common for industrial applications. In the 1920’s pulverized coal was invoduced and this allowed the design and implementation of new combustion system designs, including wall-fired boilers, cyclone boilers, and fluidized bed combustors. Large scale refining of petroleum in the latter half of the twentieth century introduced new fuels, heavy oils and coke, which are often burned to produce steam and/or electricity in suspension-fired and fluidized bed combustion systems.
Figure 1 illustrates the transformation of inorganic elements during coal combustion. Petroleum- derived fuels and biomass transformations are similar, although these fuels have less discrete mineral matter than coal. During the combustion process, the carbon matrix is consumed resulting in very high particle temperatws. Most of the inorganic elements (either from discrete minerals or organically associated) coalesce into ash particles in the range of 1-20 microns in diameter. A small part of the inorganic elements vaporize during the combustion process (1-5 w t l ) and recondense, forming a fine (0.1-0.5 micron) aerosol. Some inorganic vapors condense on the larger ash particles, but the high specific surface area of the submicron aerosol tends to bias condensation to the smaller particles.
These ash particles reside largely in the flue gas in pulverized coal- or oil-fired combustion systems. In cyclone-fired boilers and fluidized bed systems, the majority of the ash ends up as slag or spent bed material. This fly ash, in the flue gas, deposits on heat transfer surfaces in the boiler and ultimately, on modem coal-fired combustion systems, must be removed before the gas can be emitted to the atmosphere.
I 0 1 0 7 1 2 1
@ Coal / @ FlameZone / @ Post-Combustion
Figure 1. Transformations of Inorganic Elements During Combustion of Pulverized Coal
As disc.ussed above, slagging, fouling and corrosion affect the operation of industrial combustion systems and are directly caused by inorganic elements in fossil fuels. Coal combustion systems are plagued by all these problems. Corrosion is the dominant problem in oil-fired boilers because of the formation of vanadium sulfate deposits which are quite corrosive. Corrosion can be a problem in some biomass combustion systems because some biomass fuels have a very high alkali content. The combination of silica and alkali can also result in slagging and fouling.
Initially, empirical indices were developed to evaluate the potential for operational problek due to the inorganics in fuels. There are many such indices,’ but they are not specific to particular boiler designs or operating conditions. As discussed above, the realization that specific minerals in coal were responsible for slagging, fouling, and corrosion led to an explosion of research on mineralogical characterization of fuels. This was followed by attempts to create mechanistic (as opposed to empirical) models for the behavior of inorganic elements in practical combustion systems?”0stt Such models are used to provide better indications of the potential effects of fuels on system operations.
534

IMPACT OF INORGANIC ELEME-S ON THE ENVIRONMENT
The emission of toxic metals to the air and water from fossil fuel combustion is becoming of concern. In the United States, the potential for regulation of hazardous air pollutants, including metals, was specifically addressed in the 1990 Amendments to the Clean Air Act.
A recent report by the Environmental Protection Agency @PA) on emission of hazardous air pollutants by electric utilities predicted that emissions of air toxics from coal-fired utilities would increase by 10 to 30% by the year 2010.L2 Mercury from coal-fired utilities was identified as the hazardous air pollutant of greatest potential public health concern. Anthropogenic emissions of mercury account for 10 to 30% of the world-wide emissions of mercury.’* EF’A has estimated that during the period 1994-1995 annual emissions of mercury from human activities in the United States were 159 tons.” Approximately 87% of these emissions were from combustion sources. Coal-fired utilities in the U.S. were estimated to emit 51 tons of mercury per year into the air during this period. Considerable work is in progress by the author,I3 and many other groups, which will lead to a more complete understanding of the behavior of mercury in coal- fired power plants.
Other metals (e.& As, Cr, Ni, V) are also of concern when burning petroleum~denvedfuels. Chromium and nickel are the metals of most concern for residual oil combustion. Certain Compounds of Cr and Ni are highly carcinogenic. Advanced analytical methods such as XAFS have been used to identif compounds of these elements in residual oil fly ash in order to assess the potential health Cd and Zn in biomass fly ash have also been characterized by this technique. When considering the potential risk to human health or to the biosphere, the ability to identify specific compounds of these toxic metals becomes vitally important. Advanced analytical methods have proved useful in the past and are continually being improved.
SUMMlLRY
Inorganic elements are present in almost all industrially important fossil fuels and can have major impacts on operation and environmental performance of fossil fuel combustion systems. Improved analytical methods for measuring the composition and for characterizing the form of inorganic elements in fuels have been developed. These methods have led to a better understanding of the behavior of inorganic elements in combustion systems and have spurred the development of fundamentally based models which have been applied in practical systems. More recently, concerns have been raised over the impact of fossil fuel combustion systems on the environment. Advanced analytical methods are just now starting to be applied to characterization of trace. metals in fossil fuel and in combustion byproducts. This will lead to an , impved understanding of the behavior of trace metals in combustion systems and more effective methods to assess the potential risk to human health.
REFERENCES
I. Bryers, R.W., “Fireside Slagging, Fouling, and High-Temperature Corrosion of Heat Transfer Surface due to Impurities in Steam-Raising Fuels,” ProgEnergy Combust. Sci., 1996,22,29- 130.
Combustion, 1933, October, 15-17.
Furnace performance supplement to Trans. ASME, 1940.62, 144-153.
2. Moody, A.N. and Langan, D.D., “Fusion characteristics of fractionated coal ashes,”
3. Reid, W.T. and Cohen, P., “Flow characteristics of coal ash slags in solidification range,”
4. Lee. R.J., Huggins, F.E., and Huffman, G.P., Scanning Electron Microscoov/l978~, (ed. 0.
5. Steadman, E.N., Erickson, F.A., Folkedahl, B.C.. and Brekke, D.W., “Coal and ash Johari), SEM Inc., 561-568, (1978).
characterization: digital image analysis applications,” in Proceedings of the Engineering Foundation Conference on Inorganic Transformutiom and Ash Composition During Combustion, S.A. Benson, editor, ASME, New York, 1991, pp. 147-164.
F.T., “Combustion and Leaching Behavior of Elements in the Argonne Premium Coal Samples,” Energy & Fuels, 1990.4.755-766.
7. F. E. Huggins, N. Shah, G. P. Huffman, A. Kolker, S . Crowley, C. A. Palmer, and R. B. Finkelman, “Mode of occurrence of chromium in four US. coals“, Fuel. Proc. Technol..
8. Kolker, A., Palmer, C.A., Crowley, S.S., Finkelman, R.B.. Huggins, F.E., Shaw, N., and Huffman. G.P. “Mode of Occurrence of Arsenic in Four US. Coals.” Fuel. Proc. Technol.,
9. Helble. J.J.. Srinivasachar. S., Senior, C.L.. Wilemski, G., Baker, J., Simons, G.A., and Johnson, S.A., “A fundamentally based model of slag formation in utility boilers,” presented
6. Finkelman, R.B., Palmer, C.A., Krasnow. M.R., Aruscavage, P.J., Sellers, G.A., andDulong,
u)oo, 63(2-3). 79-92.
Moo, 63(2-3). 167-178.
535
\
\
at the Second Australian Workshop on Ash Deposition, Brisbane, Queensland, Australia, July 13-14, 1992.
10. Erickson. T.A., O’Leary, E.M., Folkedahl, B.C., Ramanathan, M., Zygarlicke, C.J., Steadman, E.N., Hurley, J.P., and Benson, S.A.. “Coal Ash Behavior and Management Tools,” in The Impact of Ash Deposition on Coal Fired Power Plants, I. Williamson and F. Wigley, editors, Taylor & Francis, Washington, D.C., 1994.
11. Baxter. L.L., “Ash Deposition During Biomass and Coal Combustion: A Mechanistic Approach,” Biomass andBioenergy, 1993.4. 85-102.
12. Keating, M.H., et al. Mercury Study Repon to Congress, Volume I: Executive Summary, EF’A45UR-97-003, December 1997.
13. Sarofim, A.F., Senior, C.L., and Helble, J.J., “Emissions of Mercury, Trace Elements, and Fine Particles from Stationary Combustion Sources,accepted for publication in Fuel. Proc. Technol., 2000.
characterization of elements in combustion ash and fine particulate matter,” presented at the Conference on Air Quality, McLean, Virginia, December 14,1998.
14. Huggins, F.E., Shah, N., Huffman, G.P., and Robertson, J.D., “XAFS Spectroscopic
I
536
\
MODES OF OCCURRENCE OF TRACE ELEMENTS IN COAL: RESULTS FROM AN INTERNATIONAL COLLABORATIVE PROGRAMME
Robert M. Davidson E A Coal Research - The Clean Coal Centre
G e d House, 10- 18 Putney W London SW15 6AA, United Kingdom
email: [email protected]
Keywords: Coal, Trace Elements, Modes of Occurrence
INTRODUCTION A collaborative research project on the modes of occwence of trace elements in coal was set up within the E A implementing agreement on Coal Combustion Sciences. Les Dale of CSIRO, Australia, coordinated the project. Participants in the project were requested to determine the modes of occurrence of trace elements of environmental significance using their chosen methodology. The aim was to determine not only the modes of occurrence but also to obtain data that could be compared and contrasted. The tinal reports were then sent to E A Coal Research to form the basis of a critical review of the project (Davidson, 2000). They have been published on the CD-ROM that accompanies the overall final report.
The collaborative programme was set up because the participants believe that understanding the modes of occurrence in coal is essential for developing reliable models to predict the behaviour of elements during in-ground leaching, weathering, coal cleaning, or combustion. Modelling the behaviour ofthe trace elements is necessary to provide an accurate evaluation of the environmental and human health impacts, technological impacts, and economic by-product potential of coal use (Willett and others, 2000). Knowledge of the mineralogical residences or modes of occurrence of trace eldents in coal is very important in the understanding of mechanisms by which trace elements are enriched in fly ash and are found in flue gas (Dale and Chapman, 1999). This is because the behaviour of the trace elements in coal-ked power stations is partly dependent on the mode of Occurrence of the elements in the original coal (wigley and others, 2000).
TEE PARTICIPATING LABORATORIES Laboratories in Australia, Canada, Spain, the United Kingdom, and the USA participated in the collaborative study:
Australia
Canada
Spain
UK
UK
USA
USA
USA
CSIRO, Division of Energy Technology, Lucas Heights, NSW (Dale and Chapman, 1999) Geological Survey of Canada, Energy and Environment Division, Calgary, Alberta (Goodarzi and others, 1999). Institute of Earth Sciences “Jaume Almera”, CSIC, Barcelona (Querol and others, 1999) University of Sheffield, Centre for Analytical Sciences, Sheffield (Spears and others, 1998) Imperial College of Science, Technology and Medicine, Department of Materials, London (Wigley and others, 2000) Energy t Environmental Research Center, University of North Dakota, Grand Forks, ND (Galbreath and others, 1999) University of Kentucky, Department of Chemical and Materials Engineering, Lexington, KY (Huggins, 1999) US Geological Survey, Reston, VA (Willett and others, 2000)
TBE COALS SELECTED In the initial stages of the project, three different coal samples were distributed. A fourth coal, from a mine in Nova Scotia, Eastem Canada was distributed to participants about a year after the first three coals were distriiuted. Not all the collaborating laboratories were able to study all four samples, but most were able to study the Australian, British, and US samples. The coals selected were: 0
0
0
0
Table 1 lists some analytical data provided by Goodarzi and others (1999).
Wyee coal - a high volatile bituminous Australian coal, Gascoigne Wood - a UK bituminous coal from a 2 tonne batch from power station feed, Illinois No. 6 - a high volatile US bituminous coal, and an Eastern Canadian coal - &so high volatile bituminous.
537

Table 1 Proximate and ultimate analyses of the four coals (Goodarzi and others, 1999)
WYee, Eastern Gascoigne Illinois Australia Canadian Wood, UK No. 6, US
Proximate analysis, wt% ar
Moisture 2.6 1.33 3.2 3.3 Ash 23.0 9.86 15.2 10.1 Volatile matter 27.1 31.96 29.6 36.1 Total sulphur 0.37 3 1.16 3.4
Ultimate analysis, wt% daf
Carbon 63.62 75.31 69.2 69.84 Nitrogen 1.31 1.38 1.58 1.36 Sulphur 0.38 3.00 1.20 3.52 Hydrogen 3.46 4.53 4.03 4.27 W g e n 7.62 6.12 8.25 10.57
Sulphur forms, wt%
Sulphate S 0.01 0.30 0.08 0.08
organic s 0.31 1.00 0.76 2.02 Pyritic s 0.05 1.70 0.32 1.30
MINERALOGY Goodadand others (1999) provide a comprehensive account of the mineralogies of the coals used in these studies. Most ofthe collaborating laboratories analysed the mineral composition of the coals although different methods were used. The analyses of the bulk ash contents are in reasonably close agreement for all the laboratories that provided data. However, some differences emerge in the detailed data. Huggins (1999) reports values for the floadtailings fiactions and their ash content for separations performed using a Denver flotation cell. Galbreath and others (1999) separated the coals using a 1.6 specific gravity solution for the Wyee coal and a 1.45 specific gravity solution for the other three. The data are compared in Table 2 that lists the percentage ash remaining in each fraction.
Table 2 Percentage ash separation analyses (Galbreath and others, 1999; Huggins, 1999)
Wyee, Eastern Gascoigne Illinois Australia Canadian Wood,UK No.6,US
Density sink 73 76 73 54 Denver cell tailings 40 49 69 21
Density float 27 24 27 46 Denver cell float 60 51 31 79
The differences, except for the Gascoigne Wood coal, are considerable but most likely reflect physical differences in the separation methods. The differences in the separations by different mechanical separations could possibly lead to different assignations of the trace element modes of occurrence. It would be expected that a greater proportion of trace elements will be found in the maceral-rich fiaction fiom Denver cell flotation except, possibly, for the Gascoigne Wood coal. Although, when at least 24% ofthe ash is encountered within the maceral-rich float f?actions, this is scarcely evidence for ‘mBceTB1-BssociBtion’ rather than ‘mineral-association’ with minerals dispersed within the bulk of the organic matter. Grllbreath and others (1999) observed that most of the minerals in their float fiactions were present as tiny (< 5 pm in the longest dimension) inclusions within coal particles. Most of the trace elements are enriched to some extent in the tailings hctions ( G o o d d and others, 1999) but, even when depleted in the float compared with the coal, a greater proportion of the trace elements often remains there.
THE TRACE ELEMENTS COMPARED Not every trace element was analysed by every laboratory so that comparisons among them have to be made using a restricted set. The eleven elements identified in the US Clean Air Act Amendments (CAAA) of 1990 as potentidy ‘hazardous air pollutants’ with the addition of copper and zinc formed the basis of the overview report:
538

. Beryllium, chromium, manganese, cobalt, nickel, copper, zinc, arsenic, selenium, cadmium, antimony, mercury, and lead.
A range of analytical techniques was employed in the qualitative and quantitative analysis of the elements in the coals and their fractions. Generally, the data for the concentrations of these trace elements in the whole coal were in reasonably good agreement
SAMPLE FRACTIONATION In order to determine the modes of occurrence of the trace elements in the samples, the coals were fractionated using variants of two techniques - physical separation and sequential leaching. As noted above, Galbreath and others (1999) used a float/sink density separation method with specific gravity solutions composed of mixtures of reagent-grade tetrachloroethylene and petroleum ether. After and centtifugatior~, the float and sink samples were separated, dried in a nitrogen-purged oven and weighed. Float W o n s were composed predominady of organic (maceral-rich) with small proportions of minerals. Most minerals in the float fractions were present as tiny (< 5 pm in the longest dimension) inclusions within the coal particles. However, as shown in Table 2, the minerals in the float fractions still accounted for about a quarter of the total in three coals (Wyee, Eastern Canadian, and Gascoigne Wood) and nearly half in the Illinois No. 6 coal. The sink fractions were composed predominantly of larger discrete mineral grains.
Querol and others (1999) also used density hctionation. They obtained seven density fractions between < 1.3 and > 2.8 g/cm3 by using heavy liquid mixtures ofbromoform, tetrachloroethylene, and xylene. It was noted that the density fractionation technique was developed for the study of high m i n d matter coals. The relatively low m i n d matter content of the coals in the collaborative study made complete isolation ofthe minerals &cult. Further, as noted above, it was also found that the mineral matter was finely dispersed in the organic matter that consequently made good density separation. It was for such reasons that chemical treatments were also used to isolate or extract mineral ihases from the density fraction, specifically to extract gypsum from the 2.0-2.4 dcm’ W o n of the Gaswigne Wood coal and to enrich pyrite by acidic attack on calcite in the > 2.8 dcm’ fraction ofthe Illinois No. 6 coal (Querol and others, 2000). Using this separation technique, Querol and others (1999) were able to assign the trace elements into the following atfinity categories:
organic matter (OM), density fraction < 1.3; aluminosilicates, mainly clays (ALS); sulphates (GYP); sulphides, selenides, and arsenides (PY), density fraction > 2.8; iron carbonate (CARB); heavy minerals (HTvl); and phosphates (PHOS).
Table 2 in Querol and others’ (1999) report shows more details of the density fractions used for each coal. Querol and others (ZOOO) later moddied their density fractionation data by using a mathematical deconvolution of the chemical analyses of the whole coals and their density fractions. The mathematical deconvolution calahtes the amount of organically associated elements in each density fiaction. It is based on a method developed by Uka and Kolomaznik (2000) and uses the following data from the float/sink experiments: 1. 2. 3. 4. This enables the calculation of the percentage trace element atfinity to the organic part of the coal. The concentrations of the elements in the sulphide and carbonate fractions of the coal are used in a semiquantitative determination of the elemental atfinities in the inorganic parts of the coal.
Huggins (1999) used a hybrid physical separation method in which the coal samples were first separated into float and tailings W o n s using a Denver column flotation cell. A small fraction of the tailings product was then fiuther subdivided by a float/sink density separation technique using bromoform with a specific gravity of 2.875. As a result of these separations, the as-received coal (RAW) was split into four fractions:
mass of the coal fractions, sum of crystalline phases and ash content, concentrations of the trace elements in each of the coal fractions, concentrations of sulphide and carbonate in each fraction.
the tailings (TAILS) from the Denver cell flotation, an “organic fraction” (ORG) representing the float fraction from the Denver cell, a “heavy minerals’’ fraction (HYhQ representing the fraction of the Denver cell tailings that sank in bromoform, and a “clay” W o n (CLAY) representing the fraction of the Denver cell tailmgs that floated in bromoform.
The bromoform separations were not very successfid. As a result, with the exception I-2% of HYh4 from the Illinois No. 6 coal, the TAILS and CLAY fractions were essentially the same. The float and t d h g s fractions from the Denver cell were also analysed by Goodarzi and others (1999).
539

n e other laboratories involved in the study used different sequential leaching separations. These are based on the standard method of determining the forms of sulphur in coal. Dale and Chapman (1999) used the following sequence: 1. 4.3 M hydrochloric acid (HCI) at 80°C for two hours. This dissolves oxides, carbonates, and
monosulphides. The residue was then treated with 2. 0.5 M nitric acid WO,) at 80°C for two hours. This dissolves sulphides (pyrite). The residue
was then treated with 3. 10 ml40% hydrofluoric acid @IF) and 1 ml concentrated HCI at 60-70°C for I hour. 5 ml
HCl and 5 ml water were then added and the mixture heated at 60-70°C for a hrther 1 hour. This dissolves the silicates.
The various solutions were analysed for specific trace element concentrations and the “organic” residue was also analysed. The selectivity of the pyrite leaching (stage 2) for the Illinois No.6 coal was investigated by X-ray difhction. It was verified that 0.5 M HNO, removed 100% of the pyrite.
Although not used in the study of the E A collaborative programme coals, Dale and others (1999) later introduced an initial stage in which coal samples were treated with 1M ammonium acetate (CH3COOW) at 80°C for two hours. This is similar to the first stage of the USGS sequence used by Wdlett and others (2000): 1 . 1N ammonium acetate (CH3COONH,). This removes loosely bound ions that may be
organically assodated or ions absorbed on clays and dissolves some calcite. The residue was then treated with 3N HCl. This removes cahonates, such as calcite, and monosulphides. The residue was then treated with concentrated (48%) HF. This removes silicates, including quartz and clay minerals. The residue was then treated with 2N HNO,. This primarily removes disulphides such as pyrite.
2.
3.
4. It was mgnised that some silicates, such as zircon, may be resistant to the HF leaching in stage 3. The residh left includes these, other insoluble minerals, and elements “shielded” from the solvents, together with the organic portions of the coal. It should be noted that the ash yield of the residual leached coal was commonly less than 0.3 wt0/0, suggesting little in the way of shielded and insoluble phases in most coals.
Spears and others (1998) used the sequence: 1 ,
2.
3.
4.
5 .
6. Unlike the other sequential leaching procedures, this method completely digests the coal sample leaving no “organic” residue. Some inherent problems in the technique were recognised by Spears and others (1998). For example, some of the pyrite is released in stage 3 but not quantitatively, the rest is removed in stage 4. The silicates and the organic matter will also have been partially attacked in the early stages. There. is also the problem that mineral groups, such as carbonates and sulphides, do not behave uniformly.
Obviously, the data fiom the different groups are not strictly comparable since they were obtained from different of separation techniques ranging from simple fractionation into float and sink fractions to more complex fractionation either by density fractionation or selective leaching. Nevertheless, comparisons needed to be made, even at the risk of misinterpreting some of the data. The comparisons are published in the final overview report @avidson, 2000) and some of them will be discussed in the presentation.
shake with deioinised water for up to I2 hours. This removes elements present in pore fluids and soluble minerals. The residue is shaken with dilute HCI for up to 12 hours. This removes &nates (mainly calcite), exchangeable cations and monosulphides. The residue is shaken with dilute HNO, (5%) for up to 12 hours. This removes carbonates (mainly dolomite and ankerite) and some pyrite. The residue is shaken with concentrated, cold HN03 and allowed to stand for up to 12 hours. This removes the remaining pyrite. The solid remaining is digested with concentrated HNO, with microwave heating. This digests the organic matter. Any remaining solid is digested with concentrated HCI and HF with microwave heating. This digests the silicates.
,
540

REFERENCES
Dsk S, Chapman J F (1999) IEA collaborativeproject on the modes of occurrence of trace elements in coal @me 1)fnaI report. Lucas H-, NSW, Austdia, (bmmndh Scientific and Industrial Research Organisation, Division of Energy Technology, 18 pp @ec 1999)
Dale L S, Chapman J F, Buehaoan S J, Lavrencic S A (1999) Coaperative Research Centrefir Black Coal utilisation. Mechanisms for trace element partitioning in Australian coals. Project 4.2 -fnal report. hw~gation report CET/lR215, Lucas Heights, NSW, Australja, Commonwealth Scientific and Industrial Research Organisation, Division of Energy Technology, 35 pp (Sep 1999)
Dadson R M (2000) Modes of occurrence of trace elements in coal: Resultsfrom an international collaborativeprogramme. London, UK, E A Coal Research (2000)
Galbreath K C, Dewall R A, Zygarlicke C J (1999) IEA Coal Research collaborative programme on mades of Dccurrpnce of trace elements in coal - results fiom the Energy C? Em’ronmental Research Center. Final report. Gwd Forks, ND, USA, Enem & En- Research Center, Universrty of North Dakota, 21 pp (Nov 1999)
Goodalzi F, Pollock S, Charland J-P (1999) Mode of occurrence of trace elements und minerals in coal. Calgary, Alberta, Canada, Geological Survey of Canada, Eaergy and Environment Division, 80 pp (1999) Huggins F E (1999) Trace element speciation in four bituminous coals. Lexington, K Y , University of Kentucky, Department of Chemical and Materials Engineering, 56 pp (1999)
Kwra Z, Kolomaplik I (m) New concept for the calculation of the trace element afsnity in ccal. Fuel; 79 (6); 659-670 (May 2000)
Querol X, Alastuey A, Juan R, Huerta A, LQpez-Soler A, Plana F, Chenery S R N, Robinson J (1999) Determination of elemental aflnities by demifyyfmcronation of bulk coal samples. Barcelona, Spain, Institute of Earth Sciences “Jaume Ahnera”, CSIC, 19 pp (Sep 1999)
Querol X, KLika Z, Weiss Z, Finkelman R B, Alastuey A, Juan R, LdpQSoler A, Plana F, Koker A, Chary S R N (ZOao) Determinatioa ofeheutal a5nities by density fractionation of bulk mal sanprles. To = be published m Fuel.
Spears D A, Booth C, Staton I (1998) Mode of occurrence of frace elements in round-robin coals: dl;fferential dissolution. 1998)
Sheffield, Univenityof Sheffield, ’ Analytical Sciences.
Wigley F, Williamson J, Miles N J (ZOOO) The dism’bution of trace elements in a UK bituminous coal. h d m , LK, Impenal College of Science, Technology and Medicine, Departmat of Materials, 44 pp (2000)
Willett J C, Finkelman R B, Mroczkowski S J, Palmer C A, Koker A (2000) Semiquantitafive determination of the modes of occurrence of elements in coal: resultsfrom an international round robin project. Final report. Reston, VA, USA, US. Gaological Survey, 45 pp (2000)
54 1

STANFORD-USGS SHRIMP-RG ION MICROPROBE A NEW APPROACH TO DETERMINING THE DISTRIBUTION OF TRACE ELEMENTS IN COAL
Allan Kolker’, Joseph L. Wooden2, Harold M. Persin?, and Robert A. Zielinski3
’U.S. Geological Survey, 956 National Center, Reston. VA 20192 2U.S. Geological Survey, Stanford- USGS Micro-lsotopic Analytical Center, Green Earth
Sciences Building, Stanford University, Stanford, CA 94305-21 15 ’US. Geological Survey, 973 Denver Federal Center, Denver, CO 80225
Key Words: IlliWSmectite in Coal; Ion Probe Analysis; SHRIMP-RG.
ABSTRACT
The distribution of Cr and other trace metals of environmental interest in a range of widely used US. coals was investigated using the Stanford-USGS SHRIMP-RG ion microprobe . Using the oxygen ion source, concenhations of Cr (11 to 176 ppm), V (23 to 248 ppm), hh (2 to 149 ppm), Ni (2 to 30 ppm), and 13 other elements were determined in illitelsmectite, a group of clay minerals commonly present in coal. The results confirm previous indirect or semi-quantitative determinations indicating illitelsmectite to be an important host of these metals. Calibration was achieved using doped aluminosilicate-glass synthetic standards and glasses prepared fmm USGS rock standards. Grains for analysis were identified optically, and confirmed by 1) precursory electron microprobe analysis and wavelength-dispersive compositional mapping, and 2) SHRIMP-RG major element data obtained concurrently with trace element results. Follow-up investigations will focus on the distribution of As and other elements that are more effectively ionized with the cesium primary beam currently being tested.
INTRODUCTION
Research on the occurrence of potentially toxic trace metals in coal is fundamental to predicting the potential for distribution of these metals to the environment through coal combustion, mining, and leaching from storage piles. Microbeam insmments with good spatial resolution and element sensitivities are needed to make direct, in-situ trace-element determinations that are specific to individual coal components. The Sensitive High-Resolution Ion Microprobe with Reversed Geometry (SHRIMP-RG) at Stanford University offers these characteristics. The reversed geometry, in which the electrostatic sector is downstream of the magnetic sector of the mass spectrometer, gives the SHRIMP-RG superior mass-resolution compared to its forward geometry (FG) SHRIMP predecessor and smaller ion probes.
Our initial use of the SHRIMP-RG for coal samples focussed on the distribution of Cr and other transition metals in illitdsmectite, a common inorganic clay mineral constituent of coal and other sediments. Previous work, including studies by selective leaching, electron microprobe, and XAFS spectroscopy (Huggins et al.. 2000) and chemical analysis of mineral separates (Palmer and Lyons, 1996). indicates a significant residence for Cr in clay minerals in coal. This study was undertaken to confirm and quantify these results, and to demonstrate the utility of the SHRIMP-RG for studies in environmental geochemistry. Understanding the mode of occurrence of Cr in coal is especially important because the hexavalent form of the element is a known carcinogen.
SAMPLE CHARACTERIZATION AND ANALYSIS METHODS
Samples studied include three coals currently being investigated by the USGS in Phase II of a larger DOE-funded study of toxic substances from coal combustion. The three Phase Il coals are a bituminous Ohio 5/6/7 blend, a sub-bituminous Wyodak sample, and a North Dakota lignite. Three additional samples were investigated, a bituminous Illinois #6 sample from Phase I of the combustion study, a Northern Appalachian (Pittsburgh) bituminous sample and a second Illinois #6 sample studied by the USGS as part of another recent contract. Each of these samples has been very well characterized by conventional coal-testing methods, bulk geochemistry, mineralogy, and element modes of occurrence, including selective leaching, electron microprobe, and for all but the Pittsburgh and second Illinois #6 samples, bulk XAFS analysis.
Preliminary work involved characterization of illitelsmectites using a JEOL 8900R electron minoprobe for quantitative analysis and wavelength-dispersive elemental mapping. SHRIMP- RG data were obtained in August, 1999 and February, 2000, using an 02’ duoplasmatron source. Analysis points were initially subjected to a 1-3 minute bum-in to stabilize the response. The bum-in was followed by a “short” analysis consisting of 4, 7, or 8 elements, to confirm the identity of the grains selected and minimize the contribution of overlapping grains. In the August. 1999 runs, the short analyses were followed directly by ‘‘long’’ analyses in which the
542

initial 7 elements (Mg, AI, Ca, Si, "Cr, K, and Fe) were re-determined and combined with analyses of Sc, Ti, V, 'kr , Mn, Co. Ni. Cu, Zn, Rb, and Sr. The same procedure was used to measure these elements in reference standards. A similar procedure was followed in Febxuary, 2000. except that all the short runs were conducted successively, followed by a series of long runs for only the most promising grains. This modification minimized magnet instability caused by changes to its within-run scan range. Quantifying the concentration of Cr was the highest priority of the study, and therefore, Cr was determined twice, as "Cr and as "Cr. Using this approach, the natural ratio of S3Cr/sZCr (0.1134) was typically reproduced to three decimal places. Concentrations obtained using the two chromium isotopes were generally within 1% (absolute), for calibrations obtained using the same standard (Table 1).
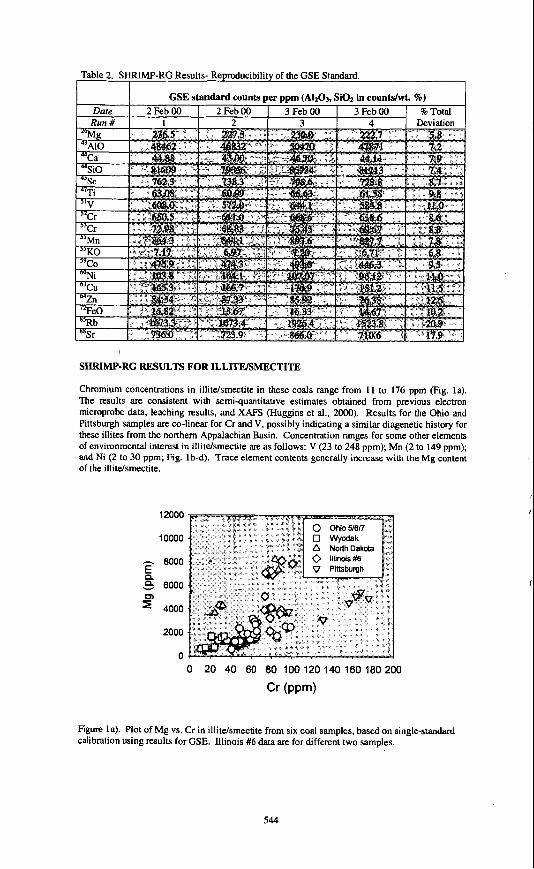
A variety of aluminosilicate standard glasses were investigated, including National Institute of Standards and Technology (NIST) SRM glasses 610 and 612, glass synthetic standards GSE and GSD, prepared for the USGS by Coming Glass Works, Inc., and glass prepared from powdered USGS rock standard BHVO-1. Concentrations were obtained by determining the countdppm for standards and calculating the concentrations of unknowns by comparing their raw counts to the Standard data. Calibration results obtained using three different standards, SRM 610, GSE, and BHVO-1, for the same Ohio 5/6/7 illitdsmectite, are given in Table 1. From electron microprobe analysis, the Si02 and A1203 contents of illitdsmectite are known to be about 50 and 30 weight percent, respectively. SHRIMP-RG results for these elements are given in weight percent to facilitate comparison to the microprobe data (Table 1). For most elements, the GSE standard gives the lowest concentrations, and these can be considered minima (Table 1). GSE is the only standard determined in every SHRIMP-RG run, providing a uniform basis for comparing data from each of the runs and for all of the samples. Table 2 shows the reproducibility of countdconcentration for the GSE standard in 4 runs over a 2-day period in February, 2000. Total deviation ranges from 5.8 to 12.5%. except for Rb (20.9%) and Sr (17.9%).
August 1999 Ohio 5l6t7
Countdppm Concentration (ppm) (A1203, Si02 in wt. %) Raw (AI2O3, Si02 in wt. %)
counts SRM GSE BHVO Conc. Conc. Conc. 61 0 61 0 GSE BHVO
543
SHRIMP-RG RESULTS FOR ILLITElSMECTITE
Chromium concentrations in illitdsmectite in these coals range from 11 to 176 ppm (Fig. la). The results are consistent with semi-quantitative estimates obtained from previous electron microprobe data, leaching results, and XAFS (Huggins et al., 2000). Results for the Ohio and Pittsburgh samples are co-linear for Cr and V, possibly indicating a similar diagenetic history for these illites from the northern Appalachian Basin. Concentration ranges for some other elements of environmental interest in illitdsmectite are as follows: V (23 to 248 ppm); Mn (2 to 149 ppm); and Ni (2 to 30 ppm; Fig. lb-d). Trace element contents generally increase with the Mg content of the illitdsmectite.
12000
10000
- 8000 2 9 6000 ' 4000
2000
0 0 20 4 0 60 80 100120140160180200
Cr (PPm)
I
Figure la). Plot of Mg vs. Cr in illitdsmectite from six coal samples, based on single-standard calibration using results for GSE. Illinois #6 data are for different two samples.
544

12000
10000
8000
e 6000 r” 4000
2000
0
E,
0
h
E, 0. Y
r”
\
14000
12000
10000
8000
6000
4000
2000
0
Figure lb-d). Plots of V, Mn, and Ni vs. Mg in illitefsmectite from six coal samples, based on calibration using GSE standard. Illinois #6 data are for two different samples.
545
PLANNED INVESTIGATIONS
The results reported here were determined using the SHRIMP-RG in its current configuration, in which oxygen (02') ions form the primary beam. Work is now being planned to take advantage of a high-energy Cs* ion source that is expected to be available for use in the summer of 2ooO. In the first planned study, the distribution of arsenic in fly ash particles will be investigated with the SHRIMP-RG. This study is prompted by evidence that moderately to slightly volatile elements such as Se and As, condense on the surface of fly ash particles as they cool, contributing to the health risk from inhaled particles and the leachability of toxic elements into the environment (EPRI, 1998). Using the oxygen source, we conducted a number of preliminary tests on fly ash from a Kentucky power plant, and on the aluminosilicate glass standards. These tests showed that the "As peak could be resolved from potential interferences in the GSE standard, whereas a mass scan on fly-ash in which 75As was present also showed a larger and broader unknown peak that is not completely resolvable from the analytical peak using oxygen ions. Count rates for arsenic are expected to be an order of magnitude higher with the cesium source.
SUMMARY
This paper reports our initial use of the SHRIMP-RG ion microprobe for determining trace metal contents in illitdsmectite, a common mineral constituent of coal and sediments. Results confirm and quantify the concentration of Cr in illihdsmectite inferred from previous indirect or semi- quantitative studies. This knowledge is important in developing quantitative models for the behavior of Cr during coal processing and combustion. Planned SHRIMP-RG investigations will use a Cs* ion beam to more effectively ionize metals such as As and Hg, thereby improving their detection and analysis.
ACKNOWLEDGEMENT
Acquisition of SHRIMP-RG data in this study was supported by U.S. Department of Energy Interagency Agreement DE-AI22-95PC95145 with the U.S. Geological Survey.
REFERENCES
EPRI (Electric Power Research Institute), 1998, Indentification of arsenic species in coal ash particles, EPRI, Palo Alto, CA, Technical Report TR-109002.
Huggins, F.E., Shah, N., Huffman, G.P., Kolker, Allan, Crowley, S.S., Palmer, C.A., and Finkelman, R. B., 2000, Mode of occurrence of chromium in four US. coals: Fuel Processing Technology, v. 63, p. 79-92.
Palmer, C.A., and Lyons, P.C., 1996, Selected elements in major minerals from bituminous coal as determined by INAA: Implications for removing environmentally sensitive elements from coal: International Journal of Coal Geology, v. 32, p. 151-166.
546
\
\
I
DIRECT COMPARISON OF XAFS SPECTROSCOPY AND SEQUENTIAL EXTRACTION FOR ARSENIC SPECIATION IN COAL
Frank E. Huggins”, Gerald P. Huffman’, Allan Kolke?, Stanley Mroczkowski’, Curtis A. Palme?, and Robea B. Finkelman’
‘Chemical and Materials Engineering/CFFIS, University of Kentucky, 533 South Limestone Street, Suite 11 1, Lexington, KY 40506-0043, *[email protected]
’Eastern Energy Resources Team, 956 National Center, U.S. Geological Survey, Reston, VA 20192
KEYWORDS: Arsenic, coal, sequential extraction, modes of occurrence, XAFS spectroscopy
ABSTRACT
The speciation of arsenic in an Ohio bituminous coal and a North Dakota lignite has been examined by the complementary methods of arsenic XAFS spectroscopy and sequential extraction by aqueous solutions of ammonium acetate, HCI, HF, and HNO3. In order to facilitate a more direct comparison of the two methods, the arsenic XAFS spectra were obtained from diquats of the coal prepared after each stage of the leaching procedure. For the aliquots, approximately linear correlations (rZ > 0.98 for the Ohio coal, > 0.90 for the ND lignite) were observed between the height of the edge-step in the XAFS analysis and the concentration of arsenic measured by instrumental neutron activation analysis. Results from the leaching sequence indicate that there are two major arsenic forms present in both coals; one is removed by
. leaching with HCI and the other by HN03. Whereas the XAFS spectral signatures of the arsenic leached by HC1 are compatible with arsenate for both coals, the arsenic leached by HNo3 is identified’as arsenic associated with pyrite for the Ohio coal and as an As” species for the North Dakota lignite. Minor arsenate forms persist in both coals after the final leaching with nitric acid. The arsenate forms extracted in HCI are believed to be oxidation products derived from the other major arsenic forms upon exposure of the pulverized coals to air.
INTRODUCTION
The techniques of sequential leaching and XAFS spectroscopy have both been used to determine modes of occurrence of elements in coal. Both methods have their advantages and disadvantages. XAFS spectroscopy is a direct probe of the occurrence of elements and is capable of providing information on how specific elements exist in coal at concentrations as least as low as 2 ppm. The major disadvantage of the technique is that only a single spectrum is obtained which is the weighted sum of all the occurrences of the element in the coal. This problem can be largely avoided by examination of different fractions of the coal separated by various physical methods, such as floavsink in heavy liquids or froth flotation [1,2]. In addition, a database of possible occurrences of the element in coal must also be established for comparative purposes [2,3]. Finally, the method is limited to a single element at a time. Sequential leaching is an indirect method and is based upon the anticipated behavior of certain mineral types in a suite of progressively stronger acidic reagents. It has the advantage that it is a multi-element technique, although depending on the analysis methods used to determine the concentrations of the elements in the residues and solutions, the analysis time can be lengthy. As with any indirect method, sequential leaching is only as good as the assumptions on which it is based and the technique may be completely misleading if the assumptions are incorrect.
In this study, we present the first direct comparison of X A F S and sequential leaching methods for determination of elemental modes of occurrence in coal. Data from both methods are presented for the speciation of arsenic in two different coals: a bituminous coal from Ohio and a lignite from North Dakota.
EXPERIMENTAL
(i) Coals Investigated
Three coals were initially considered for this study: a bituminous coal from Ohio, which is a blend of coal mined from the Ohio No. 5 , 6 and 7 seams, a subbituminous coal from the Wyodak seam in Wyoming, and a lignite mined from the Hagel seam in North Dakota. All three coals are used for electrical power generation at full-scale utility operations and the samplings are representative of the coal, in both composition and particle-size (-70% -200 mesh), fed to the burners at the power plants.
541
The trace-element contents of the two coals were determined by a combination of instrumental neutron activation analysis (JNAA), inductively-coupled plasma mass spectrometry (ICP-MS), and ICP atomic emission spectroscopy (ICP-AES). Arsenic contents determined for the Ohio bituminous coal, the North Dakota lignite and the Wyodak subbituminous coal are 18, 10, and 1.7 ppm (dry basis), respectively. Owing to its very low arsenic content, the Wyodak coal was not investigated in the detail afforded to the other two coals. I
(ii) Sequential Leaching Procedure
Preparation of the coal samples and the sequential extraction analysis were performed at the U S . Geological Survey at Reston. The procedure is described in detail elsewhere [4,5]. It consists of the following sequence of extractions: (1) I N ammonium acetate, (2) 3N HCI, (3) 48% HF, and (4) 2N FINO3. Each extraction is performed in 50 ml centrifuge tubes on a wrist-shaker, except for the extraction in HN03, which is performed in 125 ml Erlenmeyer flasks [5]. These extractions are designed respectively to solubilize (1) exchangeable cations and some readily soluble carbonate species, (2) more resistant carbonates and simple sulfides (ZnS, PbS, CuFeS2), (3) clays and other silicates, and (4) iron disulfides (pyrite and marcasite, FeS2). After each stage, the concentrations of elements in the extract were analyzed using ICP-AES and ICP-MS and portions of the residue were saved for analysis using INAA and CVAA and also for XAFS spectroscopy.
(iii) Arsenic XAFS spectroscopy
Arsenic K-edge XAFS spectroscopy was canied out at beam-line X-18B at the National Synchrotron Light Source (NSLS), Brookhaven National Laboratory, NY, during a period when the synchrotron was operated in maximum flux mode at 2.8 GeV with currents up to 400 mA. Arsenic XAFS spectra were collected in fluorescent mode using a 12-element germanium m a y detector [6]. The coal residue samples were suspended in the monochromatic X-ray beam by means of ultra-thin polypropylene bags. In addition to multiple scanning, both Soller slits and a 6p Ge filter were employed to enhance the signalhoke ratio of the spectra as much as possible, XAFS spectra were typically collected at X-ray energies ranging from about 100 eV below to at least 500 eV above the arsenic K absorption edge using a rotating Si (220) double crystal monochromator to select the energy. A thin smear of As203 on scotch tape was used as the primary calibration standard; this sample was run in an absorption experiment after the fluorescence experiment so that it provided a simultaneous calibration. The major peak in the absorption spectrum of As203 was used to define the zero-point of energy for the arsenic XAFS spectra. It is assumed to occur at 11,867 eV.
The X A F S data collected at the synchrotron were returned to the University of Kentucky for analysis. The data were analyzed in the usual fashion [7,81: after calibration of the energy scale, the spectra were split into separate X-ray absorption near-edge structure (XANES) and extended X-ray absorption fine structure (EXAFS) regions and each region was analyzed independently. The XANES region was used not only as a fingerprint for identification of the forms of occurrence of arsenic in the fly-ash samples, but also as the basis for extracting percentages of the different arsenic forms present in the coal sample. This was achieved by means of a calibrated least-squares analysis routine developed for analysis of arsenic XANES spectra [9], an example of which is shown in Figure 1. Owing to the low arsenic contents of the coal samples, neither the EXAFS region nor the radial structure function (RSF), which is derived from the EXAFS spectrum by mathematical manipulation [7,8], was useful for this study.
RESULTS AND DISCUSSION
(i) Sequential Leaching
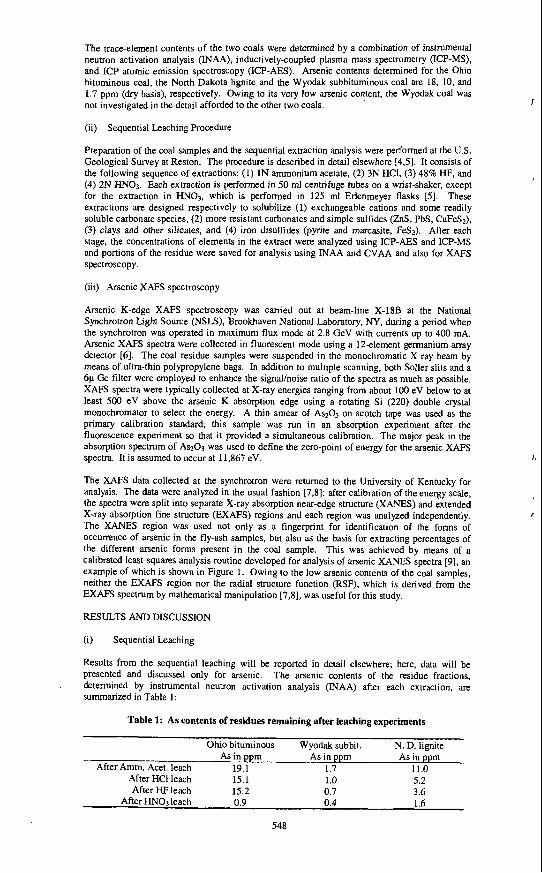
Results from the sequential leaching will be reported in detail elsewhere; here, data will be presented and discussed only for arsenic. The, arsenic contents of the residue fractions, determined by instrumental neutron activation analysis (INAA) after each extraction, are summarized in Table 1:
I ,
I
Table 1: As contents of residues remaining after leaching experiments
N. D. lignite Ohio bituminous Wyodak subbit. As in ppm As in ppm As in ppm
After Amm. Acet. leach 19.1 1.7 11.0 After HCI leach 15.1 1 .o 5.2 After HF leach 15.2 0.7 3.6
After HNO, leach 0.9 0.4 1.6
548

1 6 .
1 4 .
1 2 -
= 1 .
0 8 .
08.
0 4 .
0 2 .
0.
c
g
z
I
~. -20 -10 0 10
Energy, eV
Data -Fit -EdQe -As/Pyr -ArSmate -"
Figure 1: Least-squares fitted As XANES spectrum of Ohio bituminous coal after the ammonium acetate leach.
As In ppm
Ohio m N.D&&
-Unear(Ohio)
-Linear (N. Dakota)
Figure 2: Correlation between the XAFS step-height and the concentration of arsenic in the leached residues.
The analytical data in Table 1 can be correlated with the step-height determined from X A F S spectra, which is also an approximate measure of the arsenic concentration. This correlation is shown in Figure 2. The correlations between the analytical data and the XAFS edge-step heights for the two coals show a reasonable approximation to a linear relationship. For the Ohio bituminous coal, the correlation coefficient (2) exceeds 98%. whereas it is about 90% for the North Dakota lignite. This result indicates that both analyses are consistent with each other.
-40 0 40 120
Energy, eV
6 8
5 8
4 8 $
; 3 8
Q 2 8
e
B 4
1 8
08
-0 2 -40 0 40 80 120
Energy, eV
Figures 3 and 4: Unnormalized (left, Figure 3 ) and normalized (right, Figure 4 ) arsenic XANES spectra for the Ohio coal residues after different stages of the USGS leaching protocol.
(ii) XAFS S ~ ~ C ~ ~ O S C O P Y
Arsenic XAFS spectra were collected from the various fractions using as many as 10 scans for each sample. The spectra are shown in Figures 3 and 4 for the Ohio bituminous coal and in Figures 5 and 6 for the North Dakota lignite. Figures 3 and 5 show the unnormalized spectra, whereas Figures 4 and 6 show the same spectra normalized to the edge step and hence, these latter groupings of spectra have the effect of concentration removed from them. The data clearly show, by the reduction in intensity of the major peak at about 4.0 eV, that the HCI treatment removes principally, if not exclusively, arsenate from both the Ohio and North Dakota coals. This observation confirms more definitively the similar conclusion made in Phase I of this study
549

[4,10] based on a less direct comparison of leaching data and arsenic XAFS data for various coals. The data show also that the HF treatment has little effect, except for removing some very minor amounts of arsenate remaining after the HC1 treatment. For the Ohio coal, as indicated by the reduction in intensity of the peak at about -2 eV, the HNO3 treatment removes all of the pyritic arsenic. However, no such phase is present in the North Dakota lignite. Rather for this coal, the HN03 treatment appears to be removing an As3+ phase, as the peak that is removed is close to 0 eV. For both coals, there is a small residue of arsenic that remains after all the leachings. It is not arsenical pyrite or As3+, but rather more like an arsenate phase.
7
6
5
( 4
I
IS I p 3
2
1
0 -40 , 0 40 Bo 120 -40 0 40 Bo 120
Energy, eV Energy, eV
Figures 5 and 6: Unnormalized (left, Figure 5) and normalized (right, Figure 6) arsenic W E S spectra for North Dakota Lignite residues after different stages of the USGS leaching protocol.
A calibrated least-squares fitting model, developed earlier for quantifying arsenic species in bituminous coals [9], was used to quantify the arsenic speciation in the Ohio bituminous coal samples. For this coal, it was decided to fit only the two major arsenic forms present: arsenical pyrite and arsenate. Using this procedure [9], the arsenic speciation results obtained for the Ohio bituminous coal are summarized in Table 2. The least-squares fitting model has not yet been modified for application to the low-rank coals and their different arsenic species.
Table 2: Estimates of arsenic forms remaining after each leaching step in the Ohio coal
Leachant %As as %As as ppm As as ppm As as -. - _ Adpyrite Arsenate Adpyrite Arsenate
75 25 14.3 4.8 Amm. Acetate 19.1 pum As remains ..
93 HCI 15.1 ppm As remains I 14.0 1.1
_.
>95 <5 >14.4 <O. 8 HF 15.2 ppm As remains
<IO >90 4 . 1 S . 8 HN03- 0.9 ppm As remains
Based on this analysis, the concentration of arsenic as Adpyrite after the first three leaching steps is approximately the same, 14 f 1 ppm. This indicates that none of the three reagents, ammonium acetate, HCl, or HF removes significant arsenic as Adpyrite. As has been postulated previously [9], the presence of arsenic in pyrite appears to make pyrite more reactive to oxidation. However, for this particular coal, it does not appear that any arsenic associated with pyrite is leached prior to the HNO3 treatment. The HF leach appears to remove only the minor arsenate remaining after the HCl leach. The H N 0 3 leach removes all of the arsenic as arsenical pyrite and appears to leave a small residue of arsenate on the carbonaceous materials. It should be noted that the arsenate in the H N 0 3 residue is higher than that remaining after the HF leach, suggesting that it has been formed during the niMc acid leach.
XAFS examination of different aliquots of the two coals about a year apart shows a significant enhancement of arsenate in both coals during this time period. The arsenate species is clearly an oxidation product of other arsenic forms in the coals. Furthermore, even though the coals are not
550

deliberately Oxidized, such oxidation is an on-going process once the coal is crushed and exposed to air. Hence, the leaching results are likely to be found to change systematically with time, reflecting this time-dependent change in arsenic speciation.
CONCLUSIONS
The use of arsenic XAFS spectroscopy to examine arsenic in leached residues of coals from a sequential leaching protocol for elemental speciation in coals has provided unparalleled insight into the leaching characteristics of arsenic from coal and enables a rather complete assessment of the assumptions behind using sequential leaching for arsenic speciation to be made. XAFS spectroscopy shows clearly that the major fraction of arsenic leached from both coals by HCI is arsenate and that HNOs removes much of the remaining arsenic in both coals. Leaching with HF has little effect on the arsenic content of both coals examined and appears restricted to removing any arsenate species that remains after the HCI leach. The arsenic associated with pyrite in the bituminous coal is removed effectively by nitric acid, but a quite different form is removed from the lignite by nitric acid. The XAFS data suggest that this arsenic phase may be an AssC species, but it remains yet to be positively identified. Finally, a small fraction of the arsenic (5-15%) remains in the coal after the nitric acid leach. We suspect that this is an organoarsenate formed by a side reaction between the arsenic leached from the coal and new oxygen functionality on the coal introduced by reaction of the coal macerals with nitric acid.
ACKNOWLEDGEMENTS
This work IS supported by the U.S. Department of Energy through DOE Contract No. DE-AC22- 95PC95101 to Physical Sciences, Inc. The U.S. Department of Energy is acknowledged for its support of the synchrotron facilities at Brookhaven National Laboratory, NY.
REFEREYCES
F. E. Huggins, S. Srikantapura, B. K. Parekh, L. Blanchard, and J. D. Robertson, Energy & Fuels, ll. 691-701, (1997).
F. E. Huggins, and G. P. Huffman, Int. J. Coal Geol., 2,31-53 , (1996).
F. E. Huggins, and G. P. Huffman, In: Mineral Spectroscopy: A Tribute to Roger G. Bums, (eds. M. D. Dyar, C. A. McCammon, and M. W. Schaefer), The Geochemical Society, Houston, TX, Special Publication No. 5.133-151, (1996).
A. Kolker, S. Crowley, C. A. Palmer, R. B. Finkelman, F. E. Huggins, N. Shah, and G. P. Huffman, Fuel Proc. Technol. (Air Toxics special issue), 63, 167-178, (2000).
S. J. Mroczkowski, in C. L. Senior, T. Panagiotou, F. Huggins, G. P. Huffman, N. Yap, J. 0. L. Wendt, W. Seames, M. R. Ames, A. F. Sarofim, J. S. Lighty, A. Kolker, R. Finkelman, C. A. Palmer, S. J. Mroczkowski, J. J. Helble, and R. Mamani-Paco, Toxic Substances from Coal Combustion - A Comprehensive Assessment. Appendix E. Quarterly Report No. 11, DOE Contract No. DE-AC2295PC95101, U.S. Department of Energy, January 1999.
S. P. Cramer, 0. Tench, N. Yocum and G. N. George, Nucl. Ins t rum Meth. m, 586- 591, (1988).
P. A. Lee, P. H. Citrin, P. Eisenberger, B. M. Kincaid, Rev. Mod. Phys , 53, 769-808, (1981).
D. C. Koningsberger, R. F’rins, X-ray Absorption. J. Wiley & Sons, New York, (1988).
F. E. Huggins, J. Zhao, N. Shah, F. Lu, G. P. Huffman, L. E. Bool, m, and C. L. Senior, Proceedings, ICCS ’97, 9th International Conference on Coal Science, @sen, Germany), (eds. A. Ziegler, K. H. van Heek, J. Klein, and W. Wanzl), 1, 381-384, P & W l h c k und Verlag GMBH, &sen (1997).
L. E. Bool, III, C. L. Senior, F. Huggins, G. P. Huffman, N. Shah, J. 0. L. Wendt, F. Shadman, T. Peterson, W. Seames, A. F. Sarofim, I. Olmez, T. Zeng, S. Crowley, R. Finkelman, J. J. Helble, and M. J. Womat, Toxic Substancesfrom Coal Combustion - A Comprehensive Assessment. Final Report, DOE Contract No. DEAC2295PC95101, U.S. Department of Energy, July 1997.
55 1

ROUND ROBIN ON BIOMASS FUELS
Thore von Puttkamer, Sven Unterberger, Klaus R.G. Hein Institute for Process Engineering and Power Plant Technology (IVD)
Pfaffenwaldring 23 70550 Stuttgart, Germany
Phone:i49-7 1 U6853565, Fax:+49-7 1116853491 ,e-mail:[email protected]
Keywords: Biomass analysis, digestion, analysis methods
INTRODUCTION In order to optimise the use of biomass as a fuel it is essential to have reliable information about its chemical composition. Therefore, it is of great significance to have useful methods for detect- ing the complete composition of the fuel. By means of Round Robins the commonly used meth- ods can be evaluated and rated.
OBJECTIVES The data gained from the Round Robin shall provide a representative overview of the common methods for biomass characterisation used in the laboratories. It will give detailed information about all analysing steps (sample preparation, digestion methods, and analysis ). The evaluation will cover in first place the interlaboratory scattering of results. Laboratories using similar meth- ods of analysis will be gathered and evaluated separately. Due to the fact that no reference sam- ples for biomass are available it will not be possible to assess the accuracy of the analytical data.
IMPLEMENTATION Two fuel samples of wood and straw were investigated in the Round Robin. The fuels were milled and homogenised by an independent laboratory and then checked for homogeneity by analysing for some major elements (C,N,S,K,Fe). In the Round Robin the probes were analysed for 35 parameters by 39 German and European laboratories. All participating laboratories were free to choose the analytical methods they are used to, only recommendations concerning avail- able experience and possible problems that might occur were supplied. Moreover, the laborato- ries were free to use several different methods in parallel to compare the obtained results. In or- der to be able to compare the different methods, the laboratories should fill in a detailed ques- tionnaire to clearly describe each step of preparation, digestion, and analysis itself. Based on this information a comparison of the influence of each single analysis step was possible.
EVALUATION The classical evaluation of a Round Robin is based on IS0 5725. The assumption for using this standard is the Gaussion distribution of the data. A normal distribution is based on random mis- takes scattering around the accurate value. In a Round Robin where each laboratory was recom- mended to use its own well proven analytical methods the interlaboratory mistakes will be sys- tematic [l]. In this Round Robin the gained data is very inhomogeneous and therefore, a few data may have a big influence on the location parameters. Consequently, a distribution free, robust method based on Hampel was used for statistical evaluation. This method does without elimination of so called outliers, which are weighted in- stead making the results less sensitive to extreme single values [2]. In order to illustrate the statistical calculations the results are shown in evaluation diagrams. Some of the terms mentioned can be defined as follows: “ W i ~ ~ o l s t a n d w e i c h u n g ” ,V,, corresponds to the mean value of all intralaboratory stan- dard deviation ,S,, divided by the “robust” mean value. “Vergleichstandweichung” ,VR, corresponds to the mean value of the interlaboratory stan- dard deviation .SR, divided by the “robust” mean value. The values measured by the laboratories are represented in the diagrams by bars. The centreline of each bar shows the robust mean value, the standard deviation Corresponds to the distance be- tween the centreline and the outside bounds of the bar.
RESULTS As an example for using biomass as a fuel the analysis results for chlorine and ash content that w important for the combustion and slagging/fouling behaviour in furnaces are presented.. KCI in the fuel could be released as KCI or converted into HCI, Potassium silicate and KzSO4. At combustion temperature KCI is released into the gas phase and condenses at the heat surfaces at lower temperatures. Condensed KCI on tube surfaces could form low melting eutectics, leading to an increased corrosion rate [4]. The ash content affects the ashing device and the ash disposal as well as the concept and the cleaning of the heat exchanger.
552
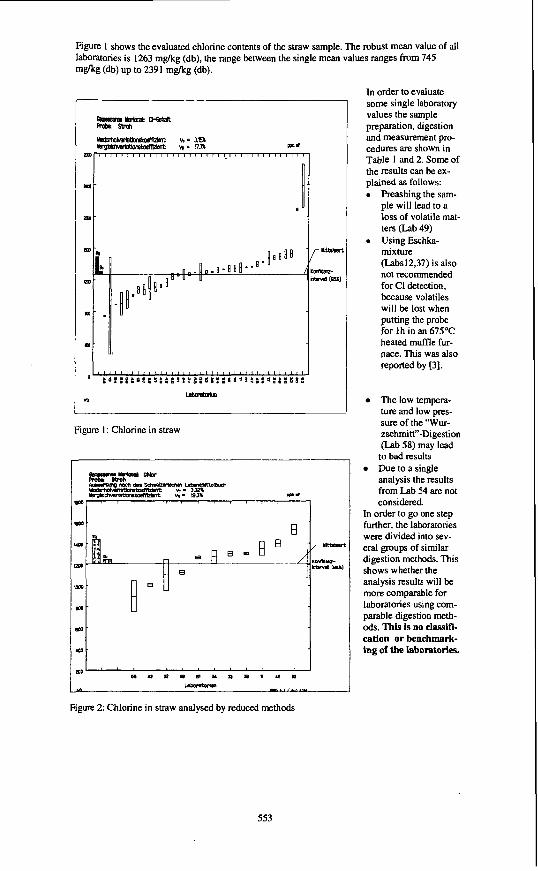
Figure 1 shows the evaluated chlorine contents of the straw sample. The robust mean value of all laboratories is 1263 m a g (db), the range between the single mean values ranges from 745 m a g (db) up to 2391 mgkg (db).
Figure 1: Chlorine in straw
In order to evaluate some single laboratory values the sample preparation, digestion and measurement pro- cedures are shown in Table 1 and 2. Some of the results can be ex- plained as follows: 0 hashing the sam-
ple will lead to a loss of volatile mat- ters (Lab 49)
mixture (Labs12,37) is also not recommended for C1 detection, because volatiles will be lost when putting the probe for lh in an 675OC heated muffle fur- nace. This was also reported by [3].
0 Using Eschka-
The low tempera- ture and low pres- sure of the "Wur- zschmitt"-Digestion (Lab 58) may lead
to bad results
analysis the results from Lab S4 axe not considered.
Due to a single
In order to go one step further, the laboratories were divided into sev- eral groups of similar digestion methods. This shows whether the analysis results will be more comparable for laboratories using com- parable digestion meth- ods. This is no classifi- cation or benchmark- ing of the laboratories.
Figure 2: Chlorine in straw analysed by reduced methods
553

Figure 2 shows labora- tories using a combus- tion method collecting the combustion prod- ucts in an alkali solu- tion. This makes it clear that reducing the analysis methods for chlorine detection does not lead to more comparable results.
Due to the free choice of analytical methods 1
the ash content was determined in a tem- perature range of 550°C up
to 900°C. Figure 3 and 4 show the measured results. The high standard de- viation of Laboratory 14 in figure 3 can not be explained. The re- sults from other labs scatter in a range o f f 7% around the robust median value of 6.5% (dh). The methods used are all based on the principle of ashing the probes till constant weight. They only dif- fer in sample prepara- tion ( milled, unmilled,
fied). The ash content determined at 8 15°C shown in Figure 4 has a mean value of 6.18% (db), which is signifi- cantly lower than the 550T values.
preashed, Or humidi-
Figure 4: Ashcontent of straw at 815°C
DISCUSSION AND CONCLUSIONS One of the major problems when analysing biomass is the non-homogeneity of the fuel and therefore, the collection of a representative probe. The reason for "outliers" is often the small sample-mass taken for the digestion. Comparing the results from different laboratories using suitable methods for analysing chlorine in the fuel it can be seen that the values scatter in a range of k25% around the robust mean value although they were using very different methods. Even digesting the sample by eluting it with water shows very good results. This confirms the assumption that chlorine in Biomass is mostly inorganically bound, whereas the'organically bound part is very small. The elution method facili- tates to use larger sample quantities for the digestion, with which a better homogeneity can be reached. Reducing the possible digestion methods does not lead to a better comparability of the results. This underlines the previously mentioned problem of the non-homogeneity of the fuel. The ash content of the fuel is strongly connected to the ashing temperature since at higher tem- prahlres more volatile matters are released. The amount of volatiles in biomass (>75%) is very high compared to coal (= 35%). It is recommended that ash content should be determined at 550°C. because the volatile elements in a combustion plant condense in the fly ash and therefore must be considered in the ash balance.
554

ACKNOWLEDGEMENTS The presented work has been financially supported by the German Federal Ministry for A&cul- ture and Forest. m97NRO55, “Standardisierung biogener Festbrennstoffe”.
Table 1: Analysis Methods
Table 2 Method-Code
(Digestion 1 Analysis 1
Sample Preparation 1 IAsrecieved [O 120” 10 lAir 10 INoextramilling 2 ldried 13 llOS0 11 IN2 Il-5]Extramilling
REFERENCES [I] M-r, Manfred (1996): Auswertung von Ringversuchen n i t Hilfe Robuster Statistik,
[2] Schweizer Handbuch fllr Lebensmittelchemie, 1989 [3] Obemberger, I. et al(1996): Round Robin on biomass fuel and ash analysis, Joule Ill,
[4] IVD, et al(l999) ,,Operational Problems, Trace Emissions and By-F’roduct Management for
Ph.D, University of WUnburg
JOR3-CI95-0001, European Commission
Industrial Biomass Co-Combustion . . . . I ‘ , JOR3-CT95-0057
\
555
USE OF CHEMICAL FRACTIONATION
TO PREDICT BIOMASS FUEL ASH BEHAVIOUR
Rob Korbee
ECN-Biomass Netherlands Energy Research Foundation
P.O. Box 1, 17755 ZG Petten, The Netherlands
KEYWORDS: biomass, ash deposition, selective extraction
ABSTRACT Chemical Fractionation (CF) has been proposed by several researchers as a tool to assist in the advance prediction of biomass fuel ash behaviour. In this work, the relation between CF classes and alleged behaviour during pf combustion is studied experimentally. Samples of well-analysed fuel batches - wood, straw and chicken manure - have been subjected to a scheme of selective extractions. After each extraction, a subsample of the partly extracted material was used as a fuel in a lab-scale combustion and ash deposition test. Comparison of the ash deposits obtained with original and selectively extracted fuels yielded valuable information on the practical use of selective extraction for the prediction of biomass fuel ash behaviour. Suggestions for improvement of the extraction scheme are also given.
INTRODUCTION Chemical Fractionation (CF) is a method to discriminate inorganic classes in biomass fuels according to their solubility in a sequence of increasingly aggressive solvents [Baxter, 19961. The parts of the fuel found as either water soluble, ion exchangeable, hydrochloric acid soluble or residual (non-soluble) are subsequently related to their alleged behaviour in a process like e.g. pulverised fuel combustion. Generally, the water soluble and ion exchangeable classes include various salts of potassium and sodium which are considered to be easily vaporised in a high temperature process. Carbonates and sulphates are expected in the hydrochloric acid soluble class [Baxter, 19961, while the oxides, silicates and sulphides are not extracted and classified as residual. Both the hydrochloric acid soluble and residual matter are considered to be much less reactive in a thermal process.
The proportion of the elements of interest found in the fwst two classes is mostly interpreted as a measure for the release of reactive inorganic species to the gas phase. Their availability is subsequently related to enhanced deposition of ash on boiler and heat exchanging surfaces. So far, ash deposition has been studied using fuels as a whole. In the current study, selective extraction has been applied to produce fuels lacking specific inorganic species. These fuels have been used in lab-scale deposition tests to verify the alleged relations with the currently used CF classes.
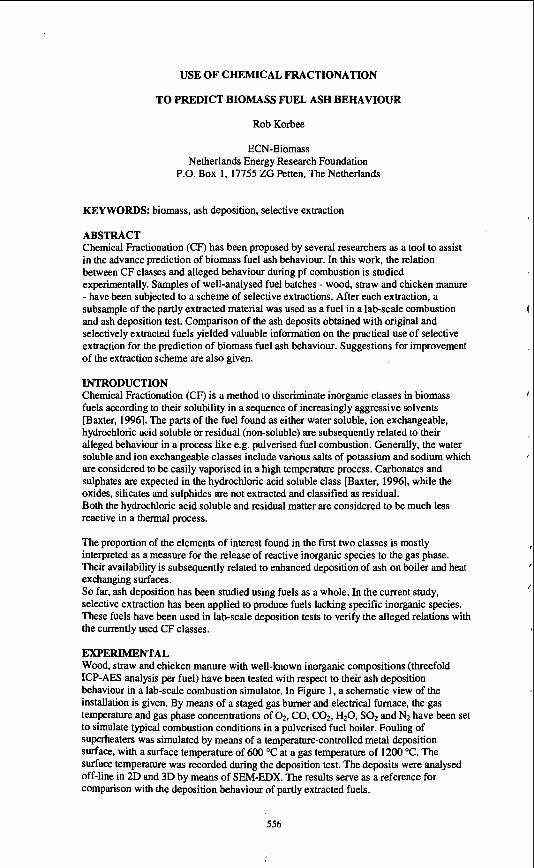
EXPERIMENTAL Wood, straw and chicken manure with well-known inorganic compositions (threefold ICP-AES analysis per fuel) have been tested with respect to their ash deposition behaviour in a lab-scale combustion simulator. In Figure 1, a schematic view of the installation is given. By means of a staged gas burner and electrical furnace, the gas temperature and gas phase concentrations of 02. CO, COz, HzO, SO2 and N2 have been set to simulate typical combustion conditions in a pulverised fuel boiler. Fouling of superheaters was simulated by means of a temperature-controlled metal deposition surface, with a surface temperature of 600 "C at a gas temperature of 1200 "C. The surface temperature was recorded during the deposition test. The deposits were analysed off-line in 2D and 3D by means of SEM-EDX. The results serve as a reference for comparison with the deposition behaviour of partly extracted fuels.
556
The same fuels were subjected to a sequence of three selective extractions using water, a 1 M W A C solution and a 1M HCl solution. The procedure suggested by Baxter [19961, S e e Figure 2, was evaluated by a) comparing the composition of the extracted material with the extract concentrations, b) comparing parallel to sequential extraction, c) examining the effect of pH-control during the extraction and d) evaluating multiple extractions at a low US ratio versus a single extraction at a proportionally higher US ratio. From these tests, suggestions for improvement of the procedure are given. Extracted material has been taken from each extraction step to be used as a fuel in a deposition test in the facility described above. Again, SEM-EDX was used to examine the deposits and to compare the Occurrence of specific species in these deposits with those obtained from burning the original fuels.
RESULTS Extraction at a US ratio of 3 is not feasible for biomass such as wood or straw due to a very high water uptake. An US ratio of 10 or more should be used in stead.
The determination of extracted elements is much easier and cheaper by analysing the extract than by handling and opening up and analysing the extracted solid residue.
The pH-value after equilibration of the solvent with the solid phase is influenced by and depends bn the biomass used. Control of the pH-value at a pre-set constant value may be considered but care must be taken not to replace a pH-influence on the extraction process by an influence of increased ion concentrations in the solvent.
Partly extracted fuels have been used in lab-scale ash deposition tests under simulated pf f ~ n g conditions. The deposits are compared to those obtained from the original fuels by means of 2D and 3D SEM-EDX analysis, identifying the presence and role of relevant species in the deposit. Heat fluxes through the growing deposit layers have been determined as a function of time as a more quantitative measure of deposit development. Definite results will be presented by the time of the symposium.
DISCUSSION AND CONCLUSIONS . Selective extraction schemes which are currently used for predicting fuel ash behaviour have been designed - in the past - for the evaluation of leaching characteristics of soils. For a Chemical Fractionation analysis of biomassfuel inorganic matter, an adapted design should be aimed at the selective extraction of elements of interest applying specific pH-values and/or solvent ion concentrations. It may be necessary to control these conditions to eliminate effects of the fuel (biomass) matrix during the extraction. More work is needed to establish specific conditions for extracting key elements or species with a known behaviour in thermal processes. Up till now, only a gross difference between water soluble I ion exchangeable, strong acid soluble and non soluble inorganic species can be made using three selective extractions. A definite relation between extraction results and fuel ash behaviour can be obtained using fuels which have been partly extracted under well-controlled conditiohs in subsequent combustion tests aimed at ash deposition evaluation. From this, extraction schemes can be set up for the determination of specific, predefined inorganic species.
REFERENCES L.L. Baxter, Chemical Fractionation Procedure, in: “Alkali Deposits Found in Biomass Power Plants, a Preliminary Investigation of Their Extent and Nature”, Summary Report for National Renewable Energy Laboratory, by T.R. Miles, P.E., T.R. Miles jr., L.L. Baxter, R.W. Bryers, B.M. Jenkins and L.L. men, Golden, CO, USA (1996).
557
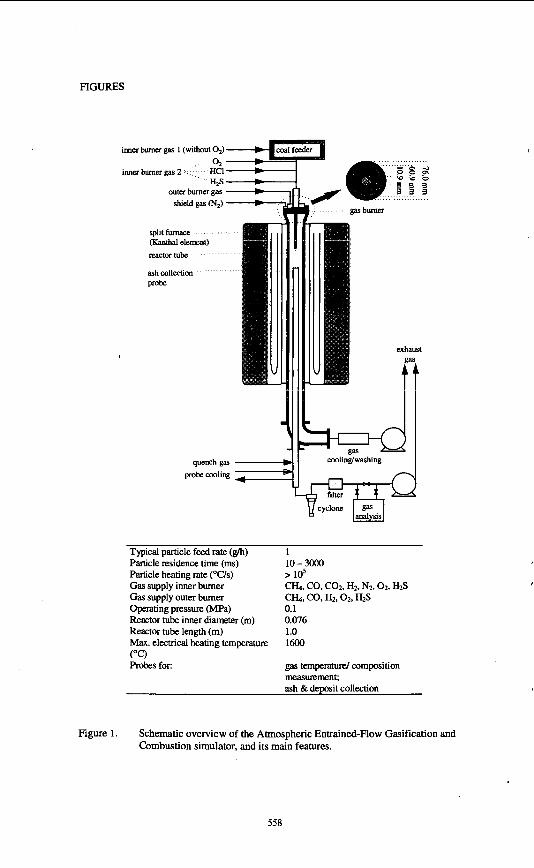
FIGURES
inner burner pas 1 (without 0,) 0 2
- w
inner burner gas 2 HCI - H2S __C.
outer burner gas - shield gas (NJ __t_
split furnace (Kanthal element) reactor Nbe
ash CollesOon probe
quench gas - probecooling - -
exhaust
di coolin&ashing
filter
Typical particle feed rate (g/h) 1 Particle residence time (ms) Particle heating rate ("Us) Gas supply inner burner Gas supply outer burner operating pressure (MPa) Reactor tube inner diameter (m) Reactor tube length (m) Max. electrical heating temperature ("C) Probes for:
10 - 3000 > Id CH4, CO, COz, Hzr Nz. 0 2 , HzS CH4, CO, H 2 . 0 ~ . HzS 0.1 0.076 1.0 1600
gas tempemhd composition measurement; ash & deposit collection
Figure 1. Schematic overview of the Atmospheric Entrained-Flow Gasification and Combustion simulator. and its main features.
558

('74 #I 01 < 200 rnerh)
-1 J 7
NH,Ae Ieaeh. 10 hr (slirred, rwm lamp.)
,. .... . . _. . . . . . . . _- optional ~
,. 4 ICP-AES ~
c.., . -.i
I I
nci iimhing I O hr / (stirred. 70 'C) / /-/- rinsing (dlaliiied)
Figure 2. '
Extraction scheme used for Chemical Fractionation analysis of inorganic matter in biomass fuels (Baxter, 1996).
559