innovative data collection strategies in qualitative research
TRANSCRIPT
The Qualitative Report The Qualitative Report
Volume 15 Number 3 Article 12
5-1-2010
Innovative Data Collection Strategies in Qualitative Research Innovative Data Collection Strategies in Qualitative Research
Anthony J. Onwuegbuzie Sam Houston State University, [email protected]
Nancy L. Leech University of Colorado,, [email protected]
Kathleen M.T. Collins University of Arkansas at Fayetteville, [email protected]
Follow this and additional works at: https://nsuworks.nova.edu/tqr
Part of the Quantitative, Qualitative, Comparative, and Historical Methodologies Commons, and the
Social Statistics Commons
Recommended APA Citation Recommended APA Citation Onwuegbuzie, A. J., Leech, N. L., & Collins, K. M. (2010). Innovative Data Collection Strategies in Qualitative Research. The Qualitative Report, 15(3), 696-726. https://doi.org/10.46743/2160-3715/2010.1171
This Article is brought to you for free and open access by the The Qualitative Report at NSUWorks. It has been accepted for inclusion in The Qualitative Report by an authorized administrator of NSUWorks. For more information, please contact [email protected].

Innovative Data Collection Strategies in Qualitative Research Innovative Data Collection Strategies in Qualitative Research
Abstract Abstract This article provides an innovative meta-framework comprising strategies designed to guide qualitative data collection in the 21st century. We present a meta-framework comprising strategies for collecting data from interviews, focus groups, observations, and documents/material culture. We present a template for collecting nonverbal data during interviews and discuss the concept of debriefing the interviewer. We identify types of data that can be collected in focus groups in addition to the actual statements made by the participants and provide templates for categorizing these data. Also, we outline the role that social networking websites can play in focus group interviews. Further, we provide models for observations that include photographs and videos. Finally, we outline ways of accessing and collating documents/material culture that can be used for document analyses.
Keywords Keywords Qualitative Research, Qualitative Data Collection, Debriefing, Interviews, Focus Groups, Observations, Nonverbal Data, Documents, Material Culture, and Computer-Mediated Communication
Creative Commons License Creative Commons License
This work is licensed under a Creative Commons Attribution-Noncommercial-Share Alike 4.0 License.
This article is available in The Qualitative Report: https://nsuworks.nova.edu/tqr/vol15/iss3/12
The Qualitative Report Volume 15 Number 3 May 2010 696-726 http://www.nova.edu/ssss/QR/QR15-3/onwuegbuzie.pdf
Innovative Data Collection Strategies in Qualitative Research
Anthony J. Onwuegbuzie Sam Houston State University, Texas, USA
Nancy L. Leech
University of Colorado, Denver, USA
Kathleen M. T. Collins University of Arkansas at Fayetteville, Arkansas, USA
This article provides an innovative meta-framework comprising strategies designed to guide qualitative data collection in the 21st century. We present a meta-framework comprising strategies for collecting data from interviews, focus groups, observations, and documents/material culture. We present a template for collecting nonverbal data during interviews and discuss the concept of debriefing the interviewer. We identify types of data that can be collected in focus groups in addition to the actual statements made by the participants and provide templates for categorizing these data. Also, we outline the role that social networking websites can play in focus group interviews. Further, we provide models for observations that include photographs and videos. Finally, we outline ways of accessing and collating documents/material culture that can be used for document analyses. Key Words: Qualitative Research, Qualitative Data Collection, Debriefing, Interviews, Focus Groups, Observations, Nonverbal Data, Documents, Material Culture, and Computer-Mediated Communication
Introduction In many disciplines and fields representing the social and behavioral sciences, the quantitative research paradigm, which has its roots in (logical) positivism, marked the first methodological wave (circa the 19th century), inasmuch as it was characterized by a comprehensive and formal set of assumptions and principles surrounding epistemology (e.g., independence of knower and known, objectivism, real causes determining outcomes reliably and validly, time- and context-free generalizations), ontology (e.g., single reality), axiology (e.g., value-free), methodology (e.g., deductive logic, testing or confirming hypotheses/theory), and rhetoric (e.g., rhetorical neutrality, formal writing style, impersonal passive voice, technical terminology). The years 1900 to 1950 marked what could be termed as the second methodological wave, in which many researchers who rejected (logical) positivism embraced the qualitative research paradigm1. Denzin
1 The field of social and behavioral sciences also has undergone a third methodological movement, which, during the 1960s, saw an increase in the number of researchers combining quantitative and qualitative approaches in a planned and systematic manner This movement was led by classical pragmatists (e.g., Charles Sanders Pierce, John
Anthony Onwuegbuzie, Nancy L. Leech, and Kathleen M. T. Collins 697
and Lincoln (2005a) refer to this era as the first historical moment or The Traditional Period for qualitative research. Vidich and Lyman (2000) describe earlier forms of ethnography that took place prior to the 17th century. However, Denzin and Lincoln’s (2005a) The Traditional Period represents the first organized qualitative research movement. Although this moment was characterized by qualitative researchers attempting to write reliable, valid, and objective accounts of their field experiences (Denzin & Lincoln, 2005a), it paved the way for the eight subsequent qualitative moments (see Table 1) that have incorporated paradigms that are extremely far removed from positivism. For example, in stark contrast to positivism, constructivism has been characterized by a different set of epistemological (e.g., subjectivist, knower and known are inseparable), ontological (e.g., relativism), axiological (e.g., value-bound), methodological (e.g., dialectical, hermeneutical), and rhetorical (e.g., informal writing style using personal voice and limited definitions) assumptions.
From Table 1, it can be seen that Denzin and Lincoln (2005a) predict that in the seventh and eighth moments, “methodological contestation will continue within and among the many disciplinary communities of qualitative research—business, marketing, nursing, psychology, communications studies, cultural studies, education, sociology, anthropology, medical clinical practice and epidemiology, and others” (p. 1117). As noted on Table 1, Denzin and Lincoln (2005a) elaborate further upon the dichotomous nature of research by predicting that in the ninth moment, methodologists form two opposing camps (i.e., “gold standard” of scientific research vs. socially, culturally, ethnically, and racially responsive, communitarian, justice-oriented research). However, in this article, we discuss the various ways that qualitative researchers might transcend this methodological contestation and methodological divide by taking advantage of the innovative approaches to reflexivity (i.e., “the process of critical self-reflection on one’s biases, theoretical predispositions, preferences, and so forth” [Schwandt, 2007, p. 260]; ”inspection of potential sources of bias and their control [and] critically inspecting the entire research process” [Schwandt, p. 260]); and the latest technology and computer-mediated communication. As such, we call for a 10th moment, which we label as the period of Methodological Innovation, in which qualitative researchers go beyond the traditional ways of collecting primary and reflexive data.
Dewey, and William James) and later by neopragmatists (e.g., Donald Davidson, Nicholas Rescher, Richard Rorty, Hilary Putnam). This third methodological movement has been given many names; however, mixed methods research is the most popular term used to describe this wave. As noted by Johnson and Onwuegbuzie (2004), mixed methods research involves collecting, analyzing, and interpreting quantitative and qualitative data in a single study or in a series of studies that investigate the same underlying phenomenon. According to Denscombe (2008), “Championed by writers such as John Creswell, Abbas Tashakkori, Burke Johnson, Anthony Onwuegbuzie, Jennifer Greene, Charles Teddlie, and David Morgan, the mixed methods approach has emerged in the last decade as a research movement with a recognized name and distinct identity” (p. 270).

698 The Qualitative Report May 2010
Table 1: Moments in the History of Qualitative Researcha
Moment
Time Period
Description
1. Traditional 2. Modernist or golden age 3. Blurred genres 4. Crisis of representation 5. Post-modern period of experimental
ethnographic writing 6. Post-experimental inquiry 7. Methodologically contested present 8. Un-named 9. Fractured future 10. Methodological innovationb
1900-1950 1950-1970 1970-1986 1986-1990 1990-1995 1995-2000 2000-2004 2005- 2005- 2008-?
Many researchers who rejected (logical) positivism embraced the qualitative research paradigm Attempt to make qualitative research as rigorous as quantitative research; causal narratives were central; many texts attempted to formalize qualitative research; new interpretive theories emerged (e.g., ethnomethodology, critical theory, feminism, phenomenology) Qualitative researchers had full arsenal of paradigms, methods, and strategies; computers came to the fore to aid qualitative analyses; new approaches surfaced (e.g., poststructuralism, neopositivism); several qualitative journals emerged; naturalistic, postpositivist, and constructionist paradigms gained power Research and writing became more reflexive and led to questions about issues of gender, race, and class; new models of truth, representation, and method were sought; issues such as validity, reliability, and objectivity re-emerged as being problematic; triple crises of representation (i.e., qualitative researchers can no longer directly capture lived experience), legitimation (i.e., makes problematic the traditional criteria for evaluating and interpreting qualitative research), and praxis (i.e., involves asking whether it is possible to effect change in the world if society is only and always a text) Struggle to make sense of triple crises; new ways of composing ethnography emerged (e.g., auto-ethnography); concept of passive observer discarded; more action, participatory, and activist-oriented research emerged Writings connected to the needs of a free democratic society; experimental forms of qualitative writing published that blurred the boundaries between social sciences and humanities Period of conflict, great tension, and retrenchment; growing body of literature on paradigms, approaches, and methods Period of confronting the methodological ramifications of the evidence-based social movement Methodologists form two opposing camps (i.e., “gold standard” of scientific research vs. socially, culturally, ethnically, and racially responsive, communitarian, justice-oriented research) Utilization of innovative approaches to reflexivity and latest technology and computer-mediated communication

Anthony Onwuegbuzie, Nancy L. Leech, and Kathleen M. T. Collins 699
a The first nine moments were conceptualized and outlined by Denzin and Lincoln (2005a). b The tenth moment is what we hope will emerge.
With this in mind, in this article, we provide an innovative meta-framework
comprising strategies designed to guide qualitative data collection in the 21st century. We call our framework a meta-framework because it incorporates several new and existing frameworks. We begin by presenting various frameworks for collecting data in qualitative research. Specifically, we present strategies for collecting data from interviews, focus groups, observations, and documents/material culture—which represent four major sources of data in qualitative research (cf. Leech & Onwuegbuzie, 2008). With respect to interviews, we present a template for collecting nonverbal data during interviews. Further, we discuss the concept of debriefing the interviewer (Onwuegbuzie, Leech, & Collins, 2008). Specifically, we outline how the interviewer could be interviewed, present possible questions that the debriefer might ask the interviewer, and illustrate how graphical displays can be used to collect and record debriefing data and leave an audit trail. We call for postmodern interviews and focus groups to be extended by utilizing the most ground-breaking media, including social networking tools (e.g., Facebook, MySpace.com, iTunes, iMovie, Youtube, Bebo, Friendster, Orkut, Flickr, and Panoramio). With regard to focus groups, we identify types of data that can be collected in addition to the actual statements made by the participants. We provide templates for collecting information about which participant responds to each question, the order that each participant responds, the characteristics of the response, the nonverbal communication used, the interaction patterns (e.g., argumentative interactions), the degree of consensus and dissent, and the characteristics of dissenters. We show how these data collection tools increase the rigor of focus group research. Also, we outline the role that social networking websites can play in focus group interviews. With regard to observations, we provide models for participants collecting their own data, including participants drawing/painting and taking photographs and videos of their own choice. Finally, we outline ways of accessing and collating documents/material culture (e.g., citation management software programs such as Refworks) that can be used for document analyses. We believe that the innovative strategies that we outline should help researchers make informed choices for collecting data in qualitative research. Interviews Strategies for collecting nonverbal communication Although the voice of the interviewee is central in all interviews, nonverbal communication also can be important for attaining a deeper shared meaning, in which both the interviewer and interviewee increase their awareness of the contextual nature of the voice. Indeed, nonverbal communication and speech combined often interact in a way that increases Verstehen, with nonverbal communication (e.g., facial expression, hand gesture) clarifying the meaning of words spoken, and words clarifying the meaning of nonverbal communication (Kelly, Barr, Church, & Lynch, 1999). Thus, nonverbal

700 The Qualitative Report May 2010
communication can be viewed as an additional method for obtaining information, helping to increase communication (Bull, 2001).
As noted by Gorden (1980), there are four basic modes of nonverbal communication: (a) proxemic (i.e., use of interpersonal space to communicate attitudes); (b) chronemic (i.e., use of pacing of speech and length of silence in conversation); (c) kinesic (i.e., body movements or postures); and (d) paralinguistic (i.e., all variations in volume, pitch, and quality of voice). Because communication includes more than the spoken words, when participants utilize these modes, they should be recorded by the researcher (Fontana & Frey, 2005). Yet, few qualitative researchers appear to incorporate substantive information about proxemic, kinesic, chronemic, and/or paralinguistic nonverbal communication into their qualitative reports (Onwuegbuzie, Collins, & Leech, 2008a). Perhaps, this common omission might stem from the fact that discussion of nonverbal communication occupies a very minimal role in standard qualitative research text books. For example, in the seminal latest edition of the Handbook of Qualitative Research (Denzin & Lincoln, 2005b), one of the leading textbooks used in qualitative research courses in the United States, of the 44 chapters contained that span 1,126 pages, only two short paragraphs of one page (i.e., p. 713) of one chapter (i.e., Chapter 27) deal explicitly with nonverbal communication. As another example, in Creswell’s (2007) 393-page qualitative text book—another popular book—no explicit information is provided about non-verbal information. Moreover, even among textbooks that provide discussion on nonverbal communication, no explicit guidance is provided as to how to collect these data. Although the study of nonverbal communication has been taking place for several decades in fields such as linguistics and communication research, clearly there is a large void in qualitative research representing fields such as education. As such, in the following section, we provide a framework for collecting nonverbal communication data2. Framework for Collecting Nonverbal Communication Data Nonverbal communication can be conceptualized as lying on a continuum of lexicalization, with the opposite ends of the continuum being represented by adapters and symbolic gestures, respectively (cf. Krauss, Chen, & Chawla, 1996). Adapters, which are situated at the low end of the lexicalization continuum, represent nonverbal communication that tends not to be considered as being indicative of meaningful gestures (Ekman & Friersen, 1969). They involve manipulations either of the person or of some object (e.g., clothing, spectacles, pen). At the high lexicalization end of the continuum are symbolic gestures (e.g., hand configurations, facial expressions; cf. Ricci Bitti & Poggi, 1991) that represent specific, conventional, and popularized meanings that are recognized by a cultural group (e.g., thumbs up). Just as cultural groups have their unique folk terms, so too do they have special symbolic gestures that often are used in lieu of speech, although they can also accompany speech either by emphasizing a spoken word or phrase 2 Space prevents us from providing a more lengthy discussion of collecting nonverbal communication data. However, for a more extensive treatise, we refer the readers to Onwuegbuzie, Collins, and Leech (2008b).

Anthony Onwuegbuzie, Nancy L. Leech, and Kathleen M. T. Collins 701
or serving as a substitute for a word or phrase that was omitted (Krauss et al.). Falling between these two extremes of the lexicalization continuum are conversational gestures. As noted by Krauss et al., conversational gestures are nonverbal behaviors that accompany speech, and that appear to be related to the speech that they accompany (Krauss et al.), manifesting themselves in the following three ways: (a) unlike symbolic gestures, they do not occur in the absence of speech; (b) they are temporally coordinated with speech; and (c) unlike adapters, they are related, at least in part, to the semantic content of the speech they accompany. Lexical movements represent a major type of conversational gesture, consisting of nonverbal behaviors that vary considerably in length, are complex, nonrepetitive, malleable, and appear to be related to some degree to the associated semantic content of the speech. A useful model for assessing nonverbal communication is the neurocultural model of facial expression (Ekman, 1972). According to this model, there are at least six fundamental emotions that are associated with innate facial expressions, and which can be adapted via learning that are called display rules—representing norms guiding how emotion is expressed in various social contexts and which vary within and among cultures (Bull, 2001). These six emotions are happiness, sadness, anger, fear, disgust, and surprise. Mapping these six emotions onto the lexicalization continuum yields the matrix in Table 2. Such a table could be used not only to document the type of verbal-based emotion exhibited by the interviewee in responding to each interview question but also whether the nonverbal communication observed, if any, represented an adapter, symbolic gesture, or lexical movement. The exact (if the researcher adopts a more post-positivist stance in attempting to identify accurately the facial musculature underlying the primary emotions) or perceived (if the researcher adopts a more constructivist-poststructuralist-critical stance of the existence of equally valid accounts of the same phenomenon representing multiple realities) nature of the nonverbal communication also could recorded in the cells either in real-time or when analyzing a video-recording of the interview, if available. Regardless of the stance of the focus group researcher (e.g., post-positivist, constructivist), he/she could benefit from training in how to recognize and interpret facial expressions. In particular, the qualitative researcher could learn the facial action coding system (FACS; Hager, Ekman, & Friesen, 2002) via a manual or an intensive workshop (see, for e.g., Rosenberg, 2009), and could even receive FACS certification. Regardless of the qualitative researcher’s level of expertise in identifying and interpreting facial expressions, we recommend that, where possible, the qualitative researcher subjects the matrix to member checking to increase what Maxwell (1992) referred to as descriptive validity (i.e., factual accuracy of the emotional expression as documented by the researcher), interpretive validity (i.e., the extent to which an interpretation of the emotional expression represents an understanding of the perspective of the person and the meanings attached to the person’s words and actions), and theoretical validity (i.e., the extent to which a theoretical explanation developed from the emotional expression in part or as a whole is consistent with the data). When using such a matrix to record nonverbal communication while the actual interview is taking place (i.e., real time documentation), the researcher should use shorthand codes/symbols to minimize the time spent writing, and thus minimize any distraction that documentation

702 The Qualitative Report May 2010
might cause on both the interviewee and interviewer. The completed matrix then could be analyzed simultaneously with the verbal data to enhance meaning.
Table 2 Matrix for Assessing Nonverbal Communication Using Krauss et al.’s (1996) Typology of Nonverbal Behaviors and Ekman’s (1972) Neurocultural Modela
Emotion
Adapters
Lexical Movements
Symbolic Gestures
Happiness
Sadness
Anger
Fear
Disgust
Surprise
Otherb
a This matrix incorporates Krauss et al.’s (1996) typology of nonverbal behaviors and Ekman’s (1972) neurocultural model of facial expression. b Emotions placed in the “Other” category include ‘alarmed,’ ‘bored,’ ‘contempt,’ and ‘excited.’
McNeill’s (1992) classification scheme of gestures also can be used to help qualitative researchers collect nonverbal communication data. Specifically, as noted by McCafferty (1998), five of McNeill’s gesture types are particularly useful: iconics, metaphorics, beats, deictics, and emblems. Iconics represent concrete gestures that simulate movements or depict movement or objects, such as the simultaneous upper movement of the upper half of the body while stating that “the table jumped up in the air” when describing the observed effects of an earthquake. Also important is the orientation of the gesture to the word(s)/phrase. Thus, the interviewee could describe the effects of the earthquake in several ways depending on the meaning that the interviewee wants to portray; for example, the gesture could emphasize the speed of the movement of the table, the abruptness, the height, and so forth. Third, meaning can be communicated via gestures that indicate the storyteller’s point of view. Using the earthquake example, for instance, the interviewee could illustrate the movement of the table using an emic (i.e., insider’s) view (i.e., taking on the role of the table by using the whole body) or an etic (i.e., outsider’s) view (i.e., as an observer of the event by using only a part of the body such as the hands/arms). Thus, according to McNeill, iconic gestures are especially useful for extracting meaning inasmuch as they “cannot help but expose the relevant dimensions of the speaker’s thought….[and]…they are the closest look at the ideas of another person that we, the observers can get” (pp. 132-133).
Anthony Onwuegbuzie, Nancy L. Leech, and Kathleen M. T. Collins 703
Metaphoric gestures, like iconic gestures, are extremely visual in nature. However, in contrast to iconic gestures, they portray abstract thoughts or ideas. For example, the phrase (i.e., idiom), “take the bull by its horns,” could be depicted by the interviewee stretching out both hands and clenching both fists to indicate taking one horn with each hand, which, in turn, is used to indicate that the interviewee has started taking control of her life. As another example, when contrasting two competing ideas or stances, the interviewee might draw an imaginary line in the immediate space in front of her or him, indicating the left side as representing one idea and the right side representing the other idea. Unlike iconic gestures, metaphoric gestures typically do not involve use of the whole or large parts of the body. Beats, like metaphoric gestures, represents abstract ideas. They are used to set the word(s) or phrase apart from other words/phrases. As noted by McNeill (1992), a beat can function metapragmatically by characterizing the word(s)/phrase it accompanies as being significant not only with respect to its semantic content but also in terms of its discourse-pragmatic content. Examples of beats include repetitive up-and-down movements of a finger and/or hand, and/or the stamping of a foot. Deictics involves an abstract level of pointing—namely, a pointing to ideas that are represented in a metaphorical space. These gestures are used to help the interviewee keep track of statements made and stories told during the course of the interview. For instance, an interviewee might use gestures (e.g., facial expressions, rapid circling of a finger) to direct the discussion back to an earlier statement made or story told. Abstract pointing also might indicate that the interviewee has stepped out of her or his role as a story teller and into a more shared conversation between the interviewer and interviewee (McCafferty, 1998). Finally, emblems represent the traditional notion of gestures that have specific linguistic designation such as nodding the head up and down to indicate a response in the affirmative. As such, emblems are similar to Krauss et al.’s (1996) lexical movements. These five gestures can be used to form a matrix such as that in Table 3, in which Ekman’s (1972) six emotions are mapped onto McNeill’s (1992) five types of gestures. As with Table 2, such a table could be used not only to document the type of verbal-based emotion exhibited by the interviewee in responding to each interview question but also whether the nonverbal communication observed, if any, represented an iconic, metaphoric, beat, deictic, or emblem. The exact or perceived nature of the nonverbal communication also could be recorded in the cells either in real-time or when analyzing a video-recording of the interview, if available. Shorthand symbols should be used to record the nonverbal behaviors. Again, we recommend that member checking be used to establish the trustworthiness of the classifications.
The typologies in Table 2 and Table 3 can be used in a transcription to combine each utterance made with its respective nonverbal expression type. Such a schema would help the researcher to contextualize the utterances to a greater extent. The matrices in Table 2 and Table 3 are just two of the numerous matrices that could be developed to collect nonverbal communication data. The data provided in both of these matrices, when combined with the utterances, lend themselves to some form of componential analysis—a “systematic search for attributes (components of meaning) associated with cultural symbols” (Spradley, 1979, p. 174). By using such tables, a componential analysis can be used to discover the differences among the subcomponents of domains, with the goal

704 The Qualitative Report May 2010
being to “map as accurately as possible the psychological reality of our informant’s cultural knowledge” (p. 176). In particular, these tables can help the qualitative researcher to create what Spradley refers to as (a) contrast sets (i.e., terms that are both alike and different that help the researcher determine how a given symbol [word, event, construct] is different from others in order to discover dimensions of meaning) and (b) dimensions of contrast, which are questions formulated by the researcher to help differentiate the contrast set and to elicit missing attributes and new dimensions of contrast, and which will inform the subsequent interview that is conducted to elicit needed data. When the interview is video-recorded, the qualitative researcher also might consider using available computer software such as THEME (cf. Magnusson, 1996), wherein a researcher can code selected behavioral categories from a digital video-recording directly onto a computer, which allows the researcher to discover, describe, and ultimately explain the structure of complex processes that develop in time such as intra- and inter-individual modes of nonverbal behavior. Table 3 Matrix for Assessing Nonverbal Communication Using McNeil’s (1992) Classification of Gesture and Ekman’s (1972) Neurocultural Modela
Emotion
Iconics
Metaphorics
Beats
Deictics
Emblemsb
Happiness
Sadness
Anger
Fear
Disgust
Surprise
Otherc
a This matrix incorporates McNeil’s (1992) classification of gesture and Ekman’s (1972) neurocultural model of facial expression. b Emblem gestures can be subdivided into elements such as Finger Pointing, Head Nod, Head Shake, Shoulder Shrug, and so forth. c Emotions placed in the “Other” category include ‘alarmed,’ ‘bored,’ ‘contempt,’ and ‘excited.’ Strategies for enhancing reflexivity
Instruments utilized in qualitative research are few: in fact, the researcher is most commonly considered the main instrument for data collection, analysis, and interpretation (Paisley & Reeves, 2001). Therefore, it is important to acknowledge that bias is a part of the research (Miles & Huberman, 1994). According to Miles and Huberman, there are

Anthony Onwuegbuzie, Nancy L. Leech, and Kathleen M. T. Collins 705
two types of researcher bias, (a) the effects of the researcher on the study participant(s)/ key informant(s) (i.e., termed Bias A); and (b) the effects of the study participant(s)/key informant(s) on the researcher (i.e., termed Bias B). Bias can play a part of the research process at any stage of the research study. Bias A tends to be introduced when the researcher poses a threat to the relationships of the participants, either socially or institutionally. Bias A can inhibit a participant and lead to participants viewing the researcher as a spy, voyeur, antagonist, or critic. Bias B occurs when the researcher goes native (Adler & Adler, 1987), which is defined as the researcher becoming a participant. Biases, especially Bias A and B, generally, are not examined or reflected upon by the researcher, and, thus, the role that these biases might play in the study is not addressed systemically. Subsequently, the study’s findings and the researcher’s interpretations might be compromised. Therefore, examining his or her biases and reflecting critically upon them in a systematic manner could facilitate the researcher’s efforts to self-analyze these biases and to address the crisis of legitimation, specifically, by keeping biases from affecting the results and the inferences drawn.
To facilitate this process, Onwuegbuzie et al. (2008) present the concept of debriefing the researcher. The process of debriefing entails the researcher being interviewed by a person who is not involved directly in the study; yet, this person is someone who understands the research topic that is the focus of the study or program of research. According to Onwuegbuzie et al. (2008), these interview data could assist the researcher in assessing his or her hunches or intuitive feelings that were formulated at the beginning of the study and adapted as the study progressed. Having the researcher present these hunches or intuitive feelings to the debriefing interviewer might elevate the researcher’s understanding of the research process that was implemented in a particular study or program of research and also serve as an audit trail. Debriefing the researcher
Onwuegbuzie et al. (2008) present the following guidelines for conducting the debriefing interview. First, it is important for the debriefer to (a) be knowledgeable (i.e., regarding interviewing, qualitative research, the specific research topic), (b) not be involved in the study, and (c) not hold a vested interest in the research study. Second, the interview should be in a private place where it can be recorded, either audio- or videotaped. Third, where possible, prior to the interview, the debriefer would read the data transcripts from the study and write potential questions to ask the interpretive researcher. Fourth, when formulating questions relevant to a particular study or context, the debriefer should use (a) open-ended questions, (b) questions that foster answers that include the researcher’s feelings, and (c) questions regarding the researcher’s thoughts, perceptions, and experiences. Conveniently, the debriefer could use some or all of the questions developed by Onwuegbuzie et al. (2008), which are discussed below. Use of these questions would bypass the third and fourth steps above. Research bias: Questions to use when debriefing the interviewer
Onwuegbuzie et al. (2008) also present interviewing questions that the debriefer could ask the researcher regarding bias. These questions are based on the following eight
706 The Qualitative Report May 2010
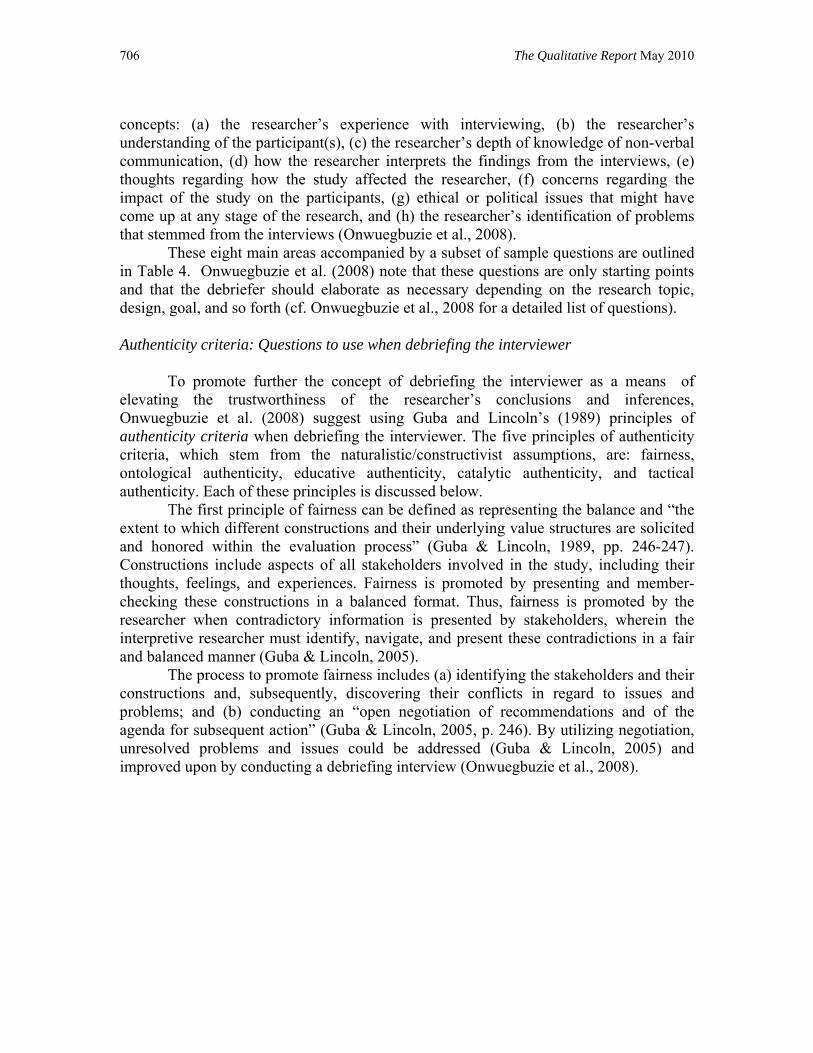
concepts: (a) the researcher’s experience with interviewing, (b) the researcher’s understanding of the participant(s), (c) the researcher’s depth of knowledge of non-verbal communication, (d) how the researcher interprets the findings from the interviews, (e) thoughts regarding how the study affected the researcher, (f) concerns regarding the impact of the study on the participants, (g) ethical or political issues that might have come up at any stage of the research, and (h) the researcher’s identification of problems that stemmed from the interviews (Onwuegbuzie et al., 2008).
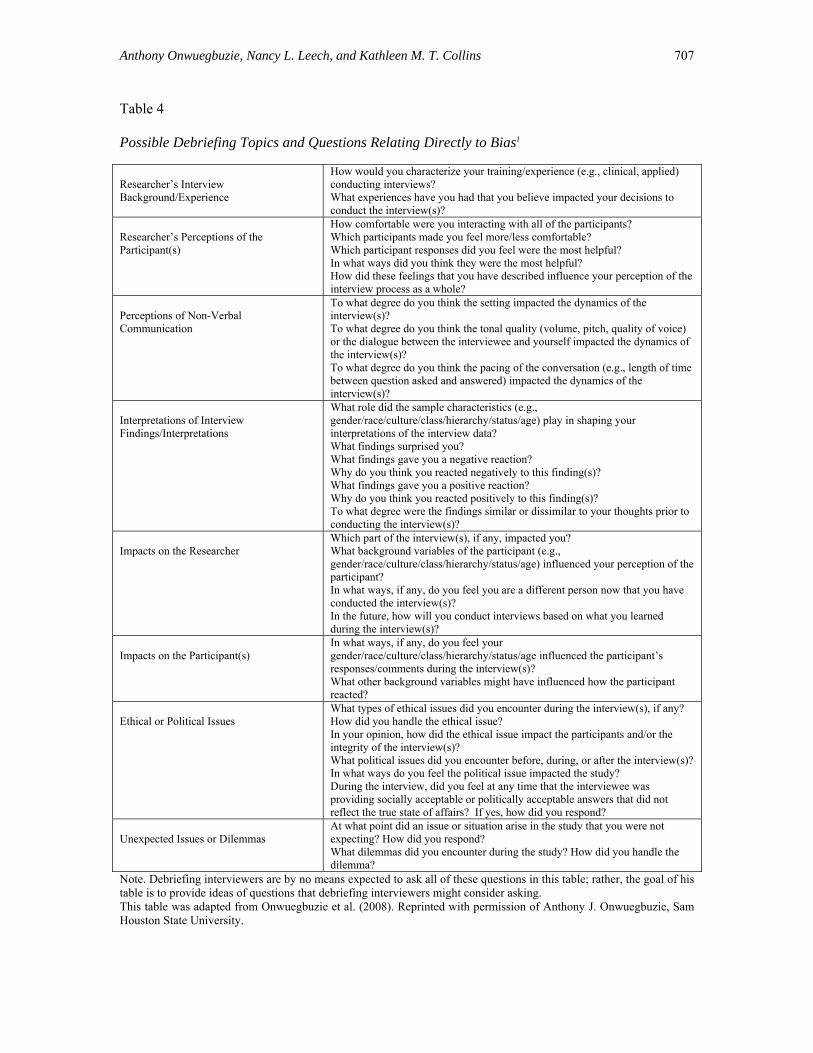
These eight main areas accompanied by a subset of sample questions are outlined in Table 4. Onwuegbuzie et al. (2008) note that these questions are only starting points and that the debriefer should elaborate as necessary depending on the research topic, design, goal, and so forth (cf. Onwuegbuzie et al., 2008 for a detailed list of questions). Authenticity criteria: Questions to use when debriefing the interviewer To promote further the concept of debriefing the interviewer as a means of elevating the trustworthiness of the researcher’s conclusions and inferences, Onwuegbuzie et al. (2008) suggest using Guba and Lincoln’s (1989) principles of authenticity criteria when debriefing the interviewer. The five principles of authenticity criteria, which stem from the naturalistic/constructivist assumptions, are: fairness, ontological authenticity, educative authenticity, catalytic authenticity, and tactical authenticity. Each of these principles is discussed below. The first principle of fairness can be defined as representing the balance and “the extent to which different constructions and their underlying value structures are solicited and honored within the evaluation process” (Guba & Lincoln, 1989, pp. 246-247). Constructions include aspects of all stakeholders involved in the study, including their thoughts, feelings, and experiences. Fairness is promoted by presenting and member-checking these constructions in a balanced format. Thus, fairness is promoted by the researcher when contradictory information is presented by stakeholders, wherein the interpretive researcher must identify, navigate, and present these contradictions in a fair and balanced manner (Guba & Lincoln, 2005).
The process to promote fairness includes (a) identifying the stakeholders and their constructions and, subsequently, discovering their conflicts in regard to issues and problems; and (b) conducting an “open negotiation of recommendations and of the agenda for subsequent action” (Guba & Lincoln, 2005, p. 246). By utilizing negotiation, unresolved problems and issues could be addressed (Guba & Lincoln, 2005) and improved upon by conducting a debriefing interview (Onwuegbuzie et al., 2008).
Anthony Onwuegbuzie, Nancy L. Leech, and Kathleen M. T. Collins 707
Table 4 Possible Debriefing Topics and Questions Relating Directly to Bias1
Researcher’s Interview Background/Experience
How would you characterize your training/experience (e.g., clinical, applied) conducting interviews? What experiences have you had that you believe impacted your decisions to conduct the interview(s)?
Researcher’s Perceptions of the Participant(s)
How comfortable were you interacting with all of the participants? Which participants made you feel more/less comfortable? Which participant responses did you feel were the most helpful? In what ways did you think they were the most helpful? How did these feelings that you have described influence your perception of the interview process as a whole?
Perceptions of Non-Verbal Communication
To what degree do you think the setting impacted the dynamics of the interview(s)? To what degree do you think the tonal quality (volume, pitch, quality of voice) or the dialogue between the interviewee and yourself impacted the dynamics of the interview(s)? To what degree do you think the pacing of the conversation (e.g., length of time between question asked and answered) impacted the dynamics of the interview(s)?
Interpretations of Interview Findings/Interpretations
What role did the sample characteristics (e.g., gender/race/culture/class/hierarchy/status/age) play in shaping your interpretations of the interview data? What findings surprised you? What findings gave you a negative reaction? Why do you think you reacted negatively to this finding(s)? What findings gave you a positive reaction? Why do you think you reacted positively to this finding(s)? To what degree were the findings similar or dissimilar to your thoughts prior to conducting the interview(s)?
Impacts on the Researcher
Which part of the interview(s), if any, impacted you? What background variables of the participant (e.g., gender/race/culture/class/hierarchy/status/age) influenced your perception of the participant? In what ways, if any, do you feel you are a different person now that you have conducted the interview(s)? In the future, how will you conduct interviews based on what you learned during the interview(s)?
Impacts on the Participant(s)
In what ways, if any, do you feel your gender/race/culture/class/hierarchy/status/age influenced the participant’s responses/comments during the interview(s)? What other background variables might have influenced how the participant reacted?
Ethical or Political Issues
What types of ethical issues did you encounter during the interview(s), if any? How did you handle the ethical issue? In your opinion, how did the ethical issue impact the participants and/or the integrity of the interview(s)? What political issues did you encounter before, during, or after the interview(s)? In what ways do you feel the political issue impacted the study? During the interview, did you feel at any time that the interviewee was providing socially acceptable or politically acceptable answers that did not reflect the true state of affairs? If yes, how did you respond?
Unexpected Issues or Dilemmas
At what point did an issue or situation arise in the study that you were not expecting? How did you respond? What dilemmas did you encounter during the study? How did you handle the dilemma?
Note. Debriefing interviewers are by no means expected to ask all of these questions in this table; rather, the goal of his table is to provide ideas of questions that debriefing interviewers might consider asking. This table was adapted from Onwuegbuzie et al. (2008). Reprinted with permission of Anthony J. Onwuegbuzie, Sam Houston State University.
708 The Qualitative Report May 2010
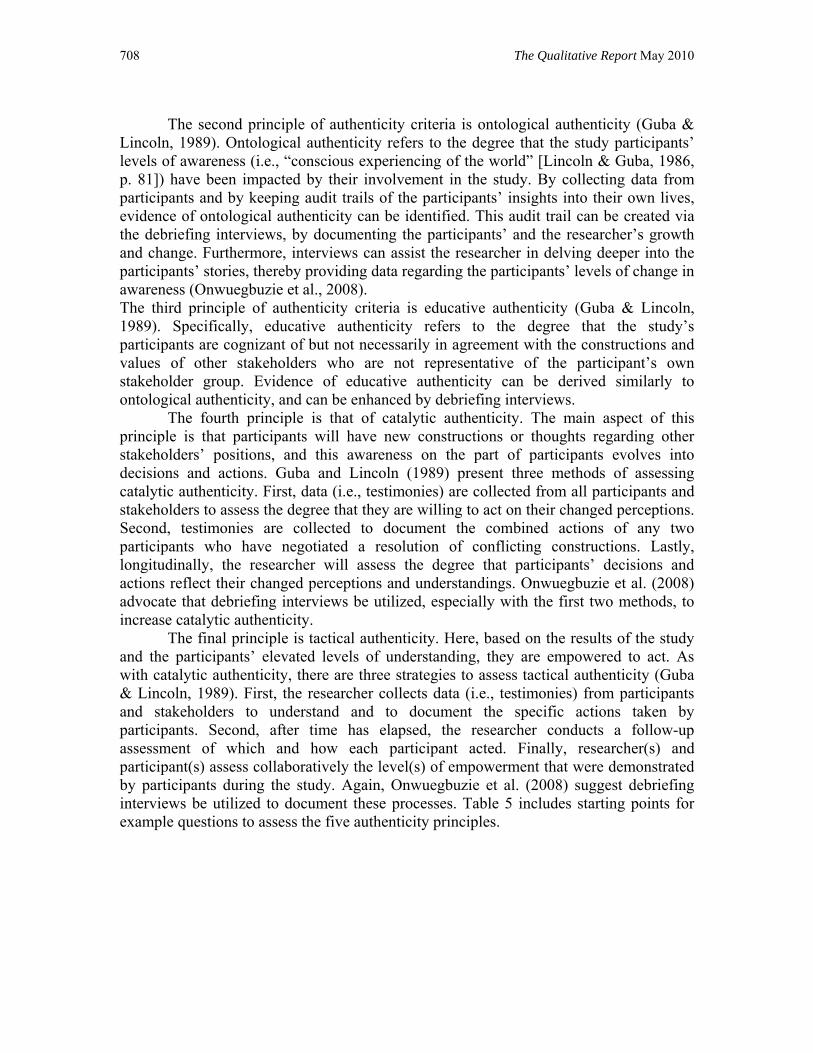
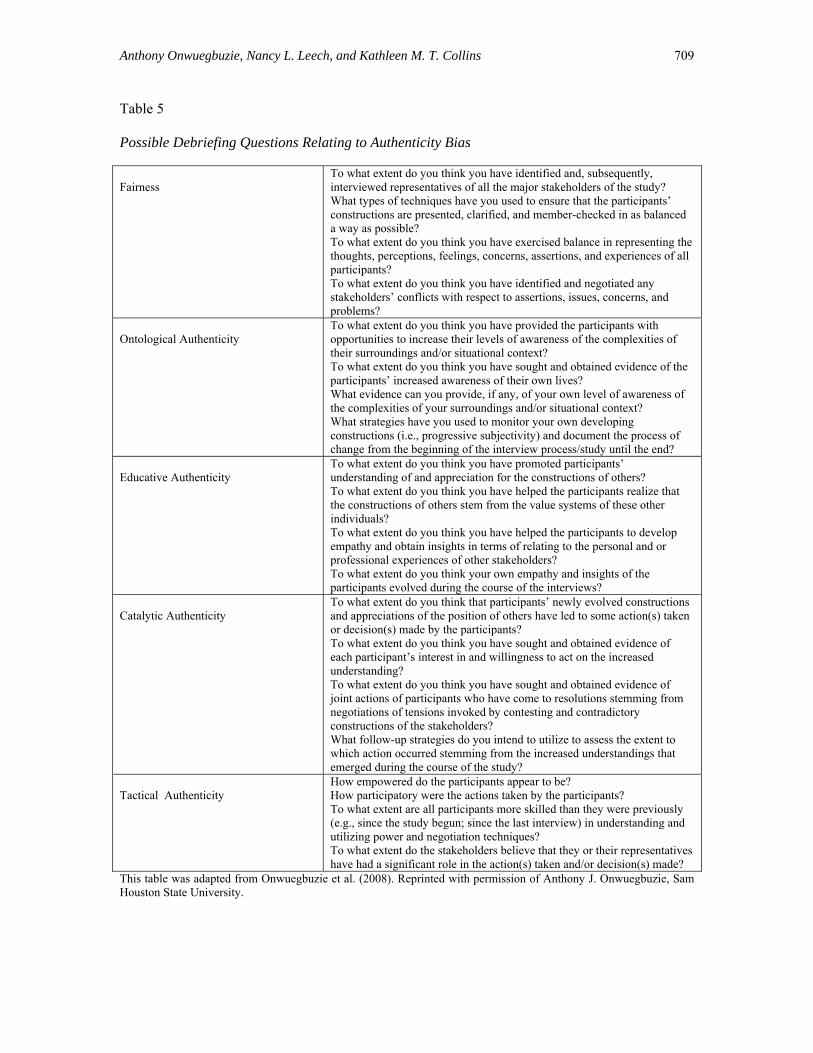
The second principle of authenticity criteria is ontological authenticity (Guba & Lincoln, 1989). Ontological authenticity refers to the degree that the study participants’ levels of awareness (i.e., “conscious experiencing of the world” [Lincoln & Guba, 1986, p. 81]) have been impacted by their involvement in the study. By collecting data from participants and by keeping audit trails of the participants’ insights into their own lives, evidence of ontological authenticity can be identified. This audit trail can be created via the debriefing interviews, by documenting the participants’ and the researcher’s growth and change. Furthermore, interviews can assist the researcher in delving deeper into the participants’ stories, thereby providing data regarding the participants’ levels of change in awareness (Onwuegbuzie et al., 2008). The third principle of authenticity criteria is educative authenticity (Guba & Lincoln, 1989). Specifically, educative authenticity refers to the degree that the study’s participants are cognizant of but not necessarily in agreement with the constructions and values of other stakeholders who are not representative of the participant’s own stakeholder group. Evidence of educative authenticity can be derived similarly to ontological authenticity, and can be enhanced by debriefing interviews. The fourth principle is that of catalytic authenticity. The main aspect of this principle is that participants will have new constructions or thoughts regarding other stakeholders’ positions, and this awareness on the part of participants evolves into decisions and actions. Guba and Lincoln (1989) present three methods of assessing catalytic authenticity. First, data (i.e., testimonies) are collected from all participants and stakeholders to assess the degree that they are willing to act on their changed perceptions. Second, testimonies are collected to document the combined actions of any two participants who have negotiated a resolution of conflicting constructions. Lastly, longitudinally, the researcher will assess the degree that participants’ decisions and actions reflect their changed perceptions and understandings. Onwuegbuzie et al. (2008) advocate that debriefing interviews be utilized, especially with the first two methods, to increase catalytic authenticity. The final principle is tactical authenticity. Here, based on the results of the study and the participants’ elevated levels of understanding, they are empowered to act. As with catalytic authenticity, there are three strategies to assess tactical authenticity (Guba & Lincoln, 1989). First, the researcher collects data (i.e., testimonies) from participants and stakeholders to understand and to document the specific actions taken by participants. Second, after time has elapsed, the researcher conducts a follow-up assessment of which and how each participant acted. Finally, researcher(s) and participant(s) assess collaboratively the level(s) of empowerment that were demonstrated by participants during the study. Again, Onwuegbuzie et al. (2008) suggest debriefing interviews be utilized to document these processes. Table 5 includes starting points for example questions to assess the five authenticity principles.
Anthony Onwuegbuzie, Nancy L. Leech, and Kathleen M. T. Collins 709
Table 5 Possible Debriefing Questions Relating to Authenticity Bias Fairness
To what extent do you think you have identified and, subsequently, interviewed representatives of all the major stakeholders of the study? What types of techniques have you used to ensure that the participants’ constructions are presented, clarified, and member-checked in as balanced a way as possible? To what extent do you think you have exercised balance in representing the thoughts, perceptions, feelings, concerns, assertions, and experiences of all participants? To what extent do you think you have identified and negotiated any stakeholders’ conflicts with respect to assertions, issues, concerns, and problems?
Ontological Authenticity
To what extent do you think you have provided the participants with opportunities to increase their levels of awareness of the complexities of their surroundings and/or situational context? To what extent do you think you have sought and obtained evidence of the participants’ increased awareness of their own lives? What evidence can you provide, if any, of your own level of awareness of the complexities of your surroundings and/or situational context? What strategies have you used to monitor your own developing constructions (i.e., progressive subjectivity) and document the process of change from the beginning of the interview process/study until the end?
Educative Authenticity
To what extent do you think you have promoted participants’ understanding of and appreciation for the constructions of others? To what extent do you think you have helped the participants realize that the constructions of others stem from the value systems of these other individuals? To what extent do you think you have helped the participants to develop empathy and obtain insights in terms of relating to the personal and or professional experiences of other stakeholders? To what extent do you think your own empathy and insights of the participants evolved during the course of the interviews?
Catalytic Authenticity
To what extent do you think that participants’ newly evolved constructions and appreciations of the position of others have led to some action(s) taken or decision(s) made by the participants? To what extent do you think you have sought and obtained evidence of each participant’s interest in and willingness to act on the increased understanding? To what extent do you think you have sought and obtained evidence of joint actions of participants who have come to resolutions stemming from negotiations of tensions invoked by contesting and contradictory constructions of the stakeholders? What follow-up strategies do you intend to utilize to assess the extent to which action occurred stemming from the increased understandings that emerged during the course of the study?
Tactical Authenticity
How empowered do the participants appear to be? How participatory were the actions taken by the participants? To what extent are all participants more skilled than they were previously (e.g., since the study begun; since the last interview) in understanding and utilizing power and negotiation techniques? To what extent do the stakeholders believe that they or their representatives have had a significant role in the action(s) taken and/or decision(s) made?
This table was adapted from Onwuegbuzie et al. (2008). Reprinted with permission of Anthony J. Onwuegbuzie, Sam Houston State University.
710 The Qualitative Report May 2010
Debriefing interviews According to Onwuegbuzie et al. (2008), there are multiple aspects of debriefing interviews to consider. First, during a debriefing interview, both verbal and non-verbal communication would be queried. In particular, each of the four major types of non-verbal communication (i.e., proxemic, kinesic, chronemic, paralinguistic orientations; cf. Gorden, 1980) should be explored during the debriefing interview. Second, even though debriefing interviews could be conducted after all the participant interviews have been completed, debriefing interviews could be undertaken throughout the study. Debriefing interviews could be conducted after each participant interview, which would help to create an audit trail of the researcher’s thoughts, feelings, and perceptions. Furthermore, the researcher can use the information gleaned through the debriefing interview to make modifications in the later interviews. Indeed, as a member of their dissertation committees, the first author conducts debriefing interviews of all students who are conducting dissertations representing qualitative or mixed methods research at various stages of their studies. To date, every student who has undergone debriefing interviews describes how useful they are for helping them reflect deeply about their experiences, perceptions, feelings, emotions, actions, and the like, during the dissertation process. Thus, our recommendation for debriefing interviews to be used in qualitative research stems from practical experience. Third, debriefing interviews include a conversation between the debriefer and the researcher, thereby creating knowledge (Onwuegbuzie et al., 2008). Thus, the debriefing interviewer and the researcher could both analyze the data derived from the debriefing interview. By doing so, member checking would be accomplished to ascertain the credibility of the data. This collaboration also might lead the researcher and interviewer to co-author facets of or the entirety of the final report. Fourth, debriefing interviews represent both a trustworthiness procedure and a data collection procedure. As a trustworthiness procedure, the debriefer could play the role of devil’s advocate or “disinterested peer” (Lincoln & Guba, 1985, p. 308), whose role is to make the researcher accountable for her/his interpretations by posing difficult questions about various aspects of the research process. As a data collection procedure, the debriefer could provide the researcher with the opportunity for catharsis by identifying with the researcher’s feelings. The information extracted from the debriefing interviews, which can be analyzed using an array of qualitative data analysis tools (see, for e.g., Leech & Onwuegbuzie, 2007, 2008), would provide additional data to those collected on the participant(s), thereby facilitating rich and detailed description of the underlying phenomenon and/or case(s). As noted by Lincoln and Guba, “debriefing is a useful—if sobering—experience to which to subject oneself; its utility, when properly engaged, is unquestionable” (1985, p. 309). Displays in debriefing interviews
Onwuegbuzie et al. (2008) recommend the use of Miles and Huberman’s (1994) framework in documenting and interpreting patterns (e.g., matrices, displays) of the data collected during the debriefing interviews and providing an audit trail. Many computer-
Anthony Onwuegbuzie, Nancy L. Leech, and Kathleen M. T. Collins 711
assisted software packages (e.g., NVIVO, QDA Miner) can be helpful when creating matrices and displays. Onwuegbuzie et al. (2008) suggest possibly having the cell entries include the participants’ statements and the researcher’s statements from the debriefing interview (cf. Onwuegbuzie et al., 2008 for a detailed discussion of the various uses of displays and matrices).
Focus Group Research
Focus group research is defined as a method of collecting data, in a safe environment, from more than one individual at a time, regarding a specified area of interrogation (Krueger & Casey, 2000). Focus groups have been used for decades (Morgan, 1998). In the 1920s, researchers used focus groups to create survey questionnaires. Later, market researchers used focus groups as a method to obtain participants’ attitudes and opinions (Greenbaum, 1998). Only during the last 20 years have researchers utilized focus groups to collect qualitative data (Madriz, 2000). In the 1980s, the first books on focus groups were published (Morgan, 1988) and health researchers used focus groups in social action research (Wilkinson, 1998). Onwuegbuzie, Dickinson, Leech, and Zoran (2009) suggest several benefits to using focus groups in qualitative research. First, focus groups are economical (Krueger & Casey, 2000). Because participants are interviewed in a group setting, the data can be collected faster and usually at a lower economic cost to the researcher. Second, using focus groups might increase the number of participants in the study (Krueger & Casey). Third, according to Krueger and Casey, focus groups are a means to collect social data in a social environment. Fourth, the interaction among participants can be identified through focus groups (Morgan, 1988). Fifth, focus groups have high face validity (Krueger & Casey). Focus groups also can create an atmosphere where more responses can take place (Butler, 1996). Furthermore, Vaughn, Schumm, and Sinagub (1996) suggest focus groups can create a “safer” environment than can individual interviews. Finally, focus groups provide a place for participants to interact in such a way that personal issues and problems can potentially be solved (Duggleby, 2005).
Onwuegbuzie et al. (2009) present a framework for collecting focus group data, which includes identifying types of data to collect during focus groups, as well as micro-interlocutor data collection (i.e., the order and characteristics in which members of the group respond to questions). In the next section, this framework is presented and described. Focus group data
Focus groups are usually conducted for one to two hours (Morgan, 1997; Vaughn et al., 1996), based on the research questions and design. It is recommended that the size of the group include between six and twelve participants, so that the group is small enough for all members to talk and share their thoughts, and yet large enough to create a diverse group (Krueger, 1994; Krueger & Casey, 2000; Morgan, 1997). Krueger suggests the use of “mini-focus groups” (p. 17) with three (Morgan, 1997) or four (Krueger) members, in order to get more in-depth information. Focus groups might meet once, or multiple times. Krueger and Morgan (1997) suggest if more than one meeting is needed,
712 The Qualitative Report May 2010
then at least three to six focus group meetings should be held. As noted by Onwuegbuzie et al. (2009), more than one meeting for the focus group can help the researcher in a number of ways—including achieving data saturation. The members of the focus group can be made up of people in a pre-existing group or the focus group can be created by the researcher. Most commonly, focus group members respond to questions posed by the researcher. Onwuegbuzie et al. (2009) suggest that the researcher might also consider presenting material to which the members can respond. These types of materials can include video, articles, pictures, and so forth. Another type of activity in which the members of the focus group can engage is group activities, such as team-building activities.
Onwuegbuzie et al. (2009) suggest the use of a moderator and an assistant moderator (Krueger, 1994) to lead the focus group. The moderator’s tasks include facilitating the discussion and taking notes during discussion in order to create new questions for the group. The assistant moderator’s tasks include ensuring the recording of the session (i.e., either through audio or videotaping), recording the session via hand written notes, securing the environment via a comfortable temperature, handling latecomers or other interruptions, and then assisting in data analysis with the researcher (Krueger & Casey, 2000).
Data collected from focus groups have traditionally included the text from the members of the group. Duggleby (2005) suggests using other types of data as well, including interaction data, group data, and individual data. Unfortunately, this leads to controversy over what the unit of analysis might be. It has been argued that the individual or group data should be considered the focus, not the unit, of analysis (Kidd & Marshall, 2000). Morgan (1997) states that most researchers designate the group as the unit of analysis within a study. Researchers analyze these data and usually present themes to assist in understanding what occurred in the group. The main problem with this approach is that the themes might not provide helpful information regarding the amount of agreement among the participants (Onwuegbuzie et al., 2009). By not collecting data regarding the level of consensus and, thus, making it appear that all of the participants agreed, the participants who do not agree are, in fact, being censored. Including data regarding those who do not agree, or what Kitzinger (1994) refers to as “argumentative interactions” can increase the chances of obtaining rich data (Sim, 1998). By collecting the dissenter’s data, the researchers would be able to determine the level of saturation for the focus group—what Onwuegbuzie et al. (2009) termed within-group data saturation.3 Collecting this type of data would be beneficial in understanding the themes and categories. Focus group researchers also could signify the shifts in talk and thought reflected in the focus group interview and generated by the group dynamics. 3 We point out that within-group saturation is a necessary but not sufficient condition either for overall data saturation or theoretical saturation. For data saturation and/or theoretical saturation to occur both within-group and across-group saturation are needed.
Anthony Onwuegbuzie, Nancy L. Leech, and Kathleen M. T. Collins 713
Consensus: Strategies for collecting information
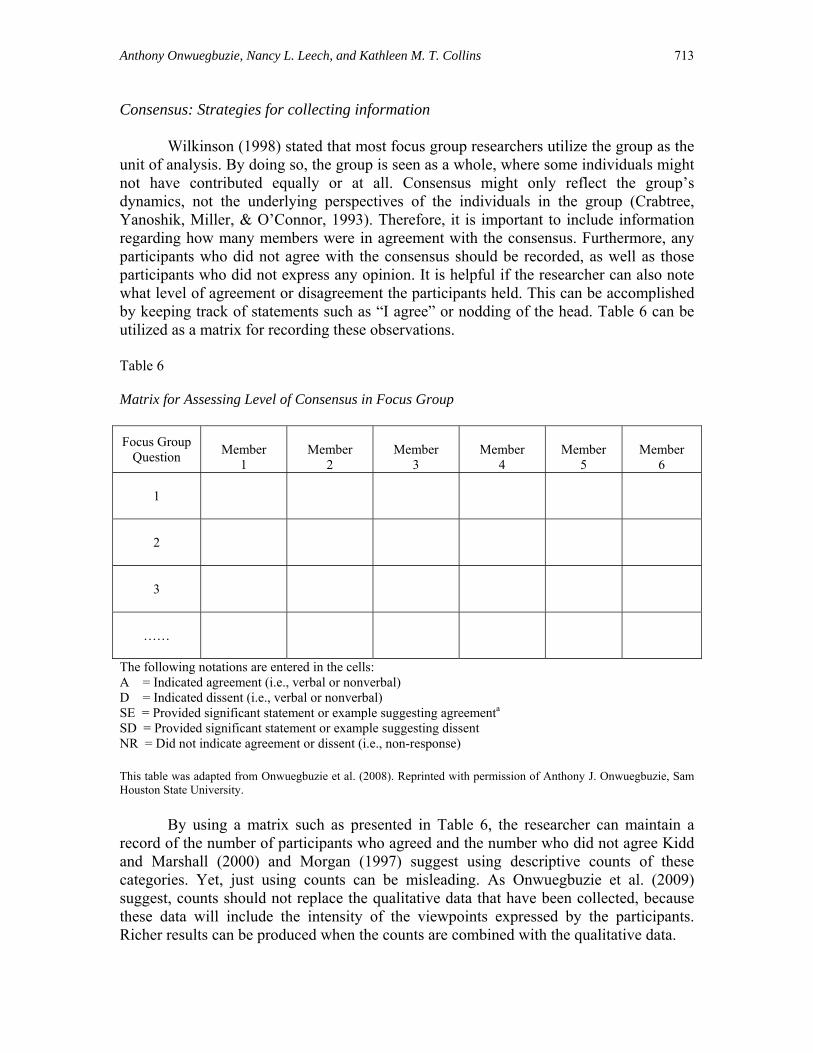
Wilkinson (1998) stated that most focus group researchers utilize the group as the unit of analysis. By doing so, the group is seen as a whole, where some individuals might not have contributed equally or at all. Consensus might only reflect the group’s dynamics, not the underlying perspectives of the individuals in the group (Crabtree, Yanoshik, Miller, & O’Connor, 1993). Therefore, it is important to include information regarding how many members were in agreement with the consensus. Furthermore, any participants who did not agree with the consensus should be recorded, as well as those participants who did not express any opinion. It is helpful if the researcher can also note what level of agreement or disagreement the participants held. This can be accomplished by keeping track of statements such as “I agree” or nodding of the head. Table 6 can be utilized as a matrix for recording these observations. Table 6 Matrix for Assessing Level of Consensus in Focus Group
Focus Group Question
Member
1
Member
2
Member
3
Member
4
Member
5
Member
6
1
2
3
……
The following notations are entered in the cells: A = Indicated agreement (i.e., verbal or nonverbal) D = Indicated dissent (i.e., verbal or nonverbal) SE = Provided significant statement or example suggesting agreementa SD = Provided significant statement or example suggesting dissent
NR = Did not indicate agreement or dissent (i.e., non-response) This table was adapted from Onwuegbuzie et al. (2008). Reprinted with permission of Anthony J. Onwuegbuzie, Sam Houston State University.
By using a matrix such as presented in Table 6, the researcher can maintain a record of the number of participants who agreed and the number who did not agree Kidd and Marshall (2000) and Morgan (1997) suggest using descriptive counts of these categories. Yet, just using counts can be misleading. As Onwuegbuzie et al. (2009) suggest, counts should not replace the qualitative data that have been collected, because these data will include the intensity of the viewpoints expressed by the participants. Richer results can be produced when the counts are combined with the qualitative data.

714 The Qualitative Report May 2010
Strategies for collecting nonverbal communication Table 7 Matrix for Documenting Proxemic, Chronemic, Kinesic, and Paralinguistic Information Focus Group
Question Member
1 Member
2 Member
3 Member
4 Member
5 Member
6 1 2 3
…… Symbolsa such as the following could be inserted into the cells by the assistant moderator, as appropriate: hhh The letter “h” is used to indicate hearable aspirations, its length being approximately proportional
to the number of ‘h’s. If preceded by a dot, the aspiration denotes an in-breath. > Talk is faster than the surrounding talk. < Talk is slower than the surrounding talk. (0.6) Numbers in parentheses indicate periods of silence, in tenths of a second—a dot inside parentheses
indicates a pause of less than 0.2 seconds. ::: Colons indicate a lengthening of the sound just preceding them, proportional to the number of
colons. toda- A hyphen indicates an abrupt cut-off or self-interruption of the utterance in progress indicated by
the preceding letter(s) (the example here represents a self-interrupted ‘today’). ____ Underlining indicates stress or emphasis. gr^eat A ‘hat’ circumflex accent symbol indicates a marked increase in pitch. = Equal signs indicate no silence between consecutive clauses or sentences. LLL The letter “L” is used to represent laughter. SSS The letter “S” is used to represent sighing. FFF The letter “F” is used to represent frowning. PPP The letter “P” is used to represent passion. L ↑ Speaker leans forward while talking, the length of the arrow being approximately proportional to
how far the speaker leans. L ↓ Speaker leans backward while talking. L ← Speaker leans to the left while talking. L → Speaker leans to the right while talking. Note: aThis table was adapted from Onwuegbuzie et al. (2008). Reprinted with permission of Anthony J.
Onwuegbuzie, Sam Houston State University.
Another type of data to collect from focus groups is nonverbal data. Similar to individual interviews, nonverbal data includes proxemic, chronemic, kinesic, and paralinguistic information. During a focus group, the assistant moderator should focus on the nonverbal behavior in order to be able to use this information as data (Fontana & Frey, 2005). The assistant moderator should document where each group member sits, how close the chairs are placed to one another, and the relevant demographic data for each participant (Onwuegbuzie et al., 2009). This documentation will assist the researcher in identifying trends, such as certain members of the group sitting together and stating similar views or perspectives. Onwuegbuzie et al. (2009) further suggest that the assistant moderator should use transcription conventions to proxemic, chronemic, kinesic,
Anthony Onwuegbuzie, Nancy L. Leech, and Kathleen M. T. Collins 715
and paralinguistic information. Table 7 includes a sample transcription. Table 2 and Table 3 could also be used to understand better nonverbal behavior in focus groups. Monitoring sub-groups: Techniques and strategies
During a focus group it is important to monitor sub-groups. Onwuegbuzie, Collins, and their colleagues (cf. Collins, Onwuegbuzie, & Jiao, in press) discuss the role of group dynamics and how these impact group outcomes. The mix of the members of the focus group impacts the type of data that can be collected. Groups that have members who are similar to one another tend to affect adversely a person’s willingness to be authentic and to present their personal views to group members (Sim, 1998). Thus, it is vital for the researcher to keep track of how sub-groups are affecting the focus group discussion. Onwuegbuzie et al. (2009) suggest the use of Venn diagrams to help the moderators collect data regarding the interactions of these subgroups. Figure 1 includes an example of a Venn diagram for sub-groups by gender. From this figure, there is evidence that five “m’s” (i.e., males) responded to the first two questions, whereas only one “f” (i.e., females) responded. This type of pattern is important to identify so that the moderator could make changes. If this type of pattern is not identified until after the conclusion of the focus group meeting, then changes could be made only for future meetings of the focus group.
According to Onwuegbuzie et al. (2009), Venn diagrams are beneficial due to a number of factors. First, the Venn diagram creates a template with which to collect data. Second, the figure can be completed quickly and creates an efficient method for collecting data. Third, information can be added to the figure by drawing circles or arrows to represent patterns in the interactions of the members of the focus group. Finally, subscripts could be used by the letters in the figure to assess how frequently the person contributed to the interactions. Another method for assessing the interaction patterns in a focus group is by keeping track of words/utterances made by each subgroup and then counting and comparing them. This method would help the researcher analyze whether one sub-group dominated the discussion more than did others.
It should be noted that the micro-interlocutor data we recommend that focus group researchers collect (e.g., consensus/dissent data, subgroup interaction data) should not be used to replace data representing the actual voice of the focus group members. Rather, it should be used to complement and supplement the voice, serving as both a validation tool and as a tool to increase representation. Also, these data could be used to help the researcher decide on which focus group members to conduct follow-up individual interviews. For example, the qualitative researcher can decide to conduct follow-up individual interviews on focus group members who spoke the most, on those who spoke the least, or using some other observation stemming from the micro-interlocutor data collection.

716 The Qualitative Report May 2010
Computer-mediated communication
There have been many recent advances in computer-mediated communication (CMC) including the use of electronic interviewing. Thus, “virtual interviewing” is where an Internet connection is utilized to study either synchronously or asynchronously a situation or phenomenon. Benefits of CMC include decreasing problems with time, location, and space of data collection; CMC being less expensive than traveling to interview participants; promoting the ability to include participants from different locations; ease of transcription (Biddix, 2008); researchers in different locations being able to collaborate; possible access to participants in prisons, hospitals, and the like being more easily accomplished; having better access to participants in certain circumstances such as mothers with young children; and the researcher having more anonymity (Mann & Stewart, 2000). Figure 1. Venn diagram comparing the response patterns of the male (x) and female (y) focus group members for the first two questions.
M m mf m m
ffff f
m
m
f f f ff
Question 1
Question 2
The focus group contains six males (m) and six females (f). The capital letters denote the person who responded to the question first. Here, the same male responded to both questions first. Also, five of the males responded to both questions, as shown by the elements in the intersection, whereas only one female responded to both questions. From this Venn diagram representation, the researcher might conclude that males were denominating the discussion pertaining to the first two questions. This diagram can be extended to monitor the response patterns for more than two questions. Also, a Venn diagram can be used to monitor other demographic information deemed important.
Anthony Onwuegbuzie, Nancy L. Leech, and Kathleen M. T. Collins 717
CMC allows the research to be conducted on geographically diverse individuals by bringing them together in chat rooms, mailing lists, and online groups. Furthermore, CMC will assist researchers in evaluating online courses, online business services, and online help services (Mann & Stewart, 2000). Researchers who use CMC will become part of the fast growing Net Generation, which is a worldwide population of children, adolescents, and young adults. Ninety-six percent of children aged eight to eighteen have utilized the Internet. Of these, 74% have a computer at home, and 61% use the Internet. One half of all children under six have used a computer; in fact, among four-to-six-year-olds, 27% spend more than one hour a day utilizing the computer (Kaiser Family Foundation, 2003). According to Grunwald (2003) more than two million US children between the ages of six to seventeen have their own Web sites. Therefore, in the future it is likely that the members of this generation will feel comfortable and even prefer being interviewed using CMC. Researchers need to keep abreast of the new developments of CMC and utilize this tool when collecting data.
When utilizing CMC, the interactions can be asynchronous or synchronous. Asynchronous methods include those that can be conducted at various times such as email, Multi User Dimensions, and websites. Synchronous methods include those that are time sensitive, including blogs and instant messaging. Some CMC methods are already utilized in multiple disciplines, such as instant messenger and network analysis.
A few of the more recent CMC tools have not yet been fully used in research studies, including Facebook, MySpace.com, iTunes, iMovie, Youtube, Bebo, Friendster, Orkut, Flickr, Panoramio, and Second Life. Yet, these tools have great potential. For example, the social networking tool of Facebook (circa 2004) has more than 80 million users worldwide. Facebook is a means to exchange social information and to network with other individuals. Because people who utilize Facebook routinely share personal information, stories, and so forth, in cyberspace, these individuals might be more comfortable participating in research interviews via the Internet. Internet sites, including Facebook, provide a great source for utilizing multiple types of sampling. Another source, mobile telephones (i.e., SMS), also could be used for (short) interviews (Onwuegbuzie et al., 2009). Observations: Strategies for Collecting Visual Representation in Multiple Contexts
Geographic information system
A geographic information system (GIS), also known as a geospatial information system, allows researchers to collect and analyze a structured database comprising geographical features that are spatially oriented to Earth (Goodchild, Fu, & Rich, 2007; Institute, 2009). These data are visually available to researchers in the forms of maps, charts, and models. As a tool, GIS can play an important role in interpretivist research by helping qualitative researchers to “think and reflect” spatially. GIS can integrate, relate, accentuate, and present qualitative data with a spatial component, regardless of the source of the data. Specifically, qualitative data can be integrated with GIS to enhance researchers’ understanding of phenomena by providing more geographical and spatial contexts to reveal trends, patterns, and relationships. For example, in the field of sociology, researchers could use GIS—or other graphing applications—to map

718 The Qualitative Report May 2010
immigration activity across the United States over a period of time (see, for e.g., Dickinson, Hines, & Onwuegbuzie, 2007), and then link these data to qualitative-based sociological data (e.g., housing, health, labor force participation, social justice, marriage quality, social structure, social transformation, religion). Photographs, videos, and drawings/paintings Numerous qualitative researchers have advocated the use of photographs to portray the insights gained via several disciplines, including cultural anthropology (Collier & Collier, 1986), visual sociology (Becker, 1995), visual ethnography (Pink, 2001), visual culture, visual critical theory (Fuery & Fuery, 2003), marketing and consumer research (Heisley & Levy, 1991), and the social sciences in general (Banks, 2001). Some researchers have been even more innovative in their calls, advocating the collection of visual images from the participants themselves rather than from the researchers (Ziller, 1990). For instance, Zaltman (1996) has provided his participants with disposable cameras so that they could take their own photographs of scenes that are deemed meaningful to them and that represent the researcher’s key concepts of interest. The use of self-photographs has the potential to help research participants to express their viewpoints and tell their stories more clearly and vividly, provide them with a topic or issue about which to discuss, encourage them to reflect verbally on their views and perspectives, and to entice them to offer additional information (Hall, Jones, Hall, Richardson, & Hodgson, 2007). In a similar vein, participants can be asked to provide self-videos. Another innovative way of collecting observations is via self-cam. For example, Teeters (2007) used self-cam with six young adult males, aged 18 to 20, with high-functioning autism. The self-cam was a wearable camera system that allows a person to collect video and audio from the movements of her or his own head and face. This self-cam provides live feedback and video playback from the camera in an attempt to experience and learn how participants look to others. The purpose of the study was to evaluate the improvement of social cue recognition when the participants trained on naturally situated videos of familiar faces compared with training on acted expressions of unfamiliar faces. The video test assessed generalization at three levels of familiarity: the participants’ own face, familiar faces, and faces of strangers. Lastly, CMC tools can play an important role in promoting the use of photographs, videos, and drawings/paintings in qualitative research. For example, Youtube (circa 2005), which is a videosharing tool wherein users can upload, view, and share video clips, might be used to house videos such that both researcher(s) and participant(s) have ready and exclusive access to them. Panoramio (circa 2005), which is a photosharing tool, might be used to share photographs, and MySpace.com (circa 2003) and Flickr (circa, 2004) might be used to use both videos and photographs. For CMC-based qualitative research conducted in Asia, Friendster (circa 2002) might be used. Many of these CMC tools have the potential to revolutionalize what we refer to as online arts-based inquiry—a form of qualitative research in which the researcher’s goal is political activism (i.e., situated within the tradition of participatory critical action
Anthony Onwuegbuzie, Nancy L. Leech, and Kathleen M. T. Collins 719
research; Lincoln, 1995) and that is conducted and/or performed online. As can be seen, CMC offers qualitative researchers many more possibilities. Documents and material culture
By documents and material culture, we are referring to written texts and cultural artifacts—evidence that in all its forms represent gendered, cultural, social, and political construction, and which cannot be subjected to an interview or focus group; yet, its interpretation holds a key to the meaning of the underlying lived cultural group or person. This evidence, “unlike the spoken word, endures physically and thus cannot be separated across space and time from its author, producer, or user” (Hodder, 2005, p. 703), which gives historical insight but which almost always forces the qualitative researcher to take an etic perspective. Strategies for collating documents and material culture Current hardware and software can play an important role in the collection of documents and material culture. For example, documents can be accessed and/or collated management software programs such as Refworks (Refworks, 2008). Refworks is a Web-based bibliography and database manager. This software allows users to create their own personal databases online by importing references from online databases or text files. Moreover, Refworks is designed to help researchers easily gather, manage, store, and share all types of information. Printed documents can be scanned and then imported into Refworks. Alternatively, when three-dimensional artifacts are involved, they can be photographed, and the image can be scanned and then imported, alongside any electronic or scanned text, into select qualitative software programs that allow photographs to be coded (e.g., QDA Miner 3.0; NVivo8).
Concluding Thoughts As we begin a new decade in the 21st century, there is little doubt that we live in times of methodological contestation—a period in which qualitative research is being marginalized by proponents favoring the new “gold standard” for producing knowledge in the conduct of research (Denzin & Lincoln, 2005c). However, rather than framing a response that demonizes quantitative research, as some writers of qualitative articles do, we believe that a more constructive approach is to illustrate the utility of qualitative research not only by demonstrating that it represents socially, culturally, ethnically, and racially responsive, communitarian, justice-oriented research, but also by showing that it represents a continuous iterative, interactive, and dynamic process that keeps abreast with methodological innovation (i.e., 10th Movement) in terms of utilization of the latest technological advancements and recognition of the various mental models (i.e., “particular constellation of assumptions, theoretical commitments, experiences, and values through which a social inquirer conducts his or her work”; Greene, 2007). Thus, the purpose of this article was to take a step, however small, in this latter direction by providing an innovative meta-framework for collecting data in qualitative research and
720 The Qualitative Report May 2010
presenting various strategies for collecting data from interviews, focus groups, observations, and documents/material culture.
A major focus among many qualitative researchers is to capture authentically the lived experiences of people. According to Denzin and Lincoln (2005d), such experience, it is argued, is created in the social text written by the researcher. This is the representational problem. It confronts the inescapable problem of representation, but does so within a framework that makes the direct link between experience and text problematic (p. 19).
Denzin and Lincoln (2005d) refer to this problem as the crisis of representation.
Denzin and Lincoln (2005d) also argue for “a serious rethinking of such terms as validity, generalizability, and reliability, terms already retheorized in postpositivist…, constructivist-naturalistic…, feminist…, interpretive…, poststructural…, and critical…discourses. This problem asks, ‘How are qualitative studies to be evaluated in the contemporary, poststructural moment?’” (pp. 19-20). Denzin and Lincoln (2005d) call this problem the crisis of legitimation. These authors also discuss what they term the crisis of praxis in qualitative research. This crisis leads to the question, “Is it possible to effect change in the world if society is only and always a text?” (p. 20).
We believe that many of the strategies presented in this article help, at least to some degree, to address the crises of representation, legitimation, and/or praxis. For example, the debriefing interview helps the researcher to reflect critically on researcher bias in a systematic manner that can greatly enhance the legitimation of accounts of social and behavioral phenomena (i.e., help to address the crisis of legitimation and praxis). Obtaining debriefing information also can benefit the qualitative study’s design and the researcher’s interpretations by clarifying the findings (i.e., help to address the crisis of representation), elucidating possible problems (i.e., help to address the crisis of legitimation and praxis), assisting the researcher in keeping bias from unduly influencing the results (i.e., help to address the crisis of legitimation), and, above all, helping the researcher understand the role that her/his bias is playing in the study (i.e., help to address the crises of representation and legitimation). Indeed, our framework here is consistent with Holstein and Gubrium’s (1995) concept of active interviews, wherein interviews represent active meaning-making endeavors.
The concept of debriefing the interviewer promotes the idea that the interview process represents a contextually based story that is not only co-constructed by the participant(s) and the interviewer (cf. Gubrium & Holstein, 2002), but also reflects an active and meaningful collaboration between the researcher and debriefing interviewer. Moreover, debriefing interviews encourage the researcher to go beyond telling the story (i.e., the what) by making transparent the processes, negotiations, and other interactive facets that occur both between the participant and the interviewer and between the researcher and debriefing interviewer (i.e., the how) and incorporating this information into the final qualitative report. Indeed, if the researcher deems this form of story-telling appropriate and meaningful, the debriefing interview process could facilitate the researcher’s voice being interspersed with the participant’s voice in an auto-ethnographical manner (Ellis & Berger, 2002)—which can yield deeper contextual meaning (Banister, 1999). Further, the debriefing interview process can help the interpretive researcher complete the hermeneutic circle of understanding (Warren, 2002).
Anthony Onwuegbuzie, Nancy L. Leech, and Kathleen M. T. Collins 721
In other words, routinely utilizing debriefing interviews as a facet of the data collection process transforms the interview process into what Onwuegbuzie et al. (2008) call a methodology of story-sharing (p. 14). Additionally, we contend that the debriefing interview process can be used to extract more meaning from data collected via other means such as observations and focus groups. These extensions to the debriefing interview framework will be developed in subsequent articles, as will other techniques for analyzing debriefing data. The strategies we presented for collecting nonverbal communication data also have the potential to address the triple crises of representation, legitimation, and praxis, by providing richer data and promoting reflexivity. Further, the strategies we outlined for incorporating computer-mediated communication can help to minimize issues associated with time, location, and space, thereby increasing representation.
With respect to focus groups, we have provided a framework—what Onwuegbuzie et al. (2009, p. 3) term as micro-interlocutor data collection (i.e., strategies for collecting information about consensus, strategies for collecting nonverbal communication, and strategies for monitoring sub-groups)—for obtaining pertinent information from focus group participants in qualitative research. We believe our framework goes far beyond collecting only the verbal communication of focus group participants. As such, we contend that our framework increases the rigor of focus group methodology in qualitative research. With regard to observations, we outlined strategies for collecting spatial information and for collecting visual representation, as a means of enhancing meaning (i.e., representation), as was the case for the strategies we presented for collating documents and material culture.
By keeping abreast with the latest technological advancements and mental models, we believe that qualitative researchers have the potential to transcend the era of methodological contestation and move towards a period of methodological innovation, in which qualitative researchers go beyond the traditional ways of collecting primary and reflexive data. In our view, the question should not be “if” but “when.”
References
Adler, P. A., & Adler P. (1987). Membership roles in field research (Qualitative
Research Methods Series 6). Thousand Oaks, CA: Sage. Banister, E. M. (1999). Evolving reflexivity: Negotiating meaning of women’s midlife
experience. Qualitative Inquiry, 5, 3-23. Banks, M. (2001). Visual methods in social research. London, England: Sage. Becker, H. S. (1995). Visual sociology, documentary photography, and photojournalism:
It's (almost) all a matter of context. Visual Sociology, 10, 5-14. Biddix, J. P. (2008). Multitasking CMC to study connected organizations. In S. Kelsey
and K. St.-Amant (Eds.), Handbook of research on computer mediated communication (Vol. 1, pp. 309-324). Hershey, NY: Information Science Reference.
Bull, P. (2001). State of the art: Nonverbal communication. The Psychologist, 14, 644-647.
722 The Qualitative Report May 2010
Butler, S. (1996). Child protection or professional self-preservation by the baby nurses? Public health nurses and child protection in Ireland. Social Science and Medicine, 43, 303-314.
Collier, J., Jr., & Collier, M. (1986), Visual anthropology: Photography as a research method (Rev. ed.). Albuquerque, NM: University of New Mexico Press.
Collins, K. M. T., Onwuegbuzie, A. J., & Jiao, Q. G. (in press). Cooperative learning and group dynamics among graduate students. Theory, research, and practice. New York: New Methodology Press.
Crabtree, B. F., Yanoshik, M. K., Miller, W. L., & O’Connor, P. J. (1993). Selecting individual or group interviews. In D. L. Morgan (Ed.), Successful focus groups: Advancing the state of the art (pp. 137-149). Newbury Park, CA: Sage.
Creswell, J. W. (2007). Qualitative inquiry and research design: Choosing among five approaches (2nd ed.). Thousand Oaks, CA: Sage.
Denscombe, M. (2008). Communities of practice. A research paradigm for the mixed methods approach. Journal of Mixed Methods Research, 2, 270-283.
Denzin, N. K., & Lincoln, Y. S. (2005a). The discipline and practice of qualitative research. In N. K. Denzin & Y. S. Lincoln, (Eds.), Sage handbook of qualitative research (3rd ed., pp. 1-32). Thousand Oaks, CA: Sage.
Denzin, N. K., & Lincoln, Y. S. (Eds.). (2005b). The Sage handbook of qualitative research (3rd ed.). Thousand Oaks, CA: Sage.
Denzin, N. K., & Lincoln, Y. S. (2005c). Preface. In N. K. Denzin & Y. S. Lincoln, (Eds.), Sage handbook of qualitative research (3rd ed., pp. ix-xix). Thousand Oaks, CA: Sage.
Denzin, N. K., & Lincoln, Y. S. (2005d). Introduction: The discipline and practice of qualitative research. In N. K. Denzin & Y. S. Lincoln (Eds.), Sage handbook of qualitative research (3rd ed., pp. 1-32). Thousand Oaks, CA: Sage.
Dickinson, W. B., Hines, C. V., & Onwuegbuzie, A. J. (2007, March). People, pattern, and place: SAS/GRAPH data display of immigration activity across the United States. Proceedings of the SAS Global Forum 2007 Conference. Cary, NC: SAS Institute.
Duggleby, W. (2005). What about focus group interaction data? Qualitative Health Research, 15, 832-840.
Ekman, P. (1972). Universal and cultural differences in facial expressions of emotion. In J. R. Cole (Ed.), Nebraska symposium on motivation 1971 (pp. 207-283). Lincoln: University of Nebraska Press.
Ekman, P., & Friersen, W. V. (1969). The repertoire of nonverbal communication: Categories, origins, usage, and coding. Semiotica, 1, 49-98.
Ellis, C., & Berger, L. (2002). Their story/my story/our story: Including the researcher’s experience in interview research. In J. Gubrium & J. Holstein (Eds.), Handbook of interview research: Context and method (pp. 849-876). Thousand Oaks, CA: Sage.
Fontana, A., & Frey, J. H. (2005). The interview: From neutral stance to political involvement. In N. K. Denzin & Y. S. Lincoln (Eds.), Sage handbook of qualitative research (2nd ed., pp. 695-727). Thousand Oaks, CA: Sage.
Anthony Onwuegbuzie, Nancy L. Leech, and Kathleen M. T. Collins 723
Fuery, P., & Fuery, K. (2003). Visual cultures and critical theory. Oxford, England: Oxford University Press.
Goodchild, M. F., Fu, P., & Rich, P. (2007, June). Sharing geographic information: An assessment of the geo-spatial one-step. Annals of the Association of American Geographers, 97, 250-266.
Gorden, R. I. (1980). Interview strategy techniques and tactics. Homewood, IL: Dorsey. Greene, J. C. (2007). Mixed methods in social inquiry. San Francisco: Jossey-Bass. Greenbaum, T. L. (1998). The handbook for focus group research (2nd ed.). Thousand
Oaks, CA: Sage. Grunwald, P. (2003). Two million American children have their own web sites, broad
new Internet survey shows. Grunwald Associates. Retrieved January 11, 2010, from http://www.grunwald.com/surveys/cfi/newsrelease.php
Guba, E. G., & Lincoln, Y. S. (1989). Fourth generation evaluation. Newbury Park, CA: Sage.
Guba, E. G., & Lincoln, Y. S. (2005). Paradigmatic controversies, contradictions, and emerging confluences. In N. K. Denzin & Y. S. Lincoln (Eds.), Sage handbook of qualitative research (3rd ed., pp. 191-215). Thousand Oaks, CA: Sage.
Gubrium, J. F., & Holstein, J. A. (2002). Handbook of interview research: Context and method. Thousand Oaks, CA: Sage.
Hager, J. C., Ekman, P., & Friesen, W. V. (2002). Facial action coding system. Salt Lake City, UT: A Human Face.
Hall, L., Jones, S., Hall, M., Richardson, J., & Hodgson, J. (2007). Inspiring design: The use of photo elicitation and lomography in gaining the child’s perspective. Retrieved June 30, 2008, from http://osiris.sunderland.ac.uk/~cs0lha/Publications/2007/hall-jones-hall-richardson-hodgson.pdf
Heisley, D. D., & Levy, S. J. (1991). Autodriving: A photoelicitation technique. Journal of Consumer Research, 18, 257-272.
Hodder, I. (2005). The interpretation of documents and material culture. In N. K. Denzin & Y. S. Lincoln, (Eds.), Sage handbook of qualitative research (3rd ed., pp. 703-715). Thousand Oaks, CA: Sage.
Holstein, J. A., & Gubrium, J. F. (1995). The active interview. Thousand Oaks, CA: Sage. Institute, E. S. R. (2009). Environmental Systems Research Institute. Retrieved June 21,
2009, from http://www.gis.com/whatisgis/index.html Johnson, R. B., & Onwuegbuzie, A. J. (2004). Mixed methods research: A research
paradigm whose time has come. Educational Researcher, 33(7), 14-26. Kaiser Family Foundation. (2003). New study finds children age zero to six spend as
much time with TV, computers, and video games as playing outside. Menlo Park, CA: Kaiser Family Foundation. Retrieved May 29, 2009, from http://www.kff.org/entmedia/entmedia102803nr.cfm
Kelly, S. D., Barr, D. J., Church, R. B., & Lynch, K. (1999).Offering a hand to pragmatic understanding: The role of speech and gesture in comprehension and memory. Journal of Memory and Language, 40, 577–592.
Kidd, P., & Marshall, M. (2000). Getting the focus and the group: Enhancing analytical rigor in focus group research. Qualitative Health Research, 10, 293-308.

724 The Qualitative Report May 2010
Kitzinger, J. (1994). The methodology of focus groups: The importance of interaction between research participants. Sociology of Health and Illness, 18, 103-121.
Krauss, R. M., Chen, Y., & Chawla, P. (1996). Nonverbal behavior and nonverbal communication: What do conversational hand gestures tell us. In M. Zanna (Ed.), Advances in experimental and social psychology (pp. 389-450). San Diego, CA: Academic Press.
Krueger, R. A. (1994). Focus groups: A practical guide for applied research (2nd ed.). Thousand Oaks, CA: Sage.
Krueger, R. A., & Casey, M. A. (2000). Focus groups: A practical guide for applied researchers (3rd ed.). Thousand Oaks, CA: Sage.
Leech, N. L., & Onwuegbuzie, A. J. (2007). An array of qualitative data analysis tools: A call for qualitative data analysis triangulation. School Psychology Quarterly, 22, 557-584.
Leech, N. L., & Onwuegbuzie, A. J. (2008). Qualitative data analysis: A compendium of techniques and a framework for selection for school psychology research and beyond. School Psychology Quarterly, 23, 587-604.
Lincoln, Y. S. (1995). Emerging criteria for quality in qualitative and interpretive research. Qualitative Inquiry, 1, 275-289.
Lincoln, Y. S., & Guba, E. G. (1985). Naturalistic inquiry. Beverly Hills, CA: Sage. Lincoln, Y. S., & Guba, E. G. (1986). But is it rigorous? Trustworthiness and authenticity
in naturalistic inquiry. In D. D. Williams (Ed.), Naturalistic evaluation (Program Evaluation Series No. 30, pp. 73-84). San Francisco: Jossey-Bass.
Madriz, E. (2000). Focus groups in feminist research. In N. K. Denzin & Y. S. Lincoln (Eds.), Handbook of qualitative research (2nd ed., pp. 835-850). Thousand Oaks, CA: Sage.
Magnusson, M. S. (1996). Hidden real-time patterns in intra- and inter-individual behaviour: Description and detection. European Journal of Psychological Assessment, 12, 112-123.
Mann, C., & Stewart, F. (2000). Internet communication and qualitative research: A handbook for researching online (New Technologies for Social Research Series). Thousand Oaks, CA: Sage.
Maxwell, J. A. (1992). Understanding and validity in qualitative research. Harvard Educational Review, 62, 279–299.
McCafferty, S. G. (1998). Nonverbal expression and L2 private speech. Applied Linguistics, 19, 73-96.
McNeill, D. (1992). Hand and mind. Chicago: Chicago University Press. Miles, M. B., & Huberman, A. M. (1994). Qualitative data analysis: An expanded
sourcebook (2nd ed.). Thousand Oaks, CA: Sage. Morgan, D. L. (1988). Focus groups as qualitative research. Newbury Park, CA: Sage. Morgan, D. L. (1997). Focus groups as qualitative research (2nd ed.). Qualitative Research Methods Series 16. Thousand Oaks, CA: Sage. Morgan, D. L. (1998). The focus group guidebook. Thousand Oaks, CA: Sage. Onwuegbuzie, A. J., Collins, K. M. T., & Leech, N. L. (2008a). A tale of two stories:
Qualitative researchers’ reporting practices pertaining to nonverbal
Anthony Onwuegbuzie, Nancy L. Leech, and Kathleen M. T. Collins 725
communication in interviews and focus groups. Manuscript submitted for publication.
Onwuegbuzie, A. J., Collins, K. M. T., & Leech, N. L. (2008b). A framework for collecting and analyzing nonverbal communication data in interviews and focus groups in qualitative research. Manuscript submitted for publication.
Onwuegbuzie, A. J., Dickinson, W. B., Leech, N. L., & Zoran, A. G. (2009). Toward more rigor in focus group research: A new framework for collecting and analyzing focus group data. International Journal of Qualitative Methods, 8(3), 1-21.
Onwuegbuzie, A. J., Leech, N. L., & Collins, K. M. T. (2008). Interviewing the interpretive researcher: A method for addressing the crises of representation, legitimation, and praxis. International Journal of Qualitative Methods, 7, 1-18. Retrieved February 5, 2009, from https://ejournals.library.ualberta.ca/index.php/IJQM/index
Paisley, P. O., & Reeves, P. M. (2001). Qualitative research in counseling. In D. C. Locke, J. E. Myers, & E. L. Herr (Eds.), The handbook of counseling (pp. 481-498). Thousand Oaks, CA: Sage.
Pink, S. (2001). Doing visual ethnography. London, England: Sage. RefWorks. (2008). RefWorks [Computer software]. Bethesda, MD: Author. Ricci Bitti, P. E., & Poggi, I. A. (1991). Symbolic nonverbal behavior: Talking through
gestures. In R. S. Feldman & B. Rimé (Eds.), Fundamentals of nonverbal behavior (pp. 433-457). New York: Cambridge University Press.
Rosenberg, E. (2009). The science of measuring and understanding facial expression: Expert consultation and training using the facial action coding system (FACS). Retrieved June 21, 2009, from http://www.erikarosenberg.com/FACS.html
Sacks, H., Schegloff, E. A., & Jefferson, G. (1974). A simple systematics for the organization of turn-taking for conversation. Language, 50, 696-735.
Schwandt, T. A. (2007). Sage dictionary of qualitative inquiry (3rd ed.). Thousand Oaks, CA: Sage.
Silverman, D. (Ed.). (2004). Qualitative research: Theory, method, and practice. Thousand Oaks, CA: Sage.
Sim, J. (1998). Collecting and analyzing qualitative data: Issues raised by the focus group. Journal of Advanced Nursing, 28, 345-352.
Spradley, J. P. (1979). The ethnographic interview. Fort Worth, TX: Holt, Rinehart, and Winston.
Teeters, A. C. (2007). Use of a wearable camera system in conversation: Toward a companion tool for social-emotional learning in autism. Retrieved June 30, 2008, from http://affect.media.mit.edu/pdfs/07.Teeters-sm.pdf
Vaughn, S., Schumm, J. S., & Sinagub, J. (1996). Focus group interviews in education and psychology. Thousand Oaks, CA: Sage.
Vidich, A. J., & Lyman, S. M. (2000). The history in sociology and anthropology. In N. K. Denzin & Y. S. Lincoln, (Eds.), Handbook of qualitative research (2nd ed., pp. 37-84). Thousand Oaks, CA: Sage.
Warren, C. A. B. (2002). Qualitative interviewing: In J. Gubrium & J. Holstein (Eds.), Handbook of interview research: Context and method (pp. 83-101). Thousand Oaks, CA: Sage.
726 The Qualitative Report May 2010
Wilkinson, S. (1998). Focus group in health research: Exploring the meanings of health and illness. Journal of Health Psychology, 3, 329-348.
Zaltman, G. (1996). Metaphorically speaking: New technique uses multidisciplinary ideas to improve qualitative research. Marketing Research, 8, 13-20.
Ziller, R. C. (1990), Photographing the self: Methods for observing personal orientations. Newbury Park, CA: Sage.
Author’s Note
Anthony Onwuegbuzie, Ph.D. is professor in the Department of Educational Leadership and Counseling at Sam Houston State University. He teaches doctoral-level courses in qualitative research, quantitative research, and mixed research, as well as teacher education courses and educational psychology courses. His research areas primarily involve social and behavioral science topics, including disadvantaged and under-served populations such as minorities, children living in war zones, students with special needs, and juvenile delinquents. Also, he has conducted numerous research studies on factors that predict educational achievement at the primary, secondary, and tertiary levels. Additionally, he writes extensively on qualitative, quantitative, and mixed methodological topics applicable to multiple disciplines within the field of the social and behavioral sciences. Dr. Onwuegbuzie has secured the publication of more than 230 refereed journal articles and 50 book/encyclopedia chapters. Correspondence should be addressed to Anthony J. Onwuegbuzie, Department of Educational Leadership and Counseling, Box 2119, Sam Houston State University, Huntsville, Texas 77341-2119, or E-Mail: [email protected].
Nancy L. Leech, Ph.D. is an associate professor at the University of Colorado Denver. Dr. Leech is currently teaching master’s and Ph.D. level courses in research, statistics, and measurement. Her area of research is promoting new developments and better understandings in applied qualitative, quantitative, and mixed methodologies. To date, she has published more than 45 articles in refereed journals, and is co-author of four books, all published by Taylor and Francis. Phone: (303) 315-6327 ; E-mail: [email protected].
Kathleen M. T. Collins, Ph.D., is an Associate Professor in the Department of Curriculum and Instruction at the University of Arkansas at Fayetteville. To date, she has published more than 60 research articles, book chapters, and encyclopedia chapters and presented more than 70 research papers at international, national, and regional conferences. Dr. Collins' interests are in research methodological issues as they pertain to mixed research, special populations, and the identification and assessment of literacy problems of post-secondary students. Phone: (479) 575-4218; E-mail: [email protected].
Copyright 2010: Anthony Onwuegbuzie, Nancy L. Leech, Kathleen M. T. Collins, and
Nova Southeastern University
Article Citation Onwuegbuzie, A., Leech, N. L., & Collins, K. M. T. (2010). Innovative data collection strategies
in qualitative research. The Qualitative Report, 15(3), 696-726. Retrieved from http://www.nova.edu/ssss/QR/QR15-3/onwuegbuzie.pdf