innovation technology in feed formulation … · risk profile related to use of insects in animal...
TRANSCRIPT

1
Graduate School of Animal Health and Production:
Science, Technology and Biotechnologies
Department of Health, Animal Science and Food Safety
PhD Course in Biotechnologies Applied to Veterinary and
Animal Husbandry Sciences
(Class XXVIII)
Doctoral Thesis
INNOVATION TECHNOLOGY
IN FEED FORMULATION AND PRODUCTION
(SSD AGR/18)
Candidate: Matteo OTTOBONI
Registration number: R10018
Tutor: Prof. Federica CHELI
Coordinator: Prof. Fulvio GANDOLFI
Academic Year 2014-2015

2
Acknowledgements
On the completion of this work, I would like to express my sincerest appreciation and gratitude to the
following people, without whom this work would have never been possible:
Prof. Federica Cheli and Prof. Luciano Pinotti, for their support, guidance, patience and spontaneous humor
during my research activities and for their technical support; a deep thanks to Prof. Antonella Baldi, for
giving me the opportunity for jointing her research group (VESPA department, University of Milan).
Prof. Mia Eeckhout my supervisor during my internship at the University of Gent, together with Prof.
Stefaan De Smet, Prof Patrick De Clercq, Dr. Joris Michiels, Dr. Thomas Spranghers and Ann Ovyn. Dr.
Wesley De Jaeghere (Ghent University, Laboratory of Pharmaceutical Technology) for his assistance in
the extrusion trials.
Dr. Daniela Marchis, Dr Maria Cesarina Abete, Dr. Giuseppina Amato, Centro di Referenza Nazionale per
la Sorveglianza e il Controllo degli Alimenti per gli Animali (C.Re.A.A.), Torino Italy, for their
collaboration in the frame of the Research Project 2010, Number ID: IZSPLV 12/10/RC titled
"Identificazione di specie delle proteine animali trasformate nei mangimi: sviluppo e confronto di tecniche
microscopiche e immunoistochimiche”.
Prof. Dr. Ing. Vincent Baeten, Dr. Pascal Veys, Marie, Benoit and the technical staff, for their support
together with the use of the feed microscopy lab of the Union Reference Laboratory for the detection of
Animal Proteins in feedingstuffs (EURL-AP), Gembloux, Belgium.
The Italian Ministero degli Affari Esteri e per la Cooperazione Internazionale which financed the survey
study. It was part of the FEEDNEEDS project a GRANDE RILEVAZA Italian-Serbian bilateral project
coordinated by Prof. Luciano Pinotti; Prof Jovanka Lević, Prof. Olivera Đuragić, Dr. Radmilo Čolović Dr.
Ðuro Vukmirović and all the technical staff (Institute of Food Technology, University of Novi Sad,
Serbia), for their collaboration in the frame of the FEEDNEEDS project and their support and
encouragement.

3
Abstract
The general aim of this thesis was to investigate new technology in feed formulation and
production. For this purpose several aspects in the field of feed production were investigated.
Specifically, during the course of this PhD program, three main sub aims have been addressed: i)
evaluation of new ingredients, i.e., insect materials, in feed formulation and the impact of feed
technology on their nutritional value; ii) improvements in the official methods for detecting
Processed Animal Proteins (PAPs), and iii) investigation of the innovation, research, and
development needs in in the feed industry in two selected areas.
With respect to the first sub aim, fresh insect (Hermetia illucens) material was evaluated as an
alternative protein source in experimental feed. Differents experimental formulae containing
insect material were tested under differing extrusion conditions. Extruded feed was also evaluated
for digestibility. The results indicate that fresh Hermetia illucens material can be efficiently
included in experimental extruded feed containing 25% insect material and 75% wheat.
Technological treatment, i.e., extrusion, increased in vitro organic matter digestibility, and did
not affect protein digestibility.
With regard to the second sub-aim the basic assumption was that insect material, if authorized,
should be considered as animal material. Accordingly, the second sub aim of the thesis focused on
implementing existing methods for processing animal protein and investigating their potential in
tracing and characterizing insect material. In this scenario, experiments were aimed toward
improving the official microscopy techniques for detecting processed animal proteins (PAP) by
combining those with image analysis (IA) technology. The studies conducted aim to i) characterize
fish meal material in compound feed (i.e., aquafeed), ii) identify specific selected markers able to
efficiently distinguish between fish and terrestrial materials, iii) distinguish between mammalian
materials, and iv) verify the applicability of the method for identifying insect material in feed. The
results obtained in this context indicated that even though microscopy seems to be a promising
approach for identifying both animal proteins and insect material, using microscopy alone has
some limitations; therefore, a combined approach with other methods (i.e., PCR) is recommended.
With regard to the third sub aim, research and development needs and innovation in the feed
industry, the results of a targeted survey conducted in two countries (Italy and Serbia) showed
that innovation in raw materials is a key factor for large multinational industries. In contrast, the
survey results obtained from small and medium feed companies are quite different; for these
companies, cost reduction, decreased energy consumption, improved quality, improved market
image, development of new markets and satisfying market demand are much more important.

4
By combining the results obtained from the various studies described in this paper, it can be
concluded that: i) Insects show great potential as a protein source in animal feeds. Specific
selected feed technologies, such as extrusion, can be useful in making such feeds convenient and
safe to use. ii) Assuming that insect material will be authorized for use in animal feeds, existing
methods for processing animal proteins may represent an advantageous starting point. Further
investigation and implementation of methods of analysis is still required. iii) Even though insect
materials as animal nutrition can be considered as a “hot topic” from a scientific point of view,
not everyone in the feed sector seems to be aware of the issue. Addressing “new ingredients”, co-
and by- products remain the main categories in the feed sector mind consciousness.

5
Table of contents
Acknowledgements ......................................................................................................................... 2
Abstract ........................................................................................................................................... 3
Introduction ..................................................................................................................................... 7
An overview of the feed sector .................................................................................................... 7
Novel alternative protein sources .............................................................................................. 12
Current legislation on insect material and detecting method .................................................... 16
Risk profile related to use of insects in animal feed .................................................................. 18
Feed technology ......................................................................................................................... 21
Matching recent advances in nutrition science with feed industries’ innovation needs ............ 24
Aim ................................................................................................................................................ 26
Material and method ...................................................................................................................... 28
Evaluation of new ingredients in feed formulation and impact of technology on nutritional value
................................................................................................................................................... 28
Evaluation of inclusion of insect material (Hermetia illucens) as is in an experimental
extruded feed .......................................................................................................................... 28
Evaluation of the impact of extrusion on the nutritional value and digestibility of experimental
mixtures containing insect material (Hermetia illucens). ...................................................... 30
Implementation of the official methods for the detection of Processed Animal Proteins (PAPs)
in feed ........................................................................................................................................ 33
Experiment-1 Evaluation of microscopy in combination Image analysis for MBM
characterization: comparison between bovine and swine material ........................................ 33
Experiment-2 Characterization fish material and comparison with land animal material ..... 36
Experiment-3 Characterization of insect material by microscopy and comparison with marine
organism material. .................................................................................................................. 38
Survey study .............................................................................................................................. 42

6
Results and discussion ................................................................................................................... 44
Evaluation of new ingredients in feed formulation and impact of technology on nutritional value
................................................................................................................................................... 44
Evaluation of inclusion of insect material (Hermetia illucens) as is in an experimental
extruded feed .......................................................................................................................... 44
Evaluation of the impact of extrusion on the nutritional value and digestibility of experimental
mixtures containing insect material (Hermetia illucens). ...................................................... 45
Implementation of the official methods for the detection of Processed Animal Proteins (PAPs)
in feed ........................................................................................................................................ 49
Experiment-1 Evaluation of microscopy in combination Image analysis for MBM
characterization: comparison between bovine and swine material ........................................ 49
Experiment-2 Characterization fish material and comparison with land animal material ..... 55
Experiment-3 Characterization of insect material by microscopy and comparison with marine
organism material. .................................................................................................................. 66
Evaluation of an analytical approach for tracing insect material in feed. .............................. 66
Survey study .............................................................................................................................. 70
Conclusions ................................................................................................................................... 80
References ..................................................................................................................................... 84
List of publications ...................................................................................................................... 100
Published ................................................................................................................................. 100
Submitted paper ....................................................................................................................... 100

7
Introduction
An overview of the feed sector
Recent feed sector updates (FEFAC, 2015) report that the EU-28 contributes 16% of global feed
production, estimated at approximately 964 mio. tons. Considering the global scenario, in 2014
Latin America, and Middle East and Africa have shown the highest increase in compound feed
production –versus to 2013 volumes- compared to the other world regions. By contrast a slightly
decrease for the same figures has been observed for Asia-Pacific and Europe/Russia regions
(figure 1- Best, 2015). Nevertheless, the EU feed sector is the most important agricultural input
industry in Europe and is an essential supply partner to the livestock industry (EUFETEC, 2013).
FIGURE 1 2013-2014 VARIATIONS IN COMPOUND FEED PRODUCTION IN DIFFERENT WORLD
REGIONS (FROM BEST, 2015)
As reported in the latest review of livestock production and trade, more than 170 million tons of
meat and other animal products were produced in the EU-28. To sustain this scale of livestock
production, the EU-28 consumed 475 million tons of feed a year, of which half consists of
roughage, 10% is farm-produced grains, 10% is purchased feed materials and the remaining 30%
is industrial compound feed (FEFAC, 2015) (see details in figures 2 and 3). Compound feed
production in the EU-28 decreased slightly, by 0.5%, in 2014 to 153.4 mio. t. Pig feed production
fell by 1.2% for the third consecutive year, whereas poultry and layer feed increased slightly
(+0.3%), confirming their positions in the leading compound feed segment, slightly above pig
feed. Cattle feed production also decreased by 1.2% (FEFAC, 2015). Germany and Italy recorded
an increase in feed production (+ 2.3% and + 0.3%, respectively), while in the UK, France, the

8
Netherlands and Spain, production decreased by 1.6%, 0.7%, 4.5% and 0.8%, respectively
(AgroNotizie, 2015).
FIGURE 2 EU-28 LIVESTOCK SOURCING IN FEEDINGSTUFFS - 475 MIO. T IN 2014
FIGURE 3 INDUSTRIAL COMPOUND FEED PRODUCTION IN THE EU-28 IN 2014 153.4 MIO. T (PER
CATEGORY)
Feed cereals
48%
Co-products from
food industry
11%
Oil &fat
2%
Cakes &meals
27%
Pulses
1%
Dairy products
1%
Dried forages
2%
Minerals additives,
vitamins
3%Other
5%
Forages
49%
Home grown cereals
11%
Industrial compund
feed
32%
Purchhased straight
feedingstuffs
8%

9
Notably, by themselves, the production of these six countries represents over 70% of total feed
production among the EU-28 (AgroNotizie, 2015). To summarize the EU scenario, most EU
member countries’ production changed within a range of -3/+3%, with the noticeable exceptions
of Ireland (-11%), due to lower demand for cattle feed, and Poland (+7%), a figure boosted by the
demand for poultry feed. Germany’s position as the leading EU country in terms of total compound
feed strengthened; it is ahead of France and Spain, which are shoulder to shoulder in second place.
Germany is the leading cattle and pig feed producer, while France maintains the lead in poultry
feed production.
Despite the huge variations in feed material prices in recent years, the proportion of feed materials
per category has remained relatively stable (48% for cereals, 27.5% for oilseed meal). However,
this does not reflect the significant changes for some feed materials, e.g., corn gluten feed or dried
distiller grains—usually imported from the USA—, which have almost disappeared since 2007
due to repeated trade disruptions caused by asynchronous authorizations of GM crops. Since the
Mac Sharry reform in 1991, the average inclusion rate of cereals increased from 32 to 48%. On
the other hand, tapioca, one of the most important substitutes for cereals in the 1980s, disappeared
completely from the diets. Animal proteins, which in the past represented up to 2% of feed
materials, were banned in 2001 and have been mostly replaced by soybean meal (FEFAC, 2015).
Livestock production: recent trends, future prospects
It is widely accepted that by 2050 the world will have a population of 9 billion people. To
accommodate this number, current food production will need to nearly double. Because of
increasing incomes, urbanization, environmental concerns, nutritional concerns and other
anthropogenic pressures, the global food system is undergoing a profound change. There has been
a major shift towards diets with increased consumption of animal products, and this change is
likely to continue in the coming decades. The demand for meat and milk is expected to be 58%
and 70% higher in 2050, respectively, than the levels were in 2010, and a large part of this increase
will originate from developing countries (FAO, 2011). In this context, agriculture and animal
production play a leading role in global food security.
The animal feed industry makes a crucial contribution to the global food industry. Feed is the
largest and most important component for ensuring safe, abundant and affordable animal proteins.
World compound feed production is fast approaching an estimated 1 billion tons annually. Global
commercial feed manufacturing generates an estimated annual turnover of over US $370 billion
(IFIF, 2014). According to the UN Food and Agricultural Organization (FAO, 2013) and IFIF

10
(2013) estimations, animal protein production will double for meats (poultry/swine/beef), as well
as dairy, and fish production will almost triple by 2050. However, there are many concerns about
the environmental sustainability of our current animal-based food production levels (Van Huis,
2013).
FIGURE 4 BIOCONVERSION TECHNOLOGY USING DETRITIVOROUS INSECTS PROPOSED FOR
PRODUCING INNOVATIVE AND HIGHLY SUSTAINABLE PROTEIN AND OIL FOR AQUACULTURE AND
LIVESTOCK FEEDS (MODIFIED FROM KUPFERSCHMIDT, 2015).

11
Protein sources traditionally used in feed production are related to sustainability issues, such as
overexploitation and deforestation (Van Huis, 2013). Rapid growth of the aquaculture industry
and the increasing demand for fish meal and fish oil (largely used in aquafeed) have resulted in
rapid price increases (Jackson, 2012; Koeleman, 2015). At the same time, current protein sources
such as soy are becoming more expensive. This explains why many companies are looking for
protein alternatives to make animal feed more sustainable and affordable for farmers. Koeleman
(2015) reported on a Malaysian company that developed a bioconversion technology to process
organic side streams into insect-based products and bio-fertilizer. Using this technology, the
company is able to make use of large-scale bioconversion techniques that use detritivorous insects,
enabling production of innovative and highly sustainable protein and oil for aquaculture and
livestock feeds (example in figure 4). Insect material in general—and high-protein insect meal in
particular—represents an ideal alternative to fish meal, which is a key component of aquafeed and
accounts for a huge import bill (Koeleman, 2015). Fish meal material is growing scarce because it
is produced by only a few operators around the globe. Nevertheless, to meet the increasing demand
for high-value protein meals, the EU Commission has re-authorized the use of non-ruminant meals
in fish feed. The latter stems from a recent revision of the feed ban rules. Regulation (EU) No
56/2013 (European Commission, 2013a), which amends various earlier restrictions concerning the
prevention, control and eradication of certain TSEs, was published in January 2013. The most
significant amendment introduced by this rule is that from 1 June 2013, processed animal protein
(PAP) from non-ruminants has been re-authorized for use as either feed or feed ingredients in
aquaculture. The reintroduction of PAP from non-ruminants has also been made possible, thanks
to the development of a consistent technique to identify and quantify levels of PAP in compound
feeds. Currently, the EU uses two official control methods for detecting animal proteins in feed,
namely, polymerase chain reaction (PCR), which delivers information on the species origin of the
detected PAP, and light microscopy (European Commission, 2009a; European Commission,
2013c). Both methods were validated for proper implementation of the feed ban. Light microscopy
in combination with computer image analysis (IA), which is based on the identification of bone
particles or tissue in feedstuffs, has also been proposed (Pinotti et. al., 2013). These studies’
findings indicated that the use of microscopy in association with computer image analysis for
identifying PAP origins appears promising, especially when used as a complementary method for
DNA-based methods. Therefore, the implementation of microscopy/image analysis techniques
will be a key factor in view of a possible re-introduction of non-ruminant PAP in feed (IFFO,
2013). Such a reintroduction would also enable the EU to reduce its dependence on other sources
of proteins.

12
Novel alternative protein sources
Based on the future feed and food scenarios worldwide, demand for food and feed is predicted to
increase by as much as 70%, placing added pressure on already scarce agricultural resources (FAO,
2009; Pinotti et al., 2014). In particular, there will be a continued increase in global meat demand
as developing countries undergo shifts in dietary habits that are associated with rapid urbanization
and economic growth. The rearing of livestock for meat already places a considerable strain on
global land and water use, and at present, much of the protein produced for livestock feed comes
from unsustainable and environmentally damaging sources (IEEP, 2009). Ultimately, to meet the
considerable challenges of assuring food security for the future, it is imperative that alternative,
sustainable sources of protein be found, both for direct human consumption (figure 5) and for use
in animal feed. Protein derived from insects represents one possible solution. The use of insects as
food and feed has proved to be relevant, mainly due to the rising costs of major protein sources for
animal feed (such as fish and soybean meal), food and feed insecurity, environmental pressures,
population growth and the increasing demand for animal protein (meat, fish, dairy products, eggs,
etc..) among the world’s expanding middle classes (Makkar, 2014; Barroso, 2014; van Huis 2013;
Veldkamp et al. 2012 Sánchez-Muros et al., 2014; Rumpold and Schlüter, 2013). In light of this,
the concept of micro-livestock is emerging around the globe.
In several EU Member States, experimental insect rearing has already begun, intended for eventual
use as a feed ingredient for farmed animals, and studies have shown that farmed insects could
represent a sustainable alternative to conventional sources of animal proteins destined for feed
(van Huis, 2013; Rumpold and Schlüter 2013; FAO 2013). Considering the present scenario the
use of novel alternative and sustainable protein sources has been also proposed as a viable solution
in the short term. In this respect, insects could provide an alternative animal protein source. Edible
insects have always been a part of some human diets, but some societies have developed a degree
of distaste for their consumption. Even in these societies, insects in animal feed can be an attractive
feed option as a substitute for traditional protein sources.

13
FIGURE 5 RECORDED NUMBER OF EDIBLE SPECIES OF INSECT BY COUNTRY (FROM FAO, 2013)
A large number of studies were aimed at investigating the chemical composition and the nutritional
value of several insect species (table 1). In general, these studies concluded that insects could serve
as protein and energy supplements for animals. In fact, insects contain large amounts of protein,
ranging from 20 to 70% on a dry matter basis (Sánchez-Muros et al., 2014; Rumpold & Schlüter,
2013; Odesanya et al., 2011). Moreover, because of their amino acid profiles, insects are
considered a high-value protein source, comparable with fish meal and soy (Finke 2013, St-Hilaire,
2007). Furthermore, the presence of antinutritional factors in insects has not been reported in the
literature.
However, insect exoskeletons and maggot cuticles both contain the polysaccharide chitin (Finke,
2007; Yi et al., 2013; Cauchie, 2001), which might affect the digestibility and utilization of other
nutrients (Diener et al., 2009; Shiau and Yu, 1999). Nevertheless, chitinolytic activity has been
observed in fish, where this nutrient might contribute to energy intake (Fines and Holt, 2010;
Goodrich and Morita, 1977a,b). It has been reported that broiler chickens can also secrete chitinase
in the gizzard (e.g., Han et al., 1997; 2000). In the case of pigs, no information is available
concerning chitinase synthesis or secretion, but swine intestinal microbiota have been found to
produce chitinolytic enzymes (Šimůnek et al., 2001). In this sense, the ingested chitin might
contribute to nutritional value, and in turn, to energy intake in some farm animals.

14
TABLE 1 PROXIMATE ANALYSIS (% DRY MATTER) OF SELECTED INSECTS (INCLUDING SAGE OF DEVELOPMENT AND ORIGIN OF THE SPECIES
ANALYZED), FISH MEAL AND SOYBEAN MEAL. VALUES ARE MEANS ± STANDARD DEVIATION. EE = CRUDE FAT. CP = PRUDE PROTEIN. NFE =
NITROGEN-FREE EXTRACT (MODIFIED FORM BARROSO ET AL. 2014).
Species Stage Origin Ash EE CP NFE
Phyllognathus excavatus Adult Free-ranging 7.8 ± 0.2 15.9 ± 1.4 65.7 ± 1.3 10.6 ± 0.1
Rhynchophorus ferrugineus Larvae Free-ranging 6.6 ± 0.6 11.8 ± 1.5 34.6 ± 0.3 47 ± 1.3
Tenebrio mollitor Larvae Captivity 3.5 ± 0.2 30.1 ± 0.7 58.4 ± 0.4 8 ± 0.2
Zophoba morio Larvae Captivity 2.5 ±0.3 38 ± 0.3 53.5 ±0.4 6 ± 1.1
Calliphora vicina Larvae Captivity 8 ± 0.1 20.1 ± 0.7 48.3 ± 0.9 23.6 ± 0.1
Chrysomya megacephala Larvae Captivity 7.2 ± 0.1 27 ± 3.2 61.8 ± 0.3 4 ± 3.4
Chrysomya megacephala Prepupae Captivity 6.1 ± 0.1 16.5 ± 0 46.8 ± 1.1 30.6 ± 1.1
Eristalis tenax Larvae Captivity 13.9 ± 0.4 5.8 ± 0.6 40.9 ± 0.9 39.4 ± 1.1
Hermetia illucens Larvae Captivity 9.3 ± 0.3 18 ± 1.6 36.2 ± 0.3 36.5 ± 1
Hermetia illucens Prepupae Captivity 19.7 ± 0.1 15.6 ± 0.1 40.7 ± 0.4 24 ± 0.7
Lucilia sericata Larvae Captivity 4.9 ± 0.9 28.4 ± 1.5 53.5 ± 4.4 13.2 ± 4.6
Lucilia sericata Prepupae Captivity 4.9 ± 0.2 26.6 ± 1 59 ± 1.5 9.5 ± 0.1
Musca domestica Larvae Captivity 6.5 ± 1.5 31.3 ± 1.6 46.9 ± 4.1 15.3 ± 4
Musca domestica Prepupae Captivity 8.4 ± 2.9 33.7 ± 0.7 40.1 ± 0.4 17.8 ± 0.3
Protophormia terraenovae Larvae Captivity 3.9 ± 0.1 28.3 ± 0.6 46.3 ± 0.6 21.5 ± 0.1
Protophormia terraenovae Prepupae Captivity 8.8 ± 0.1 23.6 ± 0.3 56 ± 2 11.6 ± 2.2
Acheta domestica Adult Captivity 5.6 ± 0 15.9 ± 0.2 73.1 ± 3.3 5.4 ± 0.3
Anacridium aegyptium Adult Free-ranging 3.7 ± 0.1 17.6 ±0.2 66 ± 5 12.7 ± 4.8
Gryllus assimilis Adult Captivity 4.8 ± 0.1 23.2 ± 0.6 64.9 ± 0.5 7 ± 0.3
Heteracris littoralis Adult Free-ranging 5.1 ± 0.1 8.8 ± 0 74.4 ± 1 11.7 ± 1
Locusta migratoria Adult Captivity 4 ± 0 29.9 ± 0.5 58.5 ± 0.5 7.6 ± 0.1
Fish meal - - 18 ± 0.2 8.2 ± 0 73 ± 0.8 0.8 ± 0.7
Soybean meal - - 7.8 ± 0 3 ± 0 50.4 ± 0.2 38.8 ± 0.3

15
Several studies indicate that traditional protein and fat sources commonly used in feed
formulation can be replaced by insects without any adverse effect on productive
performance or product quality (Teotia and Miller 1973; Newton et al., 1977; Anand
et al. 2008; Sealey et al. 2011; Fanimo et al., 2006). Housefly and black soldier fly
(BSF) maggots contain more than 20% crude fat and more than 35% crude proteins
(Barroso, 2014, Makkar et al., 2014), making them a promising ingredient in feed
formulation. A further aspect that has been mentioned for insect meals is their
nutraceutical potential. For instance, BSF are very rich in lauric acid (C12) (Barroso
2014). Skrivanova et al. (2006) showed with an MIC test that lauric acid (C12) exhibits
the highest activity against Clostridium perfringens compared with other medium
chain fatty acids (MCFAs). Furthermore, lauric acid also has the lowest impact on
favorable lactobacilli. These characteristics could help optimize performance and
health by managing the microbiota in the upper part of the small intestine, which is
dominated by gram-positive bacteria (Richards et al., 2005). Although these results
were obtained with specific fatty acids (FAs) supplementation, the proposed effects
can be mimicked with natural sources of FAs such as insect meals; however, further
specific studies and investigations are urgently needed in this area to understand the
potential gains and risks.
It has been observed that the nutritional value of insects is influenced by substrate
composition. Specifically, fatty acid composition is one of the first observed changes
in houseflies and black soldier flies in response to changes in substrate composition
(Makkar et al., 2014; Hwangbo et al., 2009; Odesanya et al., 2011; Pretorius, 2011;
Spranghers et al., 2015).
With regard to quality in animal products—and specifically the effects of dietary
inclusion of BSF prepupae on fish fillet quality—Sealey et al. (2011) stated, ‘BSF
prepupae reared on dairy cattle manure and trout offal can be used to replace up to
50% of the fish meal portion of a practical trout diet for 8 weeks without significantly
affecting fish growth or the sensory quality of rainbow trout fillets’.
However, although scientific findings can help support and/or complete potential legal
amendments concerning the use of insect meals in animal feed, the major barrier to the
growth of the edible insect sector is the lack of precise and insect-inclusive legislation,
standards, labeling and other regulatory instruments concerning the production, use
and trade of insects in food and feed chains (FAO,2014). In fact, even though several
projects (i.e., PROteINSECT) are still underway dealing with production of edible

16
insects for feed, they omit any focus on raising edible insects for food. One of the
major limits to the full adoption of insects in feed formulation is the lack of robust and
accurate analytical methods that can support legislation pertaining to these materials.
From a practical point of view, insect meals and materials should actually be
considered as PAP even though insects are not considered to be in that “family” in
most related legislation.
Current legislation on insect material and detecting method
In the EU feed register, insects (Dried Insects 01586-EN) are defined as the dried
whole or parts of insects and aquatic invertebrates in all their life stages of any species
other than those that are pathogenic to humans and animals. This situation is
complicated because according to EU Regulation 142/2011 (European Commission,
2011), ‘processed animal protein’ refers to animal protein derived entirely from
Category 3 materials that were treated in accordance with Section 1 of Chapter II of
Annex X (including blood meal and fish meal) to render them suitable for direct use
as feed material or for any other use in feedstuffs, including pet food, or for use in
organic fertilizers or for soil improvement; however, those regulations do not include
blood products, milk, milk-based products, milk-derived products, colostrum,
colostrum products, centrifuge or separator sludge, gelatin, hydrolyzed proteins and
dicalcium phosphate, eggs and egg products (including eggshells), tricalcium
phosphate and collagen. Thus, existing EU legislation does not prevent feeding farmed
animals with live insects, but insect PAP may not be fed to farmed animals due to the
feed ban restrictions. The most recent revision of the feed ban rules (European
Commission, 2013b) has re-authorized processed animal proteins (PAPs) from non-
ruminants for use as feed or feed ingredients in aquaculture since 1 June 2013, but that
re-authorization has not changed the scenario. PAPs must still adhere to strict
requirements to avoid any risk of cross-contamination with ruminant protein during
collection, transport and processing. Under EC Regulation 56/2013 (European
Commission, 2013a), category 3 PAPs (from non-ruminant species) would be
permitted as feed only for aquacultured species.
Insects are not included in EC Regulation 56/2013 (European Commission, 2013a),
mainly because the entire regulation focuses on slaughterhouse procedures and is

17
therefore not applicable. However, due to the increased interest in the topic, a
modification of the annex is currently being drafted with the goal of including insects
under EC Reg. 999/2001 (European Commission, 2001), but that has not yet been
adopted. Furthermore, in the case of insects, a key issue is the substrate for their
production in the mini-livestock: currently, 100% vegetable substrate and animal by-
products (ABP) belonging to the category 3 (i.e., ABP derived from parts of animals
that have been declared suitable for human consumption) may be used for growing
insects. In accordance with this assumption, the use of ABP will limit the further use
of insect meals in farm animal nutrition. The use of other substrates would require
modification of the EU legislation on ABP.
Despite the above categorization and destination concerns about insect meals, a further
step in defining future possible insect legislation is the implementation of analytical
methods.
Currently, insect materials in the feed and food matrix have been considered as
contaminants and/or extraneous matter. The standard method for determining insect
fragments in food, such as flour and semolina, is acid hydrolysis. AOAC method
993.26 (1997) described also by Bhuvaneswari et al. (2011) and Perez-Mendoza et al.
(2003) is a laborious and time consuming process that extracts insect fragments from
flour by acid digestion and flotation. Insect fragments are generally brown in color and
do not smash or shatter easily. Some of these hard-to-break fragments, such as
mandibles, have clear edges and retain their characteristic shapes, making them easy
to identify (Trematerra and Catalano, 2009). A few other methods that have sought to
count insect fragments include using enzyme-linked immunosorbent assays (ELISA)
(Quinn et al., 1992; Schatzki et al., 1993; Brader et al., 2002), DNA fingerprinting
(Balasubramanian et al., 2007) and near-infrared spectroscopy (NIRS) (Perez-
Mendoza et al., 2003). Hyperspectral imaging is a technique that provides spectral
information about a scanned sample in a spatially resolved manner; each pixel has its
own spectrum. The hyperspectral images can be described by a three dimensional array
of size m n l, where m and n are the spatial dimensions (in detector size or pixels)
in the x and y directions and l is the wavelength, or third dimension. Analytical tools
from chemometrics combined with spatial image processing are used to reduce the
dimensionality of hyperspectral data, extract the features, and then develop calibration
models (Grahn and Geladi, 2007). A further approach was proposed by Bhuvaneswari
et al. (2011), which compared speck counts using an electronic speck counter (SPX

18
Maztech MicroVision), acid hydrolysis and flotation (AOAC, 1997), and near-infrared
(NIR) hyperspectral imaging in semolina seeded with insect fragments (50-300
fragments/50 g) of Tribolium castaneum (Coleoptera: Tenebrionidae). That study
found a significant positive correlation between the number of insect fragments added
and detected by all three methods; however, the goal in this case was also insect
fragment detection as a measure of extraneous material.
Assuming that insect meals can be considered animal meals, and therefore as feed
ingredients, existing techniques for PAPs can be considered as a robust starting point.
The EU officially allows only two methods for the detection of animal proteins in feed:
light microscopy and polymerase chain reaction (PCR). The latter supplies information
on the species origin of the detected PAPs (European Commission, 2009a; European
Commission, 2013c). Both methods have been validated for proper implementation of
the feed ban. Light microscopy in combination with computer image analysis (IA)
intended to identify bone particles or tissues in feeding stuffs has also been proposed
(Ottoboni et al., 2014; Pinotti et. al., 2013). The findings in these studies have indicated
that using microscopy in association with computer image analysis to identify the
origin of PAPs appears promising, especially as a complementary method to DNA-
based methods. Other methods applied in the feed sector include immunoassays and
near-infrared microscopy (NIRM) (Tena et al., 2014). In light of this, it is important to
improve our ability to characterize insect meals—not only in the case of pure material
but also in practical conditions, such as in experiential feed formulation (pelleted and
extruded). This goal can be achieved in various ways that may include methods already
developed and applied to terrestrial PAPs. Existing methods should be adapted to
insect materials when possible.
Risk profile related to use of insects in animal feed
Aware of the increasing interest in using insects in feed formulation, the Commission
decided to ask the European Food Safety Authority (EFSA) to elaborate an initial
scientific opinion on the microbiological, chemical and environmental safety risks
arising from the consumption and production of insects as food and feed (EFSA,
2015). In this document, EFSA confirmed and compared results obtained by several

19
authors (Veldkamp et al., 2012; FAO, 2013; Makkar et al., 2014; Riddick, 2014;
Sanchez-Muros et al., 2014; van Huis et al, 2015) stating that insects provide protein
similar to soybean meal and fish meal and that insect products may partially replace
traditional protein sources in animal feed.
The EFSA document noted a lack of knowledge concerning the occurrence of human
and animal bacterial pathogens in farmed insects used as food and feed (EFSA, 2015).
Scientific evidence reported in that EFSA scientific opinion (EFSA, 2015) suggests
that, although pathogenic bacteria (such as Salmonella, Campylobacter and
verotoxigenic E. coli) may be present in non-processed insects depending on the
substrate used and the rearing conditions, the risk of transmission of these bacteria
could be mitigated through effective processing steps applied between farming and
consumption. Among different insects species that can be considered for micro-
livestock, the most promising for industrial production in the western world are the
black soldier fly (BSF) (Hermetica illucens), the common housefly (Musca domestica)
and the yellow mealworm (Tenebrio molitor). These species have received increasing
attention because they have the potential to valorize organic waste, which globally
amounts to 1.3 billion tons per year. Black soldier flies, for instance, are naturally
found on poultry, pig and cattle manure but can also occur on organic wastes such as
coffee bean pulp, vegetables, carrion, and fish offal. This list introduces some potential
substrates that can be used in different rearing systems; however, it also raises several
safety implications that must be verified and checked, as suggested by the EFSA.
From another point of view, safety should be considered in combination with
environmental issues. In this respect, the “insect potential” can be high (Leytem et al.,
2009; de Haro Martí et al., 2010; Li et al., 2011). Livestock waste (urine and manure)
contributes to environmental pollution (e.g., ammonia) that can lead to nitrification
and soil acidification (Aarnink et al., 1995). In this sense, insect species such as the
black soldier fly (Hermetica illucens), can be reared sustainably using such livestock
waste as a substrate/material, thus reducing the nitrogen and phosphorus content
(Leytem et al., 2010; de Haro Martí, 2010; Li, 2011). Alternatively, BSFs can not only
be used to produce feed but also recycle waste into clean energy and reduce
environmental pollution from manure. Nevertheless, according to current legislation
(EC regulation 2009a and 2009b), larvae reared on manure cannot be used to feed
animals. As an alternative, Li et al. (2011) proposed the use of insect fat (extracted
grease) from H. illucens reared on manure for biodiesel production.

20
Water use is yet another issue because agriculture currently consumes approximately
70 percent of all freshwater used worldwide (Pimentel et al., 2004). Estimates of the
volume of water required to raise an equivalent weight of edible insects are
unavailable, but they could be considerably lower. In fact, several maggots (such as
black soldier flies and common houseflies) do not require any additional water supply
beyond the moisture of the substrate in which they are reared. Composting and
stabilization of manure as well as the control of houseflies are also important in
intensive animal production. The use of BSF larvae also reduces Escherichia coli
counts in dairy manure (Liu et al., 2008), Salmonella enterica serovar enteritidis in
chicken manure (Erickson et al., 2004) and reduces house fly populations in chicken
manure (Sheppard and Craig, 1984).
The insect species selected, harvest stage, production methods, substrate and
processing methods will all affect the occurrence and accumulation of contaminants
in insect food and feed products. The greatest influence may be from the choice of
substrate relative to the insect species reared on it (FASFC, 2014; ANSES, 2015;
NVWA, 2014; Belluco et al., 2013; van der Spiegel et al., 2013). Unfortunately, data
on the transfer of contaminants from different substrates to insects raised on them are
extremely limited. The limited data available indicates that insects may accumulate
heavy metals, in particular cadmium, from their substrates (Charlton et al., 2015
Diener et al. (2011) Banjo et al., 2010; Devkota and Schmidt, 2000). The presence of
mycotoxins in farmed insects as well as the transference of mycotoxins from the
substrate has been observed (Charlton et al., 2015; van Broekhoven, 2014). Moreover,
mycotoxins may originate both from pathogenic fungi in the substrates and from
mycotoxin production in the gut of insects (Schabel, 2010; FAO, 2013). Nevertheless,
in spite of the available evidence, EFSA raised several uncertainties linked to the
authorization of insects for feed and food due to the lack of knowledge in several areas
such as prions and the extent to which insects act as mechanical vectors of them.
Published data on hazardous chemicals in reared insects in the scientific literature are
also scarce. Concerning the hazard of parasites, available information in the literature
refers to non-European areas (mostly Asia) and to insects harvested in the wild. The
risks of parasites from wild insects in the studied areas may be very different from the
risks of parasites in farmed insects (EFSA, 2015). In addition, there is a lack of
information about the exact details of insect processing and on the environmental
impact of various mass-rearing insect production systems.

21
Feed technology
As already mentioned, the industrial compound feed sector is a key segment in the
agri–food sector in general and in the chain of food products of animal origin in
particular. In spite of that, producing high-quality safe feed and food products is first
and foremost a question of good management practices at each stage of the feed and
food chain (Pulina et al., 2014; FEFAC, 2014). Quality and safety of feed, however,
are terms that not only refer to nutritional composition and values but also to specific
physical and technological properties that can affect animal performance and food
product quality. Specifically, beyond ingredients and nutrient features, compound feed
quality and safety must be addressed in terms of physical properties, which are often
linked to technical quality.
In the realm of technological quality, pelleting is a manufacturing process commonly
used to densify and improve the handling characteristics and nutritive and economic
value of granular materials (Theerarattananoon et al., 2011). Indeed, feed pelleting can
be defined as the conversion of finely ground mash feed into dense, free-flowing
pellets or capsules using a process that involves steam injection (moisture and heat)
and mechanical pressure. There are several advantages in feeding farm animals with
pelleted rather than mash feed, the most important of which is improved animal
performance (improved feed intake, weight gain and feed conversion). Poultry fed on
pelleted diets are less active, they ‘sit’ more and spend less time eating, resulting in
lower maintenance energy requirements during eating and digestion compared to birds
fed with mash feed (Nir et al., 1994). Other benefits of pelleted diets include increased
feed density, reduced feed dustiness, wastage and selection, better handling of feed on
mechanical feed lines and destruction of feed-borne pathogens. Additionally, pelleting
improves microbial stability of the product (Čabarkapa et al., 2010). It was previously
known that starch and its gelatinization are the most important factors for achieving a
desired pellet quality (Wood, 1987; Thomas, 1996, 1997 and 1998); however, recent
reports indicate that the positive impact of protein on pellet quality is important as
well. Briggs et al. (1999) investigated this issue, observing that increasing the protein
content also increased pellet durability. The same authors also reported that increasing
the oil content above 7.5% greatly reduced pellet durability. This aspect has been
described also by Farahat et al. (2015) who stated that oil’s adverse effect on pellet
quality is attributable to a coating effect on the feed particles that prevents steam

22
penetration. In addition, oil reduces the friction generated between die and feed
particles causing a subsequent decrease in the starch gelatinization rate. As shown in
Figure 6, oil has a pellet quality factor (PQF); values below 4.7 indicate poor pellet
quality (Farahat, 2015).
FIGURE 6 PELLET QUALITY FACTOR (PQF) OF DIFFERENT FEED INGREDIENTS (FROM
FARAHAT, 2015)
With regard to the moisture content, in general the optimum range for feed production
is within 12 and 18% (see table 2). Moving above or under these referring value pellet
quality decrease. Combining these factors with the potential use of insect material in
animal feed formulation, it can be speculated that different insect materials (e.g. larvae
meals vs insect protein extracts) can generate different problem in a feed plant,
especially when pelleting is considered. In fact, some insect material sometimes is
characterized by high moisture and fat content that can limit its pelletability.
-50
-40
-30
-20
-10
0
10
20
30
40
50
60
PQ
F

23
TABLE 2 TYPICAL PROCESS PARAMETERS
Process Temp.
(°C)
Max.
pressure
(bar)
Moisture
(%)
Max Fat
(%) Cook* (%)
Pellet press 60-100 12-18 12 15-35
Expander/
pelletpress 90-130 35-40 12-18 12 22-55
Dry extrusion 110-140 40-65 12-18 12** 60-90
Wet extrusion
_Single-screw 80-140 15-30 15-35 22 80-100
_Twin-screw 60-160 15-40 10-45 27 80-100
* % COOK IS STARCH GELATINIZATION MEASURED BY ENZYME SUSCEPTIBILITY.
** DRY EXTRUSION SUCCESSFULLY PROCESS FULL FAT SOY (18- 20% FAT AND OTHER
INGREDIENTS WHERE FINAL PRODUCT DURABILITY IS NOT A CONCERN.
In contrast to the pelleting process, extrusion is used mostly for pet food and fish feed
production. In an extruder barrel, the material is exposed to thermal and mechanical
treatments, plasticizing and shaping the material. The quality of the extruded product
is influenced by various factors including die geometry, feed composition, feed
moisture, particle size, feed rate, screw configuration, screw speed, etc. and specific
combinations of these factors shape the final product’s characteristics. Unlike the
pelleting process, the extrusion process can control the density of a product, resulting
in high digestibility and improved physical characteristics (Guy, 2000). Gelatinization
is the major transition of starch during thermal processes. When the mash is extruded
through the die, the release of pressure and heat causes the starch to expand and
gelatinize (Shankar and Bandyopadyay, 2005). It is recognized that extrusion has
dramatic effects on starch chemistry compared to less aggressive feed processing
techniques such as steam-pelleting or screw-pressing. Gelatinization and expansion of
the starch also increases its nutritional value by increasing its digestibility (Bergot and
Breque, 1983; Jeong et al., 1991; Glencross, 2011). Another benefit of the extrusion
process is its denaturing effect on some of the anti-nutritional factors in raw materials
such as protease inhibitors and lectins, which are affected by the heat treatment
(Refstie et al., 1998; Francis et al., 2001). With regard to the effects of feed formulas
on extrusion performance, several authors (Madeleine et al., 1979; Schweizer et al.,

24
1986) reported that adding lipids during extrusion generally retards the degree of
gelatinization and affects dough rheology in the barrel, which affects the dough flow
properties (Hsieh et al., 1991) and thus the degree of starch gelatinization of the feed
materials (Malkki et al., 1984). Unlike pelleted feed, extruded feed can include higher
amounts of both fat and water. For example, twin-screw extruders can handle viscous,
oily, sticky or wet material, including products with greater than 25% of internal fat.
Using this extrusion technology also makes it possible to add high levels of wet
ingredients (i.e., fresh meat) up to 35% (Guy, 2000). These features make the extrusion
process in general and twin screw extrusion technology in particular the most popular
for high-fat aquafeed (i.e., salmonid) and super premium pet food (with fresh meat)
production (Guy, 2000).
Matching recent advances in nutrition science with feed industries’
innovation needs
Worldwide, the consolidation and intensification of the feed industry has resulted in
more tons produced from fewer feed mills. In the European Union between 2005 and
2010, feed mill size has increased from approximately 10,000 tons to 50,000 tons per
feed mill per year, while the number of feed mills decreased by 80%. This trend is
mirrored in the US and even in China, where the number of feed mills has dropped
from over 15,000 to 10,000. The industrialization of the feed industry has resulted in
an increased specialization and efficiency of manufacturers and suppliers (Connelly,
2013).
A further feature of the feed industry today is its competitiveness. In this respect, feed
cost is determined by four components: the cost of raw materials (approximately 70%
of the overall cost of feed), labor costs, energy price, and depreciation of milling
facilities. Accordingly, feed companies are intensifying their commitment to
innovation, which is considered the key to sustainable food security. Through
innovation, the feed industry can improve resource-efficiency, adapt to trade changes,
and improve food safety, diversity and quality while maintaining the competitiveness
of the agri-food sector and creating more and better jobs in rural areas (Hogan, 2015).
With respect to the European situation presented above, it appears clear that the
livestock sector in general and the feed sector in particular need to take into account

25
several new challenges including environmental impact, the scarcity of raw materials,
and societal acceptance. A common denominator among many of these issues, which
are often politically sensitive, is not only sustainability but also innovation (Geraldine,
2014). Indeed, accelerated research and technology development—based on an
innovative approach—will be crucial for developing feed solutions able to guarantee
the EU livestock sector and remain competitive and sustainable in the global market
(EUFETEC, 2013).
Several of these issues are linked with the “insect story.” As reported earlier and also
elsewhere (Insects to Feed the World Conference, 2014), the potential of insects for
human food and animal feed is highly relevant in view of their good nutritional quality;
human population growth, and corresponding higher demands for animal proteins in
the form of meat and fish the fast rising costs and quantities of major protein sources
needed to feed the growing number of farmed animals, and the serious environmental
impact of our current high meat consumption food habits and animal farming practices,
which use feed grains that could be directly consumed by humans (Makkar, 2014;
Barroso, 2014; van Huis 2013; Veldkamp et al. 2012; Sánchez-Muros et al., 2014;
Rumpold and Schlüter, 2013). All these concerns must be combined with feed industry
needs because those represent the interface with the livestock system. However,
because insect inclusion in animal feeds should be considered as a new approach, its
acceptance as an innovation and as good practice must be verified.

26
Aim
The general aim of this study was to investigate new technologies in feed formulation
and production. Several aspects of the field of feed production were investigated to
evaluate innovative solutions in the supply of protein feed ingredients. Accordingly,
three main sub aims were identified:
1. Evaluation of new ingredients in feed formulation and the impact of technology
on nutritional value.
The approach to test the hypothesis was:
- Investigate the inclusion of insect material (Hermetia illucens) as is in an
experimental extruded feed.
- Evaluate the impact of extrusion on the nutritional value and digestibility
of experimental mixtures containing insect material (Hermetia illucens).
2. Implement the official methods for the detection of PAPs i.e., microscopy in
combination with image analysis measurements.
The approach to test the hypothesis was:
- Evaluate microscopy in combination with image analysis measurements as
an additional tool (in combination with classical microscopy) for:
Species-specific identification of bovine and swine bone containing
material (Experiment 1).
Characterization of fish bone lacunae in aquafeed-extracted material
(Experiment 2).
- Evaluate an analytical approach for tracing insect material in feed.
Specifically, preliminary experiments were performed to characterize
insect originated pure material (i.e., insect meal) using microscopy
(Experiment 3).

27
3. Investigate potential areas for innovation in research and development in the
feed sectors (i.e., use of new or innovative raw materials); identify the key
topics of research and development in the feed sector; obtain stakeholders’
opinions on how to integrate the most valuable identified factors into practice.
The approach to test the hypothesis was:
- Perform a survey study addressed to European feed companies in two
countries (Italy and Serbia). The questionnaire was based on three main
sections: i) Company Overview (CO); ii) Products and Process Features
(P&P); iii) Research, Development and Innovation (R&D).

28
Material and method
Evaluation of new ingredients in feed formulation and impact of
technology on nutritional value
Evaluation of inclusion of insect material (Hermetia illucens) as is in an
experimental extruded feed
Mixture formulation
Wheat baking flour obtained from the experimental baking lab of the Department of
Applied Bioscience of Ghent University, and BSF larvae and prepupae were the main
ingredients used in this study. The larvae were sourced from a private company that
produces BSF for experimental use (Antwerp, BE), while the prepupae were supplied
by the Department of Crop Protection of the Faculty of Bioscience Engineering at the
University of Ghent. Sunflower oil was obtained from a local supermarket. Premixes
of wheat flour and either BSF larvae or prepupae were formulated in the ratio 75:25,
respectively, and contained approximately 10.93 to 11.48 % protein (wet basis) and
from 23.65 to 24.2 % water. These premixes of flour and raw insects were prepared in
a typical household blender. Sunflower oil was added to the prepupae premix to obtain
mixtures ranging from 3.15 to 5.37% fat. The details of these mixtures are summarized
in table 6.
TABLE 3 CHEMICAL COMPOSITION OF AQUAFEED USED IN THE EXPERIMENT 1
Moisture
%
P % on
wet basis
CF% on
wet basis
Ash % on
wet basis
Prepupae + wheat 25:75 (NO oil) 24.21 11.48 3.15 2.34
Prepupae + wheat 25:75 (+oil 1) 24.02 11.39 3.89 2.32
Prepupae + wheat 25:75 (+oil 2) 23.84 11.30 4.63 2.30
Prepupae + wheat 25:75 (+oil 3) 23.65 11.21 5.37 2.29
Larvae + wheat 25:75 (NO oil) 23.71 10.93 4.62 1.67
P – PROTEIN; CF – CRUDE FAT
29
Extrusion
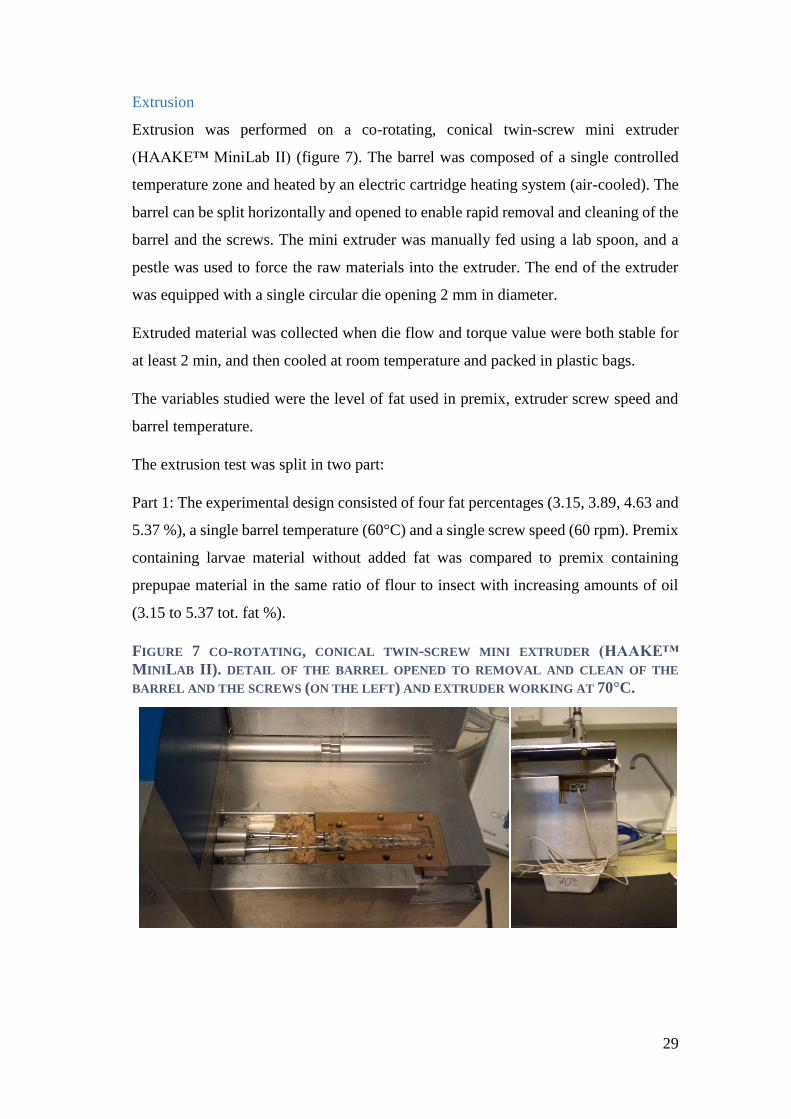
Extrusion was performed on a co-rotating, conical twin-screw mini extruder
(HAAKE™ MiniLab II) (figure 7). The barrel was composed of a single controlled
temperature zone and heated by an electric cartridge heating system (air-cooled). The
barrel can be split horizontally and opened to enable rapid removal and cleaning of the
barrel and the screws. The mini extruder was manually fed using a lab spoon, and a
pestle was used to force the raw materials into the extruder. The end of the extruder
was equipped with a single circular die opening 2 mm in diameter.
Extruded material was collected when die flow and torque value were both stable for
at least 2 min, and then cooled at room temperature and packed in plastic bags.
The variables studied were the level of fat used in premix, extruder screw speed and
barrel temperature.
The extrusion test was split in two part:
Part 1: The experimental design consisted of four fat percentages (3.15, 3.89, 4.63 and
5.37 %), a single barrel temperature (60°C) and a single screw speed (60 rpm). Premix
containing larvae material without added fat was compared to premix containing
prepupae material in the same ratio of flour to insect with increasing amounts of oil
(3.15 to 5.37 tot. fat %).
FIGURE 7 CO-ROTATING, CONICAL TWIN-SCREW MINI EXTRUDER (HAAKE™
MINILAB II). DETAIL OF THE BARREL OPENED TO REMOVAL AND CLEAN OF THE
BARREL AND THE SCREWS (ON THE LEFT) AND EXTRUDER WORKING AT 70°C.

30
The torque value was recorded for each tested mixture; mixtures with value <100 Ncm
were considered extrudable and a decrease in this value in a mixture indicates higher
extrudability.
Part 2: A single mixture was used to evaluate the effect of barrel temperatures on
nutritional value and digestibility. This experiment used a single screw speed (100
rpm) and four different barrel-temperatures (60, 70, 80 and 90°C) (figure 7, right side).
Evaluation of the impact of extrusion on the nutritional value and
digestibility of experimental mixtures containing insect material
(Hermetia illucens).
In-vitro digestibility test
In vitro digestibility assays were performed on freeze dried prepupae material and
extruded experimental feed as is. Two different in vitro protocols (table 4) were
adopted for dry matter/organic matter and protein digestibility, respectively, as
described by Dierick (1991). According to the protocol, varying amounts of sample
were finely ground with a mortar and pestle (< 1 mm), weighed to an accuracy of ±
0.1 mg and incubated in incubation flasks (figure 8). Analyses were performed in
triplicate.
FIGURE 8 IN VITRO DIGESTIBILITY TEST: INCUBATION FLASKS IN SHAKING WATER
BATH (ON THE LEFT) AND INCUBATION FLASK AFTER DOUBLE INCUBATION WITH
PEPSIN AND PANCREATIN

31
TABLE 4 IN VITRO DIGESTION PROTOCOL (MODIFIED FROM DIERICK ET AL. 1991)
Protein Dry matter/Organic matter
Step 1 150 mg protein
Incubation with pepsin
4h 37° C
2 g sample
Incubation with pepsin
4h 37° C
Step 2 Incubation with pancreatin
4h 37° C
Incubation with pancreatin
4h 37° C
Step 3 + Phosphotugstenic acid (PTA)
Centrifugation residue:
undigested protein
Supernatant: α amino-group det.
Centrifugation residue:
undigested DM
After two washings, followed by centrifugation, with 10 ml of Phosphotugstenic acid
(PTA) and 5 ml of PTA + 20 ml of distilled water, respectively, the undigested residues
were transferred to Kjeldahl tubes and dried at 70°C overnight. Undigested nitrogen
was measured by the Kjeldahl [ISO method 5983-1 (2005)]. The in vitro digestibility
of protein was calculated from the difference between the nitrogen in the original
sample and the undigested residue.
Supernatants were filtered with filter paper, and free amino acids (AAs) and peptides
concentrations were determined according to the α amino-group.
After the pepsin and pancreatin incubation in the dry matter/organic matter
digestibility test and three consecutive centrifugation and washings with 2x 20 ml
distilled water, the undigested residues were dried at 105°C overnight. The in vitro
digestibility of dry matter was calculated from the difference between dry matter in
the sample and the undigested residue. Residue was incinerated in a muffle oven for 4
h at 550°C, and OM digestibility was then calculated from the difference between dry
matter and the ash in the residue.
α-Amino nitrogen (αNH2–N) was determined as an index of total free amino acids
from supernatant samples obtained after protein digestion (figure 9). The supernatants
were filtered with filter paper and then diluted 20x with distilled water. Samples were
tested in duplicate using the methodology described by Oddy (1974). Absorbance was
measured at 570 nm using a spectrophotometer (Thermo SCIENTIFIC, Model
GENESIS 105 UV-VIS).

32
FIGURE 9 DETAILS OF AMINO NITROGEN ( NH2–N) DETERMINATION IN
SUPERNATANT
Di- tri- and tetra peptides are also contained in the supernatants (Dierick, 1991). To
determine the total AAs, 1 ml of supernatant of each sample was hydrolyzed with 1
ml of HCl 12 M 24 h at 100°. The samples were successively cooled at room
temperature, and then 2 ml of NaOH 6 M were added to neutralize the solution. The
total amount of AAs was determined after 20x dilution with distilled water of the
hydrolyzed supernatant as previously described.
Di- tri- and tetra peptides were calculated by determining the difference between AAs
before and after hydrolysis.

33
Implementation of the official methods for the detection of Processed
Animal Proteins (PAPs) in feed
In order to improve the official method for detect constituents of animal origin in
feedstuff tree main experiment have been performed.
Experiment-1 Evaluation of microscopy in combination Image analysis
for MBM characterization: comparison between bovine and swine
material
The official analytical method were combine with image analysis measurements, in
order to discriminate between bovine and swine lacunae. This experiment has been
done in the frame of Progetto di Ricerca Corrente 2010-2013, Id. IZSPLV 12/10/RC
title "Identificazione di specie delle proteine animali trasformate nei mangimi:
sviluppo e confronto di tecniche microscopiche e immunoistochimiche” coordinated
by the National reference laboratory for feed and feed additives (C.Re.A.A IZS
Torino).
For this study, 10 samples of controlled origin and processing were used, containing
bovine (BOV, 5 samples) or swine (SUS, 5 samples) meat and bone meal (Walloon
Agricultural Research Centre - CRA-W, Belgium; VESPA, University of Milan). In
each experiment, the samples were analyzed using the microscopic method (European
Commission, 2013a). Sediment fractions of each sample were observed with a
compound microscope (Olympus BX41, Germany) at several magnifications, in order
to obtain several bone fragment lacunae images at X40 for each sample.
Using a digital camera and image analysis software (Image-Pro Plus 7.0, Media
Cybernetics Inc., Silver Springs, USA), 362 bone fragment lacunae images at X40
were obtained. Images were acquired according to Pinotti (2009). The images were
then processed in order to obtain a monochrome mask for each lacuna (Figure 17). On
each lacuna, 30 geometric variables were measured as previously described (Pinotti et
al., 2013). Using this method, size descriptors and derived shape descriptors can be
identified. The size descriptors, such as area, perimeter, axis minor and major, radius
min and max, etc. (Table 5) represent direct measurements on bone lacunae, and are
also termed as dimension (Primary) descriptors. On the other hand, the derived shape

34
parameters (Table 6) are constructed by combining the various size parameters so that
the dimension units are cancelled out (Russ, 2005). Derived shape descriptors are
represented by V2, V3, V4, V20, V21, V34, V55, V56 and V58. All lacunae
measurement data were collected in Excel files and used for dataset assembly. Tables
5 and 6 report the full list and description of all the 30 geometric variables used.
TABLE 5 SIZE / PRIMARY DESCRIPTORS
ID Variable Unit Description
V1 Area m2 Area of the object, includes area of the hole if ‘Fill
Holes’ is turned on
V11 Axis major m Length of major axis of ellipse
V12 Axis minor m Length of minor axis of ellipse
V13 Diameter max m Length of longest line joining two points of the
object’s outline and passing through the centroid
V14 Diameter min m Length of shortest line joining two points of the
object’s outline and passing through the centroid
V15 Diameter mean m Average length of diameters measured at 2 degree
intervals and passing through the object’s
centroid
V16 Radius max m Maximum distance between object’s centroid and
outline
V17 Radius min m Minimum distance between object’s centroid and
outline
V19 Perimeter m Length of the object’s outline. More accurate than
previous version. Old version now called
perimeter2
V28 Size (length) m Feret diameter (i.e. caliper length) along major
axis of object
V29 Size (width) m Feret diameter (i.e. caliper length) along minor
axis of object
V30 Perimeter 2 m Chain code length of the outline. Also includes
any outlines of holes. Faster but less accurate than
perimeter
V32 Perimeter (convex) m Perimeter of the convex outline of the object
V33 Perimeter (ellipse) m Perimeter of the equivalent ellipse
V35 Polygon area m2 Area included in the polygon defining the object’s
outline. Same polygon as that used for perimeter
V40 Box Width m Width of the object’s bounding box
V41 Box Height m Height of the object’s bounding box
V42 Min feret m Smallest caliper (feret) length
V43 Max feret m Longest caliper (feret) length
V44 Feret mean m Average caliper (feret) length
V57 Convex Area m2 Area of a polygon which has major axis and
minimum axis for sides

35
TABLE 6 DERIVED SHAPE DESCRIPTORS
ID Variable Description
V2 Aspect Ratio between major axis and minor axis of the ellipse equivalent
to object
V3 Area/Box Ratio between area of object and area of its bounding box
V4 Box X/Y Ratio between width and height of object’s bounding box
V20 Radius ratio Ratio between max radius and min radius
V21 Roundness (perimeter2)/(4πarea). Uses ‘perimeter2’ and ‘area’ by default.
Select ‘perimeter’ and ‘area’ for more accurate roundness
V34 Perimeter
ratio
Ratio of convex perimeter to perimeter
V55 Form factor 4πArea/Perimeter2
V56 Roundness 2 4Area/πAxis major2
V58 Solidity Area/Convex Area
Bovine and swine lacunae measurements were analyzed using one-way analysis of
variance (one-way ANOVA) in order to compare means of the two species (GLM
procedure of SAS statistical software 9.3). The analysis has been performed using the
following model:
yij= µj + ij
Where yij are the observations (measurements), µj is the mean of the observations for
the jth group (specie) and ij is the random error. Differences with P values 0.001 were
considered significant. Furthermore, since considerable overlap of the species
distributions of the sizes of individual lacunae was expected (Pinotti et al., 2013),
graphic test (box-plot) for mean and median comparisons has been done. Accordingly,
the BOXPLOT procedure was performed in order to displays the mean, median,
quartiles, minimum and maximum observations and outliers for each single species.

36
Experiment-2 Characterization fish material and comparison with land
animal material
Part A In the same field, a different experiment was performed that investigated
the use of microscopy in combination with image analysis measurements for the
characterization of fish bone lacunae in aquafeed-extracted material. For this
experiment, 6 samples of commercial compound fish feeds containing fish meal were
used (proximate analyses are reported in table 7).
TABLE 7 CHEMICAL COMPOSITION OF AQUAFEED USED IN THE EXPERIMENT 2
Sample 1 Sample 2 Sample 3 Sample 4 Sample 5 Sample 6
DM (g/kg) 94.28 95.5 93.54 94.1 94.59 92.53
CP (g/kg DM) 45.82 42.89 44.42 45.45 42.64 48.82
CF (g/kg DM) 20.64 19.99 16.49 23.25 21.97 18.51
aNDFom
(g/kg DM) 32.28 32.14 43.14 29.07 25.08 35.74
Ash
(g/kg DM) 9.15 9.32 6.4 5.15 6.58 7.19
DM = DRY MATTER; CP = CRUDE PROTEIN; CF = CRUDE FAT; ANDFOM, NEUTRAL
DETERGENT FIBER ASSAYED WITH A HEAT STABLE AMYLASE AND EXPRESSED
EXCLUSIVE OF RESIDUAL ASH.
The samples were analyzed using the microscopic method. Bone fragment lacunae
images were acquired and processed using the same protocols as Experiment 1 and all
lacunae measurements were collected in Excel files and used for dataset assembly.
Part B The results obtained in Part A (fish bone lacunae present in commercial
aquafeed materials) were merged with raw data obtained from authentic samples of
poultry and mammals, used in Pinotti et al. (2013). Specifically, measurements
obtained from 1081 bone lacunae (644 from mammals and 437 from poultry), acquired
from 14 mammalian and 7 poultry samples were merged with the aquafeed dataset
(258 bone lacunae).
Statistical analysis
Part A As in experiment 1, aquafeed 1 to 6 lacunae measurements were analyzed
using one-way analysis of variance (one-way ANOVA) to compare means of the 6
samples (GLM procedure of SAS statistical software 9.3). Furthermore, to compare
the size of lacunae and evaluate the overlap of the six within-sample distributions,

37
boxplots of these distributions were examined. Accordingly, the BOXPLOT procedure
(PROCBOXPLOT) was performed to displays the mean, median, quartiles, minimum
and maximum observations and outliers for each single sample.
Part B Data obtained from fish material (258 lacunae) in aquafeed were
compared with the lacunae from poultry and mammals (644 from mammals and 437
from poultry) using the morphometric descriptors reported in Pinotti et al. (2013). The
analysis was performed following the same model used in experiment 1. The
BOXPLOT procedure (PROCBOXPLOT procedure of SAS statistical software 9.3)
was also performed.

38
Experiment-3 Characterization of insect material by microscopy and
comparison with marine organism material.
Evaluation of an analytical approach for tracing insect material in feed.
Starting from the assumption that insect material is considered of anomalous origin, a
small-scale study in collaboration with the European reference laboratory for animal
proteins (EURL-AP) was launched. Specifically, the microscopy method was tested
for its suitability in characterizing insect materials.
This experiment used 1 sample of pure insect meal material and 1 sample of marine
organism meal consisting of Hermetia illucens larvae and shrimp, respectively.
Shrimp material was selected because previous experience (Veys, personal
communication) indicated some similarities between insect (terrestrial arthropods) and
marine arthropods. Dried pure samples (EURL-AP) were ground with a mortar and
pestle. Subsequently, microscopic slides were prepared using Norland Optical
adhesive 65 as the embedding agent. After drying, each sample was examined using a
compound microscope at several magnifications. Depending on the image quality,
insect/marine organism fragment images were acquired at 10X, 20X or 40X using a
digital camera.
Three staining reagents were also evaluated and used to enhance fragment
identification.
Alizarin red staining EURL-AP (2013) in the Standard Operating Procedure concerning the Use of staining
reagents reports that alizarin red stains bones, fish-bones and fish scales along a range
from bright red to pink. For this reason, alizarin red is authorized as a staining reagent
in Reg. EU 51/2013 (European Commission, 2013c) concerning methods of analysis
for the determination of constituents of animal origin for the official control of feed.
Nevertheless, alizarin red is not specific to bone; it colors bone’s major mineral
constituent, hydroxyapatite. It is also reported to react with calcium phosphates (e.g.,
tricalcium phosphate) (EURL-AP, 2013). Shrimp exoskeleton is naturally rich in
calcium (Watkins et al., 1982) and small amount of calcium is present in Hermetia
illucens larvae (Finke et al., 2013). In light of this, alizarin red staining was tested for
efficacy on both insect and marine material using the following staining protocol.

39
Alizarin red stain Color Index Number 58005, Sigma-Aldrich 3050 Spruce Street,
Saint Louis, MO 63103, USA was used.
A dilute solution consisting of 100 ml water and 2.5 ml 1 M hydrochloric acid was
prepared, and 200 mg Alizarin red were added to this solution.
100 mg of dry sample were transferred into a glass test tube and rinsed twice with
approximately 5 ml ethanol (each time a vortex was used; the solvent was allowed to
settle approximately one minute and then poured off). Before using the staining
reagent, the sample was bleached by adding at least 1 ml sodium hypochlorite solution.
The reaction was allowed continue for 10 minutes. The tube was filled with water, the
sample was allowed to settle for 2-3 minutes, and then the water and any suspended
particles were poured off. The sample was rinsed twice more with approximately 10
ml of water (each time a vortex was used; the solvent was allowed to settle
approximately one minute and then poured off). Two to ten or more drops (depending
on the amount of residue) of the Alizarin red solution was added. The mixture was
shaken and the reaction was let occurred a few seconds. The colored sediment was
rinsed twice with approximately 5 ml ethanol followed by one rinse with acetone (each
time a vortex was used; the solvent was allowed to settle approximately one minute
and then poured off). The sample was placed in an oven at 68°C until completely dry.
Chlorazol Black staining Chlorazol black is a stain with a high affinity for chitin, a unique structural
polysaccharide (a homopolymer of -[1,4]-linked D-N-acetylglucosamine (Thomas et
al., 2008). As reported by Finke (2009) Hermetia illucens is rich in chitin. This
structural polysaccharide in combination with calcium is also one of the main
components in shrimp exoskeletons (Watkins et al., 1982; Sagheer et al., 2009). For
these reasons, chlorazol black stain (Color Index Number 30235, Sigma-Aldrich 3050
Spruce Street, Saint Louis, MO 63103, USA) was tested for both insect and marine
material using the following staining protocol.
Dry samples (100 mg) were transferred into a glass test tube and rinsed twice with
approximately 5 ml ethanol (each time a vortex was used; the solvent was allowed to
settle approximately one minute and then poured off). Before using this staining
reagent, the sample was bleached by adding at least 1 ml sodium hypochlorite solution.
The reaction was allowed to continue for 10 minutes. Next, the tube was filled with
water, the sample was let settle 2-3 minutes, and the water and any suspended particles
were poured off. The sample was rinsed twice more with approximately 10 ml of water

40
(each time a vortex was used; the solvent was allowed to settle approximately one
minute and then poured off). The sample was rinsed once with approximately 5 ml
acetone, vortexed and decanted, let settled, and then the acetone was poured off. A few
drops (depending on the amount of residue) of the chlorazol black solution were added.
The mixture was shaken and the reaction was let occur a few seconds. The colored
sediment was rinsed twice with approximately 5 ml ethanol followed by three rinses
with acetone (each time a vortex was used; the solvent was allowed to settle
approximately one minute and then poured off). The sample was placed in an oven at
68°C until completely dry.
Aniline blue staining (1→3)-β-D-glucans specifically bind to the triphenylmethane dye −Aaniline blue−
(Nakanishi et al., 1974).
1% (w/v) aniline blue stock solution was made by dissolving water soluble aniline blue
(color index 42755 Sigma-Aldrich 3050 Spruce Street, Saint Louis, MO 63103, USA)
in deionized water.
Staining procedure
A few drops (depending on the amount of residue) of the 1% aniline blue solution were
deposited directly on the microscopic slides as embedding agent. Microscopic slides
were mounted using adequate mounting medium and covered with coverslips in
accordance with the SOP established by the EURL-AP and published on its website.
Each coverslip was sealed around its edges with melted VALAP as described below.
To prevent drying of the embedding aniline solution during long-term imaging, each
coverslip was sealed with VALAP. VALAP is a 1:1:1 mixture of Vaseline, lanolin,
and paraffin (beeswax can be substituted for paraffin) prepared by melting and mixing
these ingredients at very low heat. After melting and mixing, the VALAP can be
poured into small containers and stored at room temperature for future use. After
placing the coverslips on the top of the mounting aniline solution, the slide was sealed
by heating a metal spatula over a flame, dipping the spatula tip into the VALAP to
melt and pick up some VALAP, and then spreading the melted VALAP around the
four sides of the coverslip, effectively sealing the agar pad and preventing drying. At
this point, the insect or marine material was ready to be imaged using a microscope to
perform long-term analysis (hours).

41
Aniline blue solution is frequently used for vegetable structure stains. For example,
Schenk and Schikora (2015) quantified callose depositions with a fluorescence
microscope using a DAPI filter. They reported that the optimal excitation wavelength
for aniline blue is 370 nm, and the emission maximum is by 509 nm. Similar results
were reported by Smith and McCully (1978); the fluorochrome fluoresces weakly with
a maximum emission approximately 455 nm, but the fluorescence shifts to longer
wavelengths (500–506 nm) when complexed with isolated β-1,3-glucans, cellulose or
mixed-linked glucans. Thus, the same wavelength ranges were adopted in this study
for insect examination.
Next, each sample was examined under UV light using a compound microscope at
several magnifications. Depending on the image quality, insect/marine organism
fragment images were acquired at 10X, 20X or 40X using a digital camera. We used
the Zeiss AxioVision 3.0 software (at the EURL_AP).

42
Survey study
Investigation of potential areas for Innovation in Research and
Development in the feed sectors
The survey was conducted from July to October of 2014. A questionnaire containing
29 questions (Figure 1) was developed and sent to 113 feed companies consisting of
Italian and Serbian stakeholders in the feed sector, and in particular extra small, small,
medium and multinational companies (referred to later as XS, S, M, L). The
questionnaire was sent to all relevant companies in the Italian and Serbian regional
trade association databases. The questionnaire included three main sections: i)
Company Overview (CO); ii) Products and Process Features (P&P); iii) Research,
Development and Innovation (R&D). The elements for each dimension (CO, P&P and
R&D) and their corresponding questions were selected using contributions from in-
house experts in feed technology, feed and animal nutrition, and economic science.
Briefly, as reported in Table 1, CO included general information such as year of
foundation, company size and owner profile. The P&P section covered types of feed
production (monogastrics or ruminants), production plant machinery, list of feed
additives used, and so forth. Finally, R&D included areas of innovation, perceived
difficulties (e.g., economic and bureaucracy), projects in the past and present, and
consistency of a budget dedicated to R&D.
Statistics The recorded data were analyzed using two different approaches: descriptive statistics
and simple correspondence analysis. Specifically, data collected by open response and
multiple-choice answers in each section (CO, P&P and R&D), were processed to
obtain frequency statistics and used to create graphs of the data. Furthermore, for a
specific set of questions, a simple correspondence analysis was performed. In this trial,
companies were grouped according to their size (see below) and type of production
(feed for monogastric, ruminant, or both) to highlight the relationships between these
features and the areas of innovation in R&D (source/type of raw materials, product
design, industrial process, packaging, marketing, nutritional content of the product,
company organization) in which they had been most innovative in the last 3 years.
Companies were classified into four categories: extra small (XS—less than 20
employees), small (S—21 to 50 employees), medium (M—51 to 100 employees) or
large (L—more than 100 employees). Companies were also classified into four

43
categories by type of feed production: monogastric, ruminant, both, or no-answer. A
simple correspondence analysis with a symmetric normalization model (Beh, 2004;
Hoffman and Franke, 1986; Lebart et al., 1984) was performed using SPSS 22.0
statistical software. This multivariate statistical method is suitable for exploring
relationships between items of two nominal variables. Accordingly, in the present
study, the correspondence analysis considered the company dimension and the type of
feed production (monogastric vs. ruminant) for each feed plant and the areas in which
they had been most innovative in the last 3 years. Differences or similarities can be
interpreted by looking at the position of points in a Cartesian plane, called a biplot.
Briefly, the closer the points are in the plots, the more similar they are considered. In
fact, statistically they are close because they contribute to the constructions of the same
dimension of the graphs. As explained in Gaviglio et al. (2014 and 2015), the results
are evaluated by taking inertia, mass, contribution to dimension, squared correlation
and quality of each point into account. The inertia of a dimension represents the
eigenvalue and reflects the relative importance of each dimension of the biplot. The
mass measures the frequency of each pair of variables in the interviewees’ answers.
The contribution to dimension indicates the importance of each point to the dimension
considered. The coordinates of the point, by definition, are the distances of each point
from the origin of the plot and indirectly indicate whether the considered variables are
significantly correlated with each other. Finally, squared correlation approximates the
accuracy of a point in constructing the axis, while quality approximates the accuracy
of a point considering the whole biplot.

44
Results and discussion
Evaluation of new ingredients in feed formulation and impact of
technology on nutritional value
Evaluation of inclusion of insect material (Hermetia illucens) as is in an
experimental extruded feed
The two lowest fat mixtures were considered not extrudable. By increasing the fat
content from 3.9 to 4.6 %, the torque value decreased significantly to an acceptable
level for extrusion (Table 8). The best extrusion performance was obtained with the
highest fat mixtures (5.4%). The lubricating effect of fat inside the extruder probably
reduced the friction between the dough and the screw elements and between the dough
and the barrel, resulting in a decrease of torque value. For the mixtures with identical
fat content, those containing 30% of total fat from added oil exhibited considerably
higher torque values. Although this aspect of feed extrusion should be deeply
investigated, an effect from the lipid source could be conjectured. For instance, Lin et
al. (1997) observed that fat sources could affect the degree of gelatinization in extruded
pet food production.
TABLE 8 EFFECTS OF FAT ON EXTRUSION PERFORMANCES ON TESTED MIXTURES
Mixture Ratio Fat % Torque value
Ncm Extrudability
Prepupae+wheat 25:75 3.2 200-400 Not extrudable
Prepupae+wheat 25:75 + oil 1 3.9 >400 Not extrudable
Prepupae+wheat 25:75 + oil 2 4.6 100-130 Acceptable
Prepupae+wheat 25:75 + oil 3 5.4 50-100 Acceptable
Larvae+wheat 25:75 4.6 80-120 Best Value

45
Evaluation of the impact of extrusion on the nutritional value and
digestibility of experimental mixtures containing insect material
(Hermetia illucens).
In-vitro digestibility tests
No differences were observed in torque value (which ranged between 80-120 Ncm)
between different barrel temperatures; thus, the mixture used was considered
efficiently extrudable with a screw speed of 100 rpm when the temperature range was
between 60 and 90°C.
With regard to water loss, the highest value was recorded after extrusion at 60°C.
Unexpectedly, water loss decreased as the barrel temperature increased (Table 9).
Observing the extruded material, the surface became smoother and brighter as the
barrel temperature increased, indicating a higher degree of gelatinization. Chiang and
Johnson (1977) confirm this hypothesis: they reported that gelatinization increases
from 35% to 95% when the temperature moves from 65 to 110°C in wheat flour
mixtures containing 24 % water. The formation of an external layer probably
prevented the water loss. By contrast, the material extruded at 60°C presented a coarse
and rough surface, confirming that surface gelatinization was lower; thus, water loss
was not prevented in this case.
TABLE 9 EFFECT OF TEMPERATURE BARREL ON WATER LOSS IN EXTRUDED
MIXTURES
Extr. T° DM water loss %
Control 75.21 -
60 80.23 20.22
70 79.68 18.03
80 79.50 17.31
90 78.94 15.04
EXTR. T° - EXTRUSION TEMPERATURE; DM – DRY MATTER

46
In vitro digestibility extruded mixtures
The extrusion process slightly increased the protein digestibility. The highest increases
(1.05 %) in protein digestibility were recorded when extrusion was performed at 60
and 70°C, although the differences were not significant (Table 10).
TABLE 10 EFFECT OF BARREL TEMPERATURE IN EXTRUDED MIXTURES ON IN-VITRO
PROTEIN DIGESTIBILITY
Rep P dig. %
N° Mean CV %
CTR 3 93.54 0.63
60 3 94.49 0.91
70 3 94.54 0.31
80 3 94.21 0.15
90 3 94.02 0.63
P DIG. – PROTEIN DIGESTIBILITY; CV – COEFFICIENT OF VARIABILITY
Total AA in supernatants reflected the results obtained for P digestibility calculated
from the difference between nitrogen in the sample and the undigested residue. Free
AA values were higher in 60°C extruded mixtures than in controls and tended to
decrease as the barrel temperature increased to 90°C (Table 11). Boye et al. 1997
reported that at temperatures above 80°C, there is a loss of almost all secondary and
tertiary structures. Initially, there is a reversible unfolding step, followed by
irreversible alterations, which include aggregation (intermolecular interactions),
scrambling of disulfide bonds, and chemical modifications of side-chains (Ahern et al.
1985; Shirley, 1992). In this sense, it can be speculated that the irreversible alteration
of protein structures influences protein digestibility and the final breakdown of
peptides in free AAs.

47
TABLE 11 AMINO GROUPS DETERMINATION IN SUPERNATANT AND PROTEIN
DIGESTIBILITY (CALCULATED FROM THE DIFFERENCE BETWEEN TOTAL NITROGEN
IN THE SAMPLE AND NITROGEN FOUND IN THE UNDIGESTED RESIDUE) ON EXTRUDED
MATERIA
μmol/ml
P dig.
%
Tot. AA Free AA pept. AA
CTR 93.54 7.38 1.77 5.61
60 94.49 7.59 2.58 5.01
70 94.54 7.82 2.40 5.43
80 94.21 7.34 2.21 5.13
90 94.02 7.63 1.61 6.01
P DIG. – PROTEIN DIGESTIBILITY; AA – AMINO ACIDS
OM and DM digestibility (Table 16) were higher in extruded mixtures compared to
the control (+ 16.8%). Wide differences between the control and treatments, and low
CVs suggest a statistically significant increase of digestibility due to the extrusion
treatment. The highest value for OM digestibility was recorded when extrusion was
performed at 60°C (95.69%), increasing digestibility by 17.6 %. The expected increase
in OM digestibility was likely due to the gelatinization of starch. As reported in
literature (Lin et al., 1997), during extrusion processes starch gelatinization increases
appreciably (30%) at temperatures close to 60°C.
TABLE 12 EFFECT OF BARREL TEMPERATURE IN EXTRUDED MIXTURES ON IN-VITRO
DM/OM DIGESTIBILITY
Rep DM dig. % OM dig
Mean CV Mean CV
CTR 2 80.99 2.97 81.37 2.86
60 2 95.24 1.78 95.69 1.66
70 2 93.81 0.79 94.18 0.30
80 3 94.98 1.23 95.38 1.26
90 3 94.67 0.46 95.01 0.39
DM DIG. – DRY MATTER DIGESTIBILITY; OM – ORGANIC MATTER DIGESTIBILITY;
CV COEFFICIENT OF VARIABILITY.

48
In light of the results, it can be concluded that 60°C is the best temperature for
extrusion for the tested mixtures to remove the maximum amount of water and increase
digestibility. Increasing the temperature beyond this threshold increases water
retention without affecting digestibility, meaning that such increases are both useless
and counterproductive in term of energy waste.
The low fat limit of 4.6 should be considered to obtain the most extrudable mixtures.

49
Implementation of the official methods for the detection of Processed
Animal Proteins (PAPs) in feed
Experiment-1 Evaluation of microscopy in combination Image analysis
for MBM characterization: comparison between bovine and swine
material
The results obtained (Tables 13 and 14) indicated that out of 30 variables/descriptors
measured on each lacuna, only 15 variables/descriptors were significantly (P<0.001)
different between bovine and swine in terms of overall mean. Of these, 10 were
primary descriptors including major axis, maximum diameter, maximum radius,
perimeter, size length, perimeter 2, perimeter convex, perimeter ellipse, maximum
feret, and mean feret. Five on the other hand were shape derived descriptors: aspect,
area/box, radius ratio, form factor, and roundness. By contrast area, box X/Y, minor
axis, minimum diameter, minimum radius, roundness, size width, perimeter ratio, area
polygon, box width, box height, minimum feret, convex area and solidity did not differ
between bovine and swine. These findings are very close to those observed in other
studies on the same type of material from avian and mammalian by-products (Pinotti
et al., 2007; Campagnoli et al., 2009; Van Raamsdonk et al., 2012; Pinotti et al. 2013).
The results also indicated that 11 variables were bigger in bovine than in swine, except
for area/box, form factor and roundness. Thus, values for all variables/descriptors
measured in bovine were higher (+11% in terms of mean; P<0.001) than in swine. On
the other hand, area/box, form factor and roundness were 11% smaller in bovine than
swine. Our data thus indicate that not only are lacunae in bovine generally bigger than
in swine but also that lacunae in this animal species differ slightly in shape. In fact
several shape descriptors, such as aspect, roundness and form factor suggest that swine
lacunae are more globular than in bovine.

50
TABLE 13 MEAN AND STANDARD DEVIATION (SD) BY SPECIES (BOVINE, BOV; SWINE,
SUS) OF ALL LACUNAE PRIMARY DESCRIPTORS MEASURED.
Variables/
descriptors id unit
BOV
mean BOV sd
SUS
mean SUS sd P value
Area V1 µm2 102.15 33.64 93.85 27.77 0.0105
Axis major V11 µm 18.24 3.30 16.35 3.71 < 0.0001
Axis minor V12 µm 7.33 2.12 7.50 1.67 0.3826
Diameter max V13 µm 18.85 3.54 16.74 3.89 < 0.0001
Diameter min V14 µm 6.74 1.89 6.91 1.46 0.3396
Diameter mean V15 µm 11.30 1.50 10.86 1.37 0.0043
Radius max V16 µm 10.04 1.89 9.04 2.17 < 0.0001
Radius min V17 µm 3.01 0.94 3.09 0.76 0.3364
Perimeter V19 µm 49.91 10.82 45.14 11.15 < 0.0001
Size (length) V28 µm 19.15 3.58 17.11 3.97 < 0.0001
Size (width) V29 µm 8.30 2.39 8.23 1.90 0.7549
Perimeter 2 V30 µm 53.79 11.93 48.62 12.19 < 0.0001
Perimeter
convex V32 µm 44.53 7.10 40.91 7.79 < 0.0001
Perimeter
ellipse V33 µm 42.24 6.27 38.97 6.87 < 0.0001
Polygon area V35 µm2 96.28 32.75 88.48 26.88 0.0134
Box Width V40 µm 14.65 4.80 13.78 4.61 0.0822
Box Height V41 µm 14.18 4.83 12.68 4.23 0.0017
Feret (min) V42 µm 8.17 2.33 8.10 1.80 0.7446
Feret (max) V43 µm 19.20 3.56 17.18 3.95 < 0.0001
Feret (mean) V44 µm 14.30 2.26 13.14 2.48 < 0.0001
Convex area V57 µm2 132.80 43.93 121.96 36.66 0.0109

51
TABLE 14 MEAN AND STANDARD DEVIATION (SD) BY SPECIES (BOVINE, BOV; SWINE,
SUS) OF ALL LACUNAE DERIVED SHAPE DESCRIPTORS MEASURED
Variables/descriptors id BOV
mean BOV sd
SUS
mean SUS sd P value
Aspect V2 2.74 1.06 2.31 0.86 < 0.0001
Area/Box V3 0.54 0.11 0.58 0.09 < 0.0001
Box X/Y V4 1.26 0.80 1.28 0.77 0.7802
Radius Ratio V20 3.76 1.68 3.18 1.46 0.0005
Roundness V21 2.27 0.69 2.00 0.97 0.0033
Perimeter ratio V34 0.88 0.07 0.90 0.06 0.0623
Form factor V55 0.53 0.14 0.60 0.14 < 0.0001
Roundness 2 V56 0.41 0.15 0.48 0.15 < 0.0001
Solidity V58 0.77 0.01 0.77 0.02 0.4597
However, probably 11% of differences are not detectable in routine lab practice,
indicating that only differences can be detected with an image analysis
approach/support. In the case studied in this paper, area and other primary descriptors
that have been recently (Pinotti et al., 2013) proposed as key descriptors in
distinguishing between animal classes (poultry and mammals), were not so effective,
confirming that species identification needs an integrated approach (i.e. a combination
of methods). Furthermore, in the studies in which mammalian and avian materials
(distinguishing between class) have been tested (Pinotti et al., 2007; Campagnoli et
al., 2009; Pinotti et al., 2013), the differences between variables were bigger than those
measured between swine and bovine.

52
FIGURE 10 SELECTED PRIMARY DESCRIPTOR BOX PLOTS, NAMELY: LACUNAE AXIS
MAJOR AND LACUNAE PERIMETER IN BOVINE (BOV), AND SWINE (SUS) SPECIES

53
FIGURE 11 SELECTED DERIVED SHAPE DESCRIPTOR BOX PLOTS, NAMELY: LACUNAE
ASPECT AND LACUNAE ROUNDNESS2 IN BOVINE (BOV), AND SWINE (SUS) SPECIES
This is supported by the more extensive investigation of the present dataset, which was
performed using a box plot procedure. When for each variable mean, median, quartiles,
and outliers were considered, as expected the dataset showed a considerable overlap
54
between species. In this respect, a few variables are presented in Figures 10 and 11.
An analysis of these selected means, medians, and box plots clearly indicated that even
though most of the variables measured were significantly different between bovine and
swine in terms of overall mean, none of them per se is able to discriminate between
species material (i.e. bovine vs swine). These results therefore confirm other findings
(Pinotti et al., 2013) in the field, in which no clear indication of species differences
within classes has been reported.

55
Experiment-2 Characterization fish material and comparison with land
animal material
The results obtained by combining the microscopy method and image analysis for fish
material characterization are reported in Tables 15 and 16. Of the 21 primary
descriptors reported, 8 did not show any difference between samples. Specifically,
diameter mean, radius max, radius min, perimeter (different types) and area polygon
were comparable among the 6 samples. In the case of the other 13 descriptors of the
same group, some significant (P<0.001) differences between samples were observed.
When shape descriptors were considered, the situation did not change. All shape
descriptors related to the radius and diameter were not significant, while Aspect,
Area/Box, Box X/Y, perimeter ratio and roundness2 differed (P<0.001) among the
samples. However, significant differences in observed values were not systematically
distributed across different descriptors. Although there are some significant
differences between means, the boxplots for all the variables showed very substantial
overlaps between the distributions of measurements in the six samples. The boxplots
for axis major and formfactor presented in figures 12 are typical examples.

56
TABLE 15 RESULTS SIZE DESCRIPTORS (PART A)
Sample 1 Sample 2 Sample 3 Sample 4 Sample 5 Sample6
unit mean SE mean SE mean SE mean SE mean SE mean SE
Area µm2 107.11a 4.51 85.79b 4.37 104.23 4.51 97.16 5.68 98.16 4.90 104.85 4.33
Axis Major µm 33.48 1.17 32.34 1.13 30.11 1.17 28.85a 1.47 31.87 1.27 35.02b 1.12
Axis Minor µm 4.64 0.18 3.86a 0.17 5.20b 0.18 4.77 0.23 4.57 0.20 4.59 0.17
Diameter Max µm 36.31 1.34 35.61 1.30 34.68 1.34 31.55a 1.69 35.55 1.45 39.03b 1.28
Diameter Min µm 4.13 0.17 3.59a 0.16 4.52b 0.17 4.26 0.21 4.01 0.18 3.93 0.16
Diameter Mean µm 10.62 0.21 9.88 0.21 10.57 0.21 10.17 0.27 10.38 0.23 10.69 0.20
Radius Max µm 20.02 0.75 19.61 0.72 19.17 0.75 17.77 0.94 19.90 0.81 21.66 0.72
Radius Min µm 1.62 0.09 1.38 0.09 1.81 0.09 1.70 0.12 1.61 0.10 1.45 0.09
Perimeter µm 85.76 3.61 81.74 3.50 87.90 3.61 79.23 4.55 87.94 3.92 93.83 3.47
Size Length µm 37.08 1.33 36.74 1.29 35.46 1.33 32.31a 1.67 36.55 1.44 40.33b 1.27
Size Width µm 6.32 0.34 5.21a 0.33 7.70b 0.34 6.88 0.43 6.55 0.37 6.75 0.33
Perimeter 2 µm 93.72 4.22 88.61 4.09 96.53 4.22 85.77 5.31 98.04 4.58 104.82 4.05
Perimeter Convex µm 77.43 2.70 75.49 2.61 74.72 2.70 68.29 3.40 76.27 2.93 84.01 2.59
Perimeter Ellipse µm 68.89 2.29 66.14 2.22 62.73 2.29 59.91 2.88 65.71 2.49 71.87 2.20
Area Polygon µm 101.92 4.35 80.64 4.22 99.04 4.35 92.00 5.48 93.18 4.73 99.92 4.18
Box Width µm 31.30ac 1.63 24.88 1.58 22.12bc 1.63 23.00 2.06 29.47c 1.77 21.49b 1.57
Box Height µm 18.93a 1.69 25.16ab 1.64 24.80ab 1.69 20.54a 2.13 20.56a 1.84 31.39b 1.62
Feret Min µm 6.35 0.32 5.24a 0.31 7.59b 0.32 6.73 0.41 6.51 0.35 6.72b 0.31
Feret Max µm 37.10 1.33 36.75 1.28 35.47 1.33 32.35a 1.67 36.57 1.44 40.35b 1.27
Feret Mean µm 24.72 0.86 24.09 0.83 23.87 0.86 21.80a 1.08 24.36 0.93 26.80b 0.82
Convex Area µm2 155.16 7.33 123.84a 7.10 155.03 7.33 139.02 9.23 145.56 7.96 158.81b 7.03
SEM, STANDARD ERROR OF MEANS; A,B,C, MEANS WITH DIFFERENT LETTERS DIFFER AT P<0.001

57
TABLE 16 RESULTS SHAPE DESCRIPTORS (PART A)
Sample 1 Sample 2 Sample 3 Sample 4 Sample 5 Sample 6
mean SE mean SE mean SE mean SE mean SE mean SE
Aspect 7.61 0.41 9.00a 0.40 6.18b 0.41 6.41b 0.51 7.46 0.44 8.11 0.39
Area/Box 0.23 0.02 0.18a 0.02 0.27b 0.02 0.28b 0.02 0.22 0.02 0.23 0.02
Box X/Y 2.13a 0.19 1.13b 0.19 1.38 0.19 1.42 0.25 1.63 0.22 1.05b 0.18
Radius Ratio 14.98 1.34 16.01 1.32 12.93 1.34 12.20 1.69 14.49 1.48 18.60 1.30
Roundness 6.08 0.45 7.28 0.43 6.59 0.45 5.99 0.56 7.21 0.49 7.60 0.43
Perimeter Ratio 0.90 0.01 0.92a 0.01 0.86b 0.01 0.87 0.01 0.88 0.01 0.90 0.01
Formfactor 0.20 0.01 0.17 0.01 0.19 0.00b 0.20 0.01 0.19 0.01 0.17b 0.01
Roundeness 2 0.13 0.01 0.11a 0.01 0.16b 0.01 0.15bc 0.01 0.14 0.01 0.12ac 0.01
Solidity 0.70 0.01 0.70 0.01 0.68 0.01 0.70 0.01 0.69 0.01 0.67 0.01
SEM, STANDARD ERROR OF MEANS; A,B,C, MEANS WITH DIFFERENT LETTERS DIFFER AT P<0.001

58
FIGURE 12 BOX-PLOTS DISPLAYING MEAN, MEDIAN, QUARTILES, MINIMUM AND
MAXIMUM OBSERVATIONS AND OUTLIERS FOR AXIS MAJOR AND FORMFACTOR
VALUES MEASURED IN SAMPLES 1 TO 6 IN PART A

59
Comparisons among fish, mammalian and poultry materials are presented in Figures
13, 4, and 15. For 17 of the 21 primary descriptors reported, there were significant
differences in mean between fish and each of the terrestrial materials. Axis Minor and
Diameter Mean did not differ significantly between fish and poultry materials and Area
and Area Polygon did not differ significantly between fish and mammalian materials.
Considering the shape descriptors, 8 of the 9 descriptors were significantly different
in mean in the fish material compared with poultry and mammals; the only exception
was the shape descriptor Box X/Y whose mean did not differ significantly from those
of either of the other materials.
FIGURE 13 GRAPHIC REPRESENTATION OF MEANS AND STANDARD ERROR (SE) BY
CLASS OF SOME (10 OF 21) OF THE SIZE DESCRIPTORS MEASURED IN PART B. AVI =
AVIAN; FISH = FISH; MAM = MAMMALS; * = 10 TIMES THE MEASURED VALUE. THE
MEANS WITHIN MORPHOMETRIC DESCRIPTORS WITH DIFFERENT LETTERS (A, B, C)
DIFFER SIGNIFICANTLY (P < 0.001)

60
FIGURE 14 GRAPHIC REPRESENTATION OF MEANS AND STANDARD ERROR (SE) BY
CLASS OF SOME (11 OF 21) OF THE SIZE DESCRIPTORS VALUE MEASURED IN PART B.
AVI = AVIAN; FISH = FISH; MAM = MAMMALS; * = 10 TIMES THE MEASURED
VALUE. THE MEANS WITHIN MORPHOMETRIC DESCRIPTORS WITH DIFFERENT
LETTERS (A, B, C) DIFFER SIGNIFICANTLY (P < 0.001)
FIGURE 15 GRAPHIC REPRESENTATION OF MEANS AND STANDARD ERROR (SE) BY
CLASS OF THE SHAPE DESCRIPTORS MEASURED IN PART B. AVI = AVIAN; FISH =
FISH; MAM = MAMMALS; * = 10 TIMES THE MEASURED VALUE. THE MEANS WITHIN
MORPHOMETRIC DESCRIPTORS WITH DIFFERENT LETTERS (A, B, C) DIFFER
SIGNIFICANTLY (P < 0.001)

61
An analysis of the box plots showed overlap of the distributions for some descriptors
but good separation for others. When fish material was compared to mammalian and
poultry materials, a substantial overlap of the distributions of the measurements was
observed for eleven morphometric descriptors. These were Area, Box X/Y, Axis
Minor, Diameter Minor, Diameter Mean, Radius Minor, Size width, Area Polygon and
Feret Minor Convex Area among the primary descriptors, and Perimeter ratio among
the secondary ones. In contrast, very little overlap was observed for the other nineteen
descriptors. In more detail, among primary descriptors, fish material showed very little
overlap with land animal material for aspect, area box, axis major, diameter max,
radius max, perimeter, size length, perimeter 2, perimeter convex and perimeter
ellipse, Feret max and Feret mean. For secondary descriptors, all except perimeter ratio
showed very little overlap between fish material and land animal materials. Specific
examples are presented in Figures 16.

62
FIGURE 16 BOX PLOTS DISPLAYING MEAN, MEDIAN, QUARTILES, MINIMUM AND
MAXIMUM OBSERVATIONS AND OUTLIERS FOR AXIS MAJOR AND FORMFACTOR
VALUES MEASURED IN AVIAN, FISH AND MAMMALIAN SAMPLES IN PART B. AVI =
AVIAN; FISH = FISH; MAM = MAMMALS

63
As expected, aquafeed composition was quite homogeneous among the 6 samples
considered in the present experiment. Although 18 of the 30 descriptors measured on
fish lacunae showed significant differences in mean between the 6 samples (Tables
13-14), the box plot analysis showed a substantial overlap between the 6 for the within-
sample distributions of compound fish feeds analyzed in part A. These findings may
be linked to the homogeneity of the fish meal used in aqua feed formulation (Ayadi et
al., 2012). Indeed fish meal used in aquafeed production derives principally from
pelagic fish and is then further treated to obtain a limited variety of standardized meals
for the market. In addition, fish meal is produced by a few major players, using fish
coming from three macro regions: Latin America (Peru and Chile), Scandinavia
(Denmark and Norway) and Iceland (FAO Globefish, 2014). This scenario may
contribute to standardization of fish meals used in compounded formulations, even
though that is merely a speculative assumption. Aquaculture feeds are made using
small pelagic forage fish, in part to produce farmed fish with levels of omega-3 long
chain polyunsaturated fatty acids that are equivalent to those of their wild counterparts
(Tacon and Metian, 2008). These forage fish come from a global supply that is
expected to remain static or decrease over time (Tacon and Metian, 2008; Deutsch et
al., 2007), while its features (in term of fish bone lacunae) seem to be quite stable.
A further result obtained in the present experiment is a detailed characterization of fish
material in aquafeed. Observed values for some specific descriptors such as those
related to axis, length and size, diameter, and Feret have indicated that fish bone
lacunae in the analyzed samples were characterized by a very large length-width ratio.
In the same way, Roundness 2, which is a derived shape descriptor calculated by
combining area and axis major, provides a further indication about fish material
features. The overall mean of the shape descriptor Roundness 2 in the fish samples
was close to zero. Roundness 2 has a value of 1.00 for an ideal circle or a “circle like”
shape. In contrast, smaller values indicate a greater departure from this ideal (Neal and
Russ, 2012). Thus, the very low values observed in the present experiment in all the
analyzed samples indicate elongated lacunae (high axis major - axis minor ratio),
although a contribution from extended perimeters in fish lacunae cannot be excluded
(see below). These findings imply a flattened and elongated to oblong shape for fish
lacunae. This is in line with other authors (Gizzi et al., 2003; Jørgensen and Baeten,
2012) who have described fish bone lacunae as elongated with a clear fusiform net of
canaliculae, although in several species lacunae are linear without visible canaliculae.

64
In this respect, IA seems to support the narrative shape description of fish bone lacunae
in the literature. One more interesting shape descriptor for fish lacunae is represented
by formfactor. The overall mean of formfactor in the fish samples is 0.18. Formfactor
is a shape descriptor based on measurements of area and perimeter. Briefly, for shapes
with identical areas the value of formfactor decreases as the apparent irregularity of
the boundary and depth of indentations (and thus the length of the perimeter) increases.
In this sense, fish bone lacunae seem to be star-shaped. Moreover, this numerical
evidence is probably attributable to the presence of a fusiform net of canaliculae,
confirming the narrative description reported by Gizzi et al. (2003). Therefore,
combining these two shape descriptors, it can be concluded that the fish bone lacunae
analyzed in the present experiment appeared elongated and/or star-shaped (figure 17).
FIGURE 17 EXAMPLES OF MONOCHROME MASK OBTAINED USING THE IMAGE
ANALYSIS SOFTWARE (IMAGE-PRO PLUS 7.0; MEDIA CYBERNETICS INC.,
ROCKVILLE, MD, USA) FROM FISH BONE LACUNAE
With regard to part B, for the “length” descriptors (Axis major, Diameter max, Radius
max, Size length, Box Height, Feret max), values from fish were twice as large as those
from terrestrial animals, indicating that bone lacunae are significantly longer in fish
than in terrestrial animals. Moreover, boxplot analysis indicated that the distributions
of these size descriptors in fish had very little overlap with those from the terrestrial
animals, suggesting these specific descriptors as valid markers for identifying and
discriminating between fish and terrestrial particles. Moving to shape descriptors, for
several of them (aspect, radius ratio, roundness, formfactor and roundness2) a large
gap between fish and mammalian and avian material has been observed. For example,
the shape descriptor Roundness 2 indicated that fish bone lacunae are more elongated
than the lacunae of terrestrials (mammalian and poultry), which are oval to elliptical.
Considering the descriptor formfactor, a large distance was observed between values

65
recorded in fish and terrestrials. This last evidence suggests that the shape descriptor
formfactor could represent a valid marker for fish material identification.
66
Experiment-3 Characterization of insect material by microscopy and
comparison with marine organism material.
Evaluation of an analytical approach for tracing insect material in feed.
Hermetia illucens larvae materials are shown in Figure 19, 21, 23 and 24. The structure
observed in Hermetia illucens material was similar to the palisade cells of canola
described by Makowsky et al. (2011). They are four or five sided with thick walls and
a broad lumen. This lumen, as observed in surface view, is wider than the thick walls.
The structure of the thick walls gives the cells a honeycomb-like appearance. The color
of these cells ranges from yellow to burgundy, with the majority having an orange-red
shade. Nevertheless, in insect material, cell-like structures are four or five sided and
the color ranges from gray-cream to brown and dark. Bristles, generally long, narrow
and yellow, have also been observed in Hermetia illucens material. Notably, bristles
can present in different colors, probably depending on the amount of air trapped inside
them. From the proximal part to the distal one outside to the inside, color moves
through yellow shades, followed by a black and yellow line in the middle. Yellow
silk—a rather small part of the interior—is completely black. As mentioned before,
the black color indicates the presence of air bubbles trapped within the bristles. In light
of this, it is important to note that HI bristles could be confused with the other vegetable
structures. As described by Klein and Marquard (2005), trichomes of certain plants,
such as wheat, are thickened, conical, straight or slightly curved. Thus, particular
attention should be paid when insect material is included in mixtures with vegetables
(i.e., compound feeds) to avoid errors in identification. As reported above, alizarin
staining was also tested on insect (Hermetia illucens) material. As mentioned above
alizarin red colors several calcium mineral forms. It is reported that this staining reacts
principally with hydroxyapatite (contained in bone) but also with calcium phosphates
(e.g., tricalcium phosphate) (EURL-AP, 2013). Accordingly, the hypothesis behind
this experiment was that this insect species could be colored using a calcium specific
stain. Indeed calcium content in Hermetia illucens larvae is higher than 9% on dry
matter basis (Finke et al., 2013). Nevertheless, after staining Hermetia illucens
material with the alizarin solution, no coloration was observed. This phenomenon
probably occurred because the amount of calcium are present in HI larvae was too

67
small or possibly that the mineral form of calcium contained in this insect species does
not react with alizarin red.
With regard to the chlorazol black stain test performed on Hermetia illucens, as
expected, the insect material stained dark black. As described above, chlorazol black
is a stain with a high affinity for chitin (Thomas et al., 2008), which is abundant in
Hermetia illucens (Finke, 2009).
Insect material stained with aniline blue did react with UV light. Insect fragments
showed a brilliant light-blue coloration. As indicated by several authors, aniline blue
(triphenylmethane dye) specifically binds (1→3)-β-D-glucans. Nevertheless, no
evidence in the literature reporting the presence of (1→3)-β-D-glucans in Hermetia
illucens was found. On the other hand, Hershberger (1946 and 1948) proposed using
aniline blue either alone or in combination with other staining (Safranine or Fuchsin
basic) as a differential stain for insect tissues, but in their study, dilute staining solution
was injected in into the live insects to color only specific organs, making them stand
out against the general white background. Notably, in that same study, no UV light
was used, and only internal organs were colored, which probably indicates an aniline
blue stained compound different from chitin, which is present in the exoskeleton. In
light of these findings, it can be concluded only that the aniline blue staining protocol
tested here and observed with UV light can stain Hermetia illucens material.
Shrimp material is presented in Figure 18, 20 and 22. These fragments were
characterized by the presence of more-or-less transparent particles of the chitinous
shells. These particles showed very fine lines intersecting at random angles and
extending across the whole particle. Occasionally, lines would connect across several
other lines, forming triangles and other geometric shapes. In some areas, there may be
cross-hatching. These findings are in line with the description of krill and shrimp meal
reported by Marowski et al. (2011). In Figures 20 and 22, several circle-shaped holes
can be observed. The chlorazol black and alizarin red stain tests colored the shrimp
fragments dark black and reddish-pink, respectively. These results were also expected
results because the shrimp exoskeleton is naturally rich in both chitin and calcium
(Watkins et al., 1982; Sagheer et al., 2009).
By combining these results obtained on a small set of samples and observations, it can
be suggested that chlorazol black stain can be efficiently used to mark Hermetia
illucens material, with the proviso that bristle structure morphology (i.e., bristles)
appear very similar to some vegetable structures and represent a limit to the accuracy

68
of these techniques in insect material identification in complex matrices such as
compound feed. Alizarin red does stain shrimp fragments but did not stain the tested
insect material, indicating a possible approach for discriminating between terrestrial
and marine arthropods.
FIGURE 18 SHRIMP MEAL FRAGMENT,
40X MAGNIFICATION. EMBEDDING
AGENT: NORLAND OPTICAL ADHESIVE
65. BRIGHT FIELD
FIGURE 19 HERMETIA ILLUCENS
FRAGMENT, 20X MAGNIFICATION.
EMBEDDING AGENT: NORLAND OPTICAL
ADHESIVE 65. BRIGHT FIELD.
FIGURE 20 SHRIMP MEAL FRAGMENT,
20X MAGNIFICATION. ALIZARIN STAIN.
EMBEDDING AGENT: NORLAND OPTICAL
ADHESIVE 65. BRIGHT FIELD.
FIGURE 21 HERMETIA ILLUCENS
FRAGMENT, 20X MAGNIFICATION.
ALIZARIN STAIN. EMBEDDING AGENT:
NORLAND OPTICAL ADHESIVE 65.
BRIGHT FIELD.

69
FIGURE 22 SHRIMP MEAL FRAGMENT,
20X MAGNIFICATION. CHLORAZOL
BLACK STAIN. EMBEDDING AGENT:
NORLAND OPTICAL ADHESIVE 65.
BRIGHT FIELD.
FIGURE 23 HERMETIA ILLUCENS
FRAGMENT, 20X MAGNIFICATION.
CHLORAZOL BLACK STAIN. EMBEDDING
AGENT: NORLAND OPTICAL ADHESIVE
65. BRIGHT FIELD.
FIGURE 24 HERMETIA ILLUCENS
FRAGMENT, 5X MAGNIFICATION.
ALIZARINE BLUE SOLUTION. UV LIGHT.

70
Survey study
Investigation of potential areas for Innovation in Research and
Development in the feed sectors
One hundred and thirteen feed companies were contacted. Of these, 37% responded
by filling out the questionnaire, which generated 464 data points for Italian (IT)
companies and 319 records for Serbian (RS) feed companies. The largest contribution
was from small companies (45% of total responses) and the least from medium-size
companies (40% of total responses). However, the response proportions are
representative of the actual feed sectors in both countries.
The results are presented as CO, P&P and R&D. Regarding the CO, the results
obtained indicated that Serbian firms were founded more recently than the Italian ones
(mean ± SD, 1980 ± 30 and 2000 ± 14 years, for IT and RS, respectively). Serbian
industries are all led by males (100%); in contrast, Italian industries are led by both
genders (63% and 38% male and female, respectively). In both countries, feed
production is based mainly on use of raw materials such as ground corn and soybean
meal. Responding Italian industries were mainly focused on ruminant feed production,
whereas those in Serbia produce feed for all species, which accounts for the large
differences in pig and poultry feed production shown in Figures 25 and 26. There was
a high rate of responses for the “other” category, which likely includes fish and pets.

71
FIGURE 25 THE PRODUCTION IS MAINLY BASE ON THE USE
FIGURE 26 TYPE OF FEED PRODUCTION
In both countries, the use of feed additives is a common practice; 91% and 90% of
responders (in Italy and Serbia, respectively) use feed additives in their formulations.
When types of additives are considered, some differences for specific groups of
additives were observed in both countries (Figure 27). The largest differences were
observed for antioxidants, enzymes, probiotics and flavoring, although precise
information within each class was not recorded.

72
The differences in additives could be related to differences in the species for which
compound feed is produced.
FIGURE 27 FEED ADDITIVES USED
Considering R&D in the past (Figure 28), 18% of Italian responders had not planned
any budged for R&D, while for Serbian industries this percentage reached 45%. The
main reason for this difference can be attributed to the fact that in both countries
informal activities in R&D have been done in the past and their proportion could have
been higher in Serbia than in Italy.

73
FIGURE 28 DISTRIBUTION OF BUDGET FUNDING SOURCES IN THE PAST 3 YEARS
When the R&D activities were tested, 64% of Italian responders chose industrial
processes as one of their activities, while 82% of Serbian activities participate in new
product development.
For both counties, marketing strategies are important, with the majority of companies
reporting that product quality, market image, new markets, and the safety of those
markets are a part of their innovation activities. The main differences between the
Italian and Serbian industries are related to efficiency including security, profit and
cost reduction (Figure 29). These differences could be due to the more recent
establishment of the Serbian companies.
.

74
FIGURE 29 GOALS OF INNOVATION ACTIVITIES IN FUTURE
In general, these observations seem to reflect the different maturities and priorities of
the feed market in the two tested areas. Approximately 20% of the feed industries
consulted will not make any investment in R&D in the near future (next 3-5 years),
but there will be unofficial R&D. This feature is common for both countries, in contrast
with the differences in past investments. This discrepancy with the past is probably
due to the need for Serbian companies to adapt their current production to new
markets, such as the EU, which require new regulations, quality and safety standards.
When type of feed production (monogastric, ruminants, etc.) was considered, research
and development of new products in the dairy and beef cattle and pet sectors are the
main areas in which Italian companies will invest in the next 3-5 years. The Serbian
and Italian scenarios looks similar in regard to research and development of new
products, extension/upgrade of production lines, new production technologies and
control over production processes. The only exception is in advertising investment.

75
FIGURE 30 MAIN DIFFICULTIES ENCOUNTERED DURING INNOVATION ACTIVITIES
High costs of innovation, paperwork/bureaucracy, too-restrictive regulations and lack
of government incentives were the main difficulties faced by industries in both
countries (Figure 30). The main difference between the two countries is that
organizational problems seem to be of more concern to Serbian companies.
The data for the correspondence between company size and areas of innovation in the
last 3 years are shown in table 17; a graphical representation is presented in Figure 31.
A significant correspondence (P < 0.05) was found among the considered categories,
i.e., between company size and R&D target. The first two dimensions account for 87.5
% of the total inertia, using a considerably satisfactory quota of the raw information.

76
TABLE 17 STATISTICS OF THE BI-PLOT IN FIGURE 31
Category Mass Coordinate
Inertia
Contribution to Squared correlation
dimension
1 2 1 2 1 2 Quality
Company size
XS .361 .263 -.711 .080 .060 .501 .129 .829 .958
S .012 4.108 2.877 .131 .489 .273 .646 .278 .925
M .181 -1.010 .473 .103 .443 .111 .744 .143 .888
L .446 .085 .307 .035 .008 .115 .038 .432 .470
Area of innovation in R&D
raw .084 1.709 1.050 .139 .592 .255 .735 .244 .978
des .157 -.271 .088 .005 .028 .003 .889 .082 .970
ind .181 -.734 .280 .060 .234 .039 .677 .086 .763
pac .133 .438 -.681 .038 .061 .168 .278 .590 .868
mkt .120 -.279 .653 .042 .023 .141 .093 .447 .540
nut .157 -.271 .088 .005 .028 .003 .889 .082 .970
org .169 .292 -.920 .060 .035 .391 .100 .870 .970
FIGURE 31 BIPLOT – CORRESPONDENCE BETWEEN COMPANY SIZE AND AREA OF
INNOVATION IN R&D

77
The biplot in figure 31 shows a substantial differentiation among company size
categories. In general, all categories, i.e., XS, S, and M, were clearly distinguishable
from one another. This difference was exacerbated for the case of the S category,
which was the smallest category considered in the study. By contrast, the L category
was close to the origin, indicating a limited ability to distinguish one large company
from another. By combining company dimension and areas of innovation, it was
observed that the XS category was extremely close to the packaging (pac) and
organization (org) points. This result indicates that XS firms have the most similar
innovation in pac and company organization. In contrast, M is close to ind, indicating
that medium firms are the most innovative in industrial processes. Large firms differ
in the first two categories; indeed, as shown in the biplot, L is placed close to des and
nut, indicating that they have innovated the most in product design (des) and nutritional
content (nut) in the recent past.
The correspondence analysis figures (Table 17) show that XS and L reported a mass
value of 0.36 and 0.45, respectively. As reported by Hoffman and Franke (1986), the
mass is a weight of the number of times each variable was reciprocally connected by
responders. Accordingly, we can conclude that XS and L are the most represented
categories. On the other hand, the mass value of S was very low, probably due to the
sample size. Considering the contribution to the dimensions of pac and org, in
dimension 2, together they account for more than 0.42, indicating that packaging and
company organization are both strategic in defining research and development efforts
in XS firms. Notably, the raw component (research and development devoted to new
ingredients) was characterized by high contribution to dimension and low mass values.
This combination would suggest that even though raw material can be considered
relevant in defining its position in the biplot (contribution to dimension), its mass is
very low, which indicates that few companies in any size category innovated in raw
material supply or uses in the past 3 years.
The data for the correspondence between type of production and the areas in which
companies have performed the most innovation in the last 3 years are shown in Table
18 and graphically presented in Figure 32. No significant correspondence (P > 0.05)
was found among the categories considered. Nevertheless, the first two dimensions
account for 81.6 % of the total inertia. The map in Figure 32 does not show any
substantial differentiation among company categories (type of feed production).
Indeed, most of the points are condensed within a single area, indicating no

78
differentiation. Moreover, NOANSWER and RUM are isolated from the others
indicating no correspondence with any points.
TABLE 18 STATISTICS OF THE BIPLOT IN FIGURE 32
Category Mass Coordinate
Inertia
Contribution to Squared correlation
dimension
1 2 1 2 1 2 Quality
Type of feed production
MON .292 .289 -.588 .050 .065 .371 .183 .553 .736
RUM .079 -1.941 -.553 .119 .792 .088 .929 .055 .984
BOT .573 .193 .235 .029 .057 .116 .277 .299 .576
NOA .056 -.754 1.434 .064 .085 .425 .186 .489 .675
Area of innovation in R&D
raw .090 -.846 -.616 .040 .172 .125 .602 .232 .834
des .146 .595 -.067 .023 .138 .002 .825 .008 .833
ind .180 .264 .658 .031 .033 .286 .150 .679 .828
pac .135 .666 -.900 .063 .160 .402 .354 .472 .826
mkt .124 .563 .314 .035 .105 .045 .421 .095 .516
nut .157 -.606 .432 .034 .154 .108 .635 .234 .869
org .169 -.726 -.228 .036 .237 .032 .932 .067 .999
FIGURE 32 BIPLOT – CORRESPONDENCE BETWEEN TYPE OF FEED PRODUCTION AND
AREA OF INNOVATION IN R&D

79
In general, combining the results and the answers obtained in the present survey
suggests that, as expected, the main concerns in both countries are related to the
economic balance between production costs and benefits. Indeed, the research and
development needs manifested by the survey were focused on cost reduction, reducing
energy consumption, improving quality, improving market image, development of
new markets and satisfying market demand. Some small differences exist between the
two countries—probably due to the greater maturity of the market in Italy versus its
potential in Serbia. This seems to be confirmed by the Italian responders, for whom
product quality is a further aspect that has been considered for R&D. However,
matching the “innovation” needs manifested in the present study with literature and
position papers from the feed sector and its associations (FEFAC, 2014; Connely,
2013) it is evident that some differences exist. Innovation through technological
advances, development of novel ingredients, improved feed safety, increased
automation and sustainability are the key factors not only according to feed
associations (e.g., FEFAC) but also for multinational and large industries with
predominant roles in the feed market (Connely, 2013). In the present study however,
implementing automation, which has been proposed as a key innovation element for
producing more feed and helping to ensure traceability, quality and biosecurity, was
not mentioned by the companies involved in this survey. Aspects such as automation
in combination with other technological advances in feed plants such as real-time
automated verification systems, which have been considered as milestones for feed
industries (Connelly, 2013), were not mentioned by either IT or RS feed companies.
The same situation has been observed for the “new ingredients”. Actually, for both
Italian and Serbian feed companies the concept of resercah and innovation in new
ingredients like insect, has not been mentioned. This is quite surprising since the
general publich as well as the sector is sensibiklized to this themes are reported in
different new papaers, magazines and on television. These discrepancies might be
attributable to the sampled companies, which were primarily classified into the small
and medium dimensions. In this segment of the feed sector, therefore, the research and
development needs are more “basic” and are focused on the products and the main
inputs (raw materials, energy etc.). Machinery and plant obsolescence are still relevant
issues, but probably not over the short term, as respondents reported.

80
Conclusions
This PhD research project focused on the use of innovative technologies in feed
production and formulation. Several aspects in the field of feed production were
investigated: i) evaluation of new ingredients in feed formulation and the impact of
technology on nutritional value, ii) improvements in the official methods for detecting
processed animal proteins (PAPs), and iii) investigation of the innovation needs in
research and development in the feed industry. Over the duration of my PhD program,
I had the opportunity to address several different topics in collaboration with other
institutions and laboratories, including Ghent University, the European Union
Reference Laboratory for the detection of Animal Proteins in feedstuffs (EURL-AP),
the National Reference Laboratory for Feed and Feed Additives (C.Re.A.A IZS
Torino) and the Institute of Food Technology of Novi Sad, Serbia (FINS). By
combining the results obtained in the various studies and trials, three main conclusions
can be drawn.
Considering the technological aspects of including Hermetia illucens fresh material in
an experimental extruded feed, the results vary. This study considered not only the
technological aspects related to feed formulation and the extrusion process but also
their impact on digestibility. In the extrusion experiment, increasing the blended fat
content (up to 5.4%) reduced the NTV by four times (<100 Ncm) compared to 3.2 and
3.9% fat mixtures. The best performing mixture was larvae + wheat 25:75 (no added
oil), containing 4.6% fat. When different barrel temperatures were considered for the
same blend, no substantial effect on water loss was observed. Processing the mixture
by extrusion increased OM digestibility by 13%, but not PD, compared to the untreated
(no extrusion) mixture. Extrusion temperature did not affect either OM digestibility or
PD. Extrusion can contribute to increasing OM digestibility in insect-containing feed
blends. These results therefore indicate that that HI fresh material can be efficiently
included in experimental extruded feed. Observation suggested that specific attention
should be paid to the lipid content. Indeed, when the lipid content is lower than 4.6%,
mixtures are not extrudable. Fat content in the mixture is a key variable that should be
defined for the extrusion process. However, the present results were obtained at the
lab scale and need to be confirmed in a large-scale pilot plant.

81
Moving to the second topic trial, as mentioned above, starting on 1 June 2013
(European Commission, 2013b), processed animal proteins (PAPs) from non-
ruminants have been re-authorized for use as feed or feed ingredients in aquaculture.
This is clearly a first step toward the re-introduction of non-ruminant PAPs not only
in aquafeed but also in feed for poultry and pigs (IFFO, 2013), which could also enable
the EU to decrease its dependence on other sources of protein (European Commission,
2010). To open the way to a possible easing of the regulations a consistent technique
for identifying and quantifying levels of PAP in compound feeds that could be used
by the member states analytical laboratories must be developed. The results obtained
from microscopy trials could help drive the re-introduction of non-ruminant PAPs in
feed. Accordingly, combining the official method (microscopy) with image analysis
to detect constituents of animal origin in feedstuffs was investigated as an innovative
tool for discriminating between bovine and swine lacunae. In light of the results
obtained here, we conclude that microscopy methods—even if improved—are not able
to meet all the requirements for the accurate identification of prohibited ingredients of
animal origin, and therefore, a combinatory approach is recommended. In the same
field, another experiment aimed at investigating the use of microscopy in combination
with image analysis measurements for the characterization of fish bone lacunae in
aquafeed-extracted material was performed. In this case, the results showed that using
a combination of light microscopy and image analysis, fish material in aquafeed
appears quite homogenous in term of bone features. Moreover, by selecting specific
markers, fish material can be efficiently distinguished from avian and mammalian
materials. Still, a larger dataset is needed for an exhaustive evaluation. The same
analytical approach was evaluated for the characterization of insect materials (i.e., pure
insect meal). The first basic assumption was adopted for this study was the “absence
of bone lacunae” in insect material. Starting from this assumption, this study’s results
indicated that specific stains can be used to efficiently mark insect fragments
(Hermetia illucens) material. Specifically, the present work tested alizarin, chlorazol
black and aniline blue. In general, the results indicate that any of these specific stains
can be recommended as gold standards, even in combination. Furthermore, the present
work has also shown that mis-classification between shirmp and insect materials (from
Hermetia illucens) can occur—but again, using a specific stain (alizarin) can help in
distinguishing the two materials. In contrast, some similarity with vegetable structures
was observed, representing a limit in insect material identification in complex matrices

82
such as compound feed. However, the same problem of similarity has also been
encountered for other animal materials in feedstuffs. Notably, this experiment was a
preliminary investigation based on a limited number of pure samples, thus further
investigation based on a complex matrix (compound feed, and eventually, extruded
feed) is required.
The last study carried out here concerned research and development efforts in the feed
sector and their implications for innovation (innovation needs). To address these issues
a targeted survey was performed in two countries: Italy and Serbia. Although these
two countries are not fully representative of the entire European feed sector, Italy is
the sixth largest compound feed producer in the EU (USDA, 2015), and Serbian feed
production is among the largest in the Balkan area (Djuragic, 2014). Matching the
“innovation” needs as manifested in the present study with literature and position
papers from the feed sector and its associations (FEFAC, 2014, Connely, 2013), it is
evident that some differences exist. Innovation through technological advances, new
ingredients, improvements in feed safety, increased automation and sustainability are
the key factors not only according to feed associations (e.g., FEFAC) but also for large
multinational industries with a predominant role in the feed market (Connely, 2013).
In the present study, however, the search for new ingredients such as insect material,
which has been proposed as a key element for the near future in Europe (Insects to
Feed the World Conference, 2014; FAO 2013; PROteINSECT, 2015), was not
mentioned by the companies involved in the survey. This may be attributable to the
predominantly small and medium sizes of the surveyed companies. In this segment of
the feed sector, research and development needs are more “basic” and are focused on
the products and the main inputs (classical raw materials, energy cost etc.). These
results were also confirmed using simple correspondence analysis as an
alternative/innovative tool for questionnaire analysis. As expected, the results show
that innovation focus is related to a company’s size. This aspect is particularly evident
for extra-small companies. However, no correspondence was observed between type
of production and area of innovation.
Based on the present research work, and in line with some position papers on this
matter (Insects to Feed the World Conference, 2014) a wide range of socio-economic
opportunities based on using insects are accessible at every scale of production in both
developed and developing countries. These include creation of jobs, enterprise

83
development, food and animal feed production, organic waste processing and
increased global trade. In spite of the advantages, several major challenges need to be
addressed as well, including the legal status, raising awareness among the general
public, ensuring the safety and quality of insect material for both food and feed,
improved methods of analysis for characterizing insect meals, identification and
traceability.
84
References
1. AACC International. Based on AOAC Method 991.43 “Total, Soluble, and
Insoluble Dietary Fiber in Foods” (First Action 1991) and AACC Method 32-
07.01 “Determination of Soluble, Insoluble, and Total Dietary Fiber in Foods
and Food Products” (Final Approval 10-16-91. AACC International, St. Paul,
MN, U.S.A.
2. Aarnink A.J.A., Keen A., Metz J.H.M., Speelman L., Verstegen M.W.A.,
1995. Ammonia emission patterns during the growing periods of pigs housed
on partially slatted floors. Journal of Agricultural Engineering Research 62,
105–116.
3. AgroNotizie. 2015. Meno mangimi in Europa. Available at:
http://agronotizie.imagelinenetwork.com/zootecnia/2015/06/19/meno-
mangimi-in-europa/44581
4. Ahern TJ, Klibanov AM. The mechanisms of irreversible enzyme inactivation
at 100°C. Science 1985, (228) 1280-9.
5. Al Sagheer F.A., Al-Sughayer M.A., Muslim S., Elsabee M.Z. 2009.
Extraction and characterization of chitin and chitosan from marine sources in
Arabian Gulf. Carbohydrate Polymers 77, 410–419.
6. Anand H., Ganguly A., Haldar P. 2008. Potential value of acridids as high
protein supplement for poultry feed. International Journal of Poultry Science
7, (7) 722-725.
7. ANSES (French Agency for Food, Environmental and Occupational Health
and Safety), 2015. Opinion on the use of insects as food and feed and the review
of scientific knowledge on the health risks related to the consumption of
insects. Available at:
https://www.anses.fr/en/documents/BIORISK2014sa0153EN.pdf.
8. AOAC (Association of Official Analytical Chemists), 1997. Official Methods
of Analysis, pp. 16–17 (Chapter 16). Baker, J.E., Woo, S.M., Nelson, D.R.,
Fatland, C.L., 1984. Olefins as major components of epicuticular lipids of three
Sitophilus weevils. Comparative Biochemistry and Physiology 77B, 877–884.
9. Arango Gutiérrez G.P., Vergara Ruiz R.A. and Mejía Vélez H. 2004. Analisis
composicional, microbiológico y digestibilidad de la proteína de la harina de
larvas de Hermetia illuscens L. (Diptera: Stratiomyiidae) en Angelópolis-

85
Antioquia, Colombia. Revista Facultad Nacional de Agronomía, 57, (2), 2491-
2500.
10. Arrese E.L. and Soulages J.L. 2010. Insect fat body: energy, metabolism, and
regulation. Annu. Rev. Entomol. 55, 207–225.
11. Athenstaedt K. & Daum G. 2006. The life cycle of neutral lipids: synthesis,
storage and degradation. Cell. Mol Life Sci. 63, 1355–69.
12. Ayadi F.Y., Rosentrater K.A. and Muthukumarappan K. 2012. Alternative
Protein Sources for Aquaculture Feeds. Journal of aquaculture feed science and
nutrition. 4 (1): 1-26
13. Balasubramanian, A., Jayas, D.S., Fernando, W.G.D., Li, G., White, N.D.G.
2007. Sensitivity analysis of DNA fingerprinting technique for detecting insect
fragments in wheat flour. Canadian Biosystems Engineering 49, 41-45.
14. Barroso F.G., de Haro C., Sánchez-Muros M.J., Venegas E., Sánchez A.M.,
Bañón C.P. 2014. The potential of various insect species for use as food for
fish. Aquaculture 422–423, 193–201.
15. Beh, E.J., 2004. Simple correspondence analysis: a bibliographic review.
International Statistical Review, 72 (2) 257–284
16. Belluco S, Losasso C, Maggioletti M, Alonzi CC, Paoletti MG and Ricci A,
2013. Edible insects in a food safety and nutritional perspective: A critical
review. Comprehensive Reviews in Food Science and Food Safety, 12, 296–
313.
17. Bergot F., Breque J. 1983. Digestibility of starch by rainbow trout: effects of
the physical state of starch and the intake level. Aquaculture, 34, 203–212.
18. Birgit A. Rumpold, Oliver K. Schlüter. 2013. Potential and challenges of
insects as an innovative source for food and feed production. Innovative Food
Science and Emerging Technologies 17, 1–11.
19. Best P. 2015. 2014 world livestock feed production up 1.6 percent.
wattagnet.com, 2 April. Available at:
http://www.wattagnet.com/articles/22114-2014-world-livestock-feed-
production-up-1-6-percent?v=preview.
20. Boye J.I., Mar C.Y. and Harwalkar V.R. 1997. Thermal denaturation and
coagulation of proteins. Food Sci Technol. 80, 25-6.

86
21. Brader, B., Lee, R.C., Plarre, R., Burkholder, W.G., Kitto, B.G., Kao, C.,
Polston, L., Dorneanu, E., Szabo, I., Mead, B., Rouse, B., Sullins, D., Denning,
R. 2002. A comparison of screening methods for insect contamination in
wheat. Journal of Stored Products Research 38, 75-86.
22. Briggs J.L., Maier D.E., Watkins B.A. Behnke K.C. 1999. Effect of ingredients
and processing parameters on pellet quality. Poultry Science 78 (10): 1464-
1471.
23. Čabarkapa, I., Čolović, R., Vukmirović, Đ., Kokić, B., Ivanov, D., Šarić, Lj.,
Lević, J., 2010. Effect of moisture increase during conditioning process on
microbial properties of pellets. Arch. Zootech. 13(3):47-54.
24. Campagnoli, A., Paltanin, C., Savoini, G., Baldi, A., Pinotti, L., 2009.
Combining microscopic methods and computer image analysis for lacunae
morpho-metric measurements in poultry and mammal by-products
characterization. Biotechnol. Agron. Soc. 13:25-27.
25. Cauchie H.M. 2002. Chitin production by arthropods in the hydrosphere.
Hydrobiologia 470, 63–96.
26. Charlton AJ, Dickinson M, Wakefield ME, Fitches E, Kenis M, Han R, Zhu F,
Kone N, Grant M, Devic E, Bruggeman G, Prior R and Smith R, 2015.
Exploring the chemical safety of fly larvae as a source of protein for animal
feed. Journal of Insects as Food and Feed, 1, 7–16.
27. Chiang B.Y. and Johnson J. A. 1977. Gelatinization of Starch in Extruded
Products. Cereal Chemistry 54, (3) 436-443.
28. Connelly A. 2013. A view on the future of the feed industry.
http://www.allaboutfeed.net/Home/General/2013/7/A-view-on-the-future-of-
the-feed-industry-1227213W/.
29. De Haro Martí M. E., Chahine M. St Hilaire S. 2010. ALTERNATIVE
BIOLOGICAL TREATMENT OF MANURE. 5° Proceedings of the Idaho
Nutrient Management Conference. 9th of March, Shoshone, Idaho.
30. Demeyer D.I., Henderson C. and Prins R.A. 1978. Relative significance of
exogenous and de novo synthesized fatty acids in the formation of rumen
microbial lipids in-vitro. Appl. Environ. Microbiol. 35, (1) 24.
31. Deutsch, L., Gräslund, S., Folke, C., Troell, M., Huitric, M., Kautsky, N., &
Lebel, L. 2007. Feeding aquaculture growth through globalization; exploitation
of marine ecosystems for fishmeal. Glob Environ Chang 17:238–49.

87
32. Diener S., Zurbrugg C. and To K. 2009. Conversion of organic material by
black soldier fly larvae: establishing optimal feeding rate. Waste management
& research 26 (6) 603-610.
33. Dierick N.A. 1991. Recent development in pig feed evaluation. International
congress on pig farming. 7-8 February, Brussels, BE.
34. EFSA. 2015. European Food Safety Authority. Risk profile related to
production and consumption of insects as food and feed. EFSA Journal 13 (10),
4257. doi:10.2903/j.efsa.2015.4257.
35. EFSA. 2015. Risk profile related to production and consumption of insects as
food and feed. EFSA Journal 13(10):4257. Available at:
www.efsa.europa.eu/efsajournal.
36. Erickson M.C., Islam M., Sheppard C., Liao J., Doyle M.P. 2004. Reduction
of Escherichia coli O157:H7 and Salmonella enterica serovar Enteritidis in
chicken manure by larvae of the black soldier fly. J. Food Prot. 67, 685–90.
37. EUFETEC. 2013. VISION & SRIA DOCUMENT 2030. FEED FOR FOOD
PRODUCING ANIMALS. EUFETEC – Vision & SRIA document. Available
at: http://www.fefac.eu/files/42994.pdf.
38. EURL-AP, 2013. European Union Reference Laboratory for Animal Proteins
in feedingstuffs, EURL-AP Standard Operating Procedure, Use of staining
reagents. Publication date 28.03.2013. Available at:
http://eurl.craw.eu/img/page/sops/EURL-
AP%20SOP%20use%20of%20staining%20reagents%20V1.0.pdf.
39. European Commission, 2001. Commission decision of 22 May 2001 laying
down rules for the prevention, control and eradication of certain transmissible
spongiform encephalopathies, 999/2001/EC. In: Official Journal, L 147,
31/05/2001, pp 1-40.
40. European Commission, 2002a. Commission decision of 28 January 2002
laying down the general principles and requirements of food law, establishing
the European Food SafetyAuthorityand laying down procedures in matters of
food safety, 178/2002/EC. In: Official Journal, L 31, 01/02/2002, pp 1-24.
41. European Commission, 2004. Commission decision of 29 April 2004 laying
down specific rules for the organisation of official controls on products of
animal origin intended for human consumption, 854/2004/EC. In: Official
Journal, L 139, 30.4.2004, p. 206-266.

88
42. European Commission, 2005. Commission decision of 12 January 2005 laying
down requirements for feed hygiene, 183/2005/EC. In: Official Journal, L 35,
8.2.2005, p. 1-33.
43. European Commission, 2009a Commission decision of 27 January 2009 laying
down the methods of sampling and analysis for the official control of feed,
152/2009/EC. In Official Journal, L 54, 26.2.2009, pp 1-120.
44. European Commission, 2009b. Commission decision of of 13 July 2009 on the
placing on the market and use of feed, amending European Parliament and
Council Regulation (EC) No 1831/2003 and repealing Council Directive
79/373/EEC, Commission Directive 80/511/EEC, Council Directives
82/471/EEC, 83/228/EEC, 93/74/EEC, 93/113/EC and 96/25/EC and
Commission Decision 2004/217/EC. 767/2009/EC. In: Official Journal, L 229,
1.9.2009, p. 1-48.
45. European Commission, 2009c. Commission decision of 21 October 2009
laying down health rules as regards animal by-products and derived products
not intended for human consumption and repealing Regulation No. 1774/2002
(Animal byproducts Regulation), 1069/2009/EC. In: Official Journal, L 300,
14/11/2009, pp 1-33.
46. European Commission, 2010. Communication from the Commission to the
European Parliament and the Council. The TSE Road map 2. A strategy paper
on transmissible spongiform encephalopathies for 2010-2015. European Union
ed., Brussels, Belgium. Available from: http://ec.europa.
eu/food/food/biosafety/tse_bse/docs/roadmap_2_en.pdf
47. European Commission, 2011. Commission decision of 25 February 2011
implementing Regulation (EC) No 1069/2009 of the European Parliament and
of the Council laying down health rules as regards animal by-products and
derived products not intended for human consumption and implementing
Council Directive 97/78/EC as regards certain samples and items exempt from
veterinary checks at the border under that Directive, 142/2011/EC. In Official
Journal, L 54, 26.2.2011 pp 1-254.
48. European Commission, 2013a. Commission decision of 16 January 2013
amending Annexes I and IV to Regulation No 999/2001 laying down rules for
the prevention, control and eradication of certain transmissible spongiform
encephalopathies, 56/2013/EC. In: Official Journal, L 21, 24/01/2013, pp 3-16.

89
49. European Commission, 2013b. Commission decision of 16 January 2013 on
the Catalogue of feed materials, 68/2013/EC, In: Official Journal, L 29,
30/01/2013, pp 1-64.
50. European Commission, 2013c. Commission decision of 16 January 2013
amending Regulation (EC) No 152/2009 as regards the methods of analysis for
the determination of constituents of animal origin for the official control of
feed, 51/2013/EC. In: Official Journal, L 20, 23.1.2013, pp 33-43.
51. Fanimo A. O., Susenbeth A., Südekum K.H. 2006. Protein utilization, lysine
bioavailability and nutrient digestibility of shrimp meal in growing pigs.
Animal Feed Science and Technology 129, 196-209.
52. FAO Globefish. 2014. Fishmeal and Fish Oil - September 2014.
http://www.globefish.org/fishmeal-and-fish-oil-september-2014.html
53. FAO, 2009. Food and Agriculture Organization of the United Nations. THE
STATE OF FOOD AND AGRICULTURE 2009, Rome. Available at:
http://www.fao.org/docrep/012/i0680e/i0680e.pdf.
54. FAO, 2010. Food and Agriculture Organization of the United Nations,
Fisheries and Aquaculture Department. THE STATE OF WORLD
FISHERIES AND AQUACULTURE, Rome. Available at:
http://www.fao.org/docrep/013/i1820e/i1820e.pdf.
55. FAO, 2011. Food and Agriculture Organization of the United Nations. THE
STATE OF FOOD AND AGRICULTURE 2010-2011, Rome. Available at:
http://www.fao.org/docrep/013/i2050e/i2050e.pdf.
56. FAO, 2013. Food and Agriculture Organization of the United Nations. THE
STATE OF FOOD AND AGRICULTURE 2013, Rome. Available at:
http://www.fao.org/docrep/018/i3300e/i3300e00.htm.
57. Farahat M.H. 2015. Good quality feed pellets: Does it make sense?. All about
feed, 13 Jul. Availabe at:
http://www.allaboutfeed.net/Processing/Pelleting/2015/7/Good-quality-feed-
pellets-Does-it-make-sense-1785760W/.
58. FASFC (Belgian Scientific Committee of the Federal Agency for the Safety of
the Food Chain), 2014. Food safety aspects of insects intended for human
consumption. Common advice of the Belgian Scientific Committee of the
Federal Agency for the Safety of the Food Chain (FASFC) and of the Superior
Health Council (SHC). Available at: http://www.favv-

90
afsca.fgov.be/scientificcommittee/advices/_documents/ADVICE14-
2014_ENG_DOSSIER2014-04.pdf.
59. FEFAC, 2014. European Feed Manufacturers' Federation. European Feed
Manufacturers’ Guide Community guide to good practice for the industrial EU
compound feed and premixtures manufacturing sector for food producing
animals. Available at: http://www.fefac.eu/files/58224.pdf.
60. FEFAC. (2015). Annual Report 2014-2015. Retrieved from
http://www.fefac.eu/files/60917.pdf
61. Fines B.C. & Holt G.J. 2010. Chitinase and apparent digestibility of chitin in
the digestive tract of juvenile cobia Rachycentron canadum. Aquaculture 303,
34–39.
62. Finke M.D. 2007. Estimate of Chitin in Raw Whole Insects. Zoo Biology 26
105-115
63. Finke M.D. 2013. Complete Nutrient Content of Four Species of Feeder
Insects. Zoo Biology 32, 27-36.
64. Francis G., Makkar H.P.S., Becker K. 2001. Antinutritional factors present in
plant-derived alternate fish feed ingredients and their effect in fish.
Aquaculture, 199, 197–227.
65. Gaviglio, A., Demartini, E., Mauracher, M., Pirani, A., 2014. Consumer
perception of different species and presentation forms of fish: An empirical
analysis in Italy. Food Quality and Preference 36, 33–49.
66. Gaviglio, A., Demartini, E., Pirani, A., Marescotti, M. E., Bertocchi, M., 2015.
National Brands versus Private Labels versus Niche Products: a graphical
representation of consumers' perception. In 143rd Joint EAAE/AAEA
Seminar, March 25-27, 2015, Naples, Italy (No. 202731). European
Association of Agricultural Economists.
67. Geraldine E.E. 2014. FEFAC: Innovation at the heart of Europe’s feed milling
industry. FEED Business Worldwide. July, pp. 36-39.
http://www.feeddesignlab.nl/applications/fdl-
website/files/Documenten/Persberichten_jpg/FBW36_JULY2014_Fefac_36-
39.pdf.
68. Gizzi G., Van Raamsdonk L.W.D., Baeten V., Murray I., Berben G., Bambilla
G., von Holst C. 2003. An overview of tests for animal tissues in feeds applied

91
in response to public health concerns regarding bovine spongiform
encephalopathy. Rev Sci Tech. Apr; 22(1):311-31.
69. Glencross B., Hawkins W, Evansa D., Rutherforda N., McCafferty P., Dodsc
K., Haulere R. 2011. A comparison of the effect of diet extrusion or screw-
press pelleting on the digestibility of grain protein products when fed to
rainbow trout (Oncorhynchus mykiss). Aquaculture, 312 (1–4), 154–161.
70. Goodrich, T.D. & Morita, R.Y., 1977a. Incidence and estimation of chitinase
activity associated with marine fish and other estuarine samples. Marine
Biology 41, 349–353.
71. Goodrich, T.D., Morita, R.Y., 1977b. Bacterial chitinase in the stomachs of
marine fishes from Yaquina Bay, Oregon, USA. Marine Biology 41, 355–360.
72. Grahn, H. and Geladi, P. 2007. Techniques and Applications of Hyperspectral
Image Analysis. John Wiley & Sons, Inc, Hoboken, NJ. Entomology 58, 563-
583.
73. Guy R. 2000. Book extrusion.
74. Han B. K., Lee W. J. and Jo D. H. 1997. Chitinolytic enzymes from the gizzard
and the chyme of the broiler (Gallus gallus L.). Biotechnology Letters 19, 981–
984.
75. Han B. K., Moon J. K., Ryu Y. W., Park Y. H. and Jo, D. H. 2000. Purification
and characterization of acidic chitinases from gizzards of broiler (Gallus gallus
L.). Journal of Biochemistry and Molecular Biology 33, 326-331.
76. Hershberger R.V. 1946. Differential Stains of Insect Tissues. Ohio Journal of
Science 43 (3): 152-162.
77. Hershberger R.V. 1948. Stain Combinations in Living Insects. Ohio Journal of
Science 48 (4): 161-168.
78. Hoffman, D.L., and Franke, G., 1986. Correspondence analysis: graphical
representation of categorical data in marketing research marketing research.
Journal of Marketing Research, 23 (3), pp. 213-227.
79. Hogan, P., 2015. Leading EU industry associations call for policy support for
innovation in the agri-food sector. Milan, 29 June 2015. Available at:
http://www.fooddrinkeurope.eu/uploads/statements_documents/Joint_Press_
Release_-_Agri-
Food_Chain_Coalition_call_for_policy_support_for_innovation_in_the_agri-
food_sector.pdf.

92
80. Hsieh, F., Huff, H. E., Lue, S., Stringer, L. 1991. Twinscrew extrusion of sugar
beet fiber and corn meal. Lebensmittel-Wissenschaft und-Technologie, 24,
495–500.
81. HwangboJ., HongH.C., Jang A., Kang H.K., Oh J.S., Kim B.W. Park B.S.
2009. Utilization of house fly-maggots, a feed supplement in the production of
broiler chickens. Journal of Environmental Biology, 30(4) 609-614.
82. IEEP. 2009. Institute for European Environmental Policies. Exploring policy
options for more sustainable livestock and feed production. Final report for
Friends of the Earth. Available at:
http://www.ieep.eu/assets/419/sustainable_livestock_feed.pdf.
83. IFFO, 2013. Feedban: transmissible spongiform encephalopathies (TSE).
International Fishmeal and Fish Oil Organisation ed.London, UK.
84. IFIF, 2013. The global feed industry. Overview of the International Feed
Industry Federation, available at the page
http://www.ifif.org/pages/t/The+global+feed+industry.
85. Insects to Feed the World Conference, 2014. First International Conference
Insects to feed the world, summary report. 14-17 May, Wageningen (Ede), The
Netherlands.
86. ISO method 5983-1, 2005. Animal feeding stuffs, Determination of nitrogen
content and calculation of crude protein content. Part 1: Kjeldahl method
87. ISO method 6492, 1999. Animal feeding stuffs — Determination of fat content
88. Jackson A. 2012. Fishmeal & fish oil and its role in sustainable aquaculture.
International AquAFeed 15, (1) 18-21.
89. Jeong K.S., Takeuchi T., Watanabe T. 1991. Improvement of nutritional
quality of carbohydrate ingredients by extrusion processes in diets of red
seabream. Nippon Suisan Gakkaishi, 57, 1543–1549.
90. Jørgensen J.S. and Baeten V. 2012. Detection, identification and quantification
of processed animal proteins in feedingstuffs, Namur, Belgique. Les Éditions
namuroises.
91. K. Bhuvaneswari K., Fields P.G.,White N.D.G., Sarkar A.K., Singh C.B.,
Jayas D.S. 2011. Image analysis for detecting insect fragments in semolina.
Journal of Stored Products Research 47, 20-24.

93
92. Klein H. and Marquard R. 2005. Feed microscopy, Atlas for the microscopic
examination of feed containing vegetable and animal products. Published by
Agrimedia.
93. Koeleman E. 2014. Insects crawling their way into feed regulation.
AllAboutFeed 22, (6) 18-21.
94. Koeleman E., 2015. From by-product to high quality insect protein. All About
Feed, 31 august. Available at: http://www.allaboutfeed.net/Nutrition/Raw-
Materials/2015/8/From-by-product-to-high-quality-insect-protein-
2678239W/.
95. Kroeckel S., Harjes A.-G.E., Roth I., Katz H, Wuertz S, Susenbeth A, Schulz
C. 2012. When a turbot catches a fly: Evaluation of a pre-pupae meal of the
Black Soldier Fly (Hermetia illucens) as fish meal substitute — Growth
performance and chitin degradation in juvenile turbot (Psetta maxima).
Aquaculture 364–365, 345–352
96. Kupferschmidt K. 2015. Feature: Why insects could be the ideal animal feed.
Science| DOI: 10.1126/science.aad4709. available at
http://news.sciencemag.org/europe/2015/10/feature-why-insects-could-be-
ideal-animal-feed.
97. Lebart, L., Morineau, A., Warwick, K. M., 1984. Multivariate descriptive
statistical analysis. Correspondence analysis and related techniques for large
matrices. New York, NY: John Wiley & Sons.
98. Leytem A.B., Bjorneberg D.L., Sheffield R.E., de Haro Marti M.E. 2009. Case
study: on-farm evaluation of liquid dairy manure application methods to reduce
ammonia losses. The Professional Animal Scientist 25, 93–98.
99. Li Q., Zheng L., Qiu N., Cai H, Tomberlin J.K., Yu Z. 2011. Bioconversion of
dairy manure by black soldier fly (Diptera: Stratiomyidae) for biodiesel and
sugar production. Waste management 31, (6) 1316-1320.
100. Lin S., Hsieh F., Huff H.E. 1997. Effects of Lipids and Processing
Conditions on Degree of Starch Gelatinization of Extruded Dry Pet Food.
Lebensm.-Wiss. u.-Technol., 30, 754–761.
101. Liu Q., Tomberlin J.K., Brady J.A., Sanford M.R., Yu Z. 2008. Black
soldier fly (Diptera: Stratiomyidae) larvae reduce Escherichia coli in dairy
manure. Environ. Entomol. 37, 1525–1530.

94
102. M. Thomas M., van Zuilichem D.J., van der Poel A.F.B. 1997.Anim.
Feed Sci. Techn. 64 (2–4), 173–192.
103. Madeleine, A. M. The effect of extractable lipid on theviscosity
characteristics of corn and wheat starches. Journal of the Science of Food and
Agriculture, 30, 731–738.
104. Makkar H.P.S., Tran G., Heuzé V., Ankers P. 2014. State-of-the-art on
use of insects as animal feed. Animal Feed Science and Technology 197, 1–33
105. Makowski J., Vary N., McCurtcheon M., Veys P., 2011. Microscopic
analysis of agricultural products, 4th edition. Urbana, USA. AOCS Press.
106. Malkki, Y., Kervinen, R., Olkku, J., Linko, P. Effects of
monoglycerides during extrusion cooking of wheat flour. In: Marcuse, R. (Ed),
Fats (Lipids) in Baking and Extrusion. Goteborg, Sweden: LIPIDFORUM
Symposium, pp. 130–137 (1984).
107. Nakanishi I., Kimura K., Kusui S., Yamazaki E. 1974. Complex
formation of gel-forming bacterial (1–3)-β-D-glucans (curdlantype
polysaccharides) with dyes in aqueous solution. Carbohydr Res 32:47–52.
108. Neal F.B. & Russ J.C. 2012. Measuring shape. CRC Press, Boca Raton,
FL, USA.
109. Newton G. L., Booram C.V., Barker R.W., Hale O.M. 1977. Dried
Hermetia illucens larvae meal as a supplement for swine. J. Anim. Sci. 44, 395-
400.
110. Nir I., Twina Y., Grossman E. Nitsan Z. 1994. Quantitative effects of
pelleting on performance, gastrointestinal tract and behaviour of meat‐type
chickens. British Poultry Science 35 (4): 589-602.
111. NVWA (Netherlands Food and Consumer Product Safety Authority),
2014. Advisory report on the risks associated with the consumption of mass-
reared insects. Available at:
http://www.nvwa.nl/actueel/risicobeoordelingen/bestand/2207475/consumpti
e-gekweekte-insecten-advies-buro.
112. Oddy V.H. 1974. A semi-automated method for the determination of
plasma alpha amino nitrogen. Clinica Chimica Acta 51, 151–156.
113. Odesanya B.O., Ajayi S.O., Agbaogun B.K.O., Okuneye B. 2011.
Comparative Evaluation of Nutritive Value of Maggots. International Journal
of Scientific & Engineering Research 2, (11) 55-59

95
114. Ottoboni, M., Cheli, F., Amato, G., Marchis, D., Brusa, B., Abete,
M.C., Pinotti, L. 2014. Microscopy and image analysis based approaches for
the species-specific identification of bovine and swine bone containing
material. Ital J Anim Sci 13(3187) 377-381.
115. Perez-Mendoza P., Throne J.E., Dowell F.E., Baker J.E. 2003.
Detection of insect fragments in wheat flour by near-infrared spectroscopy.
Journal of Stored Products Research 39, 305–312.
116. Pimentel D., Berger B., Filiberto D., Newton M., Wolfe B., Karabinakis
E., Clark S., Poon E., Abbett E., and Nandagopal S. 2004. Water resources:
agricultural and environmental issues. BioScience, 54, (10) 909-918.
117. Pinotti L., Krogdahl A., Givens ., Knight C., Baldi A., Baeten V., Van
Raamsdonk L., Woodgate S., Perez Marin D., Luten J. 2014. The role of
animal nutrition in designing optimal foods of animal origin as reviewed by
the COST Action Feed for Health (FA0802). Biotechnol. Agron. Soc. Environ.
18(4), 471-479
118. Pinotti L., Moretti V.M., Baldi A., Bellagamba F., Campagnoli A.,
Savoini G., Cantoni C. Dell’Orto V. 2005. Feed authentication as an essential
component of food safety and control. Outlook on AGRICULTURE, 34 (4),
243–248.
119. Pinotti, L., Campagnoli, A., Maggioni, L., Paltanin, C., Cheli, F.,
Dell’Orto, V., Savoini, G., 2007. Selection of new markers for animal by-
products characterization by classical microscopy. Ital. J. Anim. Sci.
6(Suppl.1):339-341.
120. Pinotti, L., Fearn, T., Gulalp, S., Campagnoli, A., Ottoboni, M., Baldi,
A., Cheli, F., Savoini, G., Dell’Orto, V., 2013. Computer image analysis: an
additional tool for the identification of processed poultry and mammal protein
containing bones. Food Addit. Contam. A 30:1745-1751.
121. Pretorius Q. 2011. The evaluation of larvae of musca domestica
(common house fly) as protein source for broiler production. Thesis presented
in partial fulfilment of the requirements for the degree of Master of Science in
Agriculture (Animal Sciences) at Stellenbosch University, South Africa.
122. PROteINSECT, 2015. Insect as sustainable source of protein project.
Available at: http://www.proteinsect.eu/.

96
123. Pulina G., Battacone G., Brambilla G., Cheli F., Danieli P.P., Masoero
F., Pietri A., Ronchi B. 2014. An update on the safety of foods of animal origin
and feeds. Italian J. of Anim. Sci. 13: 845-856.
124. Quinn, F.A., Burkholder, W., Kitto, G.B. 1992. Immunological
technique for measuring insect contamination of grain. Journal of Economic
Entomology 85, 1463-1470.
125. Refstie S., Storebakken T., Roem A.J. 1998. Feed consumption and
conversion in Atlantic salmon (Salmo salar) fed diets with fish meal, extracted
soybean meal or soybean meal with reduced content of oligosaccharides,
trypsin inhibitors, lectins and soya antigens. Aquaculture, 162, 301–312.
126. Richards J. D., Gong J., and de Lange C. F. M. 2005. The
gastrointestinal microbiota and its role in monogastric nutrition and health with
an emphasis on pigs: Current understanding, possible modulations, and new
technologies for ecological studies. Canadian Journal of Animal Science 85,
(4) 421-435
127. Ruess L., Häggblom M.M., García Zapata E.J., Dighton J. 2002. Fatty
acids of fungi and nematodes- possible biomarkers in soil food chain? Soil
biology & chemistry 34, 745-756.
128. Rumpold B.A., Oliver K. Schlüter. 2013. Potential and challenges of
insects as an innovative source for food and feed production. Innovative Food
Science and Emerging Technologies 17, 1–11.
129. Sánchez-Muros M.J., Barroso F.G. and Manzano-Agugliaro F. 2014.
Insect meal as renewable source of food for animal feeding: a review. Journal
of Cleaner Production 65, 16-27.
130. Schabel HG, 2010. Forest insects as food: A global review. In: Forest
insects as food: humans bite back. FAO Regional Office for Asia and the
Pacific, Bangkok, Thailand. Proceedings of a workshop on Asia-Pacific
resources and their potential for development. 19–21 February 2008, Chiang
Mai, Thailand, pp. 37–64.
131. Schatzki, T.F., Wilson, E.K., Kitto, G.B., Behrens, P., Heller, I. 1993.
Determination of hidden Sitophilus granarius (Coleoptera: Curculionidae) in
wheat by myosin ELISA. Journal of Economic Entomology 86, 1584-1589.
132. Schenk S.T. and Schikora A. 2015. Staining of Callose Depositions in
Root and Leaf Tissues. http://www.bio-protocol.org/e1429. 5 (6) 20 Mar.

97
133. Schweizer T.F., Reimann S., Solms J., Eliasson A.C., Asp N.G. 1986.
Influence of drum-drying and twin-screw extrusion cooking on wheat
carbohydrates, II, Effect of lipids on physical properties, degradation and
complex formation of starch in wheat starch. Journal of Cereal Science, 4, 249–
260.
134. Sealey W.M, Gaylord T.G. and Barrows F.T, Tomberlin J.K, McGuire
M.A., Ross C., St-Hilaire S. 2011. Sensory analysis of rainbow trout,
Oncorhynchus mykiss fed enriched black soldier fly prepupae, Hermetia
illucens. Journal of the World Aquaculture Society 42, (1) 34-45.
135. Shankar J. and Bandyopadyay S. 2005. Process variables during single-
screw extrusion of fish and rice flour blends Journal of Food Processing and
Preservation, 29, 151–164.
136. Sheppard C., 1984. House fly and lesser fly control utilizing the black
soldier fly in manure management systems for caged laying hens.
Environmental Entomology 12, (5) 1439-1442.
137. Shiau S. & Yu Y.P. Dietary supplementation of chitin and chitosan
depresses growth in tilapia, Oreochromis niloticus × O. aureus. Aquaculture
179, (1–4) 439–446.
138. Shirley BA. 1992. Protein conformational stability estimated from urea,
guanidine hydrochloride, and thermal denaturation curves. In: Ahern TJ,
Manning MC, editors. Stability of protein pharmaceuticals. New York: Plenum
Press, 1167-94.
139. Šimůnek, J., Hodrová, B., Bartoňová, H., Kopečný, J. 2001.
Chitinolytic bacteria of the mammal digestive tract. Folia Microbiologica 46,
76-78.
140. Skrivanova E., Marounek M., Benda V., Brezina P. 2006. Susceptibility
of Escherichia coli, Salmonella sp. and Clostridium perfringens to organic
acids and monolaurin. Veterinarni Medicina 51, (3): 81–88.
141. Smith M.M. and McCully M.E. 1978. A critical evaluation of the
specificity of aniline blue induced fluorescence. Protoplasma 95 (3), pp 229-
254.
142. Spranghers T., Ottoboni M., Eeckhout M., Michiels J., Deboosere S.,
De Clercq P., De Smet S. 2015. Impact of growth substrate on the nutritional

98
composition of black soldier fly prepupae. 1st World Conference on Innovative
Animal Nutrition and Feeding (WIANF), Budapest, Hungary October 15-17.
143. St-Hilaire S., Sheppard C., Tomberlin J.K., Irving S., Newton L.,
Mcguire M.A., Mosley E.E., Hardy R.W. and Sealey W. 2007. Fly prepupae
as a feedstuff for rainbow trout, Oncorhynchus mykiss. Journal of the World
Aquaculture Society 38, (1) 59-67.
144. Tacon A. and Metian M. 2008.Global overview on the use of fish meal
and fish oil in industrially compounded aquafeeds: trends and future prospects.
Aquaculture 285 (1–4):146–58.
145. Teotia J. S. and Miller B. F. 1973. Fly pupae as a dietary ingredient for
starting chicks. Poultry Science 52 1830-1835.
146. Theerarattananoon, K. Xu, F., Wilson, J., Ballard, R., Mckinney, L.,
Staggenborg, S., Vadlani, P., Pei, Z. J., Wang, D., 2011. Physical properties of
pellets made from sorghum stalk, corn stover, wheat straw, and big bluestem.
Ind.l Crop. Prod. 33(2):325-332
147. Thomas, M., van der Poel, A. F. B., 1996. Physical quality of pelleted
animal feed 1. Criteria for pellet quality. Anim. Feed Sci. Techn. 61:89-112.
148. Thomas, M., van Vliet T., van der Poel A.F.B. 1998. Physical quality
of pelleted animal feed 3. Contribution of feedstuff components. Anim. Feed
Sci. Techn. 70(1–2):59-78.
149. Thomas, P. A., Kaliamurthy, J., Jesudasan, C. A. N., & Geraldine, P.
2008. Use of chlorazol black E mounts of corneal scrapes for diagnosis of
filamentous fungal keratitis. American Journal of Ophthalmology, 145 (6),
971–976. http://doi.org/10.1016/j.ajo.2008.01.020.
150. Trematerra, P., Catalano, S. 2009. Filth test as component of integrated
pest management in a semolina mill. Tecnica Molitoria, 60, 963-974.
151. USDA, 2015. World Agricultural Supply and Demand Estimates.
http://www.usda.gov/oce/commodity/wasde/latest.pdf
152. van Broekhoven, 2014. Risk of mycotoxin contamination of edible
mealworms. World Mycotoxin Forum, 10–12 November 2014, Vienna,
Austria.
153. van der Spiegel M, Noordam MY and van der Fels-Klerx HJ, 2013.
Safety of novel protein sources (insects, microalgae, seaweed, duckweed, and
rapeseed) and legislative aspects for their application in food and feed

99
production. Comprehensive Reviews in Food Science and Food Safety, 12,
662–678.
154. van Huis, A., 2013. Potential of insects as food and feed in assuring
food security. Annu Rev Entomol 58, 563-583.
155. van Raamsdonk, L.W.D., Veys, P., Vancutsem, J., Pridotkas, G.,
Jørgensen, J.S., 2012. Classical microscopy. Improvements of the qualitative
protocol. In: J.S. Jørgensen and V. Baeten (eds.) Detection, identification and
quantification of processed animal proteins in feedingstuffs, Namur, Belgique.
Les Éditions namuroises, Namur, Belgium, pp 47-57.
156. Veldkamp T., Van Duinkerken, G., Van Huis, A., Lakemond, C.M.M.,
Ottevanger, E., Bosch, G., Van Boekel, M.A.J.S., 2012. Insects as a sustainable
feed ingredient in pig and poultry diets - a feasibility study. Wageningen UR
Livestock Research, Lelystad. Available at:
https://www.wageningenur.nl/upload_mm/2/8/0/f26765b9-98b2-49a7-ae43-
5251c5b694f6_234247%5B1%5D.
157. Watkins B.E., Adair J. and Oldfield J. E. 1982. Evaluation of shrimp
and king crab processing byproducts as feed supplements for mink. J Anim
Sci, 55: 578-589.
158. Wood, John F. 1987. The functional properties of feed raw materials
and their effect on the production and quality of feed pellets. Anim. Feed Sci.
Techn 18 (1), 1-17.
159. Yi L., Lakemond C.M.M., Sagis L.M.C., Eisner-Schadler V., van Huis
A., van Boekel M.A.J.S. 2013. Extraction and characterisation of protein
fractions from five insect species. Food Chemistry 141, 3341–3348.

100
List of publications
Published
Ottoboni M., Cheli F., Amato G., Marchis, D., Brusa B., Abete M. C., Pinotti, L.
2014. Microscopy and image analysis based approaches for the species-specific
identification of bovine and swine bone containing material. Italian Journal of
Animal Science, 13(3187): 377-381
Rebucci R., Pinotti L., Fusi E., Saccone F., Giromini, C., Skrivanova E., Ottoboni
M. & Baldi A. 2013. Role of Choline and Methionine in Bovine Mammary
Epithelial Cell Line Exposed to Hydrogen Peroxide. Journal of Nutritional
Ecology and Food Research, 1(3), 189-193.
Pinotti, L., Fearn, T., Gulalp, S., Campagnoli, A., Ottoboni, M., Baldi, A., Cheli
F., Savoini G., & Dell’Orto, V. 2013. Computer image analysis: an additional tool
for the identification of processed poultry and mammal protein containing bones.
Food Additives & Contaminants: Part A, 30(10), 1745-1751.
Submitted paper
Pinotti L., Ottoboni M., Caprarulo V., Giromini C., Gottardo D., Cheli F., Fearn
T., Baldi A. 2015. Microscopy in combination with image analysis for
characterization of fishmeal material in aquafeed. Submitted in Animal Feed
Science and Technology ISSN: 0377-8401. Manuscript number: ANIFEE-15-
6603.
Caprarulo V., Ottoboni M., Demartini E., Gaviglio A., Agazzi A, Rossi L., Čolović
R., Đuragić O., Vukmirović Ð., Lević J., Pinotti L. 2015. A survey on the potential
research and development in theItalian and Serbian feed industry. Submitted in
Italian Journal of Animal Science, ISSN 1828-051X. Manuscript ID: 4322.
Pinotti L., Ottoboni M., Giromini C., Dell'orto V., Cheli F. 2015. Mycotoxin
Contamination in the Feed Supply Chain: a Focus on Cereal By-products.
Submitted in Toxins, ISSN 2072-6651. Manuscript ID: toxins-103284.